Embed Size (px)
Citation preview
1
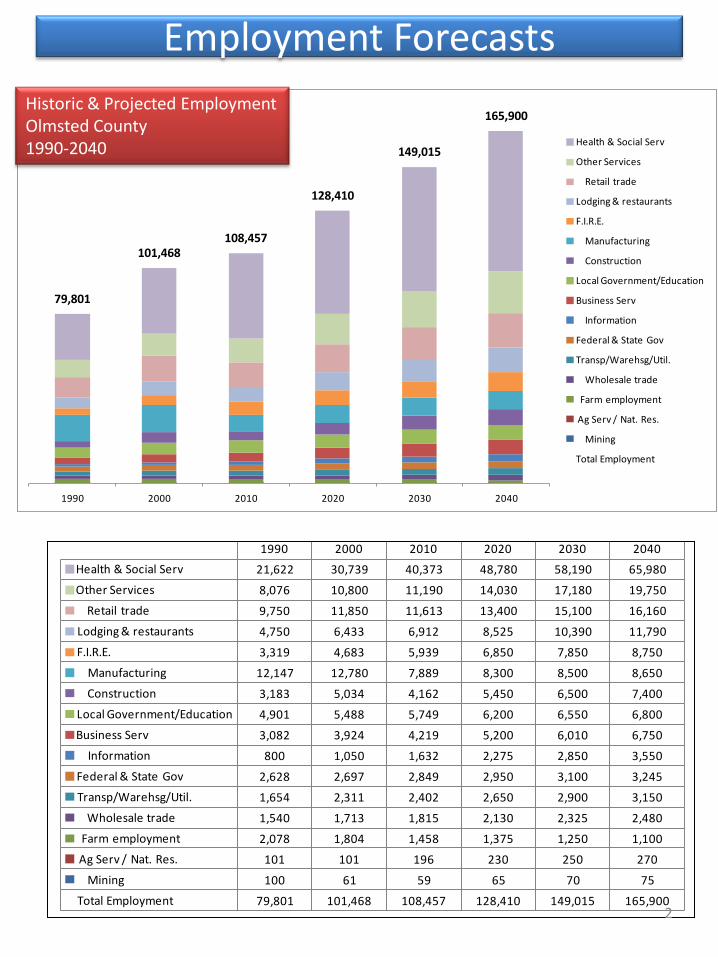
Employment Forecasts
79,801
101,468108,457
128,410
149,015
165,900
1990 2000 2010 2020 2030 2040
Health & Social Serv
Other Services
Retail trade
Lodging & restaurants
F.I.R.E.
Manufacturing
Construction
Local Government/Education
Business Serv
Information
Federal & State Gov
Transp/Warehsg/Util.
Wholesale trade
Farm employment
Ag Serv / Nat. Res.
Mining
Total Employment
Historic & Projected Employment Olmsted County 1990-2040
1990 2000 2010 2020 2030 2040
Health & Social Serv 21,622 30,739 40,373 48,780 58,190 65,980
Other Services 8,076 10,800 11,190 14,030 17,180 19,750
Retail trade 9,750 11,850 11,613 13,400 15,100 16,160
Lodging & restaurants 4,750 6,433 6,912 8,525 10,390 11,790
F.I.R.E. 3,319 4,683 5,939 6,850 7,850 8,750
Manufacturing 12,147 12,780 7,889 8,300 8,500 8,650
Construction 3,183 5,034 4,162 5,450 6,500 7,400
Local Government/Education 4,901 5,488 5,749 6,200 6,550 6,800
Business Serv 3,082 3,924 4,219 5,200 6,010 6,750
Information 800 1,050 1,632 2,275 2,850 3,550
Federal & State Gov 2,628 2,697 2,849 2,950 3,100 3,245
Transp/Warehsg/Util. 1,654 2,311 2,402 2,650 2,900 3,150
Wholesale trade 1,540 1,713 1,815 2,130 2,325 2,480
Farm employment 2,078 1,804 1,458 1,375 1,250 1,100
Ag Serv / Nat. Res. 101 101 196 230 250 270
Mining 100 61 59 65 70 75
Total Employment 79,801 101,468 108,457 128,410 149,015 165,900
79,801101,468 108,457
128,410149,015 165,900
Health & Social Serv
Other Services
Retail trade
Lodging & restaurants
F.I.R.E.
Manufacturing
Construction
Local Government/Education
Business Serv
Information
Federal & State Gov
Transp/Warehsg/Util.
Wholesale trade
Farm employment
Ag Serv / Nat. Res.
Mining
Total Employment
2
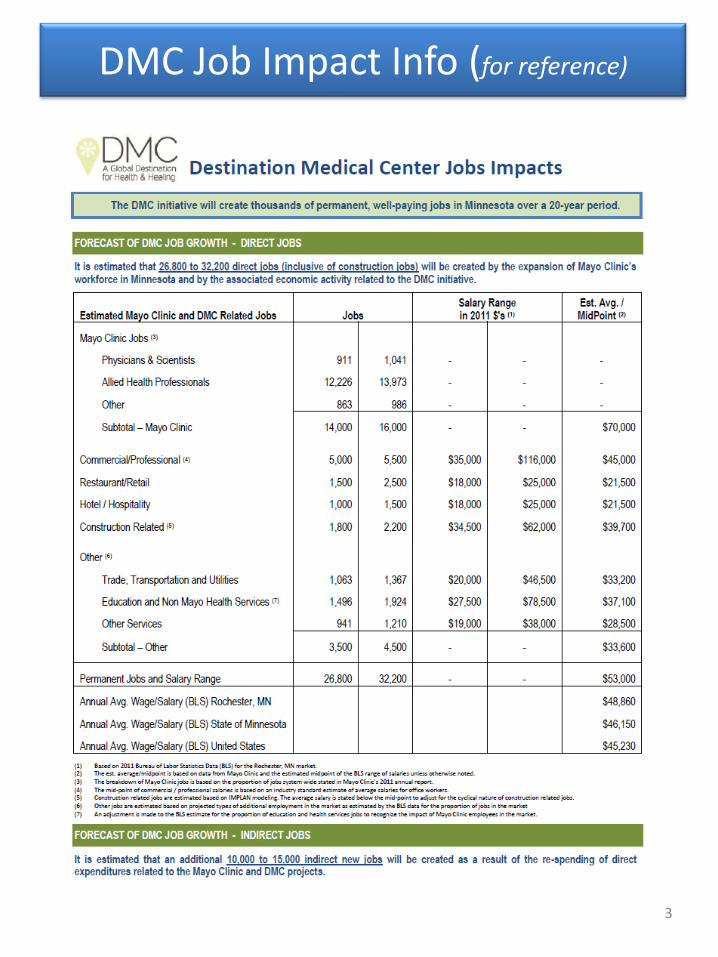
DMC Job Impact Info (for reference)
3
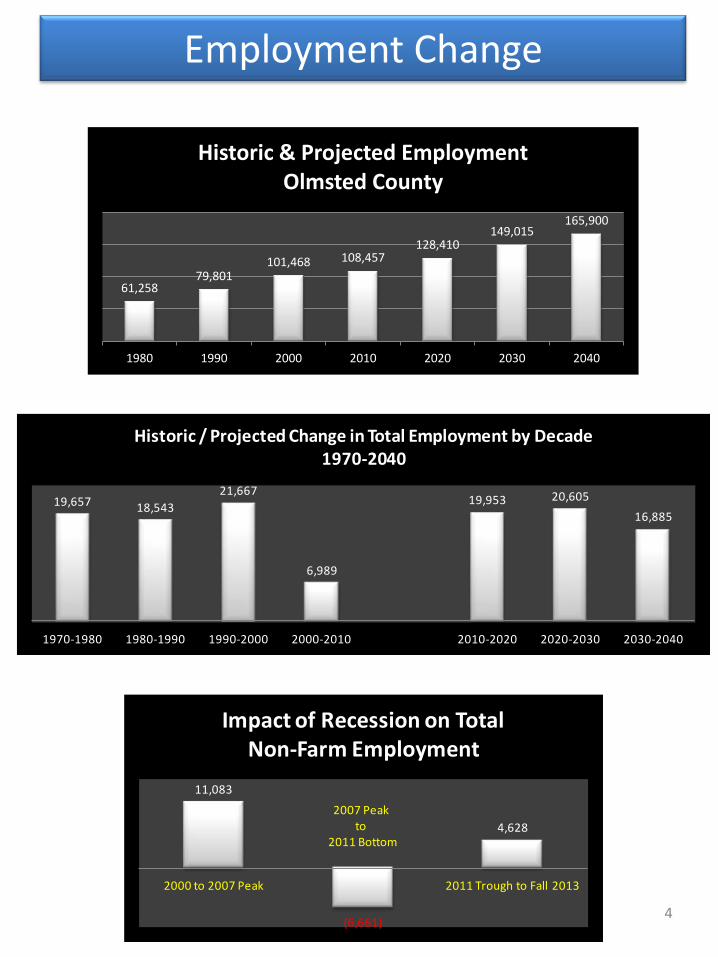
Employment Change
61,258 79,801
101,468 108,457 128,410
149,015 165,900
1980 1990 2000 2010 2020 2030 2040
Historic & Projected Employment Olmsted County
19,657 18,543
21,667
6,989
19,953 20,605
16,885
1970-1980 1980-1990 1990-2000 2000-2010 2010-2020 2020-2030 2030-2040
Historic / Projected Change in Total Employment by Decade1970-2040
11,083
(6,661)
4,628
2000 to 2007 Peak 2011 Trough to Fall 2013
Impact of Recession on Total Non-Farm Employment
2007 Peak to
2011 Bottom
4
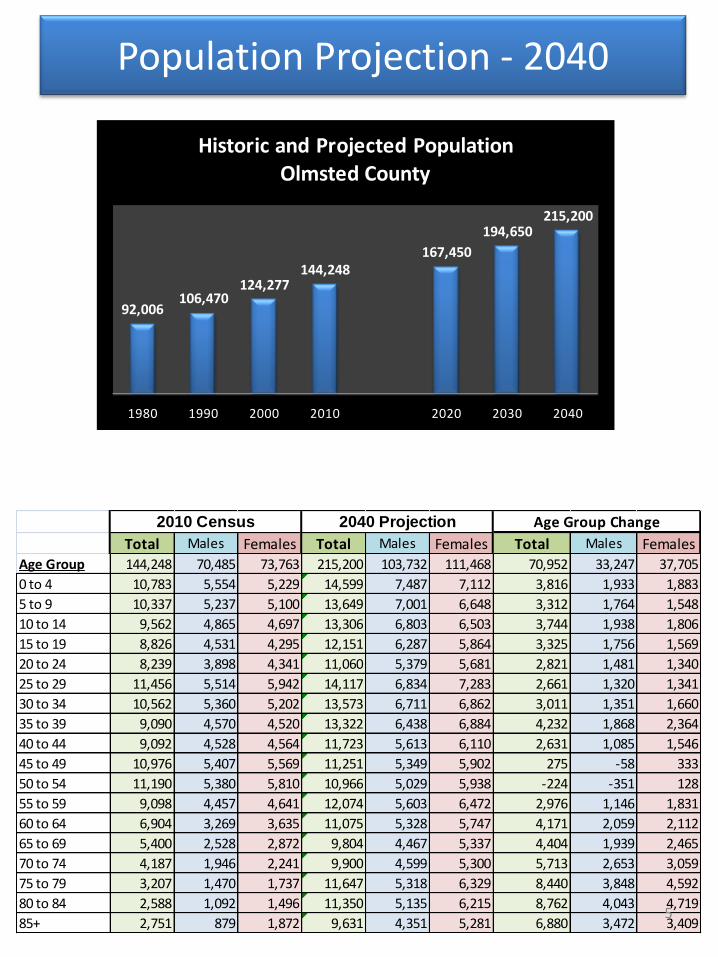
Population Projection - 2040
92,006106,470
124,277144,248
167,450
194,650215,200
1980 1990 2000 2010 2020 2030 2040
Historic and Projected PopulationOlmsted County
Total Males Females Total Males Females Total Males FemalesAge Group 144,248 70,485 73,763 215,200 103,732 111,468 70,952 33,247 37,705
0 to 4 10,783 5,554 5,229 14,599 7,487 7,112 3,816 1,933 1,883
5 to 9 10,337 5,237 5,100 13,649 7,001 6,648 3,312 1,764 1,548
10 to 14 9,562 4,865 4,697 13,306 6,803 6,503 3,744 1,938 1,806
15 to 19 8,826 4,531 4,295 12,151 6,287 5,864 3,325 1,756 1,569
20 to 24 8,239 3,898 4,341 11,060 5,379 5,681 2,821 1,481 1,340
25 to 29 11,456 5,514 5,942 14,117 6,834 7,283 2,661 1,320 1,341
30 to 34 10,562 5,360 5,202 13,573 6,711 6,862 3,011 1,351 1,660
35 to 39 9,090 4,570 4,520 13,322 6,438 6,884 4,232 1,868 2,364
40 to 44 9,092 4,528 4,564 11,723 5,613 6,110 2,631 1,085 1,546
45 to 49 10,976 5,407 5,569 11,251 5,349 5,902 275 -58 333
50 to 54 11,190 5,380 5,810 10,966 5,029 5,938 -224 -351 128
55 to 59 9,098 4,457 4,641 12,074 5,603 6,472 2,976 1,146 1,831
60 to 64 6,904 3,269 3,635 11,075 5,328 5,747 4,171 2,059 2,112
65 to 69 5,400 2,528 2,872 9,804 4,467 5,337 4,404 1,939 2,465
70 to 74 4,187 1,946 2,241 9,900 4,599 5,300 5,713 2,653 3,059
75 to 79 3,207 1,470 1,737 11,647 5,318 6,329 8,440 3,848 4,592
80 to 84 2,588 1,092 1,496 11,350 5,135 6,215 8,762 4,043 4,719
85+ 2,751 879 1,872 9,631 4,351 5,281 6,880 3,472 3,409
Age Group Change2010 Census 2040 Projection
5
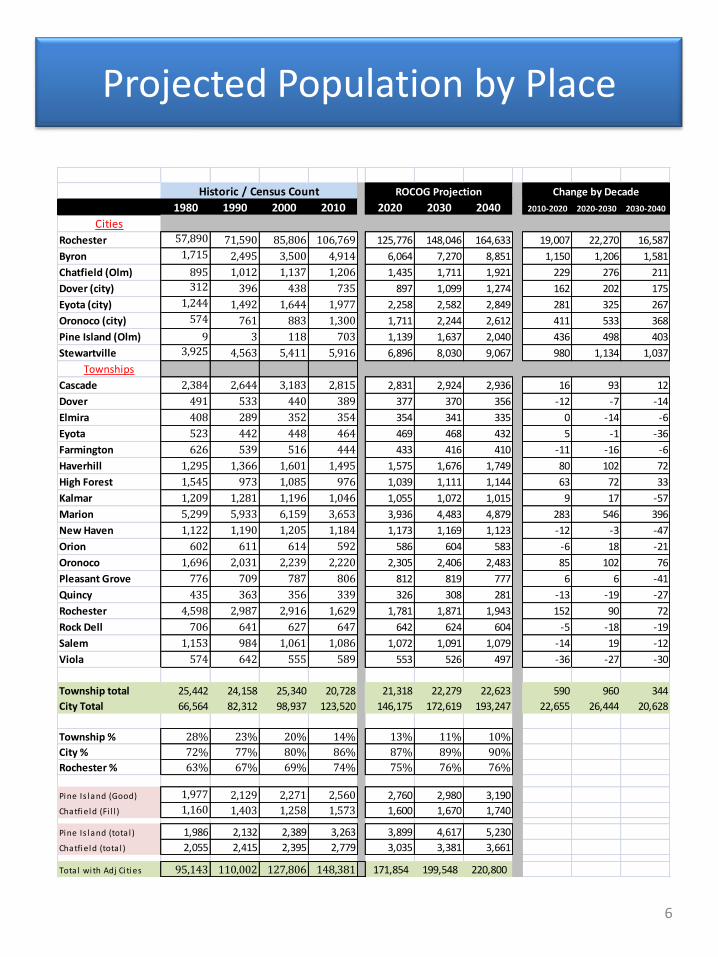
Projected Population by Place
1980 1990 2000 2010 2020 2030 2040 2010-2020 2020-2030 2030-2040
Cities
Rochester 57,890 71,590 85,806 106,769 125,776 148,046 164,633 19,007 22,270 16,587
Byron 1,715 2,495 3,500 4,914 6,064 7,270 8,851 1,150 1,206 1,581
Chatfield (Olm) 895 1,012 1,137 1,206 1,435 1,711 1,921 229 276 211
Dover (city) 312 396 438 735 897 1,099 1,274 162 202 175
Eyota (city) 1,244 1,492 1,644 1,977 2,258 2,582 2,849 281 325 267
Oronoco (city) 574 761 883 1,300 1,711 2,244 2,612 411 533 368
Pine Island (Olm) 9 3 118 703 1,139 1,637 2,040 436 498 403
Stewartville 3,925 4,563 5,411 5,916 6,896 8,030 9,067 980 1,134 1,037
Townships
Cascade 2,384 2,644 3,183 2,815 2,831 2,924 2,936 16 93 12
Dover 491 533 440 389 377 370 356 -12 -7 -14
Elmira 408 289 352 354 354 341 335 0 -14 -6
Eyota 523 442 448 464 469 468 432 5 -1 -36
Farmington 626 539 516 444 433 416 410 -11 -16 -6
Haverhill 1,295 1,366 1,601 1,495 1,575 1,676 1,749 80 102 72
High Forest 1,545 973 1,085 976 1,039 1,111 1,144 63 72 33
Kalmar 1,209 1,281 1,196 1,046 1,055 1,072 1,015 9 17 -57
Marion 5,299 5,933 6,159 3,653 3,936 4,483 4,879 283 546 396
New Haven 1,122 1,190 1,205 1,184 1,173 1,169 1,123 -12 -3 -47
Orion 602 611 614 592 586 604 583 -6 18 -21
Oronoco 1,696 2,031 2,239 2,220 2,305 2,406 2,483 85 102 76
Pleasant Grove 776 709 787 806 812 819 777 6 6 -41
Quincy 435 363 356 339 326 308 281 -13 -19 -27
Rochester 4,598 2,987 2,916 1,629 1,781 1,871 1,943 152 90 72
Rock Dell 706 641 627 647 642 624 604 -5 -18 -19
Salem 1,153 984 1,061 1,086 1,072 1,091 1,079 -14 19 -12
Viola 574 642 555 589 553 526 497 -36 -27 -30
Township total 25,442 24,158 25,340 20,728 21,318 22,279 22,623 590 960 344
City Total 66,564 82,312 98,937 123,520 146,175 172,619 193,247 22,655 26,444 20,628
Township % 28% 23% 20% 14% 13% 11% 10%
City % 72% 77% 80% 86% 87% 89% 90%
Rochester % 63% 67% 69% 74% 75% 76% 76%
Pine Is land (Good) 1,977 2,129 2,271 2,560 2,760 2,980 3,190
Chatfield (Fi l l ) 1,160 1,403 1,258 1,573 1,600 1,670 1,740
Pine Is land (tota l ) 1,986 2,132 2,389 3,263 3,899 4,617 5,230
Chatfield (tota l ) 2,055 2,415 2,395 2,779 3,035 3,381 3,661
Total with Adj Ci ties 95,143 110,002 127,806 148,381 171,854 199,548 220,800
ROCOG Projection Change by DecadeHistoric / Census Count
6
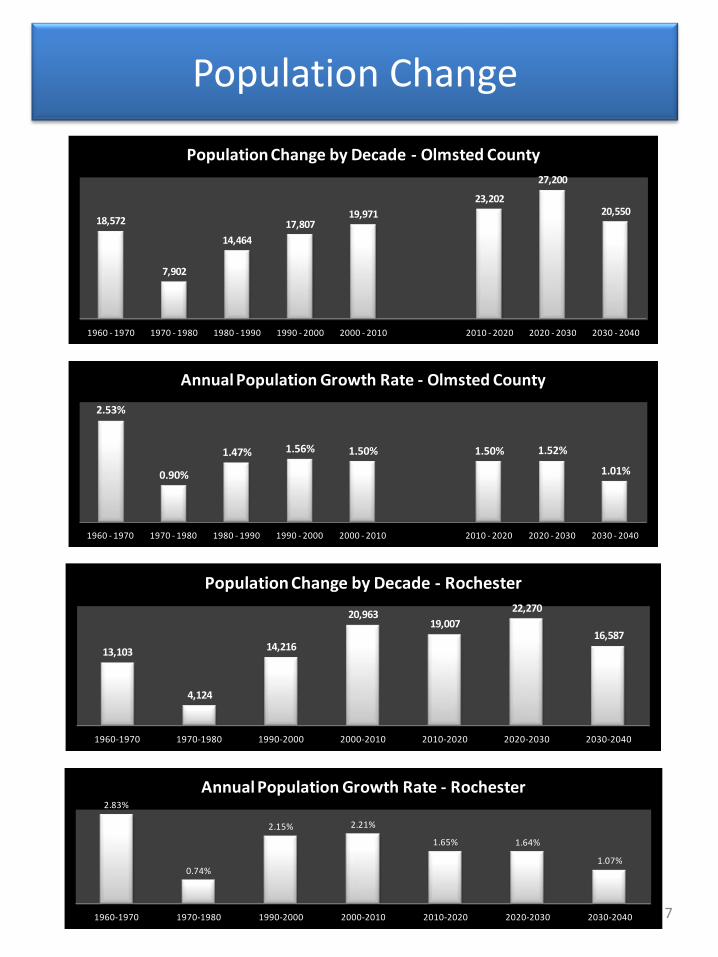
Population Change
18,572
7,902
14,464
17,80719,971
23,202
27,200
20,550
1960 - 1970 1970 - 1980 1980 - 1990 1990 - 2000 2000 - 2010 2010 - 2020 2020 - 2030 2030 - 2040
Population Change by Decade - Olmsted County
2.53%
0.90%
1.47% 1.56% 1.50% 1.50% 1.52%
1.01%
1960 - 1970 1970 - 1980 1980 - 1990 1990 - 2000 2000 - 2010 2010 - 2020 2020 - 2030 2030 - 2040
Annual Population Growth Rate - Olmsted County
13,103
4,124
14,216
20,96319,007
22,270
16,587
1960-1970 1970-1980 1990-2000 2000-2010 2010-2020 2020-2030 2030-2040
Population Change by Decade - Rochester
2.83%
0.74%
2.15% 2.21%
1.65% 1.64%
1.07%
1960-1970 1970-1980 1990-2000 2000-2010 2010-2020 2020-2030 2030-2040
Annual Population Growth Rate - Rochester
7

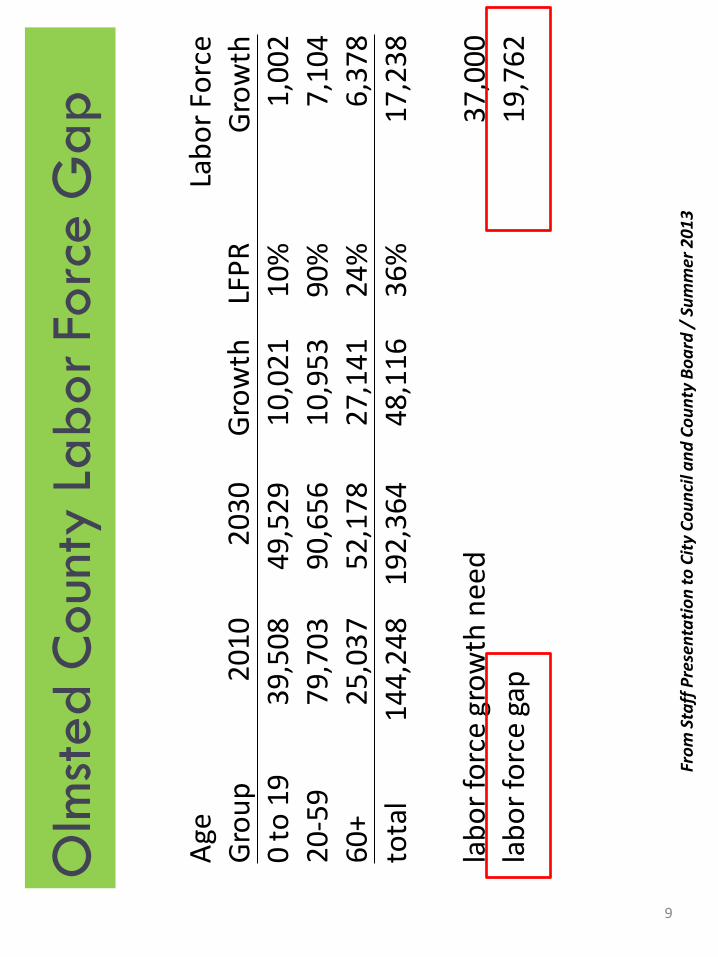
LABOR FORCE INFORMATION
Key Takeaway: One of the main challenges employers in Olmsted County / Rochester will face in future is finding enough workers to fill job replacement needs due to retirement of Baby Boomers + new job openings that will be created
8
Olm
sted
Coun
ty L
ab
or
Forc
e G
ap
9
Age
G
rou
p2
01
020
30G
row
thLF
PR
Lab
or
Forc
e G
row
th0
to
19
39
,50
849
,529
10
,02
110
%1
,00
22
0-5
97
9,7
03
90,6
561
0,9
53
90%
7,1
04
60
+2
5,0
37
52,1
782
7,1
41
24%
6,3
78
tota
l1
44
,24
819
2,36
44
8,1
16
36%
17
,23
8
lab
or
forc
e gr
ow
th n
eed
37
,00
0la
bo
r fo
rce
gap
19
,76
2
Fro
m S
taff
Pre
sen
tati
on
to
Cit
y C
ou
nci
l an
d C
ou
nty
Bo
ard
/ S
um
mer
20
13
9
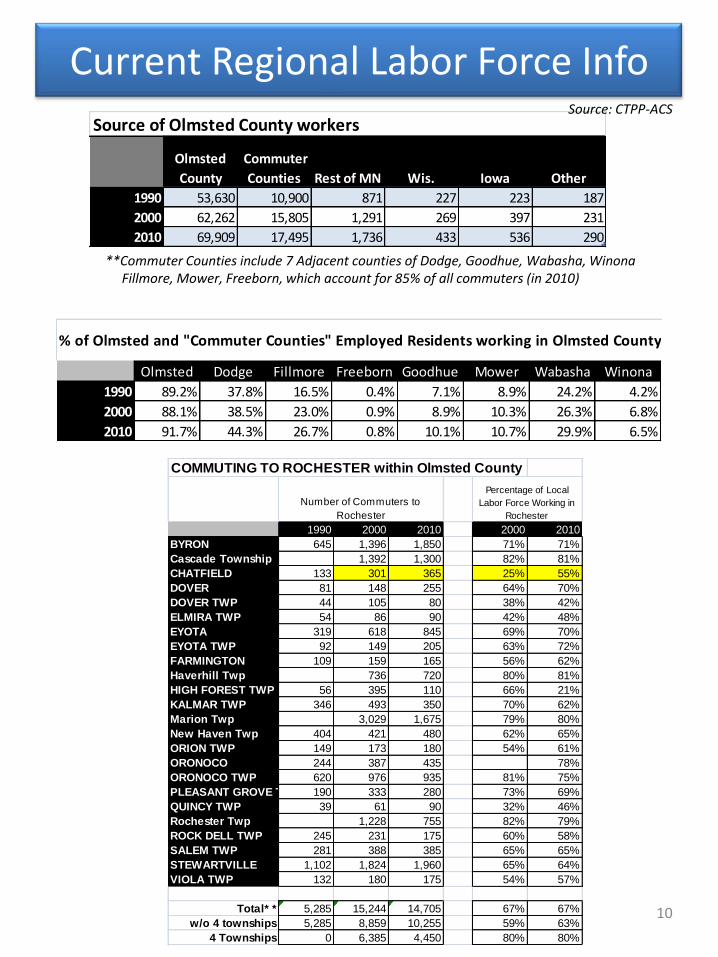
Current Regional Labor Force Info
Olmsted
County
Commuter
Counties Rest of MN Wis. Iowa Other
1990 53,630 10,900 871 227 223 187
2000 62,262 15,805 1,291 269 397 231
2010 69,909 17,495 1,736 433 536 290
Source of Olmsted County workers
**Commuter Counties include 7 Adjacent counties of Dodge, Goodhue, Wabasha, Winona Fillmore, Mower, Freeborn, which account for 85% of all commuters (in 2010)
Source: CTPP-ACS
% of Olmsted and "Commuter Counties" Employed Residents working in Olmsted County
Olmsted Dodge Fillmore Freeborn Goodhue Mower Wabasha Winona
1990 89.2% 37.8% 16.5% 0.4% 7.1% 8.9% 24.2% 4.2%
2000 88.1% 38.5% 23.0% 0.9% 8.9% 10.3% 26.3% 6.8%
2010 91.7% 44.3% 26.7% 0.8% 10.1% 10.7% 29.9% 6.5%
COMMUTING TO ROCHESTER within Olmsted County
1990 2000 2010 2000 2010
BYRON 645 1,396 1,850 71% 71%
Cascade Township 1,392 1,300 82% 81%
CHATFIELD 133 301 365 25% 55%
DOVER 81 148 255 64% 70%
DOVER TWP 44 105 80 38% 42%
ELMIRA TWP 54 86 90 42% 48%
EYOTA 319 618 845 69% 70%
EYOTA TWP 92 149 205 63% 72%
FARMINGTON 109 159 165 56% 62%
Haverhill Twp 736 720 80% 81%
HIGH FOREST TWP 56 395 110 66% 21%
KALMAR TWP 346 493 350 70% 62%
Marion Twp 3,029 1,675 79% 80%
New Haven Twp 404 421 480 62% 65%
ORION TWP 149 173 180 54% 61%
ORONOCO 244 387 435 78%
ORONOCO TWP 620 976 935 81% 75%
PLEASANT GROVE TWP 190 333 280 73% 69%
QUINCY TWP 39 61 90 32% 46%
Rochester Twp 1,228 755 82% 79%
ROCK DELL TWP 245 231 175 60% 58%
SALEM TWP 281 388 385 65% 65%
STEWARTVILLE 1,102 1,824 1,960 65% 64%
VIOLA TWP 132 180 175 54% 57%
Total* * 5,285 15,244 14,705 67% 67%
w/o 4 townships 5,285 8,859 10,255 59% 63%
4 Townships 0 6,385 4,450 80% 80%
Percentage of Local
Labor Force Working in
Rochester
Number of Commuters to
Rochester
10
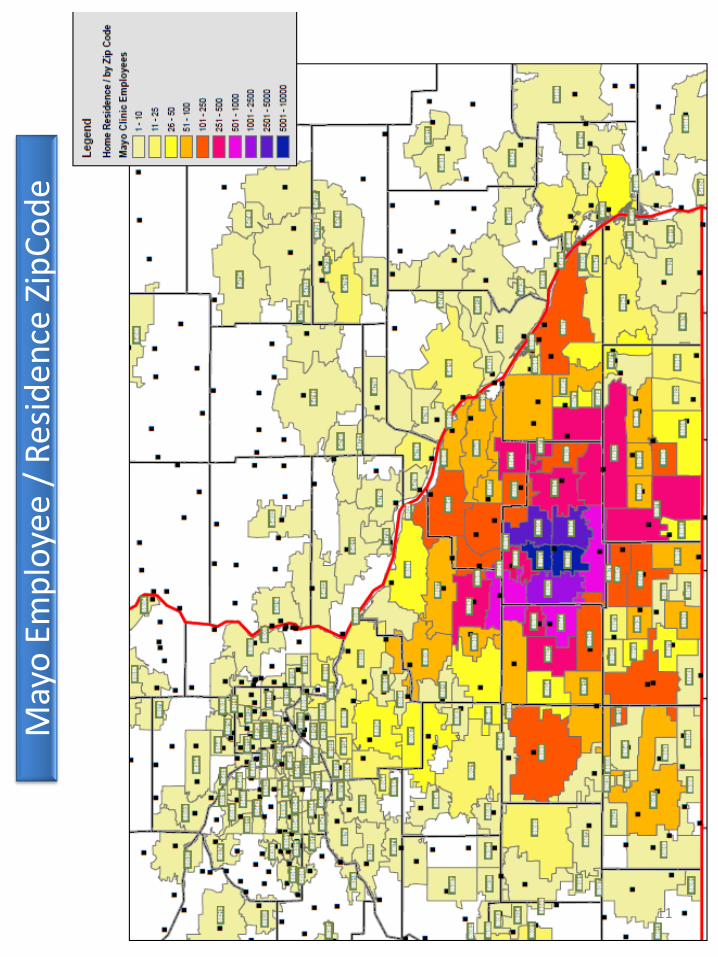
May
o E
mp
loye
e /
Res
iden
ce Z
ipC
od
e
11
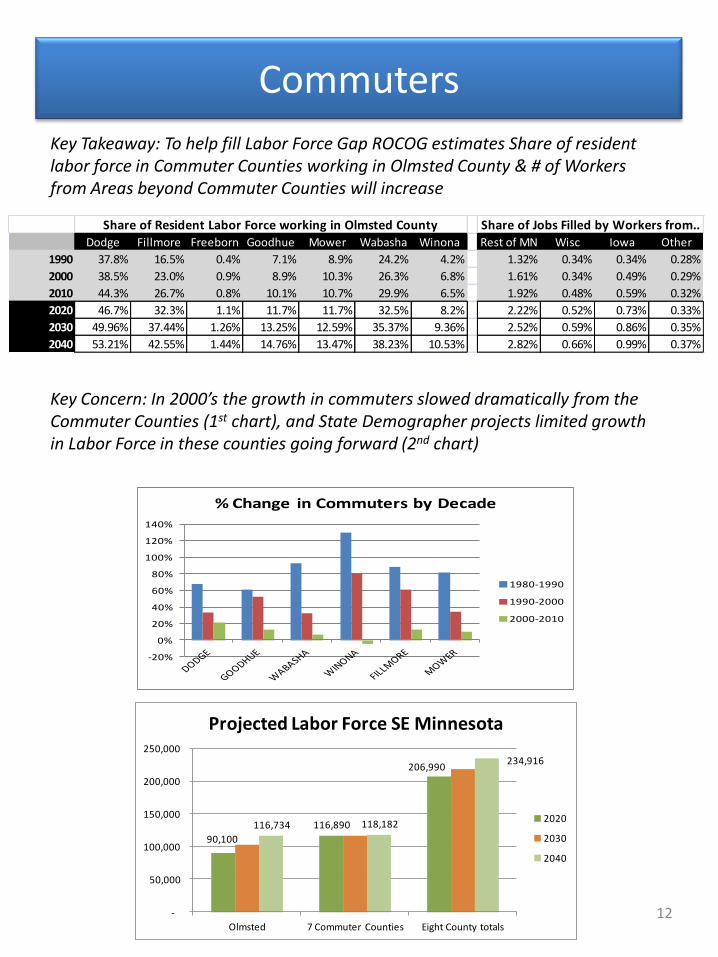
Commuters
-20%
0%
20%
40%
60%
80%
100%
120%
140%
% Change in Commuters by Decade
1980-1990
1990-2000
2000-2010
90,100
116,890
206,990
116,734 118,182
234,916
-
50,000
100,000
150,000
200,000
250,000
Olmsted 7 Commuter Counties Eight County totals
Projected Labor Force SE Minnesota
2020
2030
2040
12
Key Takeaway: To help fill Labor Force Gap ROCOG estimates Share of resident labor force in Commuter Counties working in Olmsted County & # of Workers from Areas beyond Commuter Counties will increase
Dodge Fillmore Freeborn Goodhue Mower Wabasha Winona Rest of MN Wisc Iowa Other
1990 37.8% 16.5% 0.4% 7.1% 8.9% 24.2% 4.2% 1.32% 0.34% 0.34% 0.28%
2000 38.5% 23.0% 0.9% 8.9% 10.3% 26.3% 6.8% 1.61% 0.34% 0.49% 0.29%
2010 44.3% 26.7% 0.8% 10.1% 10.7% 29.9% 6.5% 1.92% 0.48% 0.59% 0.32%
2020 46.7% 32.3% 1.1% 11.7% 11.7% 32.5% 8.2% 2.22% 0.52% 0.73% 0.33%
2030 49.96% 37.44% 1.26% 13.25% 12.59% 35.37% 9.36% 2.52% 0.59% 0.86% 0.35%
2040 53.21% 42.55% 1.44% 14.76% 13.47% 38.23% 10.53% 2.82% 0.66% 0.99% 0.37%
Share of Jobs Filled by Workers from..Share of Resident Labor Force working in Olmsted County
Key Concern: In 2000’s the growth in commuters slowed dramatically from the Commuter Counties (1st chart), and State Demographer projects limited growth in Labor Force in these counties going forward (2nd chart)
13
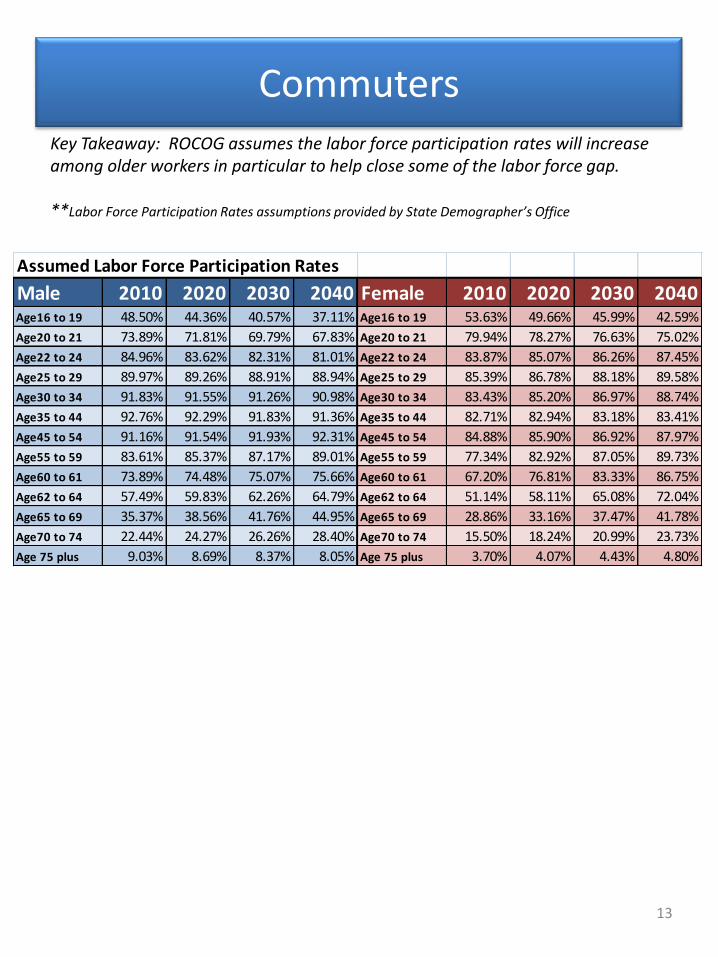
Commuters Key Takeaway: ROCOG assumes the labor force participation rates will increase among older workers in particular to help close some of the labor force gap. **Labor Force Participation Rates assumptions provided by State Demographer’s Office
Assumed Labor Force Participation Rates
Male 2010 2020 2030 2040 Female 2010 2020 2030 2040Age16 to 19 48.50% 44.36% 40.57% 37.11% Age16 to 19 53.63% 49.66% 45.99% 42.59%
Age20 to 21 73.89% 71.81% 69.79% 67.83% Age20 to 21 79.94% 78.27% 76.63% 75.02%
Age22 to 24 84.96% 83.62% 82.31% 81.01% Age22 to 24 83.87% 85.07% 86.26% 87.45%
Age25 to 29 89.97% 89.26% 88.91% 88.94% Age25 to 29 85.39% 86.78% 88.18% 89.58%
Age30 to 34 91.83% 91.55% 91.26% 90.98% Age30 to 34 83.43% 85.20% 86.97% 88.74%
Age35 to 44 92.76% 92.29% 91.83% 91.36% Age35 to 44 82.71% 82.94% 83.18% 83.41%
Age45 to 54 91.16% 91.54% 91.93% 92.31% Age45 to 54 84.88% 85.90% 86.92% 87.97%
Age55 to 59 83.61% 85.37% 87.17% 89.01% Age55 to 59 77.34% 82.92% 87.05% 89.73%
Age60 to 61 73.89% 74.48% 75.07% 75.66% Age60 to 61 67.20% 76.81% 83.33% 86.75%
Age62 to 64 57.49% 59.83% 62.26% 64.79% Age62 to 64 51.14% 58.11% 65.08% 72.04%
Age65 to 69 35.37% 38.56% 41.76% 44.95% Age65 to 69 28.86% 33.16% 37.47% 41.78%
Age70 to 74 22.44% 24.27% 26.26% 28.40% Age70 to 74 15.50% 18.24% 20.99% 23.73%
Age 75 plus 9.03% 8.69% 8.37% 8.05% Age 75 plus 3.70% 4.07% 4.43% 4.80%
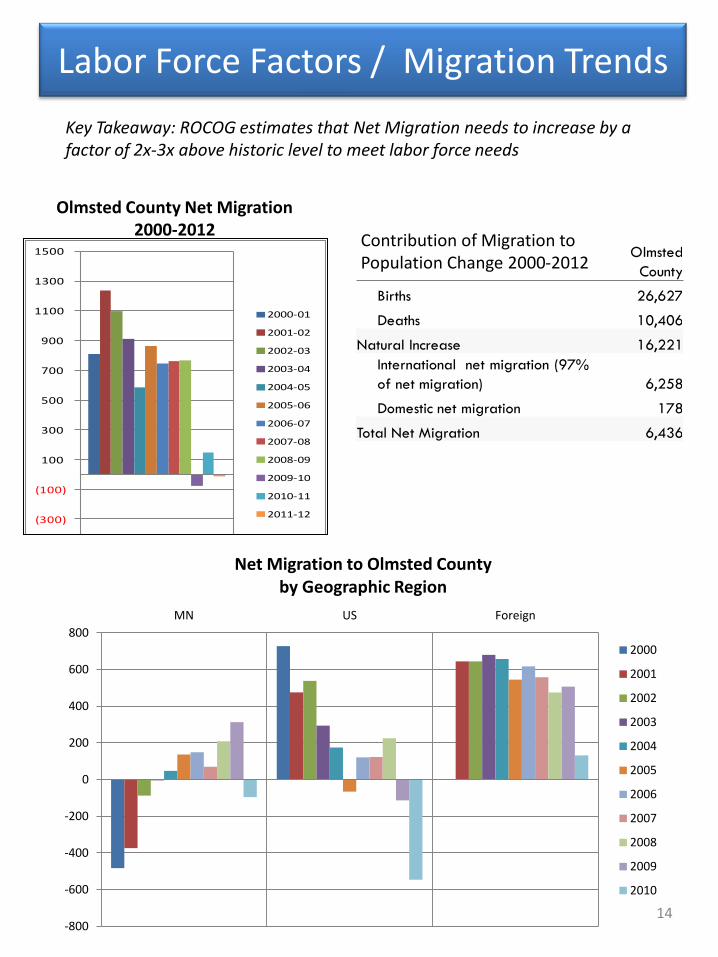
Labor Force Factors / Migration Trends
-800
-600
-400
-200
0
200
400
600
800
MN US Foreign
Net Migration to Olmsted County by Geographic Region
2000
2001
2002
2003
2004
2005
2006
2007
2008
2009
2010
Components of Change
2000-2012
Olmsted
County
Births 26,627
Deaths 10,406
Natural Increase 16,221
International net migration (97%
of net migration) 6,258
Domestic net migration 178
Total Net Migration 6,436
(500)
(300)
(100)
100
300
500
700
900
1100
1300
1500
Olmsted County Net Migration
2000-01
2001-02
2002-03
2003-04
2004-05
2005-06
2006-07
2007-08
2008-09
2009-10
2010-11
2011-12
Olmsted County Net Migration 2000-2012
Key Takeaway: ROCOG estimates that Net Migration needs to increase by a factor of 2x-3x above historic level to meet labor force needs
Contribution of Migration to Population Change 2000-2012
14