Embed Size (px)
Citation preview
Congressional Budget Offi ce
Background Paper
THE CONGRESS OF THE UNITED STATES
Employment During the2001–2003 Recovery
August 2005

Employment During the2001–2003 Recovery
August 2005
CBO
The Congress of the United States O Congressional Budget Office

Note
Figures in this paper use shaded vertical bars to indicate periods of recession. A recession extends from the peak of a business cycle to its trough.

PrefaceThe Congressional Budget Office (CBO) regularly examines issues and developments that could affect its economic forecasts and projections. As part of that endeavor, this background paper examines job growth following the 2001 recession. After declining by about 1.6 million jobs during that recession, employment fell by more than an additional million jobs in the first 18 months following the end of the recession. Understanding why employment fell even as output recovered can be useful both in assessing the labor market and in forecasting the path of employment during future recoveries.
David Brauer of the Macroeconomic Analysis Division prepared the paper under the supervi-sion of Kim Kowalewski and Robert Dennis. Brian Mathis and Andrew Gisselquist provided research and other assistance. Bob Arnold, Molly Dahl, Tom DeLeire, Ufuk Demiroglu, Douglas Hamilton, Arlene Holen, Juann Hung, Mark Lasky, John Peterson, Ralph Smith, and Christopher Williams provided comments. Lawrence Katz of Harvard University reviewed the paper. (The assistance of an external reviewer implies no responsibility for the final product, which rests solely with CBO.)
John Skeen edited the paper, and Loretta Lettner proofread it. Benjamin Umansky prepared the figures, and Maureen Costantino formatted the paper for publication. Lenny Skutnik pro-duced the printed copies for distribution, and Annette Kalicki and Simone Thomas prepared the electronic version for CBO’s Web site (www.cbo.gov).
Douglas Holtz-EakinDirector
August 2005

v
Contents
Introduction and Summary 1
Productivity 6
Shocks and Uncertainty 7
Temporary Help 9
The Labor Market During the 1990s 10
Other Proposed Explanations 11Measurement Issues and the Labor Force 12Structural Change 12Nonwage Labor Costs 14
Figures
1. The Employment Cycle for the 2001 Recession Compared with the Average Cycle 2
2. The Employment Cycle for the 2001 Recession Compared withThat for the 1990-1991 Recession 3
3. Job Creation and Destruction in the Private Sector,1992 to 2004 4
4. Employment in Manufacturing, 1970 to 2005 5
5. Productivity in the Nonfarm Business Sector, 1980 to 2005 7
6. Average Weekly Hours of Work, 1980 to 2005 8
7. Employment in Temporary Help Services, 1982 to 2005 10
8. Employment in High-Tech Industries, 1990 to 2005 11
9. Duration of Unemployment Spells, 1970 to 2005 13
10. Employers’ Health Insurance Costs, 1981 to 2005 14

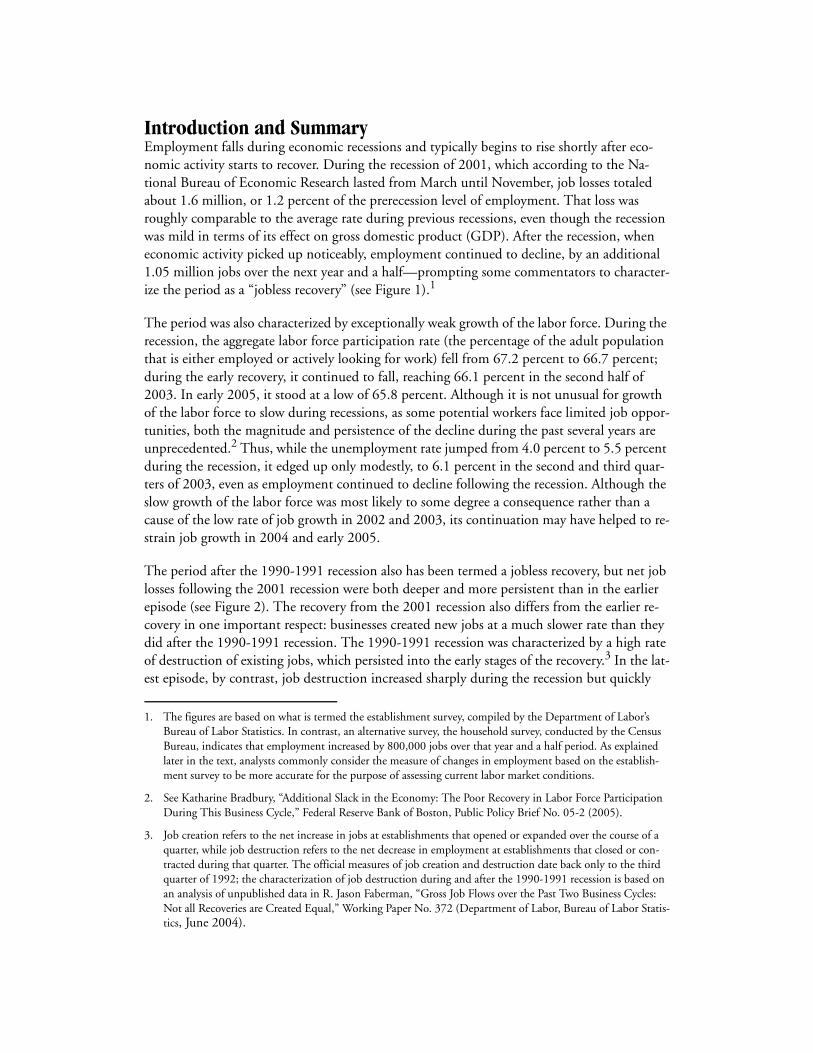
Introduction and SummaryEmployment falls during economic recessions and typically begins to rise shortly after eco-nomic activity starts to recover. During the recession of 2001, which according to the Na-tional Bureau of Economic Research lasted from March until November, job losses totaled about 1.6 million, or 1.2 percent of the prerecession level of employment. That loss was roughly comparable to the average rate during previous recessions, even though the recession was mild in terms of its effect on gross domestic product (GDP). After the recession, when economic activity picked up noticeably, employment continued to decline, by an additional 1.05 million jobs over the next year and a half—prompting some commentators to character-ize the period as a “jobless recovery” (see Figure 1).1
The period was also characterized by exceptionally weak growth of the labor force. During the recession, the aggregate labor force participation rate (the percentage of the adult population that is either employed or actively looking for work) fell from 67.2 percent to 66.7 percent; during the early recovery, it continued to fall, reaching 66.1 percent in the second half of 2003. In early 2005, it stood at a low of 65.8 percent. Although it is not unusual for growth of the labor force to slow during recessions, as some potential workers face limited job oppor-tunities, both the magnitude and persistence of the decline during the past several years are unprecedented.2 Thus, while the unemployment rate jumped from 4.0 percent to 5.5 percent during the recession, it edged up only modestly, to 6.1 percent in the second and third quar-ters of 2003, even as employment continued to decline following the recession. Although the slow growth of the labor force was most likely to some degree a consequence rather than a cause of the low rate of job growth in 2002 and 2003, its continuation may have helped to re-strain job growth in 2004 and early 2005.
The period after the 1990-1991 recession also has been termed a jobless recovery, but net job losses following the 2001 recession were both deeper and more persistent than in the earlier episode (see Figure 2). The recovery from the 2001 recession also differs from the earlier re-covery in one important respect: businesses created new jobs at a much slower rate than they did after the 1990-1991 recession. The 1990-1991 recession was characterized by a high rate of destruction of existing jobs, which persisted into the early stages of the recovery.3 In the lat-est episode, by contrast, job destruction increased sharply during the recession but quickly
1. The figures are based on what is termed the establishment survey, compiled by the Department of Labor’s Bureau of Labor Statistics. In contrast, an alternative survey, the household survey, conducted by the Census Bureau, indicates that employment increased by 800,000 jobs over that year and a half period. As explained later in the text, analysts commonly consider the measure of changes in employment based on the establish-ment survey to be more accurate for the purpose of assessing current labor market conditions.
2. See Katharine Bradbury, “Additional Slack in the Economy: The Poor Recovery in Labor Force Participation During This Business Cycle,” Federal Reserve Bank of Boston, Public Policy Brief No. 05-2 (2005).
3. Job creation refers to the net increase in jobs at establishments that opened or expanded over the course of a quarter, while job destruction refers to the net decrease in employment at establishments that closed or con-tracted during that quarter. The official measures of job creation and destruction date back only to the third quarter of 1992; the characterization of job destruction during and after the 1990-1991 recession is based on an analysis of unpublished data in R. Jason Faberman, “Gross Job Flows over the Past Two Business Cycles: Not all Recoveries are Created Equal,” Working Paper No. 372 (Department of Labor, Bureau of Labor Statis-tics, June 2004).
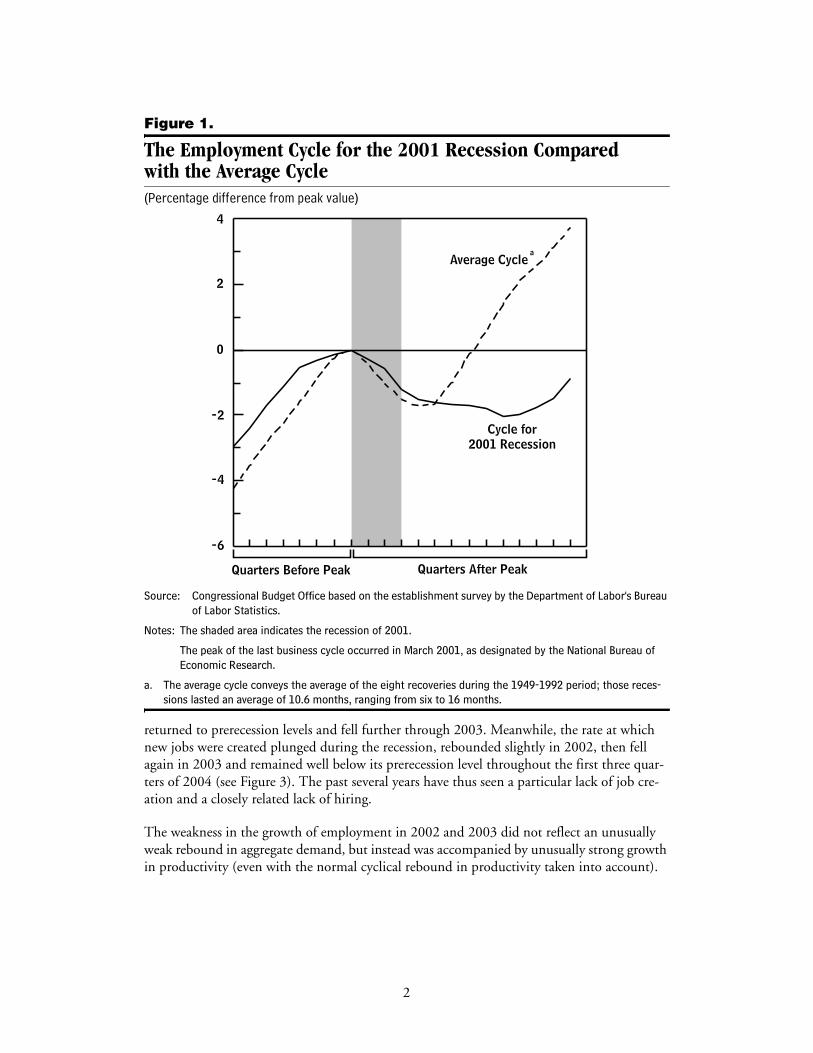
Figure 1.
The Employment Cycle for the 2001 Recession Compared with the Average Cycle(Percentage difference from peak value)
Source: Congressional Budget Office based on the establishment survey by the Department of Labor's Bureau of Labor Statistics.
Notes: The shaded area indicates the recession of 2001.
The peak of the last business cycle occurred in March 2001, as designated by the National Bureau of Economic Research.
a. The average cycle conveys the average of the eight recoveries during the 1949-1992 period; those reces-sions lasted an average of 10.6 months, ranging from six to 16 months.
returned to prerecession levels and fell further through 2003. Meanwhile, the rate at which new jobs were created plunged during the recession, rebounded slightly in 2002, then fell again in 2003 and remained well below its prerecession level throughout the first three quar-ters of 2004 (see Figure 3). The past several years have thus seen a particular lack of job cre-ation and a closely related lack of hiring.
The weakness in the growth of employment in 2002 and 2003 did not reflect an unusually weak rebound in aggregate demand, but instead was accompanied by unusually strong growth in productivity (even with the normal cyclical rebound in productivity taken into account).
4
2
0
-2
-4
-6
Cycle for2001 Recession
Average Cycle
Quarters Before Peak Quarters After Peak
a
2
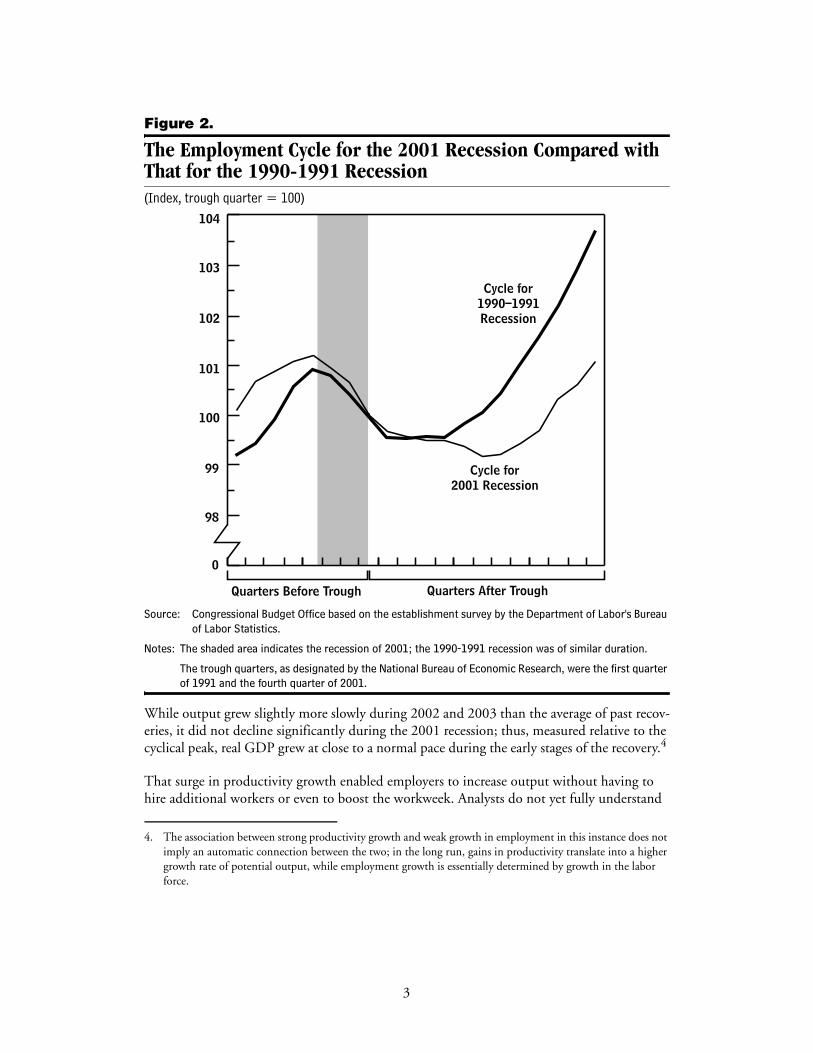
Figure 2.
The Employment Cycle for the 2001 Recession Compared withThat for the 1990-1991 Recession(Index, trough quarter = 100)
Source: Congressional Budget Office based on the establishment survey by the Department of Labor's Bureau of Labor Statistics.
Notes: The shaded area indicates the recession of 2001; the 1990-1991 recession was of similar duration.
The trough quarters, as designated by the National Bureau of Economic Research, were the first quarter of 1991 and the fourth quarter of 2001.
While output grew slightly more slowly during 2002 and 2003 than the average of past recov-eries, it did not decline significantly during the 2001 recession; thus, measured relative to the cyclical peak, real GDP grew at close to a normal pace during the early stages of the recovery.4
That surge in productivity growth enabled employers to increase output without having to hire additional workers or even to boost the workweek. Analysts do not yet fully understand
4. The association between strong productivity growth and weak growth in employment in this instance does not imply an automatic connection between the two; in the long run, gains in productivity translate into a higher growth rate of potential output, while employment growth is essentially determined by growth in the labor force.
104
103
102
101
100
99
98
0
Cycle for2001 Recession
Quarters Before Trough Quarters After Trough
Cycle for1990–1991Recession
3
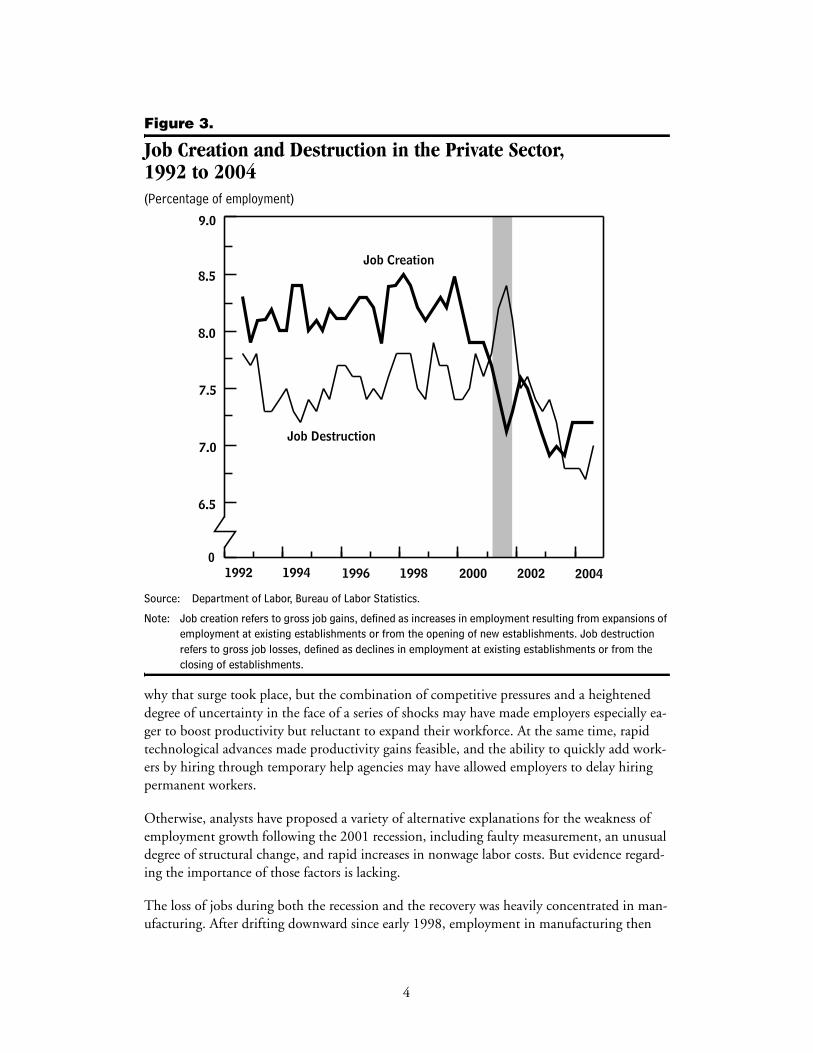
Figure 3.
Job Creation and Destruction in the Private Sector,1992 to 2004(Percentage of employment)
Source: Department of Labor, Bureau of Labor Statistics.
Note: Job creation refers to gross job gains, defined as increases in employment resulting from expansions of employment at existing establishments or from the opening of new establishments. Job destruction refers to gross job losses, defined as declines in employment at existing establishments or from the closing of establishments.
why that surge took place, but the combination of competitive pressures and a heighteneddegree of uncertainty in the face of a series of shocks may have made employers especially ea-ger to boost productivity but reluctant to expand their workforce. At the same time, rapid technological advances made productivity gains feasible, and the ability to quickly add work-ers by hiring through temporary help agencies may have allowed employers to delay hiring permanent workers.
Otherwise, analysts have proposed a variety of alternative explanations for the weakness of employment growth following the 2001 recession, including faulty measurement, an unusual degree of structural change, and rapid increases in nonwage labor costs. But evidence regard-ing the importance of those factors is lacking.
The loss of jobs during both the recession and the recovery was heavily concentrated in man-ufacturing. After drifting downward since early 1998, employment in manufacturing then
2004200220001998199619941992
9.0
8.5
8.0
7.5
7.0
6.5
0
Job Destruction
Job Creation
4
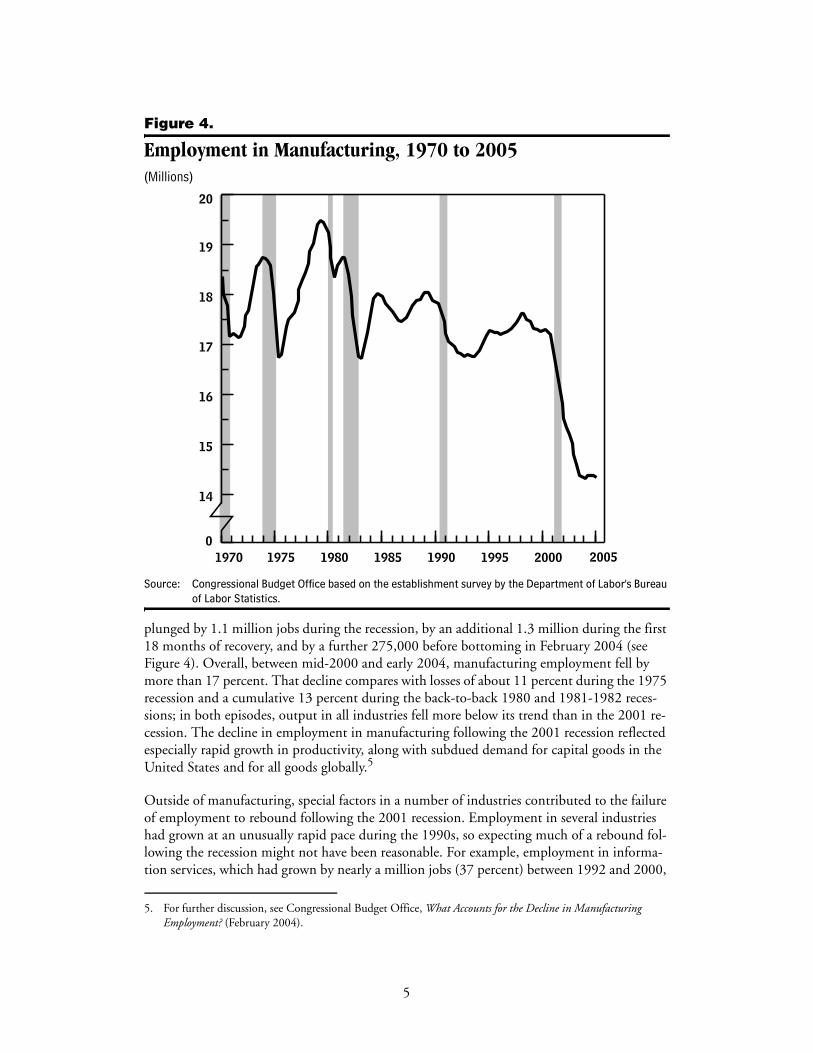
Figure 4.
Employment in Manufacturing, 1970 to 2005(Millions)
Source: Congressional Budget Office based on the establishment survey by the Department of Labor's Bureau of Labor Statistics.
plunged by 1.1 million jobs during the recession, by an additional 1.3 million during the first 18 months of recovery, and by a further 275,000 before bottoming in February 2004 (see Figure 4). Overall, between mid-2000 and early 2004, manufacturing employment fell by more than 17 percent. That decline compares with losses of about 11 percent during the 1975 recession and a cumulative 13 percent during the back-to-back 1980 and 1981-1982 reces-sions; in both episodes, output in all industries fell more below its trend than in the 2001 re-cession. The decline in employment in manufacturing following the 2001 recession reflected especially rapid growth in productivity, along with subdued demand for capital goods in the United States and for all goods globally.5
Outside of manufacturing, special factors in a number of industries contributed to the failure of employment to rebound following the 2001 recession. Employment in several industries had grown at an unusually rapid pace during the 1990s, so expecting much of a rebound fol-lowing the recession might not have been reasonable. For example, employment in informa-tion services, which had grown by nearly a million jobs (37 percent) between 1992 and 2000,
5. For further discussion, see Congressional Budget Office, What Accounts for the Decline in Manufacturing Employment? (February 2004).
2000199519901985198019751970
20
19
18
17
16
15
14
02005
5
fell by a modest 186,000 jobs (5 percent) during the recession, but an additional 338,000 (10 percent) during the first year and a half of the recovery. With temporary workers typically the first to be dismissed when demand cools, employment in the temporary help services industry fell by about half a million jobs between mid-2000 and the end of the recession and failed to rebound decisively following the recession. Employment was also weak in two industries—transportation, and leisure and hospitality—which suffered from the effects of the September 11 terrorist attacks. Finally, construction employment fell by much less during the 2001 reces-sion than in most past recessions, so there was less room for a cyclical rebound.6
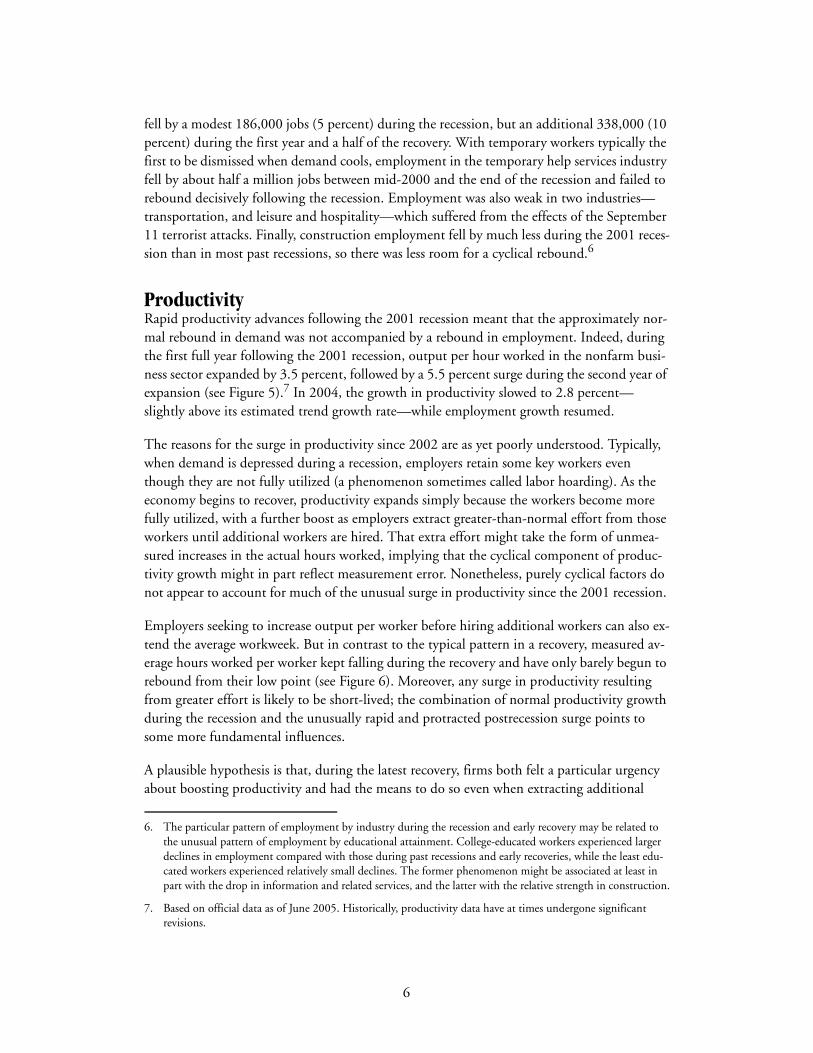
Productivity Rapid productivity advances following the 2001 recession meant that the approximately nor-mal rebound in demand was not accompanied by a rebound in employment. Indeed, during the first full year following the 2001 recession, output per hour worked in the nonfarm busi-ness sector expanded by 3.5 percent, followed by a 5.5 percent surge during the second year of expansion (see Figure 5).7 In 2004, the growth in productivity slowed to 2.8 percent—slightly above its estimated trend growth rate—while employment growth resumed.
The reasons for the surge in productivity since 2002 are as yet poorly understood. Typically, when demand is depressed during a recession, employers retain some key workers even though they are not fully utilized (a phenomenon sometimes called labor hoarding). As the economy begins to recover, productivity expands simply because the workers become more fully utilized, with a further boost as employers extract greater-than-normal effort from those workers until additional workers are hired. That extra effort might take the form of unmea-sured increases in the actual hours worked, implying that the cyclical component of produc-tivity growth might in part reflect measurement error. Nonetheless, purely cyclical factors do not appear to account for much of the unusual surge in productivity since the 2001 recession.
Employers seeking to increase output per worker before hiring additional workers can also ex-tend the average workweek. But in contrast to the typical pattern in a recovery, measured av-erage hours worked per worker kept falling during the recovery and have only barely begun to rebound from their low point (see Figure 6). Moreover, any surge in productivity resulting from greater effort is likely to be short-lived; the combination of normal productivity growth during the recession and the unusually rapid and protracted postrecession surge points to some more fundamental influences.
A plausible hypothesis is that, during the latest recovery, firms both felt a particular urgency about boosting productivity and had the means to do so even when extracting additional
6. The particular pattern of employment by industry during the recession and early recovery may be related to the unusual pattern of employment by educational attainment. College-educated workers experienced larger declines in employment compared with those during past recessions and early recoveries, while the least edu-cated workers experienced relatively small declines. The former phenomenon might be associated at least in part with the drop in information and related services, and the latter with the relative strength in construction.
7. Based on official data as of June 2005. Historically, productivity data have at times undergone significantrevisions.
6
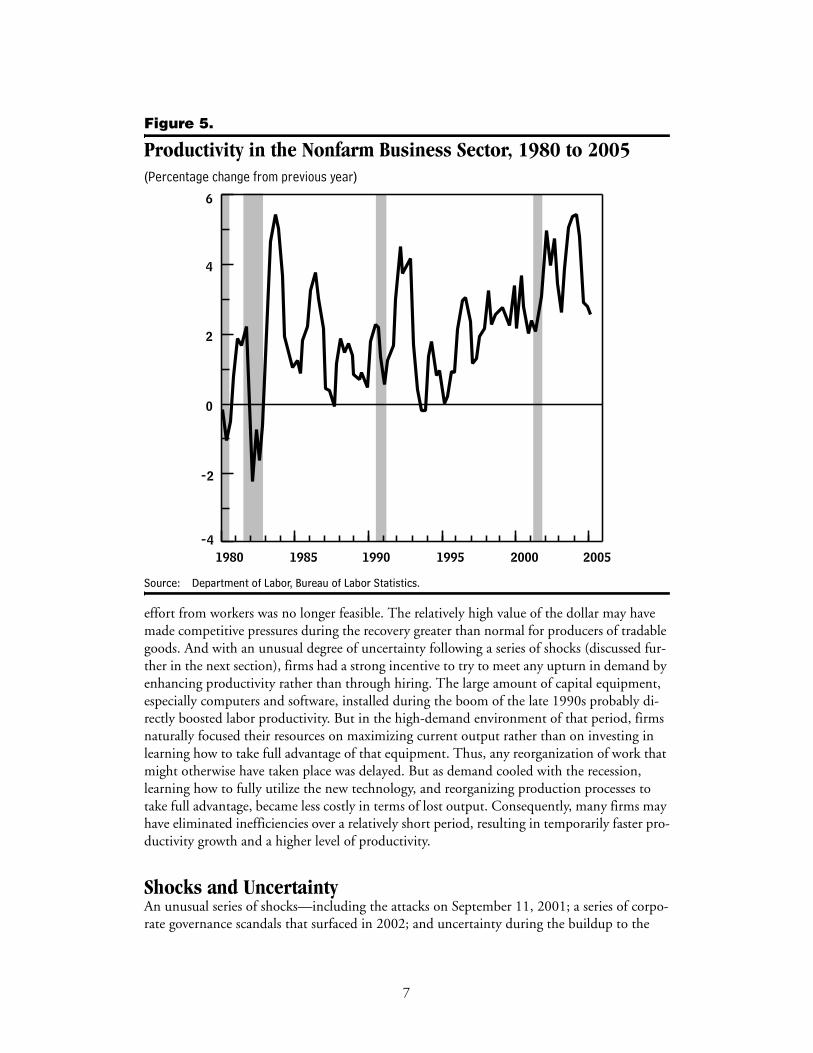
Figure 5.
Productivity in the Nonfarm Business Sector, 1980 to 2005(Percentage change from previous year)
Source: Department of Labor, Bureau of Labor Statistics.
effort from workers was no longer feasible. The relatively high value of the dollar may have made competitive pressures during the recovery greater than normal for producers of tradable goods. And with an unusual degree of uncertainty following a series of shocks (discussed fur-ther in the next section), firms had a strong incentive to try to meet any upturn in demand by enhancing productivity rather than through hiring. The large amount of capital equipment, especially computers and software, installed during the boom of the late 1990s probably di-rectly boosted labor productivity. But in the high-demand environment of that period, firms naturally focused their resources on maximizing current output rather than on investing in learning how to take full advantage of that equipment. Thus, any reorganization of work that might otherwise have taken place was delayed. But as demand cooled with the recession, learning how to fully utilize the new technology, and reorganizing production processes to take full advantage, became less costly in terms of lost output. Consequently, many firms may have eliminated inefficiencies over a relatively short period, resulting in temporarily faster pro-ductivity growth and a higher level of productivity.
Shocks and UncertaintyAn unusual series of shocks—including the attacks on September 11, 2001; a series of corpo-rate governance scandals that surfaced in 2002; and uncertainty during the buildup to the
200520001995199019851980
6
4
2
0
-2
-4
7
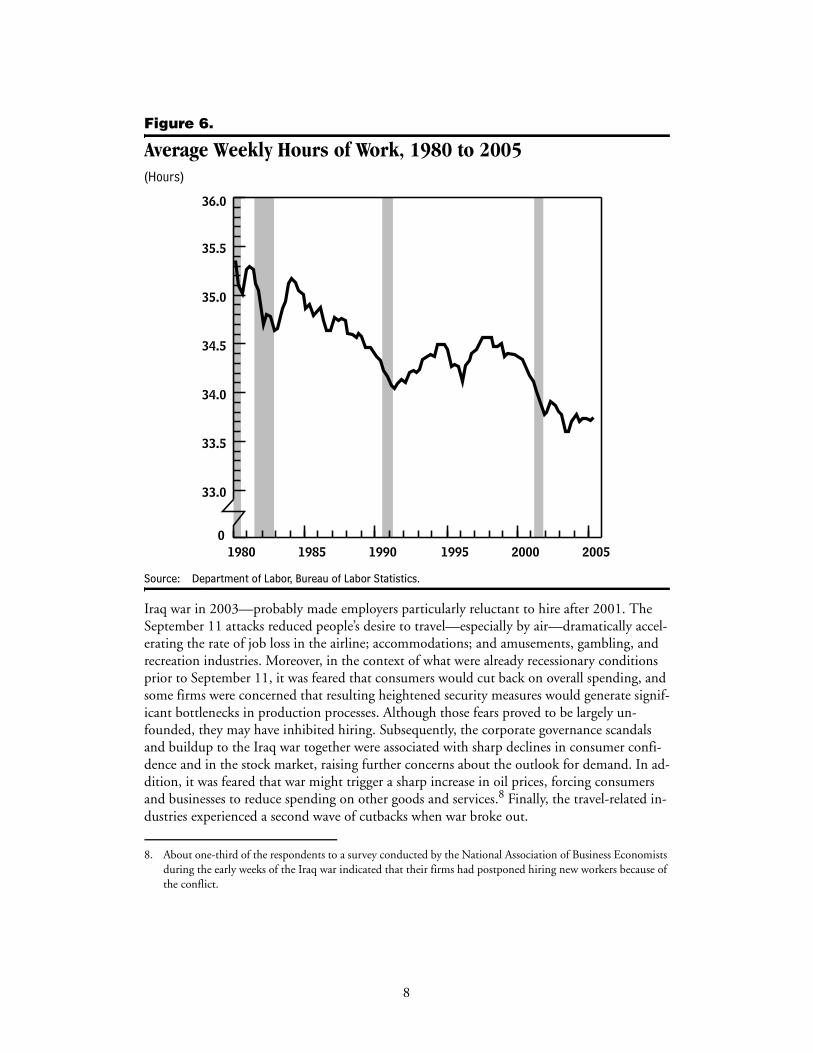
Figure 6.
Average Weekly Hours of Work, 1980 to 2005(Hours)
Source: Department of Labor, Bureau of Labor Statistics.
Iraq war in 2003—probably made employers particularly reluctant to hire after 2001. The September 11 attacks reduced people’s desire to travel—especially by air—dramatically accel-erating the rate of job loss in the airline; accommodations; and amusements, gambling, and recreation industries. Moreover, in the context of what were already recessionary conditions prior to September 11, it was feared that consumers would cut back on overall spending, and some firms were concerned that resulting heightened security measures would generate signif-icant bottlenecks in production processes. Although those fears proved to be largely un-founded, they may have inhibited hiring. Subsequently, the corporate governance scandals and buildup to the Iraq war together were associated with sharp declines in consumer confi-dence and in the stock market, raising further concerns about the outlook for demand. In ad-dition, it was feared that war might trigger a sharp increase in oil prices, forcing consumers and businesses to reduce spending on other goods and services.8 Finally, the travel-related in-dustries experienced a second wave of cutbacks when war broke out.
8. About one-third of the respondents to a survey conducted by the National Association of Business Economists during the early weeks of the Iraq war indicated that their firms had postponed hiring new workers because of the conflict.
200520001995199019851980
36.0
35.5
35.0
34.5
34.0
33.5
33.0
0
8
In general, employers will hire when the expected return from hiring a worker exceeds the ex-pected cost of doing so. That return, however, will to a considerable degree depend on future demand, while recruiting and training costs are immediate and necessarily incurred before de-mand can be known. If demand growth fails to meet expectations, some of those increased costs will have been wasted, so heightened uncertainty about demand makes it riskier for firms to commit to hiring new permanent staff. Thus, after 2001, with demand still subpar in some industries, the heightened uncertainty appears to have inhibited hiring; it was not until signs of stronger and more sustainable growth in final demand emerged and fears of a sharp increase in oil prices were dispelled following the Iraq war that employers began to resume hiring.
Temporary HelpThe effect of heightened uncertainty may be magnified by the existence of a rapidly growing temporary help industry, because employers know that if demand growth exceeds expecta-tions, they can quickly add temporary workers without having to incur the large fixed costs associated with permanent hiring. These temporary workers are counted in the establishment survey, so hiring them instead of permanent workers has no direct effect on the level of em-ployment. Nonetheless, the growing importance of the industry could have either increased or reduced employment growth during the early stages of the recovery.
Employment through temporary help agencies accounted for 2.0 percent of total employ-ment in 2000, up from less than 0.5 percent in 1982, and 1.1 percent in 1990 (see Figure 7). During the recession, employment in temporary help services fell by about 320,000, account-ing for about a fifth of the overall decline in employment, as employers cut back on the use of temporary workers before reducing their permanent staff. It remained roughly constant throughout most of the early stages of the recovery but began to rebound several months be-fore overall employment turned around.
Generally speaking, in deciding whether or not to hire additional workers, employers weigh the cost of hiring—both the fixed up-front hiring cost and the hourly cost of wages and benefits—against the revenue that would be obtained from any additional output that is pro-duced. On the one hand, the up-front cost of hiring temporary workers is less than that for permanent workers, so the ability to avoid commitments that is made possible by the tempo-rary help industry may induce employers to hire more quickly early in an expansion, when de-mand conditions are uncertain. However, the same ability to quickly and inexpensively add workers also lowers employers’ risk of missing profitable opportunities because of an insuffi-cient number of workers, allowing employers to wait before recruiting permanent workers un-til they are confident that any increase in demand will be sustained.9 (In fact, the temporary help industry has increasingly functioned as a low-cost vehicle for screening and recruiting prospective permanent workers in some industries.) The pattern of declining employment in temporary help services throughout most of the recovery period after the 2001 recession sug-gests that the negative effect on employment from reducing the cost of waiting to hire was probably stronger than the positive effect from reducing actual hiring costs.
9. See Stacey L. Schreft and Aarti Singh, “A Closer Look at Jobless Recoveries,”Economic Review, Federal Reserve Bank of Kansas City, vol. 88, no. 2 (2003), pp. 45-73.
9
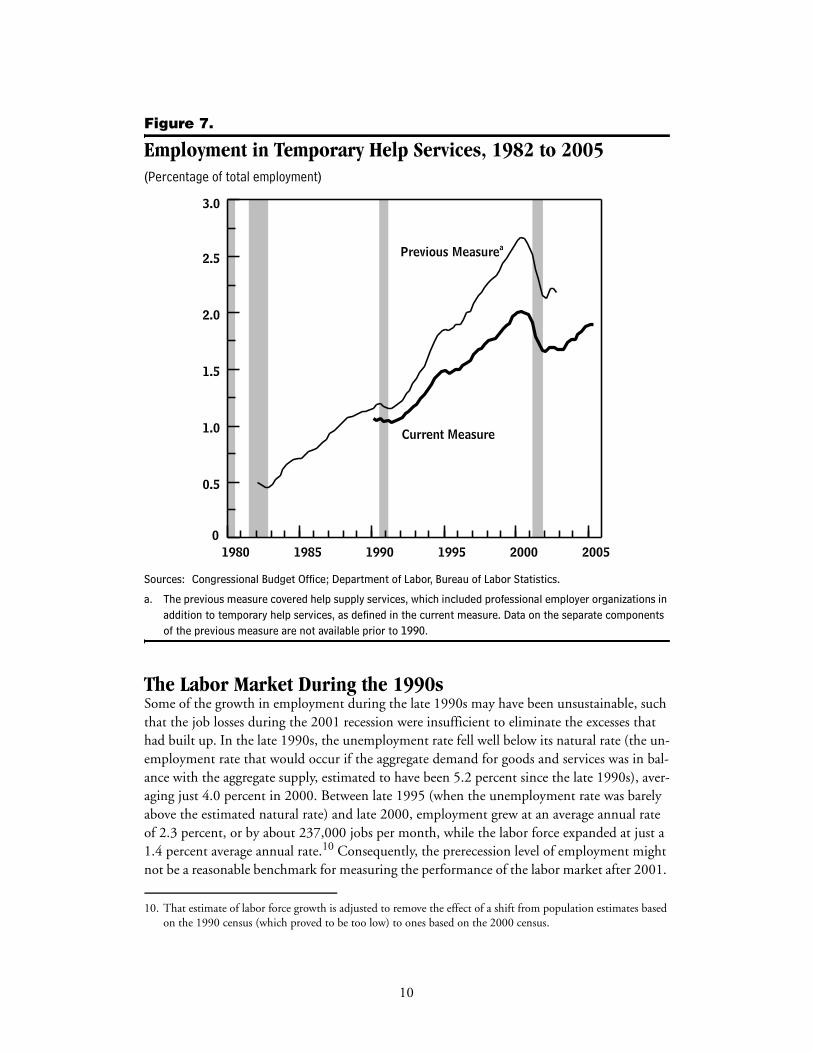
Figure 7.
Employment in Temporary Help Services, 1982 to 2005(Percentage of total employment)
Sources: Congressional Budget Office; Department of Labor, Bureau of Labor Statistics.
a. The previous measure covered help supply services, which included professional employer organizations in addition to temporary help services, as defined in the current measure. Data on the separate components of the previous measure are not available prior to 1990.
The Labor Market During the 1990s Some of the growth in employment during the late 1990s may have been unsustainable, such that the job losses during the 2001 recession were insufficient to eliminate the excesses that had built up. In the late 1990s, the unemployment rate fell well below its natural rate (the un-employment rate that would occur if the aggregate demand for goods and services was in bal-ance with the aggregate supply, estimated to have been 5.2 percent since the late 1990s), aver-aging just 4.0 percent in 2000. Between late 1995 (when the unemployment rate was barely above the estimated natural rate) and late 2000, employment grew at an average annual rate of 2.3 percent, or by about 237,000 jobs per month, while the labor force expanded at just a 1.4 percent average annual rate.10 Consequently, the prerecession level of employment might not be a reasonable benchmark for measuring the performance of the labor market after 2001.
10. That estimate of labor force growth is adjusted to remove the effect of a shift from population estimates based on the 1990 census (which proved to be too low) to ones based on the 2000 census.
200520001995199019851980
3.0
2.5
2.0
1.5
1.0
0.5
0
Previous Measure
Current Measure
a
10
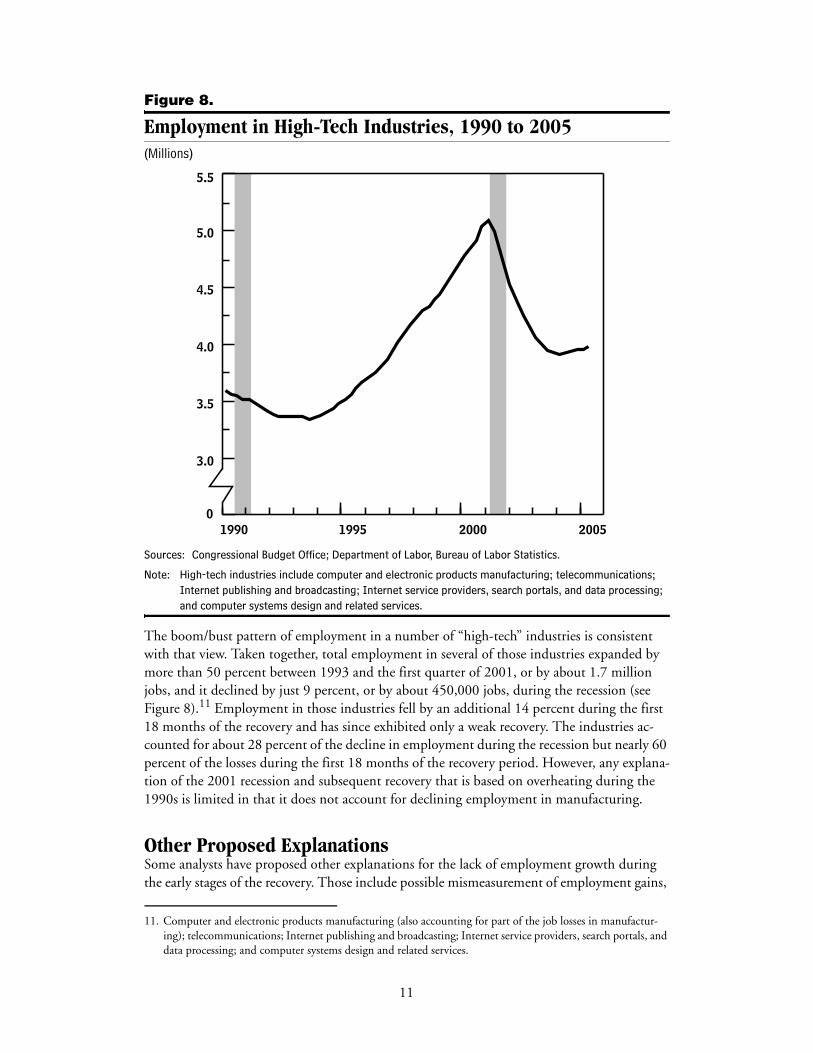
Figure 8.
Employment in High-Tech Industries, 1990 to 2005(Millions)
Sources: Congressional Budget Office; Department of Labor, Bureau of Labor Statistics.
Note: High-tech industries include computer and electronic products manufacturing; telecommunications; Internet publishing and broadcasting; Internet service providers, search portals, and data processing; and computer systems design and related services.
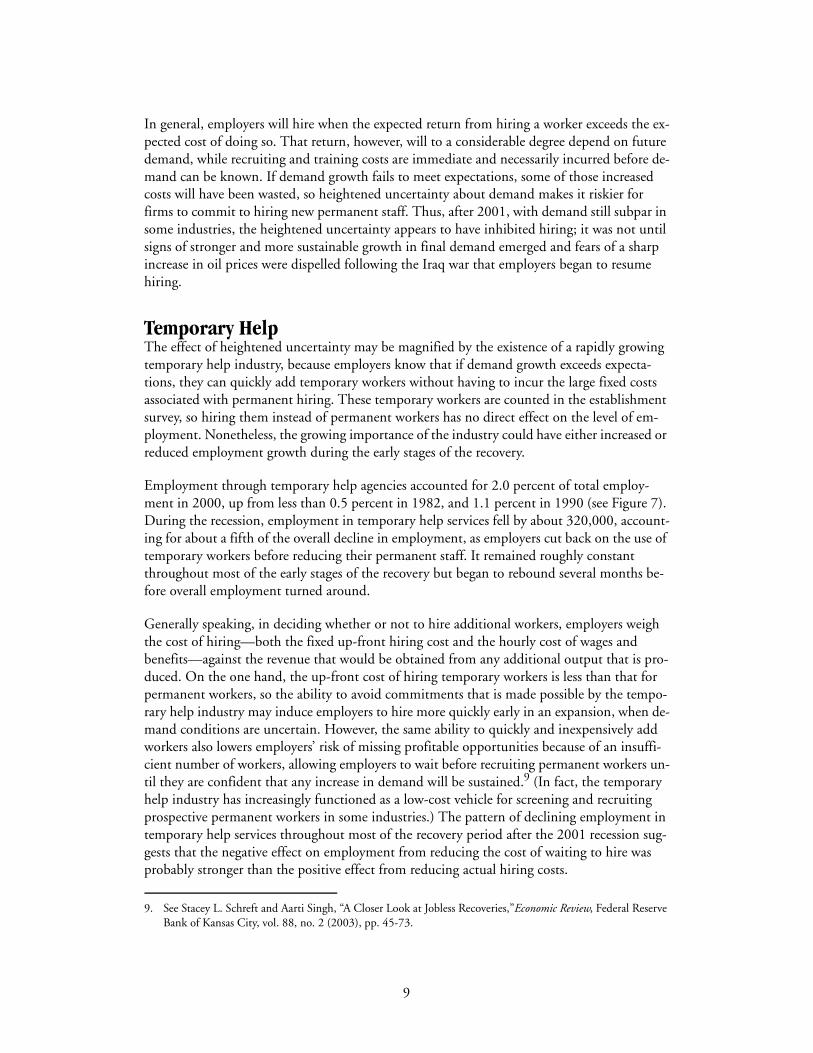
The boom/bust pattern of employment in a number of “high-tech” industries is consistent with that view. Taken together, total employment in several of those industries expanded by more than 50 percent between 1993 and the first quarter of 2001, or by about 1.7 million jobs, and it declined by just 9 percent, or by about 450,000 jobs, during the recession (see Figure 8).11 Employment in those industries fell by an additional 14 percent during the first 18 months of the recovery and has since exhibited only a weak recovery. The industries ac-counted for about 28 percent of the decline in employment during the recession but nearly 60 percent of the losses during the first 18 months of the recovery period. However, any explana-tion of the 2001 recession and subsequent recovery that is based on overheating during the 1990s is limited in that it does not account for declining employment in manufacturing.
Other Proposed ExplanationsSome analysts have proposed other explanations for the lack of employment growth during the early stages of the recovery. Those include possible mismeasurement of employment gains,
11. Computer and electronic products manufacturing (also accounting for part of the job losses in manufactur-ing); telecommunications; Internet publishing and broadcasting; Internet service providers, search portals, and data processing; and computer systems design and related services.
2005200019951990
5.5
5.0
4.5
4.0
3.5
3.0
0
11
along with exceptionally weak growth in the labor force; an unusually high rate of structural change; and rapid increases in the cost of employer-funded health insurance and pensions. However, the evidence to support those explanations is inconclusive.
Measurement Issues and the Labor ForceSome analysts have suggested that the characterization of the period following the 2001 reces-sion as a jobless recovery is inaccurate, a consequence of a substantial understatement of em-ployment growth. Between November 2001 and May 2003, employment declined by 1.05 million jobs, according to the establishment survey, compiled by the Department of Labor’s Bureau of Labor Statistics. But it rose by 1.3 million jobs in the official measure based on the household survey, an alternative measure conducted by the Census Bureau. Adjusting to smooth the effects of several onetime shifts in the estimated size of the adult population re-duces the gain in the household survey to a still-sizable 800,000 jobs.
The discrepancy in employment growth is not attributable to conceptual differences between the two surveys, the most important of which are that self-employed workers are counted in the household survey but not the establishment survey and that people who hold multiple jobs may be counted more than once in the establishment survey but are counted only once in the household survey.12 According to the Bureau of Labor Statistics, between November 2001 and May 2003, employment as measured by the household survey adjusted to adopt the con-cepts of the establishment survey (and with the same smoothing of the population) rose by 960,000 jobs.
Analysts commonly give greater weight to the establishment survey’s figures in assessing cur-rent labor market conditions, both because month-to-month changes in the levels of employ-ment in the household survey tend to be volatile and because employment levels in the house-hold survey are sensitive to uncertain estimates of the growth in the working-age population since the 2000 census. However, some have argued that the more optimistic picture portrayed by the household survey should be taken seriously.13 Even so, the employment-to-population ratio based on the household survey continued to decline early in the recovery and remained about 2 percentage points below its prerecession peak in early 2005.14 That drop reflects the sharp and persistent decline in the labor force participation rate, from 67.1 percent in 2000 to 66.7 percent in late 2001 and 66.0 percent in 2004. Such figures raise the question of whether weak employment during the recovery from the 2001 recession might have been due in part to an insufficient number of available workers; however, the fact that real average hourly compensation (including benefits) grew more slowly than did real hourly output from 2001 to 2004 points strongly toward weak demand rather than insufficient supply.
Structural ChangeSome analysts have argued that job losses during the 2001 recession resulted from, to a much greater extent than in the past, permanent shifts in the industry composition of employment,
12. In addition, the household survey includes agricultural workers, unpaid workers in family businesses, and pri-vate household workers, none of whom are counted in the establishment survey.
13. See Tim Kane, “Diverging Employment Data: A Critical Review of the Payroll Survey,” Center for Data Analysis Report No. 04-03 (Washington, D.C.: The Heritage Foundation, March 2004); and Allan H. Meltzer, “A Jobless Recovery?” Wall Street Journal, September 26, 2003, p. A16.
14. See Mark E. Schweitzer, “Another Jobless Recovery?” Federal Reserve Bank of Cleveland, March 2003, avail-able at www.clevelandfed.org/Research/Com2003/0301.pdf.
12
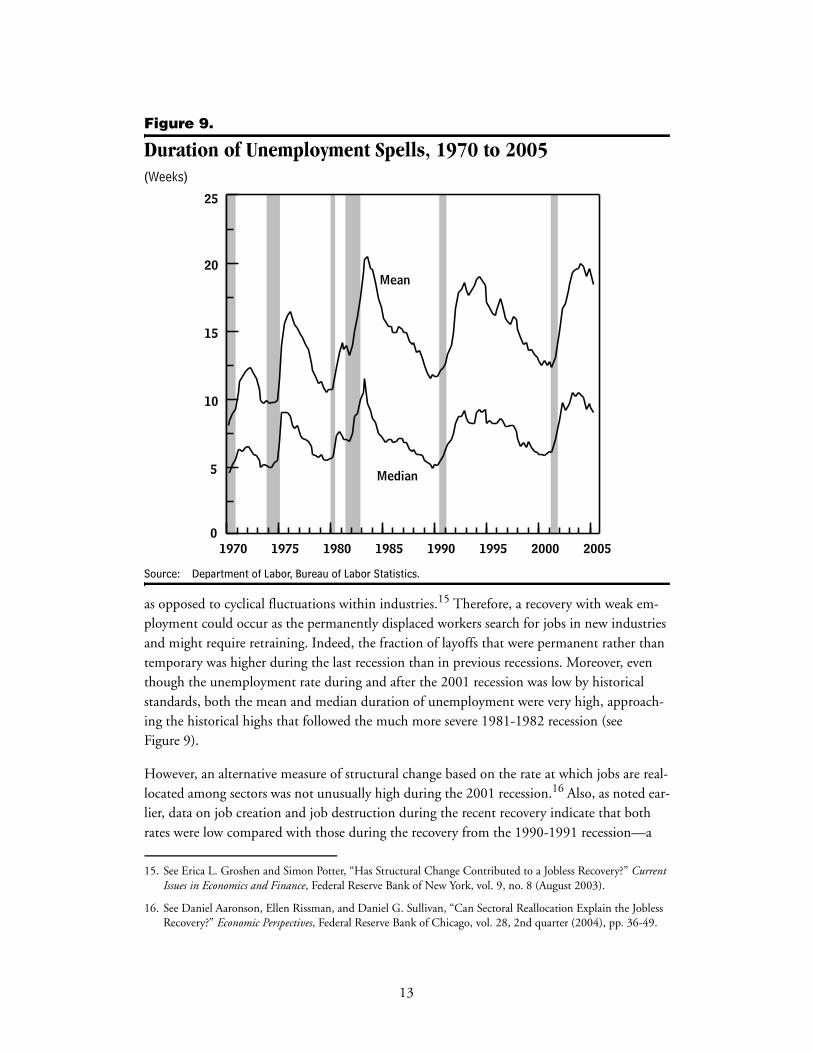
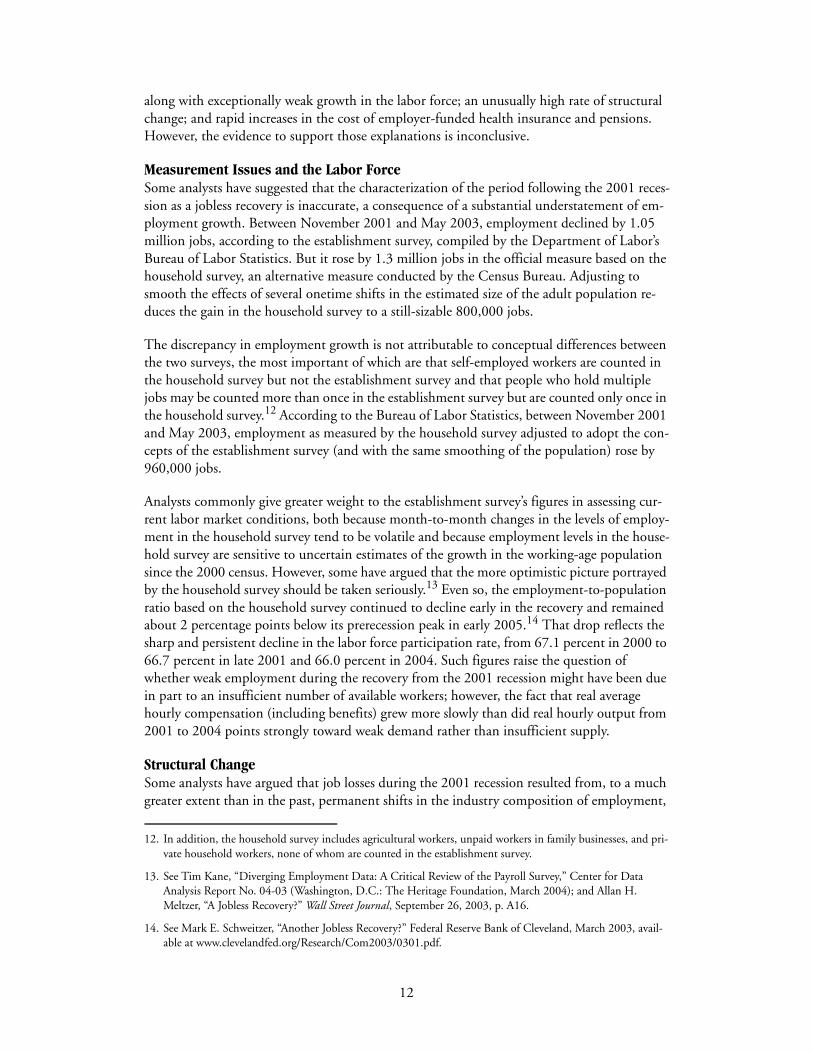
Figure 9.
Duration of Unemployment Spells, 1970 to 2005(Weeks)
Source: Department of Labor, Bureau of Labor Statistics.
as opposed to cyclical fluctuations within industries.15 Therefore, a recovery with weak em-ployment could occur as the permanently displaced workers search for jobs in new industries and might require retraining. Indeed, the fraction of layoffs that were permanent rather than temporary was higher during the last recession than in previous recessions. Moreover, even though the unemployment rate during and after the 2001 recession was low by historical standards, both the mean and median duration of unemployment were very high, approach-ing the historical highs that followed the much more severe 1981-1982 recession (see Figure 9).
However, an alternative measure of structural change based on the rate at which jobs are real-located among sectors was not unusually high during the 2001 recession.16 Also, as noted ear-lier, data on job creation and job destruction during the recent recovery indicate that both rates were low compared with those during the recovery from the 1990-1991 recession—a
15. See Erica L. Groshen and Simon Potter, “Has Structural Change Contributed to a Jobless Recovery?” Current Issues in Economics and Finance, Federal Reserve Bank of New York, vol. 9, no. 8 (August 2003).
16. See Daniel Aaronson, Ellen Rissman, and Daniel G. Sullivan, “Can Sectoral Reallocation Explain the Jobless Recovery?” Economic Perspectives, Federal Reserve Bank of Chicago, vol. 28, 2nd quarter (2004), pp. 36-49.
20052000199519901985198019751970
25
20
15
10
5
0
Median
Mean
13
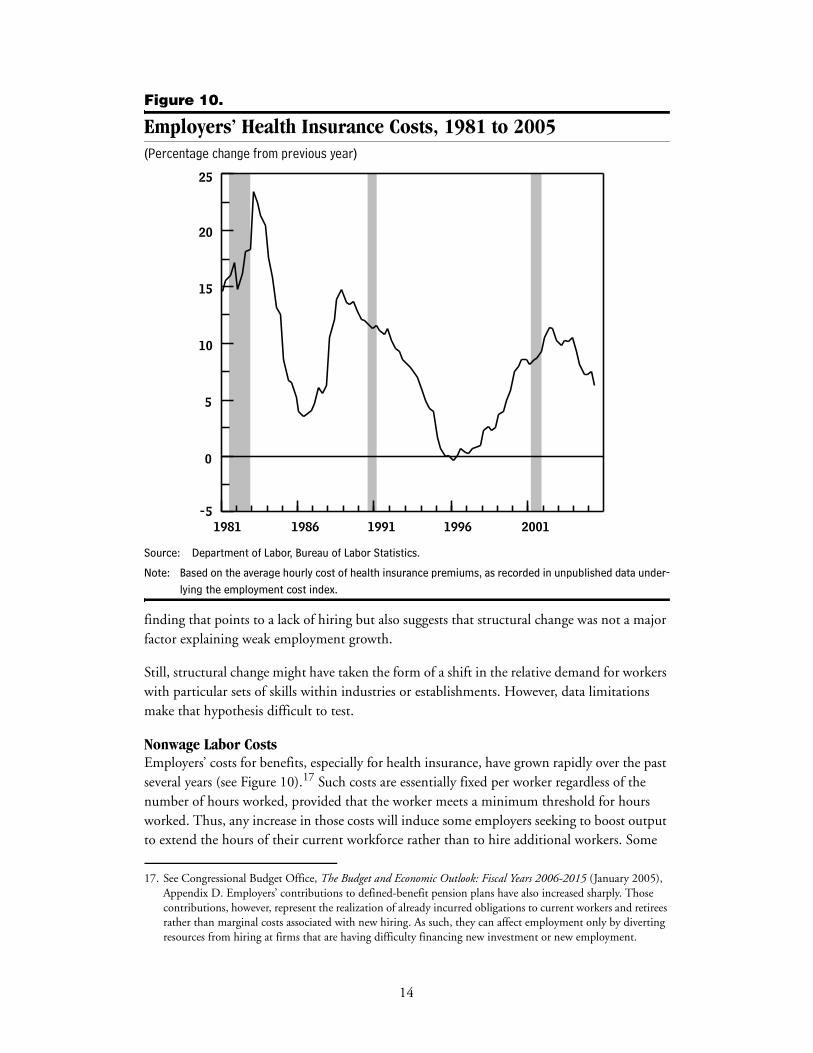
Figure 10.
Employers’ Health Insurance Costs, 1981 to 2005(Percentage change from previous year)
Source: Department of Labor, Bureau of Labor Statistics.
Note: Based on the average hourly cost of health insurance premiums, as recorded in unpublished data under-lying the employment cost index.
finding that points to a lack of hiring but also suggests that structural change was not a major factor explaining weak employment growth.
Still, structural change might have taken the form of a shift in the relative demand for workers with particular sets of skills within industries or establishments. However, data limitations make that hypothesis difficult to test.
Nonwage Labor CostsEmployers’ costs for benefits, especially for health insurance, have grown rapidly over the past several years (see Figure 10).17 Such costs are essentially fixed per worker regardless of the number of hours worked, provided that the worker meets a minimum threshold for hours worked. Thus, any increase in those costs will induce some employers seeking to boost output to extend the hours of their current workforce rather than to hire additional workers. Some
17. See Congressional Budget Office, The Budget and Economic Outlook: Fiscal Years 2006-2015 (January 2005), Appendix D. Employers’ contributions to defined-benefit pension plans have also increased sharply. Those contributions, however, represent the realization of already incurred obligations to current workers and retirees rather than marginal costs associated with new hiring. As such, they can affect employment only by diverting resources from hiring at firms that are having difficulty financing new investment or new employment.
20011996199119861981
25
20
15
10
5
0
-5
14
business leaders have attributed the weakness in hiring to the rising cost of benefits, especially health insurance. And several studies have found that higher medical insurance premiums may be associated with reductions in employment.18 However, average weekly hours have not risen sharply and have not reached the levels usually seen in a cyclical recovery, suggesting that employers have not been responding to rising health insurance premiums by extending the av-erage workweek. If, though, rising premiums caused some employers to shift from employing full-time workers to utilizing more part-time workers who fail to qualify for employer-paid health insurance, that tactic would reduce average weekly hours. But unit labor costs (labor costs per unit of output) declined during both the recession and the early stages of the recov-ery, an indication that employers were able to offset rising premiums by reducing the rate of growth in wages or other benefits.
18. See, for example, Katherine Baicker and Amitabh Chandra, “The Labor Market Effects of Rising Health Insurance Premiums,” Working Paper No. 11160 (Cambridge, Mass.: National Bureau of Economic Research, February 2005).
15