Embed Size (px)
Citation preview
Employment-Based Health Benefits Among Mid-Sized
and Large Employers
Paul Fronstin, Ph.D.
Director, Health Research & Education Program
Employee Benefit Research Institute
Copyright© - Employee Benefit Research Institute Education and Research Fund, 1978-2005. All rights reserved.
The information contained herein is not to be construed as an attempt to provide legal, accounting, actuarial, or other such
professional advice. Permission to copy or print a personal use copy of this material is hereby granted and brief quotations for the
purposes of news reporting and education are permitted. Otherwise, no part of this material may be used or reproduced without
permission in writing from EBRI-ERF.
2
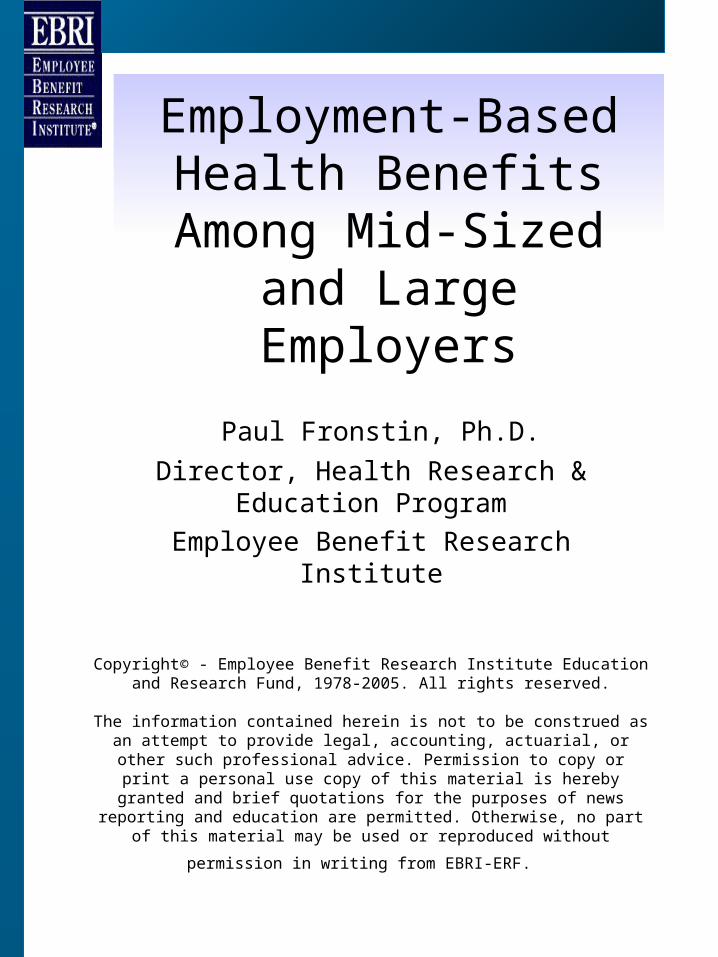
Employment-Based Coverage is Most
Common(Americans Under Age 65 in 2003)
252.7
159.2
17.0
42.5 44.7
0
50
100
150
200
250
300
Total population Employment-based
Non groupmarket
Public program Uninsured
Source: EBRI estimates of the March 2004 CPS.
millions
3
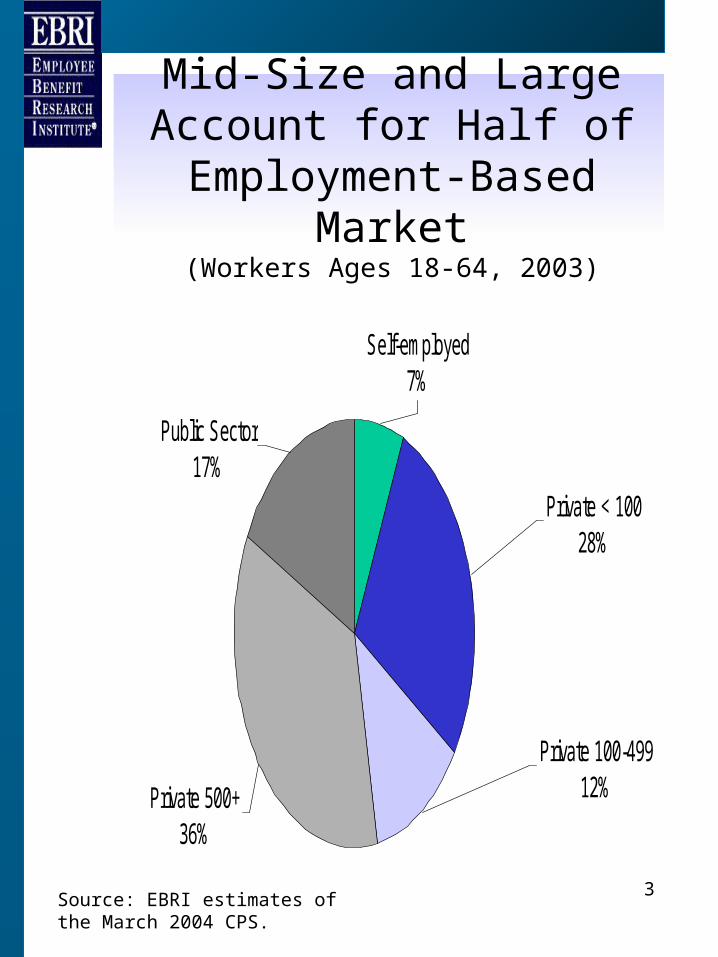
Mid-Size and Large Account for Half of Employment-
Based Market(Workers Ages 18-64, 2003)
Public Sector17%
Private 500+36%
Private 100-49912%
Private < 10028%
Self-employed7%
Source: EBRI estimates of the March 2004 CPS.
4
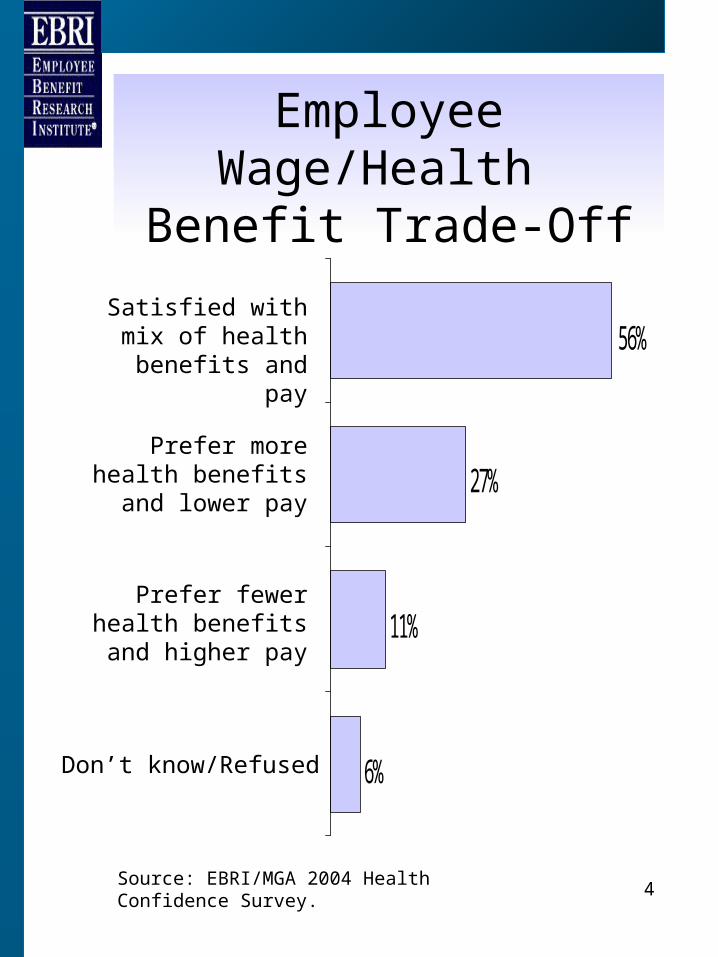
Employee Wage/Health Benefit Trade-Off
6%
11%
27%
56%Satisfied with mix of health benefits and
pay
Prefer more health benefits and lower
pay
Prefer fewer health benefits and higher
pay
Don’t know/Refused
Source: EBRI/MGA 2004 Health Confidence Survey.
5
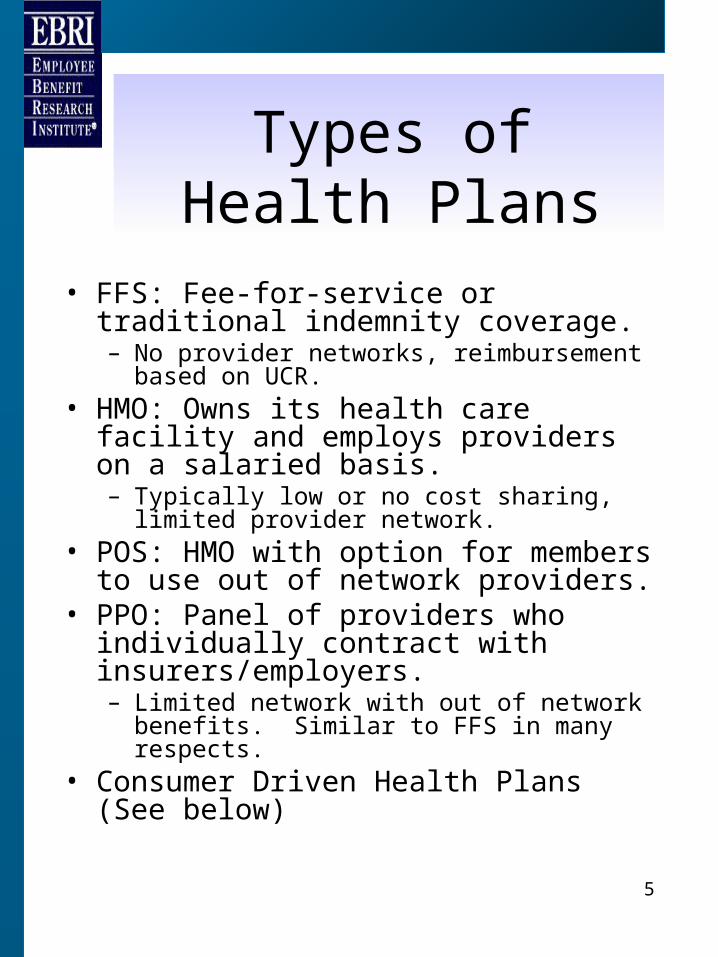
Types of Health Plans
• FFS: Fee-for-service or traditional indemnity coverage.– No provider networks, reimbursement based on
UCR.• HMO: Owns its health care facility and
employs providers on a salaried basis.– Typically low or no cost sharing, limited
provider network.• POS: HMO with option for members to
use out of network providers.• PPO: Panel of providers who individually
contract with insurers/employers.– Limited network with out of network benefits.
Similar to FFS in many respects.• Consumer Driven Health Plans (See
below)
6
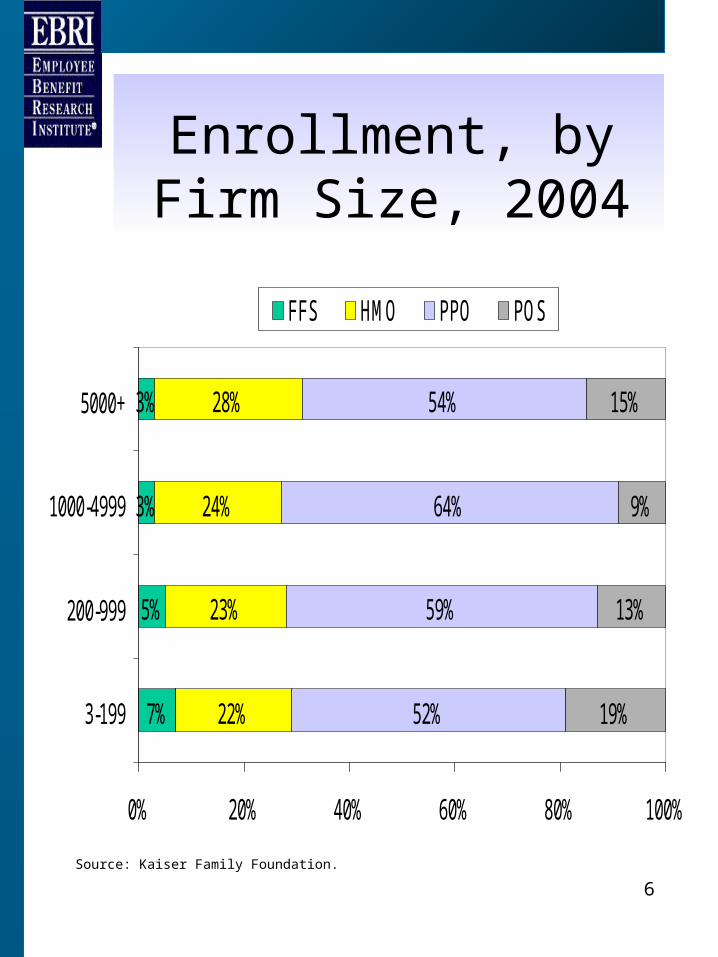
Enrollment, by Firm Size, 2004
7%
5%
3%
3%
22%
23%
24%
28%
52%
59%
64%
54%
19%
13%
9%
15%
0% 20% 40% 60% 80% 100%
3-199
200-999
1000-4999
5000+
FFS HMO PPO POS
Source: Kaiser Family Foundation.
7
Regulation of employee benefits is two-tiered:
ERISA
• ERISA is the primary regulator of private-sector employee benefit plans.– Sets forth standards on reporting and
information disclosure, claims appeal procedures, remedies for wrongfully denied benefits, and fiduciary standards.
• ERISA preempts all state laws that relate to employee benefit plans.
• ERISA specifically preserve state rights to regulate the ‘business of insurance’
8
Health Benefit Plan Regulation
• Self-funded plans: employer pays for the health care claims of its participants directly out of its own income or assets.– Regulated exclusively at the federal
level
• Fully-insured plans: employer pays premiums to purchase a commercial insurance product.– Regulated directly at the federal level
and indirectly at the state level.– State regulation includes mandated
benefits, premium taxes, and other regulation of insurance companies.
9
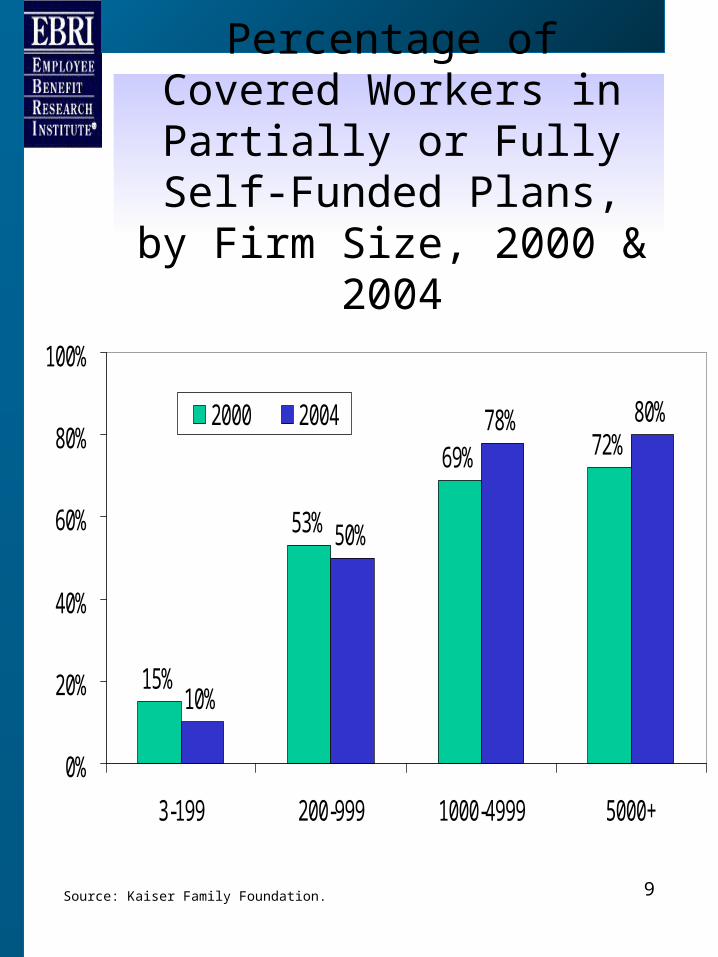
Percentage of Covered Workers in Partially or Fully Self-Funded Plans, by Firm
Size, 2000 & 2004
15%
53%
69% 72%
10%
50%
78% 80%
0%
20%
40%
60%
80%
100%
3-199 200-999 1000-4999 5000+
2000 2004
Source: Kaiser Family Foundation.
10
Health Insurance Portability and Accountability Act of
1996 (HIPAA)
• Created national standards:– Portability and access to care– Preexisting conditions– Discrimination based on health status– Timely disclosure regarding
information– Electronic transmission of health
information– Rights to privacy– Medical savings accounts
11
Other Federal Mandates
• COBRA (1985)
• Newborns’ and Mothers’ Health Protection Act (1996)
• Mental Health Parity Act (1996)
• Post-mastectomy surgery mandate (1998)
12
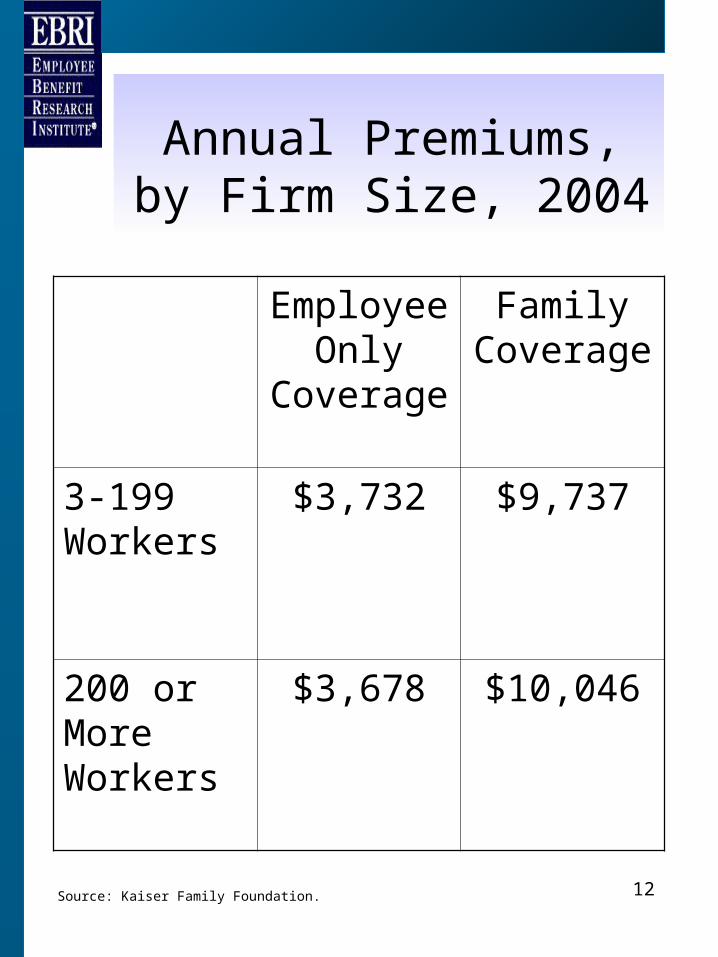
Annual Premiums, by Firm Size, 2004
Employee Only
Coverage
Family Coverage
3-199 Workers
$3,732 $9,737
200 or More Workers
$3,678 $10,046
Source: Kaiser Family Foundation.
13
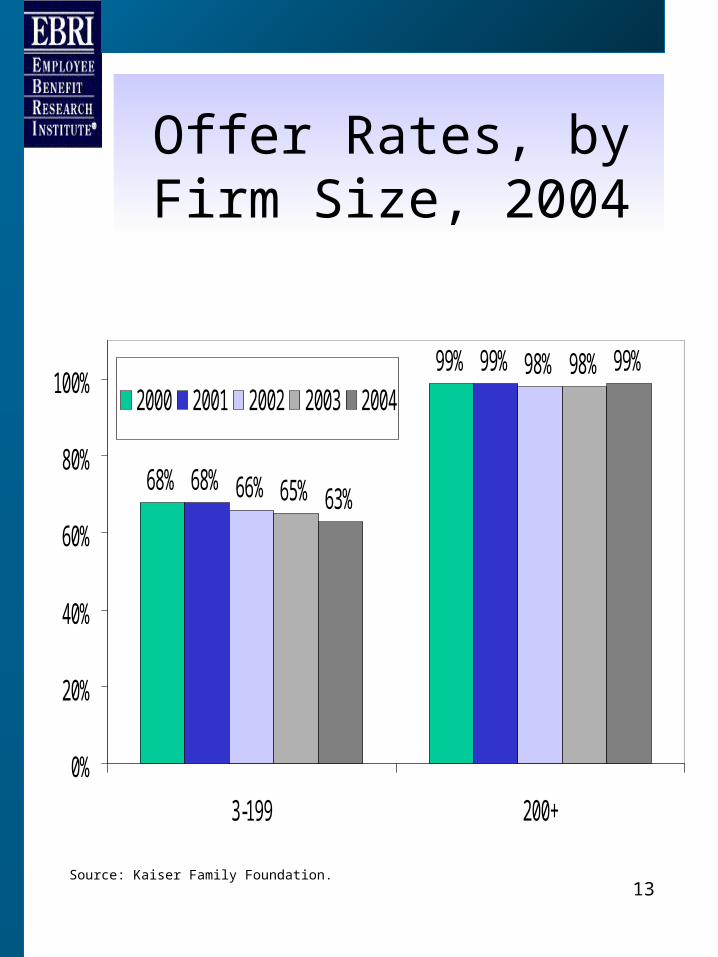
Offer Rates, by Firm Size, 2004
68%
99%
68%
99%
66%
98%
65%
98%
63%
99%
0%
20%
40%
60%
80%
100%
3-199 200+
2000 2001 2002 2003 2004
Source: Kaiser Family Foundation.
14
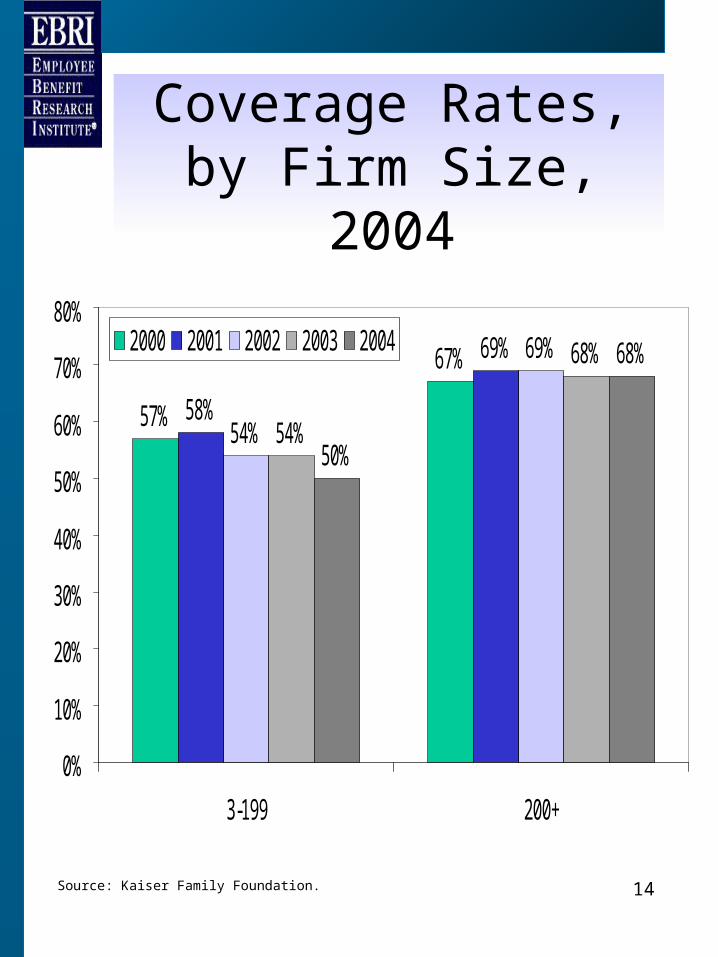
Coverage Rates, by Firm Size, 2004
57%
67%
58%
69%
54%
69%
54%
68%
50%
68%
0%
10%
20%
30%
40%
50%
60%
70%
80%
3-199 200+
2000 2001 2002 2003 2004
Source: Kaiser Family Foundation.
15
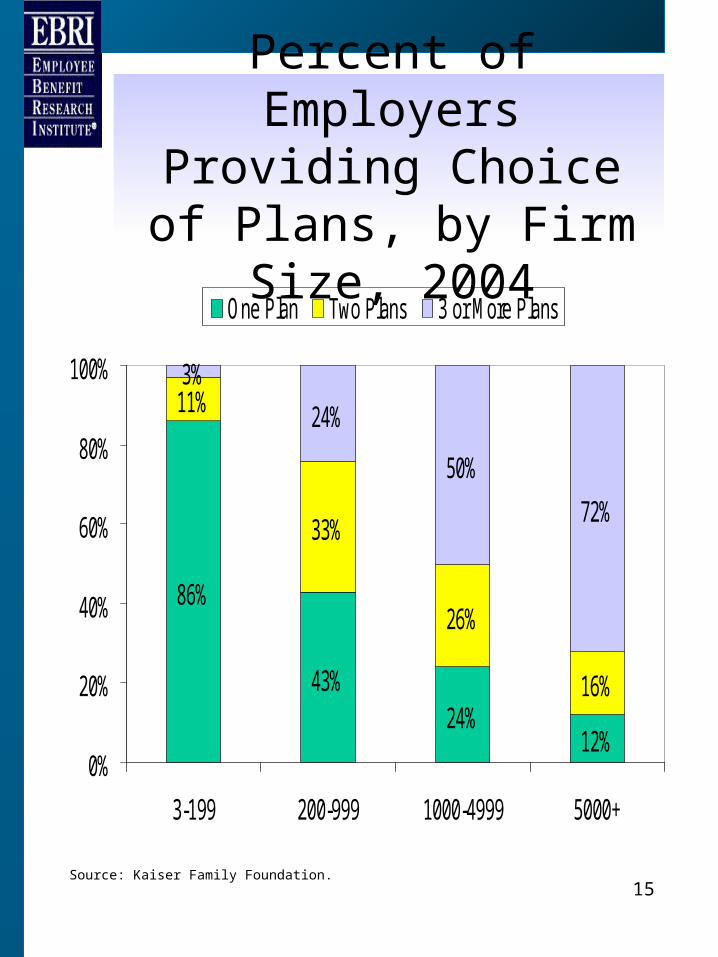
Percent of Employers Providing Choice of Plans,
by Firm Size, 2004
86%
43%24%
12%
11%
33%
26%
16%
3%
24%
50%
72%
0%
20%
40%
60%
80%
100%
3-199 200-999 1000-4999 5000+
One Plan Two Plans 3 or More Plans
Source: Kaiser Family Foundation.
16
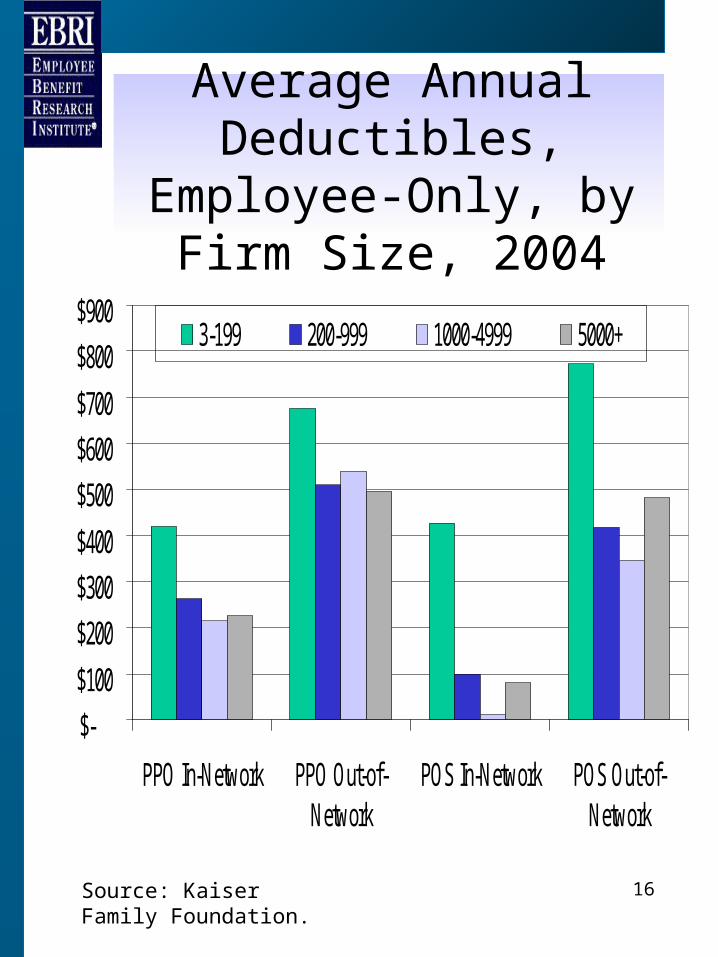
Average Annual Deductibles, Employee-
Only, by Firm Size, 2004
$-
$100
$200
$300
$400
$500
$600
$700
$800
$900
PPO In-Network PPO Out-of-Network
POS In-Network POS Out-of-Network
3-199 200-999 1000-4999 5000+
Source: Kaiser Family Foundation.
17
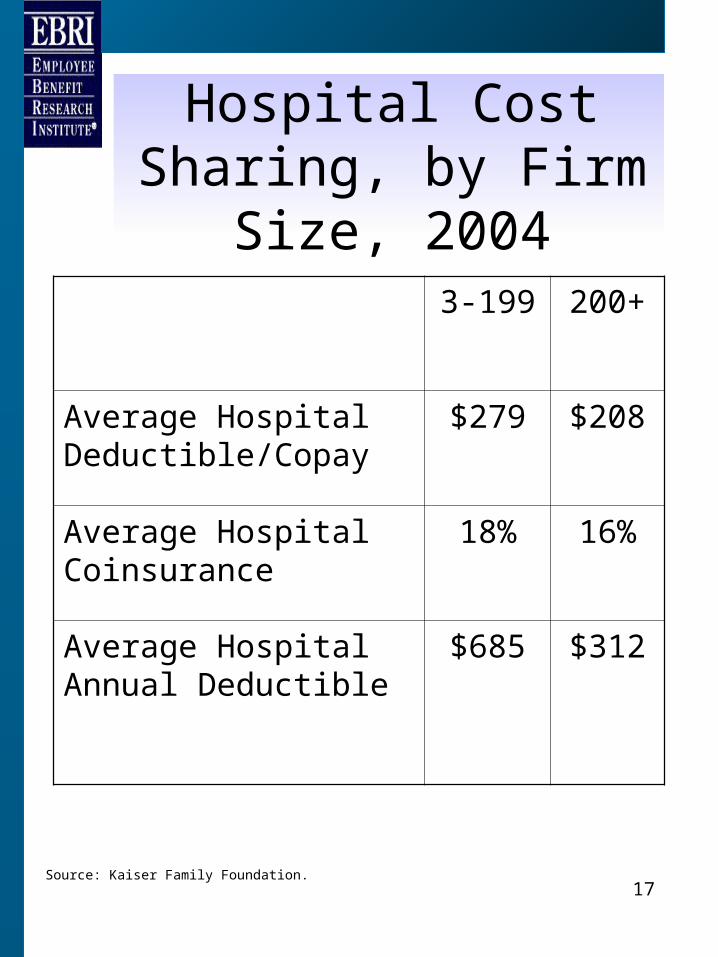
Hospital Cost Sharing, by Firm Size, 2004
3-199 200+
Average Hospital Deductible/Copay
$279 $208
Average Hospital Coinsurance
18% 16%
Average Hospital Annual Deductible
$685 $312
Source: Kaiser Family Foundation.
18
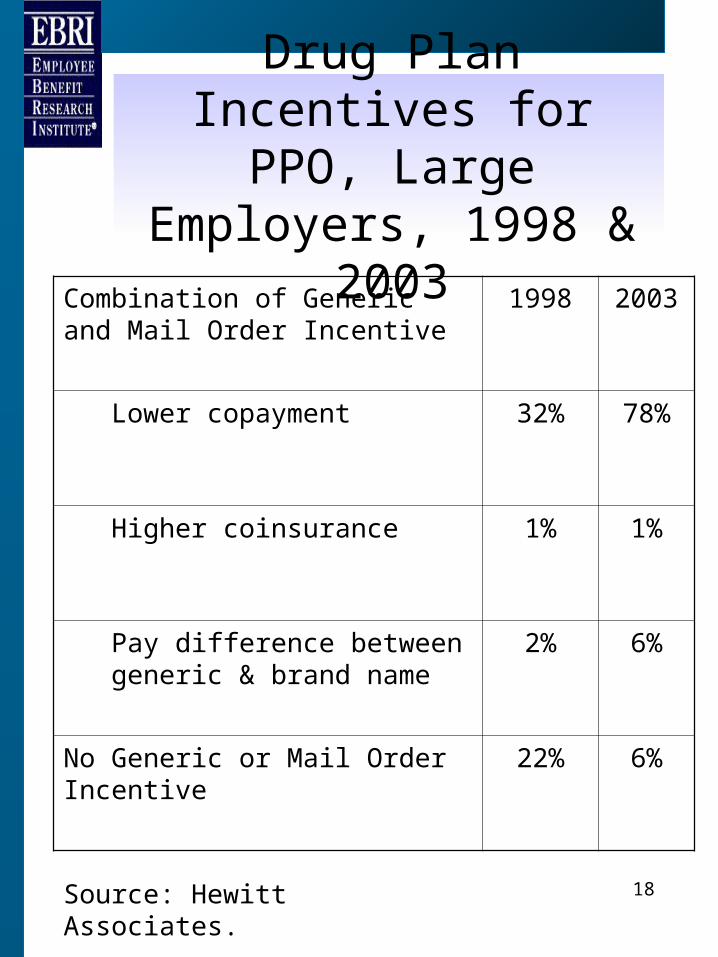
Drug Plan Incentives for PPO, Large Employers,
1998 & 2003
Combination of Generic and Mail Order Incentive
1998 2003
Lower copayment 32% 78%
Higher coinsurance 1% 1%
Pay difference between generic & brand name
2% 6%
No Generic or Mail Order Incentive
22% 6%
Source: Hewitt Associates.
19
Tiered Provider Networks
• Hospitals & doctors.• Tiers vary with cost & quality.
– Similar to PPO (in vs. out)– Similar to Rx tiers.
• Cost sharing distinctions– Co-payment per hospital day.– Coinsurance rate per stay.– Overall deductible per stay.
20
Health Reimbursement Arrangement (HRA)
• Employer provided notional account that allows for pre-tax reimbursement of medical expenses.
• Typically combined with a high-deductible health plan.
• Employee contributions not permitted.
21
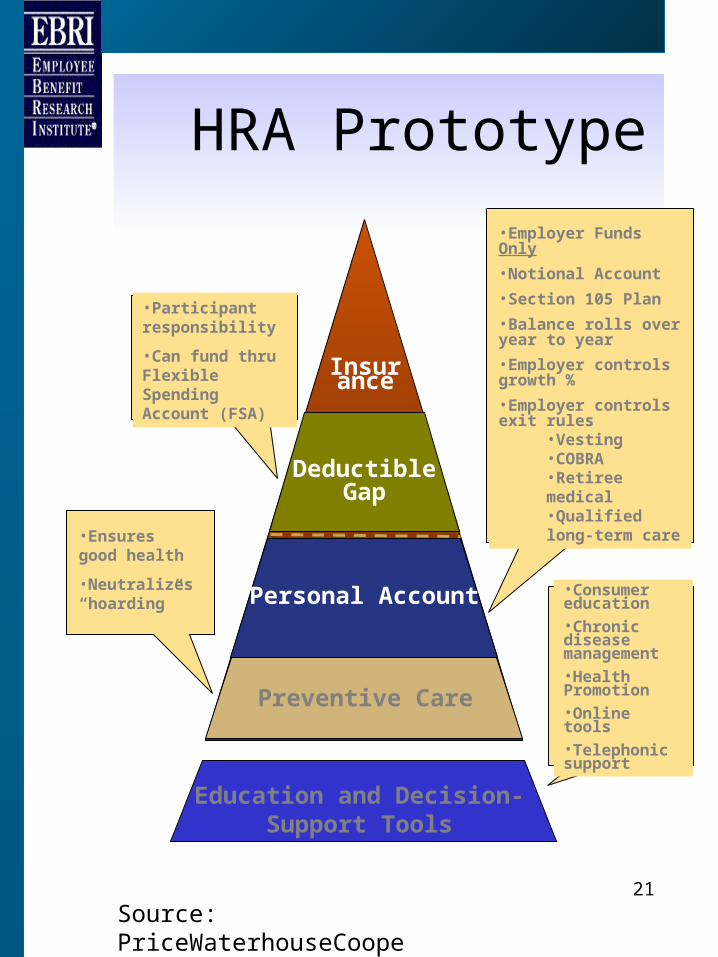
Preventive Care
Personal Account
Deductible Gap
Insurance
•Ensures good health
•Neutralizes “hoarding”
•Employer Funds Only
•Notional Account
•Section 105 Plan
•Balance rolls over year to year
•Employer controls growth %
•Employer controls exit rules
•Vesting•COBRA•Retiree medical•Qualified long-term care
•Participant responsibility
•Can fund thru Flexible Spending Account (FSA)
Education and Decision-Support Tools
•Consumer education•Chronic disease management•Health Promotion•Online tools•Telephonic support
HRA Prototype
Source: PriceWaterhouseCoopers.
22
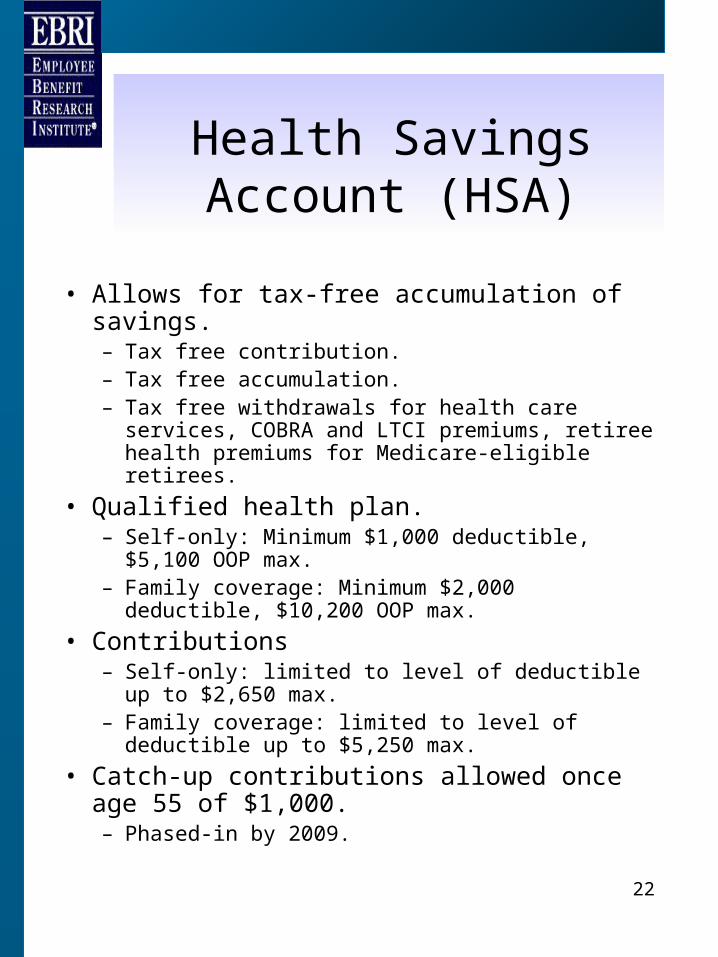
Health Savings Account (HSA)
• Allows for tax-free accumulation of savings.– Tax free contribution.– Tax free accumulation.– Tax free withdrawals for health care services, COBRA
and LTCI premiums, retiree health premiums for Medicare-eligible retirees.
• Qualified health plan.– Self-only: Minimum $1,000 deductible, $5,100 OOP
max.– Family coverage: Minimum $2,000 deductible,
$10,200 OOP max.
• Contributions– Self-only: limited to level of deductible up to $2,650
max.– Family coverage: limited to level of deductible up to
$5,250 max.
• Catch-up contributions allowed once age 55 of $1,000.– Phased-in by 2009.
23
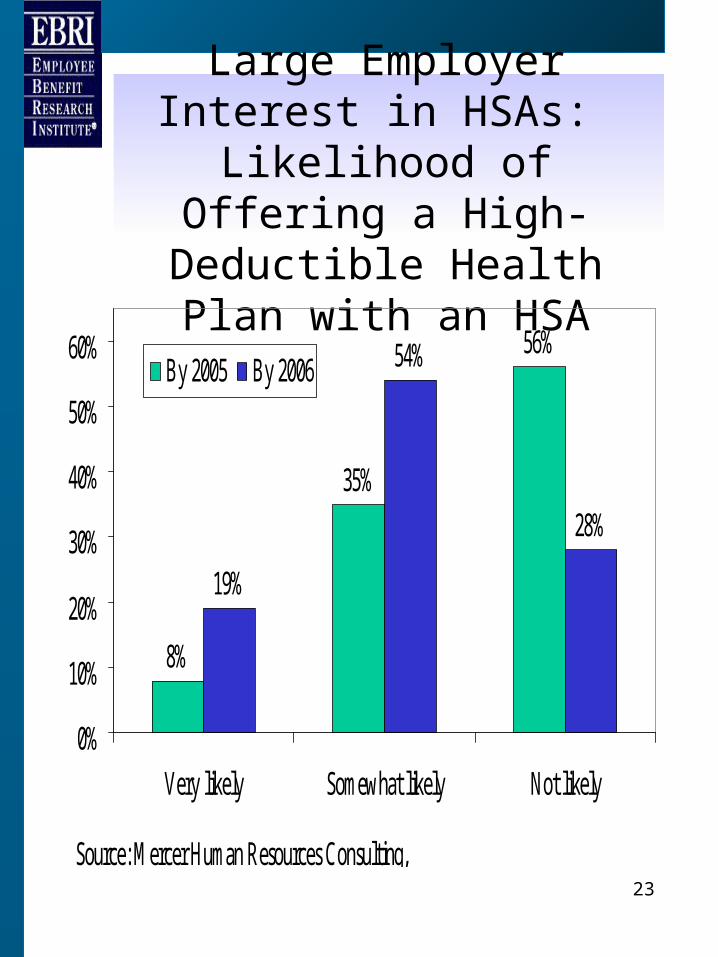
Large Employer Interest in HSAs:
Likelihood of Offering a High-Deductible Health Plan
with an HSA
8%
35%
56%
19%
54%
28%
0%
10%
20%
30%
40%
50%
60%
Very likely Somewhat likely Not likely
By 2005 By 2006
Source: Mercer Human Resources Consulting,
EBRI
2121 K Street NW, Suite 600
Washington, DC 20037
Phone: 202-659-0670
Fax: 202-775-6312
www.ebri.org