Embed Size (px)
Citation preview
EMPLOYMENT AND PAYROLLS
SECOND QUARTER 2005"Check Out Our Web Site: www.dllr.state.md.us/lmi/index.htm"
MARYLAND DEPARTMENT OF LABOR, LICENSING AND REGULATIONOffice of Labor Market Analysis and Information
1100 North Eutaw StreetBaltimore, Maryland 21201
Governor
Lieutenant Governor
Secretary
Robert L. Ehrlich, Jr.
Michael S. Steele
James D. Fielder, Jr., Ph.D.
Employment and Payrolls
Second Quarter 2005
Maryland Department of Labor, Licensing and RegulationOffice of Labor Market Analysis and Information
1100 North Eutaw StreetBaltimore, MD 21201
Prepared by:
Patrick Arnold, Director
(410) 767-2250E-mail: [email protected]
December, 2005
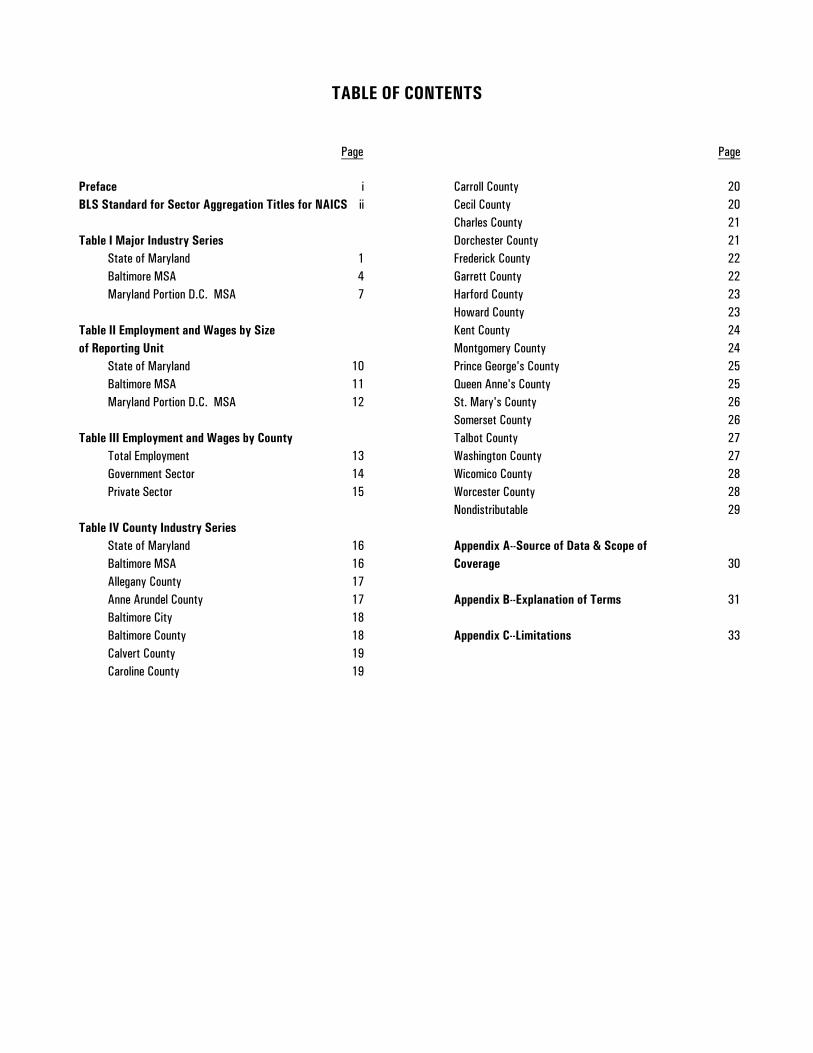
TABLE OF CONTENTS
Preface
State of MarylandTable I Major Industry Series
Baltimore MSAMaryland Portion D.C. MSA
State of Maryland
Table II Employment and Wages by Size
Baltimore MSAMaryland Portion D.C. MSA
Total EmploymentTable III Employment and Wages by County
Government SectorPrivate Sector
of Reporting Unit
Carroll CountyCecil CountyCharles CountyDorchester CountyFrederick CountyGarrett CountyHarford CountyHoward CountyKent CountyMontgomery CountyPrince George's CountyQueen Anne's CountySt. Mary's CountySomerset CountyTalbot CountyWashington CountyWicomico CountyWorcester CountyNondistributable
State of MarylandTable IV County Industry Series
Baltimore MSAAllegany CountyAnne Arundel CountyBaltimore CityBaltimore CountyCalvert CountyCaroline County
Appendix A--Source of Data & Scope ofCoverage
Appendix B--Explanation of Terms
Appendix C--Limitations
20202121222223232424252526262727282829
30
31
33
i
147
101112
131415
1616171718181919
Page Page
BLS Standard for Sector Aggregation Titles for NAICS ii
PREFACE
- i -
This publication is generated from statistics produced by Maryland's ES-202 Program. It provides the reader with a basic
industrial profile of Maryland's economy. The data are generated and published on a quarterly basis with totals for the state
as well as each of its political subdivisions. Included are all workers covered by the Unemployment Insurance (UI) Law of
Maryland and the unemployment compensation for federal employees (UCFE) program. Together these two account for
over 91% of all civilian employment. The principle exclusions are cited in Appendix A of this report.
also be based on the NAICS. Prior to the reports for 2001, the Standard Industrial Classification (SIC) Manual was used for
This report uses the North American Industry Classification System (NAICS) to code establishments. All future releases will
Requests for more information or additional copies of this report should be directed to:
Maryland Department of Labor, Licensing and Regulation
Office of Labor Market Analysis and Information
1100 North Eutaw Street
Baltimore, MD 21201
(410) 767-2250
E-mail: [email protected]
coding purposes. Although some titles remained the same, the content has changed from one system to the other and the
series are not comparable.
page details this aggregation.
For purposes of this report, NAICS sectors have been combined using the BLS standard for sector aggregation. The following
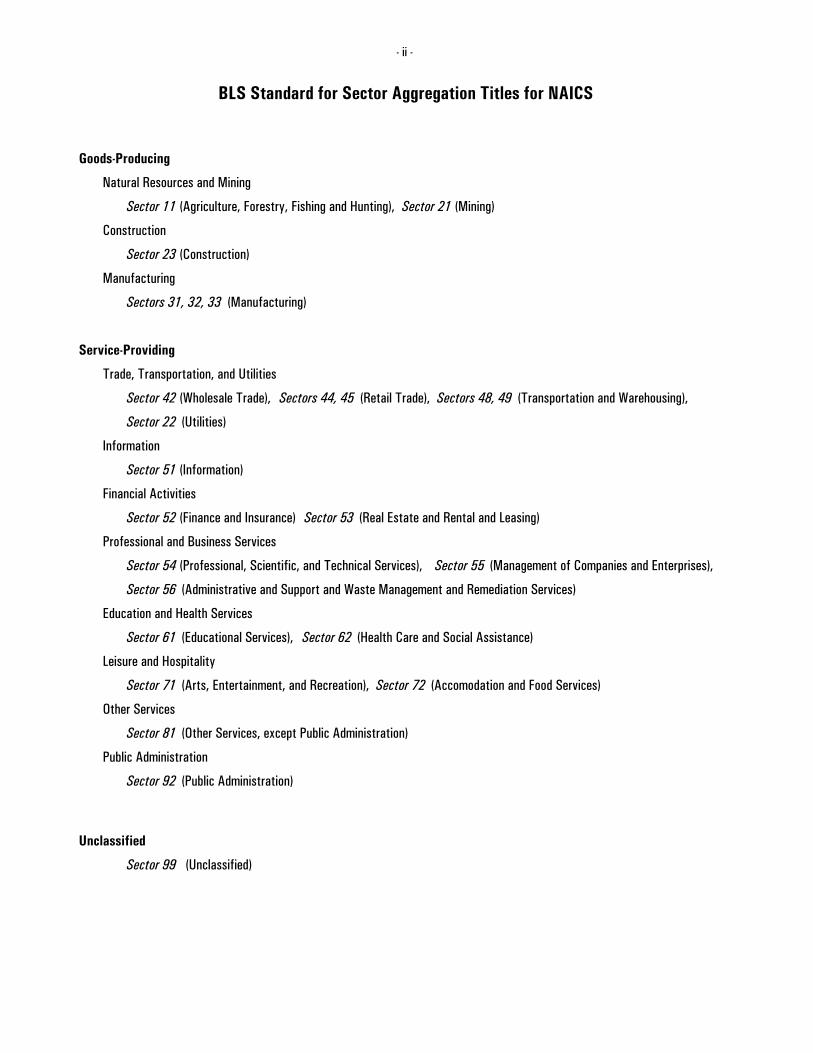
BLS Standard for Sector Aggregation Titles for NAICS
- ii -
Goods-Producing
Natural Resources and Mining
Sector 11
Construction
Manufacturing
(Agriculture, Forestry, Fishing and Hunting), Sector 21 (Mining)
Sector 23 (Construction)
Sectors 31, 32, 33 (Manufacturing)
Service-Providing
Trade, Transportation, and Utilities
Sector 42
Information
Financial Activities
(Wholesale Trade),
Sector 51 (Information)
Sector 52 (Finance and Insurance)
(Transportation and Warehousing),
Sector 22 (Utilities)
Sectors 44, 45 (Retail Trade), Sectors 48, 49
Professional and Business Services
Sector 54 (Professional, Scientific, and Technical Services), (Management of Companies and Enterprises),
Sector 56 (Administrative and Support and Waste Management and Remediation Services)
Sector 55
Education and Health Services
Sector 61 (Educational Services), Sector 62 (Health Care and Social Assistance)
Leisure and Hospitality
Sector 71 (Arts, Entertainment, and Recreation), (Accomodation and Food Services)Sector 72
Other Services
Public Administration
Sector 81 (Other Services, except Public Administration)
Sector 92 (Public Administration)
Unclassified
Sector 99 (Unclassified)
Sector 53 (Real Estate and Rental and Leasing)
INDUSTRYNUMBER
OFREPORTING
UNITS
MONTHLY EMPLOYMENT
FIRST SECOND THIRD
QUARTERLYAVERAGE
EMPLOYMENTTOTAL WAGES
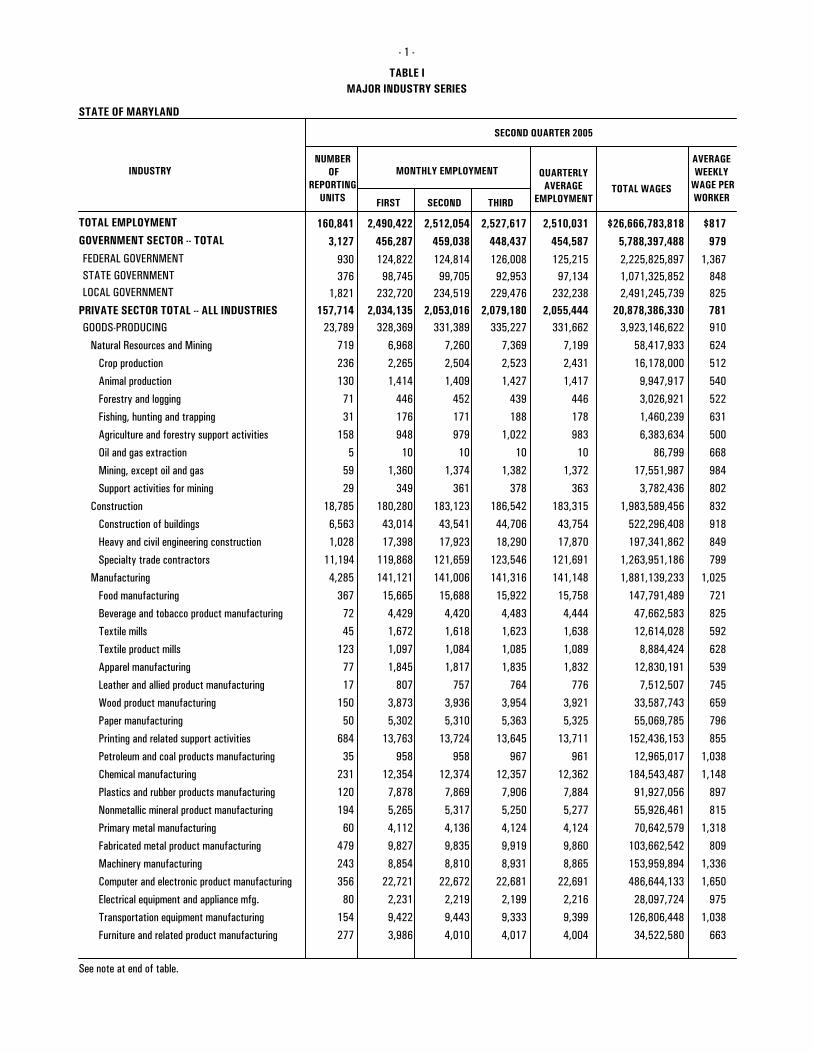
TABLE I
STATE OF MARYLAND
AVERAGEWEEKLY
WAGE PERWORKER
TOTAL EMPLOYMENTGOVERNMENT SECTOR -- TOTAL
160,841 2,490,422 2,512,054 2,527,617 3,127 456,287 459,038 448,437
930 124,822 124,814 126,008 376 98,745 99,705 92,953 1,071,325,852
1,821 232,720 234,519 229,476
FEDERAL GOVERNMENTSTATE GOVERNMENTLOCAL GOVERNMENT
2,510,031 454,587
125,215 97,134
232,238
$817 979
1,367 848 825
- 1 -
MAJOR INDUSTRY SERIES
2,491,245,739
2,225,825,897
5,788,397,488$26,666,783,818
157,714 2,034,135 2,053,016 2,079,180 2,055,444 781 20,878,386,330PRIVATE SECTOR TOTAL -- ALL INDUSTRIES
SECOND QUARTER 2005
GOODS-PRODUCING 23,789 328,369 331,389 335,227 331,662 910 3,923,146,622
Natural Resources and Mining 719 6,968 7,260 7,369 7,199 624 58,417,933
Crop production 236 2,265 2,504 2,523 2,431 512 16,178,000
Animal production 130 1,414 1,409 1,427 1,417 540 9,947,917
Forestry and logging 71 446 452 439 446 522 3,026,921
Fishing, hunting and trapping 31 176 171 188 178 631 1,460,239
Agriculture and forestry support activities 158 948 979 1,022 983 500 6,383,634
Oil and gas extraction 5 10 10 10 10 668 86,799
Mining, except oil and gas 59 1,360 1,374 1,382 1,372 984 17,551,987
Support activities for mining 29 349 361 378 363 802 3,782,436
Construction 18,785 180,280 183,123 186,542 183,315 832 1,983,589,456
Construction of buildings 6,563 43,014 43,541 44,706 43,754 918 522,296,408
Heavy and civil engineering construction 1,028 17,398 17,923 18,290 17,870 849 197,341,862
Specialty trade contractors 11,194 119,868 121,659 123,546 121,691 799 1,263,951,186
Manufacturing 4,285 141,121 141,006 141,316 141,148 1,025 1,881,139,233
Food manufacturing 367 15,665 15,688 15,922 15,758 721 147,791,489
Beverage and tobacco product manufacturing 72 4,429 4,420 4,483 4,444 825 47,662,583
Textile mills 45 1,672 1,618 1,623 1,638 592 12,614,028
Textile product mills 123 1,097 1,084 1,085 1,089 628 8,884,424
Apparel manufacturing 77 1,845 1,817 1,835 1,832 539 12,830,191
Leather and allied product manufacturing 17 807 757 764 776 745 7,512,507
Wood product manufacturing 150 3,873 3,936 3,954 3,921 659 33,587,743
Paper manufacturing 50 5,302 5,310 5,363 5,325 796 55,069,785
Printing and related support activities 684 13,763 13,724 13,645 13,711 855 152,436,153
Petroleum and coal products manufacturing 35 958 958 967 961 1,038 12,965,017
Chemical manufacturing 231 12,354 12,374 12,357 12,362 1,148 184,543,487
Plastics and rubber products manufacturing 120 7,878 7,869 7,906 7,884 897 91,927,056
Nonmetallic mineral product manufacturing 194 5,265 5,317 5,250 5,277 815 55,926,461
Primary metal manufacturing 60 4,112 4,136 4,124 4,124 1,318 70,642,579
Fabricated metal product manufacturing 479 9,827 9,835 9,919 9,860 809 103,662,542
Machinery manufacturing 243 8,854 8,810 8,931 8,865 1,336 153,959,894
Computer and electronic product manufacturing 356 22,721 22,672 22,681 22,691 1,650 486,644,133
Electrical equipment and appliance mfg. 80 2,231 2,219 2,199 2,216 975 28,097,724
Transportation equipment manufacturing 154 9,422 9,443 9,333 9,399 1,038 126,806,448
Furniture and related product manufacturing 277 3,986 4,010 4,017 4,004 663 34,522,580
See note at end of table.
INDUSTRYNUMBER
OFREPORTING
UNITS
MONTHLY EMPLOYMENT
FIRST SECOND THIRD
QUARTERLYAVERAGE
EMPLOYMENTTOTAL WAGES
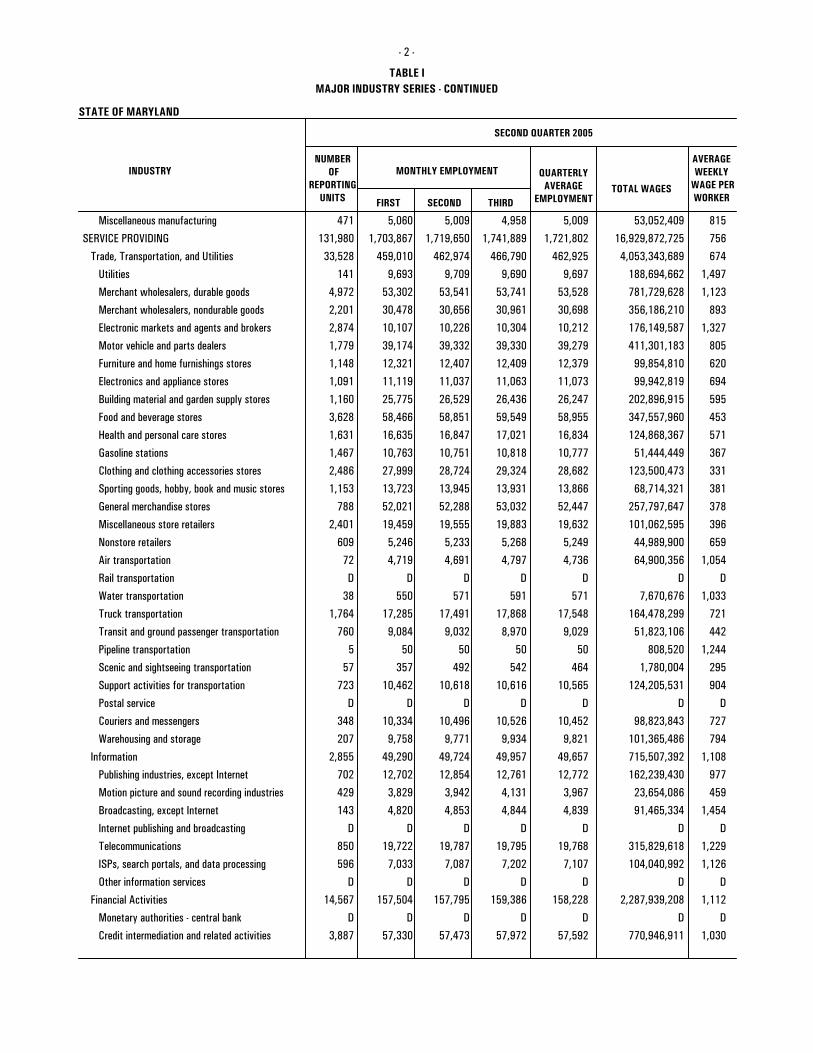
TABLE I
STATE OF MARYLAND
AVERAGEWEEKLY
WAGE PERWORKER
- 2 -
MAJOR INDUSTRY SERIES - CONTINUED
SECOND QUARTER 2005
Miscellaneous manufacturing 471 5,060 5,009 4,958 5,009 815 53,052,409
SERVICE PROVIDING 131,980 1,703,867 1,719,650 1,741,889 1,721,802 75616,929,872,725
Trade, Transportation, and Utilities 33,528 459,010 462,974 466,790 462,925 674 4,053,343,689
Utilities 141 9,693 9,709 9,690 9,697 1,497 188,694,662
Merchant wholesalers, durable goods 4,972 53,302 53,541 53,741 53,528 1,123 781,729,628
Merchant wholesalers, nondurable goods 2,201 30,478 30,656 30,961 30,698 893 356,186,210
Electronic markets and agents and brokers 2,874 10,107 10,226 10,304 10,212 1,327 176,149,587
Motor vehicle and parts dealers 1,779 39,174 39,332 39,330 39,279 805 411,301,183
Furniture and home furnishings stores 1,148 12,321 12,407 12,409 12,379 620 99,854,810
Electronics and appliance stores 1,091 11,119 11,037 11,063 11,073 694 99,942,819
Building material and garden supply stores 1,160 25,775 26,529 26,436 26,247 595 202,896,915
Food and beverage stores 3,628 58,466 58,851 59,549 58,955 453 347,557,960
Health and personal care stores 1,631 16,635 16,847 17,021 16,834 571 124,868,367
Gasoline stations 1,467 10,763 10,751 10,818 10,777 367 51,444,449
Clothing and clothing accessories stores 2,486 27,999 28,724 29,324 28,682 331 123,500,473
Sporting goods, hobby, book and music stores 1,153 13,723 13,945 13,931 13,866 381 68,714,321
General merchandise stores 788 52,021 52,288 53,032 52,447 378 257,797,647
Miscellaneous store retailers 2,401 19,459 19,555 19,883 19,632 396 101,062,595
Nonstore retailers 609 5,246 5,233 5,268 5,249 659 44,989,900
Air transportation 72 4,719 4,691 4,797 4,736 1,054 64,900,356
Rail transportation D D D D D DD
Water transportation 38 550 571 591 571 1,033 7,670,676
Truck transportation 1,764 17,285 17,491 17,868 17,548 721 164,478,299
Transit and ground passenger transportation 760 9,084 9,032 8,970 9,029 442 51,823,106
Pipeline transportation 5 50 50 50 50 1,244 808,520
Scenic and sightseeing transportation 57 357 492 542 464 295 1,780,004
Support activities for transportation 723 10,462 10,618 10,616 10,565 904 124,205,531
Postal service D D D D D DD
Couriers and messengers 348 10,334 10,496 10,526 10,452 727 98,823,843
Warehousing and storage 207 9,758 9,771 9,934 9,821 794 101,365,486
Information 2,855 49,290 49,724 49,957 49,657 1,108 715,507,392
Publishing industries, except Internet 702 12,702 12,854 12,761 12,772 977 162,239,430
Motion picture and sound recording industries 429 3,829 3,942 4,131 3,967 459 23,654,086
Broadcasting, except Internet 143 4,820 4,853 4,844 4,839 1,454 91,465,334
Internet publishing and broadcasting D D D D D DD
Telecommunications 850 19,722 19,787 19,795 19,768 1,229 315,829,618
ISPs, search portals, and data processing 596 7,033 7,087 7,202 7,107 1,126 104,040,992
Other information services D D D D D DD
Financial Activities 14,567 157,504 157,795 159,386 158,228 1,112 2,287,939,208
Monetary authorities - central bank D D D D D DD
Credit intermediation and related activities 3,887 57,330 57,473 57,972 57,592 1,030 770,946,911
INDUSTRYNUMBER
OFREPORTING
UNITS
MONTHLY EMPLOYMENT
FIRST SECOND THIRD
QUARTERLYAVERAGE
EMPLOYMENTTOTAL WAGES
TABLE I
STATE OF MARYLAND
AVERAGEWEEKLY
WAGE PERWORKER
- 3 -
MAJOR INDUSTRY SERIES - CONTINUED
SECOND QUARTER 2005
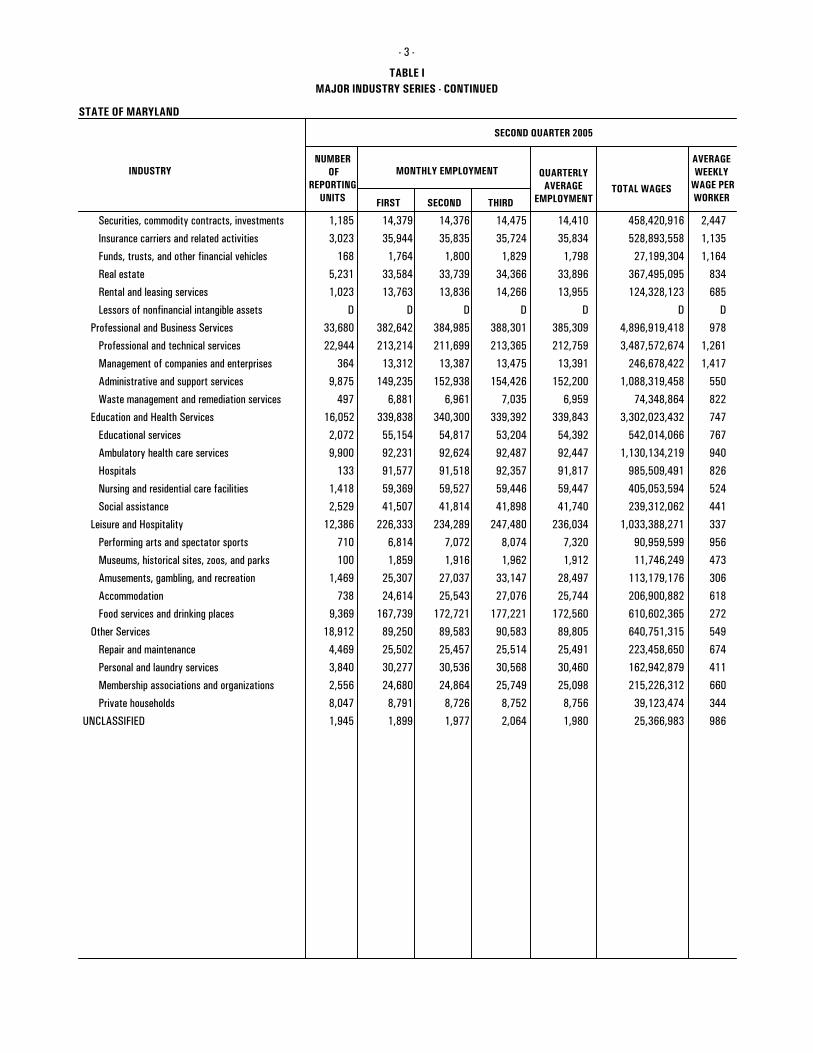
Securities, commodity contracts, investments 1,185 14,379 14,376 14,475 14,410 2,447 458,420,916
Insurance carriers and related activities 3,023 35,944 35,835 35,724 35,834 1,135 528,893,558
Funds, trusts, and other financial vehicles 168 1,764 1,800 1,829 1,798 1,164 27,199,304
Real estate 5,231 33,584 33,739 34,366 33,896 834 367,495,095
Rental and leasing services 1,023 13,763 13,836 14,266 13,955 685 124,328,123
Lessors of nonfinancial intangible assets D D D D D DD
Professional and Business Services 33,680 382,642 384,985 388,301 385,309 978 4,896,919,418
Professional and technical services 22,944 213,214 211,699 213,365 212,759 1,261 3,487,572,674
Management of companies and enterprises 364 13,312 13,387 13,475 13,391 1,417 246,678,422
Administrative and support services 9,875 149,235 152,938 154,426 152,200 550 1,088,319,458
Waste management and remediation services 497 6,881 6,961 7,035 6,959 822 74,348,864
Education and Health Services 16,052 339,838 340,300 339,392 339,843 747 3,302,023,432
Educational services 2,072 55,154 54,817 53,204 54,392 767 542,014,066
Ambulatory health care services 9,900 92,231 92,624 92,487 92,447 940 1,130,134,219
Hospitals 133 91,577 91,518 92,357 91,817 826 985,509,491
Nursing and residential care facilities 1,418 59,369 59,527 59,446 59,447 524 405,053,594
Social assistance 2,529 41,507 41,814 41,898 41,740 441 239,312,062
Leisure and Hospitality 12,386 226,333 234,289 247,480 236,034 337 1,033,388,271
Performing arts and spectator sports 710 6,814 7,072 8,074 7,320 956 90,959,599
Museums, historical sites, zoos, and parks 100 1,859 1,916 1,962 1,912 473 11,746,249
Amusements, gambling, and recreation 1,469 25,307 27,037 33,147 28,497 306 113,179,176
Accommodation 738 24,614 25,543 27,076 25,744 618 206,900,882
Food services and drinking places 9,369 167,739 172,721 177,221 172,560 272 610,602,365
Other Services 18,912 89,250 89,583 90,583 89,805 549 640,751,315
Repair and maintenance 4,469 25,502 25,457 25,514 25,491 674 223,458,650
Personal and laundry services 3,840 30,277 30,536 30,568 30,460 411 162,942,879
Membership associations and organizations 2,556 24,680 24,864 25,749 25,098 660 215,226,312
Private households 8,047 8,791 8,726 8,752 8,756 344 39,123,474
UNCLASSIFIED 1,945 1,899 1,977 2,064 1,980 986 25,366,983
INDUSTRYNUMBER
OFREPORTING
UNITS
MONTHLY EMPLOYMENT
FIRST SECOND THIRD
QUARTERLYAVERAGE
EMPLOYMENTTOTAL WAGES
TABLE I
BALTIMORE MSA
AVERAGEWEEKLY
WAGE PERWORKER
TOTAL EMPLOYMENT
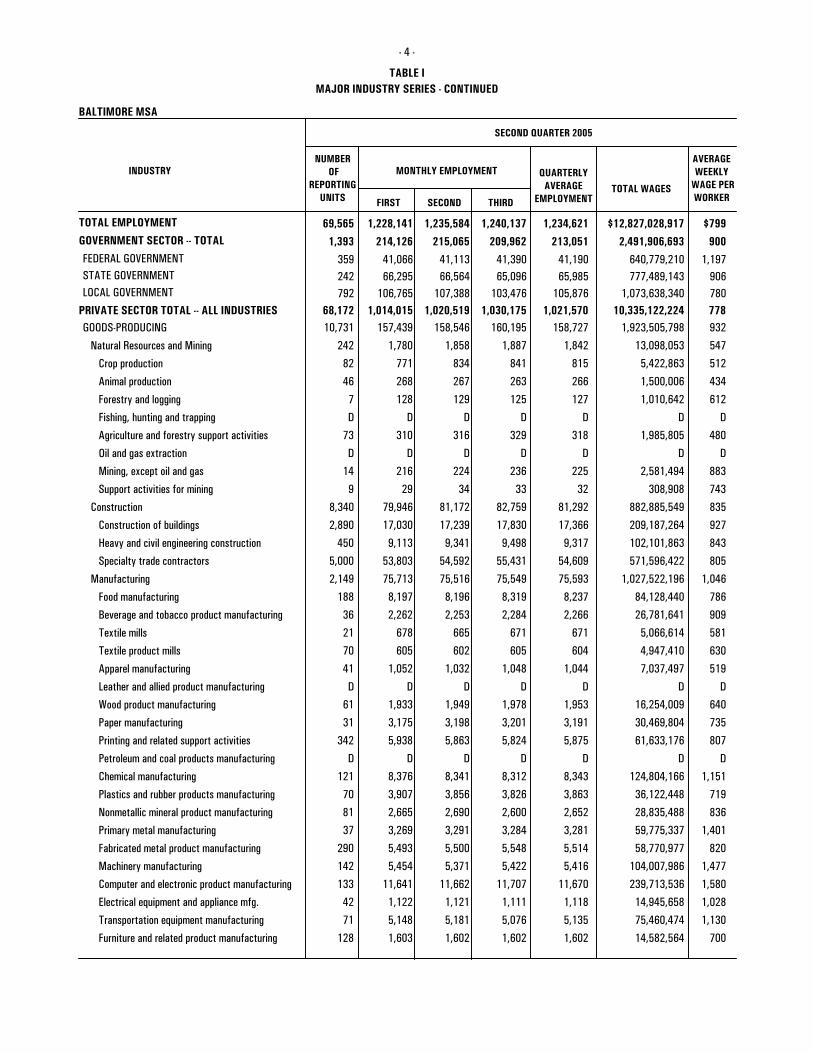
GOVERNMENT SECTOR -- TOTAL 69,565 1,228,141 1,235,584 1,240,137
1,393 214,126 215,065 209,962
359 41,066 41,113 41,390 242 66,295 66,564 65,096 777,489,143 792 106,765 107,388 103,476
FEDERAL GOVERNMENTSTATE GOVERNMENTLOCAL GOVERNMENT
1,234,621
213,051
41,190 65,985
105,876
$799
900
1,197 906 780
- 4 -
MAJOR INDUSTRY SERIES - CONTINUED
1,073,638,340
640,779,210
2,491,906,693
$12,827,028,917
68,172 1,014,015 1,020,519 1,030,175 1,021,570 778 10,335,122,224PRIVATE SECTOR TOTAL -- ALL INDUSTRIES
SECOND QUARTER 2005
GOODS-PRODUCING 10,731 157,439 158,546 160,195 158,727 932 1,923,505,798
Natural Resources and Mining 242 1,780 1,858 1,887 1,842 547 13,098,053
Crop production 82 771 834 841 815 512 5,422,863
Animal production 46 268 267 263 266 434 1,500,006
Forestry and logging 7 128 129 125 127 612 1,010,642
Fishing, hunting and trapping D D D D D DD
Agriculture and forestry support activities 73 310 316 329 318 480 1,985,805
Oil and gas extraction D D D D D DD
Mining, except oil and gas 14 216 224 236 225 883 2,581,494
Support activities for mining 9 29 34 33 32 743 308,908
Construction 8,340 79,946 81,172 82,759 81,292 835 882,885,549
Construction of buildings 2,890 17,030 17,239 17,830 17,366 927 209,187,264
Heavy and civil engineering construction 450 9,113 9,341 9,498 9,317 843 102,101,863
Specialty trade contractors 5,000 53,803 54,592 55,431 54,609 805 571,596,422
Manufacturing 2,149 75,713 75,516 75,549 75,593 1,046 1,027,522,196
Food manufacturing 188 8,197 8,196 8,319 8,237 786 84,128,440
Beverage and tobacco product manufacturing 36 2,262 2,253 2,284 2,266 909 26,781,641
Textile mills 21 678 665 671 671 581 5,066,614
Textile product mills 70 605 602 605 604 630 4,947,410
Apparel manufacturing 41 1,052 1,032 1,048 1,044 519 7,037,497
Leather and allied product manufacturing D D D D D DD
Wood product manufacturing 61 1,933 1,949 1,978 1,953 640 16,254,009
Paper manufacturing 31 3,175 3,198 3,201 3,191 735 30,469,804
Printing and related support activities 342 5,938 5,863 5,824 5,875 807 61,633,176
Petroleum and coal products manufacturing D D D D D DD
Chemical manufacturing 121 8,376 8,341 8,312 8,343 1,151 124,804,166
Plastics and rubber products manufacturing 70 3,907 3,856 3,826 3,863 719 36,122,448
Nonmetallic mineral product manufacturing 81 2,665 2,690 2,600 2,652 836 28,835,488
Primary metal manufacturing 37 3,269 3,291 3,284 3,281 1,401 59,775,337
Fabricated metal product manufacturing 290 5,493 5,500 5,548 5,514 820 58,770,977
Machinery manufacturing 142 5,454 5,371 5,422 5,416 1,477 104,007,986
Computer and electronic product manufacturing 133 11,641 11,662 11,707 11,670 1,580 239,713,536
Electrical equipment and appliance mfg. 42 1,122 1,121 1,111 1,118 1,028 14,945,658
Transportation equipment manufacturing 71 5,148 5,181 5,076 5,135 1,130 75,460,474
Furniture and related product manufacturing 128 1,603 1,602 1,602 1,602 700 14,582,564
INDUSTRYNUMBER
OFREPORTING
UNITS
MONTHLY EMPLOYMENT
FIRST SECOND THIRD
QUARTERLYAVERAGE
EMPLOYMENTTOTAL WAGES
TABLE I
BALTIMORE MSA
AVERAGEWEEKLY
WAGE PERWORKER
- 5 -
MAJOR INDUSTRY SERIES - CONTINUED
SECOND QUARTER 2005
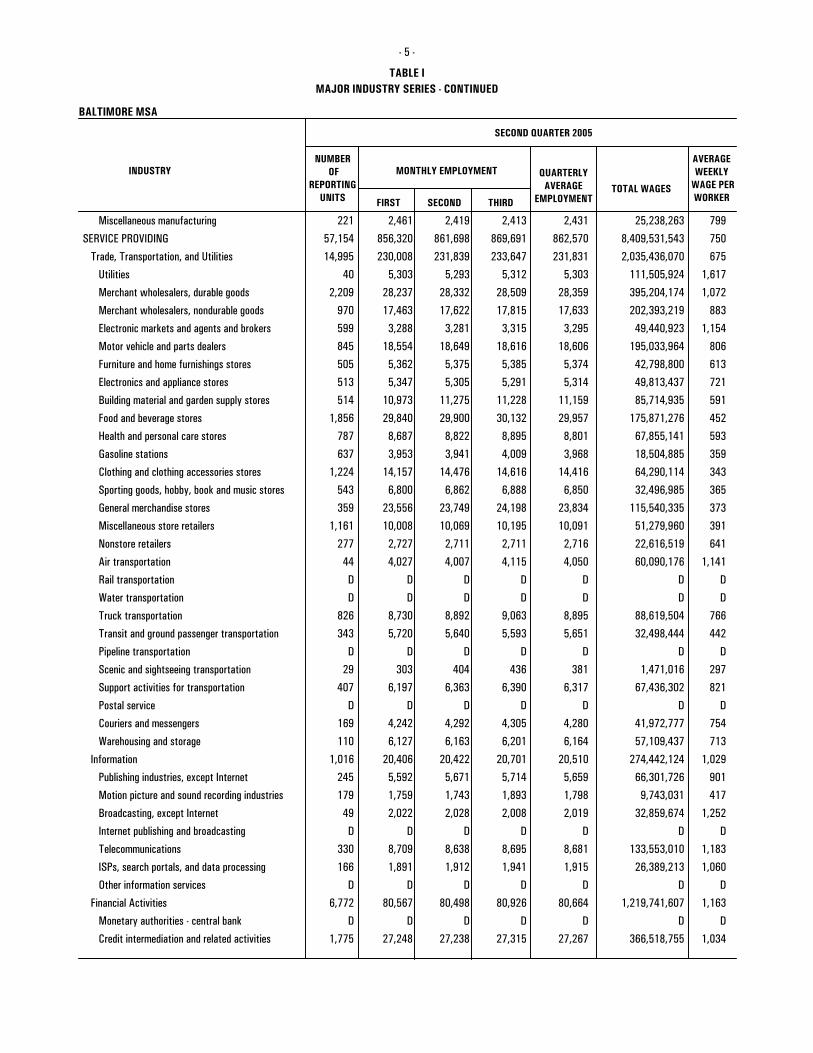
Miscellaneous manufacturing 221 2,461 2,419 2,413 2,431 799 25,238,263
SERVICE PROVIDING 57,154 856,320 861,698 869,691 862,570 750 8,409,531,543
Trade, Transportation, and Utilities 14,995 230,008 231,839 233,647 231,831 675 2,035,436,070
Utilities 40 5,303 5,293 5,312 5,303 1,617 111,505,924
Merchant wholesalers, durable goods 2,209 28,237 28,332 28,509 28,359 1,072 395,204,174
Merchant wholesalers, nondurable goods 970 17,463 17,622 17,815 17,633 883 202,393,219
Electronic markets and agents and brokers 599 3,288 3,281 3,315 3,295 1,154 49,440,923
Motor vehicle and parts dealers 845 18,554 18,649 18,616 18,606 806 195,033,964
Furniture and home furnishings stores 505 5,362 5,375 5,385 5,374 613 42,798,800
Electronics and appliance stores 513 5,347 5,305 5,291 5,314 721 49,813,437
Building material and garden supply stores 514 10,973 11,275 11,228 11,159 591 85,714,935
Food and beverage stores 1,856 29,840 29,900 30,132 29,957 452 175,871,276
Health and personal care stores 787 8,687 8,822 8,895 8,801 593 67,855,141
Gasoline stations 637 3,953 3,941 4,009 3,968 359 18,504,885
Clothing and clothing accessories stores 1,224 14,157 14,476 14,616 14,416 343 64,290,114
Sporting goods, hobby, book and music stores 543 6,800 6,862 6,888 6,850 365 32,496,985
General merchandise stores 359 23,556 23,749 24,198 23,834 373 115,540,335
Miscellaneous store retailers 1,161 10,008 10,069 10,195 10,091 391 51,279,960
Nonstore retailers 277 2,727 2,711 2,711 2,716 641 22,616,519
Air transportation 44 4,027 4,007 4,115 4,050 1,141 60,090,176
Rail transportation D D D D D DD
Water transportation D D D D D DD
Truck transportation 826 8,730 8,892 9,063 8,895 766 88,619,504
Transit and ground passenger transportation 343 5,720 5,640 5,593 5,651 442 32,498,444
Pipeline transportation D D D D D DD
Scenic and sightseeing transportation 29 303 404 436 381 297 1,471,016
Support activities for transportation 407 6,197 6,363 6,390 6,317 821 67,436,302
Postal service D D D D D DD
Couriers and messengers 169 4,242 4,292 4,305 4,280 754 41,972,777
Warehousing and storage 110 6,127 6,163 6,201 6,164 713 57,109,437
Information 1,016 20,406 20,422 20,701 20,510 1,029 274,442,124
Publishing industries, except Internet 245 5,592 5,671 5,714 5,659 901 66,301,726
Motion picture and sound recording industries 179 1,759 1,743 1,893 1,798 417 9,743,031
Broadcasting, except Internet 49 2,022 2,028 2,008 2,019 1,252 32,859,674
Internet publishing and broadcasting D D D D D DD
Telecommunications 330 8,709 8,638 8,695 8,681 1,183 133,553,010
ISPs, search portals, and data processing 166 1,891 1,912 1,941 1,915 1,060 26,389,213
Other information services D D D D D DD
Financial Activities 6,772 80,567 80,498 80,926 80,664 1,163 1,219,741,607
Monetary authorities - central bank D D D D D DD
Credit intermediation and related activities 1,775 27,248 27,238 27,315 27,267 1,034 366,518,755
INDUSTRYNUMBER
OFREPORTING
UNITS
MONTHLY EMPLOYMENT
FIRST SECOND THIRD
QUARTERLYAVERAGE
EMPLOYMENTTOTAL WAGES
TABLE I
BALTIMORE MSA
AVERAGEWEEKLY
WAGE PERWORKER
- 6 -
MAJOR INDUSTRY SERIES - CONTINUED
SECOND QUARTER 2005
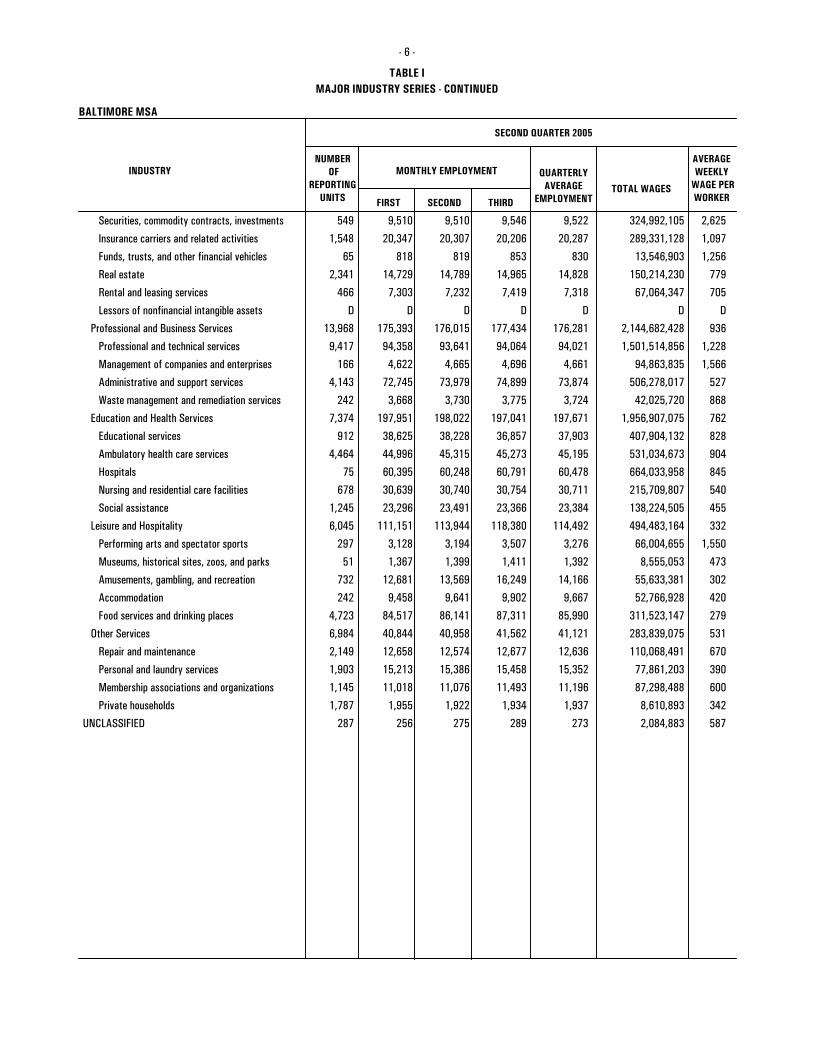
Securities, commodity contracts, investments 549 9,510 9,510 9,546 9,522 2,625 324,992,105
Insurance carriers and related activities 1,548 20,347 20,307 20,206 20,287 1,097 289,331,128
Funds, trusts, and other financial vehicles 65 818 819 853 830 1,256 13,546,903
Real estate 2,341 14,729 14,789 14,965 14,828 779 150,214,230
Rental and leasing services 466 7,303 7,232 7,419 7,318 705 67,064,347
Lessors of nonfinancial intangible assets D D D D D DD
Professional and Business Services 13,968 175,393 176,015 177,434 176,281 936 2,144,682,428
Professional and technical services 9,417 94,358 93,641 94,064 94,021 1,228 1,501,514,856
Management of companies and enterprises 166 4,622 4,665 4,696 4,661 1,566 94,863,835
Administrative and support services 4,143 72,745 73,979 74,899 73,874 527 506,278,017
Waste management and remediation services 242 3,668 3,730 3,775 3,724 868 42,025,720
Education and Health Services 7,374 197,951 198,022 197,041 197,671 762 1,956,907,075
Educational services 912 38,625 38,228 36,857 37,903 828 407,904,132
Ambulatory health care services 4,464 44,996 45,315 45,273 45,195 904 531,034,673
Hospitals 75 60,395 60,248 60,791 60,478 845 664,033,958
Nursing and residential care facilities 678 30,639 30,740 30,754 30,711 540 215,709,807
Social assistance 1,245 23,296 23,491 23,366 23,384 455 138,224,505
Leisure and Hospitality 6,045 111,151 113,944 118,380 114,492 332 494,483,164
Performing arts and spectator sports 297 3,128 3,194 3,507 3,276 1,550 66,004,655
Museums, historical sites, zoos, and parks 51 1,367 1,399 1,411 1,392 473 8,555,053
Amusements, gambling, and recreation 732 12,681 13,569 16,249 14,166 302 55,633,381
Accommodation 242 9,458 9,641 9,902 9,667 420 52,766,928
Food services and drinking places 4,723 84,517 86,141 87,311 85,990 279 311,523,147
Other Services 6,984 40,844 40,958 41,562 41,121 531 283,839,075
Repair and maintenance 2,149 12,658 12,574 12,677 12,636 670 110,068,491
Personal and laundry services 1,903 15,213 15,386 15,458 15,352 390 77,861,203
Membership associations and organizations 1,145 11,018 11,076 11,493 11,196 600 87,298,488
Private households 1,787 1,955 1,922 1,934 1,937 342 8,610,893
UNCLASSIFIED 287 256 275 289 273 587 2,084,883
INDUSTRYNUMBER
OFREPORTING
UNITS
MONTHLY EMPLOYMENT
FIRST SECOND THIRD
QUARTERLYAVERAGE
EMPLOYMENTTOTAL WAGES
TABLE I
MARYLAND PORTION OF DC MSA
AVERAGEWEEKLY
WAGE PERWORKER
TOTAL EMPLOYMENT
GOVERNMENT SECTOR -- TOTAL 58,758 922,649 929,737 933,798
984 186,923 188,464 182,947
324 71,071 71,040 71,863 39 20,108 20,783 15,658 177,978,514
621 95,744 96,641 95,426
FEDERAL GOVERNMENTSTATE GOVERNMENTLOCAL GOVERNMENT
928,728
186,111
71,325 18,850 95,937
$885
1,121
1,491 726 923
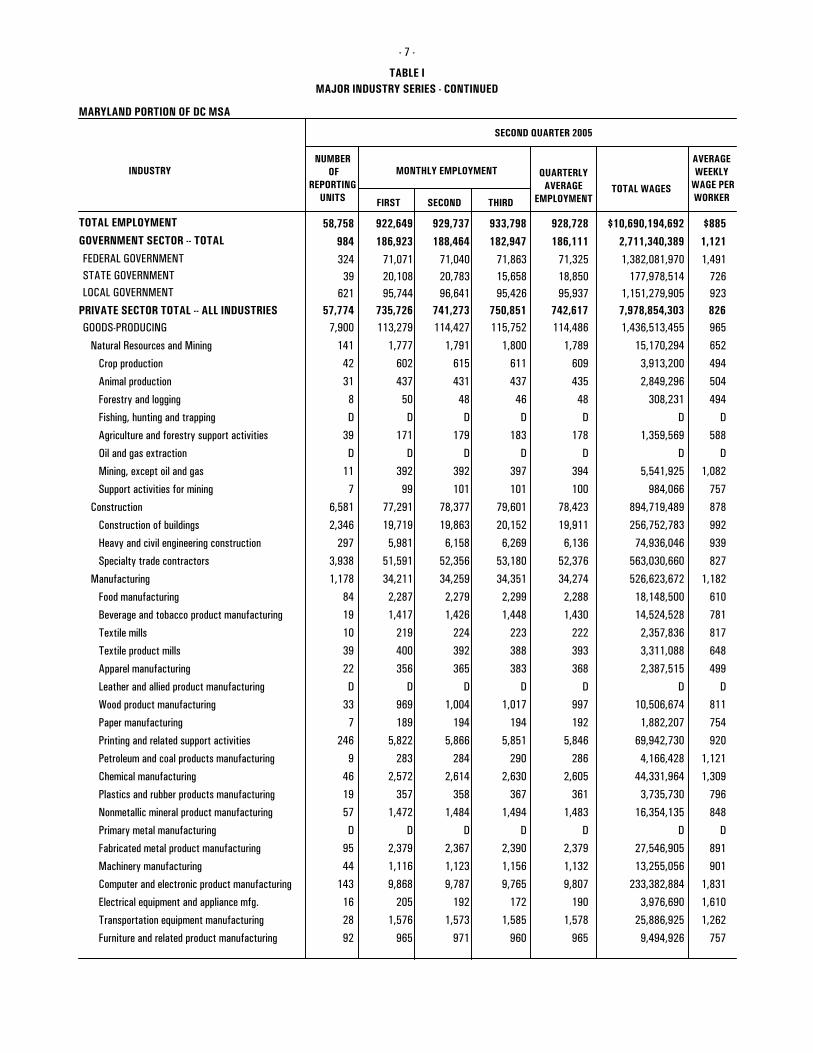
- 7 -
MAJOR INDUSTRY SERIES - CONTINUED
1,151,279,905
1,382,081,970
2,711,340,389
$10,690,194,692
57,774 735,726 741,273 750,851 742,617 826 7,978,854,303PRIVATE SECTOR TOTAL -- ALL INDUSTRIES
SECOND QUARTER 2005
GOODS-PRODUCING 7,900 113,279 114,427 115,752 114,486 965 1,436,513,455
Natural Resources and Mining 141 1,777 1,791 1,800 1,789 652 15,170,294
Crop production 42 602 615 611 609 494 3,913,200
Animal production 31 437 431 437 435 504 2,849,296
Forestry and logging 8 50 48 46 48 494 308,231
Fishing, hunting and trapping D D D D D DD
Agriculture and forestry support activities 39 171 179 183 178 588 1,359,569
Oil and gas extraction D D D D D DD
Mining, except oil and gas 11 392 392 397 394 1,082 5,541,925
Support activities for mining 7 99 101 101 100 757 984,066
Construction 6,581 77,291 78,377 79,601 78,423 878 894,719,489
Construction of buildings 2,346 19,719 19,863 20,152 19,911 992 256,752,783
Heavy and civil engineering construction 297 5,981 6,158 6,269 6,136 939 74,936,046
Specialty trade contractors 3,938 51,591 52,356 53,180 52,376 827 563,030,660
Manufacturing 1,178 34,211 34,259 34,351 34,274 1,182 526,623,672
Food manufacturing 84 2,287 2,279 2,299 2,288 610 18,148,500
Beverage and tobacco product manufacturing 19 1,417 1,426 1,448 1,430 781 14,524,528
Textile mills 10 219 224 223 222 817 2,357,836
Textile product mills 39 400 392 388 393 648 3,311,088
Apparel manufacturing 22 356 365 383 368 499 2,387,515
Leather and allied product manufacturing D D D D D DD
Wood product manufacturing 33 969 1,004 1,017 997 811 10,506,674
Paper manufacturing 7 189 194 194 192 754 1,882,207
Printing and related support activities 246 5,822 5,866 5,851 5,846 920 69,942,730
Petroleum and coal products manufacturing 9 283 284 290 286 1,121 4,166,428
Chemical manufacturing 46 2,572 2,614 2,630 2,605 1,309 44,331,964
Plastics and rubber products manufacturing 19 357 358 367 361 796 3,735,730
Nonmetallic mineral product manufacturing 57 1,472 1,484 1,494 1,483 848 16,354,135
Primary metal manufacturing D D D D D DD
Fabricated metal product manufacturing 95 2,379 2,367 2,390 2,379 891 27,546,905
Machinery manufacturing 44 1,116 1,123 1,156 1,132 901 13,255,056
Computer and electronic product manufacturing 143 9,868 9,787 9,765 9,807 1,831 233,382,884
Electrical equipment and appliance mfg. 16 205 192 172 190 1,610 3,976,690
Transportation equipment manufacturing 28 1,576 1,573 1,585 1,578 1,262 25,886,925
Furniture and related product manufacturing 92 965 971 960 965 757 9,494,926
INDUSTRYNUMBER
OFREPORTING
UNITS
MONTHLY EMPLOYMENT
FIRST SECOND THIRD
QUARTERLYAVERAGE
EMPLOYMENTTOTAL WAGES
TABLE I
MARYLAND PORTION OF DC MSA
AVERAGEWEEKLY
WAGE PERWORKER
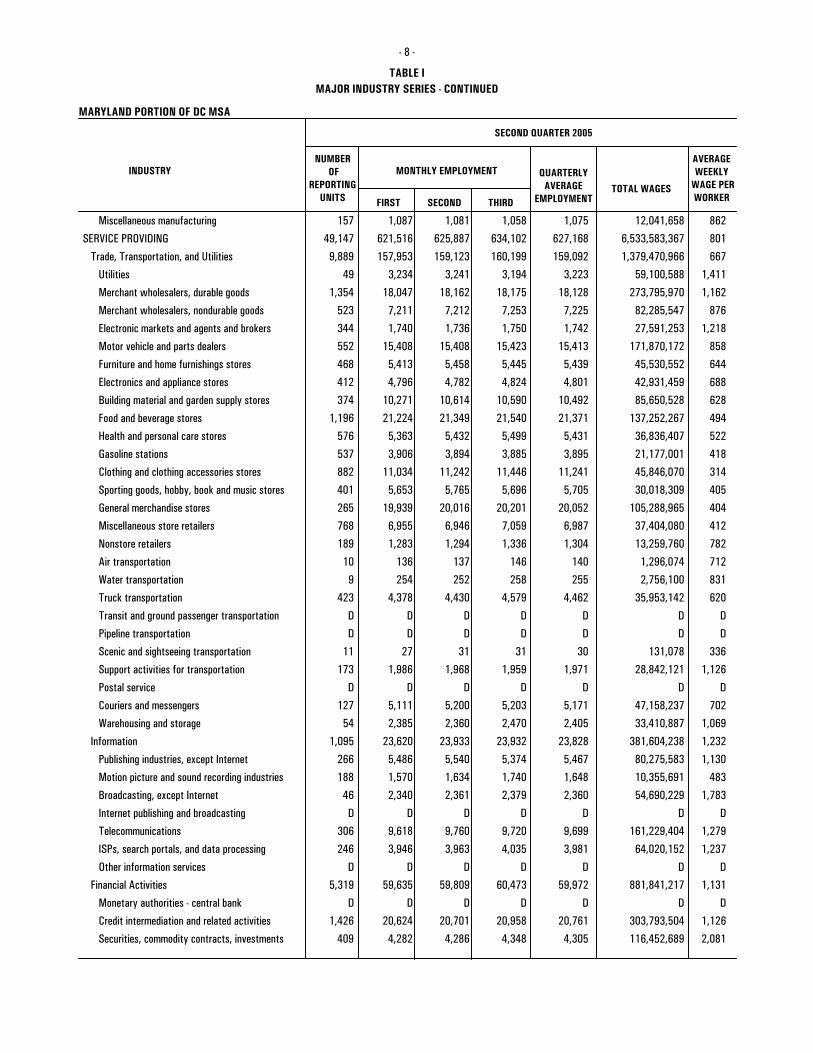
- 8 -
MAJOR INDUSTRY SERIES - CONTINUED
SECOND QUARTER 2005
Miscellaneous manufacturing 157 1,087 1,081 1,058 1,075 862 12,041,658
SERVICE PROVIDING 49,147 621,516 625,887 634,102 627,168 801 6,533,583,367
Trade, Transportation, and Utilities 9,889 157,953 159,123 160,199 159,092 667 1,379,470,966
Utilities 49 3,234 3,241 3,194 3,223 1,411 59,100,588
Merchant wholesalers, durable goods 1,354 18,047 18,162 18,175 18,128 1,162 273,795,970
Merchant wholesalers, nondurable goods 523 7,211 7,212 7,253 7,225 876 82,285,547
Electronic markets and agents and brokers 344 1,740 1,736 1,750 1,742 1,218 27,591,253
Motor vehicle and parts dealers 552 15,408 15,408 15,423 15,413 858 171,870,172
Furniture and home furnishings stores 468 5,413 5,458 5,445 5,439 644 45,530,552
Electronics and appliance stores 412 4,796 4,782 4,824 4,801 688 42,931,459
Building material and garden supply stores 374 10,271 10,614 10,590 10,492 628 85,650,528
Food and beverage stores 1,196 21,224 21,349 21,540 21,371 494 137,252,267
Health and personal care stores 576 5,363 5,432 5,499 5,431 522 36,836,407
Gasoline stations 537 3,906 3,894 3,885 3,895 418 21,177,001
Clothing and clothing accessories stores 882 11,034 11,242 11,446 11,241 314 45,846,070
Sporting goods, hobby, book and music stores 401 5,653 5,765 5,696 5,705 405 30,018,309
General merchandise stores 265 19,939 20,016 20,201 20,052 404 105,288,965
Miscellaneous store retailers 768 6,955 6,946 7,059 6,987 412 37,404,080
Nonstore retailers 189 1,283 1,294 1,336 1,304 782 13,259,760
Air transportation 10 136 137 146 140 712 1,296,074
Water transportation 9 254 252 258 255 831 2,756,100
Truck transportation 423 4,378 4,430 4,579 4,462 620 35,953,142
Transit and ground passenger transportation D D D D D DD
Pipeline transportation D D D D D DD
Scenic and sightseeing transportation 11 27 31 31 30 336 131,078
Support activities for transportation 173 1,986 1,968 1,959 1,971 1,126 28,842,121
Postal service D D D D D DD
Couriers and messengers 127 5,111 5,200 5,203 5,171 702 47,158,237
Warehousing and storage 54 2,385 2,360 2,470 2,405 1,069 33,410,887
Information 1,095 23,620 23,933 23,932 23,828 1,232 381,604,238
Publishing industries, except Internet 266 5,486 5,540 5,374 5,467 1,130 80,275,583
Motion picture and sound recording industries 188 1,570 1,634 1,740 1,648 483 10,355,691
Broadcasting, except Internet 46 2,340 2,361 2,379 2,360 1,783 54,690,229
Internet publishing and broadcasting D D D D D DD
Telecommunications 306 9,618 9,760 9,720 9,699 1,279 161,229,404
ISPs, search portals, and data processing 246 3,946 3,963 4,035 3,981 1,237 64,020,152
Other information services D D D D D DD
Financial Activities 5,319 59,635 59,809 60,473 59,972 1,131 881,841,217
Monetary authorities - central bank D D D D D DD
Credit intermediation and related activities 1,426 20,624 20,701 20,958 20,761 1,126 303,793,504
Securities, commodity contracts, investments 409 4,282 4,286 4,348 4,305 2,081 116,452,689
INDUSTRYNUMBER
OFREPORTING
UNITS
MONTHLY EMPLOYMENT
FIRST SECOND THIRD
QUARTERLYAVERAGE
EMPLOYMENTTOTAL WAGES
TABLE I
MARYLAND PORTION OF DC MSA
AVERAGEWEEKLY
WAGE PERWORKER
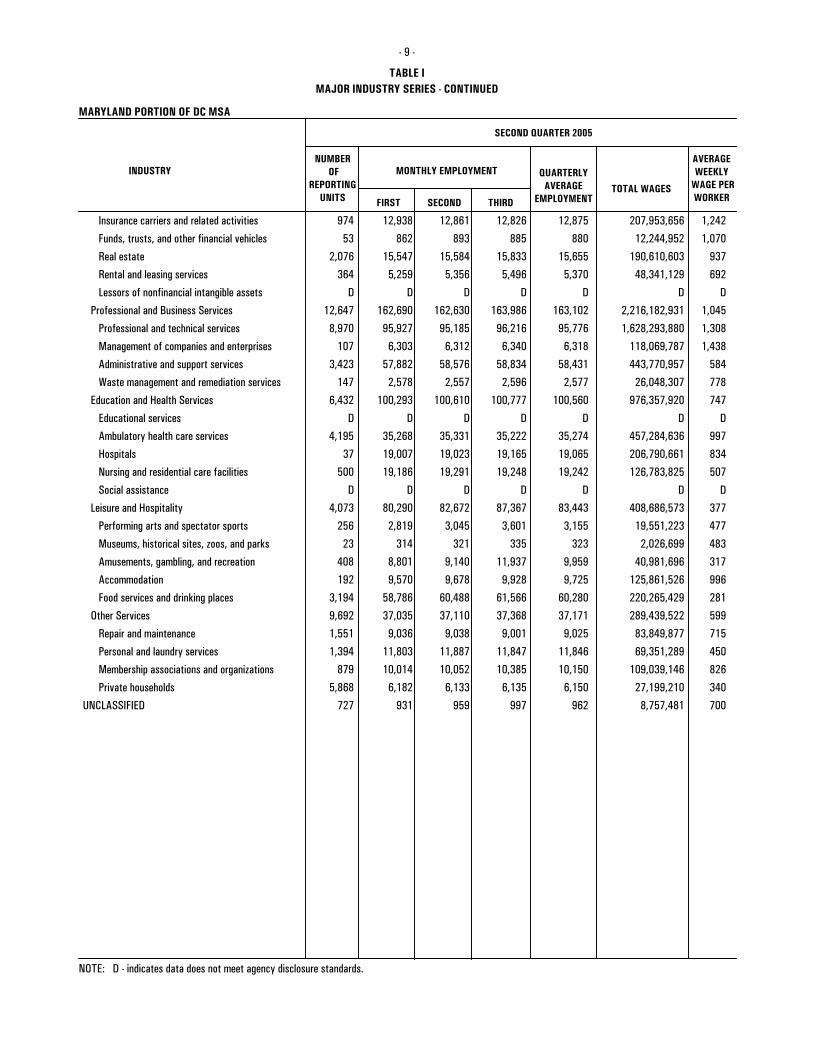
- 9 -
MAJOR INDUSTRY SERIES - CONTINUED
SECOND QUARTER 2005
Insurance carriers and related activities 974 12,938 12,861 12,826 12,875 1,242 207,953,656
Funds, trusts, and other financial vehicles 53 862 893 885 880 1,070 12,244,952
Real estate 2,076 15,547 15,584 15,833 15,655 937 190,610,603
Rental and leasing services 364 5,259 5,356 5,496 5,370 692 48,341,129
Lessors of nonfinancial intangible assets D D D D D DD
Professional and Business Services 12,647 162,690 162,630 163,986 163,102 1,045 2,216,182,931
Professional and technical services 8,970 95,927 95,185 96,216 95,776 1,308 1,628,293,880
Management of companies and enterprises 107 6,303 6,312 6,340 6,318 1,438 118,069,787
Administrative and support services 3,423 57,882 58,576 58,834 58,431 584 443,770,957
Waste management and remediation services 147 2,578 2,557 2,596 2,577 778 26,048,307
Education and Health Services 6,432 100,293 100,610 100,777 100,560 747 976,357,920
Educational services D D D D D DD
Ambulatory health care services 4,195 35,268 35,331 35,222 35,274 997 457,284,636
Hospitals 37 19,007 19,023 19,165 19,065 834 206,790,661
Nursing and residential care facilities 500 19,186 19,291 19,248 19,242 507 126,783,825
Social assistance D D D D D DD
Leisure and Hospitality 4,073 80,290 82,672 87,367 83,443 377 408,686,573
Performing arts and spectator sports 256 2,819 3,045 3,601 3,155 477 19,551,223
Museums, historical sites, zoos, and parks 23 314 321 335 323 483 2,026,699
Amusements, gambling, and recreation 408 8,801 9,140 11,937 9,959 317 40,981,696
Accommodation 192 9,570 9,678 9,928 9,725 996 125,861,526
Food services and drinking places 3,194 58,786 60,488 61,566 60,280 281 220,265,429
Other Services 9,692 37,035 37,110 37,368 37,171 599 289,439,522
Repair and maintenance 1,551 9,036 9,038 9,001 9,025 715 83,849,877
Personal and laundry services 1,394 11,803 11,887 11,847 11,846 450 69,351,289
Membership associations and organizations 879 10,014 10,052 10,385 10,150 826 109,039,146
Private households 5,868 6,182 6,133 6,135 6,150 340 27,199,210
UNCLASSIFIED 727 931 959 997 962 700 8,757,481
NOTE: D - indicates data does not meet agency disclosure standards.
SIZE CLASS
NUMBER OF
REPORTINGUNITS
MONTHLY EMPLOYMENT
FIRST SECOND THIRDTOTAL WAGES
TABLE II
STATE OF MARYLAND - PRIVATE ONLY
AVERAGEWEEKLY
WAGE PERWORKER
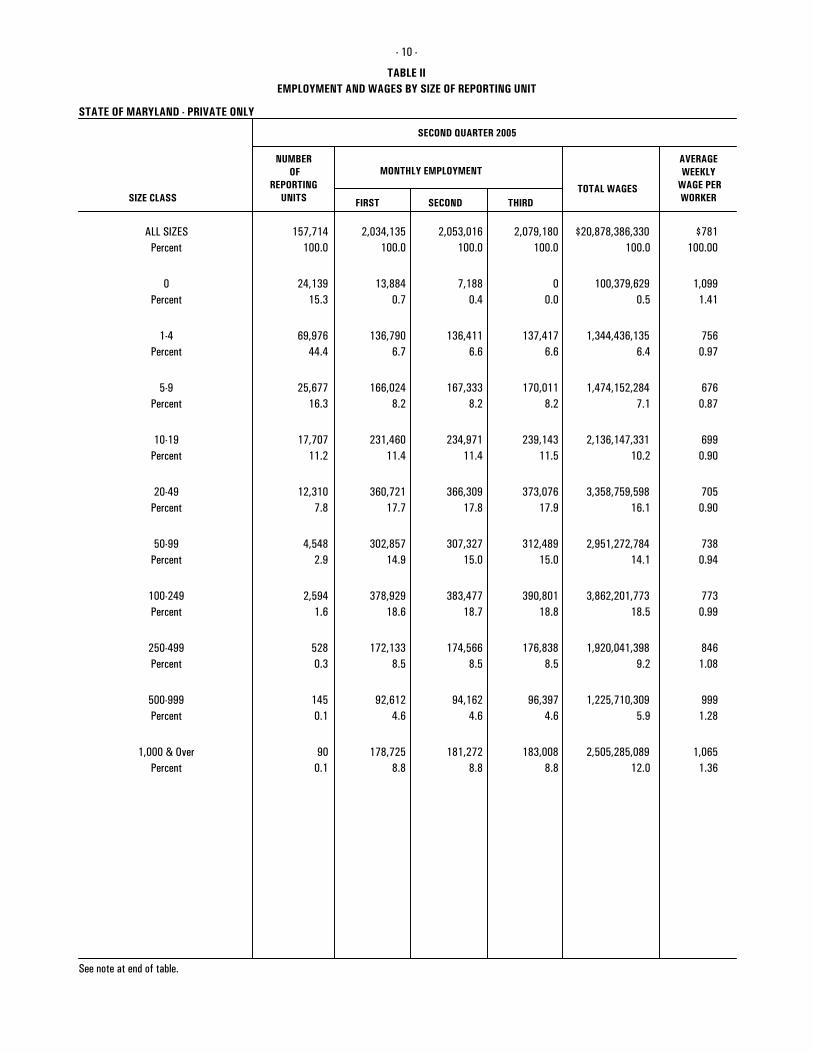
- 10 -
EMPLOYMENT AND WAGES BY SIZE OF REPORTING UNIT
SECOND QUARTER 2005
ALL SIZES 157,714 2,034,135 2,053,016 2,079,180 $781$20,878,386,330100.0 100.0 100.0 100.0 100.00100.0Percent
0 24,139 13,884 7,188 0 1,099100,379,629 15.3 0.7 0.4 0.0 1.41 0.5Percent
1-4 69,976 136,790 136,411 137,417 7561,344,436,135 44.4 6.7 6.6 6.6 0.97 6.4Percent
5-9 25,677 166,024 167,333 170,011 6761,474,152,284 16.3 8.2 8.2 8.2 0.87 7.1Percent
10-19 17,707 231,460 234,971 239,143 6992,136,147,331 11.2 11.4 11.4 11.5 0.90 10.2Percent
20-49 12,310 360,721 366,309 373,076 7053,358,759,598 7.8 17.7 17.8 17.9 0.90 16.1Percent
50-99 4,548 302,857 307,327 312,489 7382,951,272,784 2.9 14.9 15.0 15.0 0.94 14.1Percent
100-249 2,594 378,929 383,477 390,801 7733,862,201,773 1.6 18.6 18.7 18.8 0.99 18.5Percent
250-499 528 172,133 174,566 176,838 8461,920,041,398 0.3 8.5 8.5 8.5 1.08 9.2Percent
500-999 145 92,612 94,162 96,397 9991,225,710,309 0.1 4.6 4.6 4.6 1.28 5.9Percent
1,000 & Over 90 178,725 181,272 183,008 1,0652,505,285,089 0.1 8.8 8.8 8.8 1.36 12.0Percent
See note at end of table.
SIZE CLASS
NUMBER OF
REPORTINGUNITS
MONTHLY EMPLOYMENT
FIRST SECOND THIRDTOTAL WAGES
TABLE II
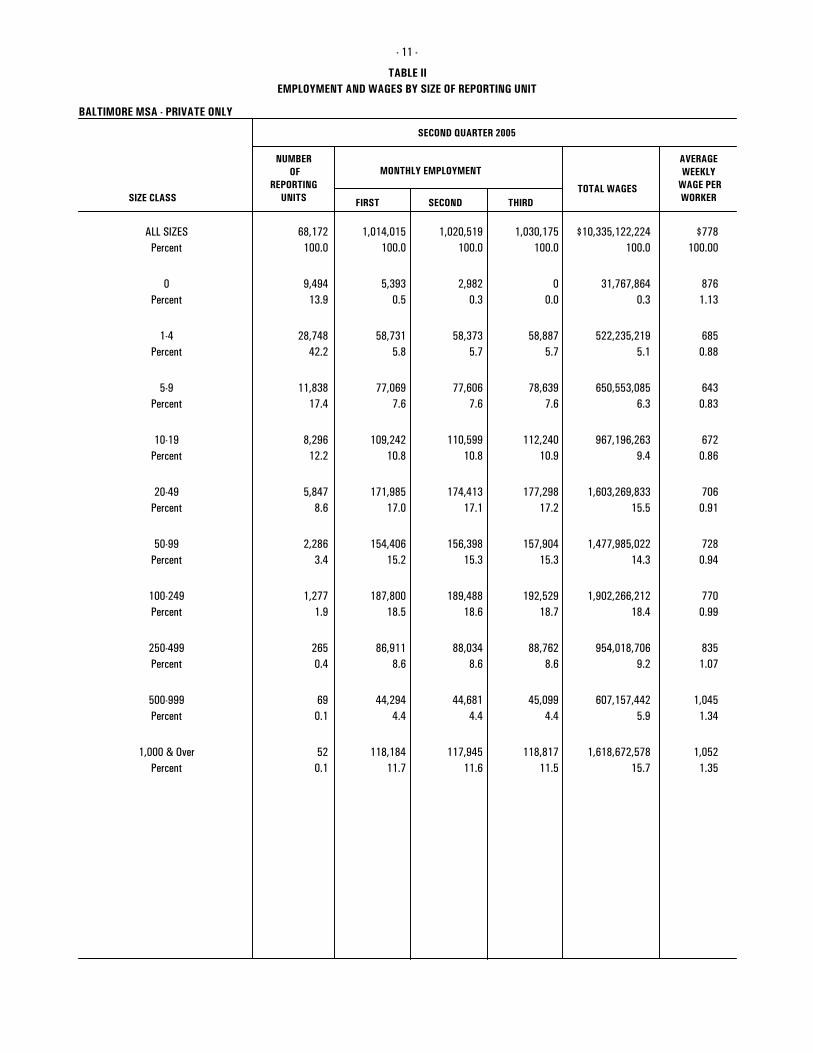
BALTIMORE MSA - PRIVATE ONLY
AVERAGEWEEKLY
WAGE PERWORKER
- 11 -
EMPLOYMENT AND WAGES BY SIZE OF REPORTING UNIT
SECOND QUARTER 2005
ALL SIZES 68,172 1,014,015 1,020,519 1,030,175 $778$10,335,122,224100.0 100.0 100.0 100.0 100.00100.0Percent
0 9,494 5,393 2,982 0 87631,767,864 13.9 0.5 0.3 0.0 1.13 0.3Percent
1-4 28,748 58,731 58,373 58,887 685522,235,219 42.2 5.8 5.7 5.7 0.88 5.1Percent
5-9 11,838 77,069 77,606 78,639 643650,553,085 17.4 7.6 7.6 7.6 0.83 6.3Percent
10-19 8,296 109,242 110,599 112,240 672967,196,263 12.2 10.8 10.8 10.9 0.86 9.4Percent
20-49 5,847 171,985 174,413 177,298 7061,603,269,833 8.6 17.0 17.1 17.2 0.91 15.5Percent
50-99 2,286 154,406 156,398 157,904 7281,477,985,022 3.4 15.2 15.3 15.3 0.94 14.3Percent
100-249 1,277 187,800 189,488 192,529 7701,902,266,212 1.9 18.5 18.6 18.7 0.99 18.4Percent
250-499 265 86,911 88,034 88,762 835954,018,706 0.4 8.6 8.6 8.6 1.07 9.2Percent
500-999 69 44,294 44,681 45,099 1,045607,157,442 0.1 4.4 4.4 4.4 1.34 5.9Percent
1,000 & Over 52 118,184 117,945 118,817 1,0521,618,672,578 0.1 11.7 11.6 11.5 1.35 15.7Percent
SIZE CLASS
NUMBER OF
REPORTINGUNITS
MONTHLY EMPLOYMENT
FIRST SECOND THIRDTOTAL WAGES
TABLE II
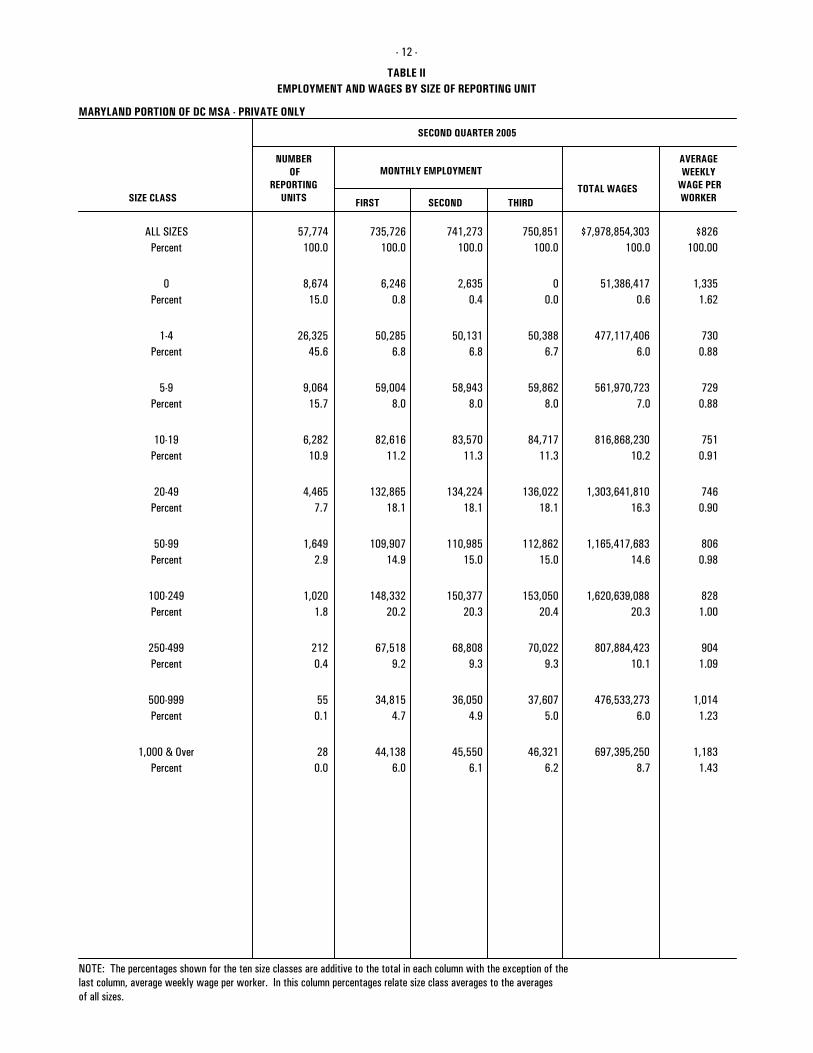
MARYLAND PORTION OF DC MSA - PRIVATE ONLY
AVERAGEWEEKLY
WAGE PERWORKER
- 12 -
EMPLOYMENT AND WAGES BY SIZE OF REPORTING UNIT
SECOND QUARTER 2005
ALL SIZES 57,774 735,726 741,273 750,851 $826$7,978,854,303100.0 100.0 100.0 100.0 100.00100.0Percent
0 8,674 6,246 2,635 0 1,33551,386,417 15.0 0.8 0.4 0.0 1.62 0.6Percent
1-4 26,325 50,285 50,131 50,388 730477,117,406 45.6 6.8 6.8 6.7 0.88 6.0Percent
5-9 9,064 59,004 58,943 59,862 729561,970,723 15.7 8.0 8.0 8.0 0.88 7.0Percent
10-19 6,282 82,616 83,570 84,717 751816,868,230 10.9 11.2 11.3 11.3 0.91 10.2Percent
20-49 4,465 132,865 134,224 136,022 7461,303,641,810 7.7 18.1 18.1 18.1 0.90 16.3Percent
50-99 1,649 109,907 110,985 112,862 8061,165,417,683 2.9 14.9 15.0 15.0 0.98 14.6Percent
100-249 1,020 148,332 150,377 153,050 8281,620,639,088 1.8 20.2 20.3 20.4 1.00 20.3Percent
250-499 212 67,518 68,808 70,022 904807,884,423 0.4 9.2 9.3 9.3 1.09 10.1Percent
500-999 55 34,815 36,050 37,607 1,014476,533,273 0.1 4.7 4.9 5.0 1.23 6.0Percent
1,000 & Over 28 44,138 45,550 46,321 1,183697,395,250 0.0 6.0 6.1 6.2 1.43 8.7Percent
NOTE: The percentages shown for the ten size classes are additive to the total in each column with the exception of thelast column, average weekly wage per worker. In this column percentages relate size class averages to the averagesof all sizes.
STATE BY COUNTYNUMBER
OFREPORTING
UNITS
MONTHLY EMPLOYMENT
FIRST SECOND THIRD
QUARTERLYAVERAGE
EMPLOYMENTTOTAL WAGES
TABLE III
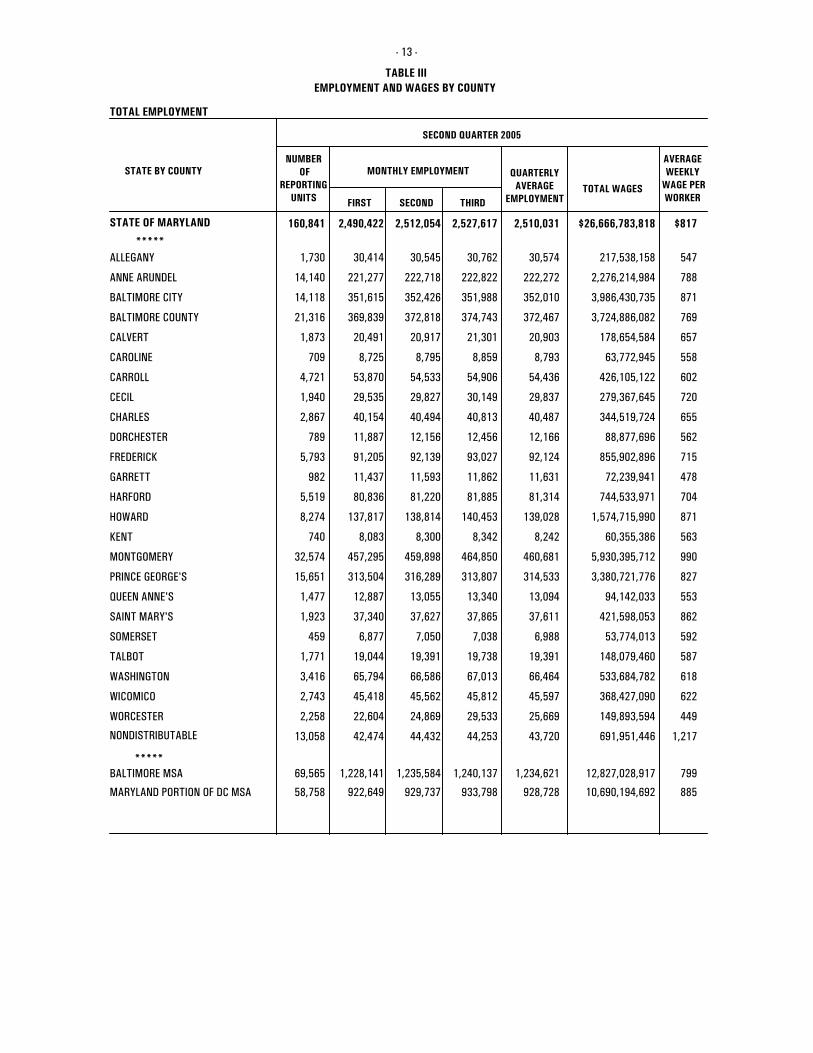
TOTAL EMPLOYMENT
AVERAGEWEEKLY
WAGE PERWORKER
STATE OF MARYLAND 160,841 2,490,422 2,512,054 2,527,617*****
2,510,031 $26,666,783,818
EMPLOYMENT AND WAGES BY COUNTY
$817
SECOND QUARTER 2005
- 13 -
1,730 30,414 30,545 30,762 30,574 217,538,158ALLEGANY 547
14,140 221,277 222,718 222,822 222,272 2,276,214,984ANNE ARUNDEL 788
14,118 351,615 352,426 351,988 352,010 3,986,430,735BALTIMORE CITY 871
21,316 369,839 372,818 374,743 372,467 3,724,886,082BALTIMORE COUNTY 769
1,873 20,491 20,917 21,301 20,903 178,654,584CALVERT 657
709 8,725 8,795 8,859 8,793 63,772,945CAROLINE 558
4,721 53,870 54,533 54,906 54,436 426,105,122CARROLL 602
1,940 29,535 29,827 30,149 29,837 279,367,645CECIL 720
2,867 40,154 40,494 40,813 40,487 344,519,724CHARLES 655
789 11,887 12,156 12,456 12,166 88,877,696DORCHESTER 562
5,793 91,205 92,139 93,027 92,124 855,902,896FREDERICK 715
982 11,437 11,593 11,862 11,631 72,239,941GARRETT 478
5,519 80,836 81,220 81,885 81,314 744,533,971HARFORD 704
8,274 137,817 138,814 140,453 139,028 1,574,715,990HOWARD 871
740 8,083 8,300 8,342 8,242 60,355,386KENT 563
32,574 457,295 459,898 464,850 460,681 5,930,395,712MONTGOMERY 990
15,651 313,504 316,289 313,807 314,533 3,380,721,776PRINCE GEORGE'S 827
1,477 12,887 13,055 13,340 13,094 94,142,033QUEEN ANNE'S 553
1,923 37,340 37,627 37,865 37,611 421,598,053SAINT MARY'S 862
459 6,877 7,050 7,038 6,988 53,774,013SOMERSET 592
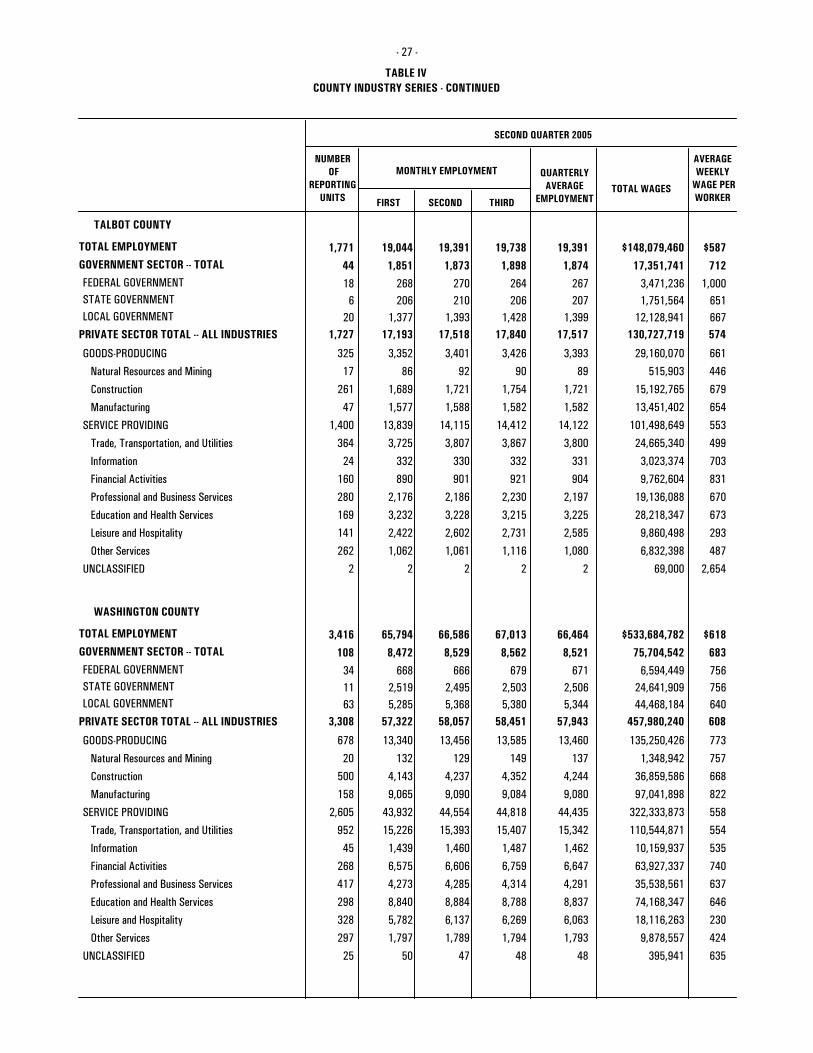
1,771 19,044 19,391 19,738 19,391 148,079,460TALBOT 587
3,416 65,794 66,586 67,013 66,464 533,684,782WASHINGTON 618
2,743 45,418 45,562 45,812 45,597 368,427,090WICOMICO 622
2,258 22,604 24,869 29,533 25,669 149,893,594WORCESTER 449
69,565 1,228,141 1,235,584 1,240,137 1,234,621 12,827,028,917
58,758 922,649 929,737 933,798 928,728 10,690,194,692
BALTIMORE MSA
MARYLAND PORTION OF DC MSA
*****
13,058 42,474 44,432 44,253 43,720 691,951,446NONDISTRIBUTABLE
799
885
1,217
STATE BY COUNTYNUMBER
OFREPORTING
UNITS
MONTHLY EMPLOYMENT
FIRST SECOND THIRD
QUARTERLYAVERAGE
EMPLOYMENTTOTAL WAGES
TABLE III
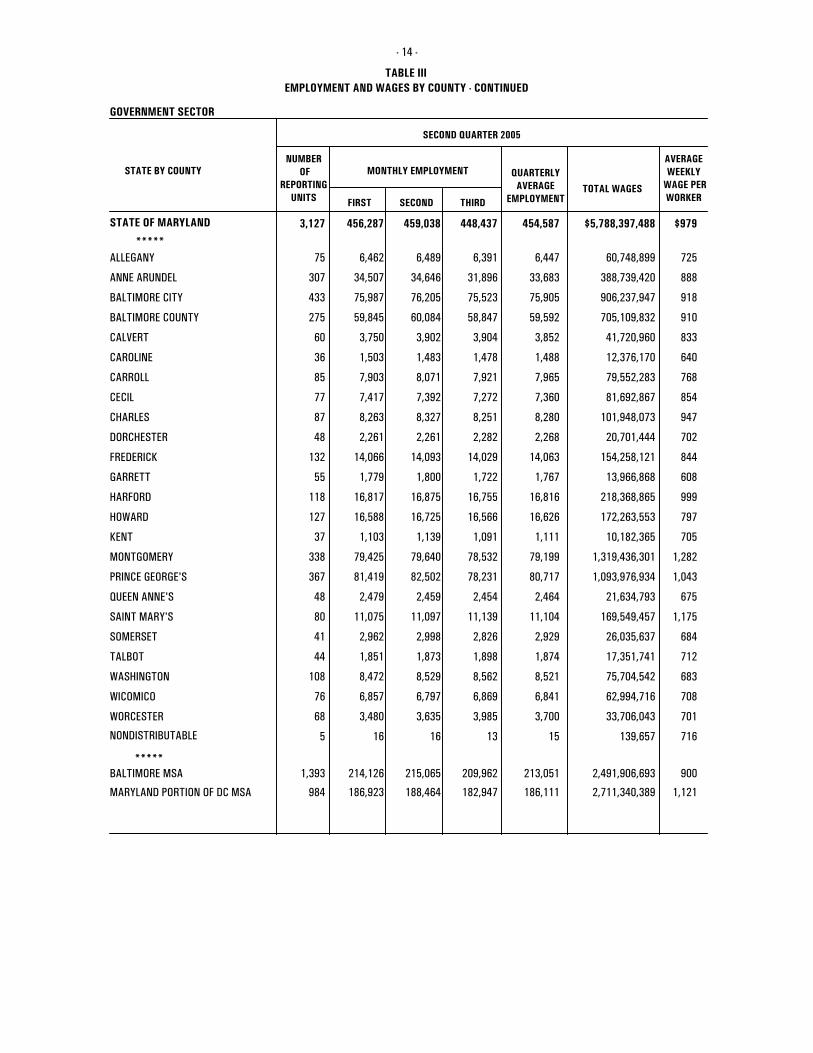
GOVERNMENT SECTOR
AVERAGEWEEKLY
WAGE PERWORKER
STATE OF MARYLAND 3,127 456,287 459,038 448,437
*****
454,587 $979 $5,788,397,488
EMPLOYMENT AND WAGES BY COUNTY - CONTINUED
SECOND QUARTER 2005
- 14 -
75 6,462 6,489 6,391 6,447 725 60,748,899ALLEGANY
307 34,507 34,646 31,896 33,683 888 388,739,420ANNE ARUNDEL
433 75,987 76,205 75,523 75,905 918 906,237,947BALTIMORE CITY
275 59,845 60,084 58,847 59,592 910 705,109,832BALTIMORE COUNTY
60 3,750 3,902 3,904 3,852 833 41,720,960CALVERT
36 1,503 1,483 1,478 1,488 640 12,376,170CAROLINE
85 7,903 8,071 7,921 7,965 768 79,552,283CARROLL
77 7,417 7,392 7,272 7,360 854 81,692,867CECIL
87 8,263 8,327 8,251 8,280 947 101,948,073CHARLES
48 2,261 2,261 2,282 2,268 702 20,701,444DORCHESTER
132 14,066 14,093 14,029 14,063 844 154,258,121FREDERICK
55 1,779 1,800 1,722 1,767 608 13,966,868GARRETT
118 16,817 16,875 16,755 16,816 999 218,368,865HARFORD
127 16,588 16,725 16,566 16,626 797 172,263,553HOWARD
37 1,103 1,139 1,091 1,111 705 10,182,365KENT
338 79,425 79,640 78,532 79,199 1,282 1,319,436,301MONTGOMERY
367 81,419 82,502 78,231 80,717 1,043 1,093,976,934PRINCE GEORGE'S
48 2,479 2,459 2,454 2,464 675 21,634,793QUEEN ANNE'S
80 11,075 11,097 11,139 11,104 1,175 169,549,457SAINT MARY'S
41 2,962 2,998 2,826 2,929 684 26,035,637SOMERSET
44 1,851 1,873 1,898 1,874 712 17,351,741TALBOT
108 8,472 8,529 8,562 8,521 683 75,704,542WASHINGTON
76 6,857 6,797 6,869 6,841 708 62,994,716WICOMICO
68 3,480 3,635 3,985 3,700 701 33,706,043WORCESTER
1,393 214,126 215,065 209,962 213,051 900 2,491,906,693
984 186,923 188,464 182,947 186,111 1,121 2,711,340,389
BALTIMORE MSA
MARYLAND PORTION OF DC MSA
*****
5 16 16 13 15 716 139,657NONDISTRIBUTABLE
STATE BY COUNTYNUMBER
OFREPORTING
UNITS
MONTHLY EMPLOYMENT
FIRST SECOND THIRD
QUARTERLYAVERAGE
EMPLOYMENTTOTAL WAGES
TABLE III
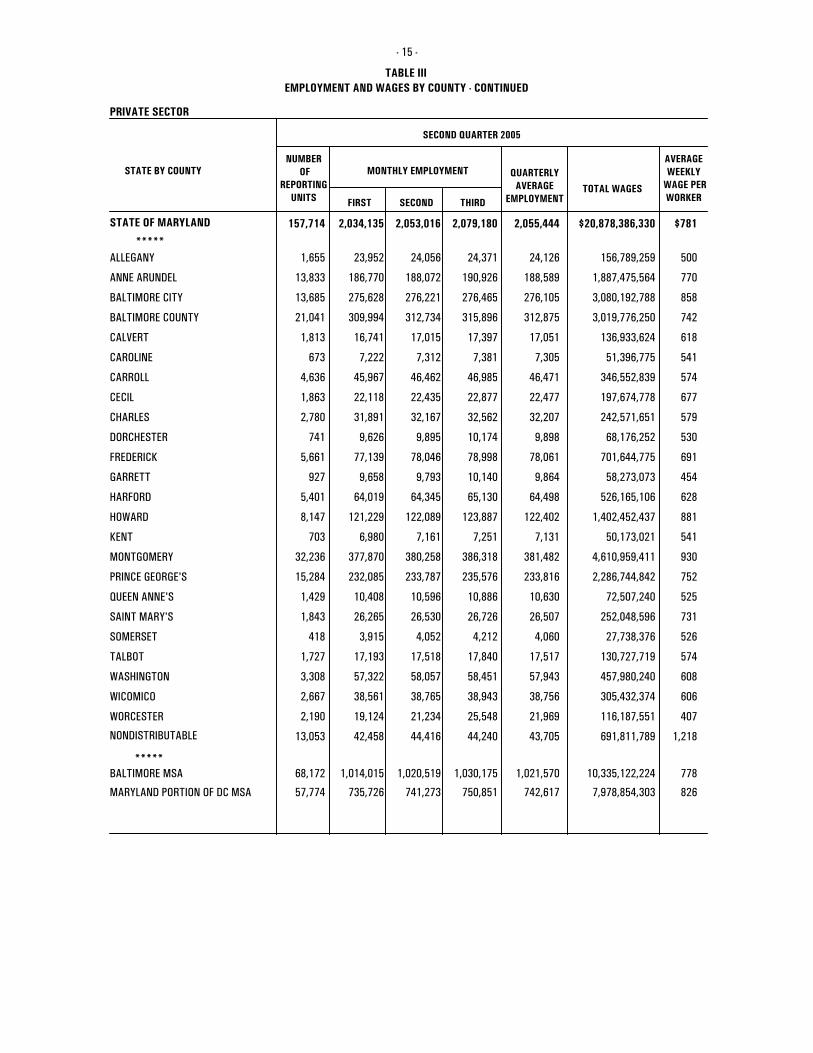
PRIVATE SECTOR
AVERAGEWEEKLY
WAGE PERWORKER
STATE OF MARYLAND 157,714 2,034,135 2,053,016 2,079,180
*****
2,055,444 $781$20,878,386,330
EMPLOYMENT AND WAGES BY COUNTY - CONTINUED
SECOND QUARTER 2005
- 15 -
1,655 23,952 24,056 24,371 24,126 500 156,789,259ALLEGANY
13,833 186,770 188,072 190,926 188,589 770 1,887,475,564ANNE ARUNDEL
13,685 275,628 276,221 276,465 276,105 858 3,080,192,788BALTIMORE CITY
21,041 309,994 312,734 315,896 312,875 742 3,019,776,250BALTIMORE COUNTY
1,813 16,741 17,015 17,397 17,051 618 136,933,624CALVERT
673 7,222 7,312 7,381 7,305 541 51,396,775CAROLINE
4,636 45,967 46,462 46,985 46,471 574 346,552,839CARROLL
1,863 22,118 22,435 22,877 22,477 677 197,674,778CECIL
2,780 31,891 32,167 32,562 32,207 579 242,571,651CHARLES
741 9,626 9,895 10,174 9,898 530 68,176,252DORCHESTER
5,661 77,139 78,046 78,998 78,061 691 701,644,775FREDERICK
927 9,658 9,793 10,140 9,864 454 58,273,073GARRETT
5,401 64,019 64,345 65,130 64,498 628 526,165,106HARFORD
8,147 121,229 122,089 123,887 122,402 881 1,402,452,437HOWARD
703 6,980 7,161 7,251 7,131 541 50,173,021KENT
32,236 377,870 380,258 386,318 381,482 930 4,610,959,411MONTGOMERY
15,284 232,085 233,787 235,576 233,816 752 2,286,744,842PRINCE GEORGE'S
1,429 10,408 10,596 10,886 10,630 525 72,507,240QUEEN ANNE'S
1,843 26,265 26,530 26,726 26,507 731 252,048,596SAINT MARY'S
418 3,915 4,052 4,212 4,060 526 27,738,376SOMERSET
1,727 17,193 17,518 17,840 17,517 574 130,727,719TALBOT
3,308 57,322 58,057 58,451 57,943 608 457,980,240WASHINGTON
2,667 38,561 38,765 38,943 38,756 606 305,432,374WICOMICO
2,190 19,124 21,234 25,548 21,969 407 116,187,551WORCESTER
68,172 1,014,015 1,020,519 1,030,175 1,021,570 77810,335,122,224
57,774 735,726 741,273 750,851 742,617 826 7,978,854,303
BALTIMORE MSA
MARYLAND PORTION OF DC MSA
*****
13,053 42,458 44,416 44,240 43,705 1,218 691,811,789NONDISTRIBUTABLE
NUMBER OF
REPORTINGUNITS
MONTHLY EMPLOYMENT
FIRST SECOND THIRD
QUARTERLYAVERAGE
EMPLOYMENTTOTAL WAGES
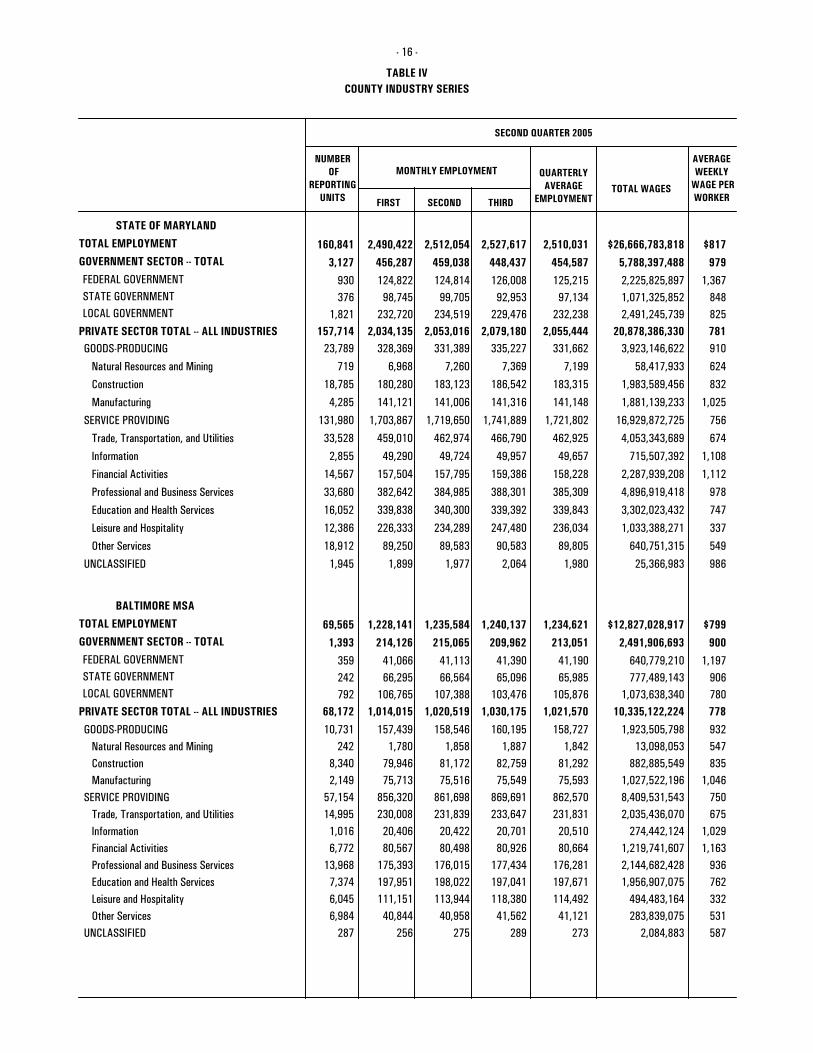
TABLE IV
AVERAGEWEEKLY
WAGE PERWORKER
TOTAL EMPLOYMENT
GOVERNMENT SECTOR -- TOTAL160,841 2,490,422 2,512,054 2,527,617
3,127 456,287 459,038 448,437
930 124,822 124,814 126,008 376 98,745 99,705 92,953 1,071,325,852
1,821 232,720 234,519 229,476
FEDERAL GOVERNMENTSTATE GOVERNMENTLOCAL GOVERNMENT
2,510,031
454,587
125,215 97,134
232,238
$817
979
1,367 848 825
- 16 -
COUNTY INDUSTRY SERIES
2,491,245,739
2,225,825,897
5,788,397,488
$26,666,783,818
157,714 2,034,135 2,053,016 2,079,180 2,055,444 781 20,878,386,330PRIVATE SECTOR TOTAL -- ALL INDUSTRIES
SECOND QUARTER 2005
STATE OF MARYLAND
GOODS-PRODUCING 23,789 328,369 331,389 335,227 331,662 910 3,923,146,622
Natural Resources and Mining 719 6,968 7,260 7,369 7,199 624 58,417,933
Construction 18,785 180,280 183,123 186,542 183,315 832 1,983,589,456
Manufacturing 4,285 141,121 141,006 141,316 141,148 1,025 1,881,139,233
SERVICE PROVIDING 131,980 1,703,867 1,719,650 1,741,889 1,721,802 75616,929,872,725
Trade, Transportation, and Utilities 33,528 459,010 462,974 466,790 462,925 674 4,053,343,689
Information 2,855 49,290 49,724 49,957 49,657 1,108 715,507,392
Financial Activities 14,567 157,504 157,795 159,386 158,228 1,112 2,287,939,208
Professional and Business Services 33,680 382,642 384,985 388,301 385,309 978 4,896,919,418
Education and Health Services 16,052 339,838 340,300 339,392 339,843 747 3,302,023,432
Leisure and Hospitality 12,386 226,333 234,289 247,480 236,034 337 1,033,388,271
Other Services 18,912 89,250 89,583 90,583 89,805 549 640,751,315
UNCLASSIFIED 1,945 1,899 1,977 2,064 1,980 986 25,366,983
TOTAL EMPLOYMENT
GOVERNMENT SECTOR -- TOTAL
FEDERAL GOVERNMENTSTATE GOVERNMENTLOCAL GOVERNMENT
PRIVATE SECTOR TOTAL -- ALL INDUSTRIES
BALTIMORE MSA
GOODS-PRODUCING 10,731 157,439 158,546 160,195 158,727 932 1,923,505,798 Natural Resources and Mining 242 1,780 1,858 1,887 1,842 547 13,098,053 Construction 8,340 79,946 81,172 82,759 81,292 835 882,885,549 Manufacturing 2,149 75,713 75,516 75,549 75,593 1,046 1,027,522,196SERVICE PROVIDING 57,154 856,320 861,698 869,691 862,570 750 8,409,531,543 Trade, Transportation, and Utilities 14,995 230,008 231,839 233,647 231,831 675 2,035,436,070 Information 1,016 20,406 20,422 20,701 20,510 1,029 274,442,124 Financial Activities 6,772 80,567 80,498 80,926 80,664 1,163 1,219,741,607 Professional and Business Services
287 256 275 289 273 587 2,084,883
Education and Health Services 13,968 175,393 176,015 177,434 176,281 936 2,144,682,428
Leisure and Hospitality 7,374 197,951 198,022 197,041 197,671 762 1,956,907,075
Other Services 6,045 111,151 113,944 118,380 114,492 332 494,483,164
UNCLASSIFIED 6,984 40,844 40,958 41,562 41,121 531 283,839,075
69,565 1,228,141 1,235,584 1,240,137
1,393 214,126 215,065 209,962
359 41,066 41,113 41,390 242 66,295 66,564 65,096 777,489,143 792 106,765 107,388 103,476
1,234,621
213,051
41,190 65,985
105,876
$799
900
1,197 906 780 1,073,638,340
640,779,210
2,491,906,693
$12,827,028,917
68,172 1,014,015 1,020,519 1,030,175 1,021,570 778 10,335,122,224
NUMBER OF
REPORTINGUNITS
MONTHLY EMPLOYMENT
FIRST SECOND THIRD
QUARTERLYAVERAGE
EMPLOYMENTTOTAL WAGES
TABLE IV
AVERAGEWEEKLY
WAGE PERWORKER
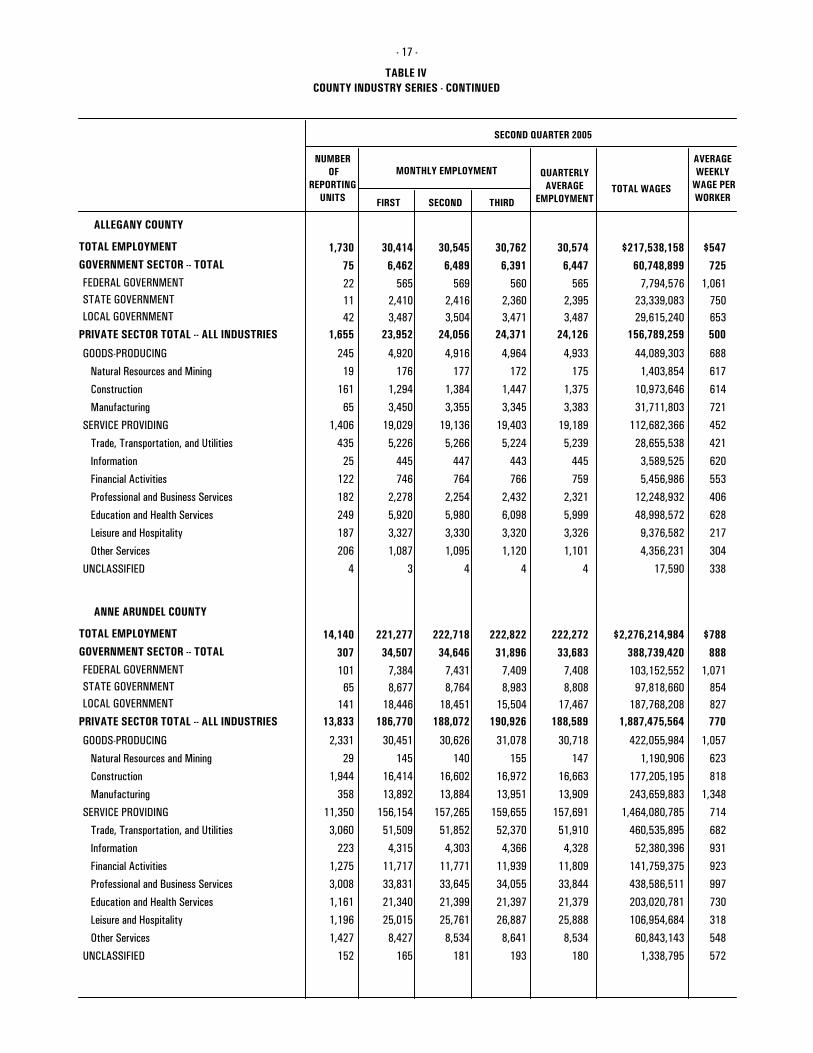
COUNTY INDUSTRY SERIES - CONTINUED
SECOND QUARTER 2005
- 17 -
TOTAL EMPLOYMENT
GOVERNMENT SECTOR -- TOTAL 1,730 30,414 30,545 30,762
75 6,462 6,489 6,391
22 565 569 560 11 2,410 2,416 2,360 23,339,083
FEDERAL GOVERNMENTSTATE GOVERNMENTLOCAL GOVERNMENT
30,574
6,447
565 2,395
$547
725
1,061 750
7,794,576
60,748,899
$217,538,158
1,655 23,952 24,056 24,371 24,126 500 156,789,259 42 3,487 3,504 3,471 29,615,240 3,487 653
ALLEGANY COUNTY
PRIVATE SECTOR TOTAL -- ALL INDUSTRIES
GOODS-PRODUCING 245 4,920 4,916 4,964 4,933 688 44,089,303
Natural Resources and Mining 19 176 177 172 175 617 1,403,854
Construction 161 1,294 1,384 1,447 1,375 614 10,973,646
Manufacturing 65 3,450 3,355 3,345 3,383 721 31,711,803
SERVICE PROVIDING 1,406 19,029 19,136 19,403 19,189 452 112,682,366
Trade, Transportation, and Utilities 435 5,226 5,266 5,224 5,239 421 28,655,538
Information 25 445 447 443 445 620 3,589,525
Financial Activities 122 746 764 766 759 553 5,456,986
Professional and Business Services 182 2,278 2,254 2,432 2,321 406 12,248,932
Education and Health Services 249 5,920 5,980 6,098 5,999 628 48,998,572
Leisure and Hospitality 187 3,327 3,330 3,320 3,326 217 9,376,582
Other Services 206 1,087 1,095 1,120 1,101 304 4,356,231
UNCLASSIFIED 4 3 4 4 4 338 17,590
TOTAL EMPLOYMENT
GOVERNMENT SECTOR -- TOTAL 14,140 221,277 222,718 222,822
307 34,507 34,646 31,896
101 7,384 7,431 7,409 65 8,677 8,764 8,983 97,818,660
FEDERAL GOVERNMENTSTATE GOVERNMENTLOCAL GOVERNMENT
222,272
33,683
7,408 8,808
$788
888
1,071 854
103,152,552
388,739,420
$2,276,214,984
13,833 186,770 188,072 190,926 188,589 770 1,887,475,564 141 18,446 18,451 15,504 187,768,208 17,467 827
ANNE ARUNDEL COUNTY
PRIVATE SECTOR TOTAL -- ALL INDUSTRIES
GOODS-PRODUCING 2,331 30,451 30,626 31,078 30,718 1,057 422,055,984
Natural Resources and Mining 29 145 140 155 147 623 1,190,906
Construction 1,944 16,414 16,602 16,972 16,663 818 177,205,195
Manufacturing 358 13,892 13,884 13,951 13,909 1,348 243,659,883
SERVICE PROVIDING 11,350 156,154 157,265 159,655 157,691 714 1,464,080,785
Trade, Transportation, and Utilities 3,060 51,509 51,852 52,370 51,910 682 460,535,895
Information 223 4,315 4,303 4,366 4,328 931 52,380,396
Financial Activities 1,275 11,717 11,771 11,939 11,809 923 141,759,375
Professional and Business Services 3,008 33,831 33,645 34,055 33,844 997 438,586,511
Education and Health Services 1,161 21,340 21,399 21,397 21,379 730 203,020,781
Leisure and Hospitality 1,196 25,015 25,761 26,887 25,888 318 106,954,684
Other Services 1,427 8,427 8,534 8,641 8,534 548 60,843,143
UNCLASSIFIED 152 165 181 193 180 572 1,338,795
NUMBER OF
REPORTINGUNITS
MONTHLY EMPLOYMENT
FIRST SECOND THIRD
QUARTERLYAVERAGE
EMPLOYMENTTOTAL WAGES
TABLE IV
AVERAGEWEEKLY
WAGE PERWORKER
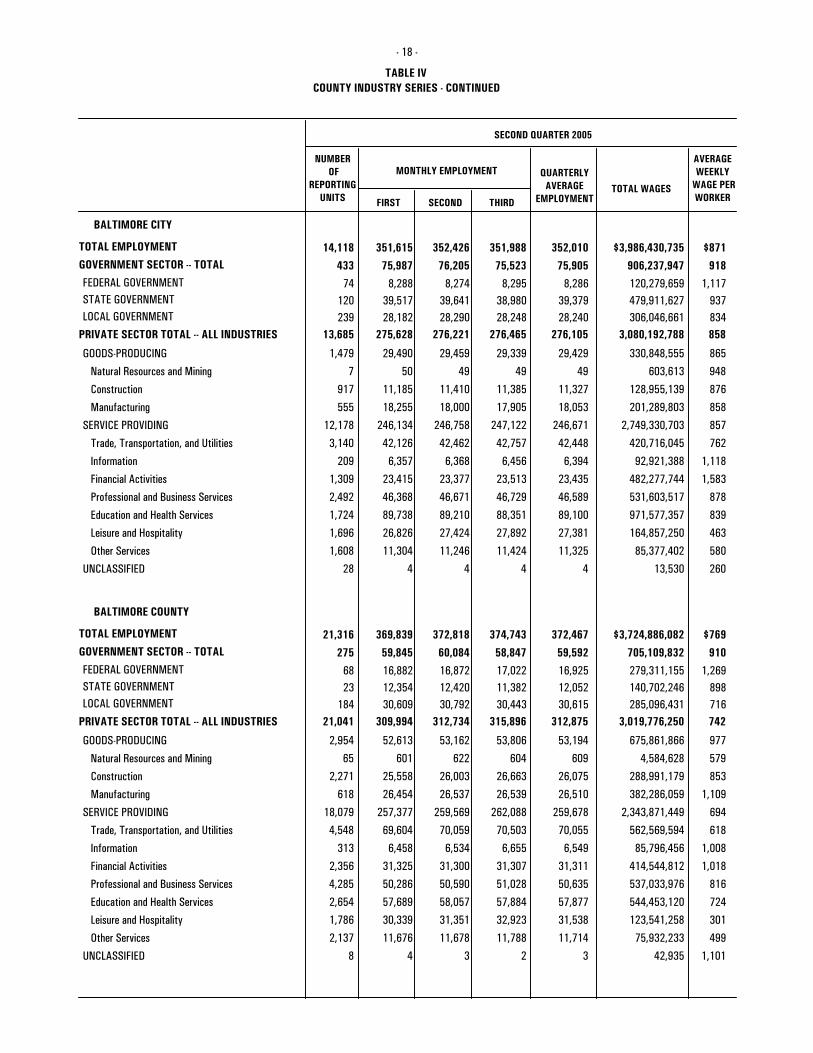
COUNTY INDUSTRY SERIES - CONTINUED
SECOND QUARTER 2005
- 18 -
TOTAL EMPLOYMENT
GOVERNMENT SECTOR -- TOTAL 14,118 351,615 352,426 351,988
433 75,987 76,205 75,523
74 8,288 8,274 8,295 120 39,517 39,641 38,980 479,911,627
FEDERAL GOVERNMENTSTATE GOVERNMENTLOCAL GOVERNMENT
352,010
75,905
8,286 39,379
$871
918
1,117 937
120,279,659
906,237,947
$3,986,430,735
13,685 275,628 276,221 276,465 276,105 858 3,080,192,788 239 28,182 28,290 28,248 306,046,661 28,240 834
BALTIMORE CITY
PRIVATE SECTOR TOTAL -- ALL INDUSTRIES
GOODS-PRODUCING 1,479 29,490 29,459 29,339 29,429 865 330,848,555
Natural Resources and Mining 7 50 49 49 49 948 603,613
Construction 917 11,185 11,410 11,385 11,327 876 128,955,139
Manufacturing 555 18,255 18,000 17,905 18,053 858 201,289,803
SERVICE PROVIDING 12,178 246,134 246,758 247,122 246,671 857 2,749,330,703
Trade, Transportation, and Utilities 3,140 42,126 42,462 42,757 42,448 762 420,716,045
Information 209 6,357 6,368 6,456 6,394 1,118 92,921,388
Financial Activities 1,309 23,415 23,377 23,513 23,435 1,583 482,277,744
Professional and Business Services 2,492 46,368 46,671 46,729 46,589 878 531,603,517
Education and Health Services 1,724 89,738 89,210 88,351 89,100 839 971,577,357
Leisure and Hospitality 1,696 26,826 27,424 27,892 27,381 463 164,857,250
Other Services 1,608 11,304 11,246 11,424 11,325 580 85,377,402
UNCLASSIFIED 28 4 4 4 4 260 13,530
TOTAL EMPLOYMENT
GOVERNMENT SECTOR -- TOTAL 21,316 369,839 372,818 374,743
275 59,845 60,084 58,847
68 16,882 16,872 17,022 23 12,354 12,420 11,382 140,702,246
FEDERAL GOVERNMENTSTATE GOVERNMENTLOCAL GOVERNMENT
372,467
59,592
16,925 12,052
$769
910
1,269 898
279,311,155
705,109,832
$3,724,886,082
21,041 309,994 312,734 315,896 312,875 742 3,019,776,250 184 30,609 30,792 30,443 285,096,431 30,615 716
BALTIMORE COUNTY
PRIVATE SECTOR TOTAL -- ALL INDUSTRIES
GOODS-PRODUCING 2,954 52,613 53,162 53,806 53,194 977 675,861,866
Natural Resources and Mining 65 601 622 604 609 579 4,584,628
Construction 2,271 25,558 26,003 26,663 26,075 853 288,991,179
Manufacturing 618 26,454 26,537 26,539 26,510 1,109 382,286,059
SERVICE PROVIDING 18,079 257,377 259,569 262,088 259,678 694 2,343,871,449
Trade, Transportation, and Utilities 4,548 69,604 70,059 70,503 70,055 618 562,569,594
Information 313 6,458 6,534 6,655 6,549 1,008 85,796,456
Financial Activities 2,356 31,325 31,300 31,307 31,311 1,018 414,544,812
Professional and Business Services 4,285 50,286 50,590 51,028 50,635 816 537,033,976
Education and Health Services 2,654 57,689 58,057 57,884 57,877 724 544,453,120
Leisure and Hospitality 1,786 30,339 31,351 32,923 31,538 301 123,541,258
Other Services 2,137 11,676 11,678 11,788 11,714 499 75,932,233
UNCLASSIFIED 8 4 3 2 3 1,101 42,935
NUMBER OF
REPORTINGUNITS
MONTHLY EMPLOYMENT
FIRST SECOND THIRD
QUARTERLYAVERAGE
EMPLOYMENTTOTAL WAGES
TABLE IV
AVERAGEWEEKLY
WAGE PERWORKER
COUNTY INDUSTRY SERIES - CONTINUED
SECOND QUARTER 2005
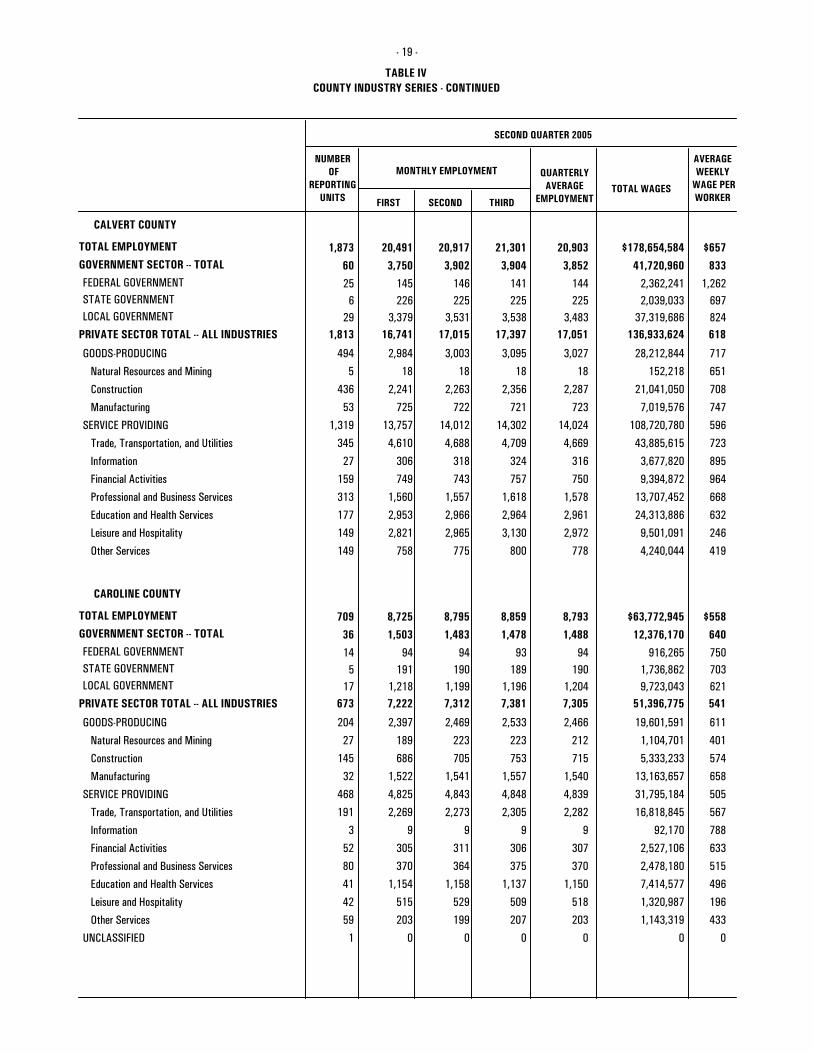
- 19 -
TOTAL EMPLOYMENT
GOVERNMENT SECTOR -- TOTAL 1,873 20,491 20,917 21,301
60 3,750 3,902 3,904
25 145 146 141 6 226 225 225 2,039,033
FEDERAL GOVERNMENTSTATE GOVERNMENTLOCAL GOVERNMENT
20,903
3,852
144 225
$657
833
1,262 697
2,362,241
41,720,960
$178,654,584
1,813 16,741 17,015 17,397 17,051 618 136,933,624 29 3,379 3,531 3,538 37,319,686 3,483 824
CALVERT COUNTY
PRIVATE SECTOR TOTAL -- ALL INDUSTRIES
GOODS-PRODUCING 494 2,984 3,003 3,095 3,027 717 28,212,844
Natural Resources and Mining 5 18 18 18 18 651 152,218
Construction 436 2,241 2,263 2,356 2,287 708 21,041,050
Manufacturing 53 725 722 721 723 747 7,019,576
SERVICE PROVIDING 1,319 13,757 14,012 14,302 14,024 596 108,720,780
Trade, Transportation, and Utilities 345 4,610 4,688 4,709 4,669 723 43,885,615
Information 27 306 318 324 316 895 3,677,820
Financial Activities 159 749 743 757 750 964 9,394,872
Professional and Business Services 313 1,560 1,557 1,618 1,578 668 13,707,452
Education and Health Services 177 2,953 2,966 2,964 2,961 632 24,313,886
Leisure and Hospitality 149 2,821 2,965 3,130 2,972 246 9,501,091
Other Services 149 758 775 800 778 419 4,240,044
TOTAL EMPLOYMENT
GOVERNMENT SECTOR -- TOTAL 709 8,725 8,795 8,859
36 1,503 1,483 1,478
14 94 94 93 5 191 190 189 1,736,862
FEDERAL GOVERNMENTSTATE GOVERNMENTLOCAL GOVERNMENT
8,793
1,488
94 190
$558
640
750 703
916,265
12,376,170
$63,772,945
673 7,222 7,312 7,381 7,305 541 51,396,775 17 1,218 1,199 1,196 9,723,043 1,204 621
CAROLINE COUNTY
PRIVATE SECTOR TOTAL -- ALL INDUSTRIES
GOODS-PRODUCING 204 2,397 2,469 2,533 2,466 611 19,601,591
Natural Resources and Mining 27 189 223 223 212 401 1,104,701
Construction 145 686 705 753 715 574 5,333,233
Manufacturing 32 1,522 1,541 1,557 1,540 658 13,163,657
SERVICE PROVIDING 468 4,825 4,843 4,848 4,839 505 31,795,184
Trade, Transportation, and Utilities 191 2,269 2,273 2,305 2,282 567 16,818,845
Information 3 9 9 9 9 788 92,170
Financial Activities 52 305 311 306 307 633 2,527,106
Professional and Business Services 80 370 364 375 370 515 2,478,180
Education and Health Services 41 1,154 1,158 1,137 1,150 496 7,414,577
Leisure and Hospitality 42 515 529 509 518 196 1,320,987
Other Services 59 203 199 207 203 433 1,143,319
UNCLASSIFIED 1 0 0 0 0 0 0
NUMBER OF
REPORTINGUNITS
MONTHLY EMPLOYMENT
FIRST SECOND THIRD
QUARTERLYAVERAGE
EMPLOYMENTTOTAL WAGES
TABLE IV
AVERAGEWEEKLY
WAGE PERWORKER
COUNTY INDUSTRY SERIES - CONTINUED
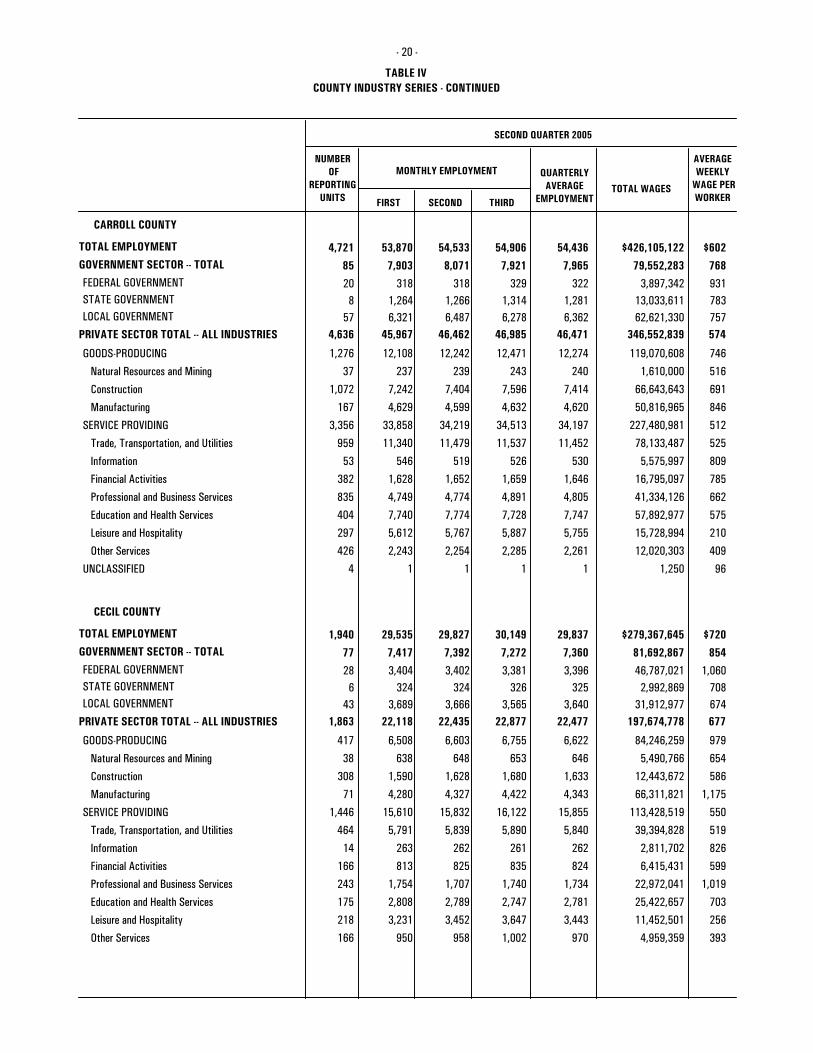
SECOND QUARTER 2005
- 20 -
TOTAL EMPLOYMENT
GOVERNMENT SECTOR -- TOTAL 4,721 53,870 54,533 54,906
85 7,903 8,071 7,921
20 318 318 329 8 1,264 1,266 1,314 13,033,611
FEDERAL GOVERNMENTSTATE GOVERNMENTLOCAL GOVERNMENT
54,436
7,965
322 1,281
$602
768
931 783
3,897,342
79,552,283
$426,105,122
4,636 45,967 46,462 46,985 46,471 574 346,552,839 57 6,321 6,487 6,278 62,621,330 6,362 757
CARROLL COUNTY
PRIVATE SECTOR TOTAL -- ALL INDUSTRIES
GOODS-PRODUCING 1,276 12,108 12,242 12,471 12,274 746 119,070,608
Natural Resources and Mining 37 237 239 243 240 516 1,610,000
Construction 1,072 7,242 7,404 7,596 7,414 691 66,643,643
Manufacturing 167 4,629 4,599 4,632 4,620 846 50,816,965
SERVICE PROVIDING 3,356 33,858 34,219 34,513 34,197 512 227,480,981
Trade, Transportation, and Utilities 959 11,340 11,479 11,537 11,452 525 78,133,487
Information 53 546 519 526 530 809 5,575,997
Financial Activities 382 1,628 1,652 1,659 1,646 785 16,795,097
Professional and Business Services 835 4,749 4,774 4,891 4,805 662 41,334,126
Education and Health Services 404 7,740 7,774 7,728 7,747 575 57,892,977
Leisure and Hospitality 297 5,612 5,767 5,887 5,755 210 15,728,994
Other Services 426 2,243 2,254 2,285 2,261 409 12,020,303
UNCLASSIFIED 4 1 1 1 1 96 1,250
TOTAL EMPLOYMENT
GOVERNMENT SECTOR -- TOTAL 1,940 29,535 29,827 30,149
77 7,417 7,392 7,272
28 3,404 3,402 3,381 6 324 324 326 2,992,869
FEDERAL GOVERNMENTSTATE GOVERNMENTLOCAL GOVERNMENT
29,837
7,360
3,396 325
$720
854
1,060 708
46,787,021
81,692,867
$279,367,645
1,863 22,118 22,435 22,877 22,477 677 197,674,778 43 3,689 3,666 3,565 31,912,977 3,640 674
CECIL COUNTY
PRIVATE SECTOR TOTAL -- ALL INDUSTRIES
GOODS-PRODUCING 417 6,508 6,603 6,755 6,622 979 84,246,259
Natural Resources and Mining 38 638 648 653 646 654 5,490,766
Construction 308 1,590 1,628 1,680 1,633 586 12,443,672
Manufacturing 71 4,280 4,327 4,422 4,343 1,175 66,311,821
SERVICE PROVIDING 1,446 15,610 15,832 16,122 15,855 550 113,428,519
Trade, Transportation, and Utilities 464 5,791 5,839 5,890 5,840 519 39,394,828
Information 14 263 262 261 262 826 2,811,702
Financial Activities 166 813 825 835 824 599 6,415,431
Professional and Business Services 243 1,754 1,707 1,740 1,734 1,019 22,972,041
Education and Health Services 175 2,808 2,789 2,747 2,781 703 25,422,657
Leisure and Hospitality 218 3,231 3,452 3,647 3,443 256 11,452,501
Other Services 166 950 958 1,002 970 393 4,959,359
NUMBER OF
REPORTINGUNITS
MONTHLY EMPLOYMENT
FIRST SECOND THIRD
QUARTERLYAVERAGE
EMPLOYMENTTOTAL WAGES
TABLE IV
AVERAGEWEEKLY
WAGE PERWORKER
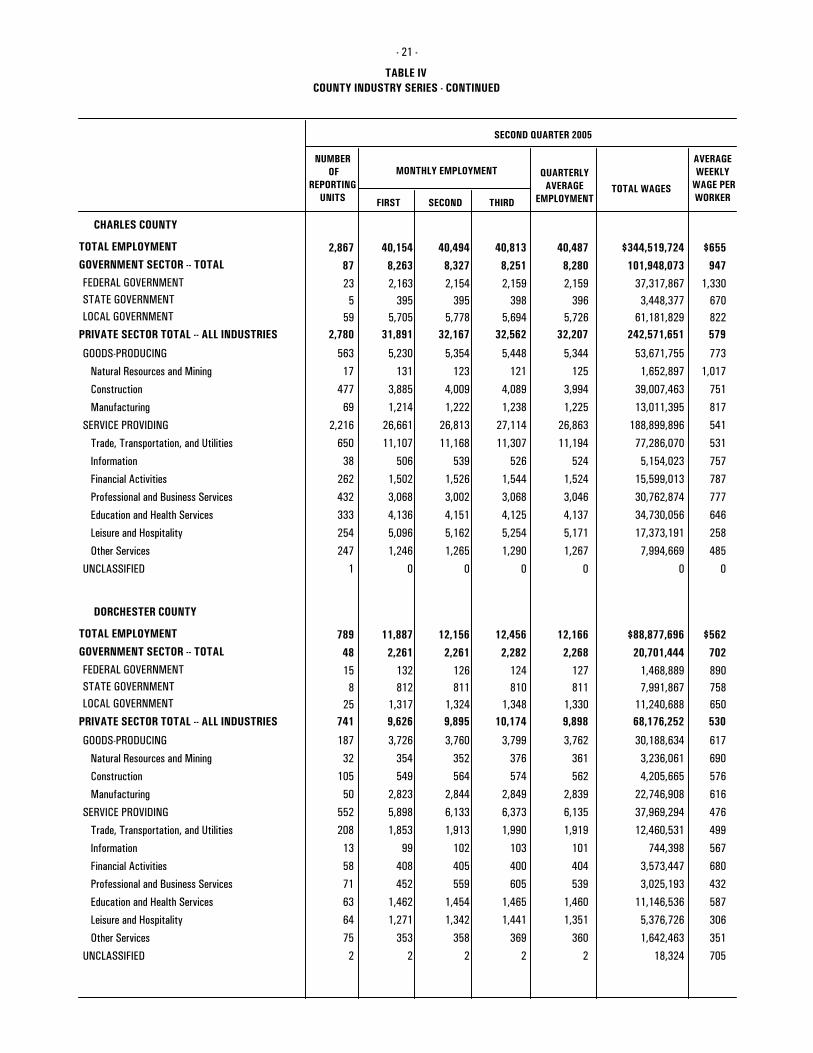
COUNTY INDUSTRY SERIES - CONTINUED
SECOND QUARTER 2005
- 21 -
TOTAL EMPLOYMENT
GOVERNMENT SECTOR -- TOTAL 2,867 40,154 40,494 40,813
87 8,263 8,327 8,251
23 2,163 2,154 2,159 5 395 395 398 3,448,377
FEDERAL GOVERNMENTSTATE GOVERNMENTLOCAL GOVERNMENT
40,487
8,280
2,159 396
$655
947
1,330 670
37,317,867
101,948,073
$344,519,724
2,780 31,891 32,167 32,562 32,207 579 242,571,651 59 5,705 5,778 5,694 61,181,829 5,726 822
CHARLES COUNTY
PRIVATE SECTOR TOTAL -- ALL INDUSTRIES
GOODS-PRODUCING 563 5,230 5,354 5,448 5,344 773 53,671,755
Natural Resources and Mining 17 131 123 121 125 1,017 1,652,897
Construction 477 3,885 4,009 4,089 3,994 751 39,007,463
Manufacturing 69 1,214 1,222 1,238 1,225 817 13,011,395
SERVICE PROVIDING 2,216 26,661 26,813 27,114 26,863 541 188,899,896
Trade, Transportation, and Utilities 650 11,107 11,168 11,307 11,194 531 77,286,070
Information 38 506 539 526 524 757 5,154,023
Financial Activities 262 1,502 1,526 1,544 1,524 787 15,599,013
Professional and Business Services 432 3,068 3,002 3,068 3,046 777 30,762,874
Education and Health Services 333 4,136 4,151 4,125 4,137 646 34,730,056
Leisure and Hospitality 254 5,096 5,162 5,254 5,171 258 17,373,191
Other Services 247 1,246 1,265 1,290 1,267 485 7,994,669
UNCLASSIFIED 1 0 0 0 0 0 0
TOTAL EMPLOYMENT
GOVERNMENT SECTOR -- TOTAL 789 11,887 12,156 12,456
48 2,261 2,261 2,282
15 132 126 124 8 812 811 810 7,991,867
FEDERAL GOVERNMENTSTATE GOVERNMENTLOCAL GOVERNMENT
12,166
2,268
127 811
$562
702
890 758
1,468,889
20,701,444
$88,877,696
741 9,626 9,895 10,174 9,898 530 68,176,252 25 1,317 1,324 1,348 11,240,688 1,330 650
DORCHESTER COUNTY
PRIVATE SECTOR TOTAL -- ALL INDUSTRIES
GOODS-PRODUCING 187 3,726 3,760 3,799 3,762 617 30,188,634
Natural Resources and Mining 32 354 352 376 361 690 3,236,061
Construction 105 549 564 574 562 576 4,205,665
Manufacturing 50 2,823 2,844 2,849 2,839 616 22,746,908
SERVICE PROVIDING 552 5,898 6,133 6,373 6,135 476 37,969,294
Trade, Transportation, and Utilities 208 1,853 1,913 1,990 1,919 499 12,460,531
Information 13 99 102 103 101 567 744,398
Financial Activities 58 408 405 400 404 680 3,573,447
Professional and Business Services 71 452 559 605 539 432 3,025,193
Education and Health Services 63 1,462 1,454 1,465 1,460 587 11,146,536
Leisure and Hospitality 64 1,271 1,342 1,441 1,351 306 5,376,726
Other Services 75 353 358 369 360 351 1,642,463
UNCLASSIFIED 2 2 2 2 2 705 18,324
NUMBER OF
REPORTINGUNITS
MONTHLY EMPLOYMENT
FIRST SECOND THIRD
QUARTERLYAVERAGE
EMPLOYMENTTOTAL WAGES
TABLE IV
AVERAGEWEEKLY
WAGE PERWORKER
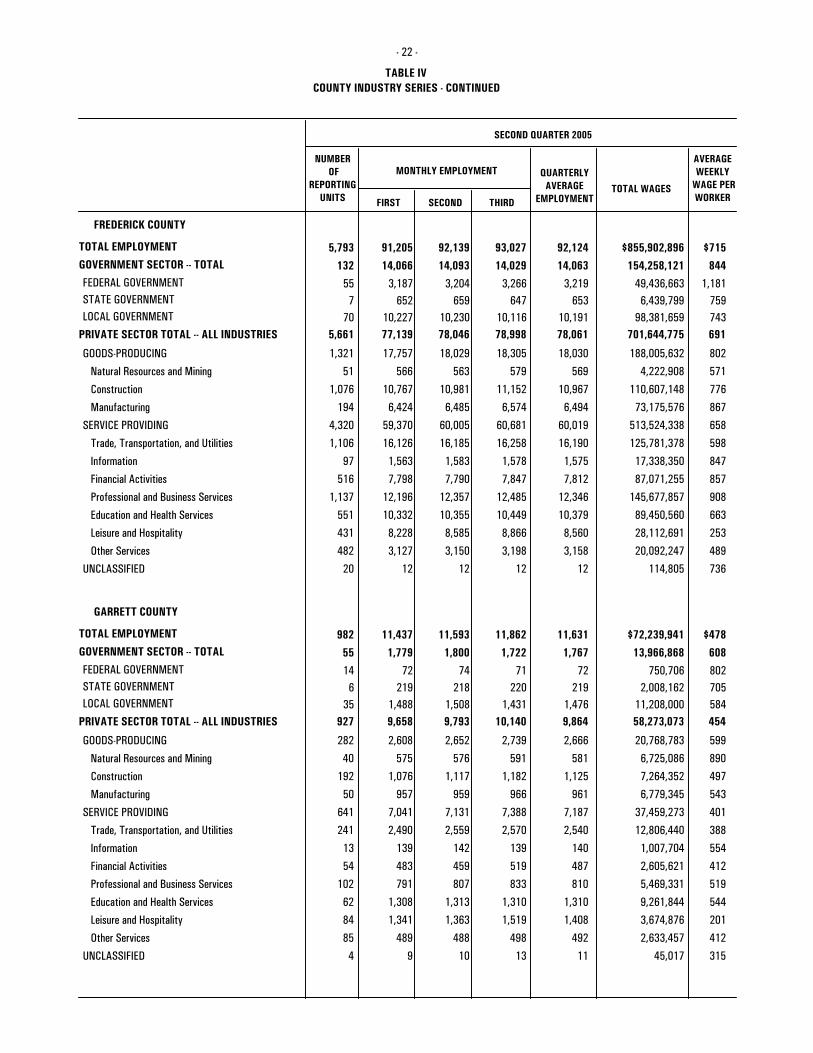
COUNTY INDUSTRY SERIES - CONTINUED
SECOND QUARTER 2005
- 22 -
TOTAL EMPLOYMENT
GOVERNMENT SECTOR -- TOTAL 5,793 91,205 92,139 93,027
132 14,066 14,093 14,029
55 3,187 3,204 3,266 7 652 659 647 6,439,799
FEDERAL GOVERNMENTSTATE GOVERNMENTLOCAL GOVERNMENT
92,124
14,063
3,219 653
$715
844
1,181 759
49,436,663
154,258,121
$855,902,896
5,661 77,139 78,046 78,998 78,061 691 701,644,775 70 10,227 10,230 10,116 98,381,659 10,191 743
FREDERICK COUNTY
PRIVATE SECTOR TOTAL -- ALL INDUSTRIES
GOODS-PRODUCING 1,321 17,757 18,029 18,305 18,030 802 188,005,632
Natural Resources and Mining 51 566 563 579 569 571 4,222,908
Construction 1,076 10,767 10,981 11,152 10,967 776 110,607,148
Manufacturing 194 6,424 6,485 6,574 6,494 867 73,175,576
SERVICE PROVIDING 4,320 59,370 60,005 60,681 60,019 658 513,524,338
Trade, Transportation, and Utilities 1,106 16,126 16,185 16,258 16,190 598 125,781,378
Information 97 1,563 1,583 1,578 1,575 847 17,338,350
Financial Activities 516 7,798 7,790 7,847 7,812 857 87,071,255
Professional and Business Services 1,137 12,196 12,357 12,485 12,346 908 145,677,857
Education and Health Services 551 10,332 10,355 10,449 10,379 663 89,450,560
Leisure and Hospitality 431 8,228 8,585 8,866 8,560 253 28,112,691
Other Services 482 3,127 3,150 3,198 3,158 489 20,092,247
UNCLASSIFIED 20 12 12 12 12 736 114,805
TOTAL EMPLOYMENT
GOVERNMENT SECTOR -- TOTAL 982 11,437 11,593 11,862
55 1,779 1,800 1,722
14 72 74 71 6 219 218 220 2,008,162
FEDERAL GOVERNMENTSTATE GOVERNMENTLOCAL GOVERNMENT
11,631
1,767
72 219
$478
608
802 705
750,706
13,966,868
$72,239,941
927 9,658 9,793 10,140 9,864 454 58,273,073 35 1,488 1,508 1,431 11,208,000 1,476 584
GARRETT COUNTY
PRIVATE SECTOR TOTAL -- ALL INDUSTRIES
GOODS-PRODUCING 282 2,608 2,652 2,739 2,666 599 20,768,783
Natural Resources and Mining 40 575 576 591 581 890 6,725,086
Construction 192 1,076 1,117 1,182 1,125 497 7,264,352
Manufacturing 50 957 959 966 961 543 6,779,345
SERVICE PROVIDING 641 7,041 7,131 7,388 7,187 401 37,459,273
Trade, Transportation, and Utilities 241 2,490 2,559 2,570 2,540 388 12,806,440
Information 13 139 142 139 140 554 1,007,704
Financial Activities 54 483 459 519 487 412 2,605,621
Professional and Business Services 102 791 807 833 810 519 5,469,331
Education and Health Services 62 1,308 1,313 1,310 1,310 544 9,261,844
Leisure and Hospitality 84 1,341 1,363 1,519 1,408 201 3,674,876
Other Services 85 489 488 498 492 412 2,633,457
UNCLASSIFIED 4 9 10 13 11 315 45,017
NUMBER OF
REPORTINGUNITS
MONTHLY EMPLOYMENT
FIRST SECOND THIRD
QUARTERLYAVERAGE
EMPLOYMENTTOTAL WAGES
TABLE IV
AVERAGEWEEKLY
WAGE PERWORKER
COUNTY INDUSTRY SERIES - CONTINUED
SECOND QUARTER 2005
- 23 -
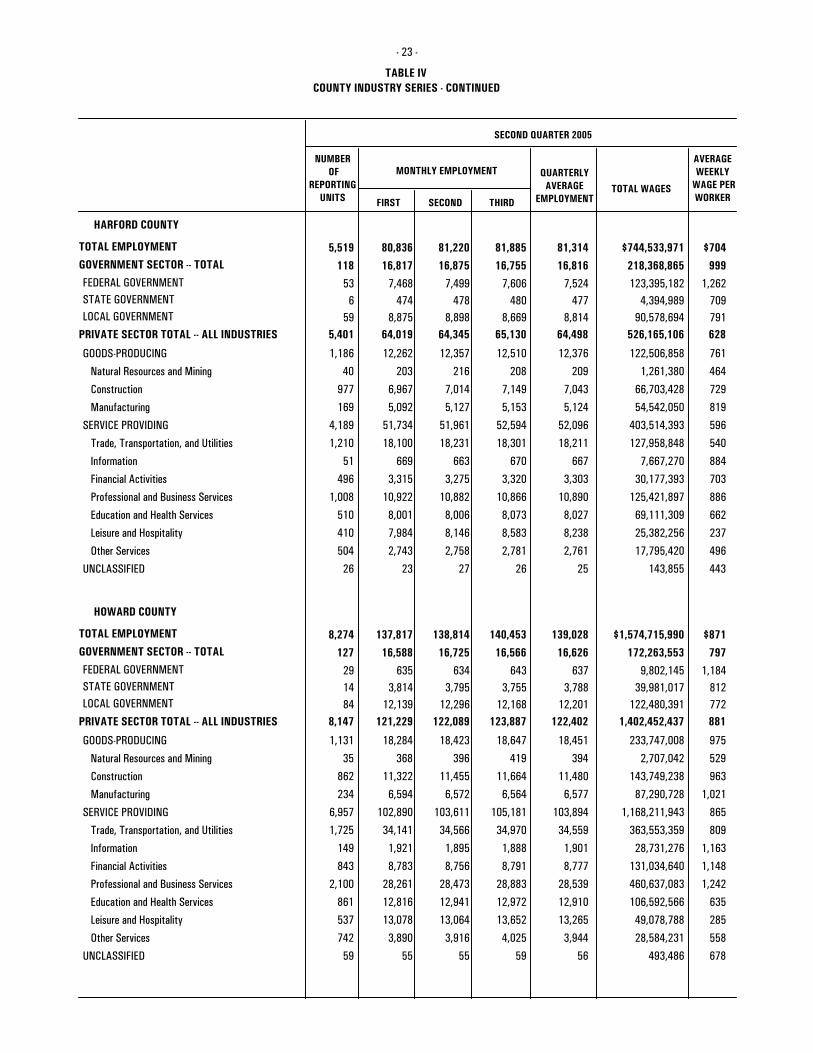
TOTAL EMPLOYMENT
GOVERNMENT SECTOR -- TOTAL 5,519 80,836 81,220 81,885
118 16,817 16,875 16,755
53 7,468 7,499 7,606 6 474 478 480 4,394,989
FEDERAL GOVERNMENTSTATE GOVERNMENTLOCAL GOVERNMENT
81,314
16,816
7,524 477
$704
999
1,262 709
123,395,182
218,368,865
$744,533,971
5,401 64,019 64,345 65,130 64,498 628 526,165,106 59 8,875 8,898 8,669 90,578,694 8,814 791
HARFORD COUNTY
PRIVATE SECTOR TOTAL -- ALL INDUSTRIES
GOODS-PRODUCING 1,186 12,262 12,357 12,510 12,376 761 122,506,858
Natural Resources and Mining 40 203 216 208 209 464 1,261,380
Construction 977 6,967 7,014 7,149 7,043 729 66,703,428
Manufacturing 169 5,092 5,127 5,153 5,124 819 54,542,050
SERVICE PROVIDING 4,189 51,734 51,961 52,594 52,096 596 403,514,393
Trade, Transportation, and Utilities 1,210 18,100 18,231 18,301 18,211 540 127,958,848
Information 51 669 663 670 667 884 7,667,270
Financial Activities 496 3,315 3,275 3,320 3,303 703 30,177,393
Professional and Business Services 1,008 10,922 10,882 10,866 10,890 886 125,421,897
Education and Health Services 510 8,001 8,006 8,073 8,027 662 69,111,309
Leisure and Hospitality 410 7,984 8,146 8,583 8,238 237 25,382,256
Other Services 504 2,743 2,758 2,781 2,761 496 17,795,420
UNCLASSIFIED 26 23 27 26 25 443 143,855
TOTAL EMPLOYMENT
GOVERNMENT SECTOR -- TOTAL 8,274 137,817 138,814 140,453
127 16,588 16,725 16,566
29 635 634 643 14 3,814 3,795 3,755 39,981,017
FEDERAL GOVERNMENTSTATE GOVERNMENTLOCAL GOVERNMENT
139,028
16,626
637 3,788
$871
797
1,184 812
9,802,145
172,263,553
$1,574,715,990
8,147 121,229 122,089 123,887 122,402 881 1,402,452,437 84 12,139 12,296 12,168 122,480,391 12,201 772
HOWARD COUNTY
PRIVATE SECTOR TOTAL -- ALL INDUSTRIES
GOODS-PRODUCING 1,131 18,284 18,423 18,647 18,451 975 233,747,008
Natural Resources and Mining 35 368 396 419 394 529 2,707,042
Construction 862 11,322 11,455 11,664 11,480 963 143,749,238
Manufacturing 234 6,594 6,572 6,564 6,577 1,021 87,290,728
SERVICE PROVIDING 6,957 102,890 103,611 105,181 103,894 865 1,168,211,943
Trade, Transportation, and Utilities 1,725 34,141 34,566 34,970 34,559 809 363,553,359
Information 149 1,921 1,895 1,888 1,901 1,163 28,731,276
Financial Activities 843 8,783 8,756 8,791 8,777 1,148 131,034,640
Professional and Business Services 2,100 28,261 28,473 28,883 28,539 1,242 460,637,083
Education and Health Services 861 12,816 12,941 12,972 12,910 635 106,592,566
Leisure and Hospitality 537 13,078 13,064 13,652 13,265 285 49,078,788
Other Services 742 3,890 3,916 4,025 3,944 558 28,584,231
UNCLASSIFIED 59 55 55 59 56 678 493,486
NUMBER OF
REPORTINGUNITS
MONTHLY EMPLOYMENT
FIRST SECOND THIRD
QUARTERLYAVERAGE
EMPLOYMENTTOTAL WAGES
TABLE IV
AVERAGEWEEKLY
WAGE PERWORKER
COUNTY INDUSTRY SERIES - CONTINUED
SECOND QUARTER 2005
- 24 -
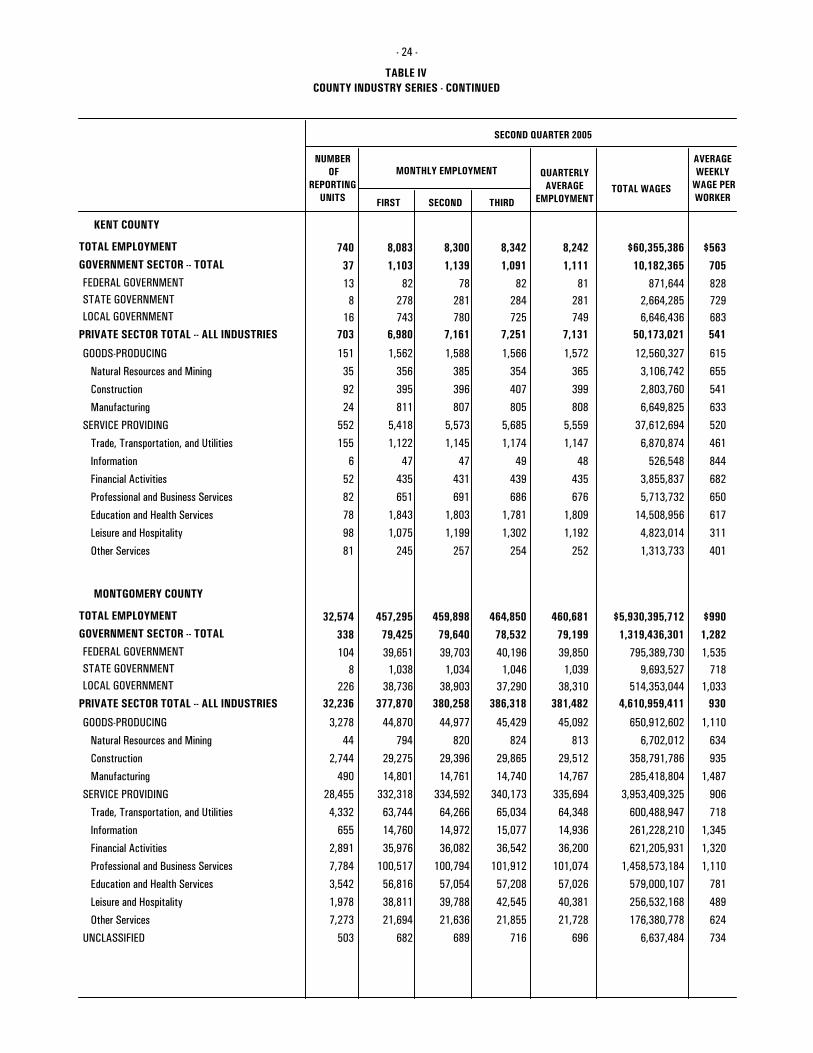
TOTAL EMPLOYMENT
GOVERNMENT SECTOR -- TOTAL 740 8,083 8,300 8,342
37 1,103 1,139 1,091
13 82 78 82 8 278 281 284 2,664,285
FEDERAL GOVERNMENTSTATE GOVERNMENTLOCAL GOVERNMENT
8,242
1,111
81 281
$563
705
828 729
871,644
10,182,365
$60,355,386
703 6,980 7,161 7,251 7,131 541 50,173,021 16 743 780 725 6,646,436 749 683
KENT COUNTY
PRIVATE SECTOR TOTAL -- ALL INDUSTRIES
GOODS-PRODUCING 151 1,562 1,588 1,566 1,572 615 12,560,327
Natural Resources and Mining 35 356 385 354 365 655 3,106,742
Construction 92 395 396 407 399 541 2,803,760
Manufacturing 24 811 807 805 808 633 6,649,825
SERVICE PROVIDING 552 5,418 5,573 5,685 5,559 520 37,612,694
Trade, Transportation, and Utilities 155 1,122 1,145 1,174 1,147 461 6,870,874
Information 6 47 47 49 48 844 526,548
Financial Activities 52 435 431 439 435 682 3,855,837
Professional and Business Services 82 651 691 686 676 650 5,713,732
Education and Health Services 78 1,843 1,803 1,781 1,809 617 14,508,956
Leisure and Hospitality 98 1,075 1,199 1,302 1,192 311 4,823,014
Other Services 81 245 257 254 252 401 1,313,733
TOTAL EMPLOYMENT
GOVERNMENT SECTOR -- TOTAL 32,574 457,295 459,898 464,850
338 79,425 79,640 78,532
104 39,651 39,703 40,196 8 1,038 1,034 1,046 9,693,527
FEDERAL GOVERNMENTSTATE GOVERNMENTLOCAL GOVERNMENT
460,681
79,199
39,850 1,039
$990
1,282
1,535 718
795,389,730
1,319,436,301
$5,930,395,712
32,236 377,870 380,258 386,318 381,482 930 4,610,959,411 226 38,736 38,903 37,290 514,353,044 38,310 1,033
MONTGOMERY COUNTY
PRIVATE SECTOR TOTAL -- ALL INDUSTRIES
GOODS-PRODUCING 3,278 44,870 44,977 45,429 45,092 1,110 650,912,602
Natural Resources and Mining 44 794 820 824 813 634 6,702,012
Construction 2,744 29,275 29,396 29,865 29,512 935 358,791,786
Manufacturing 490 14,801 14,761 14,740 14,767 1,487 285,418,804
SERVICE PROVIDING 28,455 332,318 334,592 340,173 335,694 906 3,953,409,325
Trade, Transportation, and Utilities 4,332 63,744 64,266 65,034 64,348 718 600,488,947
Information 655 14,760 14,972 15,077 14,936 1,345 261,228,210
Financial Activities 2,891 35,976 36,082 36,542 36,200 1,320 621,205,931
Professional and Business Services 7,784 100,517 100,794 101,912 101,074 1,110 1,458,573,184
Education and Health Services 3,542 56,816 57,054 57,208 57,026 781 579,000,107
Leisure and Hospitality 1,978 38,811 39,788 42,545 40,381 489 256,532,168
Other Services 7,273 21,694 21,636 21,855 21,728 624 176,380,778
UNCLASSIFIED 503 682 689 716 696 734 6,637,484
NUMBER OF
REPORTINGUNITS
MONTHLY EMPLOYMENT
FIRST SECOND THIRD
QUARTERLYAVERAGE
EMPLOYMENTTOTAL WAGES
TABLE IV
AVERAGEWEEKLY
WAGE PERWORKER
COUNTY INDUSTRY SERIES - CONTINUED
SECOND QUARTER 2005
- 25 -
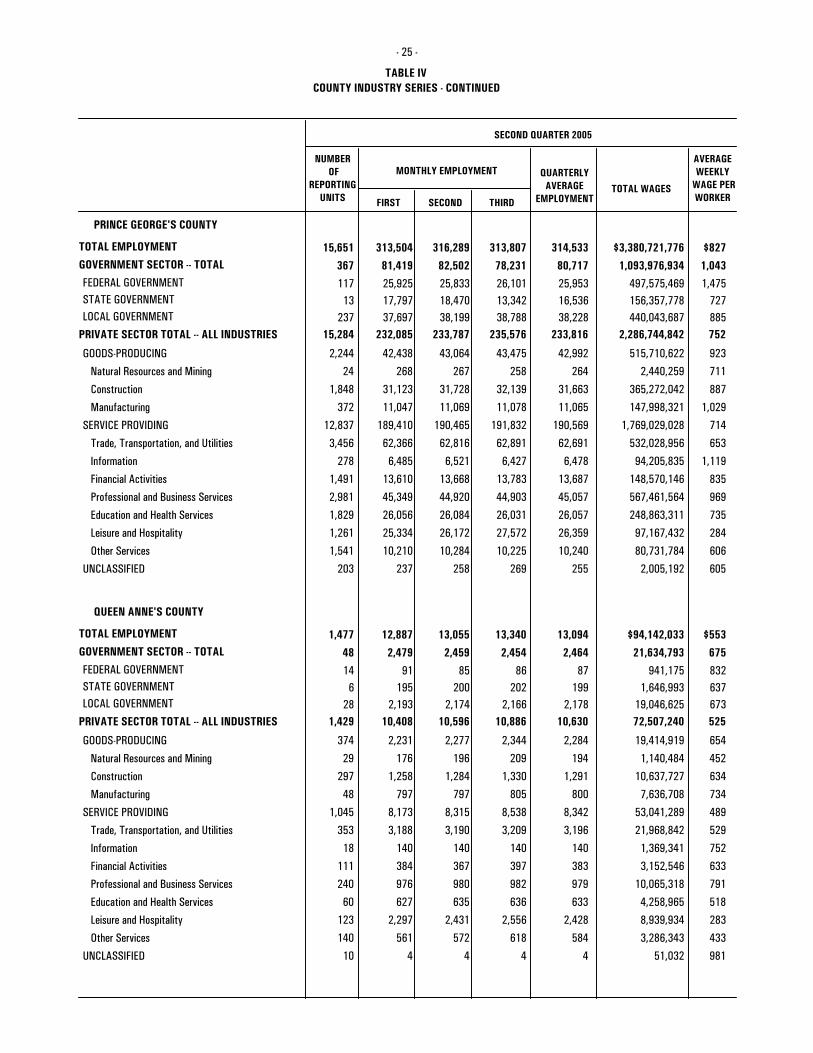
TOTAL EMPLOYMENT
GOVERNMENT SECTOR -- TOTAL 15,651 313,504 316,289 313,807
367 81,419 82,502 78,231
117 25,925 25,833 26,101 13 17,797 18,470 13,342 156,357,778
FEDERAL GOVERNMENTSTATE GOVERNMENTLOCAL GOVERNMENT
314,533
80,717
25,953 16,536
$827
1,043
1,475 727
497,575,469
1,093,976,934
$3,380,721,776
15,284 232,085 233,787 235,576 233,816 752 2,286,744,842 237 37,697 38,199 38,788 440,043,687 38,228 885
PRINCE GEORGE'S COUNTY
PRIVATE SECTOR TOTAL -- ALL INDUSTRIES
GOODS-PRODUCING 2,244 42,438 43,064 43,475 42,992 923 515,710,622
Natural Resources and Mining 24 268 267 258 264 711 2,440,259
Construction 1,848 31,123 31,728 32,139 31,663 887 365,272,042
Manufacturing 372 11,047 11,069 11,078 11,065 1,029 147,998,321
SERVICE PROVIDING 12,837 189,410 190,465 191,832 190,569 714 1,769,029,028
Trade, Transportation, and Utilities 3,456 62,366 62,816 62,891 62,691 653 532,028,956
Information 278 6,485 6,521 6,427 6,478 1,119 94,205,835
Financial Activities 1,491 13,610 13,668 13,783 13,687 835 148,570,146
Professional and Business Services 2,981 45,349 44,920 44,903 45,057 969 567,461,564
Education and Health Services 1,829 26,056 26,084 26,031 26,057 735 248,863,311
Leisure and Hospitality 1,261 25,334 26,172 27,572 26,359 284 97,167,432
Other Services 1,541 10,210 10,284 10,225 10,240 606 80,731,784
UNCLASSIFIED 203 237 258 269 255 605 2,005,192
TOTAL EMPLOYMENT
GOVERNMENT SECTOR -- TOTAL 1,477 12,887 13,055 13,340
48 2,479 2,459 2,454
14 91 85 86 6 195 200 202 1,646,993
FEDERAL GOVERNMENTSTATE GOVERNMENTLOCAL GOVERNMENT
13,094
2,464
87 199
$553
675
832 637
941,175
21,634,793
$94,142,033
1,429 10,408 10,596 10,886 10,630 525 72,507,240 28 2,193 2,174 2,166 19,046,625 2,178 673
QUEEN ANNE'S COUNTY
PRIVATE SECTOR TOTAL -- ALL INDUSTRIES
GOODS-PRODUCING 374 2,231 2,277 2,344 2,284 654 19,414,919
Natural Resources and Mining 29 176 196 209 194 452 1,140,484
Construction 297 1,258 1,284 1,330 1,291 634 10,637,727
Manufacturing 48 797 797 805 800 734 7,636,708
SERVICE PROVIDING 1,045 8,173 8,315 8,538 8,342 489 53,041,289
Trade, Transportation, and Utilities 353 3,188 3,190 3,209 3,196 529 21,968,842
Information 18 140 140 140 140 752 1,369,341
Financial Activities 111 384 367 397 383 633 3,152,546
Professional and Business Services 240 976 980 982 979 791 10,065,318
Education and Health Services 60 627 635 636 633 518 4,258,965
Leisure and Hospitality 123 2,297 2,431 2,556 2,428 283 8,939,934
Other Services 140 561 572 618 584 433 3,286,343
UNCLASSIFIED 10 4 4 4 4 981 51,032
NUMBER OF
REPORTINGUNITS
MONTHLY EMPLOYMENT
FIRST SECOND THIRD
QUARTERLYAVERAGE
EMPLOYMENTTOTAL WAGES
TABLE IV
AVERAGEWEEKLY
WAGE PERWORKER
COUNTY INDUSTRY SERIES - CONTINUED
SECOND QUARTER 2005
- 26 -
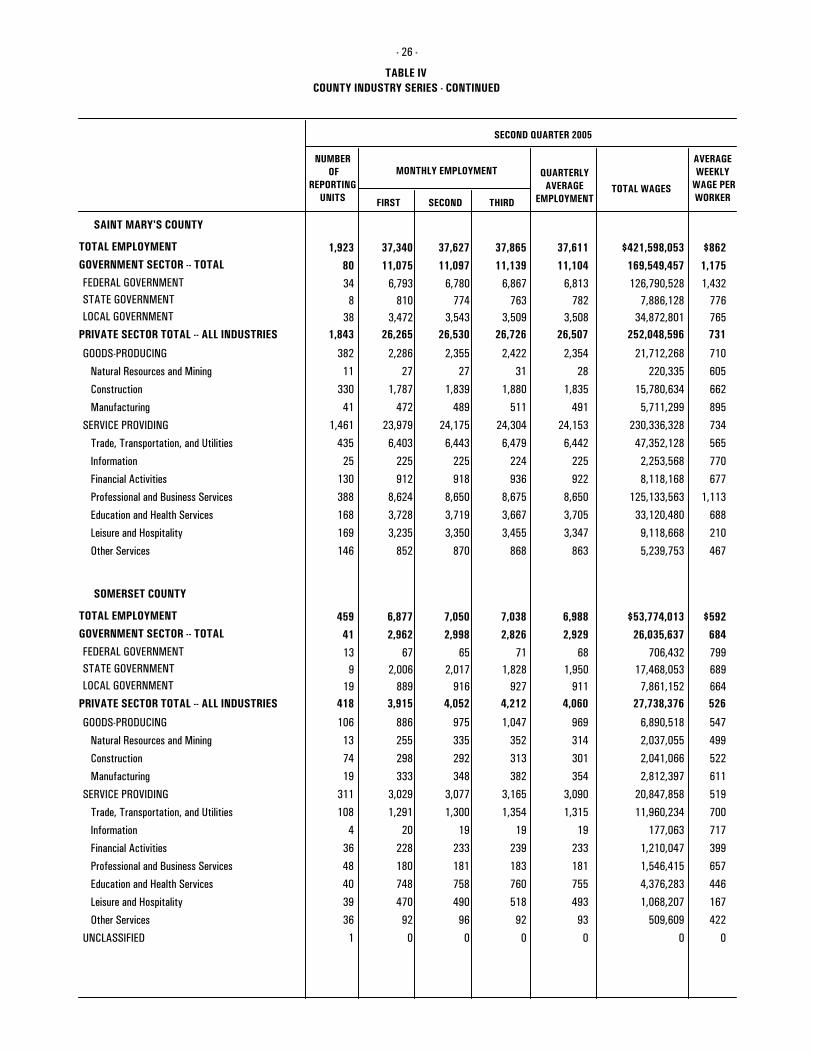
TOTAL EMPLOYMENT
GOVERNMENT SECTOR -- TOTAL 1,923 37,340 37,627 37,865
80 11,075 11,097 11,139
34 6,793 6,780 6,867 8 810 774 763 7,886,128
FEDERAL GOVERNMENTSTATE GOVERNMENTLOCAL GOVERNMENT
37,611
11,104
6,813 782
$862
1,175
1,432 776
126,790,528
169,549,457
$421,598,053
1,843 26,265 26,530 26,726 26,507 731 252,048,596 38 3,472 3,543 3,509 34,872,801 3,508 765
SAINT MARY'S COUNTY
PRIVATE SECTOR TOTAL -- ALL INDUSTRIES
GOODS-PRODUCING 382 2,286 2,355 2,422 2,354 710 21,712,268
Natural Resources and Mining 11 27 27 31 28 605 220,335
Construction 330 1,787 1,839 1,880 1,835 662 15,780,634
Manufacturing 41 472 489 511 491 895 5,711,299
SERVICE PROVIDING 1,461 23,979 24,175 24,304 24,153 734 230,336,328
Trade, Transportation, and Utilities 435 6,403 6,443 6,479 6,442 565 47,352,128
Information 25 225 225 224 225 770 2,253,568
Financial Activities 130 912 918 936 922 677 8,118,168
Professional and Business Services 388 8,624 8,650 8,675 8,650 1,113 125,133,563
Education and Health Services 168 3,728 3,719 3,667 3,705 688 33,120,480
Leisure and Hospitality 169 3,235 3,350 3,455 3,347 210 9,118,668
Other Services 146 852 870 868 863 467 5,239,753
TOTAL EMPLOYMENT
GOVERNMENT SECTOR -- TOTAL 459 6,877 7,050 7,038
41 2,962 2,998 2,826
13 67 65 71 9 2,006 2,017 1,828 17,468,053
FEDERAL GOVERNMENTSTATE GOVERNMENTLOCAL GOVERNMENT
6,988
2,929
68 1,950
$592
684
799 689
706,432
26,035,637
$53,774,013
418 3,915 4,052 4,212 4,060 526 27,738,376 19 889 916 927 7,861,152 911 664
SOMERSET COUNTY
PRIVATE SECTOR TOTAL -- ALL INDUSTRIES
GOODS-PRODUCING 106 886 975 1,047 969 547 6,890,518
Natural Resources and Mining 13 255 335 352 314 499 2,037,055
Construction 74 298 292 313 301 522 2,041,066
Manufacturing 19 333 348 382 354 611 2,812,397
SERVICE PROVIDING 311 3,029 3,077 3,165 3,090 519 20,847,858
Trade, Transportation, and Utilities 108 1,291 1,300 1,354 1,315 700 11,960,234
Information 4 20 19 19 19 717 177,063
Financial Activities 36 228 233 239 233 399 1,210,047
Professional and Business Services 48 180 181 183 181 657 1,546,415
Education and Health Services 40 748 758 760 755 446 4,376,283
Leisure and Hospitality 39 470 490 518 493 167 1,068,207
Other Services 36 92 96 92 93 422 509,609
UNCLASSIFIED 1 0 0 0 0 0 0
NUMBER OF
REPORTINGUNITS
MONTHLY EMPLOYMENT
FIRST SECOND THIRD
QUARTERLYAVERAGE
EMPLOYMENTTOTAL WAGES
TABLE IV
AVERAGEWEEKLY
WAGE PERWORKER
COUNTY INDUSTRY SERIES - CONTINUED
SECOND QUARTER 2005
- 27 -
TOTAL EMPLOYMENT
GOVERNMENT SECTOR -- TOTAL 1,771 19,044 19,391 19,738
44 1,851 1,873 1,898
18 268 270 264 6 206 210 206 1,751,564
FEDERAL GOVERNMENTSTATE GOVERNMENTLOCAL GOVERNMENT
19,391
1,874
267 207
$587
712
1,000 651
3,471,236
17,351,741
$148,079,460
1,727 17,193 17,518 17,840 17,517 574 130,727,719 20 1,377 1,393 1,428 12,128,941 1,399 667
TALBOT COUNTY
PRIVATE SECTOR TOTAL -- ALL INDUSTRIES
GOODS-PRODUCING 325 3,352 3,401 3,426 3,393 661 29,160,070
Natural Resources and Mining 17 86 92 90 89 446 515,903
Construction 261 1,689 1,721 1,754 1,721 679 15,192,765
Manufacturing 47 1,577 1,588 1,582 1,582 654 13,451,402
SERVICE PROVIDING 1,400 13,839 14,115 14,412 14,122 553 101,498,649
Trade, Transportation, and Utilities 364 3,725 3,807 3,867 3,800 499 24,665,340
Information 24 332 330 332 331 703 3,023,374
Financial Activities 160 890 901 921 904 831 9,762,604
Professional and Business Services 280 2,176 2,186 2,230 2,197 670 19,136,088
Education and Health Services 169 3,232 3,228 3,215 3,225 673 28,218,347
Leisure and Hospitality 141 2,422 2,602 2,731 2,585 293 9,860,498
Other Services 262 1,062 1,061 1,116 1,080 487 6,832,398
UNCLASSIFIED 2 2 2 2 2 2,654 69,000
TOTAL EMPLOYMENT
GOVERNMENT SECTOR -- TOTAL 3,416 65,794 66,586 67,013
108 8,472 8,529 8,562
34 668 666 679 11 2,519 2,495 2,503 24,641,909
FEDERAL GOVERNMENTSTATE GOVERNMENTLOCAL GOVERNMENT
66,464
8,521
671 2,506
$618
683
756 756
6,594,449
75,704,542
$533,684,782
3,308 57,322 58,057 58,451 57,943 608 457,980,240 63 5,285 5,368 5,380 44,468,184 5,344 640
WASHINGTON COUNTY
PRIVATE SECTOR TOTAL -- ALL INDUSTRIES
GOODS-PRODUCING 678 13,340 13,456 13,585 13,460 773 135,250,426
Natural Resources and Mining 20 132 129 149 137 757 1,348,942
Construction 500 4,143 4,237 4,352 4,244 668 36,859,586
Manufacturing 158 9,065 9,090 9,084 9,080 822 97,041,898
SERVICE PROVIDING 2,605 43,932 44,554 44,818 44,435 558 322,333,873
Trade, Transportation, and Utilities 952 15,226 15,393 15,407 15,342 554 110,544,871
Information 45 1,439 1,460 1,487 1,462 535 10,159,937
Financial Activities 268 6,575 6,606 6,759 6,647 740 63,927,337
Professional and Business Services 417 4,273 4,285 4,314 4,291 637 35,538,561
Education and Health Services 298 8,840 8,884 8,788 8,837 646 74,168,347
Leisure and Hospitality 328 5,782 6,137 6,269 6,063 230 18,116,263
Other Services 297 1,797 1,789 1,794 1,793 424 9,878,557
UNCLASSIFIED 25 50 47 48 48 635 395,941
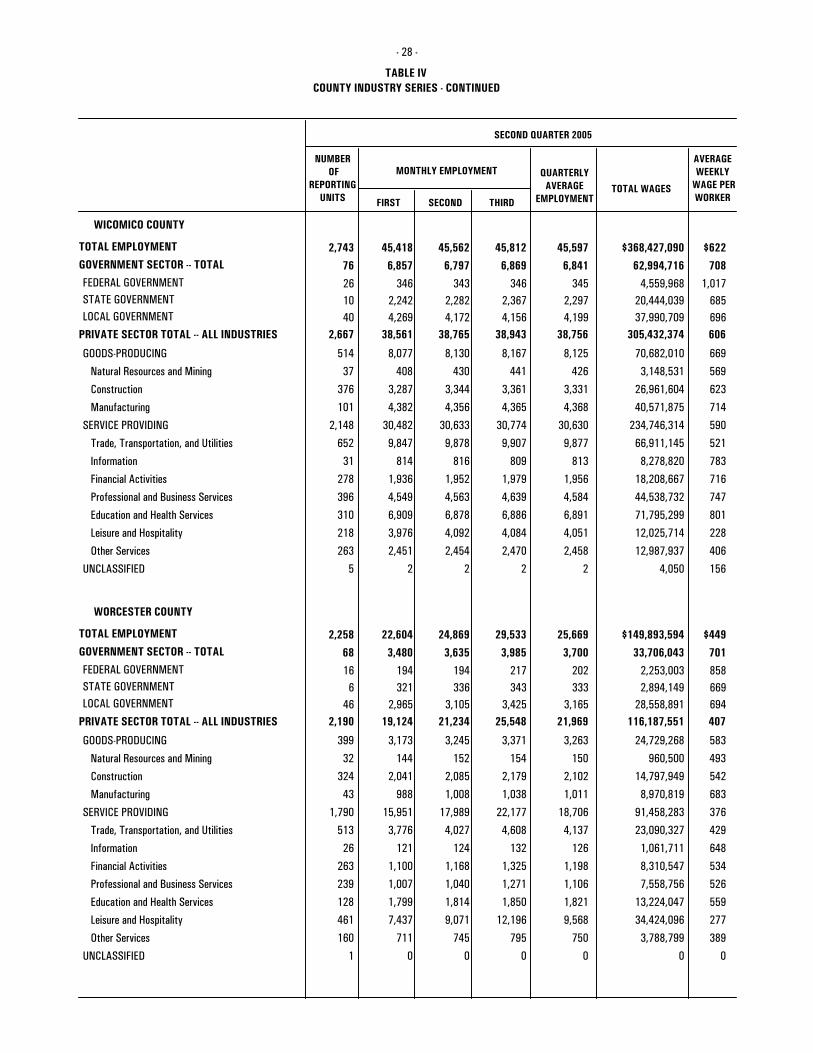
NUMBER OF
REPORTINGUNITS
MONTHLY EMPLOYMENT
FIRST SECOND THIRD
QUARTERLYAVERAGE
EMPLOYMENTTOTAL WAGES
TABLE IV
AVERAGEWEEKLY
WAGE PERWORKER
COUNTY INDUSTRY SERIES - CONTINUED
SECOND QUARTER 2005
- 28 -
TOTAL EMPLOYMENT
GOVERNMENT SECTOR -- TOTAL 2,743 45,418 45,562 45,812
76 6,857 6,797 6,869
26 346 343 346 10 2,242 2,282 2,367 20,444,039
FEDERAL GOVERNMENTSTATE GOVERNMENTLOCAL GOVERNMENT
45,597
6,841
345 2,297
$622
708
1,017 685
4,559,968
62,994,716
$368,427,090
2,667 38,561 38,765 38,943 38,756 606 305,432,374 40 4,269 4,172 4,156 37,990,709 4,199 696
WICOMICO COUNTY
PRIVATE SECTOR TOTAL -- ALL INDUSTRIES
GOODS-PRODUCING 514 8,077 8,130 8,167 8,125 669 70,682,010
Natural Resources and Mining 37 408 430 441 426 569 3,148,531
Construction 376 3,287 3,344 3,361 3,331 623 26,961,604
Manufacturing 101 4,382 4,356 4,365 4,368 714 40,571,875
SERVICE PROVIDING 2,148 30,482 30,633 30,774 30,630 590 234,746,314
Trade, Transportation, and Utilities 652 9,847 9,878 9,907 9,877 521 66,911,145
Information 31 814 816 809 813 783 8,278,820
Financial Activities 278 1,936 1,952 1,979 1,956 716 18,208,667
Professional and Business Services 396 4,549 4,563 4,639 4,584 747 44,538,732
Education and Health Services 310 6,909 6,878 6,886 6,891 801 71,795,299
Leisure and Hospitality 218 3,976 4,092 4,084 4,051 228 12,025,714
Other Services 263 2,451 2,454 2,470 2,458 406 12,987,937
UNCLASSIFIED 5 2 2 2 2 156 4,050
TOTAL EMPLOYMENT
GOVERNMENT SECTOR -- TOTAL 2,258 22,604 24,869 29,533
68 3,480 3,635 3,985
16 194 194 217 6 321 336 343 2,894,149
FEDERAL GOVERNMENTSTATE GOVERNMENTLOCAL GOVERNMENT
25,669
3,700
202 333
$449
701
858 669
2,253,003
33,706,043
$149,893,594
2,190 19,124 21,234 25,548 21,969 407 116,187,551 46 2,965 3,105 3,425 28,558,891 3,165 694
WORCESTER COUNTY
PRIVATE SECTOR TOTAL -- ALL INDUSTRIES
GOODS-PRODUCING 399 3,173 3,245 3,371 3,263 583 24,729,268
Natural Resources and Mining 32 144 152 154 150 493 960,500
Construction 324 2,041 2,085 2,179 2,102 542 14,797,949
Manufacturing 43 988 1,008 1,038 1,011 683 8,970,819
SERVICE PROVIDING 1,790 15,951 17,989 22,177 18,706 376 91,458,283
Trade, Transportation, and Utilities 513 3,776 4,027 4,608 4,137 429 23,090,327
Information 26 121 124 132 126 648 1,061,711
Financial Activities 263 1,100 1,168 1,325 1,198 534 8,310,547
Professional and Business Services 239 1,007 1,040 1,271 1,106 526 7,558,756
Education and Health Services 128 1,799 1,814 1,850 1,821 559 13,224,047
Leisure and Hospitality 461 7,437 9,071 12,196 9,568 277 34,424,096
Other Services 160 711 745 795 750 389 3,788,799
UNCLASSIFIED 1 0 0 0 0 0 0
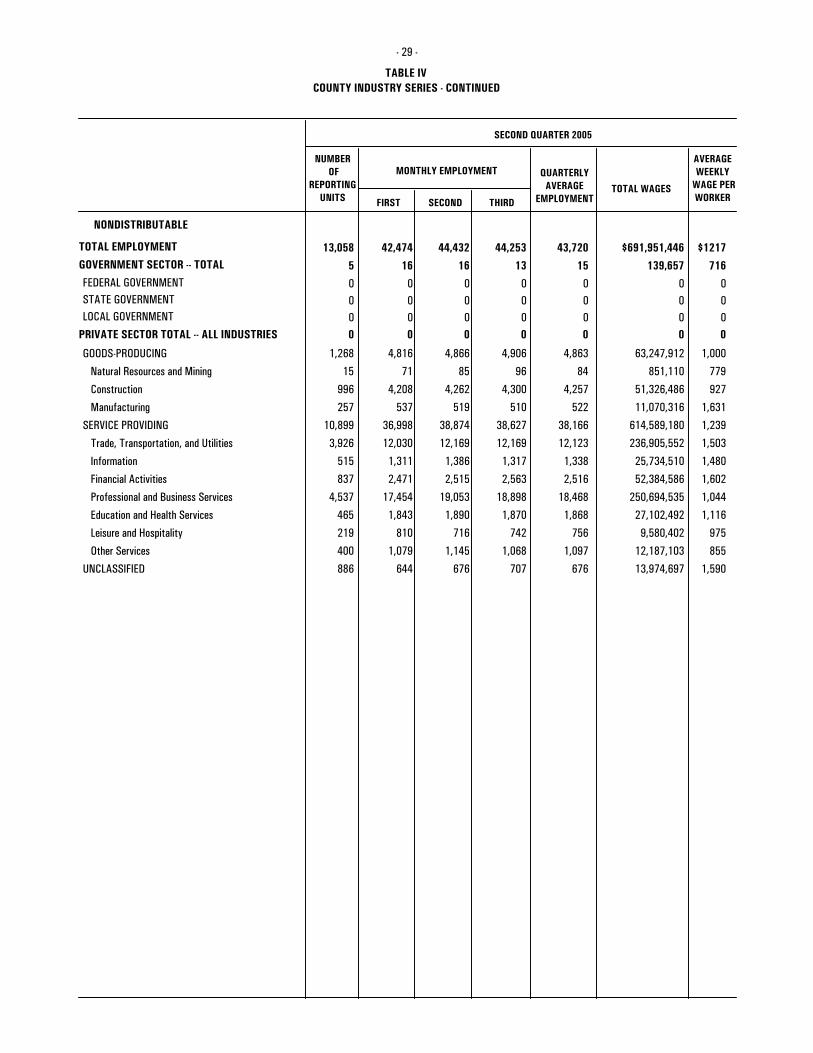
NUMBER OF
REPORTINGUNITS
MONTHLY EMPLOYMENT
FIRST SECOND THIRD
QUARTERLYAVERAGE
EMPLOYMENTTOTAL WAGES
TABLE IV
AVERAGEWEEKLY
WAGE PERWORKER
COUNTY INDUSTRY SERIES - CONTINUED
SECOND QUARTER 2005
- 29 -
TOTAL EMPLOYMENT
GOVERNMENT SECTOR -- TOTAL 13,058 42,474 44,432 44,253
5 16 16 13
0 0 0 0 0 0 0 0 0
FEDERAL GOVERNMENTSTATE GOVERNMENTLOCAL GOVERNMENT
43,720
15
0 0
$1217
716
0 0
0
139,657
$691,951,446
0 0 0 0 0 0 0 0 0 0 0 0 0 0
NONDISTRIBUTABLE
PRIVATE SECTOR TOTAL -- ALL INDUSTRIES
GOODS-PRODUCING 1,268 4,816 4,866 4,906 4,863 1,000 63,247,912
Natural Resources and Mining 15 71 85 96 84 779 851,110
Construction 996 4,208 4,262 4,300 4,257 927 51,326,486
Manufacturing 257 537 519 510 522 1,631 11,070,316
SERVICE PROVIDING 10,899 36,998 38,874 38,627 38,166 1,239 614,589,180
Trade, Transportation, and Utilities 3,926 12,030 12,169 12,169 12,123 1,503 236,905,552
Information 515 1,311 1,386 1,317 1,338 1,480 25,734,510
Financial Activities 837 2,471 2,515 2,563 2,516 1,602 52,384,586
Professional and Business Services 4,537 17,454 19,053 18,898 18,468 1,044 250,694,535
Education and Health Services 465 1,843 1,890 1,870 1,868 1,116 27,102,492
Leisure and Hospitality 219 810 716 742 756 975 9,580,402
Other Services 400 1,079 1,145 1,068 1,097 855 12,187,103
UNCLASSIFIED 886 644 676 707 676 1,590 13,974,697
APPENDIX A
Data contained in this report represent all employers covered by the Unemployment Insurance (UI) law of Maryland as well asfederal workers covered by 5 U.S.C. section 85 (Unemployment Compensation for Federal Employees). The state-insured data are compiled from quarterly contributions reports submitted by employers subject to the Maryland law. Included are all reports received plus estimates for those known to be delinquent. Incomplete reports have missing data elements estimated as necessary to provide useful data. Employers known to have more than one physical location operating in Maryland are requested to "breakdown" the data submitted. A Multiple Worksite Report completed by an employer allows data to be disaggregated intoreporting units. Employment data pertaining to the federal government are obtained from similarly required reports submitted by the
SOURCE OF DATA
various government installations located in Maryland.
An employer is subject to Maryland's UI law as soon as one or more workers are employed in the state. The following types ofwage and salary employment are currently exempt from this coverage:
SCOPE OF COVERAGE
Railroad workers
Agricultural labor where cash wages are less than $20,000 or fewer than 10 workers are employed during the current orpreceding quarter
Domestic service unless during any quarter of the current or preceding calendar year the employer pays cash wages of at least $1,000 to individuals performing the employment
Crew members and officers of vessels having a capacity of 10 tons or less
State and local government elected officials
Religious organization workers except where employment is elected to be covered as provided for in the law
Insurance and real estate agents that receive payment solely by commission
In addition to the wage and salaried workers listed above, all self-employed and family workers are not covered by the law. Amore complete definition of covered workers may be obtained by referring to the annotated code of Maryland.
Federal employment represents civilian employees only. A few installations are exempt because of national security.
- 30 -
APPENDIX B
- The total wages paid divided by thirteen (number of weeks in a quarter) thendivided by the quarterly average employment. It should be noted that no attempt is made to standardize the workweek.Industries that employ a large number of part-time workers will normally have a downward bias while those that engage in
EXPLANATION OF TERMS
AVERAGE WEEKLY WAGE PER WORKER
extensive payment of overtime will normally have an upward bias.
- The Baltimore MSA (Metropolitan Statistical Area) consists of Baltimore City and Anne Arundel,Baltimore, Carroll, Harford, Howard and Queen Anne's counties.BALTIMORE MSA
- The number of workers earning wages during the pay period including the 12th of the month. Included arethose on paid sick leave, paid holiday, paid vacation, etc. The count excludes those who did not earn wages during the entirepay period because of layoffs, work stoppages, illness or unpaid vacation. Individuals on more than one payroll are counted
EMPLOYMENT
each time they are reported. Employment is by reporting unit and is included in the area in which the unit is located.
- The type of activity(s) engaged in by an employer are classified according to the 2002 North American IndustryClassification System (NAICS) Manual. Where more than one activity is involved the dominant activity is used for classification. When an employer has more than one reporting unit, each unit is assigned to an industry based on the activity of that specific
INDUSTRY
unit. Included in the Unclassified category are those units for which no industry can be assigned.
- The Maryland portion of the Washington, D.C. MSA (Metropolitan Statistical Area)consists of Calvert, Charles, Frederick, Montgomery, and Prince George's counties.MARYLAND PORTION OF D.C. MSA
- An employer is the legal entity subject to the Unemployment Insurance law. In most casesthe employer is equivalent to the establishment or reporting unit, while in some cases the employer will include severalestablishments or reporting units. A reporting unit is the economic unit for which data are submitted by an employer.
EMPLOYER/REPORTING UNIT
Reporting units are, for the most part, individual establishments. An establishment is generally defined as a single physicallocation where primarily one type of economic activity is conducted. An employer may have more than one reporting unit;however, most employers operate only one place of business and therefore only have one reporting unit. In Maryland,approximately 1,900 employers have more than one reporting unit and account for approximately 17,700 of the total numberof units.
- This is the area designation for reporting units that cannot be assigned to one specific area. This includes sales and other personnel with no permanent place of work or established place of business in the state.NONDISTRIBUTABLE
- 31 -

- Each reporting unit is assigned to a category based on the employment reported for the third month of the quarter. Because of employment fluctuations within the quarter, the average employment per reporting unit may fall outsidethe indicated size class. For example, size zero shows employment for the first two months of the quarter and will result in an
SIZE CLASS
average quarterly employment figure greater than zero. Employment of zero is often reported one or more months for
- The result of summing the employment reported in each of the three months of the quarter and then dividing by three.QUARTERLY AVERAGE EMPLOYMENT
- The sum of all compensation for services. This includes bonuses, commissions, tips and the cash value of all compensation in any medium other than cash such as the value of meals and lodging.TOTAL WAGES
employers entering or leaving the market place as well as those that operate seasonally.
- 32 -

APPENDIX C
Although these data represent the largest universe of employment and wage information regularly available, there are some limitations associated with the use of the data presented in this report. The user should be aware of the following in making use ofthe data presented here:
LIMITATIONS
All data represent the best available estimates at the time the report was prepared. Once the data are prepared, they are not revised based on later information.
Data reported by employers are edited and corrected, however not all reporting errors are able to be discerned.
Terms used in this report have specific meanings and may not be the same as in other publications even though the termsappear to be the same.
Total wages are based on when the wages were paid and not when they were earned. Bonuses and different pay periods maycause the figures to fluctuate from quarter to quarter.
Industry and area designations are updated once a year as necessary when additional information warrants a change. Thisoccurs in the first quarter report and thus data from previous reports may not always be comparable.
Employers may change the way they report if they have more than one establishment. Employers may begin to report by morethan one reporting unit or may elect to revert back to reporting only one unit.
- 33 -


![EOW LU Tax 2013 Payrolls 1.3.13[1]](https://img.pdfslide.us/doc/110x75/577ce37b1a28abf1038c3c61/eow-lu-tax-2013-payrolls-13131.jpg)