Embed Size (px)
Citation preview

hnicityagefaith
gg
nguagetytyommunithnicityhnicitynguagegetytyealth
employmeniti languagelanguagetttt
ducation
esionageageommunitommunityyealthealthelongingfaifaid tid ti
angladesagagfaitfait
ggealthealthffffmalielonelon
anglala
ooooo
tiontiontitititi
The Diversity of Leicester
A Demographic Profile
May 2008


ageghealthesagaggghealthhealthForeword
This booklet paints a picture of the people of the city of
Leicester. It tells how many people live here, their age
and ethnicity, the faiths they follow and the languages
they speak. It also reveals where and how they live, and
many of the important issues facing those who choose
to call this city home.
The purpose of the booklet is to provide information
about the ethnic diversity of Leicester in an easily
accessible format. It is particularly designed for
managers and other officers of local agencies.
Hard statistical data and soft local intelligence are both
used in painting this picture of Leicester. Statistics
become dated and while important for revealing broad
trends, they can fail to highlight interesting and
important local information. This booklet aims to
bridge this gap and give an up-to-date picture of
the demographic profile of Leicester.
The picture provides a snapshot in time. It describes
both the now and what is expected in the future, how
Leicester compares with other cities both in the East
Midlands region and elsewhere, and to averages for
England.
Only the most significant information has been included
and inevitably much has been left out. Wherever
possible, the location of more extensive information has
been included for those who would like to know more.
The booklet will be periodically updated and the latest
edition will be available on line at www.leicester.gov.uk
and on the Leicester Shire Research (LSR) online
website at www.lsr-online.org
It has been prepared with the support of
the former Community Cohesion Project Team and
the Leicester Partnership Information Group, both
sub-groups of the Leicester Partnership.
It is hoped that through this publication the rich diversity
of the people who live in Leicester may be more readily
understood.
Cllr Ross Willmott Philip Parkinson
Leader, Leicester Chair, Leicester
City Council Partnership
0011

cityagefaith
gg
anguageyymunitycitycityanguagenguageyyy
lth
cation
esionageagemmunitmmunityy
ageagelthlthngingfaifai
titi
ladesagagfaitfait
gglthlthfffflinnlaa
tiontiontitititi
thnicityagethgg
anguageyycommunitythnicitythnicityanguagenguageyyy
health
employmenticiticit anguageanguage
esionageageommunitommunityy
ageageealthealthbangladesagagf itf it
gghealthhealthffff
pcocohh
ooo
Contents
Population Information 4
Ethnicity 4
Ethnicity and Population Projection 5
Age 5
Faiths in Leicester 6
Languages in Leicester 10
New Arrivals 11
Socio-Economic Information 12
Poverty and Deprivation 14
Segregation 16
Employment 17
Women and Employment 17
Skills 18
Educational Attainment 18
Health 19
Housing 20
Community Safety 21
Fear of Crime 21
Incidence of Crime 21
Community Cohesion 22
Community Relations 22
Sense of Belonging to Leicester 22
Satisfaction with Leicester as a Place to Live 22
Sites of Cross-Cultural Mixing 23
Culture and Community Cohesion 23
Electoral Participation 23
Data Sources 24
Other Data Sources 24
ageghealthesagaggghealthhealth
0022

ageghealthesagaggghealthhealth
ethnicityagethgg
anguayycommunthnicitythnicityanguagyyy
health
employmeiciticit anguaangua
eageageommunommunyy
ageageealthealthbangladesagagfaitfait
gghealthhealthffffbanglala
pcocohh
ooo
CChhaarrttss
CChhaarrtt 11:: Population pyramid of Leicester compared to UK average . . .5
CChhaarrtt 22:: Leicester population by age and ethnicity 2001 . . . . . . . . . . . . . . .6
CChhaarrtt 33:: Percentage of primary school pupils where first language
is known or believed to be other than English, 2005 . . . . . . . .10
CChhaarrtt 44:: Free school meals take-up, England, 2005 . . . . . . . . . . . . . . . . . .15
CChhaarrtt 55:: Employment rate by ethnic group, England, 2002-03 . . . . . . .17
CChhaarrtt 66:: Employment rates and part-time employment rates
for women, Leicester, 2001 . . . . . . . . . . . . . . . . . . . . . . . . . . . . . . . . . . .17
CChhaarrtt 77:: Leicester GCSE Results - 5 or more at A*-C,
by ethnicity, England, 2005 . . . . . . . . . . . . . . . . . . . . . . . . . . . . . . . . . .18
CChhaarrtt 88:: Leicester GCSE Results - 5 or more at A*-C,
ethnicity and gender, 2005 . . . . . . . . . . . . . . . . . . . . . . . . . . . . . . . . . . .18
CChhaarrtt 99:: Percentage of people describing their
general health as ‘good, England, 2001 . . . . . . . . . . . . . . . . . . . . . .19
TTaabblleess
TTaabbllee 11:: Ethnic composition of Leicester from 2001 Census . . . . . . . . . . . .4
TTaabbllee 22:: Ethnic composition of Leicester 2007 estimate . . . . . . . . . . . . . . .4
TTaabbllee 33:: Ethnic composition of Leicester’s school pupils 2007 . . . . . . . . .5
TTaabbllee 44:: Average age of ethnic groups in Leicester, 2001 . . . . . . . . . . . . . .5
TTaabbllee 55:: Overseas nationals entering the UK and allocated a
National Insurance Number by year of registration and
place of residence 2002/03-2005/06 . . . . . . . . . . . . . . . . . . . . . . . .11
TTaabbllee 66:: Benefit claimants in Leicester, 2005 . . . . . . . . . . . . . . . . . . . . . . . . .15
TTaabbllee 77:: Asian presence in deprived areas, 2001 . . . . . . . . . . . . . . . . . . . . . .15
TTaabbllee 88:: Patterns of segregation in English cities, 2001 . . . . . . . . . . .16
TTaabbllee 99:: Employment rates by ethnicity, England, 2002-03 . . . . . . . . . . .17
TTaabbllee 1100:: Leicester unemployment rates by ethnicity, 2006 . . . . . . . . . . .17
TTaabbllee 1111:: Percentage of working age population in Leicester
with no qualifications, 2004 . . . . . . . . . . . . . . . . . . . . . . . . . . . . . . . . . .18
TTaabbllee 1122:: Literacy and numeracy levels in Leicester, 2002-03 . . . . . . . .18
TTaabbllee 1133:: Ethnicity and housing tenure in Leicester, 2001 . . . . . . . . . . . . .20
TTaabbllee 1144:: ‘People from different backgrounds get on well together’,
England, 2006 . . . . . . . . . . . . . . . . . . . . . . . . . . . . . . . . . . . . . . . . . . . . . . . .22
TTaabbllee 1155:: ‘Sense of belonging’ to Leicester, 2005 . . . . . . . . . . . . . . . . . . . . .22
TTaabbllee 1166:: Satisfaction with Leicester as a place to live, 1998-2005 . . . .22
TTaabbllee 1177:: Sites of cross–cultural interaction, 2003-2005 . . . . . . . . . . . . .23
MMaappss
MMaapp 11:: Distribution of Hindu communities living in Leicester, 2001 . . . . 8
MMaapp 22:: Distribution of Muslim communities living in Leicester, 2001. . . 9
MMaapp 33:: Leicester neighbourhoods by socio-economic
characteristics, 2001 . . . . . . . . . . . . . . . . . . . . . . . . . . . . . . . . . . . . . . . . . . .13
MMaapp 44:: LSOA areas in Leicester that are in the top 5% most deprived . .
nationally, 2007 . . . . . . . . . . . . . . . . . . . . . . . . . . . . . . . . . . . . . . . . . . . . . . . .14
DDiiaaggrraammss
DDiiaaggrraamm 11:: Faith communities in Leicester . . . . . . . . . . . . . . . . . . . . . 7
DDiiaaggrraamm 22:: Additional languages spoken in Leicester . . . . . . . . . . . . . . . . 10
Charts, tables, maps & diagrams
0033

ageghealthesagaggghealthhealth� Population Information
In the 2001 Census, the official population for Leicester was
279,921. The 2006 mid-year estimate, based on Census
projections, was 289,700. The official statistics show that
Leicester’s population has remained steady in the ten years
since 1991.
Local intelligence, however, suggests that Leicester’s
population is considerably larger than these figures indicate.
There is anecdotal evidence that a number of people,
particularly those living in the inner city, were not counted
accurately in the 2001 Census. Further, since 2001 there have
been two new waves of migration. Between 2002-2004
many people of Somali origin settled in the city and, since
2005, many have come from Poland and other countries of
the former Eastern Europe. In addition, Leicester is also
home to many who have fled from trouble spots around the
world. (For further information see the section on New
Arrivals).
23% of people living in Leicester were born outside the UK.
This is far higher than the national average of 9%. In Oadby
and Wigston, areas bordering on the city boundary, 11% of
people were born outside the UK. (2001 Census).
Ethnicity
Leicester has a large and diverse ethnic minority population.
Based on the census information and local intelligence,
Leicester City Council estimates that 60% of Leicester’s
population is ethnically white and 40% have an ethnic
minority background. The 2001 Census showed the
difference as 64% to 36%. See Tables 1 and 2.
Amongst the ethnic minority people of Leicester, 30%+ have
an Asian background. The Asian population is predominantly
Indian from either East Africa, particularly Uganda or Kenya,
or from Gujarat in India. Other much smaller Asian
populations include Bangladeshis and Pakistanis. The black
population in Leicester comprise two groups – those of
Caribbean origin and those of African origin.
Leicester is unique amongst English cities in that its
predominant ethnic minority community is of Indian origin.
In terms of faith, approximately 75% of this community are
Hindu, and 25% Muslim. In other English cities (outside
London), minority ethnic communities are predominantly
Pakistani or Bangladeshi in origin and Muslim in faith.
SSoouurrccee:: 2001 Census (www.neighbourhood.statistics.gov.uk)
Ethnicity Breakdown (%) Leicester England& Wales
White 63.9 91.3
Mixed 2.3 1.3
Asian 29.9 4.4
Asian or Asian British: Indian 25.7 2.0
Asian or Asian British: Pakistani 1.5 1.4
Asian or Asian British: Bangladeshi 0.7 0.5
Black 3.1 2.2
Black or Black British: Caribbean 1.7 1.1
Black or Black British: African 1.2 0.9
Chinese 0.5 0.4
Other 0.3 0.4
Table 1: Ethnic composition of Leicester from 2001 Census
SSoouurrccee:: Leicester City Council
NNoottee:: This table uses 2001 Census data along with soft local
intelligence and is an attempt to reflect the actual ethnicity of the
population of Leicester as at 2007. Please use this with caution.
Ethnicity Breakdown (%) Leicester
White 60%
British 57%
Irish 1%
European 1%
Other 1%
Asian 31%
Asian or Asian British: Indian 28%
Asian or Asian British: Pakistani 2%
Asian or Asian British: Bangladeshi 1%
Black 8%
Black or Black British: Caribbean 4%
Black or Black British: Somali 3%
Black or Black British: Other African 1%
Chinese 0.5%
Other 0.5%
Table 2: Ethnic composition of Leicester 2007 estimate
0044

In 2007, the ethnicity data on school pupils in Leicester
indicated that 54% had an ethnic minority background and
44% were ethnically white. Closer analysis of this data
indicated that the proportion of black and mixed heritage
children in Leicester is increasing compared to Asian and
white children.
Ethnicity and Population Projection
There was a 7% increase in ethnic minority residents
between the 1991 Census and the 2001 Census. If this trend
continues then Leicester is likely to become amongst the first
cities in England, outside of London, to have a majority of
people with an ethnic minority background. This is due to a
range of factors including higher birth rates amongst ethnic
minority groups, increases in existing populations through
family consolidations and increases in the number of new
arrivals. If this trend continues, Leicester may reach this
milestone sometime after 2011.
(The above projection takes account of migration out of the
city. It should also be noted that the 1991 and 2001 Census
data are not directly comparable as the 2001 data includes
students and other ‘estimates’.)
Age
Leicester has a younger than average population. The
average age is 35.5 compared to 38.7 for England and Wales.
The average age of the ethnic minority population in
Leicester is approximately 8 years younger than that of the
white population. See Table 4.
The population pyramid, Chart 1, shows the difference from
the UK average. The spike amongst 20-24 year olds can be
explained by the fact that Leicester has a large student
population. The average age of new arrivals tends to be
younger than that of established ethnic minority populations.
See also Chart 2.
ageghealthesagaggghealthhealthTTaabbllee 33:: Ethnic composition of Leicester’s school
pupils 2007
SSoouurrccee:: PLASC data 2007
NNoottee:: The ‘Other’ category is statisically small.
SSoouurrccee:: National Statistics (www.statistics.gov.uk)
Primary% Secondary % Other % % Total
Asian 39 40 24 39
Black 9 7 2 8
Mixed 6 5 4 6
Other 2 3 2 2
White 44 45 65 44
Men Women
90 and over
85-89
80-84
`75-79
70-74
65-69
60-64
55-59
50-54
45-49
40-44
35-39
30-34
25-29
20-24
15-19
10-14
5-9
0-4
12% 10% 8% 6% 4% 2% 0% 2% 4% 6% 8% 10% 12%
Chart 1: Population pyramid of Leicester compared to UK average
0055
TTaabbllee 44:: Average age of ethnic groups inLeicester, 2001
SSoouurrccee:: 2001 Census (www.neighbourhood.staistics.gov.uk)
Ethnicity Average Age
All white 38.39
All none white 30.36
Black 28.1
Indian 31.82
Pakistani 25.99
Bangladeshi 28.1

ageghealthesagaggghealthhealth
Compared to national patterns, Leicester’s older population
is declining as older people move out of the city into
neighbouring areas in the county. Anecdotal evidence
suggests that nearly a quarter of older people in Leicester
have an ethnic minority background.
Faiths in Leicester
The 2001 Census showed the largest faith communities
in Leicester are the Christian communities at 44.7% of the
population, followed by Hindu at 14.7%, Muslim at 11%, and Sikh
at 4.2%. 17.4% stated they had no religion while 7% did not
indicate their religion. See Diagram 1.
According to the Leicester Council of Faiths, Leicester has
one of the highest rates of attendance at faith-based activities
in England. There are approximately 240 faith groups across
14 different faiths. (Places of Worship in the City of Leicester,
Leicester Council of Faiths, 2004, updated.)
In terms of places of Christian worship in the city there
are 37 Churches of England, 15 Roman Catholic, and 69
non-conformist churches, 19 Evangelical, 15 Pentecostal,
13 Baptist, 11 Methodist and 11 United Reform churches. In
addition there are also a growing number of black led
churches. There are 2 Jewish synagogues in the city.
Within the city there are 26 Sunni mosques, 2 Shia mosques,
22 Hindu temples, 7 Sikh Gurdwaras and 1 Jain temple.
75% of Leicester’s Indian community are Hindu and 25% are
Muslim. Leicester has the highest concentration of Hindus
outside London.
Two thirds of the Muslim population within the city are of
Indian origin. Over recent years, particularly since the arrival
of Somali people, the Muslim population in the city has
significantly increased. This is expected to continue as 26% of
the school population is Muslim and 15% Hindu. (PLASC,
2006).
The maps on pages 8 and 9 show that the Hindu and Muslim
communities are very spatially concentrated in Leicester:
Hindus in the north of the city, and Muslims to the east of the
city centre. There are no similar concentrations observed for
other religions.
0066
SSoouurrccee:: 2001 Census, Information Services.Leicester City Council
00--44 5-9 10-14 15-19 20-24 25-29 30-34 35-39 40-44 45-49 50-54 55-59 60-64 65-69 70-74 75-79 80-84 85-89 90+
100%
75%
50%
25%
Age Group
All WhiteNon-White
Chart 2: Leicester population by age and ethnicity,2001

ageghealthesagaggghealthhealthDiagram 1: Faith communities in Leicester
SSoouurrccee:: Leicester City Council, 2005
NNoottee:: * 2001 Census
LohanaRajput
PrajapatiPatel
SunniIsmaili
Shia
Jain Centre JJaaiinnss ((lleessss tthhaann 11%%))
Muslim Burial CouncilMuslim Council of Britain
Federation of Muslim Organisations
3 Islamic schools in the city Madrassas
Diocese of Leicester – Church of England Black Anglicans
Roman Catholic Diocese (Nottingham) Catholic Committee for Racial Justice
United Reformed ChurchMethodistsBaptistsFree churchesBlack Christian churches30 Christian schools in the city
Progressive SynagogueOrthodox Synagogue
Federation of Sikh OrganisationsFederation of Sikh YouthLeicester Sikh Education FederationGurdwaras
Sri Lankan BuddhistsChinese Buddhist CentreTibetan Buddhist CentreLeicester Buddhist Circle
Faith Communities
Shree SanatanJalaram
SwaminarayanVishnu hindu prasad
Krishna-IskconOther-gurus
Caste communities/organisations
HHiinndduu
((1155%%**))
CChhrriissttiiaann
((4455%%**))
Schools
MMuussll iimm
((1111%%**))
JJeewwiisshh ((lleessss tthhaann11%%**))
SSiikkhh
((44%%**))
BBaahhaaii ((lleessss tthhaann 11%%))
BBuuddddhhiissttss
((lleessss tthhaann 11%%))
0077

ageghealthesagaggghealthhealthMap 1: Distribution of Hindu communities living in Leicester, 2001
PPeerrcceennttaaggee ooff rreessiiddeennttss ooff HHiinndduu ffaaiitthh
SSoouurrccee:: 2001 Census, Information Services
Leicester City Council
0088
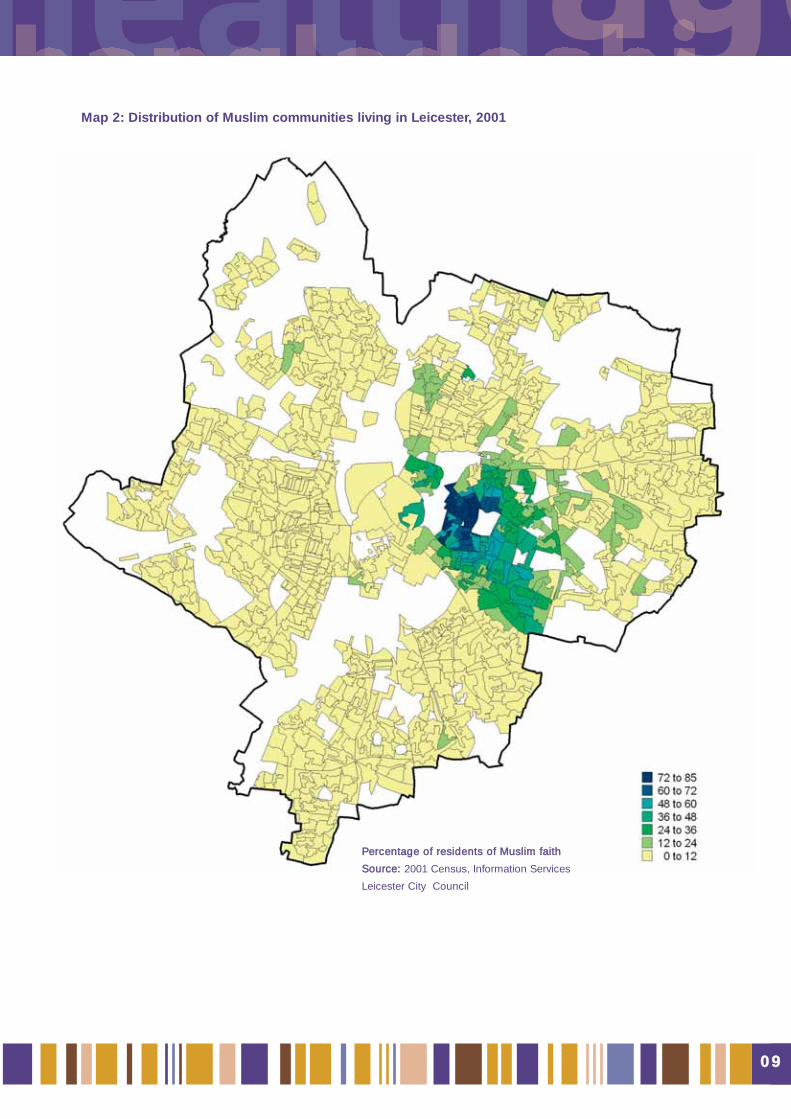
ageghealthesagaggghealthhealthMap 2: Distribution of Muslim communities living in Leicester, 2001
PPeerrcceennttaaggee ooff rreessiiddeennttss ooff MMuusslliimm ffaaiitthh
SSoouurrccee:: 2001 Census, Information Services
Leicester City Council
0099

ageghealthesagaggghealthhealthLanguages in Leicester
Alongside English there are around 70 languages and/or
dialects spoken in the city. In addition to English, eight
languages are commonly spoken: Gujarati is the preferred
language of 16% of the city’s residents, Punjabi 3%, Somali 3%
and Urdu 2%. Other smaller language groups include Hindi,
Arabic, Bengali and Polish. (Residents’ Survey, 2005 and
local evidence). See Diagram 2.
With continuing migration into the city, new languages and or
dialects from Africa, the Middle East and Eastern Europe are
also being spoken in the city.
In primary schools in Leicester, English is not the ‘preferred’
language of 45% of pupils and the proportion of children
whose first language is known, or believed to be, other than
English, is significantly higher than other cities within the
region, or within the UK. See Chart 3.
Diagram 2: Additional languages spoken in Leicester
SSoouurrccee:: Leicester City Council, 2005
SSoouurrccee:: Department for Education and Skills (DfES) http://www.dfes.gov.uk/rsgateway
50
45
40
35
30
25
20
15
10
5
0
CChhaarrtt 33:: Percentage of primary school pupils where first language is known, or believed to be, other than English, 2005
Leicester Nottingham Derby East Midlands England
44.6
15.0 14.3
7.211.7
Bengali and Sylheti
(Bangladesh, West Bengal)
Urdu and Punjabi
(Pakistan)
Language Groups
Arabic
Polish
Hindi (India)
Gujarati
Punjabi (Sikh, Punjab)
Somali and Dutch or Swahili
1100

ageghealthesagaggghealthhealthNew Arrivals
Leicester has a reputation for welcoming new arrivals and in
recent years it has become a home to refugee and asylum
seekers and others forced, or willing, to emigrate from their
homeland.
The majority of Leicester’s Somali community arrived in the
years following the 2001 census and consequently few
appear in the census statistics. Current Leicester City Council
assessments suggest the Somali population is between
6,000 - 10,000 people. Many of the Somali population are in
family units and many are European Union nationals having
received refugee status in the Netherlands, Denmark or
Sweden.
In recent years new groups of people have come to the city
mainly from Iraq, Afghanistan, Zimbabwe, Kosovo, Iran and
other African and Middle Eastern countries. Many of these
newer groups are made up of single young men. 2006
estimates suggest that there were just under 1000 asylum
seekers living in the city (Refugee Action Leicester, 2006.)
An estimated 2000 refugees also live in the city – i.e. those
whose application for asylum has been successful.
In addition to the above there may be a substantial number
of ‘hidden migrants’ living in the city including failed asylum
seekers and illegal immigrants. Local estimates suggest that
the number of failed asylum seekers may be as high as 5,000
– 6,000 people (Multi-Agency Forum for Asylum Seekers and
Refugees, 2006).
Leicester has been home to a small but long standing Polish
community since the end of the Second World War. Since
Poland’s accession to the European Union in 2004 there has
been a noticeable increase in Polish people and others from
former Eastern Europe, living in the city. It is estimated that
there are now between 3,000 – 5,000 Polish people and
other economic migrants, including Slovakians and
Portuguese, living in the city (Leicester City Council, 2007).
For some economic migrants their time in Leicester and or
the UK is transient, depending on the availability of jobs.
However a number have settled and Leicester’s school
census data indicates that the percentage of students
registering as ‘white European’ has risen from 1.1% in 2005
to 1.9% in 2007.
Data from National Insurance number registration provides
the strongest statistical evidence of the presence of economic
migrants in Leicester. Registering with National Insurance
allows Eastern European migrants to work in the UK legally.
Leicester’s figures have doubled since 2002/03 and are more
than double the rate per thousand for England. However,
registering in Leicester does not necessarily mean they stay
on in Leicester. See Table 5.
TTaabbllee 55:: Overseas nationals entering the UK and allocated a National Insurance number by year
of registration and place of residence 2002/03 – 2005/06
SSoouurrccee:: Dept for Work and Pensions. Rate per 1,000 calculated using 2005/06 data divided by mid year population estimates.
NNoottee:: 1. This table includes those who have registered with the Workers’ Registration Scheme and then have been allocated
a National Insurance number.2. The table indicates the numbers who applied in Leicester. Other regional locations where new arrivals could apply
for a National Insurance number are Nottingham, Boston and Derby (up to 2007).
2002/03 2003/04 2004/05 2005/06 Rate per 1,000people
Leicester 3,820 4,880 4,920 7,620 26.7
East Midlands 13,400 16,480 23,510 38,480 9.0
UK 349,240 370,750 439,730 662,390 11.4
1111
ageghealthesagaggghealthhealth� Socio-Economic
Information
The picture of Leicester in terms of socio-economic
information is complicated. The usual pattern is for
communities to be geographically segregated on the basis
of age, employment status and social class, but in Leicester
ethnicity and religion are also significant elements in the
picture. Based on census information, the spatial pattern
across the city shows neighbourhood clusters of statistically
similar neighbourhoods. See Map 3.
Although Leicester has some areas of wealth, there are also
many areas of extreme and multiple deprivation. The majority
of the poorest areas of the city are the largely white working
class areas on the periphery of the city, along with a few
areas in the inner city. The more affluent areas of the city are
in the south stretching from Victoria Park to the City boundary
alongside the A6 road.
In terms of ethnicity, the picture above is even more complex
as patterns of poverty and deprivation do not correspond with
patterns of ethnicity. In general, Leicester’s Asian residents
are not concentrated in the most deprived parts of the city.
However, local intelligence suggests that although this is the
case for the Indian population of the city, it is not for the
Pakistani and Bangladeshi populations. These populations
suffer considerable levels of deprivation, however because
their numbers are small compared to the Indian population,
this is not revealed in the official statistics.
In terms of age and ethnicity, the outer peripheral housing
areas are older due to higher proportions of white residents
who are themselves older and have fewer children. The
opposite is true of the inner city – younger populations, more
ethnically diverse and more children.
The inner city area is quite mixed with the data revealing
relative differences within the Asian community by religion
and deprivation. Other communities in the inner city
include students and young professionals who tend to be
concentrated in the southern and eastern part of the
inner city.
1122

ageghealthesagaggghealthhealth
SSoouurrccee:: Information Services,
Leicester City Council
Disadvantaged Council Housing Estates
Wealthier Muslim Area
Hindu AreaPoorer Muslim AreaProfessional AreaMixed/Transient Inner City
Older Council Housing
Older Private HousingStudent Inner CityOther Areas
Statistically Similar Communities Census
Area Statistics, 2001 ONS
Map 3: Leicester neighbourhoods by socio-economic characteristics, 2001
1133

ageghealthesagaggghealthhealthPoverty and Deprivation
The pattern of deprivation across Leicester shows higher
levels of deprivation in the west of the city than in the east.
Deprivation is a measure of poverty based on a number of
criteria such as economic circumstances, health, crime,
housing, educational achievement, skills and the
environment.
Leicester City is ranked as the 20th most deprived local
authority region according to the Indices of Multiple
Deprivation 2007 (IMD2007), a national study of deprivation
across England developed by the Department for
Communities and Local Government. Some areas within the
city, known as ‘Lower Super Output Areas’ (LSOA’s), feature
within the 5% most deprived of all areas in the country. These
areas include parts of New Parks, Braunstone, Beaumont
Leys and Spinney Hills as well as the St Matthews and
Saffron Lane estates. See Map 4.
.
Map 4: LSOA areas in Leicester that are in the top 5% most deprived nationally, 2007
SSoouurrccee:: Partnership Executive Team
Leicester City Council
1144
IIMMDD22000077 DDeepprriivvaattiioonn bbyy SSccoorree

ageghealthesagaggghealthhealthFree school meal take-up is often used as a proxy measure
for deprivation. The proportion of primary school pupils
taking free school meals in Leicester is more than double
the regional average, and significantly above the figure
for England. See Chart 4.
Free school meal entitlement is based on income and
parents are required to apply for their children to take up free
school meals. Due to the stigma attached, it is very likely that
the percentage of children entitled to free school meals is
higher than the percentage of children claiming them.
25
20
15
10
5
0
CChhaarrtt 44:: Free school meals take up, England, 2005
Leicester Nottingham Derby East Midlands England
21.3 21.6
15.0
9.9
13.3
SSoouurrccee:: Department for Education and Skills (DfES), 2005http://www.dfes.gov.uk/rsgateway
%
Another indicator of deprivation in the city is the number of
benefit claimants. Leicester has far higher levels than other
cities in the region or nationally. See Table 6.
% Job % % Lone % Other: Total
Seeker: Incapacity: Parent:
Leicester 4.9 8.5 3.5 3.2 20.1
E.Midlands 2.2 6.8 1.8 2.7 13.5
Great Britain 2.4 7.5 2.2 2.7 14.8
TTaabbllee 66:: Benefit claimants in Leicester, 2005
SSoouurrccee:: Department of Work and Pensions, 2005
A further indicator of deprivation is the number of lone parent
households and here again Leicester ranks third in the East
Midlands with 8.7% of lone parents per thousand households -
behind Nottingham and Corby local authorities (2001 Census).
Leicester’s distinctive pattern of limited correlation between
deprivation and ethnicity is unlike other cities in England with
large ethnic minority populations. This can be seen in Table 7
which compares Asian presence in deprived areas across a
number of English cities.
Table 7: Asian presence in deprived areas, 2001
ConcentrationIndex:
Ratio ofAsian pres-ence (A/B)
AsianPresence in
all otherareas (%)
'B'
City AsianPresence in
mostdeprivedareas (%)
'A'Derby 24.8 4.6 5.4
Peterborough 27.9 5.2 5.4
Bradford 42.1 8.3 5.1
Preston 19.4 3.8 5.1
Burnley 25.4 7.1 3.6
Rochdale 20 6.1 3.3
Sheffield 8.4 2.7 3.1
Huddersfield 25.8 9.3 2.8
Bolton 18.2 6.5 2.8
Birmingham 25.8 9.6 2.7
Manchester 10.3 3.9 2.6
Ipswich 4.1 1.6 2.6
Leeds 8.3 3.5 2.4
Coventry 19.3 9.6 2
Nottingham 6.1 3.1 2
Luton 34.6 17.9 1.9
Blackburn 27.3 18.8 1.5
London 15.6 10.4 1.5
Gloucester 3.7 2.7 1.4
Milton Keynes 3.1 3.7 0.8
Northampton 2.7 3.3 0.8
Leicester 17.2 23.1 0.7
Oxford 2.9 4.8 0.6
SSoouurrccee:: State of the English Cities Report, ODPM
Note: Leicester ranks 22nd of English cities in relation to Asian
presence in deprived areas. This contrasts significantly to both Derby
and Nottingham.
1155

ageghealthesagaggghealthhealth
SSoouurrccee:: State of the English Cities Report, ODPM
Note: The rank of 1 indicates that Blackburn is the most segregated city in England. Leicester ranks 10th in terms of White/non-White segre-
gation, 13th for White/Asian segregation and 25th for White/Black segregation. There were 56 cities and towns surveyed.
TTaabbllee 88:: Patterns of segregation in English cities, 2001
White/Non-White White/Asian White/Black
Rank City ID Score City ID Score City ID Score1 Blackburn 0.72 Blackburn 0.73 Barnsley 0.73
2 Bradford 0.71 Bradford 0.73 Sunderland 0.65
3 Burnley 0.68 Rochdale 0.71 Burnley 0.63
4 Rochdale 0.67 Burnley 0.7 Middlesbrough 0.62
5 Huddersfield 0.62 Derby 0.68 Leeds 0.6
6 Bolton 0.62 Huddersfield 0.66 Liverpool 0.59
7 Sheffield 0.59 Preston 0.66 Blackpool 0.59
8 Preston 0.59 Bolton 0.65 Manchester 0.59
9 Derby 0.59 Sheffield 0.64 Wakefield 0.58
10 Leicester 0.59 Manchester 0.63 Huddersfield 0.57
11 Birmingham 0.58 Birmingham 0.63 Grimsby 0.56
12 Middlesbrough 0.57 Middlesbrough 0.62 Sheffield 0.56
13 Manchester 0.57 Leicester 0.62 Bristol 0.54
14 Stoke 0.54 Wakefield 0.62 Birkenhead 0.53
15 Leeds 0.54 Stoke 0.61 Newcastle 0.53
16 Wakefield 0.52 Gloucester 0.59 Blackburn 0.52
17 Doncaster 0.49 Leeds 0.57 Birmingham 0.52
18 Liverpool 0.49 Doncaster 0.56 London 0.51
19 Newcastle 0.48 Peterborough 0.55 Warrington 0.51
20 Nottingham 0.48 Nottingham 0.55 Doncaster 0.5
21 Peterborough 0.47 Newcastle 0.53 Bradford 0.49
22 Hull 0.45 Liverpool 0.52 Nottingham 0.49
23 Sunderland 0.44 Hull 0.51 Preston 0.48
24 London 0.44 Luton 0.51 Plymouth 0.47
25 Gloucester 0.43 London 0.5 Leicester 0.47
26 Southampton 0.42 Portsmouth 0.49 Stoke 0.47
27 Bristol 0.42 Southampton 0.49 Reading 0.47
28 Luton 0.41 Sunderland 0.48 York 0.47
Segregation
Given the size of Leicester’s ethnic minority population,
Leicester scores moderately well against other English
cities on tables of segregation. This indicates that Leicester’s
population is relatively mixed with few areas where one
minority ethnic group is dominant. The highest degree of
segregation in the city is between white and non-white
residents. See Table 8.
1166

ageghealthesagaggghealthhealthEmployment
The overall employment rate in Leicester in 2004 was 66.4%
This was just lower than the East Midlands region average
and 8.4% lower than for England at 74.9%. The employment
rate for ethnic minorities in Leicester is 62.6% and is lower
than that for the white population. See Chart 5.
(Neighbourhood Renewal Unit 2003/04).
The ethnic minority employment rate hides wide variations
amongst different ethnic groups. This is highlighted in Table 9
showing England’s employment rates by ethnicity. Table 10
shows Leicester’s unemployment rates by ethnicity.
On a national level the number of working aged people who
are not actively seeking, or are unavailable for work, is also
significantly higher for ethnic minority groups (33%) than for
white people (21%). The majority of people from ethnic
minority communities who are neither working nor collecting
benefits are Bangladeshi and Pakistani women, students,
and young Black African and Caribbean men.
(Neighbourhood Renewal Unit, Jobs/ Worklessness,
Background Paper 1, 2006) Local evidence suggests this is
also the case with the Somali community.
Unemployment rates for the Somali community in the city
are significant and figures quoted have been in excess of 75%
unemployment for both men and women.
Women and Employment
A study of women in employment in Leicester showed that
the employment rates for women in Leicester is low, at 54%
compared to 64% in England as a whole. (Gender Profile of
Leicester’s Labour Market, GELLM ,2006)
The study also indicated that in relation to part-time
employment, the rate varies according to ethnicity. There
are higher levels of part-time employment amongst
Bangladeshi women and lower levels amongst African
Caribbean and Indian women than amongst white British
women. See Chart 6.
90
80
70
60
50
40
30
20
10
0
CChhaarrtt 55:: Employment rate by ethnic group, England, 2002-03
Leicester Nottingham Derby East Midlands England
67.9
57.4
63.865
48.9
62.4
74.8
54.6
7277
58
75.8 76.3
57.4
74.5
SSoouurrccee:: Annual Labour Force Survey, 2003
% e
mpl
oym
ent r
ate
White
Non-White
All
70
60
50
40
30
20
10
0
CChhaarrtt 66:: Employment rates and part-time employment rates for women, Leicester, 2001
Whi
te B
ritis
hAll
Indi
an
Pak
ista
ni
Ban
glad
eshi
Bla
ckC
arib
bean
Bla
ck A
frica
n All
Whi
te B
ritis
h
Indi
an
paki
stan
i
Ban
glas
desh
i
Bla
ckC
arib
bean
Bla
ck A
frica
n
Source: 2001 Census Standard Tables, Crown Copyright 2003. 2001
Census Commissioned Tables, Crown Copyright 2004. From
Working Below Potential: Women and Part-Time Work in Leicester,
GELLM, 2006
Per
cent
age
of w
omen
Employees (% of women aged 16-59) Part-time employees (% of all employees)
SSoouurrccee:: Annual Labour Force Survey, 2002-03
Ethnicity Employment Rate %
White 76.3
Indian 68.5
Pakistani & Bangladeshi 42.4
Black 60.3
Other 55.1
TTaabbllee 99:: Employment rates by ethnicity, England, 2002-03
SSoouurrccee:: Office for National Statistics, 2006
Ethnic Group Employment Rate %
White 2.3
Mixed 2.9
Black or Black British 6.3
Asian or Asian British 2.9
Chinese or other ethnic group 8.0
Non white 3.4
TTaabbllee 1100:: Leicester unemployment rates by ethnicity, 2006
1177

ageghealthesagaggghealthhealthSkills
Compared to other cities in the region and to England,
there is a high proportion of people in Leicester with no
qualifications, and a high proportion with both low literacy
and low numeracy skills. Low skills are particularly prevalent
amongst the white population on the outer estates and
amongst the smaller ethnic minority groups in the city
such as Pakistanis, Bangladeshis, Somalis and African
Caribbeans. See Tables 11 and 12.
The 68% low level of literacy in Leicester means that it is
highly likely that written English above a reading age of 11 will
be difficult for many of the residents of Leicester – both white
and non-white – to read and understand easily.
Educational Attainment
Educational attainment rates are amongst the lowest in
the country, demonstrated at both Key Stage Two and for
GCSE results. Within Leicester, the patterns of educational
attainment differ markedly for different ethnic groups, by
gender and across the city.
Leicester has high educational achievement amongst
Asian students comparable to East Midlands and England
averages. However, white, black and mixed heritage students
all fare worse than the national average and there is a
particular issue of underachievement amongst black male
students. See Charts 7 and 8.
SSoouurrccee:: Dept for Education and Skills, 2005
http://www.dfes.gov.uk/rsgateway
SSoouurrccee:: Dept for Education and Skills
http://www.dfes.gov.uk/rsgateway
SSoouurrccee:: Local Area Labour Force Survey, 2004
Leicester England
No qualifications 24.7% 14.8%
Table 11: Percentage of working age population inLeicester with no qualifications, 2004
70
60
50
40
30
20
10
0
Asian Black Mixed White All
49.7
63.1
23.9
42.3
37.7
42.7
32.8 35
39.3
46.7
% a
chie
cing
52.2
32.5
Leicester
60
50
40
30
20
10
0
East Midlands England
39.7
33.9
42.9
58.9
34.2
43.6
51.1 50.9
58.8
40.1
49.9
52.4 52
Asian
Chart 7: Leicester GCSE Results - 5 or more at A*-C, by ethnicity, England 2005
Black
Mixed
White
All
Boys
Girls
SSoouurrccee:: http://www.dfes.gov.uk/readwriteplus_skillsforlifesurvey/
Note: Survey undertaken 2002-03. ‘Low literacy skills’ equates to
below GCSE level; ‘Level 1’ comparable to grades D-G; ‘Level 2’
comparable to A*-C. The concept of ‘low literacy’ includes both
Low literacy skills and Level 1 skills
Leicester England
Low literacy skills 18% c16%
Level 1 literacy skills 50% 40%
Level 2 literacy skills 32% 44%
Low numeracy skills 64% c46%
Level 1 numeracy skills 25% 28%
Level 2 numeracy skills 11% 25%
Table 12: Literacy and numeracy levels in Leicester,2002-03
Chart 8: Leicester GCSE Results - 5 or more atA*-C, by ethnicity and gender, 2005
1188
ageghealthesagaggghealthhealthHealth
Patterns of good or poor health in Leicester are related to
age, gender and ethnicity as well as to other socio-economic
factors. Inequalities in health exist both within the city and
between the city and other comparable cities in England.
Generally the indicators of health for people living in Leicester
are worse than average when compared to England and the
East Midlands. (Department of Health, Leicester Health
Profile, 2007 and the Director of Public Health, Annual
Report, 2005 and 2006.)
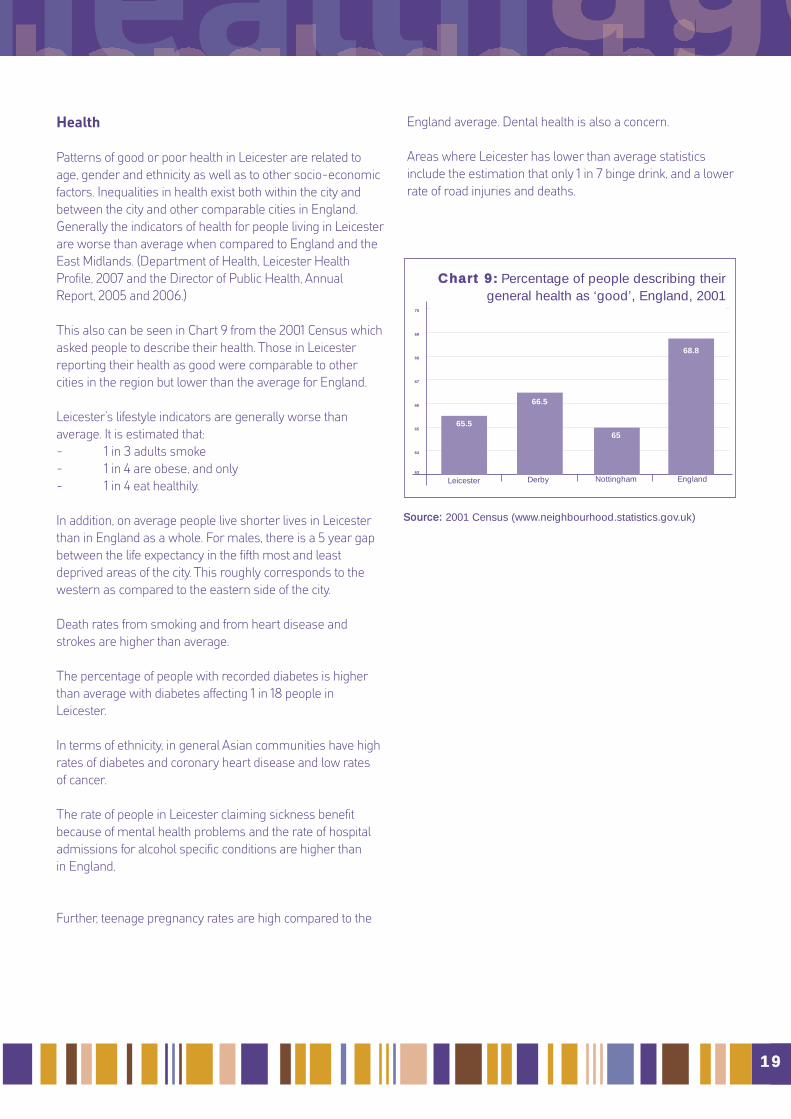
This also can be seen in Chart 9 from the 2001 Census which
asked people to describe their health. Those in Leicester
reporting their health as good were comparable to other
cities in the region but lower than the average for England.
Leicester’s lifestyle indicators are generally worse than
average. It is estimated that:
- 1 in 3 adults smoke
- 1 in 4 are obese, and only
- 1 in 4 eat healthily.
In addition, on average people live shorter lives in Leicester
than in England as a whole. For males, there is a 5 year gap
between the life expectancy in the fifth most and least
deprived areas of the city. This roughly corresponds to the
western as compared to the eastern side of the city.
Death rates from smoking and from heart disease and
strokes are higher than average.
The percentage of people with recorded diabetes is higher
than average with diabetes affecting 1 in 18 people in
Leicester.
In terms of ethnicity, in general Asian communities have high
rates of diabetes and coronary heart disease and low rates
of cancer.
The rate of people in Leicester claiming sickness benefit
because of mental health problems and the rate of hospital
admissions for alcohol specific conditions are higher than
in England.
Further, teenage pregnancy rates are high compared to the
England average. Dental health is also a concern.
Areas where Leicester has lower than average statistics
include the estimation that only 1 in 7 binge drink, and a lower
rate of road injuries and deaths.
70
69
68
67
66
65
64
63
CChhaarrtt 99:: Percentage of people describing theirgeneral health as ‘good’, England, 2001
Leicester NottinghamDerby England
65.5
66.5
65
68.8
SSoouurrccee:: 2001 Census (www.neighbourhood.statistics.gov.uk)
1199
ageghealthesagaggghealthhealthHousing
There is a shortage of affordable housing in Leicester and
this affects all groups within the city along with the lack of
sufficient social housing. People’s need to move into social
housing reflects a range of issues. However overcrowding is
a particular issue for ethnic minority households in Leicester
as there is a shortage of large family homes. 19% of
dependent children in Leicester experience overcrowding
as compared to 12.5% nationally (2001 Census).
All communities able to access social housing in Leicester
want quality, affordable homes, to be able to live near family
and friends and to feel safe. In addition, Asian people are
more concerned about the lack of local shops and facilities
whilst people from a white background are more concerned
about crime and antisocial behaviour. Both white and ethnic
minority groups are equally concerned about harassment
and feeling out of place in a new area.
Recent local research has revealed that there are some
differences in choice of location between ethnic groups.
Living near somebody of the same ethnicity is not a major factor
in itself for choosing location, but ethnic clustering is likely to
happen because people are fulfilling emotional and social needs
to live alongside people with similar needs. The research also
suggests that for many Muslim applicants a key factor in choice
of location is to be close to a place of worship.
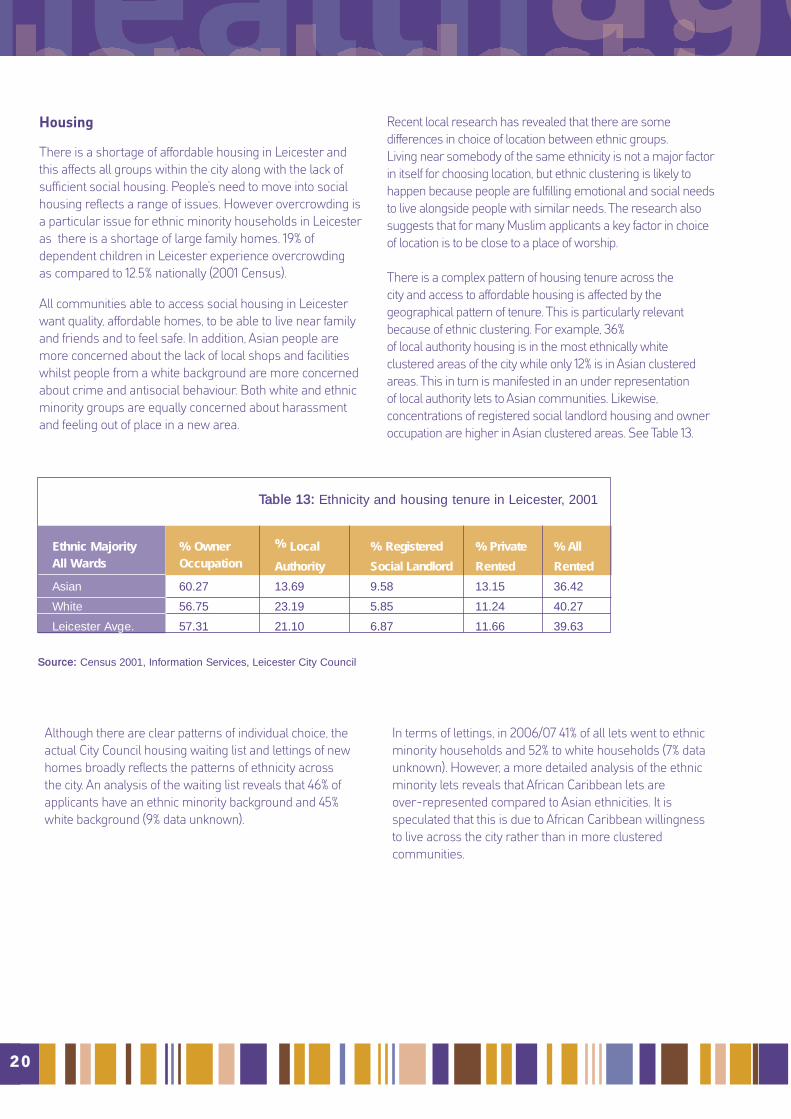
There is a complex pattern of housing tenure across the
city and access to affordable housing is affected by the
geographical pattern of tenure. This is particularly relevant
because of ethnic clustering. For example, 36%
of local authority housing is in the most ethnically white
clustered areas of the city while only 12% is in Asian clustered
areas. This in turn is manifested in an under representation
of local authority lets to Asian communities. Likewise,
concentrations of registered social landlord housing and owner
occupation are higher in Asian clustered areas. See Table 13.
Although there are clear patterns of individual choice, the
actual City Council housing waiting list and lettings of new
homes broadly reflects the patterns of ethnicity across
the city. An analysis of the waiting list reveals that 46% of
applicants have an ethnic minority background and 45%
white background (9% data unknown).
In terms of lettings, in 2006/07 41% of all lets went to ethnic
minority households and 52% to white households (7% data
unknown). However, a more detailed analysis of the ethnic
minority lets reveals that African Caribbean lets are
over-represented compared to Asian ethnicities. It is
speculated that this is due to African Caribbean willingness
to live across the city rather than in more clustered
communities.
SSoouurrccee:: Census 2001, Information Services, Leicester City Council
Ethnic Majority % Owner % Local % Registered % Private % AllAll Wards Occupation Authority Social Landlord Rented Rented
Asian 60.27 13.69 9.58 13.15 36.42
White 56.75 23.19 5.85 11.24 40.27
Leicester Avge. 57.31 21.10 6.87 11.66 39.63
TTaabbllee 1133:: Ethnicity and housing tenure in Leicester, 2001
2200

ageghealthesagaggghealthhealthCommunity Safety
Fear of Crime
Evidence from the 2005 Residents’ Survey indicated that
black and ethnic minority residents in the city are more
worried about crime than white residents. This covers
domestic burglary, vehicle crime, deliberate damage to
property, people using or dealing in drugs and teenagers
hanging around on the street.
Asian residents are more worried about being mugged or
robbed, and more worried about domestic violence, than
are white or black residents.
In terms of fear of hate crimes, ethnic minority residents
are far more worried than are white residents, 19%
compared to 6%.
Incidence of Crime
From the same survey, in terms of being victims of vehicle
crime, deliberate damage to property, and drunken people
causing a problem, teenagers hanging around in the street,
domestic violence and vandalism and graffiti, there was no
difference in the incidence of these crimes in relation to
ethnicity.
In relation to domestic burglary white residents were twice
as likely to be victims of burglary as ethnic minority residents.
In relation to hate crime, specifically in relation to verbal
abuse or harassment in relation to skin colour or ethnic
origin, ethnic minority residents were more likely than white
residents to indicate being a victim. Within the ethnic minority
groups, those most likely to be a victim were African
Caribbean residents.
Only 1% of residents in the city indicated that they had been
subject to a physical attack due to their skin colour, ethnic
origin or religion. Of these people, ethnic minority residents
were more likely than white residents to indicate being a
victim, and within the ethnic minority groups, African
Caribbean residents were most likely to be a victim.
In relation to being mugged or robbed, white residents
were slightly more likely to be victims than ethnic minority
residents.
In the 2006 British Crime Survey, the evidence indicates that
people in Leicester and Leicestershire have more confidence
in the police than do people in areas comparable to Leicester
and Leicestershire. Leicester and Leicestershire also scored
well on perceptions of drug use, anti-social behaviour and
are at less risk of household crime than those people in
comparable areas e.g. Coventry and Wolverhampton.
People in Leicester and Leicestershire have a lower fear of
crime compared to other comparable areas nationally, in
terms of antisocial behaviour and drugs crime and
household and or personal crime.
2211

ageghealthesagaggghealthhealth� Community CohesionAs a city Leicester has a good reputation for community
cohesion. There is a high level of acceptance of the
multi-ethnic, multi-cultural and multi-faith nature of the city
as evident in a number of anecdotal reports as well as in
several national surveys.
It is difficult to provide sound statistical data for the sense of
community cohesion within the city. However, over the last
few years a number of key questions about the values of our
residents and perceptions of life in Leicester have been asked
in two major surveys conducted every few years. These are
the Residents’ Survey conducted by MORI for the City Council
in 1998, 2003, and 2005 and the Best Value General Survey
for the Audit Commission in 2000, 2003 and 2006.
(Please note, while sometimes the same questions have
been asked, these two surveys use quite different methods
and so results cannot be directly compared with each other:
the Resident’s Survey is conducted via a face-to-face
interview while the General Survey is a postal questionnaire.)
Community Relations
In 2006 the Best Value General Survey asked the key
community cohesion indicator question for the first time.
This asks people if they think their local area is a place where
people from different backgrounds get on well together and
highlights whether or not residents think they live in an area
with good community relations. The results indicated that 84%
of Leicester’s residents agreed with this statement
compared to 78% in the East Midlands region and 79% nationally.
See Table 14.
SSoouurrccee:: Best Value General Survey 2006.
Sense of Belonging to Leicester
In 2005 the Residents’ Survey and in 2003 the General
Survey asked about the ‘sense of belonging’ in the city. This
question is based on the belief that a community is likely to
be more cohesive at the local level where people feel a
strong sense of belonging to their neighbourhood and or
local area. The 2005 Residents’ Survey results indicated that
the sense of belonging of people in Leicester to their street,
local area, Leicester, England and Britain was high compared
to comparable cities. A breakdown of these figures reveals
that this sense was highest amongst the city’s ethnic minority
population. 86% of the ethnic minority population they felt
they belonged to their street, area, Leicester, England and
Britain compared to only 75% amongst the white population.
See Table 15.
Satisfaction with Leicester as a Place to Live
Another indicator commonly used for community cohesion
is the proportion of people who are satisfied with the city in
which they live. Although there is a downward trend, in the
2005 Residents’ Survey 77% of residents said that they were
satisfied with Leicester as a place to live. See Table 16.Leicester East Midlands England
General Survey 2006 84% 78% 79%
TTaabbllee 1144:: ‘People from different backgrounds get onwell together’, England, 2006
SSoouurrccee:: Leicester Residents’ Survey 2005, Best Value General Survey
2003, 2006.
NNoottee:: The two Surveys are not directly comparable although each indicates
a similar sense of belonging.
% Your % Local % % %neighbour area Leicester England Britain
hoodBV General Survey 2003Residents’ Survey 2005
61.2 Not asked 71.4 76.3 73.2Survey 200374.5 74 79 84 84Survey 2005
Table 15: ‘‘Sense of belonging’ to Leicester, 2005
SSoouurrccee:: Leicester Residents’ Survey 1998, 2001, 2005.
Satisfaction with Leicester
Residents’ Survey 1998 81%
Residents’ Survey 2001 80%
Residents’ Survey 2005 77%
Table 16: Satisfaction with Leicester as a place tolive,1998-2005
2222

Sites of Cross-Cultural Mixing
The places where people meet with others of different
ethnicities in Leicester are principally at the local shops, on
public transport and at public events such as entertainment
and sports events. However a breakdown of these figures
from the 2005 Residents’ Survey in terms of gender, shows
that more men met regularly with people from different
ethnic origins at work, at restaurants and pubs, and by taking
part in sport. Women more regularly met those from
different ethnic origins at local shops and on public transport.
See Table 17.
NNoottee:: The two surveys are not directly compatible although each
indicates sites of cross-cultural interaction.
Culture and Community Cohesion
Another way that reflects the sense of community cohesion
in Leicester is the importance given to cultural activities in the
city. Through a range of activities around sport, art, music,
museums, libraries and fashion, food and faiths, the different
cultural traditions of the city are celebrated and inter-cultural
understanding developed between communities.
The city is renowned for its Diwali celebrations, which are the
second biggest outside India, its Christmas festival and
neighbourhood fun days, the Leicester Comedy Festival and
the Caribbean Carnival. Over five million people participate in
the city’s cultural events and activities every year (Leicester
City Council).
Electoral Participation
Electoral participation in local and national elections in
Leicester is also another measure of cohesion in that it
reflects the participation of all ethnic groups in civil society.
Interestingly, electoral participation varies significantly across
the city and varies from the national picture.
Nationally, the most disadvantaged in society are also the
most marginalised in terms of democracy. Young, poor, black
and ethnic minority people are less likely to be on the
electoral register, and therefore able to vote, than white
people, and even if they are on the register, they are also
less likely to go out to vote. Only 6% of white Britons are not
registered to vote, compared with 37% of Black Africans
(Department of Constitutional Affairs, Press Release,
16/01/2006).
However, in Leicester this national pattern is not so clear. A
significant pattern of voting in local elections in Leicester is
that the greater the diversity of an electoral ward the higher
the electoral turnout.
In the 2007 City Council elections, the four electoral districts
with the highest turnout were Latimer 58% (2003 51%),
Spinney Hills 55% (2003 48%), Belgrave 53% (2003 44%)
Evington 49% (2003 48%). This roughly corresponds to wards
with high levels of ethnic diversity. The four with the lowest
turnout are Castle 23% (2003 24%) Westcotes 25% (2003 24%),
Beaumont Leys 28% (2003 22%), and Braunstone Park and
Rowley Fields 29%, the largely white outer estates.
(Electoral Services, Leicester City Council).
The average electoral turnout in Leicester for the 2005
general election was 59%, and for the 2003 and 2007 local
elections was respectively 35% and 40%. Across England
the comparative figures were 61% (2005 general election)
and 35% (2003 local elections).
ageghealthesagaggghealthhealth
SSoouurrccee:: Leicester Residents’ Survey 2005,
Best Value General Survey 2003
% Local % % Work % Shops Neighbourhood Restaurants
pubs, cinemas
BV General
Survey 2003
Residents
Survey 2005
75 57 54 51
Residents
53 40 38 29
TTaabbllee 1177:: Sites of cross-cultural interaction, 2003-2005
2233

ageghealthesagaggghealthhealthIn terms of the ethnic minority representation on Leicester
City Council, and its predecessors, the first member elected
with an ethnic minority background was in 1973. Since then
the number of members elected with an ethnic minority
background has continued to rise.
The 2003-2007 Leicester City Council had 11 members with
an ethnic minority background, 20% of the total, of whom 10
were Asian and one a Black member. The 2007 – 2011
Council has 17 members with an ethnic minority background,
31% of the total, all of whom are Asian. These figures compare
favourably with national figures where ethnic minority repre-
sentation is only 4%.
The representation of women on the Council has
remained steady. The 2003-2007 Council had 12 women
representatives of whom one had an ethnic minority
background, and the 2007-2011 Council has 11 women
representatives of whom two have an ethnic minority
background.
� Data Sources
The Leicester Shire Research (LSR) online web portal is
a project sponsored by the Leicester Partnership to bring
together in one web-based site all the major statistical data
on Leicester. The statistical data is accessible for very small
areas in table and colour map formats. Access to LSR can be
found at www.lsr-online.org
Information Services, Department of Regeneration and
Culture, Leicester City Council also has a wide range of
statistical information on Leicester. Key websites include
www.leicester.gov.uk/about-leicester/city-statistics for general
demographic information and www.leicester.gov.uk/about-
leicester/city-statistics/ward-profiles—-2001-census for ward
profiles.
Other sources of statistical information include the 2001
Census data from the Office of National Statistics
www.statistics.gov.uk/census2001 and the Neighbourhood
Statistics site which provides a wider range of statistical data
for local areas www.neighbourhood.statistics.gov.uk.
Other Data Sources
The Home Office’s Research Development and Statistics
website, which includes statistics on crime, policing, justice,
immigration and drugs www.homeoffice.gov.uk/rds/
Department of Communities and Local Government website
contains wide range of information on regeneration,
sustainable communities, housing, social exclusion etc
www.communities.gov.uk/index.asp?id=1141801
Department for Education and Skills:
www.dfes.gov.uk/rsgateway/
Public Health information: ‘Choosing Health in Leicester:
Annual Report of the Director of Public Health 2005
www.phleicester.org.uk
CityStreAtZ: www.citystreatz.leicester.gov.uk
Social Atlas: www.leicester.gov.uk/about-leicester/social-atlas
This document has been prepared by Trish Roberts-
Thomson, with assistance from Rachel Clarke, Kurt
Coulter and Ian Robertson, Leicester City Council.
May 2008.
2244


hnicityagefaith
gg
nguagetytyommunithnicityhnicitynguagegetytyealth
employmeiti languagelanguagetttt
ducation
esionageageommunitommunityyealthealthelongingfaifaid tid ti
angladesagagfaitfait
ggealthealthffffmalielonelon
anglala
ooooo
tiontiontitititi