Embed Size (px)
Citation preview

1
Employer Skills Survey 2019: Skills Needs Research report
November 2020 Authors: Mark Winterbotham, Genna Kik, Sam Selner, Rebecca Menys, Sam Stroud and Sam Whittaker

2
Contents
List of figures 4
List of tables 6
Executive summary 7
Introduction 7
Where are the current skills bottlenecks? 7
Current skill demands 8
Addressing skills shortages 9
Future skills requirements 9
1. Introduction 11
Background to the Employer Skills Survey 11
Policy background 12
Methodological overview 13
Sampling 13
Questionnaire 14
Fieldwork 14
Weighting 14
Report coverage 14
Reporting conventions 15
2. Where are the current skills bottlenecks? 17
Chapter summary 17
Introduction 18
Overall picture – skill-shortage vacancies and skills gaps 19
Pockets of skill-shortage 22
Skills needs by country 22
Skills needs by Local Area 25
Sectoral distribution of skills needs 28
Occupational distribution of skills needs 31
Skill-shortage vacancies by job role 34
3. Which skills are lacking among applicants and the workforce? 39

3
Chapter summary 39
Introduction 39
Skills lacking in the available labour market 40
Skills lacking internally 52
4. Addressing skills shortages 60
Chapter summary 60
Introduction 61
Causes of skills gaps 61
Steps taken to address skills needs 63
What employers with skill-shortage vacancies look for when recruiting 65
Recruitment methods and strategies that are used by employers 66
Do employers with skills needs engage with skills policy initiatives? 68
5. Future skills requirements 70
Chapter summary 70
Introduction 70
The prevalence of the need to upskill 71
Occupations in most need of upskilling 72
Reasons for a need for upskilling 73
Upskilling: skills that need improving 75
6. Conclusions 80
Appendix A: Supplementary tables 82
Appendix B: Definitions for skills and causes of skills gaps groupings 150
Appendix C: Industry coding 152
Appendix D: Occupational Coding 155
Appendix E: Sampling error and statistical confidence 157
Appendix F: Survey population estimates (weighted) 159
Appendix G: References 160

4
List of figures Figure 2-1 Incidence, density and volume of skill-shortage vacancies and skills gaps over time .................................................................................................................................. 21
Figure 2-2 Incidence and density of skill-shortage vacancies (SSVs), by country ........... 23
Figure 2-3 Incidence and density of skills gaps over time, by country ............................. 24
Figure 2-4 Number and density of skill-shortage vacancies (SSVs), by sector ................ 29
Figure 2-5 Number and density of skills gaps by sector .................................................. 31
Figure 2-6 Density and number of skill-shortage vacancies (SSVs), by occupation ........ 32
Figure 2-7 Number and density of skills gaps by occupation ........................................... 33
Figure 2-8 The job roles with the highest and lowest skill-shortage vacancy densities .... 35
Figure 3-1 Technical and practical skills found difficult to obtain from applicants ............ 42
Figure 3-2 People and personal skills found difficult to obtain from applicants ................ 43
Figure 3-3 Digital skills lacking among applicants to establishments with IT-related skill-shortage vacancies (unprompted) ................................................................................... 45
Figure 3-4 Digital skills lacking among applicants to establishments with IT-related skill-shortage vacancies, by occupation (unprompted) ........................................................... 47
Figure 3-5 Types of skills lacking across sectors with the highest density of skill-shortage vacancies (SSVs) ............................................................................................................ 49
Figure 3-6 Types of skills lacking across occupations with the highest density of skill-shortage vacancies (SSVs) .............................................................................................. 51
Figure 3-7 Technical and practical skills lacking among staff with skills gaps .................. 52
Figure 3-8 People and soft skills lacking among staff with skills gaps ............................. 54
Figure 3-9 IT skills lacking among staff with skills gaps ................................................... 55
Figure 3-10 Skills lacking in sectors with highest density of skills gaps ........................... 57
Figure 3-11 Skills lacking in occupations with highest density of skills gaps .................... 59
Figure 4-1 Main causes of skills gaps (prompted) ........................................................... 62

5
Figure 4-2 Actions taken by establishments to overcome skill-shortage vacancies and skills gaps ........................................................................................................................ 64
Figure 4-3 What employers looked for in recruits, broken down by those with skill-shortage vacancies and those without them .................................................................... 66
Figure 4-4 Recruitment methods used in the last 12 months ........................................... 67
Figure 4-5 Engagement with skills policy initiative by skills need ..................................... 69
Figure 5-1 The proportion of establishments identifying a need for upskilling in the coming 12 months by country, size and sector ................................................................ 71
Figure 5-2 Single occupation most affected by a need for upskilling among establishments that employ that occupation and identified a need to upskill ................... 72
Figure 5-3 Reasons for expected need for new skills in next 12 months ......................... 73
Figure 5-4 Technical and practical skills that employers expect to need to develop in the coming 12 months ........................................................................................................... 76
Figure 5-5 People and personal skills that employers expect to need to develop in the coming 12 months ........................................................................................................... 77
Figure 5-6 Digital skills that employers expect to need to develop in the coming 12 months ............................................................................................................................. 79

6
List of tables Table 2-1 Skills needs by sector ...................................................................................... 28
Table 2-2 Density of skill-shortage vacancies by occupation within sector ...................... 36
Table 2-3 Density of skills gaps by occupation within sector (percentage of staff not fully proficient) ......................................................................................................................... 38
Table 5-1 Reasons for a need for upskilling, by nation (prompted) .................................. 74

7
Executive summary
Introduction The Employer Skills Survey (ESS) has run biennially since 2011, providing a vital source of intelligence on the skills issues employers face. ESS traditionally has an inward-looking focus assessing the current skills position and skills needs of employers. It has sat alongside the Employer Perspectives Survey, which is primarily outward-looking, covering provision engagement with the wider skills system. In ESS 2019, the two surveys were, in effect, merged, by incorporating EPS questions as modules.1 In total, 81,013 respondents across England, Northern Ireland and Wales responded to the survey.
This report focuses on findings relating to skills needs, focusing upon skill-shortage vacancies and skills gaps in the current workforce. It assesses where these skills needs are most keenly felt by employers, which skills in particular are lacking in the workforce and recruitment pool, how employers attempt to address these skills needs as well as considering anticipated future skills needs.
Where are the current skills bottlenecks? Overall, 5% of employers reported that they had skill-shortage vacancies (vacancies which are hard to fill because of a lack of the required skills, qualifications or experience) and 13% of employers reported that they had skills gaps among their workforce. These figures were in line with levels in 2017 regarding skills gaps (13%), but represented a slight decrease since 2017 regarding skill-shortage vacancies (6%).
Despite a decrease in the number of vacancies compared with 2017, there was an increase in the number of skill-shortage vacancies, with these skill-shortage vacancies comprising a larger proportion of all vacancies than in 2017 (24%, up from 22%). Similarly, the proportion of the workforce that were considered to be lacking in full proficiency (i.e. to have a skills gap) had also risen, albeit slightly, since 2017 (4.5%, up from 4.3%). This marks a reversal of the gradual decrease in skills gap density from 2011 to 2017 (the figure was 5.5% in 2011). These slight increases in skill-shortage vacancy and skills gap densities were driven by rises in England.
1 Prior to the 2019 survey, the ESS survey, along with its sister survey the UK EPS ran across the UK on alternate years. This means that comparisons over time refer to different survey years depending on whether the measure being referred to originated from the ESS or EPS survey prior to 2019. The report commonly refers to the last two waves of these surveys (i.e. ESS 2015 and 2017 and EPS 2014 and 2016).

8
In terms of where these skills needs are felt more sharply, skill-shortage vacancy density (the proportion of vacancies hard to fill because of skill shortages in applicants) was highest in the Construction and Manufacturing sectors, where 36% of vacancies were proving hard-to-fill because of applicants lacking the appropriate skills, qualifications or experience (compared to the 24% average). By occupation, employers faced the greatest challenges in finding suitably skilled candidates for Skilled Trades positions, with nearly half of vacancies in these roles being skill-shortage vacancies (48%). This occupational group also had the largest increase in skill-shortage vacancy density compared with 2017 (up 6 percentage points).
Skills gap density remained highest among the Hotels and Restaurants and Manufacturing sectors (6.9% and 5.8% respectively), with both having similar skills gap densities to levels seen in 2017 . In terms of occupation, Elementary Staff experienced the greatest increase in skills gap density compared with 2017 (a 1.7 percentage point increase) and were the occupations with the highest skills gap density (8.0%).
Current skill demands A wide range of skills were lacking among applicants. Over four-fifths (84%) of skill-shortage vacancies were at least partially caused by a lack of technical or practical skills (a small decrease from a figure of 88% in 2017); often a lack of specialist skills or knowledge needed to perform the role (63%). Two-thirds (66%) of skill-shortage vacan-cies were at least partially caused by a lack of people and personal skills, much lower than in 2017 (75%). The most common skill of this type lacking was the ability to man-age one’s own time and prioritise tasks (45%). Just under a third (30%) of skill-shortage vacancies involved a lack of digital skills.
Skills lacking among the existing workforce tended to match those discussed as lacking among recruits. In terms of technical and practical skills, specialist skills or knowledge required to perform the job role was the most prevalent specific skill lacking among staff (a factor in 53% of all skills gaps). The same proportion of skills gaps were partly due to a lack of operational skills (53%), while a lack of proficiency in complex analytical skills contributed to just under half of all skills gaps (47%). All three of these were most likely to be cited as skills deficiencies within the Financial Services sector. The most common people and soft skills lacking were related to self-management skills (72% of all skills gaps), including the inability among staff to manage their own time or prioritise tasks (60% of all skills gaps) or to manage their feelings and the feelings of others (49%). A lack of management and leadership skills were also a factor for approaching three-fifths (57%) of skills gaps. A lack of digital skills was a factor in around two-fifths of skills gaps (38%).

9
There was wide variation in the skills lacking among applicants and the current work-force by sector and occupation, reflecting very different skills challenges.
Addressing skills shortages Although transient factors (such as staff having been recruited who are not yet fully trained or experienced in their new role) regularly contributed to skills gaps (79%), they were rarely the exclusive cause of them (20%). Consequently, skills gaps were not exclusively caused by factors that would be expected to alleviate over time, and this was reflected in the fact that many employers actively took issues to address skills needs.
Unsurprisingly, the key difference in terms of the way that establishments tried to address skill-shortage vacancies and skills gaps related to the direction that employers looked when trying to address them: generally action was directed externally to address skill-shortage vacancies, and internally to address skills gaps. Consequently, the most common actions taken to overcome skill-shortage vacancies was to utilise new recruitment methods or channels (37%) or to increase advertising or recruitment spend (37%). Contrastingly, establishments tried to overcome skills gaps in their workforce most often by increasing training activity (64%), supervising staff more (55%), conducting more appraisals (46%) or implementing a mentoring scheme (45%).
New analysis for 2019 shows employers with skill-shortage vacancies tended to place more emphasis on each factor that they considered when recruiting staff than those that did not have skill-shortage vacancies, and were also more likely to utilise each different recruitment method and strategy during their recruitment process. Similarly, employers with skills needs were more likely to indicate that they had engaged with national skills policy initiatives, including taking on apprentices, trainees, expressing interest in offering work placements through the T-Levels scheme.
Future skills requirements Around two-thirds of employers anticipated the requirement to develop the skills of their workforce in the coming year (64%). The most common reasons for expecting to need to upskill their staff were in response to new legislative or regulatory requirements (42%), because of the introduction of new technologies or equipment (41%), the development of new products and services (35%) and the introduction of new working practices (35%).

10
The profile of skills that employers anticipated needing to develop was broadly similar to the profile of skills lacking among applicants and the current workforce. One key difference however was digital skills: these skills were more prominently a part of employers anticipation of upskilling requirements, perhaps reflecting the pace of change of digital skills requirements. The most common skills that were identified by employers as requiring upskilling were grouped as operational skills (52%), specialist skills or knowledge (50%), self-management skills (49%), management or leadership skills (48%) and digital skills (47%).

11
1. Introduction
Background to the Employer Skills Survey From 2010-2017, the Employer Skills Survey (ESS) sat alongside the Employer Perspectives Survey (EPS) to produce insights that complemented each other, with the two surveys run in alternate years (EPS was last conducted UK-wide in 2016). The focus of the Employer Perspectives Survey was primarily outward-looking, covering engagement with the education and skills system, whereas the Employer Skills Survey had a more inward-looking focus assessing the current skills position and skills needs of employers. For ESS 2019, the two surveys were in effect merged. The 2019 iteration of ESS is the fifth in a series conducted biennially since 2011.2 For the 2019 iteration, the survey covered England, Wales and Northern Ireland rather than the whole UK as in previous years.
A separate ‘core’ report covers the key ESS measures including recruitment and skill-shortage vacancies, skills challenges among the workforce; and training and workforce development activity. This report specifically explores employer skills needs and provides a more in-depth examination of some of the factors reported in the core report. This report covers the skills lacking in applicants and within the existing workforce, the causes of these skills challenges, the ways that employers have tried to address them, and an indication of potential future skills challenges.
It should be noted that the results presented in the report relate to employer skills needs prior to the Covid-19 pandemic: while the findings still provide an important source of labour market intelligence, clearly the economic landscape has changed significantly since survey fieldwork was conducted.
2 The 2011, 2013 and 2015 editions of the survey were commissioned by the UK Commission for Employment and Skills (UKCES). Responsibility for the ESS series transferred to the Department for Education following the closure of UKCES in 2016. The government has conducted employer surveys on skills and training since 1990, starting with the Skill Needs in Britain surveys. See Appendix B for more details on related predecessor surveys.

12
Policy background The period immediately prior to the fieldwork period for ESS 2019 was marked by continued economic growth,3 and high levels of job creation, with the employment rate at the end of the second quarter of 2019 at 76.1%, at that time the joint highest since records began.4 Another key characterisation of the UK economy during this period was its productivity gap relative to international competitors (Taylor, M., 2017). According to the most recent ONS estimates, the UK had the lowest productivity rate of all G7 countries except Italy.5 In the second quarter of 2019 output per hour fell by 0.5%, the largest quarterly fall in productivity in five years.6
Workplace skills as a driver of economic growth, and productivity growth specifically, remain central to government policy. As we enter a period of economic and labour market uncertainty, ensuring the workforce has the right skills will be more important than ever to aid recovery. While skills are recognised as a key contributor to productivity growth, it is widely held that (prior to the Covid-19 pandemic) the UK had a skills deficit. The Department for Education’s ‘Technical education reform: the case for change’ (July 2016) reported that ‘it is increasingly evident from international surveys that our current skills system is failing to fully meet the country’s needs across a range of skills’, including numeracy and literacy skills, and intermediate skills. It cited the OECD’s forecast that the UK would fall to 28th out of 33 OECD countries for intermediate skills by 2020. The report also discussed how skills shortages were posing significant challenges to employers, but argued that at the same time there was a lack of employer engagement and investment in education and training.7
These aspects of government policy and the broader understanding of the skills landscape in the UK act as crucial context for ESS 2019. This report considers the current skills needs of employers by considering skill levels in the workforce and among applicants to vacancies, as well as skills areas that employers believe they will need to upskill among their workforce in the near future. This analysis sheds light onto the current and future skills challenges that employers were facing pre-pandemic, as well as the types of action that employers were pursuing to address these issues.
3 2.7% growth in UK gross domestic product (GDP) between 2017 Q2 and 2019 Q2. Source: ONS, Quarterly National Accounts time series dataset March 2020, (2020). 4 ONS, Labour Market Overview: June 2019 (2019) 5 ONS, International comparisons of productivity: 2016 (2018) 6 ONS, Labour productivity, UK: April to June 2019, (2019) 7 DfE, Technical Education Reform: the case for change (2016)

13
Methodological overview This section briefly summarises the key features of the methodology for ESS 2019, further detail of which can be found in the published technical report on the gov.uk website. As in previous iterations of ESS, the survey was carried out in two parts, both of which were conducted by telephone: a core survey of establishments and a follow-up survey looking at the investment employers had made in providing training to employees in the previous 12 months (the “Investment in Training Survey”).8 This report does not present findings from the Investment in Training Survey.
Sampling
The population covered by the survey comprised employers with at least two staff on the payroll in England, Northern Ireland and Wales. The survey is conducted at the establishment level (rather than at an organisational level)9. Sole traders with a single person on the payroll were excluded.
The survey covered all sectors of the economy (the commercial, public and charitable spheres). The profile of this population was established through Office for National Statistics (ONS) data from the March 2018 Inter-Departmental Business Register (IDBR), the most up to date business population figures available at the time that sampling was conducted for the survey.
The sample of establishments was primarily sourced from the commercial data supplier Market Location. This was supplemented by records supplied directly through the IDBR to improve coverage of establishments in specific sectors and parts of sectors that are underrepresented in Market Location’s database.
Quotas for the main survey were set by size within sector separately for Wales, Northern Ireland and eight English regions, while in one region, the West Midlands, a slightly different approach was adopted. In this region a Random Probability Sampling method was trialled, with no quotas and instead interviews were attempted with all sample records loaded.
8 More information about the methodology for the Investment in Training Survey can be found in the ‘Training and Workforce Development’ thematic report that will be published alongside this report. 9 i.e. multiple sites (or premises) of a larger organisation were in scope for the research and were thus counted separately for sampling purposes. This was in recognition of the influence that local labour markets have on skill issues and the fact that skills issues are felt most acutely at the site level.

14
Questionnaire
ESS 2019 was designed to merge the ESS and EPS surveys to provide greater efficiency and to enhance the potential for cross analysis. The surveys were required to be combined in such a way that interview length stayed below 25 minutes: a longer survey would have impacted on response rates and the quality of information provided. To avoid an excessively long questionnaire the merger of two surveys required more extensive modularisation of the questionnaire than undertaken previously.
Questions that were included in the merged questionnaire were designed to be as consistent as possible with previous versions of the same question in order to ensure comparability over time.
Fieldwork
Fieldwork for the core survey was undertaken between May and December 2019 and involved 81,013 interviews. Fieldwork was conducted by three research agencies (IFF Research, BMG Research and Ipsos MORI). An overall response rate of 41% was achieved for the main survey.
Weighting
Findings from the core survey have been weighted and grossed up to accurately represent the total population of establishments in England, Northern Ireland and Wales with at least two people on their payroll, calculated using the March 2019 IDBR population statistics. This has been done on a size, sector and geographic basis. Separate weights were generated which allow findings to be presented (a) based on the number of workplaces reporting a particular experience, and (b) based on the number of employees and/or job roles affected by different challenges. For questions that were modularised (i.e. only asked of a random selected sample of respondents), modular versions of the workplace and employee weights were created.
Report coverage This report covers:
• Where there are ‘bottlenecks’ and particular pockets of skills shortage, including a comparison of the incidence, volume and density of skill shortages and how these differ by geography, sector and occupation;
• Specific skills that are lacking in the currently available labour market, as well as internally among the workforce, considering the types of skills that are in demand by employers;

15
• The causes of skill shortage vacancies and skills gaps (including the types of skill lacking) as well as the steps employers have been taking to address them;
• Whether employer recruitment strategies help or hinder the occurrence of skill-shortage vacancies, and the extent to which employers with skills needs engage with skills policy initiatives (e.g. apprenticeships, traineeships, etc.); and
• A view on potential skills needs over the coming 12 months (from the time at which the survey was conducted), including areas where employers anticipated fu-ture requirements to upskill their workforce.
Reporting conventions The terms “establishment”, “employer” and “workplace” are used interchangeably throughout this report to avoid excessive repetition.
Throughout the report unweighted base figures are shown on tables and charts to give an indication of the statistical reliability of the figures.
Prior to the 2019 survey, the ESS survey, along with its sister survey the UK EPS ran across the UK on alternate years. This means that comparisons over time refer to different survey years depending on whether the measure being referred to originated from the ESS or EPS survey prior to 2019. The report commonly refers to the last two waves of these surveys (i.e. ESS 2015 and 2017 and EPS 2014 and 2016).
In tables, “zero” is denoted as a dash (“-“); and an asterisk is used (“*”) if the figure is larger than zero but less than 0.5%.
Throughout the report, figures with a base size of fewer than 30 establishments are not reported (a double asterisk, “**”, is displayed instead), and figures with a base size of 30 to 49 are italicised and should be treated with caution.
The scale and scope of data collected in ESS 2019 means that it is a valuable research resource supporting detailed and complex statistical analysis of the inter-relationships between employer characteristics and their practices and experiences. The findings presented in this report reflect a descriptive exploration of the data. All differences referred to in the text are statistically significant at the 95% level of confidence. Significance testing on employer measures use the unweighted respondent base, while employment measures, and density measures such as the proportion of the workforce with skills gaps and skills-shortage vacancy density, have been calculated on the basis of the unweighted employment (or vacancy) base. Further statistical information can be found in Appendix E.

16
Usually survey data on occupations are discussed at one-digit standard occupational classification (SOC) level. However, on occasion to aid analysis, the report discusses occupations at a broader classification of high-skill, middle-skill, service-intensive and labour-intensive roles, as shown in Appendix D.

17
2. Where are the current skills bottlenecks? Chapter summary Overall, 5% of employers reported having skill-shortage vacancies at the time of the interview and 13% reported that there were skills gaps in their workforce.
Despite an overall fall in the number of vacancies compared with 2017, the number of skill-shortage vacancies in 2019 was higher than at any point since 2011. Almost a quarter (24%) of all vacancies were skill-shortage vacancies (up from 22% in the 2013 to 2017 period).
The proportion of the workforce that employers considered to be lacking full proficiency (i.e. had a skills gap) had also risen since 2017, albeit a relatively slight increase (from 4.3% to 4.5%). This did, however, mark a reversal of the gradual decrease observed from 2011 to 2017 (from a high of 5.5% in 2011).
In terms of the geographic profile of skills challenges, increases in skill-shortage vacancy density and skills gap density were predominantly driven by increases in England, where both figures rose compared with 2017. At a more disaggregated level there were highly localised pockets of skills bottlenecks, highlighting that these pressures can be felt in very specific areas of the country. In some instances, local areas with very challenging skills needs bordered areas with relatively low levels of skill needs.
Skills needs were particularly prevalent in certain sectors. Skill-shortage vacancy density was highest in the Construction sector (36%, the same as in 2017) and in Manufacturing (36%, a large increase from 29% in 2017, indicating growing skill-shortages in this sector). Skill-shortage vacancy density was lowest in the Public Administration and Financial Services sectors (13% in each case). The sectoral profile of skills gap density has remained relatively consistent over time, remaining highest in the Hotels and Restaurants sector (6.9% of the workforce were considered to have a skills gap) and lowest in the Education sector (2.8%).
By occupation, Skilled Trades roles have historically had the highest skill-shortage vacancy density; this continued in 2019. Such roles also saw the biggest increase in skill-shortage vacancy density since 2017 (48% up from 42%). Elementary occupations experienced the greatest increase in skills gap density compared with 2017 (1.7 percentage points) and were the occupational group with the highest skills gap density (8.0%), while managerial occupations had the lowest (2.2%).

18
Introduction ESS 2019 provides a detailed understanding of the level and nature of employer demand for new staff and the ability of the labour market to meet this demand, particularly in relation to applicants having the skills and qualifications employers require. In addition to this, it provides understanding of the proportion of the current workforce that employers consider to be fully proficient. These two key measures represent the current skills needs bottlenecks in the labour market and workforce. The key measures used in this chapter and throughout this report are:
Skill-shortage vacancies are defined within ESS as any vacancies that are proving hard to fill due to a lack of skills, experience or qualifications among applicants. ESS measures skill-shortage vacancies that employers are aware of. It would not include hard-to-fill vacancies that receive no applicants which could be the result of a skill short-age, especially where the job description has clearly stated high requirements. Equally, a reported skill-shortage vacancy – i.e. one which attracts applicants but none with the right skills – may be caused by relative unattractiveness of the role to a pool of potential appli-cants who do possess the right skills. Aspects of the role which influence would-be appli-cants, such as pay or working conditions, may not be recognised by the employer and therefore may not be represented in these findings.
Skill-shortage vacancies
Incidence
The number of establishments reporting at
least one skill-shortage vacancy
The number of establishments reporting at
least one skills gap
DensitySkill-shortage vacancies
as a proportion of all vacancies
The number of employees that lack full proficiency as
a proportion of all employees
Skills gaps
Volume
The number of vacancies that establishments have reported as being hard to fill due to skill-shortages
The number of employees that establishments have reported as lacking in full
proficiency

19
Skills gaps are defined as occurring when employees within a company do not possess all of the required skills to be fully proficient at their job. These can arise as a result of not being able to find suitably skilled applicants, or intentionally taking on recruits who are not fully experienced in order to train them up to the employer’s way of working, but can also arise for a host of other reasons such as the skills needed within an establishment changing. Some skills gaps may be by their nature temporary, for example where new staff have been recruited who are not yet fully trained or experienced in their new role: in this report these causes of skills gaps are considered to be ‘transient’. However, others can be more persistent and a result of under-investment in training and development, staff reluctance to develop existing skills or develop new ones, or high staff turnover. Persistent skills gaps can hinder an establishment’s ability to function effectively and harm its productivity, profitability and ability to innovate in terms of internal processes and regarding new products or services.
It is worth bearing in mind that the survey only captures the skills gaps that employers are aware of and report. Arguably, employers that pay little attention to their employees’ skills and the needs of their establishment may be less likely to report skill gaps. Some commentators have termed these ‘latent skill gaps’.10
This chapter explores the incidence of skill-shortage vacancies and skills gaps within the existing workforce at an overall level, by sector and by geography, focusing on areas of the current employer landscape with skills challenges that may be considered bottlenecks.
Overall picture – skill-shortage vacancies and skills gaps Only a relatively small minority reported that they had skill-shortage vacancies at the time of the interview (5%) or had any staff that were not fully proficient at their job (13%). Very few employers reported that they had both skill-shortage vacancies and skills gaps (2%).
Slightly fewer establishments had skill-shortage vacancies in 2019 (5%) than in 2017 (6%). As shown in Figure 2-1, this represents a break from the trend of generally increasing incidence of skill-shortage vacancies since 2011. Conversely, the proportion of employers who reported that at least some of their staff were not fully proficient has remained stable since 2017 (13%), following a gradual decline since 2011 (17%).
10 Terence Hogarth, Rob Wilson, Skills Matter: a Synthesis of Research on the Extent, Causes and Implications of Skill Deficiencies (2001)

20
Despite total vacancies falling (from 932,000 in 2017 to 877,000 in 2019), there was a small increase in the volume of skill-shortage vacancies (from 209,000 to 214,000). The combination of these factors saw skill-shortage vacancy density – the proportion of vacancies which are skill-shortage vacancies – increase to 24% (from 22% in 2017). This represents an nine percentage-point increase since 2011, when only 16% of vacancies were proving hard to fill due to difficulties in finding applicants with appropriate skills, qualifications or experience. This sustained increase in skill-shortage vacancy density is likely to reflect the tightening labour market (prior to Covid-19),11 both in terms of a continued reduction in unemployment and reduced access to migrant labour since 2016.
Skills gap density (the proportion of the workforce lacking full proficiency) also rose, marking the first increase in skills gap density since 2011, albeit a relatively slight increase. Skills gap density had decreased during the period 2011 to 2017 (from 5.5% to 4.3%), while the figure rose slightly to 4.5% in 2019.
Across England, Northern Ireland and Wales there were in total 214,300 skill-shortage vacancies (an increase compared to 208,700 in 2017), while 1.25 million employees were felt to be lacking proficiency (an increase compared to 1.15 million in 2017).
11 Less freely available labour – i.e. continued falls to unemployment and increases in employment, source: ONS, UK Labour Market: February 2020 (2020), and a sustained reduction of work-related migration, source: ONS, Migration Statistics Quarterly Report: February 2020 (2020)

21
Figure 2-1 Incidence, density and volume of skill-shortage vacancies and skills gaps over time
The likelihood that an establishment had a skill-shortage vacancy increased with size, from 2% of employers with 2 to 4 employees to 25% of those with 250 or more employees. In the same way, the proportion of establishments that reported any skills gaps among their staff increased with size: from 5% of establishments with 2 to 4 employees to around two-fifths (39%) of those with 250 or more employees. These changes are perhaps unsurprising, given that larger workforces offer more opportunity for skills gaps to occur and tend to correlate with greater recruitment activity and therefore offer a higher likelihood of skill-shortage vacancies too.
Although smaller employers were less likely to experience skills-shortage vacancies, as in 2017 the density of skill-shortage vacancies was higher among small establishments than large establishments. Over a third of vacancies in establishments with fewer than five employees were proving hard-to-fill due to skill-shortages (34%), compared to a fifth (20%) among establishments with 100 or more employees. The density of skills gaps was lower among smaller establishments. Establishments with 2 to 4 employees reported a smaller proportion of their workforce as not fully proficient (2.2%) than those with 5 to
3% 4%
6% 6%5%
16%
22% 22% 22%
24%
17%
15%14%
13% 13%
6% 5%
5%4% 5%
0%
5%
10%
15%
20%
25%
30%
2011 2013 2015 2017 2019
1,364,500 1,274,700 1,262,500 1,145,400 1,245,100Volume of skills gaps:
Base: All establishments 2019: 81,013; 2017: 81,413; 2015: 85,175; 2013: 85,265; 2011: 85.069
84,800 132,800 191,800 208,700 214,300Volume of SSVs:
Proportion of employers with
SSVs (incidenceof SSVs)
Skills gap density
SSV Density
Proportion of employers with
skills gaps

22
24 employees (4.3%) or 25 or more employees (4.9%). This was a similar pattern to findings in 2017 (2 to 4 employees: 2.4%, 5 to 24: 4.2% and 25 or more: 4.6%).
Table A.2.7 and Table A.2.8 in Appendix A provide a full breakdown of the incidence, number and density of skills gaps by size of establishment and sector. Table A.2.9 in Appendix A provides the density of skills gap by country.
Pockets of skill-shortage
Skills needs by country
It was more common for employers to report that they had skill-shortage vacancies or skills gaps in England (17%) or Wales (17%) than Northern Ireland (13%).
As demonstrated in Figure 2-2, the fall in skill-shortage vacancy incidence was driven by changes in Northern Ireland and Wales, where the incidence of skill-shortage vacancies decreased from 5% to 4% and 6% to 5% respectively. In England, the incidence of skill-shortage vacancies remained unchanged, at 6%.
In terms of skill-shortage vacancy density, the picture is not uniform: while the density of skill-shortage vacancies increased in England and Northern Ireland compared with 2017, it fell in Wales (where the number of skill-shortage vacancies remained relatively constant while the total number of vacancies increased).
In Northern Ireland, the skill shortage pressures that were building in 2017 were sustained. While historically employers in Northern Ireland have found vacancies much less hard to fill than the rest of the UK, in 2019 the density of skill-shortage vacancies in Northern Ireland were broadly in line with the average (22% compared with 24%).

23
Figure 2-2 Incidence and density of skill-shortage vacancies (SSVs), by country
Unlike with skill-shortage vacancies, the slight increase in skills gap density since 2017 was driven by changes in England. Although there were falls in skills gap density between 2017 and 2019 in Northern Ireland (from 3.8% to 3.3%) and Wales (from 4.7% to 4.0%), the overall picture was driven by the slight rise in in England (from 4.3% to 4.6%). In each nation skills gap density is lower or at the same level in 2019 than in 2015, as shown in Figure 2-3.
6% 6%
5%
6% 6% 6%
3%
5%
4%
6% 6%
5%
22% 22%
24%23%
22%
25%
14%
21%22%
24%
27%
24%
0%
5%
10%
15%
20%
25%
30%
Total England N. Ireland WalesBase: All establishments (2019: UK: 81,013; England: 70,217; NI: 4,023; Wales: 6,773)
See Table A.1.1 in Appendix A for full set of base sizes.
2015 2017 % of establishments with SSVs2019
Density (SSVs as % of vacancies)

24
Figure 2-3 Incidence and density of skills gaps over time, by country
14%
13% 13%
14%
13% 13%
9%
12%
10%
14%
13% 13%
5.0%4.3% 4.5%
5.0%4.3% 4.6%
3.3%3.8%
3.3%
4.5% 4.7%4.0%
Total England N. Ireland Wales
2015 2017 % of establishments with skills gaps2019
Density (proportion of staff with skills gaps)
Base: All establishments (2019: total: 81,013; England: 70,217; Northern Ireland: 4,023; Wales: 6,773)See Table A.1.1 in Appendix A for full set of base sizes.

25
Skills needs by Local Area
A key advantage of the ESS survey with its large sample size is that skills needs can be examined at a local level – either at the Local Authority (referred to as “local areas”) or Local Enterprise Partnership (LEP) level.12 By considering this local data it is possible to identify specific areas of the country where employers have reported greater skills needs, and to allow local areas gain a better understanding of the specific skills challenges in their area to allow a targeted local policy response. This section illustrates the type of local level data available and some of the wide variations in skills needs around the country. The detailed data tables and slide packs published alongside the ESS reports can be used to do more in-depth analysis of specific areas.13
The local areas with the highest density of skill-shortage vacancies were Lambeth, Luton, Middlesbrough and Poole, in each of these areas nearly half (48%) of all vacancies were proving hard to fill due to skill-shortages. The areas with the lowest density of skill-shortage vacancies were Walsall and Wokingham, where in each case just 7% of vacancies were skill-shortage vacancies.
The extent to which variation in skill-shortage vacancy density can exist at a local level is highlighted by the fact that Hartlepool, which is adjacent to Middlesbrough – with one of the highest skill-shortage vacancy densities in England – has a skill-shortage vacancy density of only 14%, significantly below the English average. Table A.2.13 in Appendix A demonstrates the 10 LEAs with the highest and lowest skill-shortage vacancy densities.
Turning to Local Enterprise Partnerships (LEPs), the LEP with the highest density of skill-shortage vacancies was Lancashire, where more than a third (36%) of vacancies were skill-shortage vacancies. The LEPs with the lowest density of skill-shortage vacancies were Sheffield City Region (19%); York, North Yorkshire and East Riding (19%); Cornwall and Isles of Scilly (20%); Derby, Derbyshire, Nottingham and Nottinghamshire (20%); and Leicester and Leicestershire (20%). Table A.2.14 in Appendix A lists the 10 LEPs with the highest and lowest skill-shortage densities. The 5 highest and lowest skill-shortage vacancies at an LEP level are presented on a map below (Figure 2-4), with additional colour coding to show regional skill-shortage vacancy density.
12 Due to low base sizes, some of the very small Local Authorities have been merged with larger adjoining LAs. Although no longer technically in use operationally, as in previous years, “Local Education Authority” definitions have been used to guide this merging. 13 Despite base sizes at a local level being large enough to allow for robust subgroup analysis, it is worth exercising slightly more caution with results at a local level as some of the more stark differences could relate to smaller base sizes. Any data based upon base sizes below 30 has been suppressed throughout this section of the report.

26
Figure 2-4 Map of LEPs in England with particularly high or low skill-shortage vacancy densities
Considering skills gaps among the existing workforce at a local level, three local areas stood out as having particularly high skills gap density figures: Blackburn with Darwen (11.3%), Knowsley (10.1%) and Reading (8.9%). Conversely, three local areas were found to have fewer than 2% of their workforce lacking in full proficiency: Wokingham (1.5%), Tower Hamlets (1.8%) and Hartlepool (1.9%). Again, strong localised variation in skills gap density can be demonstrated by the fact that Reading and Wokingham, neighbouring areas, were found to have among the highest and lowest skills gap density figures in England. Table A.2.15 in Appendix A demonstrates the 10 LEAs with the highest and lowest skills gap densities.

27
When analysing skills gap density by LEP, three had densities that stood out as being substantially higher than average: Leicester and Leicestershire (6.1%), Liverpool City Region (5.9%) and Greater Cambridge and Greater Peterborough (5.8%). Conversely, four LEPs stood out as having particularly low skills gap density figures: Black Country (3.0%), Stoke-on-Trent and Staffordshire (3.1%), Greater Birmingham and Solihull (3.5%) and London (3.6%). Table A.2.16 in Appendix A lists LEPs, highlighting those with the highest and lowest skills gap densities, while the 5 highest and lowest are presented on a map, with additional colour coding to demonstrate regional skills gap density levels, in Figure 2-5 below.
Figure 2-5 Map of LEPs in England with particularly high or low skills gap densities

28
Sectoral distribution of skills needs
As well as looking locally, the data allows us to look at the sectoral distribution of skills needs (the accompanying ESS data tables also allow an analysis of sectoral needs within local areas). When considering the proportion of employers that had skill-shortage vacancies or skills gaps, employers classified as within the Primary Sector and Utilities and Information & Communications sectors were the least likely to have either skill-shortage (both 11%). Contrastingly, the highest proportion of establishments reporting either skill-shortage vacancies or skills gaps were found in the Public Administration (25%), Hotels & Restaurants (23%), Manufacturing (22%) Education (21%) and Health & Social Work (21%) sectors. Table 2-1 below shows the proportion of employers within each sector that reported each type of skills shortages.
Table 2-1 Skills needs by sector
The experience of skill-shortage vacancies varied by sector. Reflecting the relative size of the sectors in employment terms, skill-shortage vacancies were most numerous in the Business Services and Health and Social Work sectors. Skill-shortage vacancy density, however, was highest in the Construction and Manufacturing sectors, where over a third of vacancies were proving hard to fill due to difficulties in finding applicants with appropriate skills, qualifications or experience (36%).
Base
Has a skill-shortage vacancy
Has a skills gap
Has both skills needs
Has either skills need
Has no skills needs
(n) (%) (%) (%) (%) (%) Total 81,013 5 13 2 17 83 Sector Primary Sector & Utilities 2,952 3 9 1 11 89
Manufacturing 6,234 8 17 3 22 78 Construction 5,249 4 10 1 13 87 Wholesale & Retail 17,503 5 15 1 18 82 Hotels & Restaurants 7,594 7 19 4 23 77 Transport & Storage 2,330 6 12 2 15 85 Information & Communications 2,511 5 8 1 11 89
Financial Services 1,577 5 16 2 19 81 Business Services 15,490 5 11 2 14 86 Public Admin. 840 7 21 3 25 75 Education 5,012 7 17 3 21 79 Health & Social Work 8,092 9 16 3 21 79 Arts & Other Services 5,629 5 12 1 15 85

29
Figure 2-6 Number and density of skill-shortage vacancies (SSVs), by sector
The sectoral pattern of skill-shortage vacancy density, in terms of the ordering of sectors from highest to lowest density (as in Figure 2-6, above) was broadly similar to both 2017 and 2015: Construction and Manufacturing remained among those most affected by skill-shortage vacancies, and Public Administration and Financial Services remained among those least affected (despite Public Administration seeing proportionately the largest increase in the number of overall vacancies, indicating that the increased volume of vacancies in this sector had not at the time of interview led to significant challenges in terms of finding applicants with suitable skills).
There were, however, some notable changes in the density of skill-shortage vacancies within sectors, with increased densities in:
• Manufacturing (from 29% in 2017 to 36%);
• Health and Social Work (from 21% to 25%);
• Business Services (from 24% to 27%);
• Wholesale and Retail (from 19% to 22%); and
• Hotels and Restaurants (from 17% to 21%).
The sectors with the biggest decreases in skill-shortage vacancy density since 2017 were Primary Sector and Utilities (from 36% to 31%), Information and Communications (from 28% to 23%), and Financial Services (from 17% to 13%).
17%
14%
17%
19%
22%
28%
26%
21%
29%
24%
36%
29%
36%
13%
13%
21%
22%
23%
23%
25%
25%
26%
27%
31%
36%
36%
Financial Services
Public Administration
Hotels & Restaurants
Wholesale & Retail
Education
Information & Comms
Arts & Other Services
Health & Social Work
Transport & Storage
Business Services
Primary Sector & Utilities
Manufacturing
Construction
2019 SSV density2017 SSV density
Base: All establishments with vacancies (range: Public Admin. 285 to Wholesale & Retail 3,584)
Number of SSVs (2019)
10,700
18,300
5,600
48,900
10,100
9,300
36,300
9,100
9,000
24,800
21,700
6,900
3,600

30
Table A.2.1 in Appendix A provides a detailed breakdown of skill-shortage vacancies by country, size of establishment and sector.
Turning to skills gap density, it is clear that there is a different pattern when comparing sectors with high skill-shortage vacancy and those with skills gaps densities; sectors with particularly high skill-shortage vacancy densities did not necessarily have particularly high skills gap densities. As well as this, the slight overall increase in the proportion of the workforce that was not fully proficient from 2017 to 2019 was broadly reflected across sectors, as shown in Figure 2-7. The sectors with the highest and lowest skills gap densities were broadly consistent with findings in 2017. Hotels and Restaurants (6.9%) and Manufacturing (5.8%) remained the two sectors with the highest proportions of their workforces lacking full proficiency, with the skills gap density in both increasing slightly since 2017, while Health & Social Work (3.3%) and Education (2.8%) remained the sectors with the lowest skills gap densities.
Two sectors saw particularly noteworthy changes in their skills gap densities:
• Public Administration saw a particularly large increase in skills gap density from 3.8% in 2017 to 5.3% of the workforce, although this was still lower than in 2015 (6.9%).
• In contrast, the Financial Services sector saw a marked decrease in skills gap density, falling from 5.0% in 2017 to 3.8% in 2019. This was accompanied by a 2% contraction in workforce size, and it may be the case that this reduction in employment has disproportionately affected staff lacking full proficiency (i.e. fully proficient staff were more likely to be retained).
Although skills gap density was highest in the Hotels and Restaurants and the Manufacturing sectors, the highest number of skills gaps existed in the Business Services sector (249,800) and the Wholesale and Retail sector (218,000 skills gaps). Together these two sectors accounted for 38% of all skills gaps, slightly more than their combined share of total employment (35%).

31
Figure 2-7 Number and density of skills gaps by sector
Despite having the lowest skills gap density overall, Northern Ireland had a particularly high density of skills gaps in the Manufacturing sector (8.3%). In Wales too, Manufacturing had the highest skills gap density (8.3%) although the figure was also high in the Hotels and Restaurants sector (7.2%).
Table A.2.7, Table A.2.8 and Table A.2.9 in Appendix A provide a detailed breakdown of skills gaps broken down by country, size and sector.
Occupational distribution of skills needs
By occupation, employers were most likely to have experienced skills-related difficulties in recruitment when recruiting for Skilled Trades positions. Nearly half of vacancies for such roles were proving hard to fill for skills-related reasons (a skill-shortage vacancy density of 48%). This occupation has had the highest density of skill-shortage vacancies in all previous iterations of the ESS series, and the skills situation has intensified in 2019, with skill-shortage vacancy density increasing by the highest amount of all occupation groups (from 42% to 48%).
2.8%
3.3%
3.9%
5.0%
3.3%
3.9%
4.6%
4.6%
4.2%
5.0%
3.8%
5.6%
6.7%
2.8%
3.3%
3.7%
3.8%
3.9%
3.9%
4.0%
4.1%
4.7%
5.1%
5.3%
5.8%
6.9%
Education
Health & Social Work
Arts & Other Services
Financial Services
Transport & Storage
Construction
Information & Communications
Primary Sector & Utilities
Business Services
Wholesale & Retail
Public admin.
Manufacturing
Hotels & Restaurants
2019 skills gap density
2017 skills gap density
Number of skills gaps (2019)
147,800
129,900
60,900
218,000
249,800
28,700
43,600
47,300
51,200
34,300
47,200
119,200
67,300
Base: All establishments in each sector (Total: 81,013; see Table A.1.1 in Appendix A for sector base sizes)

32
The pattern of skill-shortage vacancy density by occupation was broadly the same as in 2015 and 2017 (see Figure 2-8), though the density had increased among Professionals (from 30% in 2017 to 33%), Caring and Leisure Services (from 24% to 29%), Managers (from 17% to 22%), and Elementary (from 14% to 18%) roles (as well as for Skilled Trades, as already discussed).
Figure 2-8 Density and number of skill-shortage vacancies (SSVs), by occupation
As with sectors, the specific occupations that had particularly high skills gap densities were not necessarily the same as those that had particularly high skill-shortage vacancy densities. In terms of skills gaps, most occupations saw a slight increase in the proportion of staff lacking full proficiency from 2017 to 2019, with the exceptions of Skilled Trades and Sales and Customer Services occupations. Elementary Occupations saw a particularly large increase in skills gap density, rising from 6.3% of the workforce in 2017 to 8.0% in 2019. This was the only occupational group where skills gap density in 2019 exceeded the level in 2015.
17%
32%
22%
11%
44%
20%
15%
32%
14%17
%
30%
23%
15%
42%
24%
15%
32%
14%
22%
33%
20%
12%
48%
29%
14%
30%
18%
Managers Professionals AssociateProfessionals
Administrativeand Clerical
Skilled Trades Caring,Leisure and
Other Service
Sales andCustomerServices
MachineOperatives
ElementaryOccupations
2015 2017 2019
Base: All establishments in each sector (Total: 81,013; see Table A.1.1 in Appendix A for sector base sizes)
5,500
Number of skill-shortage vacancies:
40,900 27,000 9,300 40,500 33,200 12,000 19,500 22,900
26%High Skill
31%Middle Skill
22%Service
Intensive
22%Labour
Intensive

33
Figure 2-9 Number and density of skills gaps by occupation
The overall increase in skills gaps density compared to 2017 was mainly the result of an increase within Labour-intensive occupations (+1.0 percentage point); in other occupational groups there was either a slight increase (+0.3 percentage points in the High-skill grouping), or modest decreases (Middle-skill -0.1 percentage points, Service-intensive -0.3 percentage points).
At a national level, skills gap density was lower than the overall average in Northern Ireland for Elementary occupations (4.9% in Northern Ireland compared to 8.0% overall) and Caring, Leisure and Other Service occupations (1.6% in Northern Ireland compared to 3.7% total). In general, skills gap density was lower in Northern Ireland (3.3%) than at the overall level (4.5%).
In Wales, the two key differences in terms of skills gap density by occupation were that Elementary Staff in Wales had a lower skills gap density than the overall average (5.9% compared to 8.0%) while Machine operatives had a higher skills gap density than the average (7.0% compared to 5.2%).
2.8% 3.
0%
5.4%
5.4%
5.3%
4.1%
6.5% 6.
8% 6.9%
2.0% 2.
7%
4.1%
3.7%
5.6%
3.6%
7.0%
5.1%
6.3%
2.2%
3.0%
4.3%3.9%
5.1%
3.7%
6.4%
5.2%
8.0%
Managers Professionals AssociateProfessionals
Administrativeand Clerical
Skilled Trades Caring,Leisure and
Other Service
Sales andCustomerServices
MachineOperatives
ElementaryOccupations
2015 2017 2019
Base: All establishments in each sector (Total: 81,013; see Table A.1.1 in Appendix A for sector base sizes)
105,300
Number of skills gaps:
108,800 78,800 135,700 104,200 90,200 218,900 122,800 280,300
2.9%High Skill
4.3%Middle Skill
5.3%Service
Intensive
6.9%Labour
Intensive
34
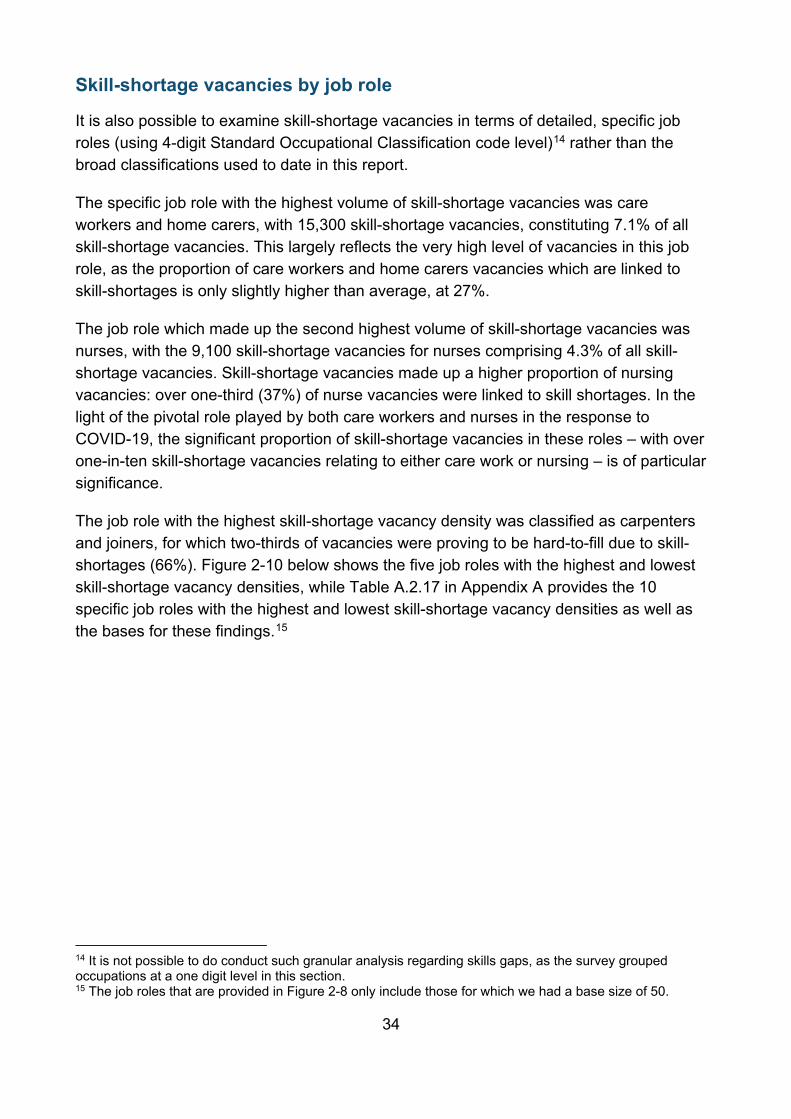
Skill-shortage vacancies by job role
It is also possible to examine skill-shortage vacancies in terms of detailed, specific job roles (using 4-digit Standard Occupational Classification code level)14 rather than the broad classifications used to date in this report.
The specific job role with the highest volume of skill-shortage vacancies was care workers and home carers, with 15,300 skill-shortage vacancies, constituting 7.1% of all skill-shortage vacancies. This largely reflects the very high level of vacancies in this job role, as the proportion of care workers and home carers vacancies which are linked to skill-shortages is only slightly higher than average, at 27%.
The job role which made up the second highest volume of skill-shortage vacancies was nurses, with the 9,100 skill-shortage vacancies for nurses comprising 4.3% of all skill-shortage vacancies. Skill-shortage vacancies made up a higher proportion of nursing vacancies: over one-third (37%) of nurse vacancies were linked to skill shortages. In the light of the pivotal role played by both care workers and nurses in the response to COVID-19, the significant proportion of skill-shortage vacancies in these roles – with over one-in-ten skill-shortage vacancies relating to either care work or nursing – is of particular significance.
The job role with the highest skill-shortage vacancy density was classified as carpenters and joiners, for which two-thirds of vacancies were proving to be hard-to-fill due to skill-shortages (66%). Figure 2-10 below shows the five job roles with the highest and lowest skill-shortage vacancy densities, while Table A.2.17 in Appendix A provides the 10 specific job roles with the highest and lowest skill-shortage vacancy densities as well as the bases for these findings.15
14 It is not possible to do conduct such granular analysis regarding skills gaps, as the survey grouped occupations at a one digit level in this section. 15 The job roles that are provided in Figure 2-8 only include those for which we had a base size of 50.

35
Figure 2-10 The job roles with the highest and lowest skill-shortage vacancy densities
Skills needs by occupation within sector
The previous section looked at the density of skill-shortage vacancies by sector and occupation separately. Exploring the density of skill-shortage vacancies by occupations within sectors provides a more detailed picture of where employers struggle to recruit the skills they need.
Though care should be taken not to over-extrapolate because of the relatively small base sizes in places, Table 2-2 details the skill-shortage vacancy density by occupation within sector. Many of these pockets of skill shortages have proved to be persistent over time. The much higher than average density of skill-shortage vacancies for Skilled Trades has been evident in a number of sectors (such as Manufacturing, Construction and Primary Sector and Utilities) across the ESS series.
Skill-shortage vacancy density has also remained high for Machine Operatives in the Construction and Transport and Storage sectors; for Professional occupations in Con-struction, Manufacturing, Information and Communications, and Health and Social Work; and for Elementary Staff in Primary Sector and Utilities.
1.0%
1.9%
4.9%
7.4%
7.6%
51.1%
58.4%
61.6%
62.4%
66.0%
Library clerks and assistants
Finance officers
Laboratory technicians
Customer serviceoccupations n.e.c.
Cleaning and housekeepingmanagers and supervisors
Vehicle technicians,mechanics and electricians
Butchers
Metal machining settersand setter-operators
Welding trades
Carpenters and joiners
Base: All establishments with each occupations (see Table A.2.17 in Appendix A)

36
Table 2-2 Density of skill-shortage vacancies by occupation within sector16
Tota
l
Skille
d Tr
ades
Occ
upat
ions
Prof
essi
onal
s
Mac
hine
Ope
rativ
es
Car
ing,
Lei
sure
and
Oth
er S
ervi
ce S
taff
Man
ager
s
Ass
ocia
te P
rofe
ssio
nals
Elem
enta
ry S
taff
Sale
s an
d C
usto
mer
Ser
vice
s St
aff
Adm
inis
trativ
e / C
leric
al S
taff Those where density was
40% and over
Those where density was 30% and over (but less than 40%)
Those where density was 22% and over (but less than 29%)
Those where density was less than 22%
Total 24% 48% 33% 30% 29% 22% 20% 18% 14% 12%
Manufacturing 36% 61% 36% 33% ** 27% 26% 12% 20% 12%
Construction 36% 43% 35% 37% ** 42% 43% 29% 10% 15%
Primary Sector & Utilities 31% 46% 42% 27% ** ** 31% 39% ** 21%
Business Services 27% 51% 33% 35% 40% 29% 23% 29% 13% 15%
Transport and Storage 26% 54% ** 35% 3% 13% 34% 14% 21% 9%
Health and Social Work 25% 24% 38% 12% 25% 21% 19% 10% 6% 6%
Arts and Other Services 25% 35% 9% ** 41% 12% 17% 14% 15% 9%
Information and Communications 23% 30% 36% ** ** ** 22% ** 9% 9%
Education 23% 12% 25% ** 29% 8% 26% 14% ** 8%
Wholesale and Retail 22% 54% 27% 25% ** 25% 27% 15% 14% 21%
Hotels and Restaurants 21% 45% ** 14% 17% 25% 18% 16% 10% 12%
Financial Services 13% ** 32% ** ** ** 11% ** 16% 10%
Public Administration 13% ** 25% ** ** ** 13% ** ** 10% Base: establishments with vacancies in each type of occupation, by sector (see Table A.2.4 in Appendix A) ** denotes a figure not shown because of a low base size (fewer than 30 establishments) Figures in italics denote a base size between 30 and 49 establishments
16 For the volumes of skill-shortage vacancies by occupation and sector, please see Table A.2.3, in Appendix A.

37
Some pockets of skill-shortage vacancies are either newly emerging, or have sharpened since 2017:17
• Skilled Trades in the Manufacturing sector (including job roles such as ‘Machine setters / tool makers’) is now the highest density pocket of skill-shortage vacan-cies, with over three-in-five (61%) vacancies in this sector proving hard-to-fill for skills related reasons (up from 40% in 2017);
• Professionals in Health and Social Work (‘Doctors’ and ‘nurses’), which has in-creased to 38% from 32% in 2017 – a trend which is reflected in reports of recruit-ment difficulties within the NHS which have been acknowledged by NHS Improve-ment;18 and
• Associate Professionals in the Construction sector (‘Building and engineering technicians’), up to 43% from 27% in 2017.
There are a small number of occupations within sectors where the density of skill-shortage vacancies has fallen compared to 2017, most notably: Machine Operatives within Primary Sector and Utilities (from 48% to 27%), including job roles such as ‘Agricultural machinery drivers’.
There were also some particularly marked occupational patterns within sectors regarding skills gap density, as shown in Table 2-3. Skills gap density among Elementary Staff was the highest of all occupations, peaking within this group among staff in the Business Services (12.3%) and Manufacturing (10.7%) services. These are pockets of particularly high skills gap densities that are unique to 2019, having been much lower in findings during the 2017 ESS (6.6% and 5.9% respectively). In 2017, the highest skills gap density was found in Sales and Customer Services staff within the Primary Sector and Utilities sector (19.8%), which had fallen to below average skills gap density in 2019 (3.4%).
Table A.2.9 and Table A.2.8 in Appendix A provide detailed breakdowns of skills gap density by occupation within country and sector respectively.
17 Only ‘pockets’ where the total number of skill-shortage vacancies is over 1,000 are discussed in this section. 18 NHS Improvement, Quarterly performance of the NHS provider sector: quarter 4 2018/19 (2019)

38
Table 2-3 Density of skills gaps by occupation within sector (percentage of staff not fully proficient)19
Tota
l
Elem
enta
ry S
taff
Sale
s an
d C
usto
mer
Ser
vice
s St
aff
Mac
hine
Ope
rativ
es
Skill
ed T
rade
s O
ccup
atio
ns
Ass
ocia
te P
rofe
ssio
nals
Adm
inis
trat
ive/
cler
ical
Sta
ff
Car
ing,
Lei
sure
and
Oth
er S
ervi
ce
Staf
f
Prof
essi
onal
s
Man
ager
s
Those where density was 10% and over
Those where density was 7% and over (but less than 10%)
Those where density was 4.5% and over (but less than 7%)
Those where density was less than 4.5%
Total 4.5% 8.0% 6.4% 5.2% 5.1% 4.3% 3.9% 3.7% 3.0% 2.2%
Hotels & Restaurants 6.9% 8.7% 8.2% 6.3% 5.3% 3.1% 5.8% 4.6% 6.7% 3.0%
Manufacturing 5.8% 10.7% 5.1% 6.9% 5.4% 4.9% 3.6% 7.9% 2.4% 2.7%
Public admin. 5.3% 7.5% 2.3% 6.8% 8.2% 6.6% 5.9% 4.8% 5.0% 2.0%
Wholesale & Retail 5.1% 6.3% 6.4% 4.9% 5.4% 6.0% 4.0% 3.4% 3.2% 2.5%
Business Services 4.7% 12.3% 6.3% 4.8% 4.9% 4.7% 3.7% 4.4% 3.8% 1.9%
Primary Sector & Utilities 4.1% 4.9% 3.4% 7.0% 3.8% 4.1% 3.9% 6.1% 3.8% 1.4%
Information & Communications 4.0% 6.1% 9.7% 6.9% 4.9% 3.4% 3.7% ** 2.4% 2.2%
Construction 3.9% 9.1% 5.3% 4.9% 5.6% 3.6% 2.9% ** 2.2% 1.3%
Transport & Storage 3.9% 9.3% 5.7% 2.8% 4.2% 3.8% 3.9% 0.7% 3.4% 2.4%
Financial Services 3.8% 3.8% 5.8% ** 0.6% 4.5% 3.9% ** 1.5% 3.2%
Arts & Other Services 3.7% 6.2% 4.7% ** 4.0% 3.0% 3.0% ** 2.3% 1.6%
Health & Social Work 3.3% 3.2% 5.5% 1.4% 2.8% 2.2% 3.6% 3.6% 3.1% 2.6%
Education 2.8% 3.8% 7.5% 2.0% 2.4% 2.7% 3.5% 3.3% 2.1% 1.7% Base: All establishments employing each occupation, by sector (see Table A.2.6 in Appendix A) ** denotes a figure not shown because of a low base size (fewer than 30 establishments) Figures in italics denote a base size between 30 and 49 establishments
19 For the volumes of skills gaps by occupation and sector, please see Table A.2.5, in Appendix A.

39
3. Which skills are lacking among applicants and the workforce?
Chapter summary
Introduction This chapter focuses upon which skills are currently in demand among employers either because of a perceived lack of availability in the current labour market or within their current workforce. The skills that are considered can be broadly grouped into three categories:
A wide range of skills were lacking among applicants. Over four-fifths (84%) of skill-shortage vacancies were at least partially caused by a lack of technical or practical skills (a small decrease from a figure of 88% in 2017); specifically a lack of specialist skills or knowledge needed to perform the role was a partial cause of nearly two-thirds (63%) of skill-shortage vacancies. Overall, 30% of skill-shortage vacancies were caused at least in part by a lack of digital skills.
Two-thirds (66%) of skill-shortage vacancies were at least partially caused by a lack of people and personal skills, much lower than in 2017 (75%). The most common skill of this type lacking was the ability to manage one’s own time and prioritise tasks. However, as with most people and personal skills, the proportion of skill-shortage va-cancies at least partially attributed to this (45%) was lower than in 2017 (50%).
The skills lacking among employers within the existing workforce remained relatively consistent with findings in previous years, with skills relating to self-management re-maining the most prevalent (72%). The most commonly lacking skills were the ability to manage their own time and to prioritise tasks (a factor in 60% of skills gaps), spe-cialist skills or knowledge needed to perform the role (53%) and team working (50%). Digital skills were a factor in around two-fifths of skills gaps (38%), with the most com-mon skill lacking being basic digital skills (47% of digital skills gaps related to basic digital skills).
When looking at sectors and occupations, there was unsurprisingly a wide variance in the kinds of skills lacking among applicants and the workforce. Some of these find-ings were more expected than others, such as sales and customer service skills be-ing a key skills gaps among Sales and Customer Service occupations, while others were perhaps more surprising such as the extent to which complex analytical skills contributed to skill-shortage vacancies among Primary Sector and Utilities employers.

40
The individual skills within these broader groupings are also grouped into smaller, more thematic groupings, as defined in Table B.1, Table B.2 and Table B.3 in Appendix B
This chapter considers each skill and the level at which they can be considered lacking among applicants and the current workforce, before considering the profile of the same factors (internally and externally) by sector and occupation.
Skills lacking in the available labour market Employers with skill-shortage vacancies were read a list of skills and asked, for each oc-cupation in which they reported skill-shortage vacancies,20 which skills were lacking. The specific skills that employers perceive to be lacking among applicants have been broadly grouped into the three categories outlined in the introduction to this chapter: technical and practical skills, people and personal skills and digital skills.
Technical and practical skills lacking among applicants
Looking first at technical and practical skills, 84% of skill-shortage vacancies were at least partially caused by a lack of technical or practical skills in applicants. This represents a decrease from a figure of 88% in 2017. Of the specific technical and practical skills lacking, a lack of specialist skills or knowledge needed to perform the role was the most commonly reported skill shortage. In line with 2017, this was mentioned as being at least a partial cause of nearly two-thirds of skill-shortage vacancies (63%).
20 Up to a maximum of two occupations chosen at random.
People and personal skills
‘Softer’, less tangible skills required to manage oneself and interact with others in the workplace.
Technical and practical skills
Specific skills required to perform the specific functions of a job role.
Digital skillsDigital skills required by employers such as using computers, technical skills and use of specific software suites.

41
Among the other technical and practical skills lacking, it is possible to group some of the skills. A lack of ‘operational skills’, including knowledge of products and services offered and/or knowledge of how the organisation works, has become relatively more prevalent, being at least partially responsible for 45% of skill-shortage vacancies (compared with 43% in 2017). As in 2017, shortages of such skills were especially prevalent among employers in the Wholesale and Retail sector, and appear to be increasingly prevalent among employers in the Financial Services sector (in both sectors a lack of such skills was at least partially responsible for 53% of skill-shortage vacancies; in Financial Services this represented an increase from 42% in 2017).
A lack of ‘complex analytical skills’ remains common. Approaching half (45%) of skill-shortage vacancies were attributed to a lack of this group of skills, although they were slightly less prevalent than in 2017 (48%). Within this grouping, the most prevalent was a lack of complex problem-solving skills (39%). A lack of complex analytical skills was most prevalent in the Information and Communications and Public Administration sectors, where they contributed to nearly three-fifths (58%) of skill-shortage vacancies.
A lack of basic level skills, defined here as basic numerical or basic IT skills, contributed to a third of skill-shortage vacancies (34%), representing a slight decrease from 2017 (39%). These skills contributed to a larger proportion of skill-shortage vacancies for the following groups of employers: those in Northern Ireland (46%, compared to 38% in Wales and 33% among those in England); smaller employers (42% among employers with 2 to 4 employees compared to 32% among large establishments with 100 or more staff); and employers in Transport and Storage (43%) and Primary Sector and Utilities (41%).

42
Figure 3-1 Technical and practical skills found difficult to obtain from applicants
People and personal skills lacking among applicants
Turning to people and personal skills, 66% of skill-shortage vacancies were at least partially caused by a lack of people and personal skills. This represents a substantial drop from 2017 (75%). Technical and practical skill shortages were already more prevalent than people and personal skill shortages in 2017, and in 2019 this difference became more pronounced.
As was the case in previous waves of ESS, the most common people and personal skill lacking among applicants was the ability to manage one’s own time and prioritise tasks – however the proportion of skill-shortage vacancies at least partially attributed to this has dropped since 2017 (from 50% to 45%). This represents a trend across most people and personal skills, which were generally less commonly cited as a reason for skill-shortage vacancies than in 2017.
When time management and task prioritisation skills are combined with the ability to manage one’s own feelings and handle the feelings of others – which was cited as a skilled lacking for 33% of all skill-shortage vacancies – just over half (52%) of skill-shortage vacancies were at least partly caused by a lack of ‘self-management skills’. As
16%
20%
17%
22%
22%
29%
25%
27%
32%
31%
36%
39%
64%
17%
18%
18%
21%
21%
23%
24%
26%
31%
32%
38%
39%
63%
Communicating in a foreign language
Advanced or specialist IT skills
Manual dexterity
Computer literacy / basic IT skills
Adapting to new equipment or materials
Basic numerical skills
Complex numerical/statistical skills
Writing instructions, reports etc.
Reading/understanding instructions,reports etc.
Knowledge of how the organisation works
Knowledge of products and servicesoffered
Solving complex problems
Specialist skills or knowledge
2019
2017
Base: All establishments with SSVs – up to two occupations followed up (2019: 6,529; 2017: 6,677)
45%
Operational skills
30%
Digital skills
45%
Complex analytical
skills
48%
2017
32%
2017
43%
2017
34%
Basic skills
39%
2017

43
in 2017, a lack of self-management skills was particularly prevalent for employers in the Hotels and Restaurants sector (a factor for 65% of all skill-shortage vacancies in the sector).
Over two-fifths (44%) of skill-shortage vacancies were at least partially attributable to a lack of ‘management and leadership’ skills, such as managing or motivating other staff, persuading and influencing others, and setting objectives and/or planning resources. Again, in line with 2017, a lack of management and leadership skills was most prevalent for employers in the Hotels and Restaurants sector (54%).
Another group of people and personal skills that were commonly lacking were ‘sales and customer skills’ – such as customer handling skills and sales skills – which were cited as a cause of just under four-in-ten (39%) skill-shortage vacancies. As was the case in 2017, a lack of such skills was particularly prevalent in the Arts and Other Services (55%) and Wholesale and Retail (50%) sectors. There was a sharp drop in the proportion of Financial Services skill-shortage vacancies attributable to a lack of these skills (from 71% to 39%).
Figure 3-2 People and personal skills found difficult to obtain from applicants
16%
24%
26%
24%
32%
33%
36%
38%
36%
50%
15%
21%
22%
22%
27%
31%
33%
34%
34%
45%
Making speeches or presentations
Setting objectives for others / planning resources
Sales skills
Instructing, teaching or training people
Persuading or influencing others
Managing or motivating other staff
Managing own feelings / handling those of others
Customer handling skills
Team working
Managing own time and task prioritisation
44%
Management / leadership
skills
39%
Sales / customer service skills
52%
Self-management skills
58%
2017
49%
2017
44%
2017
Base: All establishments with SSVs – up to two occupations followed up (2019: 6,529; 2017: 6,677)

44
Digital skills lacking among applicants
For the first time in 2019, employers that reported difficulties in finding applicants with adequate digital skills (30% of employers with SSVs) were asked about the specific IT skills they found difficult to obtain from applicants. Respondents with skill-shortage vacancies caused by a lack of IT skills most commonly found it difficult to find applicants with foundational digital skills such as using basic Microsoft Office applications (36% of IT-related skill-shortage vacancies were caused by these issues) or doing things such as turning on devices and typing (25% of IT-related skill-shortage vacancies were caused by these issues). Grouped, these basic skills contributed to half of digital skill-shortage vacancies (51%). More advanced IT skills did contribute collectively to a significant number of IT-related skills-shortage vacancies, although there was a wider spread of specific advanced IT skills that were contributing to these skills needs.
As Figure 3-3 demonstrates, a lack of more advanced IT skills was reported less commonly for each individual skill - for example, around an eighth (12%) of IT-related skill-shortage vacancies concerned advanced Microsoft Office skills or 'app' programming and development skills, and 7% related to a lack of data analysis, data analytics, or data science skills. These findings indicate that, insofar as a lack of IT skills was causing recruitment difficulties, it was generally a lack of fundamental skills which was most problematic, rather than a lack of more advanced skills.
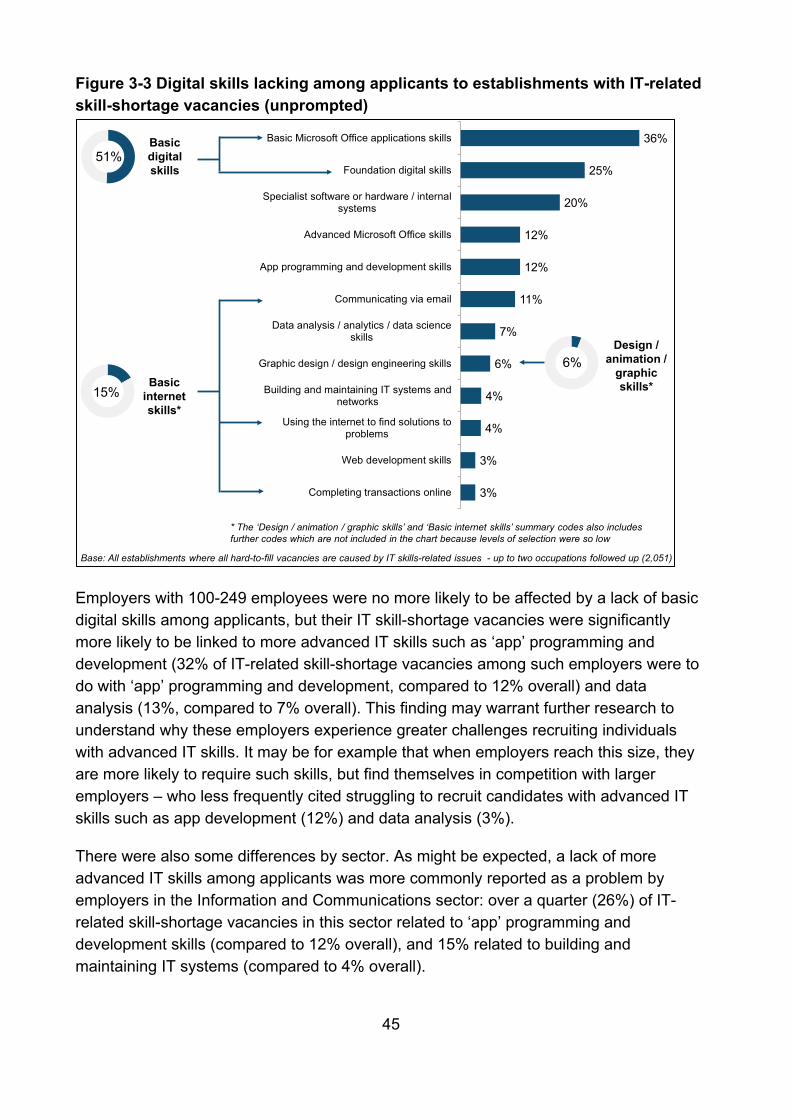
45
Figure 3-3 Digital skills lacking among applicants to establishments with IT-related skill-shortage vacancies (unprompted)
Employers with 100-249 employees were no more likely to be affected by a lack of basic digital skills among applicants, but their IT skill-shortage vacancies were significantly more likely to be linked to more advanced IT skills such as ‘app’ programming and development (32% of IT-related skill-shortage vacancies among such employers were to do with ‘app’ programming and development, compared to 12% overall) and data analysis (13%, compared to 7% overall). This finding may warrant further research to understand why these employers experience greater challenges recruiting individuals with advanced IT skills. It may be for example that when employers reach this size, they are more likely to require such skills, but find themselves in competition with larger employers – who less frequently cited struggling to recruit candidates with advanced IT skills such as app development (12%) and data analysis (3%).
There were also some differences by sector. As might be expected, a lack of more advanced IT skills among applicants was more commonly reported as a problem by employers in the Information and Communications sector: over a quarter (26%) of IT-related skill-shortage vacancies in this sector related to ‘app’ programming and development skills (compared to 12% overall), and 15% related to building and maintaining IT systems (compared to 4% overall).
3%
3%
4%
4%
6%
7%
11%
12%
12%
20%
25%
36%
Completing transactions online
Web development skills
Using the internet to find solutions toproblems
Building and maintaining IT systems andnetworks
Graphic design / design engineering skills
Data analysis / analytics / data scienceskills
Communicating via email
App programming and development skills
Advanced Microsoft Office skills
Specialist software or hardware / internalsystems
Foundation digital skills
Basic Microsoft Office applications skills
Base: All establishments where all hard-to-fill vacancies are caused by IT skills-related issues - up to two occupations followed up (2,051)
Design / animation /
graphic skills*
6%
51%Basic digital skills
Basic internet skills*
15%
* The ‘Design / animation / graphic skills’ and ‘Basic internet skills’ summary codes also includes further codes which are not included in the chart because levels of selection were so low

46
Certain sectors – potentially those where specialist sector- or business-specific IT systems are more prevalent – were more affected by a lack of specialist software, hardware or internal systems skills among applicants: for example 38% of IT-related skill-shortage vacancies in the Financial Services sector, and 35% of those in the Manufacturing sector, concerned specialist software, hardware or internal systems skills (compared with 20% overall).
While a lack of advanced IT skills among applicants was generally less frequent, employers were more likely to report a lack of advanced IT skills among applicants when recruiting for certain occupations. For example, nearly a quarter (24%) of IT-related skill-shortage vacancies in Professional occupations were related to ‘app’ programming and development skills, and over a quarter (26%) of IT-related skill-shortage vacancies in Administrative and Clerical occupations were related to advanced Microsoft Office skills (see Figure 3-4). At the same time, it is not simply service- or labour-intensive occupations which are affected by a lack of basic IT skills among applicants: nearly half (46%) of IT-related skill-shortage vacancies in Managerial occupations concerned basic Microsoft Office skills.
Figure 3-4 shows each occupation and the two most common digital skills (grouped as defined by the key in the figure) that contributed to IT-related skill-shortage vacancies among these occupations. The proportion of skill-shortage vacancies to which digital skills issues contributed overall is also provided to give a sense of the importance of digital skills for each occupation.

47
Figure 3-4 Digital skills lacking among applicants to establishments with IT-related skill-shortage vacancies, by occupation (unprompted)
In summary, where recruitment difficulties are being caused by a lack of IT skills amongst applicants, more basic IT skills such as basic Microsoft office skills or foundation digital skills were the most common contributor to IT-related skill-shortage vacancies, although a lack of advanced IT skills also contributed to the picture.
Types of skills lacking among applicants by sector
As discussed in the second chapter of this report, the four sectors with the highest density of skill-shortage vacancies were Construction, Manufacturing, Primary Sector and Utilities, and Business Services, with the Manufacturing sector registering a particularly notable increase in skill-shortage vacancy density since 2017. The broad skills characteristics lacking among applicants for these sectors, relative to the average across all occupations, is illustrated in Figure 3-5. The skills groupings used throughout this section are detailed in Table B.1, Table B.2 and Table B.3 in Appendix B
In the Construction sector, skills relating to complex analytical skills and self-management were disproportionately likely to be lacking among applicants (54% and 61%, respectively, compared to respective figures of 45% and 52% overall).
49%
29%
28%
41%
24%
26%
21%
24%
15%
52%
31%
39%
56%
27%
41%
28%
25%
46%
ElementaryStaff
Machineoperatives
Sales andCustomerService
Caring / leisure/
Other Services
Skilled trades
Admin / clericalstaff
Assoc.Professonals
Professionals
Managers
Basic Microsoft Office skills
Specialist software or hardware /
internal systems skills
App programming & development skills
Advanced Microsoft Office skills
Foundation digital skills
KEY
Base: All establishments where all hard-to-fill vacancies are caused by IT skills-related issues in each type of occupation – up to 2 occupations followed up (range: Managers 96; Professionals 398)
34%
30%
36%
44%
23%
31%
32%
19%
26%
% of SSVs to which digital
skills contributed

48
Despite the high skill-shortage vacancy density in the manufacturing sector, as shown in Figure 3-5, each broad skill grouping utilised was less likely to contribute to skill-shortage vacancies than among the average employer, with the exception of operational skills (45% for both Manufacturing employers and all establishments). Looking at specific skills lacking amongst applicants, employers in the Manufacturing sector were substantially more likely to cite a lack of skills to do with adapting to new equipment or materials among applicants (32% of skill-shortage vacancies in the Manufacturing sector were linked to this, compared with 21% overall), which could be a reflection of the introduction of new technologies in the sector. It is also worth noting that employers in this sector were more likely to mention issues with communicating in a foreign language among applicants (26%, compared with 17% overall), which may be linked to the integration of Manufacturing companies into international supply chains. For more detailed information about the specific skills lacking amongst applicants in the Manufacturing sector, please see Table A.3.3, Table A.3.4 and Table A.3.5 in Appendix A.
For Primary Sector and Utilities employers, as shown in Figure 3-5, skills that were most prominently lacking among applicants included those grouped as complex analytical skills (56% compared to 45% among all establishments) and self-management skills (58% compared to 52% among all establishments). When considering skills at a more specific level than those shown in Figure 3-5 (which are shown in Table A.3.3, Table A.3.4 and Table A.3.5 in Appendix A), the areas of skill shortages become more clear again: in particular, employers linked skill-shortage vacancies to applicants lacking specialist skills or knowledge needed to perform specific roles (75%, compared with 63% overall). Employers in this sector were also substantially more likely than average to link skill-shortage vacancies to a lack of people and personal skills among applicants (74%, compared with 66% overall), again indicating a broad-based issue with a lack of skills among applicants in this sector.
A lack of complex analytical skills was a key contributor to skill-shortage vacancies in the Business Services sector (51% of skill-shortage vacancies in this sector were at least partly attributable to a lack of complex analytical skills). Skill-shortage vacancies in this sector were also more likely than average to be linked to skills relating to management and leadership (49%, compared with 44% overall).

49
Figure 3-5 Types of skills lacking across sectors with the highest density of skill-shortage vacancies (SSVs)
Operational
Digital
Managementand Leadership
Sales andCustomer
Self-Management
Operational
Digital
Managementand Leadership
Sales andCustomer
Self-Management
Operational
Digital
Managementand Leadership
Sales andCustomer
Self-Management
Operational
Digital
Managementand
Leadership
Sales andCustomer
Self-Management
Cons
truc
tion
Busi
ness
Ser
vice
sPr
imar
y Se
ctor
& U
tiliti
es
Man
ufac
turin
g
All sectors
SSVdensity
36%
SSVdensity
31%
SSVdensity
36%
SSVdensity
27%All sectors
All sectors
All sectors
Complex analytical Complex analytical
Complex analytical Complex analytical
Base: All establishments with SSVs for the given occupations – up to two occupations followed up (All: 6,529, Primary Sector & Utilities: 149, Manufacturing: 660, Construction: 339, Business Services: 1,231)

50
The types of skills lacking among applicants by occupation
The four occupations in which employers experienced the most significant challenges in recruiting sufficiently skilled labour were Skilled Trades, Professionals, Machine Operatives, and Caring, Leisure and Other Services. The broad skills characteristics lacking among applicants for these occupations, relative to the average across all occupations, is illustrated in Figure 3-6. The skills groupings used throughout this section are detailed in Table B.1, Table B.2 and Table B.3 in Appendix B
For Skilled Trades, the category with by far the highest density of skill-shortage vacancies, the types of skills lacking broadly demonstrated a similar pattern to the overall average when looking at the broad groupings of skills, albeit with less of an emphasis on digital skills and sales and customer service skills. Looking outside the skills groupings shown in Figure 3-6, applicants to Skills Trades positions were disproportionately reported to be lacking skills such as specialist skills or knowledge needed to perform the role (a lack of such skills contributed to 72% of skill-shortage vacancies in Skilled Trades roles, compared with 63% across all skill-shortage vacancies), and manual dexterity (36%, compared with 18% overall). For more detailed information about the specific skills lacking in Skilled Trades occupations, please see Table A.3.6, Table A.3.7 and Table A.3.8 Appendix A.
Across the three other occupational categories, a similar pattern is demonstrated, with applicants less likely than average to lack skills in the broad skill categorisations. The one exception to this is applicants to Caring, Leisure and Other Service roles, where applicants were disproportionately likely to lack sales and customer service skills (a lack of such skills contributed to 49% of skill-shortage vacancies in Caring, Leisure and Other Service roles, compared with 39% across all skill-shortage vacancies) and self-management skills (64%, compared with 52% overall).
Table A.3.2 to Table A.3.8 in Appendix A provide a full breakdown of the skills lacking in the available labour market, by country, occupation and sector.
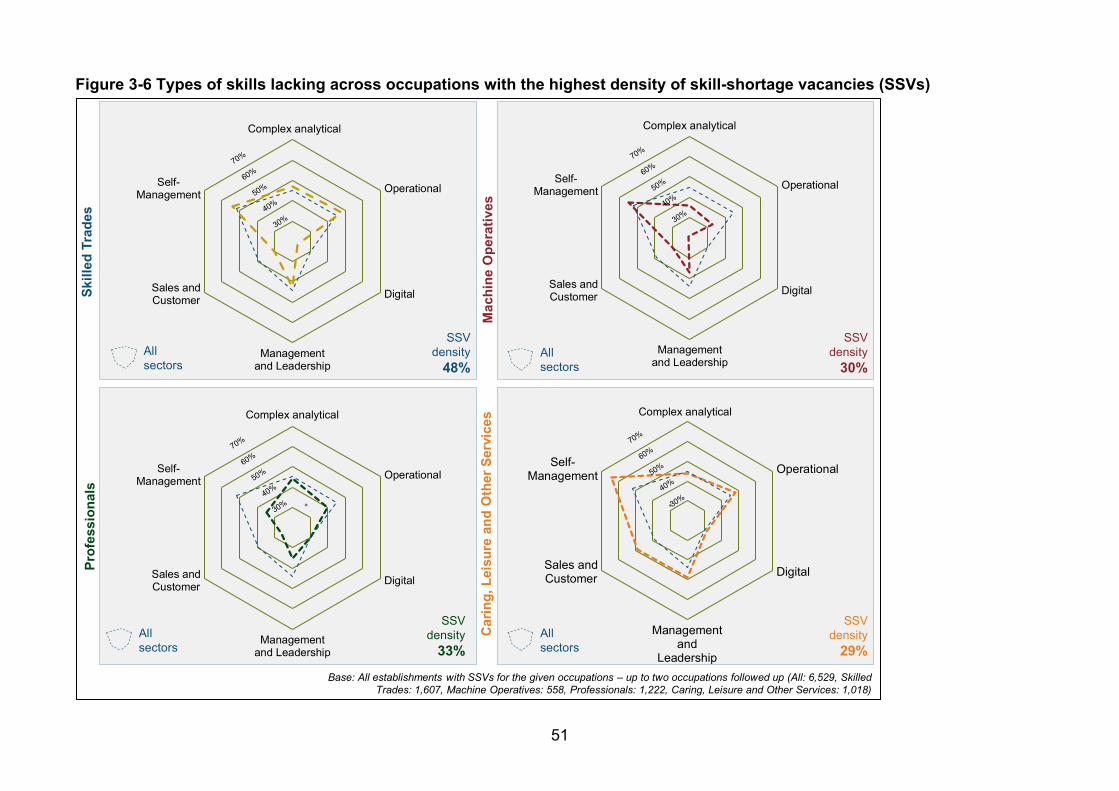
51
Figure 3-6 Types of skills lacking across occupations with the highest density of skill-shortage vacancies (SSVs)
Operational
Digital
Managementand Leadership
Sales andCustomer
Self-Management
Operational
Digital
Managementand Leadership
Sales andCustomer
Self-Management
Operational
Digital
Managementand Leadership
Sales andCustomer
Self-Management
Operational
Digital
Managementand
Leadership
Sales andCustomer
Self-Management
Carin
g, L
eisu
re a
nd O
ther
Ser
vice
sM
achi
ne O
pera
tives
Prof
essi
onal
s
All sectors
SSVdensity
48%
SSVdensity
30%
SSVdensity
33%
SSVdensity
29%All sectors
All sectors
All sectors
Complex analytical Complex analytical
Complex analytical Complex analytical
Skill
ed T
rade
s
Base: All establishments with SSVs for the given occupations – up to two occupations followed up (All: 6,529, Skilled Trades: 1,607, Machine Operatives: 558, Professionals: 1,222, Caring, Leisure and Other Services: 1,018)

52
Skills lacking internally This section examines the specific skills that employers felt were lacking among their workforce. Employers with skills gaps were asked, for up to a maximum of two occupations in which they reported skills gaps, which skills were lacking. The specific skills that were put to employers as potential causes of a lack of proficiency in the workforce were the same as those utilised in the previous analysis of skills lacking among applicants, which were outlined in the introduction to this chapter: technical and practical skills, people and personal skills and digital skills.
Technical and practical skills lacking internally
At an overall level, it was generally the case that each technical and practical skill listed in Figure 3-7 contributed to a greater proportion of skills gaps than they had in 2017.
A deficiency in specialist skills or knowledge required to perform the job role was a contributing factor to around half of all skills gaps (53%), rising to around seven in ten within the Financial Services and Manufacturing sectors (73% and 65% respectively).
Figure 3-7 Technical and practical skills lacking among staff with skills gaps
As in 2017, a lack of knowledge of a company’s products, services and internal processes was also a common cause of skills gaps (43%, compared to 39% in 2017). A
13%
12%
19%
20%
21%
23%
25%
31%
28%
35%
36%
39%
47%
17%
18%
20%
23%
24%
24%
28%
34%
36%
40%
41%
43%
53%
Communicating in a foreignlanguage
Manual dexterity
Advanced or specialist IT skills
Complex numerical / statisticalskills
Basic numerical skills
Writing instructions, reports etc.
Computer literacy / basic IT skills
Reading / understandinginstructions, reports, etc.
Adapting to new equipment ormaterials
Knowledge of how yourorganisation works
Solving complex problems
Knowledge of products andservices offered
Specialist skills or knowledge
2019
2017
Complex analytical skills
Operational skills
Digital skills
47%
53%
38%
Base: All establishments with skills gaps (2019: 16,169; 2017: 16,519)
43%
2017
48%
2017
35%
2017
Basic skills
53%
48%2017
53
need to improve such operational skills21 contributed to more than half of all skills gaps (53%, rising to 67% in the Financial Services sector). Operational skills contributed to a greater proportion of skills gaps in 2019 (53%) than in 2017 (48%).
A lack of proficiency in complex analytical skills contributed to just under half (47%) of all skills gaps, a slight increase from 2017 (43%), though this skills gap was more common among establishments in the Information and Communications (62%), Financial Services (57%), and Health & Social Work (56%) sectors.22
Around two-fifths of skills gaps (38%) involved a deficiency in digital skills, which includes both basic computer literacy and IT skills (28%) as well as more advanced or specialist IT skills (20%). The proportion of skills gaps that can be at least partly attributed to a lack of proficiency in digital skills was higher than in 2017 (35%).
Table A.3.9 to Table A.3.16 in Appendix A present the technical and practical skills lacking in the workforce by occupation, nation and sector.
People and soft skills lacking internally
The most common people and soft skills that were identified as causing skills gaps in 2019 were broadly in line with findings in 2017, with the most common such skill lacking relating to an inability to manage their own time or prioritise their own tasks (60%). This cause of skills gaps, alongside the ability to manage one’s own feelings and handle the feelings of others, which contributed to half of all skills gaps (49%), means that approaching three-quarters of skills gaps were at least partially caused by a lack of what can broadly be categorised as ‘self-management skills’ (72%). A lack of self-management skills was a contributing factor to a higher proportion of skills gaps in the Health & Social Work sector (80%).
21 Operational skills were defined as knowledge of products and services offered and knowledge of how your organisation works. 22 Complex analytical skills included specialist skills or knowledge needed to perform the role and solving complex problems requiring a solution specific to the situation.

54
Figure 3-8 People and soft skills lacking among staff with skills gaps
A lack of management and leadership skills contributed to around six in every ten skills gaps (57%), though to a higher proportion of gaps in Information and Communications (75%) and Health and Social Work (69%). As in 2017, sales and customer service skills were lacking for around half of all staff with skills gaps (50%).
IT skills lacking internally
For the 2019 iteration of ESS, employers that identified skills gaps in their workforce related to IT skills were asked which specific IT skills were causing skills gaps in their workforce (8% of all employers and 38% of all employers with skills gaps). The most common IT related skill that needed improving in this group was basic Microsoft Office skills, which was a factor in a third of IT-related skills gaps (35%). Other commonly expressed IT related skills that needed improving included specialist software or hardware and internal systems (26%), foundational digital skills (19%) as well as advanced Microsoft Office skills (18%). Skills that were considered to be basic digital skills (which included foundation digital skills and basic Microsoft Office skills) were a factor in almost half (46%) of IT-related skills gaps. A list of the specific IT skills that were factors in IT skills gaps can be found in Figure 3-9.
16%
26%
25%
27%
35%
37%
45%
43%
50%
59%
19%
26%
28%
30%
38%
45%
45%
49%
50%
60%
Making speeches or presentations
Sales skills
Setting objectives for others /planning resources
Instructing, teaching or trainingpeople
Persuading or influencing others
Managing or motivating other staff
Customer handling skills
Managing own feelings / handlingthose of others
Team working
Managing own time and taskprioritisation
2019
2017
Management / leadership skills
Sales / customer services skills
Self-managementskills
57%50%
72%
53%
201750%
2017
67%
2017
Base: All establishments with skills gaps (2019: 16,169; 2017: 16,519)

55
When considering this by sector, foundation digital skills were a factor in a higher proportion of IT-related skills gaps within the Hotels & Restaurants (28%) and Wholesale & Retail sectors (28%). Issues relating to specialist software or hardware and internal systems contributed towards skills gaps in around three-fifths of IT skills gaps in the Public Administration (60%) and two-fifths for the Health and Social Work (43%) sectors, both levels far above the average.
Figure 3-9 IT skills lacking among staff with skills gaps among establishments with skills gaps caused by a lack of IT skills
Profile of skills lacking in high skills gap density sectors
Figure 3-10 demonstrates the profile of skills contributing to skills gaps at the overall level as well as in the three sectors with the highest skill gap densities. As demonstrated, the overall profile of skills lacking in the workforce was relatively similar to the overall profile in 2017, although there has been a slight increase in complex and analytical skills gaps in 2019. The skills groupings used throughout this section are detailed in Table B.1, Table B.2 and Table B.3 in Appendix B
Within the Hotels and Restaurants sector, a far higher proportion of skills gaps were related to sales and customer skills (71%) and a slightly higher proportion were caused
5%
5%
5%
6%
10%
18%
19%
26%
35%
Using the internet to findsolutions to problems
Application ('app') programmingand development skills
Skills using new or updatedcompany software or systems
Data analysis / analytics / datascience skills
Communicating via email
Advanced Microsoft Office skills
Foundation digital skills
Specialist software or hardware/ internal systems
Basic Microsoft Office skills
Base: All establishments with skills gaps followed up caused by a lack of IT skills (6,408)
Basic digital skills
46%

56
by management and leadership (62%) than the average (50% and 57% respectively). Skills gaps in this sector were far less likely to have been caused by digital skills (21%) compared to the overall picture (38%), however.
In the Manufacturing sector, a greater proportion of skills gaps were caused by complex and analytical (54%) and operational related skills (57%) compared to the average (47% and 53% respectively), but far fewer skills gaps were caused by sales and customer related skills (17%) than the average (50%).
The Public administration sector had a higher than average skills gap density but the skills lacking in this sector were spread out more widely and more thinly between each skill Indeed, fewer skills gaps were caused by the areas shown in Figure 3-10, except for digital skills, this being a result of each person lacking proficiency being described as having fewer skills gaps. One specific skill where skills deficiencies contributed to a higher proportion of skills gaps than average (although not shown in Figure 3-10), was adapting to new equipment or materials (47% compared to 36%), as shown in Table A.3.10 in Appendix A.

57
Figure 3-10 Skills lacking in sectors with highest density of skills gaps
Operational
Digital
Managementand
Leadership
Sales andCustomer
Self-Management
Operational
Digital
Managementand
Leadership
Sales andCustomer
Self-Management
Operational
Digital
Managementand
Leadership
Sales andCustomer
Self-Management
Operational
Digital
Managementand Leadership
Sales andCustomer
Self-Management
All s
ecto
rs
Publ
ic a
dmin
.Ho
tels
and
Res
taur
ants
Man
ufac
turin
g
All sectors
Skills gapdensity4.5%
Skills gapdensity6.9%
Skills gapdensity5.8%
Skills gapdensity5.3%
All sectors
All sectors
All sectors
Complex analytical Complex analytical
Complex analytical Complex analytical
2017 allsectors
Base: All with skills gaps (16,169)

58
Profile of skills lacking in high skills gap density occupations
The profile of the skills lacking among the three occupational groups with the highest densities of skills gaps (Elementary, Sales and customer Services, and Machine Operatives) is shown in Figure 3-11.
The profile of skills lacking within occupations classified as Elementary Staff was broadly similar to the profile of skills lacking overall, although a notably lower proportion of skills gaps related to Complex analytical skills (39%) and Digital skills (25%) than the overall profile (47% and 38% respectively).
Predictably, deficiencies in sales and customer skills contributed to the greatest proportion of skills gaps among employees in Sales and customer service occupations (75%), at a rate far above the overall picture (50%). Self-management also contributed to a large proportion of skills gaps for these occupations (75%), albeit this was more in line with the overall average (72%).
Despite occupations classified as being Machine Operatives having a higher than average skills gap density, these skills gaps were less consistently identified as being caused by the factors displayed in Figure 3-11 than among all occupations overall, perhaps unsurprisingly most notably regarding sales and customer skills (24% compared to 50% overall).
Employees in high-skill occupations (Managers, Professionals and Associate Professionals) were more likely than average to be deficient in management and leadership skills (72% when grouped compared with 57% overall). Complex-analytical skills were more commonly identified as areas needing improvement among high-skill and middle-skill occupations (57% and 53% respectively) than the overall average (47%). Operational skills contributed to the highest proportion of skills gaps among staff in Service-intensive professions (60% compared to the overall average of 53%).
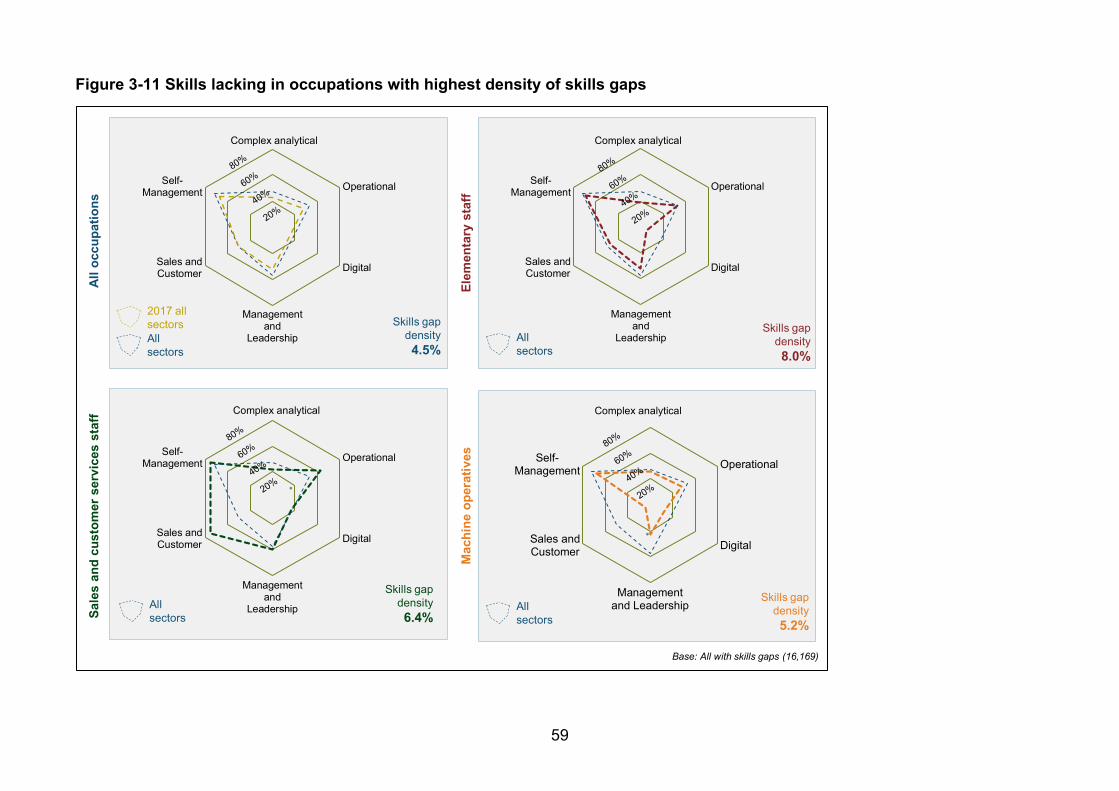
59
Figure 3-11 Skills lacking in occupations with highest density of skills gaps
Operational
Digital
Managementand
Leadership
Sales andCustomer
Self-Management
Operational
Digital
Managementand
Leadership
Sales andCustomer
Self-Management
Operational
Digital
Managementand
Leadership
Sales andCustomer
Self-Management
Operational
Digital
Managementand Leadership
Sales andCustomer
Self-Management
All o
ccup
atio
ns
Mac
hine
ope
rativ
esEl
emen
tary
sta
ff
Sale
s an
d cu
stom
er s
ervi
ces
staf
f
All sectors
Skills gapdensity4.5%
Skills gapdensity8.0%
Skills gapdensity6.4%
Skills gapdensity5.2%
All sectors
All sectors
All sectors
Complex analytical Complex analytical
Complex analytical Complex analytical
2017 allsectors
Base: All with skills gaps (16,169)

60
4. Addressing skills shortages Chapter summary
The most common cause of skills gaps remained factors that can be considered transient namely because individuals were new to the role or because their training was only partially completed (79%), although only in a minority of cases were skills gaps caused exclusively by transient factors (20%). Other key causes included steps taken to positively transform a business creating skills gaps (42%) and staff lacking motivation (38%).
The most common actions taken to overcome skill-shortage vacancies were increasing advertising or recruitment spend (37%) or using new recruitment methods or channels (37%). In comparison, establishments tried to overcome skills gaps in their workforce most often by increasing training activity (64%) and by increased supervision of staff (55%). Perhaps unsurprisingly, employers tried to rectify skill-shortage vacancies most often through looking externally, to their recruitment methods, while they tried to address skills gaps by looking to their internal processes such as training and their management of staff.
When considering the factors that employers looked for when recruiting (such as qualifications and work experience) those with skill-shortage vacancies tended to place greater importance on each potential factor than those that did not have skill-shortage vacancies. This was particularly true regarding relevant work experience (17 percentage point difference), vocational qualifications (12 percentage point difference) and having a degree or degree-equivalent qualification (8 percentage point difference).
Similarly, in terms of recruitment methods and strategies used to fill vacancies, employers with skill-shortage vacancies were more likely to have used each recruitment method in order to fill vacancies than employers that had vacancies, none of which were classified as hard to fill due to skill-shortages. This was also the case for employers with skills gaps compared to those without them, although the association was less strong.
In much the same way, it was generally the case that employers with skills needs were more likely to have engaged with national skills policy initiatives than those without skills needs, including taking on apprentices, trainees or expressing interest in offering work placements through the T-Levels scheme.

61
Introduction This chapter first considers the causes of skills gaps within the workforce, in order to provide context about the steps taken by employers to address skills shortages, both among their current staff and among prospective applicants to vacancies. The chapter also covers recruitment, particularly considering whether the recruitment methods and strategies used by employers and the profile of skills and qualifications that employers look for among applicants vary based upon whether an employer has current skills deficiencies. Finally, the rate at which employers are engaging with national skills policy initiatives is also considered, again split out by employers with skills needs and those without them.
Causes of skills gaps The most common causes of skills gaps among the existing workforce were that individuals were new to the role which was a contributing factor to two-thirds of skills gaps (67%) or that their training was only partially completed (61%). These may be classified as transient skills gaps as they are factors which would be expected to ease naturally over time: they contributed to four in five skills gaps (79%), although were the exclusive cause in one in five cases (20%). These transient factors contributed to slightly more skills gaps than in 2017 (76%), although were the exclusive cause of slightly fewer (21%). Other common causes of skills gaps included staff lacking motivation (38%), the fact that staff had been on training but their performance had not improved sufficiently (33%) and employers being unable to recruit staff with the required skills (32%). The causes of skills gaps are presented in Figure 4-1.
The profile of these causes of skills gaps, in terms of the ranking of causes from most common to least common, was broadly similar in 2019 to the profile in 2017 and 2015. However, all causes of skills gaps were mentioned by more employers in 2019 than in 2017 and 2015. The most marked increases compared to 2017 were regarding problems retaining staff (an increase of 7 percentage points) and the introduction of new technology causing gaps (an increase of 6 percentage points), with most causes having increased by around four or five percentage points.

62
Figure 4-1 Main causes of skills gaps (prompted)
A greater proportion of skills gaps were caused exclusively by transient factors in in Northern Ireland (25% compared with 20% in England and Wales) and among establishments in the Construction (29%), Arts & Other Services (26%) and Public Administration (25%) sectors. A smaller proportion of skills gaps were caused entirely by transient factors in the Transport and Storage sector, with only one in seven skills gaps (14%) caused entirely by employees being new to the role or their training being incomplete.
Another common cause of skills gaps was staff lacking motivation, a factor in around two-fifths of skills gaps (38%), rising to half of skill gaps among Elementary Staff (51%).
Issues related to training were also a prominent cause of skills gaps. Staff having received training but their performance not sufficiently improving was a factor in a third of all skills gaps (33%), while over a quarter of all skills gaps were caused at least in part because staff had not received the appropriate training (28%). In both cases, skills gaps within the Primary Sector and Utilities sector were more likely to be caused in part by these training related issues (42% and 33% respectively).
19%
20%
26%
28%
18%
25%
29%
34%
56%
60%
16%
19%
25%
24%
22%
28%
31%
31%
57%
63%
20%
25%
28%
29%
29%
32%
33%
38%
61%
67%
The development of newproducts and services
The introduction of new technology
They have not received theappropriate training
The introduction of newworking practices
Problems retaining staff
Unable to recruit staff with therequired skills
They have been on trainingbut their performance hasnot improved sufficiently
Staff lack motivation
Their training is currently only partially completed
They are new to the role
201920172015
Base: All establishments with skills gaps (2019: 16,169; 2017: 16,519; 2015: 17,029)
Transient factors
79%76%
2017
Transient only
20%21%
2017
Positive transformationalfactors
42%34%
2017

63
Around a third (32%) of skills gaps were caused at least in part by an inability to recruit staff with the required skills, an increase on the proportion in 2017 (28%). There was no clear correlation between sectors with particularly high densities of skill-shortage vacancies and sectors in which a high proportion of skills gaps were caused to some extent by an inability to recruit staff with the required skills.
There are some workplace activities such as introducing new technology or working practices which, although a cause of skills gaps in the short-term, represent a positive tendency in that it indicates employer investment in future growth. In 2019 42% of skills gaps were caused by these sorts of factors, a significant increase compared with 34% in 2017. The introduction of new working practices contributed to 29% of skills gaps (an increase from 24% in 2017). Similarly, the proportion of skills gaps caused by the introduction of new technology (25%, up from 19%), and the proportion of skills gaps caused by the development of new products and services (20%, up from 16%) have also increased between 2017 and 2019. The introduction of new technology was a more common contributing cause of skills gaps in Wales (30%) than in England (25%), and in both nations this was more common than in Northern Ireland (13%).
These increases in potentially ‘positive’ causes of skills gaps, when combined with the increase in number of transient skills gaps, may somewhat offset concerns about the rise in number of skills gaps overall. However, it is important to note that there was no difference in terms of the proportion of skills gaps that can be said to be exclusively caused by positive transformational factors (0.4% in 2019 and 0.6% in 2017), while a slightly smaller proportion of factors were exclusively transient in nature (20%, down from 21% in 2017). When combining these factors, the proportion of skills gaps that were caused exclusively by positive factors or transient factors had remained the same (21% in 2017 and 2019). Consequently, it does not appear that the increase in skills gaps between 2017 and 2019 can be understood exclusively as resulting from potentially positive causes that may indicate investment in future growth.
Table A.4.1 and Table A.4.2 in Appendix A provide breakdowns of the most common causes of skills gaps by sector and occupation. Table B.4 in Appendix B provides the definitions of the two groupings of causes of skills gaps (transient and positive transformational) that have been used for analysis in this section of the report.
Steps taken to address skills needs Establishments that identified that they had skill-shortage vacancies were asked what actions, if any, they had taken to attempt to overcome such vacancies. Two actions predominated, namely utilising new recruitment methods or channels (37%) and increasing advertising or recruitment spend (37%, a less common response than in 2017 (41%)).

64
Utilising new recruitment methods or channels was more common in England (37%) and Wales (37%) than in Northern Ireland (29%), and it was also more common among establishments with more employees (50 or more employees: 46%; 2 to 49 employees: 36%) and in the Public Administration (49%) and Information & Communications (45%) sectors.
When taking action to overcome skills gaps, employers were most likely to have increased training activity or spend, including increasing or expanding their trainee programmes (64%, a more common response among employers in England (65%) than in Northern Ireland (61%) and Wales (60%)). Larger employers were also more likely to increase training activity or spend, with three quarters (75%) of establishments with skill gaps with 25 or more employees taking this action.
Employers with skills gaps also regularly increased supervision of their staff (55%), conducted more appraisals or performance reviews (46%) or implemented mentoring schemes (45%), all actions being taken at a similar level in 2019 as in 2017.
Figure 4-2 presents the full list of actions taken by employers to address skill-shortage vacancies and skills gaps.
Figure 4-2 Actions taken by establishments to overcome skill-shortage vacancies and skills gaps
8%
10%
11%
10%
8%
15%
36%
41%
5%
8%
8%
9%
9%
13%
37%
37%
Increasing salaries
Increasing the training givento your existing workforce
Being prepared to offertraining to less well qualified
recruits
Increasing / expandingtrainee programmes
Bringing in contractors to dothe work, or contracting it
out
Redefining existing jobs
Using NEW recruitmentmethods or channels
Increasing advertising /recruitment spend
10%
21%
27%
35%
44%
45%
54%
66%
9%
20%
28%
35%
45%
46%
55%
64%
Recruiting workers who arenon-UK nationals
Increase recruitment activity/ spend
Changing working practices
Reallocating work
Implementation of mentoring/ buddying scheme
More staff appraisals /performance reviews
More supervision of staff
Increase training activity /spend or increase / expand
trainee programmes
20192017
Base: SSVs: All establishments with hard-to-fill vacancies that are all as a result of skill shortages (2019: 5,951; 2017: 6,165). Skills gaps: All establishments with skills gaps (2019: 16,169; 2017: 16,519)
Skills gapsSkill-shortage vacancies

65
More than a third of employers with skill-shortage vacancies had recruited, or tried to recruit, workers who were non-UK nationals in order to fill vacancies (37%). This was most often either EU nationals (17%) or both EU and non-EU nationals (17%), and rarely exclusively non-EU nationals (2%).
Employers in Northern Ireland (41%) and England (38%) were more likely to have pursued recruitment of non-UK nationals to address skill-shortage vacancies than those in Wales (25%).
The recruitment, or attempted recruitment, of non-UK employees was less commonly utilised to try to address skills gaps among existing workers than it was to address skill-shortage vacancies. Employers with skills gaps in their workforce were asked whether they had recruited, or tried to recruit, non-UK national workers in order to overcome these skills gaps - 13% of these establishments had done so. This most commonly involved both EU nationals and non-EU nationals (7%), although just under 1 in 20 establishments had specifically targeted EU nationals only (4%), while 1% had targeted non-EU nationals only.
Employers in Northern Ireland were more likely to have recruited or tried to recruit non-UK nationals in order to overcome skills gaps (16%) than those in England (13%) or particularly Wales (7%).
What employers with skill-shortage vacancies look for when recruiting? When considering the factors that employers looked for in recruits, the factor that was most commonly identified by establishments as being of significant or critical importance was relevant work experience (63%). This was followed by Maths & English GCSE A* - C (52%), vocational qualifications (47%), academic qualifications (42%) and finally a degree or degree equivalent qualification (20%).
Breaking this profile down by establishments that have skill-shortage vacancies and those that do not, there was a clear pattern of employers with skill-shortage vacancies placing greater importance on each factor than those that did not have them. This was particularly true regarding relevant work experience (17 percentage point difference), vocational qualifications (12 percentage point difference) and having a degree or degree-equivalent qualification (8 percentage point difference).
Figure 4-3 below demonstrates the importance that employers placed upon each factor that employers looked for in recruits, split out by employers with skill-shortage vacancies and those without them, highlighting this pattern of employers with skill-shortages placing greater importance on each factor.

66
Figure 4-3 What employers looked for in recruits, broken down by those with skill-shortage vacancies and those without them
Table A.4.6 in Appendix A shows what employers looked for in recruits, broken down by employers with different skills needs.
Recruitment methods and strategies that are used by employers Employers with vacancies were asked what methods they had used in the last 12 months to recruit new staff. As Figure 4-4 shows, the most common recruitment methods used remained word of mouth or personal recommendations, followed by adverts placed on the company’s own website and adverts placed on social media, similar to the pattern seen in the 2016 Employer Perspectives Survey.
Employers with skill-shortage vacancies were more likely to have used each of these recruitment methods than employers with vacancies where none were classified as skill-shortage vacancies, as demonstrated in Figure 4-4.
52%
46%
51%
26%
21%
26%
23%
16%
23%
20%
17%
20%
12%
12%
24%
25%
24%
29%
32%
29%
26%
25%
26%
25%
25%
25%
23%
15%
23%
13%
17%
13%
27%
27%
27%
31%
34%
31%
31%
31%
31%
40%
42%
40%
6%
10%
6%
15%
19%
15%
15%
25%
16%
20%
25%
21%
21%
37%
22%
(Employers without SSVs)
(Employers with SSVs)
Having a degree or degree-equivalent qualifications (all)
(Employers without SSVs)
(Employers with SSVs)
Academic qualifications (all)
(Employers without SSVs)
(Employers with SSVs)
Vocational qualifications (all)
(Employers without SSVs)
(Employers with SSVs)
Maths & English GCSE A*-C(all)
(Employers without SSVs)
(Employers with SSVs)
Relevant work experience(all)
SIGNIFICANT / CRITICAL2019
Base: 2019: All establishments in Module D (16,031); 2016: All employers (14,019)
2016*
47%58%46%
63%79%62%
52%56%52%
42%46%42%
20%27%19%
Not asked
in 2016
46%
49%
56%
65%
*It was not possible to conduct analysis by employers with SSVs and without in EPS 2016.

67
In much the same way, employers who have had vacancies in the last 12 months that had skills gaps were also more likely to have utilised each recruitment method than employers with vacancies that did not have skills gaps. The profile of usage of these recruitment methods is presented in Figure 4-4, broken down by employers with a fully proficient workforce and those with skills gaps.
Out of the three employer profiles demonstrated in Figure 4-4, employers with skill-shortage vacancies were the most likely to have used each of the recruitment methods over the last 12 months. Establishments with skill-shortage vacancies were the least likely to have utilised exclusively one approach (7%) or word of mouth only (4%), when compared to employers with vacancies, none of which were classified as skill-shortage vacancies (word of mouth only: 16%; single approach only 30%). It is clear, therefore, that are employers with skill-shortage vacancies used more varied recruitment strategies.
Figure 4-4 Recruitment methods used in the last 12 months
71%
48%
47%
38%
17%
15%
11%
87%
63%
70%
61%
38%
27%
21%
69%
47%
45%
36%
14%
14%
10%
Word of mouth or personalrecommendations
Adverts placed on own website usinginternal resources
Adverts placed on social media usinginternal resources
Some other form of paid-for recruitmentservice, including the press
School, college or university job fairs orcareers services
A government recruitment service orscheme
A paid-for recruitment service to placeadverts on your website or social media
on your behalf
All employers with vacancies
Employers with SSVs
Employers with vacancies, none ofwhich were SSVS
Base: 2019: All employers with vacancies in Module D (10,990); all employers with SSVs in Module D (1,271); All employers in Module D with vacancies, none of which were SSVs (9,719)
15%4%16%
Word of mouth only
28%7%30%
Single approach only

68
Do employers with skills needs engage with skills policy initiatives? At an overall level, engagement with skills policy initiatives was relatively low, with 10% of employers having any staff undertaking a formal apprenticeship, 3% of employers having had anyone undertake a Traineeship over the last 12 months and 19% of Welsh and Northern Irish establishments having used National Occupational Standards in some way. Just over a third of English establishments also registered some interest in providing work placements to T-Level students at some point in the future (36%).
In general, employers with skills needs were more likely to have engaged with each of these skills policy initiatives than employers without skills needs. Employers with skill-shortage vacancies were more likely to have employed somebody undertaking a formal apprenticeship (25%) than those without a skill-shortage vacancy (10%). Employers with skill-shortage vacancies were also more likely to state that they planned to offer apprenticeships in the future (59% compared to 29% without) and that they expected their apprentice numbers to increase (46% compared to 27% without). Similarly, employers with skills gaps were more likely to have at least one member of staff undertaking a formal apprenticeship (28% compared to 8% without) and they were also more likely to expect to offer an apprenticeship (51% compared to 27% without). This extended to the number of apprentices that establishments with skills needs had too, with those with skill-shortage vacancies having more than twice as many apprentices on average (4.9) than those without them (2.3); although it was still higher among those with skills gaps (3.1) than without (2.4), the association was less strong than when considering establishments by skill-shortage vacancy status. Employers with skill-shortage vacancies (46%) were more likely to expect the number of apprentices at the site to increased than those without skill-shortage vacancies (27%), although there was, however, no difference in this regard based upon whether they had skills gaps (32%) or not (29%).
Employers with skill-shortage vacancies were also more likely to have had anyone undertake a Traineeship over the last 12 months (5% compared to 2% without a skill-shortage vacancy). Usage of National Occupational Standards in Northern Ireland and Wales was also higher among employers with at least one skill-shortage vacancy (26%) than those without (19%). Interest in potentially offering work experience placements through T-Levels was also higher, with around two thirds of employers with a skill-shortage vacancy (64%) expressing interest in doing so, compared to around a third without a skill-shortage vacancy (35%).
Employers with skills gaps were also more likely to have engaged with skills policy initiatives than those without skills gaps. This included having undertaken a Traineeship (4% compared to 2% without) and expressing interest in offering work placements through the T-Levels scheme (54% compared to 33% without). There was, however, no

69
difference between employers with skills gaps (20%) and those without skills gaps (19%) regarding usage of National Occupation Standards.
These findings present a perhaps reassuring picture, in that employers with skills needs are turning to skills policy initiatives, potentially in an attempt to resolve these issues. Similarly, from a T-Levels policy perspective this presents something of a readymade market for T-Levels placements, with employers with skill-shortage vacancies (64%) and skills gaps (54%) expressing an interest in offering work placements through this scheme. These findings represent new analysis for the ESS series (utilising a combination of both ESS and EPS measures) and represent interesting results, although in some respects interpretation is difficult. This could represent an area for further research in the future, in order to provide better understand the relationship between employer skills needs and engagement with the skills system.
Figure 4-5 Engagement with skills policy initiative by skills need
4%
28%
20%
32%
51%
54%
5%
25%
26%
46%
59%
64%
3%
10%
19%
30%
30%
36%
Anyoneundertaking a
Traineeship overthe last 12 month
Staff undertakinga fomral
apprenticeship
Used nationalOccupational
Standards
Expect number ofapprentices at thesite to increase inthe next 2 years
Organisationplans to offer
Apprenticeships inthe future
Registeredinterest in
providing workplacements to T-
level students
All establishmentsEstablishments has SSVsEstablishments has skills gaps
Base: T-Levels: all establishments in England in Module C (13,365); National Occupational Standards: All establishments in Wales and Northern Ireland in Module D (2,679); Apprenticeships: All establishments in Module A (16,070); Apprenticeships changing in next 2 years: All establishments who have current apprentices
and plan to continue offering Apprenticeships in Module A (2,358); Traineeships: All establishments in England in Module a (13,358)
2.74.93.1
Number of current apprentices
70
5. Future skills requirements
Chapter summary
Introduction Employers were asked in ESS 2019 about their anticipated requirement to upskill, or develop, their current workforce in the next 12 months (from the time of the survey). It should be noted that employers were asked about these future needs prior to the Covid-19 pandemic. This chapter considers how prevalent it was for employers to anticipate the need to upskill their workforce and which occupations this was most common among, as well as the reasons provided by employers for needing to develop the skills of their workforce. This chapter also contains analysis of the specific skills that employers identified as needing development among their employees, as well as analysis about the factors that are most significant drivers of the need for employers to upskill their workforce.
A majority of employers anticipated the need to develop the skills of any of their workforce in the coming year (64%), particularly large employers with 250 or more employees (89%) and establishments in the Public Administration sector (80%). It was most common for employers to anticipate the need to upskill their employees at the managerial level.
The most common reasons for their expected need to upskill their staff were in re-sponse to new legislative or regulatory requirements (42%), because of the introduc-tion of new technologies or equipment (41%), the development of new products and services (35%) and the introduction of new working practices (35%). The profile rea-sons for anticipating upskilling requirements remained relatively similar between 2017 and 2019.
The most common skills that were identified by employers as requiring development were specialist skills and knowledge (50%), knowledge of products and services of-fered (48%) and the ability to adapt to new equipment or materials (45%). Technical and practical skills, therefore, played a more prominent role in the upskilling picture than they had in the skills that were lacking among the current workforce and among applicants. Digital skills were also more prominently a part of employer anticipation of upskilling requirements (47%), perhaps reflecting the pace of change of digital skills requirements. Conversely, while people and personal skills such as staff being able to manage their own time and prioritise tasks (41%) were still important factors that were identified by establishments as requiring development over the coming 12 months, they were less significant than in the current skills need picture.

71
The prevalence of the need to upskill Around two-thirds of all establishments expected that they would need to upskill their workforce in the next 12 months (64%), which represents a slight increase from 2017 (62%). This was most common in Wales (68%, up from 63% in 2017) compared to England (64%) and Northern Ireland (63%). There was a link between business size and likelihood to want to upskill the workforce in the next 12 months, with around nine in ten employers with 250 or more employees expecting to have to upskill in the next 12 months (89%), compared with three-fifths of those with 2 to 4 employees (59%). For a full breakdown of expected need to upskill the workforce by size and country, see Figure 5-1.
In terms of sector, employers classified as Public Administration were the most likely to express an anticipated need to upskill their workforce (80%), followed by those classified as Financial Services (74%), Information and Communications (73%), Education (73%), Health and Social Work (73%) and Business Services (70%). Establishments classified as Hotels & Restaurants (55%) and Construction (56%) were the least likely to anticipate a need to upskill in the next 12 months. Figure 5-1 shows the full profile of the expected requirements to upskill by sector.
Figure 5-1 The proportion of establishments identifying a need for upskilling in the coming 12 months by country, size and sector
62%In 2017
59% 68
% 78%
79% 82% 89
%
57% 66
% 74% 78
%
79%
81%
2 to 4 5 to 24 25 to 49 50 to 99 100 to249
250+2019 2017 Base: 2019: All Establishments in Modules B and D (32,088); 2017: All establishments in Module 2 (40, 373)
53%
54%
58%
57%
57%
59%
61%
67%
71%
73%
71%
71%
81%
55%
56%
56%
59%
59%
62%
63%
70%
73%
73%
73%
74%
80%
Hotels & restaurants
Construction
Transport & storage
Primary Sector & Utilities
Manufacturing
Arts & Other Services
Wholesale & retail trade
Business services
Information &communications
Education
Health & social work
Financial services
Public admin.
2019
2017
64%(62% in 2017)
68%(63%
in 2017)
63%(62% in 2017)
64%Overall upskilling
need 2019
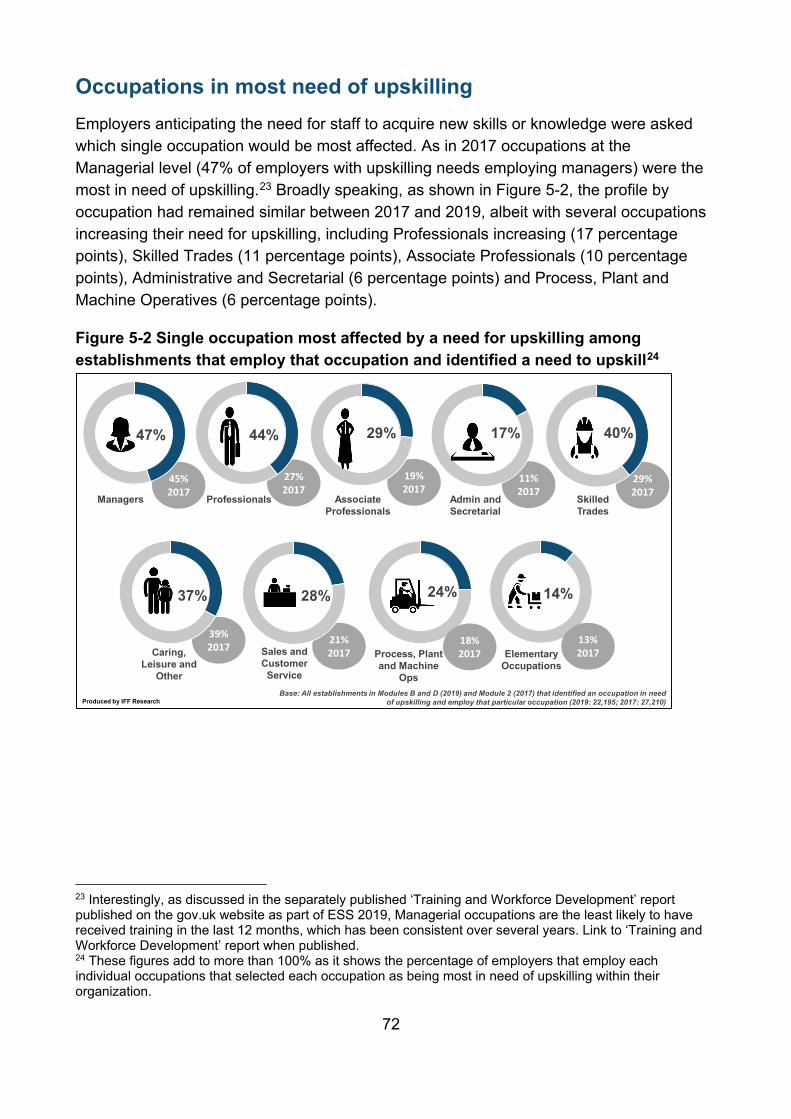
72
Occupations in most need of upskilling Employers anticipating the need for staff to acquire new skills or knowledge were asked which single occupation would be most affected. As in 2017 occupations at the Managerial level (47% of employers with upskilling needs employing managers) were the most in need of upskilling.23 Broadly speaking, as shown in Figure 5-2, the profile by occupation had remained similar between 2017 and 2019, albeit with several occupations increasing their need for upskilling, including Professionals increasing (17 percentage points), Skilled Trades (11 percentage points), Associate Professionals (10 percentage points), Administrative and Secretarial (6 percentage points) and Process, Plant and Machine Operatives (6 percentage points).
Figure 5-2 Single occupation most affected by a need for upskilling among establishments that employ that occupation and identified a need to upskill24
23 Interestingly, as discussed in the separately published ‘Training and Workforce Development’ report published on the gov.uk website as part of ESS 2019, Managerial occupations are the least likely to have received training in the last 12 months, which has been consistent over several years. Link to ‘Training and Workforce Development’ report when published. 24 These figures add to more than 100% as it shows the percentage of employers that employ each individual occupations that selected each occupation as being most in need of upskilling within their organization.
39% 2017
21% 2017
45% 2017
27% 2017
19% 2017
11% 2017
29% 2017Managers Professionals Associate
ProfessionalsAdmin and Secretarial
Skilled Trades
47% 44% 29% 17% 40%
Caring, Leisure and
Other
Sales and Customer Service
Process, Plant and Machine
Ops
Elementary Occupations
37% 28% 24% 14%
18% 2017
13% 2017
Base: All establishments in Modules B and D (2019) and Module 2 (2017) that identified an occupation in need of upskilling and employ that particular occupation (2019: 22,195; 2017: 27,210)Produced by IFF Research

73
Reasons for a need for upskilling The main reasons provided by establishments for expecting the need to upskill their employees in the next 12 months were in response to new legislative or regulatory requirements (42%), because of the introduction of new technologies or equipment (41%), the development of new products and services (35%) and the introduction of new working practices (35%). In the cases of the need to upskill due to new legislative or regulatory requirements and the introduction of new technologies or equipment, each of these figures represented a slight increase since 2017 (38% and 39% respectively).
Figure 5-3 shows each reason that establishments provided to explain their expected need for new skills in the next 12 months. As the figure demonstrates, the greatest change since 2017 was related to the UK’s decision to leave the EU (a 5 percentage point increase).
Figure 5-3 Reasons for expected need for new skills in next 12 months (prompted unless *)
As shown in Table 5-1, there was some variation between nations in terms of the reasons stated for needing to upskill their workforce. Establishments in Wales were more likely to state that they needed to improve the skills of their employees due to each reason listed, with the exception of increased competitive pressure and because of the UK’s decision to leave the EU.
13%
24%
35%
35%
39%
38%
18%
22%
35%
35%
41%
42%
The UK's decision to leave the EU
Increased competitive pressure
The development of new products and services
The introduction of new working practices
The introduction of new technologies orequipment
New legislative or regulatory requirements
2019
2017
Base: 2019: All establishments in Modules B and D (32,088); 2017: All establishments in Module 2 (40,373)

74
Establishments in England were more likely than those in Northern Ireland to state that they needed to upskill their workforce due to new legislative or regulatory requirements (42% compared to 39%), the introduction of new technologies or equipment (41% compared to 36%) and the development of new products and services (35% compared to 30%). Despite being generally less likely to state that they needed to upskill their workforce for each reason, establishments in Northern Ireland (23%) were more likely than those in England (18%) or Wales (17%) to feel the need to upskill their workforce due to the UK’s decision to leave the EU.
Table 5-1 Reasons for a need for upskilling, by nation (prompted)
2017 2019
Total England Northern Ireland Wales Total England Northern
Ireland Wales
Base 40,373 35,490 1,945 2,938 32,088 26,707 2,003 3,378 New legislative or regulatory requirements
38% 38% 39% 41% 42% 42% 39% 46%
The introduction of new technologies or equipment
39% 38% 39% 42% 41% 41% 36% 44%
The development of new products and services
35% 35% 32% 37% 35% 35% 30% 38%
The introduction of new working practices
35% 35% 36% 39% 35% 35% 34% 40%
Increased competitive pressure
24% 24% 25% 23% 22% 22% 22% 24%
The UK’s decision to leave the EU
13% 13% 17% 11% 18% 18% 23% 17%

75
Upskilling: skills that need improving Those employers that identified an occupation most affected by the need for upskilling were asked which skills would require developing over the coming 12 months among their staff. Again, these have been grouped into three categories:
The individual skills within these broader groupings are also grouped into smaller, more thematic groupings, as defined in Table B.1, Table B.2 and Table B.3 in Appendix B
Technical and practical skills that required upskilling
The most common technical and practical skills that establishments stated that they anticipated needing to develop in the coming 12 months were specialist skills or knowledge that were required in that role, with half of establishments with an upskilling need stating that this would need to be developed (50%). This figure rose to just under two-thirds of establishments in the Public Administration (63%) and Financial Services (62%) sectors. There was also a strong link between establishment size and the anticipated need to upskill specialist skills or knowledge, with establishments with 100 or more employees being more likely to anticipate the need to develop these skills (66%) than smaller employers (2 to 4 employees 44%, 5 to 24 employees 53%, 25 to 49 employees 58%, 50 to 99 employees 61%).
Employers were also likely to anticipate the need to develop knowledge of products and services (48%) and adapting to new equipment or materials (45%) in the coming 12 months. The need to upskill staff relating to knowledge of products and services was particular common in the Financial Services sector (67%), while the need to adapt to new equipment or materials was most keenly felt as an upskilling requirement among Primary Sector and Utilities (57%) and Manufacturing (57%) establishments.
When grouping these skills by area; over half (52%) cited operational skills such as knowledge of how the organisation works, around half (47%) cited digital skills (at advanced and/or basic level), over two-fifths (44%) mentioned complex analytical skills
People and personal skills
‘Softer’, less tangible skills required to manage oneself and interact with others in the workplace.
Technical and practical skills
Specific skills required to perform the specific functions of a job role.
Digital skillsDigital skills required by employers such as using computers, technical skills and use of specific software suites.

76
such as complex numerical or statistical skills and 36% mentioned basic skills such as basic digital and basic numerical skills. This profile was broadly similar to the profile of skills that had been identified as lacking in the current workforce (see Overall picture – skill-shortage vacancies and skills gaps), although digital skills are more commonly seen as skills that may require development in the coming 12 months (47%) than they are seen as skills that the workforce is currently lacking proficiency in (38%), perhaps reflecting the rapid pace at which digital skill requirements can change.
Figure 5-4 Technical and practical skills that employers expect to need to develop in the coming 12 months
People and personal skills that required upskilling
The profile of people and personal skills that employers identified as being in need of development over the coming 12 months was consistent in 2019 and 2017, albeit with a reduction across the board, with each skill being slightly less commonly cited than in 2017. Skills relating to self-management (49%) and management and leadership (48%) were the most commonly identified people and personal skills that establishments felt they would need to develop among their workforce.
11%
13%
16%
19%
22%
31%
27%
31%
31%
38%
43%
48%
47%
9%
14%
16%
18%
23%
29%
30%
30%
30%
38%
45%
48%
50%
Communicating in a foreignlanguage
Manual dexterity
Basic numerical skills
Complex numerical / statisticalskills
Writing instructions, reports etc.
Advanced or specialist IT skills
Reading / understandinginstructions, reports, etc.
Knowledge of how yourorganisation works
Computer literacy / basic IT skills
Solving complex problems
Adapting to new equipment ormaterials
Knowledge of products andservices offered
Specialist skills or knowledge
2019
2017
Complex analytical
skills
Operational skills
Digital skills
44%
52%
47%
Base: 2019: All establishments anticipating a need for new skills in next 12 months (and could identify an occupation that would be most affected) (Modules B and D) (19,901). 2017: All establishments who anticipate a need for new skills in next 12 months (and could identify an occupation that would be most affected) (24,334)
44%
2017
53%2017
49%
2017
Basic skills
36%
36%2017

77
It was generally the case that there was a correlation between employer size and the likelihood for an establishment to identify each skill shown in Figure 5-5. The most marked difference in this regard was found regarding the need to increase the ability of staff to manage their own feelings or handle the feelings of others; there was a 26 percentage point gap between employers with 2 to 4 employees (26%) and those with 100 or more employees (52%) in relation to the need to develop this skill.
A full profile of the people and personal skills identified by employers as in need of development in the coming 12 months, broken down by size and sector, can be found in Table A.5.6 and Table A.5.7 in Appendix A.
Figure 5-5 People and personal skills that employers expect to need to develop in the coming 12 months
Digital skills that require upskilling
In the 2019 iteration of ESS, 47% of employers that identified a requirement to upskill their workforce the digital skills of their employees in the coming 12 months. For the first time in 2019, employers were asked a follow up question to identify the specific digital skills that required development. By far the most commonly identified skill requiring development related to using new or updated company software or systems, required among 39% of employers with digital upskilling requirements.
19%
31%
31%
31%
35%
34%
36%
39%
40%
45%
15%
27%
27%
28%
31%
33%
34%
36%
37%
41%
Making speeches or presentations
Sales skills
Persuading or influencing others
Setting objectives for others /planning resources
Instructing, teaching or trainingpeople
Managing own feelings / handlingthose of others
Customer handling skills
Managing or motivating other staff
Team working
Managing own time and taskprioritisation
2019
2017
Management / leadership skills
Sales / customer services skills
Self-managementskills
48%
41%
49%
53%
2017
44%
2017
52%2017
Base: 2019: All establishments anticipating a need for new skills in next 12 months (and could identify an occupation that would be most affected) (Modules B and D) (19,901). 2017: All establishments who anticipate a need for new skills in next 12 months (and could identify an occupation that would be most affected) (24,334)

78
There was some variation in terms of digital skills that establishments identified as requiring upskilling. It was more common for larger establishments to identify a need to develop foundation digital skills (14% of employers with digital upskilling needs with 100 or more employees) than smaller employers (9% of employers with digital upskilling needs with fewer than 100 employees). Contrastingly, among establishments with requirements to develop digital skills, smaller establishments, especially those with 2 to 4 employees, were more likely to identify a need to develop graphic design or design engineering skills (7%) than those with 5 or more employees (4%).
There was also sectoral variation regarding digital skills that employers felt needed developing in the coming 12 months. Establishments in the Financial Services sector (47%) were most likely to require development regarding skills using new or updated company systems, particularly when compared to those in Manufacturing (36%), Construction (35%), Primary Sector and Utilities (30%) and Hotels and Restaurants (30%). Employers classified as Public Administration were most likely to require development in advanced Microsoft Office skills (21%). Graphic design and design engineering skills were most commonly identified as being in need of development among establishments in the Manufacturing (12%), Construction (11%) and Business Services (10%) sectors.
For a full list of digital skills identified as requiring development, broken down by country, size and sector, please see Table A.5.8 and Table A.5.9 in Appendix A.

79
Figure 5-6 Digital skills that employers expect to need to develop in the coming 12 months
5%
5%
5%
9%
10%
10%
16%
39%
Graphic design / designengineering skills (incl.
Computer Aided Design [CAD]skills)
Web development skills
Application ('app') programmingand development skills
Foundation digital skills – such as turning on devices, typing,
changing passwords, connecting to the internet
Specialist software or hardware/ internal systems
Advanced Microsoft Office skills(Word, Excel, PowerPoint,
Outlook etc.)
Basic Microsoft Officeapplications skills (Word, Excel,
PowerPoint, Outlook etc.)
Skills using new or updatedcompany software or systems
Base: All establishments anticipatinga need for new IT skills in next 12 months (and could identify an occupation that would be most affected) (Modules B and D) (9,273)
Basic digital skills
22%
Basic internet skills
9%
Design, animation and graphic skills
7%

80
6. Conclusions Fieldwork for the Employer Skills Survey (ESS) 2019 took place at a time of economic growth of the UK economy: ONS data shows that at the second quarter of 2019, when ESS 2019 fieldwork began, job creation was at its highest level since records began (an employment rate of 76.1%).25 Despite this, UK productivity was behind most other G7 countries and in the second quarter of 2019 output per hour fell by 0.5%, the largest quarterly fall in productivity in five years.26 Developing the skills and proficiency of the workforce is seen as a key route through which these productivity issues may be addressed.
Despite an overall fall compared to 2017 in the proportion of employers that had vacancies, the volume of vacancies that were hard to fill for skills-related reasons and the proportion of all vacancies where skill shortages were encountered were slightly higher than in 2017. These skills challenges during recruitment have remained high in certain sectors, particularly Construction, and have become more acute in others (notably Manufacturing). In both, over a third of current vacancies were considered to be skill-shortage vacancies (i.e. hard to fill for skills-related reasons).
The proportion of the workforce that employers considered to have skills gaps had also risen since 2017, the first instance of an increase in the ESS series since 2011. These changes were driven by increases in such skills challenges in England. Skills gaps within the workforce affected some sectors more than others and remained most common in the Hotels and Restaurants and Manufacturing sectors. However, from 2017 to 2019, there was a large increase in the proportion of the workforce considered to have a skills gap in the Public Administration sector, and a large decrease in Financial Services.
The profile of the types of skills that were lacking among the labour market remained relatively consistent between 2017 and 2019, albeit with each skill generally contributing to a slightly smaller proportion of skill-shortage vacancies. The most common skill found lacking among applicants related to a lack of specialist skills or knowledge needed to perform the role. When considering the skills lacking among the existing workforce, the picture was also consistent with 2017, with self-management skills remaining the most prevalent. Unsurprisingly, there was wide variance in terms of the skills lacking among the prospective and current workforces when looking at different sectors and different occupations.
25 ONS, Labour Market Overview: June 2019 (2019) 26 ONS, Labour productivity, UK: April to June 2019, (2019)

81
The most common steps taken by employers to address their skills needs were, for skill-shortage vacancies, to increase advertising or recruitment spend or to use new recruitment methods and channels, while to try to overcome skills gaps in the workforce, employers increased training activity and supervision of staff.
Skill requirements are fast changing, and while a minority (13%) of employers reported that there were skills gaps in their workforce, still a majority anticipated the need to upskill their workforce in the coming year. This was particularly true for larger employers. Rea-sons tended to be forwards looking, responding to new legislative or regulatory require-ments, new technologies or equipment, or new products and services. The skills that were most commonly identified as requiring upskilling in the workforce closely relate to this; employers felt that they would need to upskill their staff regarding specialist skills and knowledge of products and services offered and the ability to adapt to new equip-ment or materials.
ESS provides a snapshot of the skills situation employers were facing in the second half of 2019. The outbreak of the Covid-19 pandemic in 2020 has clearly provided a significant shock to the economy and is likely to have lasting and significant effects on employers and their skills needs. While this makes extrapolating ESS 2019 results to the post-Covid-19 situation problematic, the ESS 2019 results provide an important baseline to assess the post-Covid economy and labour market as we enter a new decade.

82
Appendix A: Supplementary tables Chapter 1: Introduction Table A.1.1 Unweighted base sizes (i.e. number of completed interviews) for all establishments, by country, size and sector (2015 – 2019)
Source: Employer Skills Survey (2019)
2015 2017 2019 Total 85,175 81,413 81,013 Country England 75,129 71,527 70,217 Northern Ireland 4,019 3,973 4,023 Wales 6,027 5,913 6,773 Size 2 to 4 19,263 16,137 20,183 5 to 24 46,565 43,798 40,611 25 to 49 10,728 11,500 10,795 50 to 99 5,346 5,974 5,377 100 to 249 2,440 3,018 3,122 250+ 833 986 925 Sector Primary Sector & Utilities 4,248 4,460 2,952 Manufacturing 6,450 6,169 6,234 Construction 6,895 6,422 5,249 Wholesale & Retail 15,188 13,581 17,503 Hotels & Restaurants 8,338 7,898 7,594 Transport & Storage 4,357 3,746 2,330 Information & Communications 3,996 3,721 2,511 Financial Services 2,322 2,471 1,577 Business Services 12,380 12,875 15,490 Public Administration 845 1,004 840 Education 5,177 5,146 5,012 Health & Social Work 7,962 7,379 8,092 Arts & Other Services 6,927 6,541 5,629

83
Table A.1.2 Unweighted base sizes (i.e. number of completed interviews) for establishments in England, by size and sector (2015 - 2019)
Source: Employer Skills Survey (2019)
2015 2017 2019 England total 75,129 71,527 70,217 Size 2 to 4 16,346 13,371 17,286 5 to 24 41,013 38,447 35,102 25 to 49 9,860 10,571 9,510 50 to 99 4,882 5,461 4,710 100 to 249 2,263 2,757 2,781 250+ 765 920 828 Sector Primary Sector & Utilities 3,649 3,761 2,394 Manufacturing 5,703 5,498 5,391 Construction 6,334 5,622 4,531 Wholesale & Retail 13,126 11,841 15,131 Hotels & Restaurants 7,274 6,917 6,486 Transport & Storage 3,797 3,317 2,047 Information & Communications 3,741 3,436 2,305 Financial Services 2,121 2,195 1,387 Business Services 11,158 11,582 14,040 Public Administration 721 859 683 Education 4,549 4,516 4,190 Health & Social Work 6,963 6,315 6,828 Arts & Other Services 5,993 5,668 4,804

84
Table A.1.3 Unweighted base sizes (i.e. number of completed interviews) for establishments in Northern Ireland, by size and sector (2015 - 2019)
Source: Employer Skills Survey (2019)
2015 2017 2019 Northern Ireland total 4,019 3,973 4,023 Size 2 to 4 1,168 1,097 984 5 to 24 2,236 2,182 2,102 25 to 49 321 368 485 50 to 99 191 220 285 100 to 249 72 88 124 250+ 31 18 43 Sector Primary Sector & Utilities 122 188 194 Manufacturing 330 252 377 Construction 246 319 317 Wholesale & Retail 859 782 930 Hotels & Restaurants 415 384 311 Transport & Storage 201 155 112 Information & Communications 88 117 65 Financial Services 93 122 81 Business Services 507 499 462 Public Administration 49 54 48 Education 267 255 359 Health & Social Work 382 461 439 Arts & Other Services 460 385 328

85
Table A.1.4 Unweighted base sizes (i.e. number of completed interviews) for establishments in Wales, by size and sector (2015 - 2019)
Source: Employer Skills Survey (2019)
2015 2017 2019 Wales total 6,027 5,913 6,773 Size 2 to 4 1,749 1,669 1,193 5 to 24 3,316 3,169 3,407 25 to 49 547 561 800 50 to 99 273 293 382 100 to 249 105 173 217 250+ 37 48 54 Sector Primary Sector & Utilities 477 511 364 Manufacturing 417 419 466 Construction 405 481 401 Wholesale & Retail 1,203 958 1,442 Hotels & Restaurants 649 597 797 Transport & Storage 359 274 171 Information & Communications 167 168 141 Financial Services 108 154 109 Business Services 715 794 988 Public Administration 75 91 109 Education 361 375 463 Health & Social Work 617 603 825 Arts & Other Services 474 488 497

86
Table A.1.5 Unweighted base sizes (Module A) for EPS measures (i.e. number of completed interviews) for all establishments, by country, size and sector (2014 – 2019)
2014 2016 2019 UK 14,044 14,019 16,070 Country England 10,032 10,015 13,358 Northern Ireland 2,005 2,007 1,008 Wales 2,007 1,997 1,704 Size 2 to 4 3,344 3,293 3,908 5 to 24 6,438 6,714 8,080 25 to 49 1,911 1,818 2,146 50 to 99 1,029 961 1,153 100 to 249 889 836 592 250+ 433 397 191 Sector Primary Sector & Utilities 669 609 559 Manufacturing 1,011 878 1,196 Construction 1,202 960 1,024 Wholesale & Retail 2,755 3,086 3,516 Hotels & Restaurants 1,234 1,344 1,429 Transport & Storage 432 382 442 Information & Communications 516 528 520 Financial Services 419 304 323 Business Services 2,000 2,412 3,053 Public Admin. 342 294 175 Education 936 818 1,047 Health & Social Work 1,567 1,560 1,606 Arts & Other 961 844 1,180 Source: Employer Skills Survey (2019)

87
Table A.1.6 Unweighted base sizes (Module A) for EPS measures (i.e. number of completed interviews) for all establishments in England, by size and sector (2014 – 2019)
2014 2016 2019 England total 10,032 10,015 13,358 Size 2 to 4 2,317 2,261 3,215 5 to 24 4,580 4,814 6,676 25 to 49 1,336 1,339 1,818 50 to 99 740 670 979 100 to 249 707 628 504 250+ 352 303 166 Sector Primary Sector & Utilities 440 375 439 Manufacturing 738 612 992 Construction 902 656 842 Wholesale & Retail 1,875 2,072 2,906 Hotels & Restaurants 854 991 1,168 Transport & Storage 328 267 358 Information & Communications 383 445 470 Financial Services 313 220 289 Business Services 1,568 1,934 2,690 Public Admin. 214 209 133 Education 667 572 822 Health & Social Work 1,070 1,066 1,289 Arts & Other 680 596 960 Source: Employer Skills Survey (2019)

88
Table A.1.7 Unweighted base sizes (Module A) for EPS measures (i.e. number of completed interviews) for all establishments in Northern Ireland, by size and sector (2014 – 2019)
2014 2016 2019 Northern Ireland total 2,005 2,007 1,008 Size 2 to 4 524 521 244 5 to 24 940 958 522 25 to 49 260 245 122 50 to 99 155 151 75 100 to 249 86 87 31 250+ 40 45 14 Sector Primary Sector & Utilities 96 120 48 Manufacturing 139 124 88 Construction 148 161 86 Wholesale & Retail 449 531 232 Hotels & Restaurants 173 131 78 Transport & Storage 53 56 32 Information & Communications 63 40 20 Financial Services 56 46 14 Business Services 202 246 113 Public Admin. 68 34 10 Education 153 139 90 Health & Social Work 258 252 104 Arts & Other 147 127 93 Source: Employer Skills Survey (2019)

89
Table A.1.8 Unweighted base sizes (Module A) for EPS measures (i.e. number of completed interviews) for all establishments in Wales, by size and sector (2014 – 2019)
2014 2016 2019 Wales total 2,007 1,997 1,704 Size 2 to 4 503 511 449 5 to 24 918 942 882 25 to 49 315 234 206 50 to 99 134 140 99 100 to 249 96 121 57 250+ 41 49 11 Sector Primary Sector & Utilities 133 114 72 Manufacturing 134 142 116 Construction 152 143 96 Wholesale & Retail 431 483 378 Hotels & Restaurants 207 222 183 Transport & Storage 51 59 52 Information & Communications 70 43 30 Financial Services 50 38 20 Business Services 230 232 250 Public Admin. 60 51 32 Education 116 107 135 Health & Social Work 239 242 213 Arts & Other 134 121 127 Source: Employer Skills Survey (2019)

90
Table A.1.9 Unweighted base sizes (Module C) for EPS measures (i.e. number of completed interviews) for all establishments, by country, size and sector (2014 – 2019)
2014 2016 2019 UK 14,044 14,019 16,059 Country England 10,032 10,015 13,365 Northern Ireland 2,005 2,007 1,011 Wales 2,007 1,997 1,683 Size 2 to 4 3,344 3,293 4,083 5 to 24 6,438 6,714 7,990 25 to 49 1,911 1,818 2,143 50 to 99 1,029 961 1,006 100 to 249 889 836 643 250+ 433 397 194 Sector Primary Sector & Utilities 669 609 660 Manufacturing 1,011 878 1,181 Construction 1,202 960 1,055 Wholesale & Retail 2,755 3,086 3,485 Hotels & Restaurants 1,234 1,344 1,471 Transport & Storage 432 382 428 Information & Communications 516 528 510 Financial Services 419 304 306 Business Services 2,000 2,412 3,026 Public Admin. 342 294 162 Education 936 818 1,005 Health & Social Work 1,567 1,560 1,656 Arts & Other 961 844 1,114 Source: Employer Skills Survey (2019)

91
Table A.1.10 Unweighted base sizes (Module C) for EPS measures (i.e. number of completed interviews) for all establishments in England, by size and sector (2014 – 2019)
2014 2016 2019 England total 10,032 10,015 13,365 Size 2 to 4 2,317 2,261 3,364 5 to 24 4,580 4,814 6,613 25 to 49 1,336 1,339 1,813 50 to 99 740 670 846 100 to 249 707 628 553 250+ 352 303 176 Sector Primary Sector & Utilities 440 375 500 Manufacturing 738 612 980 Construction 902 656 872 Wholesale & Retail 1,875 2,072 2,883 Hotels & Restaurants 854 991 1,193 Transport & Storage 328 267 360 Information & Communications 383 445 466 Financial Services 313 220 257 Business Services 1,568 1,934 2,669 Public Admin. 214 209 130 Education 667 572 822 Health & Social Work 1,070 1,066 1,321 Arts & Other 680 596 912 Source: Employer Skills Survey (2019)

92
Table A.1.11 Unweighted base sizes (Module C) for EPS measures (i.e. number of completed interviews) for all establishments in Northern Ireland, by size and sector (2014 – 2019)
2014 2016 2019 Northern Ireland total 2,005 2,007 1,011 Size 2 to 4 524 521 267 5 to 24 940 958 513 25 to 49 260 245 116 50 to 99 155 151 69 100 to 249 86 87 37 250+ 40 45 9 Sector Primary Sector & Utilities 96 120 50 Manufacturing 139 124 95 Construction 148 161 72 Wholesale & Retail 449 531 236 Hotels & Restaurants 173 131 73 Transport & Storage 53 56 27 Information & Communications 63 40 14 Financial Services 56 46 21 Business Services 202 246 122 Public Admin. 68 34 12 Education 153 139 89 Health & Social Work 258 252 113 Arts & Other 147 127 87 Source: Employer Skills Survey (2019)

93
Table A.1.12 Unweighted base sizes (Module C) for EPS measures (i.e. number of completed interviews) for all establishments in Wales, by size and sector (2014 – 2019)
2014 2016 2019 Wales total 2,007 1,997 1,683 Size 2 to 4 503 511 452 5 to 24 918 942 864 25 to 49 315 234 214 50 to 99 134 140 91 100 to 249 96 121 53 250+ 41 49 9 Sector Primary Sector & Utilities 133 114 110 Manufacturing 134 142 106 Construction 152 143 111 Wholesale & Retail 431 483 366 Hotels & Restaurants 207 222 205 Transport & Storage 51 59 41 Information & Communications 70 43 30 Financial Services 50 38 28 Business Services 230 232 235 Public Admin. 60 51 20 Education 116 107 94 Health & Social Work 239 242 222 Arts & Other 134 121 115 Source: Employer Skills Survey (2019)

94
Table A.1.13 Unweighted base sizes (Module D) for EPS measures (i.e. number of completed interviews) for all establishments, by country, size and sector (2014 – 2019)
2014 2016 2019 UK 14,044 14,019 16,031 Country England 10,032 10,015 13,352 Northern Ireland 2,005 2,007 1,001 Wales 2,007 1,997 1,678 Size 2 to 4 3,344 3,293 4,059 5 to 24 6,438 6,714 8,068 25 to 49 1,911 1,818 2,039 50 to 99 1,029 961 1,046 100 to 249 889 836 640 250+ 433 397 179 Sector Primary Sector & Utilities 669 609 567 Manufacturing 1,011 878 1,257 Construction 1,202 960 1,013 Wholesale & Retail 2,755 3,086 3,366 Hotels & Restaurants 1,234 1,344 1,571 Transport & Storage 432 382 488 Information & Communications 516 528 482 Financial Services 419 304 320 Business Services 2,000 2,412 3,090 Public Admin. 342 294 169 Education 936 818 993 Health & Social Work 1,567 1,560 1,605 Arts & Other 961 844 1,110

95
Table A.1.14 Unweighted base sizes (Module D) for EPS measures (i.e. number of completed interviews) for all establishments in England, by size and sector (2014 – 2019)
2014 2016 2019 England total 10,032 10,015 13,352 Size 2 to 4 2,317 2,261 3,322 5 to 24 4,580 4,814 6,697 25 to 49 1,336 1,339 1,733 50 to 99 740 670 890 100 to 249 707 628 555 250+ 352 303 155 Sector Primary Sector & Utilities 440 375 423 Manufacturing 738 612 1,041 Construction 902 656 848 Wholesale & Retail 1,875 2,072 2,792 Hotels & Restaurants 854 991 1,297 Transport & Storage 328 267 420 Information & Communications 383 445 429 Financial Services 313 220 265 Business Services 1,568 1,934 2,738 Public Admin. 214 209 127 Education 667 572 783 Health & Social Work 1,070 1,066 1,281 Arts & Other 680 596 908 Source: Employer Skills Survey (2019)

96
Table A.1.15 Unweighted base sizes (Module D) for EPS measures (i.e. number of completed interviews) for all establishments in Northern Ireland, by size and sector (2014 – 2019)
2014 2016 2019 Northern Ireland total 2,005 2,007 1,001 Size 2 to 4 524 521 228 5 to 24 940 958 558 25 to 49 260 245 111 50 to 99 155 151 66 100 to 249 86 87 28 250+ 40 45 10 Sector Primary Sector & Utilities 96 120 48 Manufacturing 139 124 102 Construction 148 161 68 Wholesale & Retail 449 531 233 Hotels & Restaurants 173 131 78 Transport & Storage 53 56 27 Information & Communications 63 40 13 Financial Services 56 46 25 Business Services 202 246 107 Public Admin. 68 34 11 Education 153 139 85 Health & Social Work 258 252 130 Arts & Other 147 127 74 Source: Employer Skills Survey (2019)

97
Table A.1.16 Unweighted base sizes (Module D) for EPS measures (i.e. number of completed interviews) for all establishments in Wales, by size and sector (2014 – 2019)
2014 2016 2019 Wales total 2,007 1,997 1,678 Size 2 to 4 503 511 509 5 to 24 918 942 813 25 to 49 315 234 195 50 to 99 134 140 90 100 to 249 96 121 57 250+ 41 49 14 Sector Primary Sector & Utilities 133 114 96 Manufacturing 134 142 114 Construction 152 143 97 Wholesale & Retail 431 483 341 Hotels & Restaurants 207 222 196 Transport & Storage 51 59 41 Information & Communications 70 43 40 Financial Services 50 38 30 Business Services 230 232 245 Public Admin. 60 51 31 Education 116 107 125 Health & Social Work 239 242 194 Arts & Other 134 121 128 Source: Employer Skills Survey (2019)

98
Table A.1.17 Unweighted base sizes (Module B & D) for EPS measures (i.e. number of completed interviews) for all establishments, by country, size and sector (2014 – 2019)
2014 2016 2019 UK 14,044 14,019 32,088 Country England 10,032 10,015 26,707 Northern Ireland 2,005 2,007 2,003 Wales 2,007 1,997 3,378 Size 2 to 4 3,344 3,293 8,016 5 to 24 6,438 6,714 16,156 25 to 49 1,911 1,818 4,147 50 to 99 1,029 961 2,163 100 to 249 889 836 1,263 250+ 433 397 343 Sector Primary Sector & Utilities 669 609 1,135 Manufacturing 1,011 878 2,529 Construction 1,202 960 2,084 Wholesale & Retail 2,755 3,086 6,795 Hotels & Restaurants 1,234 1,344 3,130 Transport & Storage 432 382 965 Information & Communications 516 528 955 Financial Services 419 304 649 Business Services 2,000 2,412 6,097 Public Admin. 342 294 330 Education 936 818 2,001 Health & Social Work 1,567 1,560 3,179 Arts & Other 961 844 2,239 Source: Employer Skills Survey (2019)

99
Table A.1.18 Unweighted base sizes (Module B & D) for EPS measures (i.e. number of completed interviews) for all establishments in England, by size and sector (2015 – 2019)
2014 2016 2019 England total 10,032 10,015 26,707 Size 2 to 4 2,317 2,261 6,532 5 to 24 4,580 4,814 13,434 25 to 49 1,336 1,339 3,521 50 to 99 740 670 1,830 100 to 249 707 628 1,100 250+ 352 303 290 Sector Primary Sector & Utilities 440 375 857 Manufacturing 738 612 2,091 Construction 902 656 1,731 Wholesale & Retail 1,875 2,072 5,636 Hotels & Restaurants 854 991 2,561 Transport & Storage 328 267 835 Information & Communications 383 445 844 Financial Services 313 220 542 Business Services 1,568 1,934 5,372 Public Admin. 214 209 247 Education 667 572 1,587 Health & Social Work 1,070 1,066 2,568 Arts & Other 680 596 1,836 Source: Employer Skills Survey (2019)

100
Table A.1.19 Unweighted base sizes (Module B & D) for EPS measures (i.e. number of completed interviews) for all establishments in Northern Ireland, by size and sector (2015 – 2019)
2014 2016 2019 Northern Ireland total 2,005 2,007 2,003 Size 2 to 4 524 521 473 5 to 24 940 958 1,067 25 to 49 260 245 247 50 to 99 155 151 141 100 to 249 86 87 56 250+ 40 45 19 Sector Primary Sector & Utilities 96 120 96 Manufacturing 139 124 194 Construction 148 161 159 Wholesale & Retail 449 531 462 Hotels & Restaurants 173 131 160 Transport & Storage 53 56 53 Information & Communications 63 40 31 Financial Services 56 46 46 Business Services 202 246 226 Public Admin. 68 34 26 Education 153 139 180 Health & Social Work 258 252 222 Arts & Other 147 127 148 Source: Employer Skills Survey (2019)

101
Table A.1.20 Unweighted base sizes (Module B & D) for EPS measures (i.e. number of completed interviews) for all establishments in Wales, by size and sector (2015 – 2019)
2014 2016 2019 Wales total 2,007 1,997 3,378 Size 2 to 4 503 511 1,011 5 to 24 918 942 1,655 25 to 49 315 234 379 50 to 99 134 140 192 100 to 249 96 121 107 250+ 41 49 34 Sector Primary Sector & Utilities 133 114 182 Manufacturing 134 142 244 Construction 152 143 194 Wholesale & Retail 431 483 697 Hotels & Restaurants 207 222 409 Transport & Storage 51 59 77 Information & Communications 70 43 80 Financial Services 50 38 61 Business Services 230 232 499 Public Admin. 60 51 57 Education 116 107 234 Health & Social Work 239 242 389 Arts & Other 134 121 255 Source: Employer Skills Survey (2019)

102
Table A.1.21 Size within sector population profile of establishments
Row percentages
Size
% 2 to 4 5 to 9 10 to 24 25 to 49 50 to 99 100 to 249 250+
Sector Primary Sector & Utilities % 77 14 6 2 1 1 *
Manufacturing % 44 21 17 8 5 3 1 Construction % 72 16 8 2 1 * * Wholesale & Retail % 47 27 18 5 2 1 * Hotels & Restaurants % 39 27 23 8 2 1 * Transport & Storage % 53 20 13 6 4 3 1 Information & Communication % 70 13 10 4 2 1 1
Financial Services % 47 25 17 5 3 2 2 Business Services % 65 18 11 3 2 1 1 Public Administration % 23 16 22 14 10 8 7 Education % 23 15 19 19 15 8 2 Health & Social Work % 29 22 27 12 6 2 1 Arts & Other Services % 59 24 11 3 2 1 * Source: ONS Inter-Departmental Business Register * denotes a figure greater than zero but less than 0.5%

103
Table A.1.22 Classification of establishments, by country, size and sector
Row percentages Unwtd. Base:
Priv
ate
sect
or
Third
sec
tor
Publ
ic s
ecto
r
Sing
le s
ite
Mul
ti-si
te
Total 81,013 % 88 8 4 71 29 Country England 70,217 % 88 8 3 71 29 Northern Ireland 4,023 % 81 12 5 74 26 Wales 6,773 % 86 8 6 70 30 Size 2 to 4 20,183 % 91 7 1 81 19 5 to 24 40,611 % 86 9 4 63 37 24 to 49 10,795 % 77 9 13 47 53 50 to 99 5,377 % 71 10 18 41 59 100 to 249 3,122 % 70 12 17 35 65 250+ 925 % 69 9 20 28 72 Sector Primary Sector & Utilities 2,952 % 98 1 1 88 12 Manufacturing 6,234 % 99 * * 80 20 Construction 5,249 % 100 * * 91 9 Wholesale & Retail 17,503 % 95 4 * 57 43 Hotels & Restaurants 7,594 % 93 6 * 64 36 Transport & Storage 2,330 % 97 2 1 69 31 Information & Communications 2,511 % 96 3 * 85 15 Financial Services 1,577 % 94 4 * 68 32 Business Services 15,490 % 95 3 1 74 26 Public Administration 840 % 10 4 83 47 53 Education 5,012 % 31 25 42 68 32 Health & Social Work 8,092 % 43 42 12 50 50 Arts & Other Services 5,629 % 63 29 6 72 28 ‘*’ denotes a figure larger than zero but smaller than 0.5 Source: Employer Skills Survey (2019)

104
Chapter 2: Where are the current skills bottlenecks? Table A.2.1 Incidence, number and density of skill-shortage vacancies (SSVs) by country, size and sector
Base: Column 1 and 2: All establishments; Column 3: all establishments with vacancies
Percentages in Column 3 are based on all vacancies, rather than all establishments with vacancies; figures therefore show the proportion of vacancies caused by skill shortages
% of establishments
with a skill-shortage vacancy
Number of skill-shortage
vacancies % of vacancies which
are SSVs
Unwtd. base % Rounded to
nearest 1,000
Unwtd. base %
Total 81,013 5 214,000 20,775 24 Country England 70,217 6 199,000 18,380 25 Northern Ireland 4,023 4 5,000 892 22 Wales 6,773 5 10,000 1,503 24 Size 2 to 4 20,183 3 30,000 1,473 34 5 to 24 40,611 7 67,000 8,878 29 25 to 49 10,795 14 28,000 4,667 24 50 to 99 5377 17 24,000 2,947 22 100 to 249 3122 21 27,000 2,100 20 250+ 925 25 39,000 710 20 Sector Primary Sector & Utilities 2,952 3 6,000 382 31 Manufacturing 6,234 8 18,000 1,477 36 Construction 5,249 4 11,000 824 36 Wholesale & Retail 17,503 5 25,000 3,584 22 Hotels & Restaurants 7,594 7 22,000 2,843 21 Transport & Storage 2,330 6 10,000 581 26 Information & Communications 2,511 5 9,000 609 23
Financial Services 1,577 5 4,000 346 13 Business Services 15,490 5 49,000 3,574 27 Public Administration 840 7 7,000 285 13 Education 5,012 7 9,000 1,727 23 Health & Social Work 8,092 9 36,000 3,304 25 Arts & Other Services 5,629 5 9,000 1,239 25

105
Table A.2.2 Density of skill-shortage vacancies, by country, size and sector (2013 - 2019)
Base: All establishments with vacancies
% of vacancies which are SSVs
2013 2015 2017 2019 Unwtd. Unwtd. Unwtd. Unwtd.
base % base % base % base % Total 17,460 22 22,687 22 23,287 22 20,775 24 Country England 15,894 22 20,697 23 21,033 22 18,380 25 Northern Ireland 550 19 713 14 855 21 892 22 Wales 1,016 20 1,277 24 1,399 27 1,503 24 Size 2 to 4 1,342 31 1,764 28 1,493 31 1,473 34 5 to 24 8,335 26 11,218 26 10,782 26 8,878 29 25 to 49 3,330 21 4,598 21 5,043 22 4,667 24 50 to 99 2,210 19 2,897 20 3,210 19 2,947 22 100 to 249 1,561 18 1,604 19 2,010 17 2,100 20 250+ 682 14 606 18 749 16 710 20 All sectors Primary Sector & Utilities 329 24 405 28 527 36 382 31 Manufacturing 1,247 30 1,499 30 1,685 29 1,477 36 Construction 639 22 1,092 34 1,201 36 824 36 Wholesale & Retail 2,754 18 3,526 20 3,620 19 3,584 22 Hotels & Restaurants 2,265 19 3,188 18 3,122 17 2,843 21 Transport & Storage 504 25 900 37 892 29 581 26 Information & Communications 626 25 965 24 937 28 609 23 Financial Services 368 11 433 21 503 17 346 13 Business Services 2,909 28 3,633 26 3,676 24 3,574 27 Public Administration 249 23 243 9 303 14 285 13 Education 1,905 12 1,921 15 1,970 22 1,727 23 Health & Social Work 2,176 22 2,920 21 3,102 21 3,304 25 Arts & Other Services 1,489 24 1,962 21 1,749 26 1,239 25

106
Table A.2.3 Volume of skill-shortage vacancies by occupation within sector
Tota
l
Skille
d tra
des
occu
patio
ns
Prof
essi
onal
s
Mac
hine
Ope
rativ
es
Car
ing,
leis
ure
and
othe
r ser
vice
sta
ff
Man
ager
s
Ass
ocia
te P
rofe
ssio
nals
Elem
enta
ry S
taff
Sale
s an
d cu
stom
er s
ervi
ces
staf
f
Adm
inis
trativ
e / C
leric
al S
taff
Total 214,306 40,543 40,914 19,494 33,150 5,451 27,009 22,908 11,972 9,346
Manufacturing 18,283 7,615 1,569 5,946 16 303 1,686 291 337 341
Construction 10,744 6,062 724 1,318 0 474 1,020 656 69 419 Primary Sector & Utilities 5,618 1,025 297 1,594 144 152 347 1,489 124 446
Business Services 48,919 6,689 14,188 1,935 3,497 1,089 9,757 5,454 1,658 3,664 Transport and Storage 10,051 876 769 5,568 23 122 967 680 514 329 Health and Social Work 36,310 312 12,270 120 18,679 674 1,969 413 232 582 Arts and Other Services 9,115 643 161 61 5,582 217 1,158 689 174 374 Information and Communications 9,300 1,291 4,613 21 20 194 2,438 73 314 248
Education 8,969 40 2,795 182 4,152 33 976 476 20 266
Wholesale and Retail 24,814 8,139 504 2,039 280 1,112 2,122 1,680 7,714 1,013
Hotels and Restaurants 21,729 7,693 12 679 465 879 229 10,906 295 362
Financial Services 3,583 0 881 0 0 97 1,376 0 455 708
Public Administration 6,871 159 2,131 31 291 105 2,963 100 66 593
Base: All establishments with skill-shortage vacancies

107
Table A.2.4 Unweighted base sizes for Table 2-2
Tota
l
Skille
d tra
des
occu
patio
ns
Prof
essi
onal
s
Mac
hine
Ope
rativ
es
Car
ing,
leis
ure
and
othe
r ser
vice
sta
ff
Man
ager
s
Ass
ocia
te P
rofe
ssio
nals
Elem
enta
ry S
taff
Sale
s an
d cu
stom
er s
ervi
ces
staf
f
Adm
inis
trativ
e / C
leric
al S
taff
Total 6,529 1,728 1,380 663 1,230 401 1,254 1,118 539 843
Manufacturing 660 569 174 457 2 100 340 129 80 191
Construction 339 415 105 108 0 57 120 73 30 120
Primary Sector & Utilities
149 69 33 113 18 20 38 118 20 49
Business Services 1,231 398 1,069 158 221 171 1,226 271 187 830
Transport and Storage
199 47 19 320 5 32 62 91 42 99
Health and Social Work
962 115 816 46 2,072 160 372 262 60 414
Arts and Other Services
336 91 96 17 458 117 302 214 60 245
Information and Communications
218 62 272 9 3 26 283 17 65 83
Education 469 38 671 22 828 37 231 262 6 251
Wholesale and Retail 955 652 107 327 23 236 350 443 1,852 278
Hotels and Restaurants
854 917 2 144 136 209 72 2,123 111 203
Financial Services 96 1 43 0 0 15 165 0 39 169
Public Administration 61 22 77 13 20 22 125 26 14 108
Base: All establishments with skill-shortage vacancies

108
Table A.2.5 Volume of skills gaps by occupation within sector
Tota
l
Elem
enta
ry s
taff
Sale
s an
d cu
stom
er s
ervi
ces
staf
f
Mac
hine
ope
rativ
es
Skill
ed tr
ades
occ
upat
ions
Ass
ocia
te p
rofe
ssio
nals
Adm
inis
trat
ive/
cler
ical
sta
ff
Car
ing,
leis
ure
and
othe
r ser
vice
sta
ff
Prof
essi
onal
s
Man
ager
s
Total 1,245,117 280,330 218,869 122,842 104,240 78,818 135,703 90,233 108,812 105,270 Hotels & Restaurants 147,802 87,028 26,983 1,984 11,375 554 5,317 2,237 727 11,596
Manufacturing 129,863 30,619 5,845 50,867 17,465 5,829 7,758 329 2,881 8,271
Public admin. 60,911 5,035 951 3,231 5,420 11,125 16,807 2,082 12,878 3,382 Wholesale & Retail 217,958 29,012 107,318 19,768 17,935 6,098 15,074 303 3,262 19,188 Business Services 249,838 67,593 32,763 13,803 14,306 27,791 33,614 3,927 34,720 21,319 Primary Sector & Utilities 28,695 7,041 725 10,274 2,842 738 2,968 661 759 2,688 Information & Communications 43,570 1,497 14,767 1,289 5,063 4,850 4,128 0 6,397 5,579
Construction 47,292 7,029 2,022 4,220 20,486 1,952 5,742 0 1,154 4,687 Transport & Storage 51,180 14,674 4,784 15,497 2,538 1,398 6,580 108 1,419 4,181 Financial Services 34,329 257 9,960 0 26 8,428 8,060 0 2,217 5,380 Arts & Other Services 47,183 12,768 5,748 1,374 3,489 3,214 5,211 9,606 1,611 4,162 Health & Social Work 119,241 8,050 5,886 395 2,296 4,120 15,227 49,989 22,193 11,085
Education 67,255 9,726 1,118 142 996 2,721 9,216 20,990 18,594 3,753 Base: All establishments

109
Table A.2.6 Unweighted base sizes for Table 2-3
Tota
l
Elem
enta
ry s
taff
Sale
s an
d cu
stom
er s
ervi
ces
staf
f
Mac
hine
ope
rativ
es
Skill
ed tr
ades
occ
upat
ions
Ass
ocia
te p
rofe
ssio
nals
Adm
inis
trat
ive/
cler
ical
sta
ff
Car
ing,
leis
ure
and
othe
r ser
vice
sta
ff
Prof
essi
onal
s
Man
ager
s
Total 81,013 26,003 23,959 13,265 21,410 13,052 48,948 12,802 17,819 77,494
Hotels & Restaurants
7,594 6,055 1,993 348 3,122 313 2,125 526 219 7,231
Manufacturing 6,234 2,064 1,996 3,349 2,961 1,471 4,620 41 1,135 6,070
Public admin. 840 271 110 94 196 267 740 117 242 798
Wholesale & Retail
17,503 4,063 11,353 3893 4,376 1,575 7,812 162 1,464 16,717
Business Services
15,490 1,958 3,471 1,489 2,080 3,833 11,170 641 5,033 14,883
Primary Sector & Utilities
2,952 1,087 288 829 754 202 1,371 139 175 2,719
Information & Communications
2,511 199 887 118 534 806 1,536 15 1,019 2,437
Construction 5,249 1,091 624 872 2,844 655 3,753 18 665 5,057
Transport & Storage
2,330 617 482 1,258 457 258 1,707 61 219 2,199
Financial Services
1,577 86 584 6 46 421 1,274 0 396 1,529
Arts & Other Services
5,629 1,781 1,212 426 1,064 928 3,127 1,942 749 5,096
Health & Social Work
8,092 3,429 724 389 1,828 1,213 5,543 5,111 2,755 7,851
Education 5,012 3,302 235 194 1,148 1,110 4,170 4,029 3,748 4,907
Base: All establishments

110
Table A.2.7 Incidence, number and density of skills gaps, by size (2013 - 2019)
Base: All establishments. Percentage of staff with skills gap measure is based on all employment, rather than all establishments; proportions therefore show the percentage of staff reported as having skills gaps See Table A.1.1 in Appendix A for base sizes.
2013 2015 2017 2019
% o
f est
ablis
hmen
ts w
ith
any
skill
s ga
ps
Num
ber o
f sta
ff no
t ful
ly
prof
icie
nt (s
kills
gap
s)
% o
f sta
ff w
ith s
kills
gap
s
% o
f est
ablis
hmen
ts w
ith
any
skill
s ga
ps
Num
ber o
f sta
ff no
t ful
ly
prof
icie
nt (s
kills
gap
s)
% o
f sta
ff w
ith s
kills
gap
s
% o
f est
ablis
hmen
ts w
ith
any
skill
s ga
ps
Num
ber o
f sta
ff no
t ful
ly
prof
icie
nt (s
kills
gap
s)
% o
f sta
ff w
ith s
kills
gap
s
% o
f est
ablis
hmen
ts w
ith
any
skill
s ga
ps
Num
ber o
f sta
ff no
t ful
ly
prof
icie
nt (s
kills
gap
s)
% o
f sta
ff w
ith s
kills
gap
s
Total 15 1,275,000 5.2 14 1,263,000 5.0 13 1,145,000 4.3 13 1,245,000 4.5
Size
2 to 4 7 64,000 2.9 6 58,000 2.6 6 59,000 2.4 5 57,000 2.2
5 to 24 21 284,000 4.8 19 262,000 4.3 19 263,000 4.2 19 281,000 4.3
25 to 49 32 153,000 5.0 30 145,000 4.5 30 154,000 4.7 32 161,000 4.8
50 to 99 35 163,000 5.1 33 144,000 4.5 31 141,000 4.3 35 160,000 4.6
100 to 249 43 200,000 5.4 39 195,000 5.0 33 188,000 4.6 38 209,000 4.8
250+ 47 412,000 6.2 43 458,000 6.8 42 339,000 4.8 39 378,000 5.2

111
Table A.2.8 Incidence, number and density of skills gaps, by sector (2013-2019)
Base: All establishments. Percentage of staff with skills gap measure is based on all employment, rather than all establishments; proportions therefore show the percentage of staff reported as having skills gaps See Table A.1.1 in Appendix A for base sizes.
2013 2015 2017 2019
% o
f es
tabl
ishm
ents
w
ith a
ny s
kills
Num
ber o
f sta
ff no
t fu
lly p
rofic
ient
(s
kills
gap
s)
% o
f sta
ff w
ith
skill
s ga
ps
% o
f es
tabl
ishm
ents
w
ith a
ny s
kills
ga
ps
Num
ber o
f sta
ff no
t fu
lly p
rofic
ient
(s
kills
gap
s)
% o
f sta
ff w
ith
skill
s ga
ps
% o
f es
tabl
ishm
ents
w
ith a
ny s
kills
Num
ber o
f sta
ff no
t fu
lly p
rofic
ient
(s
kills
gap
s)
% o
f sta
ff w
ith
skill
s ga
ps
% o
f es
tabl
ishm
ents
w
ith a
ny s
kills
Num
ber o
f sta
ff no
t fu
lly p
rofic
ient
(s
kills
gap
s)
% o
f sta
ff w
ith
skill
s ga
ps
Sector
Primary Sector & utilities 9 28,000 4.5 8 25,000 4.0 9 30,000 4.6 9 29,000 4.1
Manufacturing 17 122,000 5.7 19 150,000 6.9 18 124,000 5.6 17 130,000 5.8
Construction 11 54,000 4.8 10 39,000 3.8 10 42,000 3.9 10 47,000 3.9
Wholesale & Retail 17 233,000 5.7 16 223,000 5.4 15 210,000 5.0 15 218,000 5.1
Hotels & Restaurants 21 145,000 8.8 19 127,000 7.2 18 130,000 6.7 19 148,000 6.9
Transport & Storage 14 35,000 3.0 15 48,000 4.2 13 40,000 3.3 12 51,000 3.9
Information & Communications 13 51,000 6.1 11 54,000 5.7 9 44,000 4.6 8 44,000 4.0
Financial Services 18 82,000 8.7 16 33,000 3.6 15 46,000 5.0 16 34,000 3.8
Business Services 13 208,000 5.0 12 231,000 5.2 10 208,000 4.2 11 250,000 4.7
Public Administration 19 63,000 4.9 23 83,000 6.9 20 43,000 3.8 21 61,000 5.3
Education 18 86,000 3.6 19 94,000 3.9 18 68,000 2.8 17 67,000 2.8
Health & Social Work 18 119,000 3.7 16 112,000 3.3 13 114,000 3.3 16 119,000 3.3
Arts & Other Services 13 49,000 4.3 12 43,000 3.7 11 48,000 3.9 12 47,000 3.7

112
Table A.2.9 Density of skills gaps by sector within nation (2017-2019)
Base: All establishments Densities are based on skills gaps as a proportion of all employment within each occupation by sector, rather than the number of establishments with skills gaps. Where base between 30 and 49 establishments, figures are shown in italics Table A.2.10 Unweighted base sizes for previous table (Table A.4.2)
England Northern Ireland Wales
2017 2019 2017 2019 2017 2019 Total 71,527 70,217 3,937 4,023 5,913 6,773 Sector Primary Sector & Utilities 3,761 2,394 188 194 511 364 Manufacturing 5,498 5,391 252 377 419 466 Construction 5,622 4,531 319 317 481 401 Wholesale & Retail 11,841 15,131 782 930 958 1,442 Hotels & Restaurants 6,917 6,486 384 311 597 797 Transport & Storage 3,317 2,047 155 112 274 171 Information & Communications 3,436 2,305 117 65 168 141 Financial Services 2,195 1,387 122 81 154 109 Business Services 11,582 14,040 499 462 794 988 Public Administration 859 683 54 48 91 109 Education 4,516 4,190 255 359 375 463 Health & Social Work 6,315 6,828 461 439 603 825 Arts & Other Services 5,668 4,804 385 328 488 497
England Northern Ireland Wales
2017 2019 2017 2019 2017 2019 % % % % % % All sectors 4.3 4.6 3.8 3.3 4.7 4.0 Sector Primary Sector & Utilities 4.9 4.4 3.0 2.4 1.9 1.7 Manufacturing 5.6 5.5 5.1 8.3 5.9 8.3 Construction 3.8 3.9 4.8 3.3 4.4 3.7 Wholesale & Retail 4.9 5.2 5.4 4.5 5.6 3.8 Hotels & Restaurants 6.6 6.9 8.3 6.1 7.3 7.2 Transport & Storage 3.3 4.0 3.3 4.2 1.9 3.2 Information & Communications 4.7 4.1 1.7 3.1 2.5 2.8 Financial Services 4.9 3.9 3.2 0.8 7.7 4.8 Business Services 4.2 4.8 4.0 2.0 3.2 3.6 Public Administration 4.0 5.7 0.6 2.0 2.3 1.9 Education 2.8 2.9 3.8 1.2 3.2 1.7 Health & Social Work 3.2 3.4 1.1 1.2 5.7 3.1 Arts & Other Services 3.9 3.7 2.1 1.8 4.9 4.2

113
Table A.2.11 Proportion of each occupation lacking full proficiency within country
Total England Northern Ireland Wales
% % % %
Managers 2.2% 2.2% 1.5% 1.9%
Professionals 3.0% 3.1% 1.3% 1.5%
Associate professionals 4.3% 4.4% 2.6% 3.2%
Administrative / clerical staff 3.9% 4.0% 2.8% 3.2%
Skilled trades occupations 5.1% 5.1% 4.5% 4.5%
Caring, leisure and other services 3.7% 3.8% 1.6% 3.9%
Sales and customer services 6.4% 6.5% 4.8% 6.3%
Machine operatives 5.2% 5.0% 6.3% 7.0%
Elementary staff 8.0% 8.3% 4.9% 5.9% Base: All establishments employing each type of occupation (see Table A.2.12 for base sizes) Percentages are based on all employment, rather than all establishments; proportions therefore show the percentage of staff reported as having a skills gap. Table A.2.12 Unweighted base sizes for previous table (Table A.3.3)
Total England Northern Ireland Wales
Managers 77,494 67,249 3,836 6,409
Professionals 17,819 15,562 922 1,335
Associate professionals 13,052 11,478 597 977
Administrative / clerical staff 48,948 42,544 2,573 3,831
Skilled trades occupations 21,410 18,535 1,019 1,856
Caring, leisure and other services 12,802 10,831 762 1,209
Sales and customer services 23,959 21,025 1,169 1,765
Machine operatives 13,265 11,476 733 1,056
Elementary staff 26,003 22,357 1,371 2,275

114
Table A.2.13 Skills shortage vacancy density by LEA
Base: All establishments in England
LEA Unwtd. base SSV Density Number of SSVs
Total 70,217 24.2% 204,762
Top 10 LEAs with the highest SSV density Torbay 169 69.8% 1,085
Poole 194 48.3% 963
Luton 148 48.1% 1,250
Lambeth 282 47.9% 4,656
Middlesbrough 251 47.6% 720
Windsor and Maidenhead 163 43.7% 1,574
Southend on Sea 186 43.7% 715
Blackburn with Darwen 170 42.7% 858
Lewisham 181 42.2% 1,124
Waltham Forest 157 41.4% 1,061
Top 10 LEAs with the lowest SSV density
Walsall 247 7.0% 144
Wokingham 138 7.2% 297
Blackpool 154 7.8% 141
Tower Hamlets 295 8.8% 1,117
Gateshead 431 9.6% 269
Hillingdon 316 9.7% 564
Wirral 318 10.5% 470
North Tyneside 360 11.7% 327
Bracknell Forest 102 12.2% 220
Derby 302 12.5% 413

115
Table A.2.14 Skills shortage vacancy density by LEP
Base: All establishments in England
LEP Unwtd. base SSV Density Number of SSVs
Total 70,217 24.2% 204,762 Top 10 LEPs with the highest SSV density Lancashire 1,869 35.6% 6,708 Worcestershire 844 33.4% 2,357 Dorset 1,064 33.2% 3,305 Cheshire and Warrington 1,312 30.8% 4,870 Heart of the South West 2,761 30.7% 6,601 The Marches 1,165 30.7% 2,260 Greater Cambridge Greater Peterborough 2,637 28.9% 9,009 Buckinghamshire Thames Valley 639 28.4% 3,002 Solent 1,303 28.1% 4,315 Cumbria 1,053 27.9% 2,007 Top 10 LEPs with the lowest SSV density
Sheffield City Region 2,229 18.8% 3,833
York, North Yorkshire and East Riding 2,227 19.1% 3,550 Derby, Derbyshire, Nottingham and Nottinghamshire 2,913 19.8% 4,107
Cornwall and Isles of Scilly 979 20.0% 1,274
Leicester and Leicestershire 1,358 20.3% 4,164
Liverpool City Region 1,378 20.9% 3,830
Coventry and Warwickshire 1,105 20.9% 2,839
London 10,117 21.4% 43,002
Leeds City Region 3,957 22.1% 9,138
Hertfordshire 1,380 22.3% 4,818

116
Table A.2.15 Skills gap density by LEA
Base: All establishments in England
LEA Unwtd. base Skills Gap Density
Number of Skills Gaps
Total 70,217 4.5% 1,155,738
10 LEAs with the highest skills gap density
Blackburn with Darwen 170 11.3% 7,356
Knowsley 89 10.1% 6,802
Reading 148 8.9% 9,141
Lambeth 282 8.1% 12,627
Salford 208 7.8% 9,713
Southampton 188 7.4% 8,151
Luton 148 7.3% 6,496 Telford and Wrekin 200 6.9% 5,787
Trafford 286 6.9% 10,105
Calderdale 334 6.8% 6,207
10 LEAs with the lowest skills gap density
Wokingham 138 1.5% 1,387
Tower Hamlets 295 1.8% 5,150
Hartlepool 155 1.9% 570
Waltham Forest 157 2.0% 1,358
Tameside 207 2.0% 1,302
Hounslow 285 2.2% 3,391
Barking and Dagenham 128 2.3% 1,240
South Gloucestershire 259 2.3% 3,291
Wolverhampton 217 2.5% 2,444
Oldham 181 2.5% 2,033

117
Table A.2.16 Skills gap density by LEP
Base: All establishments in England
LEP Unwtd. base Skills Gap Density
Number of Skills Gaps
Total 70,217 4.5% 1,155,738
10 LEPs with the highest skills gap density
Leicester and Leicestershire 1,358 6.1% 28,762
Liverpool City Region 1,378 5.9% 36,681
Greater Cambridge Greater Peterborough 2,637 5.8% 46,946
Lancashire 1,869 5.6% 35,208
Hertfordshire 1,380 5.6% 35,380
Gloucestershire 986 5.4% 15,340
Greater Lincolnshire 1,716 5.2% 22,519
Dorset 1,064 5.1% 16,857
Greater Manchester 2,528 5.1% 65,373
Cheshire and Warrington 1,312 5.0% 24,260
10 LEPs with the lowest skills gap density
Black Country 1,079 3.0% 12,771
Stoke-on-Trent and Staffordshire 1,242 3.1% 14,551
Greater Birmingham and Solihull 1,970 3.5% 32,719
London 10,117 3.6% 182,710
Tees Valley 1,263 3.9% 10,007
Buckinghamshire Thames Valley 639 3.9% 8,894
North Eastern 4,039 4.0% 31,767
West of England 1,341 4.1% 23,484
Worcestershire 844 4.1% 10,275
Cumbria 1,053 4.2% 10,085

118
Table A.2.17 Skills shortage vacancy density by job role
Base: All establishments with Vacancies
Vacancies with an unweighted bae of less than 50 have been excluded.
Job role Unwtd. base SSV Density Number of SSVs
Top 10 job roles with the highest SSV density
Carpenters and joiners 136 66.0% 2,645
Welding trades 139 62.4% 1,508 Metal machining setters and setter-operators 127 61.6% 1,426
Butchers 57 58.4% 772 Vehicle technicians, mechanics and electricians 464 51.1% 5,274
Veterinarians 129 50.9% 1,086
Veterinary nurses 83 50.6% 825
Beauticians and related occupations 74 50.5% 925
Hairdressers and barbers 262 49.8% 3,759 Metal working production and maintenance fitters 569 48.9% 5,487
Top 10 job roles with the lowest SSV density
Library clerks and assistants 60 1.0% 18 Finance officers 82 1.9% 40 Laboratory technicians 50 4.9% 57 Customer service occupations n.e.c. 346 7.4% 950 Cleaning and housekeeping managers and supervisors
57 7.6% 77
Health associate professionals n.e.c. 59 8.3% 141 Finance and investment analysts and advisers
86 8.8% 607
Personal assistants and other secretaries 96 9.1% 152 Records clerks and assistants 157 9.2% 325 School secretaries 91 9.2% 77

119
Chapter 3: Which skills are lacking among applicants and the workforce? Table A.3.1 Skills lacking among applicants over time (prompted)
Base: All establishments with skill-shortage vacancies in each occupation – up to two occupations followed up Percentages are based on all skill-shortage vacancies, rather than all establishments with skill-shortage vacancies; proportions therefore show the percentage of skill-shortage vacancies within each occupation caused by lack of each skill
2015
2017
2019
Unweighted base 3,044 6,677 6,529 % % % Technical and practical skills Specialist skills or knowledge needed to perform the role 63 64 63 Solving complex problems requiring a solution specific to the situation 40 39 39 Knowledge of products and services offered by your organisation 37 36 38 Knowledge of how your organisation works 30 31 32 Reading and understanding instructions, guidelines, manuals or reports 27 32 31
Writing instructions, guidelines, manuals or reports 25 27 26 More complex numerical or statistical skills and understanding 29 25 24 Basic numerical skills and understanding 25 29 23 Computer literacy / basic IT skills 22 22 21 Adapting to new equipment or materials 20 22 21 Advanced or specialist IT skills 22 20 18 Manual dexterity 15 17 18 Communicating in a foreign language 15 16 17 None of the above 7 9 8 People and personal skills Ability to manage own time and prioritise own tasks 47 50 45 Team working 33 36 34 Customer handling skills 39 38 34 Managing their own feelings, or handling the feelings of others 32 36 33 Managing or motivating other staff 29 33 31 Persuading or influencing others 30 32 27 Instructing, teaching or training people 21 24 22 Sales skills 24 26 22 Setting objectives for others & planning human, financial & other resources 21 24 21
Making speeches or presentations 17 16 15 None of the above 25 22 24

120
Table A.3.2 Skills lacking among applicants, overall and by country (prompted)
Base: All establishments with skill-shortage vacancies – up to two occupations followed up Percentages are based on all skill-shortage vacancies, rather than all establishments with skill-shortage vacancies; proportions therefore show the percentage of skill-shortage vacancies within each occupation caused by lack of each skill
Tota
l
Engl
and
Nor
ther
n Ire
land
Wal
es
Unweighted base 6,529 5,785 246 498 % % % % Technical and practical skills Specialist skills or knowledge needed to perform the role 63 63 69 61 Solving complex problems requiring a solution specific to the situation 39 39 52 33
Knowledge of products and services offered by your organisation 38 37 46 36
Knowledge of how your organisation works 32 31 42 30 Reading and understanding instructions, guidelines, manuals or reports 31 30 44 30
Writing instructions, guidelines, manuals or reports 26 25 37 30 More complex numerical or statistical skills and understanding 24 23 40 19 Basic numerical skills and understanding 23 23 40 20 Adapting to new equipment or materials 21 21 40 20 Computer literacy / basic IT skills 21 20 33 24 Manual dexterity 18 18 36 16 Advanced or specialist IT skills 18 17 35 12 Communicating in a foreign language 17 17 34 6 Oral Welsh language skills 1 0 0 19 Written Welsh language skills 1 0 0 17 None of the above 8 8 6 7 People and personal skills Ability to manage own time and prioritise own tasks 45 45 55 42 Team working 34 33 49 40 Customer handling skills 34 33 49 30 Managing their own feelings, or handling the feelings of others 33 33 45 32 Managing or motivating other staff 31 31 44 27 Persuading or influencing others 27 26 40 23 Instructing, teaching or training people 22 21 37 29 Sales skills 22 22 37 24 Setting objectives for others & planning human, financial & other resources 21 21 37 16
Making speeches or presentations 15 14 36 18 None of the above 24 24 17 24

121
Table A.3.3 Technical or practical skills lacking among applicants, by sector (prompted)
Base: All establishments with skill-shortage vacancies – up to two occupations followed up.
‘*’ denotes a figure greater than zero but less than 0.5%.
Percentages are based on all skill-shortage vacancies, rather than all establishments with skill-shortage vacancies; proportions therefore show the percentage of skill-shortage vacancies within each sector caused by lack of each skill.
Ove
rall
Prim
ary
Sect
or &
U
tiliti
es
Man
ufac
turin
g
Con
stru
ctio
n
Who
lesa
le &
Ret
ail
Hot
els
&
Res
taur
ants
Tran
spor
t &
Stor
age
Info
rmat
ion
&
Com
mun
icat
ions
Fina
ncia
l Ser
vice
s
Bus
ines
s Se
rvic
es
Publ
ic A
dmin
.
Educ
atio
n
Hea
lth &
Soc
ial
Wor
k
Art
s &
Oth
er
Serv
ices
Unweighted base 6,529 149 660 339 955 854 199 218 96 1,231 61 469 962 336 % % % % % % % % % % % % % % Specialist skills or knowledge 63 75 61 71 57 55 62 72 76 66 47 67 65 61 Solving complex problems 39 48 33 48 42 34 38 53 29 45 56 29 31 32 Knowledge of products & services offered 38 28 43 44 46 41 31 49 51 34 33 29 31 40 Knowledge of how organisation works 32 28 24 29 34 37 38 30 23 25 40 35 37 34 Reading/understanding instructions, reports etc. 31 31 37 34 32 36 48 16 16 28 33 25 27 28 Writing instructions, reports, etc 26 29 31 25 23 27 38 19 12 21 37 25 28 22 Complex numerical or statistical skills 24 21 21 30 26 19 25 34 23 25 37 25 17 21 Basic numerical skills 23 35 24 26 27 28 33 14 13 19 15 19 22 31 Adapting to new equipment or materials 21 31 32 30 30 22 28 16 10 15 25 12 14 21 Computer literacy / basic IT skills 21 30 18 17 22 14 26 15 8 20 33 18 26 20 Manual dexterity 18 38 29 33 26 17 21 12 * 15 18 8 10 16 Advanced or specialist IT skills 18 14 14 18 15 7 17 60 27 21 16 15 15 10 Communicating in a foreign language 17 12 26 8 10 21 26 10 3 13 12 13 28 12 None of the above 8 6 4 6 7 13 5 3 6 6 4 12 10 9

122
Table A.3.4 People and personal skills lacking among applicants, by sector (prompted)
Ove
rall
Prim
ary
Sect
or &
U
tiliti
es
Man
ufac
turin
g
Con
stru
ctio
n
Who
lesa
le &
R
etai
l
Hot
els
&
Res
taur
ants
Tran
spor
t &
Stor
age
Info
rmat
ion
&
Com
mun
icat
ions
Fina
ncia
l Se
rvic
es
Bus
ines
s Se
rvic
es
Publ
ic A
dmin
.
Educ
atio
n
Hea
lth &
Soc
ial
Wor
k
Art
s &
Oth
er
Serv
ices
Unweighted base 6,529 149 660 339 955 854 199 218 96 1,231 61 469 962 336 % % % % % % % % % % % % % %
Ability to manage own time and prioritise own tasks 45 53 31 55 53 59 49 34 28 40 49 38 41 51
Team working 34 49 32 36 36 51 32 29 18 24 43 33 33 43
Customer handling skills 34 32 18 38 45 44 42 31 34 32 24 23 27 47
Managing own feelings, or handling feelings of others 33 40 26 32 37 43 40 26 32 28 38 39 30 42
Managing or motivating other staff 31 37 25 30 32 43 34 23 22 34 20 28 26 35
Persuading or influencing others 27 16 19 22 33 35 34 25 25 26 32 20 24 28
Instructing, teaching or training people 22 24 19 23 23 32 19 14 13 22 27 27 19 20
Sales skills 22 11 12 16 34 31 20 26 30 26 19 6 11 37
Setting objectives for others & planning resources 21 17 16 22 22 26 24 22 16 24 13 15 18 23
Making speeches or presentations 15 10 11 14 13 11 19 26 6 16 30 16 12 25
None of the above 24 22 29 21 18 15 22 27 37 23 12 23 35 20 Base: All establishments with skill-shortage vacancies – up to two occupations followed up.
‘*’ denotes a figure greater than zero but less than 0.5%. Percentages are based on all skill-shortage vacancies, rather than all establishments with skill-shortage vacancies; proportions therefore show the percentage of skill-shortage vacancies within each sector caused by lack of each skill.

123
Table A.3.5 Digital skills found difficult to obtain from applicants, overall and by occupation (unprompted)
Ove
rall
Man
ager
s
Prof
essi
onal
s
Ass
ocia
te
Prof
essi
onal
s
Adm
inis
trat
ive
and
Cle
rical
Skill
ed T
rade
s
Car
ing,
Lei
sure
an
d O
ther
Se
rvic
es
Sale
s an
d C
usto
mer
Se
rvic
e
Mac
hine
O
pera
tives
Elem
enta
ry
Occ
upat
ions
Unweighted base 2,051 152 495 502 362 476 356 221 177 284 % % % % % % % % % % Basic Microsoft Office application skills 36 46 19 28 41 27 56 39 31 52 Foundation digital skills 25 11 9 21 11 23 41 28 29 49 Specialist software or hardware / internal systems 20 15 25 17 24 24 14 26 29 16 Advanced Microsoft Office skills 12 15 13 21 26 8 8 8 5 9 Application programming and development skills 12 8 24 19 4 10 3 4 24 1 Communicating via email 11 7 6 9 10 6 12 10 10 35 Data analysis / analysis / data science skills 7 14 7 14 7 5 2 6 5 4 Graphic design / design engineering skills 6 2 9 15 1 7 1 1 2 * Other 7 11 5 7 5 12 5 9 2 6 Base: All establishments with skill-shortage vacancies – up to two occupations followed up.
‘*’ denotes a figure greater than zero but less than 0.5%. Percentages are based on all skill-shortage vacancies, rather than all establishments with skill-shortage vacancies; proportions therefore show the percentage of skill-shortage vacancies within each sector caused by lack of each skill. Note: Column percentages exceed 100 per cent because of multiple responses; skill-shortage vacancies unable to be coded to an occupational group have been included in the “Overall” figures, though have not been included in the more detailed breakdown.

124
Table A.3.6 Technical and practical skills lacking among applicants, overall and by occupation (prompted)
Ove
rall
Man
ager
s
Prof
essi
onal
s
Ass
ocia
te
Prof
essi
onal
s
Adm
inis
trat
ive
and
Cle
rical
Skill
ed T
rade
s
Car
ing,
Lei
sure
an
d O
ther
Ser
vice
s
Sale
s an
d C
usto
mer
Ser
vice
Mac
hine
O
pera
tives
Elem
enta
ry
Occ
upat
ions
Unweighted base 6,529 289 1,222 1,022 455 1,607 1,018 409 558 749
% % % % % % % % % % Specialist skills or knowledge needed to perform the role 63 64 74 63 50 72 62 52 59 46
Solving complex problems requiring a solution specific to the situation
39 44 40 43 44 42 37 38 29 36
Knowledge of products and services offered by your organisation and organisations like yours
38 41 29 46 43 43 39 54 26 30
Knowledge of how your organisation works 32 41 28 34 36 26 38 40 27 33
Reading and understanding instructions, guidelines, manuals or reports
31 27 13 22 29 29 40 31 53 45
Writing instructions, guidelines, manuals or reports 26 25 16 23 25 22 38 18 42 25
More complex numerical or statistical skills and understanding
24 26 23 28 38 25 25 23 15 15
Basic numerical skills and understanding 23 19 9 17 29 25 33 26 36 26
Adapting to new equipment or materials 21 17 10 20 13 28 21 23 37 20
Computer literacy / basic IT skills 21 24 12 21 28 16 28 27 18 24
Manual dexterity 18 6 6 12 8 36 15 14 23 24
Advanced or specialist IT skills 18 21 25 26 32 14 15 15 4 8 Communicating in a foreign language 17 9 21 11 8 16 20 10 21 20
None of the above 8 5 8 6 4 6 10 8 5 13 Base: All establishments with skill-shortage vacancies in each occupation – up to two occupations followed up
Percentages are based on all skill-shortage vacancies, rather than all establishments with skill-shortage vacancies; proportions therefore show the percentage of skill-shortage vacancies within each occupation caused by lack of each skill. ‘*’ denotes a figure greater than zero but less than 0.5%. Note: Column percentages exceed 100 per cent because of multiple responses; skill-shortage vacancies unable to be coded to an occupational group have been included in the “Overall” figures, though have not been included in the more detailed breakdown.

125
Table A.3.7 People and personal skills lacking among applicants, overall and by occupation (prompted)
Ove
rall
Man
ager
s
Prof
essi
onal
s
Ass
ocia
te
Prof
essi
onal
s
Adm
inis
trat
ive
and
Cle
rical
Skill
ed T
rade
s
Car
ing,
Lei
sure
and
O
ther
Ser
vice
s
Sale
s an
d C
usto
mer
Se
rvic
e
Mac
hine
Ope
rativ
es
Elem
enta
ry
Occ
upat
ions
Unweighted base 6,529 289 1,222 1,022 455 1,607 1,018 409 558 749
% % % % % % % % % % Ability to manage own time and prioritise own tasks 45 38 27 39 42 48 57 57 41 61
Team working 34 32 18 30 28 34 45 36 43 43
Customer handling skills 34 40 20 33 40 28 44 58 28 41 Managing their own feelings, or handling the feelings of others
33 37 23 30 31 32 43 41 35 37
Managing or motivating other staff 31 49 26 26 29 33 33 32 29 40
Persuading or influencing others 27 43 19 35 25 23 30 45 16 27
Instructing, teaching or training people 22 33 17 22 18 22 26 24 16 29
Sales skills 22 27 16 33 23 13 21 54 8 33 Setting objectives for others and planning human, financial and other resources
21 39 21 21 22 22 26 20 13 18
Making speeches or presentations 15 14 21 20 13 10 16 18 6 9
None of the above 24 19 39 23 21 26 17 12 23 14 Base: All establishments with skill-shortage vacancies in each occupation – up to two occupations followed up
Percentages are based on all skill-shortage vacancies, rather than all establishments with skill-shortage vacancies; proportions therefore show the percentage of skill-shortage vacancies within each occupation caused by lack of each skill.
Note: Column percentages exceed 100 per cent because of multiple responses; skill-shortage vacancies unable to be coded to an occupational group have been included in the “Overall” figures, though have not been included in the more detailed breakdown

126
Table A.3.8 Digital skills found difficult to obtain from applicants, overall and by occupation (unprompted)
Ove
rall
Man
ager
s
Prof
essi
onal
s
Ass
ocia
te P
rofe
ssio
nals
Adm
inis
trat
ive
and
Cle
rical
Skill
ed T
rade
s
Car
ing,
Lei
sure
and
Oth
er
Serv
ices
Sale
s an
d C
usto
mer
Se
rvic
e
Mac
hine
Ope
rativ
es
Elem
enta
ry O
ccup
atio
ns
Unweighted base 2,051 152 495 502 362 476 356 221 177 284
% % % % % % % % % %
Basic Microsoft Office application skills 36 46 19 28 41 27 56 39 31 52 Foundation digital skills 25 11 9 21 11 23 41 28 29 49 Specialist software or hardware / internal systems 20 15 25 17 24 24 14 26 29 16 Advanced Microsoft Office skills 12 15 13 21 26 8 8 8 5 9 Application programming and development skills 12 8 24 19 4 10 3 4 24 1 Communicating via email 11 7 6 9 10 6 12 10 10 35 Data analysis / analysis / data science skills 7 14 7 14 7 5 2 6 5 4 Graphic design / design engineering skills 6 2 9 15 1 7 1 1 2 * Base: All establishments with skill-shortage vacancies in each occupation – up to two occupations followed up
Percentages are based on all skill-shortage vacancies, rather than all establishments with skill-shortage vacancies; proportions therefore show the percentage of skill-shortage vacancies within each occupation caused by lack of each skill.
Note: Column percentages exceed 100 per cent because of multiple responses; skill-shortage vacancies unable to be coded to an occupational group have been included in the “Overall” figures, though have not been included in the more detailed breakdown

127
Table A.3.9 Skills lacking among staff over time (prompted)
Base: All establishments with skills gaps – up to two occupations followed up
Percentages are based on all skills gaps, rather than all establishments with skills gaps; proportions therefore show the percentage of skills gaps attributed to each cause.
2015
2017
2019
Unweighted base 8,526 16,519 16,169 % % % Technical and practical skills Specialist skills or knowledge needed to perform the role 48 47 53
Knowledge of products and services offered by your organisation 37 39 43
Solving complex problems requiring a solution specific to the situation 39 36 41
Knowledge of how your organisation works 37 35 40
Adapting to new equipment or materials 32 28 36
Reading and understanding instructions, guidelines, manuals or reports 30 31 34
Computer literacy / basic IT skills 30 25 28
Writing instructions, guidelines, manuals or reports 22 23 24
Basic numerical skills and understanding 20 21 24
More complex numerical or statistical skills and understanding 25 20 23
Advanced or specialist IT skills 27 19 20
Manual dexterity 14 12 18
Communicating in a foreign language 12 13 17
None of the above 9 10 7
People and personal skills Ability to manage own time and prioritise own tasks 59 59 60
Team working 55 50 50
Managing their own feelings, or handling the feelings of others 46 43 49
Customer handling skills 46 45 45
Managing or motivating other staff 41 37 41
Persuading or influencing others 39 35 38
Instructing, teaching or training people 29 27 30 Setting objectives for others & planning human, financial & other resources
31 25 28
Sales skills 24 26 26
Making speeches or presentations 17 16 19
None of the above 12 12 14

128
Table A.3.10 Technical and practical skills lacking among staff with skills gaps, by sector (prompted)
Base: All establishments with skills gaps – up to two occupations followed up Percentages are based on all skills gaps, rather than all establishments with skills gaps; proportions therefore show the percentage of skills gaps attributed to each cause. ‘*’ denotes a figure greater than zero but smaller than 0.5.
Ove
rall
Prim
ary
Sect
or
& U
tiliti
es
Man
ufac
turin
g
Con
stru
ctio
n
Who
lesa
le &
R
etai
l
Hot
els
&
Res
taur
ants
Tran
spor
t &
Stor
age
Info
rmat
ion
&
Com
ms
Fina
ncia
l Se
rvic
es
Bus
ines
s Se
rvic
es
Publ
ic A
dmin
.
Educ
atio
n
Hea
lth &
Soc
ial
Wor
k
Art
s &
Oth
er
Serv
ices
Unweighted base 16,169 434 1,548 892 3,521 2,208 413 382 328 2,638 173 1,090 1,614 928 % % % % % % % % % % % % % % Specialist skills or knowledge 53 46 65 60 43 45 48 62 73 54 42 59 64 55
Knowledge of products & services offered 43 36 48 35 50 50 43 54 63 36 24 31 34 46
Solving complex problems 41 40 34 48 37 37 44 59 53 40 26 43 51 39
Knowledge of how organisation works 40 38 39 27 40 45 49 40 48 34 27 36 48 39
Adapting to new equipment or materials 36 43 37 37 37 31 40 36 24 38 47 26 39 29 Reading and understanding instructions, reports etc. 34 50 49 35 33 32 43 15 31 32 19 30 36 24
Computer literacy / basic IT skills 28 37 23 23 31 19 30 17 36 24 29 36 48 27
Writing instructions, guidelines, etc 24 39 33 25 19 20 24 28 34 22 15 21 34 20
Basic numerical skills 24 40 36 18 22 27 29 11 7 19 11 18 35 19
Complex numerical or statistical skills 23 35 33 23 18 16 21 40 33 23 11 20 32 19
Advanced or specialist IT skills 20 13 16 17 16 9 20 52 22 23 16 30 33 15 Manual dexterity 18 40 27 30 14 14 19 9 2 25 11 4 9 12 Communicating in a foreign language 17 25 16 13 10 18 15 5 3 25 9 12 25 6 None of the above 7 9 4 9 8 11 7 6 8 6 10 8 5 9

129
Table A.3.12 Digital skills lacking among staff with skills gaps, by sector (unprompted)
Ove
rall
Prim
ary
Sect
or &
U
tiliti
es
Man
ufac
turin
g
Con
stru
ctio
n
Who
lesa
le &
Ret
ail
Hot
els
&
Res
taur
ants
Tran
spor
t &
Stor
age
Info
rmat
ion
&
Com
mun
icat
ions
Fina
ncia
l Ser
vice
s
Bus
ines
s Se
rvic
es
Publ
ic A
dmin
.
Educ
atio
n
Hea
lth &
Soc
ial
Wor
k
Art
s &
Oth
er
Serv
ices
Unweighted base 6,408 145 606 310 1381 551 175 222 122 1181 84 525 754 352
% % % % % % % % % % % % % %
Basic Microsoft Office skills 35 50 39 40 26 42 38 15 63 36 21 46 29 45 Specialist software or hardware /internal systems 26 13 21 22 19 16 30 18 12 29 60 19 43 19 Foundation digital skills 19 8 16 17 28 28 22 4 3 13 18 20 21 16 Advanced Microsoft Office skills 18 37 16 24 13 11 14 29 30 21 16 30 10 14 Communicating via email 10 4 11 16 7 14 15 1 * 14 6 15 12 12 Data analysis / analytics / data science skills 6 4 8 9 6 2 4 29 2 5 6 6 3 4 Skills using new or updated company software or systems 5 31 3 1 6 3 3 3 6 5 1 7 2 3 Application ('app') programming and development skills 5 17 6 5 5 3 2 7 3 5 2 6 2 3 Using the internet to find solutions to problems 5 1 * 2 4 5 3 * 1 12 0 7 3 3 Base: All establishments with skills gaps – up to two occupations followed up Percentages are based on all skills gaps, rather than all establishments with skills gaps; proportions therefore show the percentage of skills gaps attributed to each cause. ‘*’ denotes a figure greater than zero but smaller than 0.5.
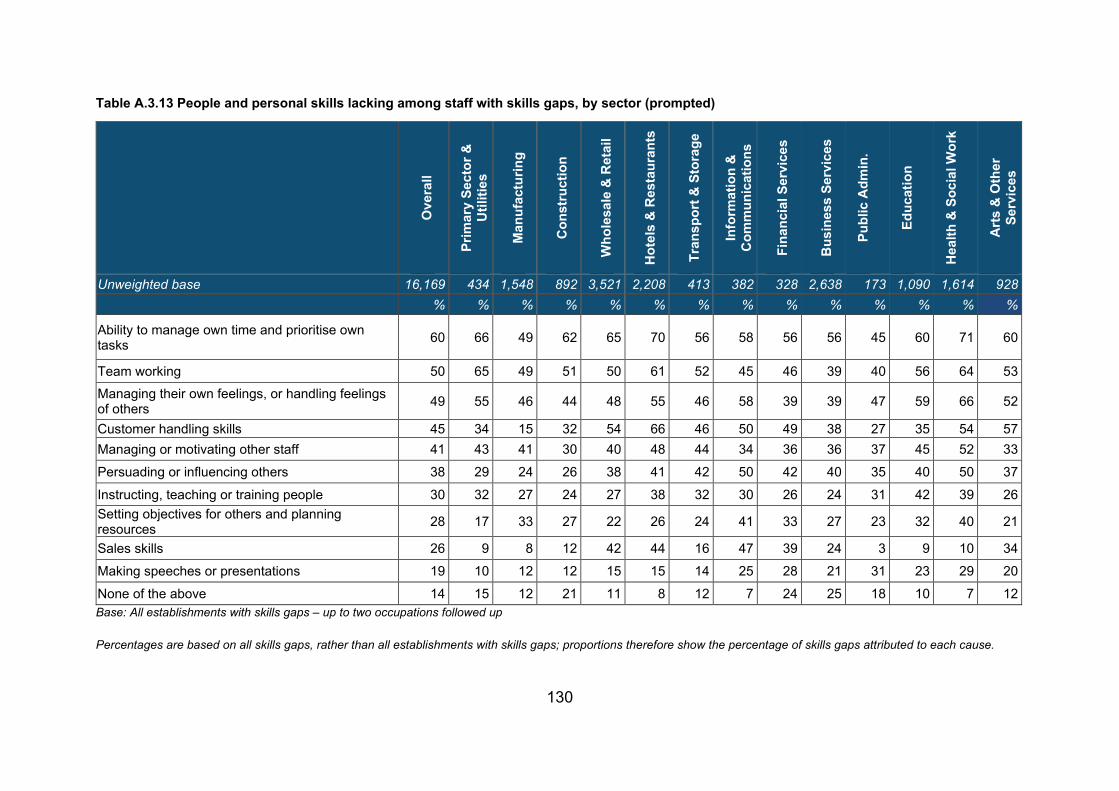
130
Table A.3.13 People and personal skills lacking among staff with skills gaps, by sector (prompted)
Base: All establishments with skills gaps – up to two occupations followed up
Percentages are based on all skills gaps, rather than all establishments with skills gaps; proportions therefore show the percentage of skills gaps attributed to each cause.
Ove
rall
Prim
ary
Sect
or &
U
tiliti
es
Man
ufac
turin
g
Con
stru
ctio
n
Who
lesa
le &
Ret
ail
Hot
els
& R
esta
uran
ts
Tran
spor
t & S
tora
ge
Info
rmat
ion
&
Com
mun
icat
ions
Fina
ncia
l Ser
vice
s
Bus
ines
s Se
rvic
es
Publ
ic A
dmin
.
Educ
atio
n
Hea
lth &
Soc
ial W
ork
Art
s &
Oth
er
Serv
ices
Unweighted base 16,169 434 1,548 892 3,521 2,208 413 382 328 2,638 173 1,090 1,614 928 % % % % % % % % % % % % % %
Ability to manage own time and prioritise own tasks 60 66 49 62 65 70 56 58 56 56 45 60 71 60
Team working 50 65 49 51 50 61 52 45 46 39 40 56 64 53 Managing their own feelings, or handling feelings of others 49 55 46 44 48 55 46 58 39 39 47 59 66 52
Customer handling skills 45 34 15 32 54 66 46 50 49 38 27 35 54 57 Managing or motivating other staff 41 43 41 30 40 48 44 34 36 36 37 45 52 33 Persuading or influencing others 38 29 24 26 38 41 42 50 42 40 35 40 50 37
Instructing, teaching or training people 30 32 27 24 27 38 32 30 26 24 31 42 39 26 Setting objectives for others and planning resources 28 17 33 27 22 26 24 41 33 27 23 32 40 21
Sales skills 26 9 8 12 42 44 16 47 39 24 3 9 10 34 Making speeches or presentations 19 10 12 12 15 15 14 25 28 21 31 23 29 20 None of the above 14 15 12 21 11 8 12 7 24 25 18 10 7 12

131
Table A.3.14 Technical and practical skills lacking among staff with skills gaps, by occupation (prompted)
Ove
rall
Man
ager
s
Prof
essi
onal
s
Ass
ocia
te
Prof
essi
onal
s
Adm
inis
trat
ive
and
Cle
rical
Skill
ed T
rade
s
Car
ing,
Le
isur
e an
d O
ther
Se
rvic
es
Sale
s an
d C
usto
mer
Se
rvic
e
Mac
hine
O
pera
tives
Elem
enta
ry
Occ
upat
ions
Unweighted base 16,169 2,567 1,379 1,312 3,432 2,545 1,822 3,548 1,595 3,414 % % % % % % % % % % Specialist skills or knowledge needed to perform the role 53 54 77 68 43 65 63 45 51 46
Knowledge of products and services offered by your organisation and organisations like yours 43 28 29 45 43 40 38 57 42 44
Solving complex problems requiring a solution specific to the situation 41 50 51 53 48 45 40 38 34 30
Knowledge of how your organisation works 40 33 47 41 38 29 42 44 32 42 Adapting to new equipment or materials 36 25 33 25 29 40 32 32 48 45 Reading and understanding instructions, guidelines, manuals or reports 34 25 16 26 30 35 44 29 47 41
Computer literacy / basic IT skills 28 36 31 26 32 24 37 28 29 23 Writing instructions, guidelines, manuals or reports 24 36 18 24 22 26 32 16 27 25
Basic numerical skills and understanding 24 17 23 9 18 19 25 19 34 34 More complex numerical or statistical skills and understanding 23 31 36 31 30 21 17 18 23 19
Advanced or specialist IT skills 20 32 42 29 38 18 15 17 9 10 Manual dexterity 18 7 3 4 7 30 14 9 34 31 Communicating in a foreign language 17 10 24 4 10 10 14 9 19 30 None of the above 7 9 6 8 6 10 7 9 5 7 Base: All establishments with skills gaps in each occupation – up to two occupations followed up Percentages are based on all skills gaps, rather than all establishments with skills gaps; proportions therefore show the percentage of skills gaps attributed to each cause. ‘*’ denotes a figure greater than zero but smaller than 0.5.

132
Table A.3.15 Digital skills lacking among staff with skills gaps, by occupation (unprompted)
Ove
rall
Man
ager
s
Prof
essi
onal
s
Ass
ocia
te
Prof
essi
onal
s
Adm
inis
trat
ive
and
Cle
rical
Skill
ed T
rade
s
Car
ing,
Lei
sure
an
d O
ther
Se
rvic
es
Sale
s an
d C
usto
mer
Ser
vice
Mac
hine
O
pera
tives
Elem
enta
ry
Occ
upat
ions
Unweighted base 6,408 1,034 533 547 1831 691 657 1,182 403 775
% % % % % % % % % %
Basic Microsoft Office skills 35 34 17 37 41 33 43 28 40 40 Specialist software or hardware /internal systems 26 15 56 24 29 25 17 20 27 22 Foundation digital skills 19 15 2 6 9 21 39 26 24 23 Advanced Microsoft Office skills 18 31 18 23 31 17 9 15 16 5 Communicating via email 10 11 4 2 5 13 20 4 11 24 Data analysis / analytics / data science skills 6 8 5 7 7 6 3 10 4 2 Skills using new or updated company software or systems 5 5 4 2 4 4 3 5 11 6 Application ('app') programming and development skills 5 3 6 4 3 9 4 5 10 2 Using the internet to find solutions to problems 5 4 3 1 1 3 6 3 2 15 Base: All establishments with skills gaps – followed up caused by a lack of IT skills Percentages are based on all skills gaps, rather than all establishments with skills gaps; proportions therefore show the percentage of skills gaps attributed to each cause.

133
Table A.3.16 People and personal skills lacking among staff with skills gaps, by occupation (prompted)
Ove
rall
Man
ager
s
Prof
essi
onal
s
Ass
ocia
te
Prof
essi
onal
s
Adm
inis
trat
ive
and
Cle
rical
Skill
ed T
rade
s
Car
ing,
Lei
sure
an
d O
ther
Se
rvic
es
Sale
s an
d C
usto
mer
Se
rvic
e
Mac
hine
O
pera
tives
Elem
enta
ry
Occ
upat
ions
Unweighted base 16,169 2,567 1,379 1,312 3,432 2,545 1,822 3,548 1,595 3,414
% % % % % % % % % % Ability to manage own time and prioritise own tasks 60 60 72 56 57 59 65 65 57 56 Team working 50 54 53 42 41 48 61 48 57 51 Managing their own feelings, or handling the feelings of others 49 56 53 48 44 41 61 51 44 48 Customer handling skills 45 35 45 42 49 31 49 65 23 45 Managing or motivating other staff 41 70 60 49 30 37 42 33 34 37 Persuading or influencing others 38 54 57 42 36 29 38 43 25 33 Instructing, teaching or training people 30 46 51 35 24 31 30 23 28 24 Setting objectives for others and planning human, financial and other resources
28 58 54 43 22 22 23 20 16 23
Sales skills 26 23 15 25 24 17 13 56 6 25 Making speeches or presentations 19 33 45 36 20 13 16 15 8 11 None of the above 14 14 11 13 12 22 10 9 15 20 Base: All establishments with skills gaps in each occupation – up to two occupations followed up.
Percentages are based on all skills gaps, rather than all establishments with skills gaps; proportions therefore show the percentage of skills gaps attributed to each cause.

134
Chapter 4: Addressing skills shortages
Table A.4.1 Main causes of skills gaps, by sector (prompted)
Ove
rall
Prim
ary
Sect
or &
U
tiliti
es
Man
ufac
turin
g
Con
stru
ctio
n
Who
lesa
le &
R
etai
l
Hot
els
&
Res
taur
ants
Tran
spor
t &
Stor
age
Info
rmat
ion
&
Com
mun
icat
ions
Fina
ncia
l Ser
vice
s
Bus
ines
s Se
rvic
es
Publ
ic A
dmin
.
Educ
atio
n
Hea
lth &
Soc
ial
Wor
k
Art
s &
Oth
er
Serv
ices
Unweighted base 16,169 434 1,548 892 3,521 2,208 413 382 328 2,638 173 1,090 1,614 928 % % % % % % % % % % % % % % They are new to the role 67 73 58 59 63 73 63 63 80 74 69 60 68 60 Their training is currently only partially completed 61 57 61 68 58 63 61 47 78 67 75 50 45 60
Staff lack motivation 38 47 38 36 38 46 46 31 32 34 18 33 49 32 They have been on training, but their performance has not improved sufficiently
33 42 37 27 35 41 40 18 34 29 14 31 33 27
Unable to recruit staff with the required skills 32 45 33 33 28 37 38 25 31 25 22 31 45 28
Problems retaining staff 29 37 33 24 21 31 37 31 29 38 18 28 27 22 The introduction of new working practices 29 36 20 18 30 26 31 21 39 26 38 38 46 21
They have not received the appropriate training 28 33 29 26 24 24 25 24 33 31 30 22 33 23
The introduction of new technology 25 33 21 18 28 15 27 32 41 23 25 21 37 15
The development of new products and services 20 22 22 10 22 19 15 21 38 15 30 15 27 13 Base: All establishments with skills gaps – up to two occupations followed up.
Percentages are based on all skills gaps, rather than all establishments with skills gaps; proportions therefore show the percentage of skills gaps attributed to each cause.

135
Table A.4.2 Main causes of skills gaps, by occupation (prompted)
Man
ager
s
Prof
essi
onal
s
Ass
ocia
te
Prof
essi
onal
s
Adm
inis
trat
ive
and
Cle
rical
Skill
ed T
rade
s
Car
ing,
Lei
sure
an
d O
ther
Se
rvic
es
Sale
s an
d C
usto
mer
Se
rvic
e
Mac
hine
O
pera
tives
Elem
enta
ry
Occ
upat
ions
Unweighted base 2,567 1,379 1,312 3,432 2,545 1,822 3,548 1,595 3,414 % % % % % % % % % They are new to the role 55 66 74 67 60 65 69 73 70 Their training is currently only partially completed 48 50 70 62 69 60 59 69 60
Staff lack motivation 37 32 33 24 30 38 39 38 51 They have been on training, but their performance has not improved sufficiently 28 19 28 23 26 38 36 35 41
Unable to recruit staff with the required skills 23 38 42 22 39 36 24 43 30 Problems retaining staff 21 23 29 16 22 29 24 33 46 The introduction of new working practices 31 45 31 35 23 33 27 29 23 They have not received the appropriate training 31 31 30 25 30 23 23 31 29
The introduction of new technology 31 32 29 25 25 24 25 27 18 The development of new products and services 18 28 25 21 18 15 20 27 14
Summary: New to the role / training not complete (transient factors) 71 79 85 79 83 79 80 83 77 Base: All establishments with skills gaps in each occupation – up to two occupations followed up
Percentages are based on all skills gaps, rather than all establishments with skills gaps; proportions therefore show the percentage of skills gaps attributed to each cause.

136
Table A.4.3 Actions taken to overcome difficulties finding candidates to fill hard-to-fill vacancies (unprompted), by country and size
Base: All establishments with hard-to-fill vacancies that are all as a result of skill shortages
Tota
l
Country` Size
Engl
and
Nor
ther
n Ire
land
Wal
es
2 to
4
5 to
24
25 to
49
50 to
99
100
to 2
49
250+
Unweighted base 8,928 7,876 382 670 748 3,920 1,976 1,172 820 292
Any Action 88 88 89 80 84 88 90 94 95 93
Using NEW recruitment methods or channels
37 37 29 37 34 36 38 45 46 51
Increasing advertising / recruitment spend 37 37 38 35 33 37 41 38 42 42
Redefining existing jobs 13 12 16 16 10 15 12 12 11 13 Increasing / expanding trainee programmes 9 9 11 10 7 8 11 14 12 15
Bringing in contractors to do the work, or contracting it out 9 9 11 6 9 8 10 14 12 11
Increasing the training given to your existing workforce
8 8 17 6 5 8 12 13 13 12
Being prepared to offer training to less well qualified recruits
8 8 12 9 8 7 10 9 10 13
Increasing salaries 5 5 9 4 3 5 8 10 8 10 Recruiting workers who are non-UK nationals
3 3 10 2 3 3 3 5 3 6
Making the job more attractive e.g. recruitment incentives
3 3 1 4 1 3 4 6 3 3
Nothing 11 10 10 19 14 11 8 5 4 6

137
Table A.4.4 Actions taken to overcome difficulties finding candidates to fill hard-to-fill vacancies (unprompted), by sector
Unwtd. base
Any
Actio
n
Incr
easi
ng a
dver
tisin
g /
recr
uitm
ent s
pend
Usi
ng N
EW re
crui
tmen
t m
etho
ds o
r cha
nnel
s
Red
efin
ing
exis
ting
jobs
Bein
g pr
epar
ed to
offe
r tra
inin
g to
less
wel
l qu
alifi
ed re
crui
ts
Incr
easi
ng th
e tra
inin
g gi
ven
to y
our e
xist
ing
wor
kfor
ce
Incr
easi
ng /
expa
ndin
g tra
inee
pro
gram
mes
Brin
ging
in c
ontra
ctor
s to
do
the
wor
k, o
r co
ntra
ctin
g it
out
Incr
easi
ng s
alar
ies
Rec
ruiti
ng w
orke
rs w
ho
are
non-
UK
natio
nals
Mak
ing
the
job
mor
e at
tract
ive
e.g.
recr
uitm
ent
ince
ntiv
es
Not
hing
Total 5,951 % 88 37 37 13 9 9 8 8 5 3 3 11 Sector Primary Sector & Utilities 130 % 86 33 38 16 6 13 5 6 3 1 4 14 Manufacturing 606 % 88 40 30 11 14 10 12 9 5 3 3 10 Construction 326 % 83 31 27 9 7 15 10 6 4 5 * 16 Wholesale & Retail 904 % 85 37 34 15 8 6 6 7 5 3 2 13 Hotels & Restaurants 709 % 90 33 40 18 9 5 10 7 6 4 3 9 Transport & Storage 188 % 93 33 43 10 12 13 16 18 8 5 2 7 Information & Communications 203 % 89 45 34 7 9 10 6 8 4 4 4 8
Financial Services 91 % 80 44 37 9 11 5 8 2 8 3 1 14 Business Services 1,164 % 87 39 33 10 9 9 7 8 5 3 2 11 Public Admin. 54 % 93 49 44 13 22 7 11 5 7 4 7 7 Education 424 % 94 39 46 18 8 12 9 7 7 2 4 5 Health & Social Work 850 % 93 41 49 13 9 13 10 9 8 5 4 6 Arts & Other Services 302 % 87 33 45 13 8 4 10 11 5 2 3 12 Base: All establishments with hard-to-fill vacancies that are all as a result of skill shortages

138
Table A.4.5 Recruitment methods/strategies used by employers in the last 12 months (prompted)
All establishments who have had vacancies (Module D)
2014 2016 2019
Total Total Total Have SSVs
No SSVs
Have any
skills gaps
Do not have any
skills gaps
Unweighted base 8,962 9.546 10,990 1,271 9,719 3,031 7,959 % % % % % % % Recruitment methods Word of mouth or personal recommendations 30 79 71 87 69 74 70
Adverts on own website using internal resources 21 54 48 63 47 55 46
Adverts on social media using internal resources 7 46 47 70 45 54 45
Some form of paid-for recruitment service 19 44 38 61 36 45 36
School, college or university job fairs or careers services 7 19 17 38 14 23 15
A government recruitment service or scheme 8 38 15 27 14 19 14
Paid someone to place adverts on your website or social media on your behalf
N/A 10 11 21 10 15 10
Word of mouth only 11 11 15 4 16 10 16 Any social media 7 49 51 75 48 59 48 Any external resource N/A 69 57 82 54 67 54 Any internal resource N/A 91 87 97 86 90 86 External resources only N/A 6 8 3 9 8 8 Internal resources only N/A 28 39 17 41 31 41 Single approach N/A 18 28 7 30 21 30

139
Table A.4.6 Factors that employers look for when recruiting (prompted)
All establishments (Module D)
2014 2016 2019
Total Total Total Have SSVs
No SSVs
Have any
skills gaps
Do not have any
skills gaps
Unweighted base 14,044 14,019 16,031 1,271 14,760 3,351 12,680
% % % % % % %
Factors looked for in candidates (% is proportion saying each factor is critical / significant)
Relevant work experience 66 65 63 79 62 65 62
Maths and English GCSE to at least level or A*-C 58 56 52 56 52 54 52
A relevant vocational qualification 50 49 47 58 46 49 47 Particular academic qualifications such as GCSEs, A levels or a degree 49 46 42 46 42 42 42
A degree or degree-equivalent ualifications N/A N/A 20 27 19 18 20
None important N/A N/A 17 7 18 14 18

140
Table A.4.7 Use of skills policy initiatives by employers, broken down by employers with different skills needs (MD_SD20, MD_SD21_ALL)
Base: Apprentices: all establishments in Module A; expect number of apprentices at site to increase in the next 2 years: all establishments in Module A that currently have apprentices. T-levels: all establishments in England in Module C; Traineeships: all establishments in England in Module A; National Occupational Standards: all establishments in Northern Ireland and Wales in Module D; use of National Occupational Standard: all establishments in Northern Ireland and Wales in Module D that have at least some knowledge of National Occupational Standards.
Total Have SSVs
No SSVs
Have any
skills gaps
Do not have any
skills gaps
Unweighted base 16,070 1,351 14,719 3,127 12,943
Apprenticeships
Number of apprentices currently at site 496,400 122,600 373,700 204,000 292,400
% % % % %
Currently offer apprenticeships at site 9 22 8 17 8 Currently have any staff undertaking formal apprenticeships at site 10 25 10 28 8
Plan to offer apprenticeships in the future 30 59 29 51 27 Expect number of apprentices at site to increase in the next 2 years 30 46 27 32 29
Interest in providing work placements to T-Levels students
Very Interested/Quite interested 36 64 35 54 33
Not very interested/Not at all interested 57 32 58 39 60
Traineeships Whether anyone had undertaken a traineeship in last 12 months 3 5 2 4 2
Awareness of the National Occupation Standards for the organisation's industry or sector
Have not heard of National Occupational Standards 47 37 48 43 48
Any awareness 51 62 50 55 50 Aware of National Occupation Standards and have at least some knowledge about them 30 40 29 30 30
How National Occupational Standards are used (prompted) To develop training plans to meet establishment's skills needs 13 21 13 13 14
For staff appraisals or performance management 11 16 11 12 11
To develop job descriptions or guide recruitment criteria 11 16 11 12 11
For succession planning or competency frameworks 10 14 10 9 10 National Occupational Standards are not used by this establishment 8 10 8 8 8
Used in any way 19 26 19 20 19
Not used 78 70 79 78 78

141
Chapter 5: Future skills requirements Table A.5.1 Need for upskilling by country, size and sector
Base: All establishments in Modules B and D. Need for upskilling calculated as the percentage of establishments which mentioned any cause of a need for new skills.
% of establishments with a need for upskilling
2017 2019
Unweighted base % Unweighted
base %
Total 40,373 62 32,088 64 Country England 35,490 62 26,707 64 Northern Ireland 1,945 62 2,003 63 Wales 2,938 63 3,378 68 Size 2 to 4 8,087 57 8,016 59 5 to 24 21,577 66 16,156 68 25 to 49 5,793 74 4,147 78 50 to 99 2,947 78 2,163 79 100-249 1,480 79 1,263 82 250+ 489 81 343 89 Sector Primary Sector & Utilities 2,214 57 1,135 59 Manufacturing 3,142 57 2,529 59 Construction 3,170 54 2,084 56 Wholesale & Retail 6,690 61 6,795 63 Hotels & Restaurants 3,873 53 3,130 55 Transport & Storage 1,905 58 965 56 Information & Communications 1,846 71 955 73 Financial Services 1,216 71 649 74 Business Services 6,361 67 6,097 70 Public Admin. 470 81 330 80 Education 2,594 73 2,001 73 Health & Social Work 3,659 71 3,179 73 Arts & Other Services 3,236 59 2,239 62

142
Table A.5.2 Reasons for expected need for upskilling by country and size
The development of new products
and services
The introduction of new working
practices
The introduction of new
technologies or equipment
New legislative or regulatory
requirements
Increased competitive
pressure The UK’s decision
to leave the EU
2017 2019 2017 2019 2017 2019 2017 2019 2017 2019 2017 2019
Total 35 35 35 35 39 41 38 42 24 22 13 18
Country
England 35 35 35 35 38 41 38 42 24 22 13 18
Northern Ireland 32 30 36 34 39 36 39 39 25 22 17 23
Wales 37 38 39 40 42 44 41 46 23 24 11 17
Size
2 to 4 31 30 29 29 35 37 34 38 21 19 12 15
5 to 24 39 40 39 40 40 42 41 44 26 25 13 19
25 to 49 43 47 48 51 49 53 48 52 30 30 16 23
50 to 99 46 45 50 53 55 56 52 54 32 30 17 26
100-249 48 51 54 59 57 64 55 59 33 39 21 32
250+ 54 62 60 64 65 75 59 70 39 47 27 42 Base: All establishments in Modules B and D
‘*’ denotes a figure greater than zero but smaller than 0.5.

143
Table A.5.3 Reasons for expected need for upskilling by sector (prompted)
The development of new products
and services
The introduction of new working
practices
The introduction of new
technologies or equipment
New legislative or regulatory
requirements
Increased competitive
pressure The UK’s decision
to leave the EU
2017 2019 2017 2019 2017 2019 2017 2019 2017 2019 2017 2019
Sector
Primary Sector & Utilities 22 25 29 31 38 40 37 42 18 22 16 20
Manufacturing 34 35 29 28 37 38 29 32 23 20 12 18 Construction 28 28 31 32 33 33 36 39 17 16 7 10
Wholesale & Retail 41 41 33 35 40 43 31 37 28 25 13 18
Hotels & Restaurants 33 30 34 34 29 28 32 35 24 21 15 15
Transport & Storage 29 21 32 28 35 33 35 40 23 20 14 22 Information & Communications 48 53 29 29 57 60 29 37 30 27 17 22
Financial Services 44 46 39 40 36 42 59 61 23 23 18 23
Business Services 35 35 35 35 41 44 45 49 25 26 15 21
Public Admin. 33 37 58 55 52 58 62 61 13 13 16 24
Education 36 31 49 49 42 45 56 57 25 18 12 16
Health & Social Work 35 39 49 51 40 45 53 53 23 21 12 16
Arts & Other Services 35 35 34 34 35 37 31 34 20 18 9 12 Base: All establishments in Modules B and D ‘*’ denotes a figure greater than zero but smaller than 0.

144
Table A.5.4 Technical and practical skills that will need developing among workforce by country and size (prompted)
Tota
l
Country Size
Engl
and
Nor
ther
n Ire
land
Wal
es
2 - 4
5 - 2
4
25 -
49
50 -
99
100
- 249
250+
Unweighted Base 19,901 16,507 1,247 2,147 4,347 9,994 2,929 1,530 862 239
Specialist skills or knowledge needed
% 50 50 42 51 44 53 58 61 65 66
Knowledge of products and services offered % 48 48 42 47 44 52 52 50 53 48
Adapting to new equipment or materials % 45 45 40 48 43 46 47 48 51 54
Solving complex problems % 38 38 34 37 35 40 42 43 49 42
Computer literacy / basic IT skills % 30 30 30 35 30 29 31 32 35 35 Reading and understanding instructions, etc. % 30 30 28 29 29 31 32 31 35 36
Knowledge of how your org. works % 30 30 28 31 25 34 39 36 39 37
Advanced or specialist IT skills % 29 29 28 28 31 27 29 29 35 31 Writing instructions, guidelines, manuals or reports % 23 23 23 25 22 24 27 25 31 25
More complex numerical skills % 18 18 18 19 18 18 19 20 25 25
Basic numerical skills % 16 16 17 17 16 16 15 15 17 16
Manual dexterity % 14 14 12 16 15 13 12 10 14 18 Communicating in a foreign language % 9 9 10 7 9 9 10 10 9 14 Base: All establishments in Modules B and D anticipating a need to upskill their workforce (*) Denotes a figure greater than 0 but smaller than 0.5

145
Table A.5.5 Technical and practical skills that will need developing among workforce by sector (prompted)
Base: All establishments in Modules B and D anticipating a need to upskill their workforce (*) Denotes a figure greater than 0 but smaller than 0.5
Prim
ary
Sect
or &
U
tiliti
es
Man
ufac
turin
g
Con
stru
ctio
n
Who
lesa
le &
R
etai
l
Hot
els
&
Res
taur
ants
Tran
spor
t &
Stor
age
Info
rmat
ion
&
Com
mun
icat
ions
Fina
ncia
l Ser
vice
s
Bus
ines
s Se
rvic
es
Publ
ic A
dmin
.
Educ
atio
n
Hea
lth &
Soc
ial
Wor
k
Art
s &
Oth
er
Serv
ices
Unweighted base % 657 1,486 1,176 4,061 1,715 532 671 463 4,023 236 1,379 2,157 1,345 Specialist skills or knowledge needed % 47 49 43 48 41 47 55 62 52 63 57 54 47
Knowledge of products and services offered % 40 41 40 57 50 38 51 67 45 48 35 46 49
Adapting to new equipment or materials % 57 57 53 51 47 42 38 25 36 44 39 45 48
Solving complex problems % 36 37 35 38 35 36 46 46 39 47 35 39 32 Computer literacy / basic IT skills % 41 27 27 35 30 33 22 25 28 38 30 33 27
Reading and understanding instructions, etc. % 33 27 31 33 36 32 23 32 29 31 23 30 26
Knowledge of how your org. works % 30 26 23 34 42 28 19 35 27 41 29 34 33
Advanced or specialist IT skills % 22 24 24 24 18 22 63 23 36 34 31 28 24 Writing instructions, guidelines, manuals or reports % 23 20 22 22 26 24 21 23 24 30 22 27 19
More complex numerical skills % 18 16 17 18 21 22 20 23 19 18 19 17 13 Basic numerical skills % 22 13 15 19 25 17 11 15 13 16 11 14 13 Manual dexterity % 29 24 21 18 17 15 9 1 8 11 6 7 12 Communicating in a foreign language % 5 8 7 10 16 9 9 5 8 8 13 10 10

146
Table A.5.6 People and personal skills that will need developing among workforce by country and size (prompted)
Tota
l
Country Size
Engl
and
Nor
ther
n Ire
land
Wal
es
2 - 4
5 - 2
4
25 -
49
50 -
99
100
- 249
250+
Unweighted Base 19,901 16,507 1,247 2,147 4,347 9,994 2,929 1,530 862 239
Ability to manage my own time and prioritise own tasks % 41 41 41 43 35 46 50 50 54 49
Team working % 37 37 37 38 29 43 50 51 54 56
Managing or motivating other staff % 36 36 35 37 28 42 49 50 55 52
Customer handling skills % 34 34 33 35 29 39 40 38 39 41
Managing their own feelings, or handling the feelings of others % 33 33 33 36 26 38 45 48 51 54
Instructing, teaching or training people % 31 31 29 31 25 36 43 41 46 47
Setting objectives for others and planning human, financial and other resources
% 28 28 29 28 23 30 36 38 41 46
Sales skills % 27 28 25 26 26 30 25 21 23 20
Persuading or influencing others % 27 27 26 26 24 29 34 34 44 44
Making speeches or presentations % 15 15 15 14 13 16 19 21 22 28 Base: All establishments in Modules B and D anticipating a need to upskill their workforce (*) Denotes a figure greater than 0 but smaller than 0.5

147
Table A.5.7 People and personal skills that will need developing among workforce by sector (prompted)
Prim
ary
Sect
or &
U
tiliti
es
Man
ufac
turin
g
Con
stru
ctio
n
Who
lesa
le &
R
etai
l
Hot
els
&
Res
taur
ants
Tran
spor
t &
Stor
age
Info
rmat
ion
&
Com
mun
icat
ions
Fina
ncia
l Se
rvic
es
Bus
ines
s Se
rvic
es
Publ
ic A
dmin
.
Educ
atio
n
Hea
lth &
Soc
ial
Wor
k
Art
s &
Oth
er
Serv
ices
Unweighted base % 657 1,486 1,176 4,061 1,715 532 671 463 4,023 236 1,379 2,157 1,345
Ability to manage my own time and prioritise own tasks % 41 39 36 43 48 39 40 42 39 48 45 46 42
Team working % 41 34 29 39 47 37 29 36 32 50 38 46 39 Managing or motivating other staff % 35 32 27 38 48 30 29 33 32 52 43 45 38
Customer handling skills % 24 27 28 40 48 34 32 38 33 32 21 34 36 Managing their own feelings, or handling the feelings of others
% 34 30 25 35 44 30 27 33 29 42 40 44 36
Instructing, teaching or training people % 25 29 25 33 41 26 29 29 28 39 43 38 33
Setting objectives for others and planning human, financial and other resources
% 28 22 22 27 35 21 25 29 27 39 32 32 27
Sales skills % 18 25 19 36 38 17 35 34 29 10 10 17 27 Persuading or influencing others % 26 23 21 27 35 22 27 27 28 40 27 29 28
Making speeches or presentations % 8 10 11 12 14 9 16 21 18 30 18 19 15 Base: All establishments in Modules B and D anticipating a need to upskill their workforce (*) Denotes a figure greater than 0 but smaller than 0.5

148
Table A.5.8 Digital skills that will need developing among workforce by country and size (unprompted)
Tota
l
Country Size
Engl
and
Nor
ther
n Ire
land
Wal
es
2 - 4
5 - 2
4
25 -
49
50 -
99
100
- 249
250+
Unweighted Base 9,273 7,651 590 1,032 2,084 4,494 1,377 749 455 114
Skills using new or updated company software or systems % 39 39 40 43 36 42 43 43 47 37
Basic Microsoft Office application skills % 16 15 23 19 15 16 17 19 18 22
Specialist software or hardware / internal systems % 10 11 6 7 9 12 13 16 14 13
Advanced Microsoft Office skills % 10 10 15 9 10 10 11 12 12 13
Foundation digital skills % 9 9 11 11 9 9 8 9 12 19
Graphic design / design engineering % 5 5 5 6 7 4 3 3 3 *
Web development skills % 5 5 5 7 6 4 2 2 2 5
Application programming and development skills % 5 5 7 3 5 4 5 5 5 4 Base: All establishments in Modules B and D anticipating a need to upskill their workforce (*) Denotes a figure greater than 0 but smaller than 0.5

149
Table A.5.9 Digital skills that will need developing among the workforce by sector (unprompted)
Prim
ary
Sect
or &
U
tiliti
es
Man
ufac
turin
g
Con
stru
ctio
n
Who
lesa
le &
Ret
ail
Hot
els
& R
esta
uran
ts
Tran
spor
t & S
tora
ge
Info
rmat
ion
&
Com
mun
icat
ions
Fina
ncia
l Ser
vice
s
Bus
ines
s Se
rvic
es
Publ
ic A
dmin
.
Educ
atio
n
Hea
lth &
Soc
ial W
ork
Art
s &
Oth
er S
ervi
ces
Unweighted base % 314 592 476 1,904 656 225 445 187 1,996 126 695 1,045 612
Skills using new or updated company software or systems % 30 36 35 41 30 43 41 47 42 44 41 40 37
Basic Microsoft Office application skills % 24 16 19 15 24 16 6 18 12 20 16 22 19
Specialist software or hardware / internal systems % 9 11 7 12 9 13 7 14 10 7 12 12 11
Advanced Microsoft Office skills % 5 11 14 8 10 6 9 14 10 21 11 14 10
Foundation digital skills % 16 6 9 10 11 6 3 4 7 6 12 12 14 Graphic design / design engineering % 1 12 11 3 1 * 6 1 10 * 1 2 3
Web development skills % 2 4 4 5 5 1 9 3 6 6 2 4 7 Application programming and development skills % 3 7 4 3 3 4 15 4 4 2 6 4 6 Base: All establishments in Modules B and D anticipating a need to upskill their workforce (*) Denotes a figure greater than 0 but smaller than 0.5

150
Appendix B: Definitions for skills and causes of skills gaps groupings Table B.1 Grouped technical and practical skills
Table B.2 Grouped people and personal skills
Table B.3 Grouped digital skills
Complex analytical skills Operational skills Digital skills Basic skills
Solving complex problems requiring a solution specific to the situation
Knowledge of products and services offered by your organisation and organisations like yours
Computer literacy / basic IT skills
Computer literacy / basic IT skills
More complex numerical or statistical skills and understanding
Knowledge of how your organisation works
Advanced or specialist IT skills
Reading and understanding instructions, guidelines, manuals or reports
Management and leadership skills Sales and customer skills Self-management skills
Persuading or influencing others Sales skills Ability to manage own time and prioritise own tasks
Managing or motivating staff Customer handling skills Managing their own feelings, or handling the feelings of others
Setting objectives for others and planning human, financial and other resources
Design, animation and graphics skills Basic internet skills Basic digital skills
Animation skills Communicating via email
Foundation digital skills – such as turning on devices typing changing passwords connecting to the internet
Multimedia production skills Completing transactions online Basic Microsoft Office applications skills (Word Excel PowerPoint Outlook etc.)
Graphic design / design engineering skills (incl. Computer Aided Design [CAD] skills)
Using the internet to find solutions to problems
Being safe and legal online – e.g. understanding online risks and threats

151
Table B.4 Grouped causes of skills gaps
Transient factors Positive transformational factors
They are new to the role The introduction of new working practices
Their training is currently only partially completed The introduction of new technology

152
Appendix C: Industry coding Each establishment was allocated to one of 13 sectors, based on their Standard Industrial Classification (SIC). SIC 2007 was used to classify establishments using the following method. Using the four-digit Standard Industrial Classification (SIC) supplied for each record from the Market Location or IDBR database, a description of business activity was read out to each respondent. If they agreed that this description matched the main activity undertaken at the establishment, then the SIC on Market Location’s database or IDBR was assumed to be correct. If, however, the respondent felt the description did not correspond to their main business activity at the site (around a fifth of cases), a verbatim response was collected to find out what they do. At the analysis stage this was coded to a four-digit SIC which was then used as the basis for allocation into sector.
The table below shows the 13 sectors and their corresponding SIC 2007 definitions.27
Sector SIC 2007
Primary Sector and Utilities
A - Agriculture, forestry and fishing (01-03) Including farming, hunting and other related service activities, forestry and logging, fishing and aquaculture B - Mining and quarrying (05-09) Including mining of coal, metals, sand/stone/clay, and extraction of crude petroleum and natural gas D - Electricity, gas, steam and air conditioning supply (35) E - Water supply, sewerage, waste management and remediation activities (36-39) Including electric power generation, transmission and distribution, manufacture of gas and distribution of gaseous fuels, steam and air conditioning supply, water collection, treatment and supply, sewerage and waste collection
Manufacturing
C - Manufacturing (10-33) Including manufacture of food and beverage, textiles, chemicals and chemical products, basic pharmaceutical products, other mineral products, manufacture of metals and metal products, machinery, computer and electronic products and equipment, motor vehicles and other transport equipment, furniture, and repair and installation of machinery and equipment
27 UK Standard Industrial Classification of Economic Activities 2007 (SIC 2007), Source: Companies House, Standard industrial classification of economic activities (SIC) (2008)

153
Construction F - Construction (41-43) Including the construction of buildings, civil engineering (constructing roads, railways and other utility projects), demolition, and specialised activities such as electrical installation, roofing and scaffold erection
Wholesale and Retail
G - Wholesale and retail trade; repair of motor vehicles and motor cycles (45-47) Including sale, maintenance and repair of motor vehicles, parts and accessories, non-vehicle wholesale (for example agriculture, food, household goods), and the retail trade of all products whether in stores, stalls, markets, mail order or online
Hotels and Restaurants
I - Accommodation and food service activities (55-56) Including hotels, campsites, youth hostels, holiday centres, villages and other short stay accommodation, restaurants and takeaways, event catering and licensed clubs, pubs and bars
Transport and Storage
H - Transport and storage (49-53) Including land, water and air transport (passenger and freight), warehousing and support activities for transportation, postal and courier activities,
Information and Communications
J - Information and communication (58-63) Including publishing (books, journals, newspapers etc. and software/computer games), television, film and music production, broadcasting, telecommunications, computer programming and consultancy, information service activities (e.g. data processing and hosting)
Financial Services
K - Financial and insurance activities (64-66) Including banks and building societies, activities of holding companies, trusts, funds and similar financial entities, credit granting, pensions, insurance and reinsurance
Business services
L - Real estate activities (68) M - Professional, scientific and technical activities (69-75) N - Administrative and support service activities (77-82) Including the buying, selling and renting of real estate, legal activities, accounting, bookkeeping and auditing, management consultancy, architectural and engineering activities, scientific research and development, advertising and market research, specialist design, photographic activities, translation and interpretation, veterinary activities, renting and leasing of tangible goods (motors, household, machinery), employment agencies, travel agencies and tour operations, security and investigation activities, office administration and business support
Public Administration
O - Public administration and defence; compulsory social security (84) Including administration of the State and economic and social policy of the com-munity, provision of services to the community such as defence activities, foreign affairs, justice and judicial activities, fire service and compulsory social security activities

154
Education P - Education (85) Including pre-primary, primary, secondary and higher education, other education (such as sports, driving schools, cultural education), educational support activities
Health and Social Work
Q - Human health and social work activities (86-88) Including Hospitals, medical and dental practices, residential care, social work activities
Arts, entertainment, recreation and other service activities
R - Arts, entertainment and recreation (90-93) S - Other service activities (94-96) Including performing arts, libraries and museums, gambling and betting, sports facilities, amusement and recreation activities, activities of membership organisations (religious, political, trade union, professional), personal services (hairdressing, beauty, textile cleaning, well-being activities, funeral activities)
NOT COVERED IN SURVEY
T - Activities of households as employers; undifferentiated goods and services producing activities of households for own use (97-98) U - Activities of extraterritorial organisations and bodies (99) Including households as employers of domestic personnel, private households producing goods for own use

155
Appendix D: Occupational Coding The occupational data collected in the survey were collected both pre-coded and verbatim. The former included the occupational breakdown of employment (question SD5A to SD8) where respondents were asked how many of their workforce fell into each of the nine major (one-digit) Standard Occupation Classification (SOC) 2010 categories (Managers, Directors and Senior Officials through to Elementary occupations). However, on vacancy measures (for example the occupations in which vacancies exist – question SC7) this information was collected verbatim. This was then coded at the analysis stage, where possible to a four-digit level SOC, if not three, two- or one-digit level.
Examples of what might fall into each occupational band are as follows:
Occupational group
Primary sectors (Primary Sector &
Utilities, Manufacturing, Construction
Service sectors (Retail, Business, Finance,
Transport, etc.)
Public sector (Public Admin, Health, Education, etc.)
Managers, Directors and Senior Officials
Site managers, Department Heads, Shift
Managers (not supervisors)
Directors, Managers / Branch/site managers,
shift managers (not supervisors
Police inspectors and above, department
heads, Head teachers, Senior Officials
Professionals
Professional engineers, software and IT professionals,
accountants, chemists, scientific researchers
Solicitors, lawyers, accountants, IT professionals,
economists, architects, actuaries
Doctors, nurses, midwives, teachers,
social workers, librarians
Associate Professionals
Science and engineering technicians, lab technicians, IT
technicians, accounting technicians
Insurance underwriters, finance/investment
analysts and advisers, writers/journalists,
buyers, estate agents
Junior police/fire/prison officers, therapists,
paramedics, community workers, H&S officers,
housing officers
Administrative staff
Secretaries, receptionists, PAs,
telephonists, bookkeepers
Secretaries, receptionists, PAs,
communication operators, market
research interviewers, clerks
Secretaries, receptionists, PAs, local government officers and
assistants, office assistants, library and database assistants
Skilled Trades
Farmers, electricians, machine setters / tool makers, carpenters,
plasterers
Motor mechanics, printers, TV engineers,
butchers Chefs
Caring, Leisure and Other Service Occupations
Care assistants, nursery nurses
Travel agents, travel assistants, hairdressers,
housekeepers
Care assistants, home carers, nursery nurses, ambulance staff, pest control, dental nurses,
caretakers
Sales and customer service occupations
Customer facing roles: sales staff and call centre
agents
Sales assistants and retail cashiers, telesales,
call centre agents
Customer care operations
Process, plant and machine operatives
Routine operatives, drivers, machine
HGV, van, fork-lift, bus and taxi drivers
Drivers, vehicle inspectors

156
operators, sorters and assemblers
Elementary occupations
Labourers, packers, goods handling and
storage staff
Bar staff, shelf fillers, catering assistants, waiters/waitresses,
cleaners
Labourers, cleaners, road sweepers, traffic
wardens, security guards
157
Appendix E: Sampling error and statistical confidence Sampling errors for the survey results overall and for key sub-groups are presented in Table E.1. Figures have been based on a survey result of 50% (the ‘worst’ case in terms of statistical reliability) and have used a 95% confidence level. Where the table indicates that a survey result based on all respondents has a sampling error of ±0.34%, this should be interpreted as follows: ‘for a question asked of all respondents where the survey result is 50%, we are 95% confident that the true figure lies within the range 49.66% to 50.34%’. Significance testing on employer measures use the unweighted respondent base, while employment measures, and density measures such as the proportion of the workforce with skills gaps and skills-shortage vacancy density, have been calculated on the basis of the unweighted employment (or vacancy) base.
As a note, the calculation of sampling error has taken into account the finite population correction factor to account for cases where we are measuring a significant portion of the population universe (i.e. even if two sample sizes are the same, the sampling error will be lower if in one case a far higher proportion of the population was covered).
These confidence intervals are based on the assumptions of probability random sampling and a normal distribution of responses.

158
Table E.1 Sampling error (at the 95% confidence level) associated with findings of 50%
Population Number of interviews
(Maximum) Sampling Error
Overall 1,831,000 81,013 ± 0.34
By country
England 1,683,000 70,217 ± 0.36
Northern Ireland 59,000 4,023 ± 1.49
Wales 89,000 6,773 ± 1.14
By size
2 to 4 998,000 20,183 ± 0.68
5 to 9 381,000 20,012 ± 0.67
10 to 24 267,000 20,599 ± 0.66
25 to 49 98,000 10,795 ± 0.89
50 to 99 50,000 5,377 ± 1.26
100 to 249 27,000 3,122 ± 1.65
250+ 11,000 925 ± 3.09
By sector
Primary Sector & Utilities 99,000 2,952 ± 1.78
Manufacturing 94,000 6,234 ± 1.20
Construction 179,000 5,249 ± 1.33
Wholesale and Retail 348,000 17,503 ± 0.72
Hotels and Restaurants 172,000 7,594 ± 1.10
Transport and Storage 62,000 2,330 ± 1.99
Information and Communications
91,000 2,511 ± 1.93
Financial Services 37,000 1,577 ± 2.41
Business Services 426,000 15,490 ± 0.77
Public Administration 15,000 840 ± 3.29
Education 55,000 5,012 ± 1.32
Health and Social Work 120,000 8,092 ± 1.05
Arts and Other Services 134,000 5,629 ± 1.28
Source for population data is the ONS Inter-Departmental Register (IDBR). Populations have been rounded to the nearest 1,000.

159
Appendix F: Survey population estimates (weighted)
Base: All establishments
Total England Northern Ireland Wales
Overall number of establishments 1,830,802 1,683,072 58,663 89,067 With a vacancy 309,543 287,541 8,274 13,279 With a hard-to-fill vacancy 137,437 127,197 3,839 6,400 With a skill-shortage vacancy 100,012 92,754 2,482 4,775 With at least one skills gap 241,392 224,344 5,757 11,292 With at least one employee with more qualifications and skills than job role requires
775,395 711,881 25,055 38,459

160
Appendix G: References Companies House, Standard industrial classification of economic activities (SIC) (2008)
Department for Education, Technical Education Reform: the case for change (2016)
Hogarth, Terrence and Wilson, Rob, Skills Matter: a synthesis of research on the extent, causes and implications of skill deficiencies (2001)
NHS Improvement, Quarterly performance of the NHS provider sector: quarter 4 2018/19 (2019)
Office for National Statistics, International comparisons of productivity: 2016 (2018)
Office for National Statistics, Labour market overview: June 2019 (2019)
Office for National Statistics, UK labour market February 2020 (2020)
Office for National Statistics, Migration statistics quarterly report: February 2020 (2020)
Office for National Statistics, Labour productivity, UK: April to June 2019 (2019)
Office for National Statistics, Quarterly national accounts time series dataset (2020)

161
© Department for Education 2020
Reference: DFERPPU 2018061/2
ISBN: 978-1-83870-204-5
For any enquiries regarding this publication, contact us at: www.education.gov.uk/contactus
This document is available for download at www.gov.uk/government/publications