Embed Size (px)
DESCRIPTION
Employer Satisfaction Survey 2011/12 National Results March 2014. Contents. 01 Introduction.................................2 02 Employer profile..........................4 03 Overall rating.............................12 04 Detailed analysis.......................18. Introduction. 01. - PowerPoint PPT Presentation
Citation preview
Employer Satisfaction Survey 2011/12 National ResultsMarch 2014
1
Contents01 Introduction.................................202 Employer profile..........................403 Overall rating.............................1204 Detailed analysis.......................18

Introduction
01 2
Introduction Over 265,000 employers received training funded by the Skills Funding Agency
in 2010/11. The training was delivered by 743 providers which included
General Further Education (FE) Colleges, private sector providers, other
public-funded organisations and Special Colleges.
Over 59,000 (22%) of employers took part in the Employer Satisfaction Survey
2011/12 and gave their views on the training their employees received. These
employers are representative of the 265,000 employers who received training
in terms of workplace size and industry sector. Therefore, the data presented
in this report is unweighted.
The survey took place between March and June 2012: 57% of employers
completed the online survey, 29% used paper questionnaires and 14% by
telephone. This report summarises key findings from the survey and, where
relevant, comments on subgroup differences that are statistically significant.
3

Employer profile
02 4
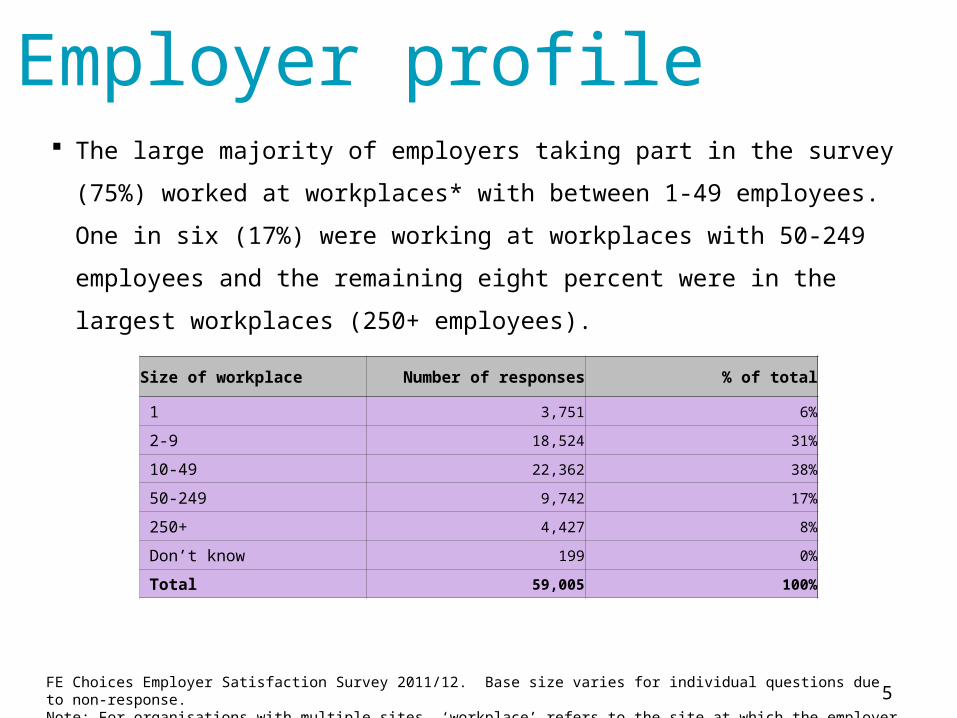
Employer profile The large majority of employers taking part in the survey (75%) worked at
workplaces* with between 1-49 employees. One in six (17%) were working at
workplaces with 50-249 employees and the remaining eight percent were in
the largest workplaces (250+ employees).
5
Size of workplace Number of responses % of total
1 3,751 6%
2-9 18,524 31%
10-49 22,362 38%
50-249 9,742 17%
250+ 4,427 8%
Don’t know 199 0%
Total 59,005 100%
FE Choices Employer Satisfaction Survey 2011/12. Base size varies for individual questions due to non-response.Note: For organisations with multiple sites, ‘workplace’ refers to the site at which the employer is based.
FE Choices Employer Satisfaction Survey 2011/12. Base size varies for individual questions due to non-response.
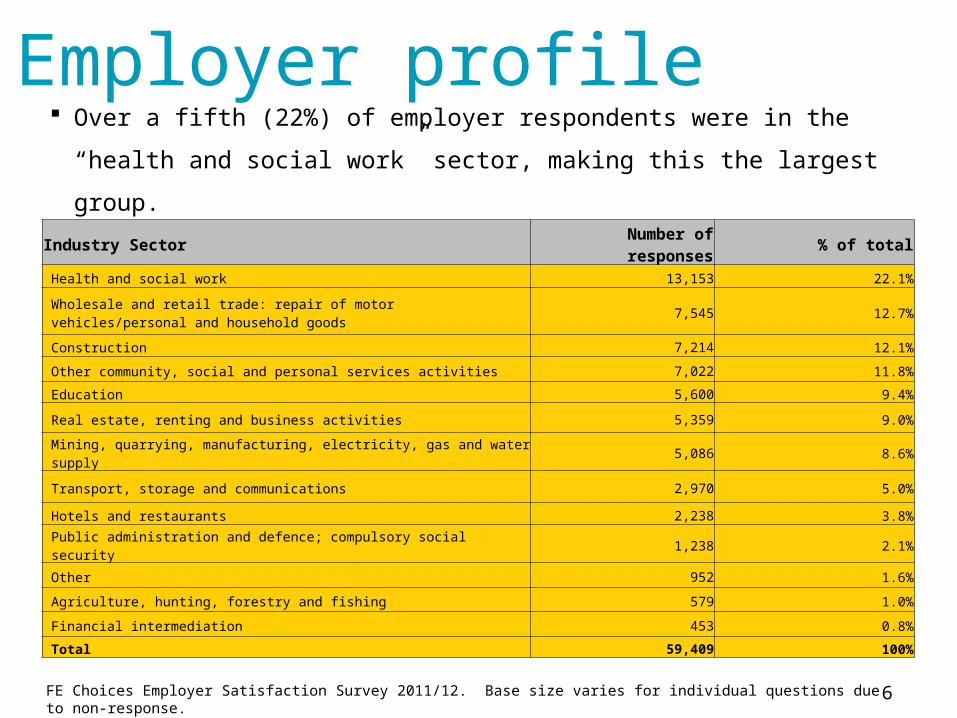
Employer profile Over a fifth (22%) of employer respondents were in the “health and social
work” sector, making this the largest group.
6
Industry Sector Number of responses % of total
Health and social work 13,153 22.1%
Wholesale and retail trade: repair of motor vehicles/personal and household goods
7,545 12.7%
Construction 7,214 12.1%
Other community, social and personal services activities 7,022 11.8%
Education 5,600 9.4%
Real estate, renting and business activities 5,359 9.0%
Mining, quarrying, manufacturing, electricity, gas and water supply 5,086 8.6%
Transport, storage and communications 2,970 5.0%
Hotels and restaurants 2,238 3.8%
Public administration and defence; compulsory social security 1,238 2.1%
Other 952 1.6%
Agriculture, hunting, forestry and fishing 579 1.0%
Financial intermediation 453 0.8%
Total 59,409 100%
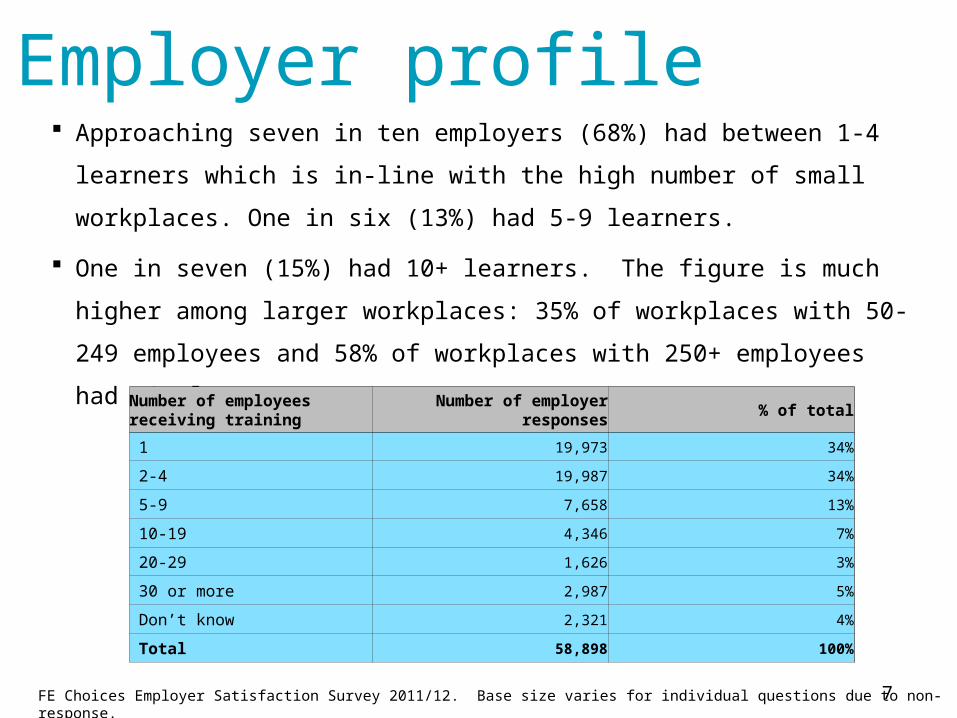
Employer profile Approaching seven in ten employers (68%) had between 1-4 learners which is
in-line with the high number of small workplaces. One in six (13%) had 5-9
learners.
One in seven (15%) had 10+ learners. The figure is much higher among larger
workplaces: 35% of workplaces with 50-249 employees and 58% of
workplaces with 250+ employees had 10+ learners.
7
Number of employees receiving training
Number of employer responses
% of total
1 19,973 34%
2-4 19,987 34%
5-9 7,658 13%
10-19 4,346 7%
20-29 1,626 3%
30 or more 2,987 5%
Don’t know 2,321 4%
Total 58,898 100%
FE Choices Employer Satisfaction Survey 2011/12. Base size varies for individual questions due to non-response.
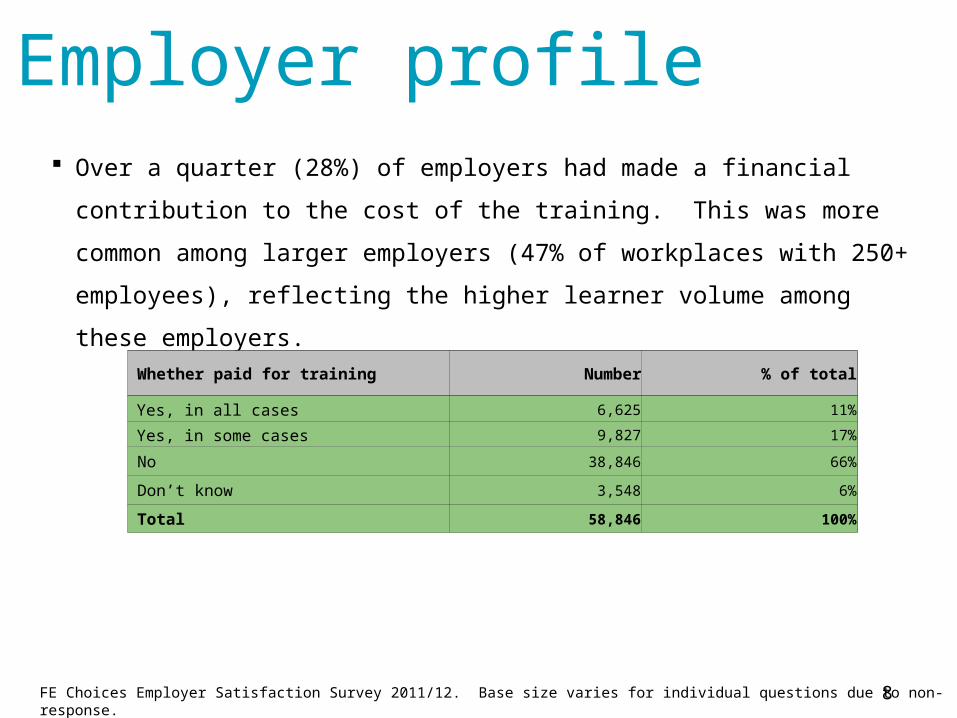
Employer profile Over a quarter (28%) of employers had made a financial contribution to the
cost of the training. This was more common among larger employers (47% of
workplaces with 250+ employees), reflecting the higher learner volume among
these employers.
8
Whether paid for training Number % of total
Yes, in all cases 6,625 11%
Yes, in some cases 9,827 17%
No 38,846 66%
Don’t know 3,548 6%
Total 58,846 100%
FE Choices Employer Satisfaction Survey 2011/12. Base size varies for individual questions due to non-response.
Employer profile
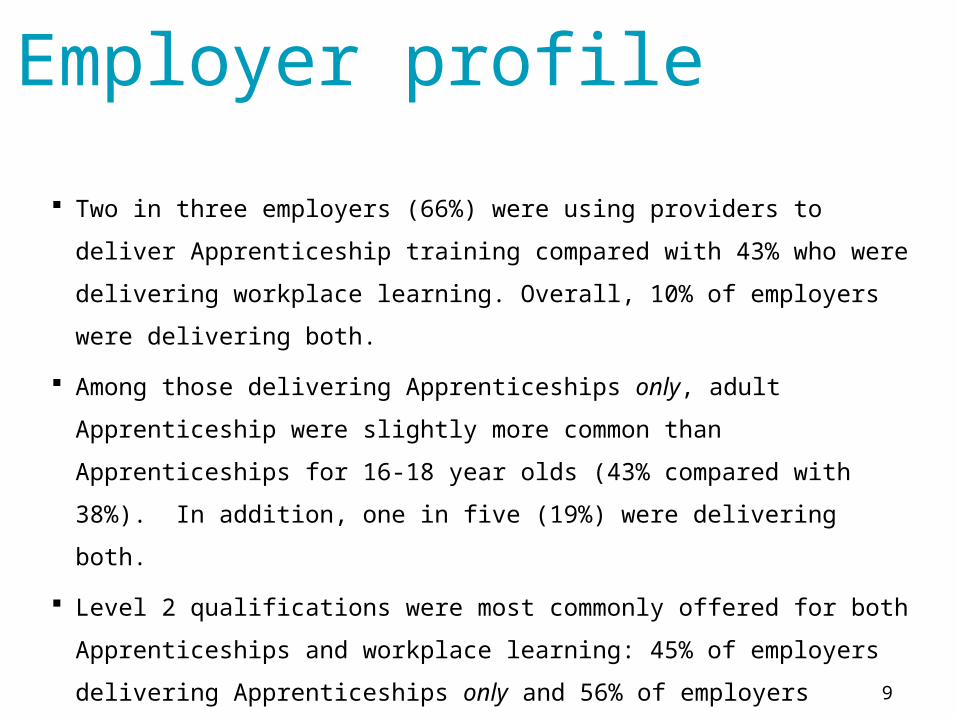
Two in three employers (66%) were using providers to deliver Apprenticeship
training compared with 43% who were delivering workplace learning. Overall,
10% of employers were delivering both.
Among those delivering Apprenticeships only, adult Apprenticeship were
slightly more common than Apprenticeships for 16-18 year olds (43%
compared with 38%). In addition, one in five (19%) were delivering both.
Level 2 qualifications were most commonly offered for both Apprenticeships
and workplace learning: 45% of employers delivering Apprenticeships only and
56% of employers delivering workplace learning only were delivering Level 2
only. The equivalent figures for Level 3 are 32% and 23% respectively.
9
Employer profile
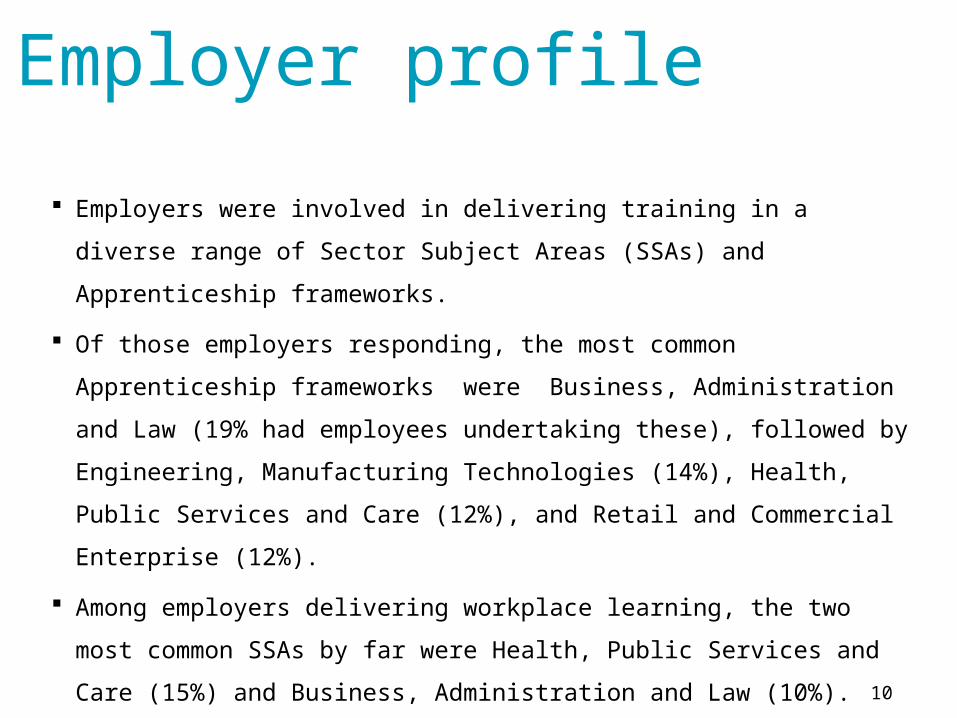
Employers were involved in delivering training in a diverse range of Sector
Subject Areas (SSAs) and Apprenticeship frameworks.
Of those employers responding, the most common Apprenticeship
frameworks were Business, Administration and Law (19% had employees
undertaking these), followed by Engineering, Manufacturing Technologies
(14%), Health, Public Services and Care (12%), and Retail and Commercial
Enterprise (12%).
Among employers delivering workplace learning, the two most common SSAs
by far were Health, Public Services and Care (15%) and Business,
Administration and Law (10%).
10
Employer profile
11
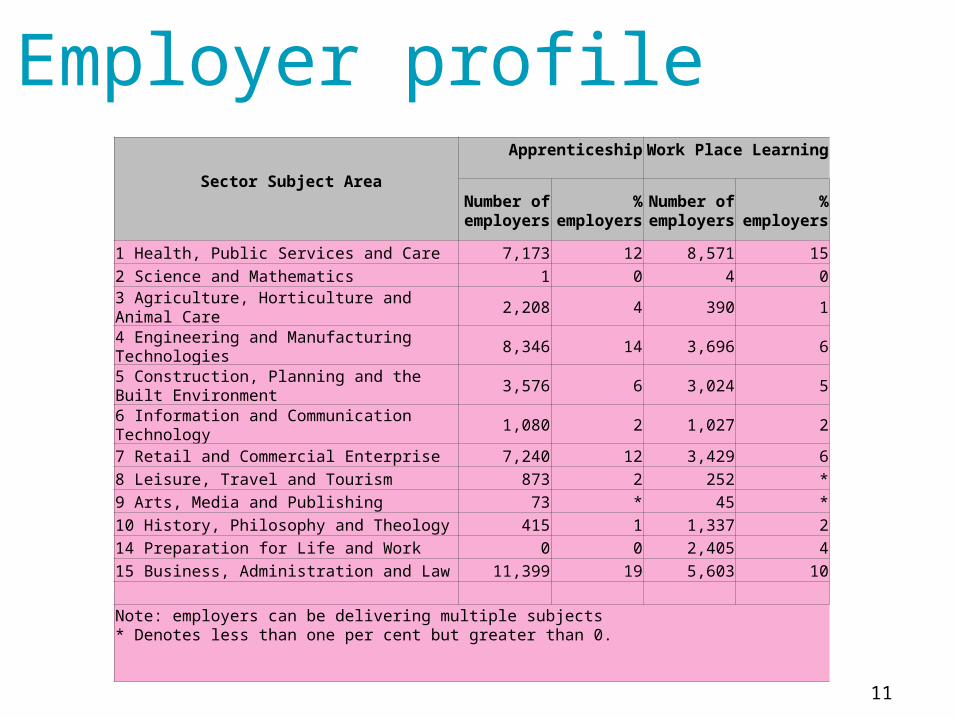
Sector Subject Area
Apprenticeship
Work Place Learning
Number of employers
% employers
Number of employers
% employers
1 Health, Public Services and Care 7,173 12 8,571 15
2 Science and Mathematics 1 0 4 0
3 Agriculture, Horticulture and Animal Care 2,208 4 390 1
4 Engineering and Manufacturing Technologies 8,346 14 3,696 65 Construction, Planning and the Built Environment
3,576 6 3,024 5
6 Information and Communication Technology 1,080 2 1,027 2
7 Retail and Commercial Enterprise 7,240 12 3,429 6
8 Leisure, Travel and Tourism 873 2 252 *
9 Arts, Media and Publishing 73 * 45 *
10 History, Philosophy and Theology 415 1 1,337 2
14 Preparation for Life and Work 0 0 2,405 4
15 Business, Administration and Law 11,399 19 5,603 10
Note: employers can be delivering multiple subjects* Denotes less than one per cent but greater than 0.

Overall rating
03 12
Overall rating
Employers were generally very positive about the training received by their
employees. Private sector providers consistently received the most positive
ratings. Ratings were generally lower for FE and Special Colleges.
Partly linked to this, providers with high employer volume (which tended to be
FE Colleges) received lower ratings than those with fewer employer
customers. The exception is Special Colleges which typically had fewer
employer customers yet still received relatively lower ratings. The explanation
lies in the types of employers that use Special Colleges which is explored in
slide 19.
13
Overall rating
Seven in ten employers gave a rating of between 8-10 (out of 10) for the
quality of training/assessment and benefits of the training to their
organisation (Q4 and Q5, slide 15)
The majority would be advocates of the training provider – 74% gave a score
of between 8-10 for likelihood to recommend their training provider (Q6).
Around one in ten gave overall ratings of between 0-5 across all three
measures.
14
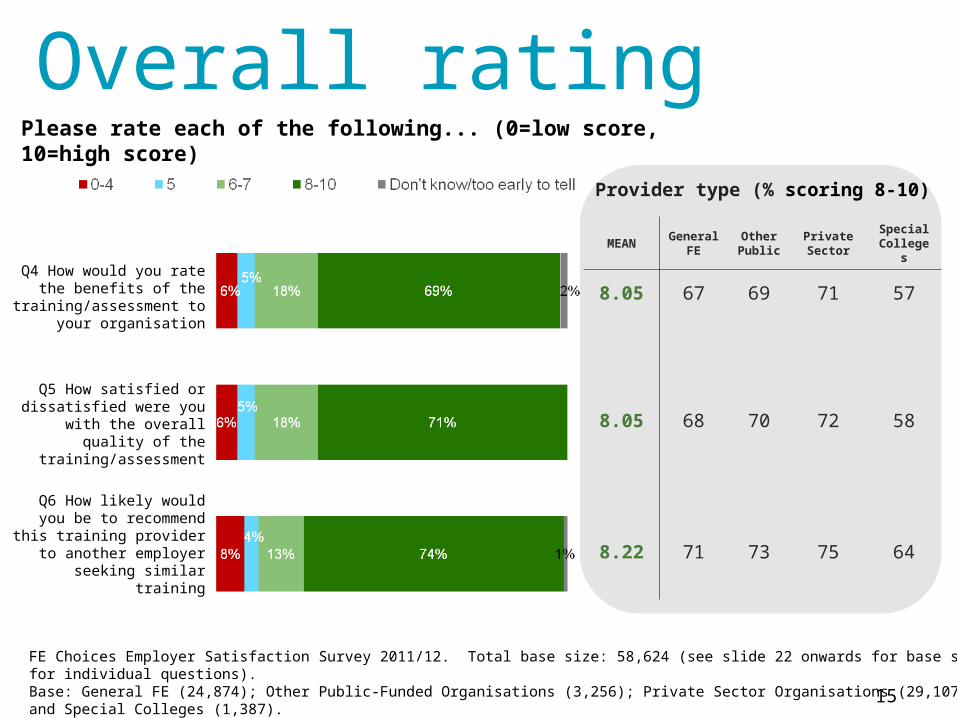
Provider type (% scoring 8-10)
MEANGeneral
FEOther Public
Private Sector
Special Colleges
8.05 67 69 71 57
8.05 68 70 72 58
8.22 71 73 75 64
Please rate each of the following... (0=low score, 10=high score)
Overall rating
Q4 How would you rate the benefits of the
training/assessment to your organisation
Q5 How satisfied or dissatisfied were you with the
overall quality of the training/assessment
Q6 How likely would you be to recommend this training
provider to another employer seeking similar training
FE Choices Employer Satisfaction Survey 2011/12. Total base size: 58,624 (see slide 22 onwards for base size for individual questions).Base: General FE (24,874); Other Public-Funded Organisations (3,256); Private Sector Organisations (29,107); and Special Colleges (1,387).
15
Key aspects
Employers were equally positive in their ratings on key aspects the training –
around seven in ten gave a rating of between 8-10 for each key aspect.
Employers were especially positive about the professionalism of staff delivering
the training (76% gave a rating of between 8-10).
Only a small minority gave a rating of 0-4 on the different key aspects. The
two areas that stood out were communications and overall efficiency in the
way providers deal with employers (9% and 8% respectively gave a rating of
between 0-4 for these two aspects compared with 5-6% for all other key
aspects).
16
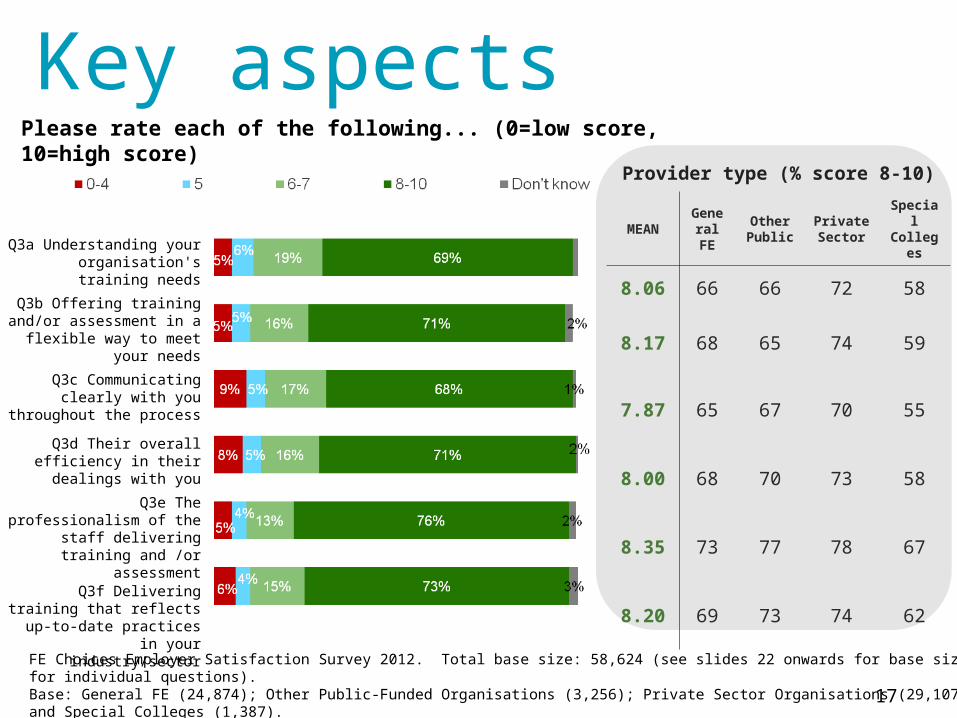
Provider type (% score 8-10)
MEANGeneral FE
Other Public
Private Sector
Special College
s
8.06 66 66 72 58
8.17 68 65 74 59
7.87 65 67 70 55
8.00 68 70 73 58
8.35 73 77 78 67
8.20 69 73 74 62
Key aspects
Q3a Understanding your organisation's training needs
Q3b Offering training and/or assessment in a flexible way
to meet your needs
Q3c Communicating clearly with you throughout the
process
Q3d Their overall efficiency in their dealings with you
Q3e The professionalism of the staff delivering training
and /or assessment
Q3f Delivering training that reflects up-to-date practices
in your industry/sector
Please rate each of the following... (0=low score, 10=high score)
FE Choices Employer Satisfaction Survey 2012. Total base size: 58,624 (see slides 22 onwards for base size for individual questions).Base: General FE (24,874); Other Public-Funded Organisations (3,256); Private Sector Organisations (29,107); and Special Colleges (1,387).
17
Detailed analysis
04 18
Detailed analysis Although the majority of employers were positive, there was some variation of
views by employee size and industry sector. For example, workplaces with 2-9
employees were generally less positive than average, as were those in the
Agriculture, Hunting, Forestry & Fishing, and Education sector (slides 23, 27
and 31).
Linked to this, employers offering subjects relating to Agriculture, Horticulture &
Animal Care, and Education & Training were consistently least positive in their
assessment of the training (slides 24, 28,32, 35-40).
These findings explain the lower ratings for Special Colleges which have a
relatively high volume of employers in the Agriculture, Hunting, Forestry &
Fishing sector. General FE and Special Colleges also have slightly higher than
average volume of employers with 2-9 employees.
19
Detailed analysis Overall employers using providers to deliver workplace learning were
consistently more positive than those delivering Apprenticeships (slides 24, 28,
32, 35-40).
Employers delivering Apprenticeships to 16-18 year olds only were least
positive about the training. By contrast, those with both young and adult
apprentices were significantly more positive, possibly reflecting their greater
experience in delivering the Programme*.
The most positive views were expressed by those with learners doing
workplace training in Engineering & Manufacturing Technologies;
Construction, Planning & Built Environment; Retail & Commercial Enterprise;
and Leisure, Travel & Tourism.
20*Apprenticeships Evaluation: Employer , BIS Research Paper No. 123, August 2013
Detailed analysis Employers offering Apprenticeships were less positive across all qualification
levels though response is slightly more marked at Level 2 which is consistent
with the lower ratings given by employers with young apprentices. The trend
for Level 4 is based on very small base sizes and is not statistically significant
(slides 24, 28, 32, 35-40).
Among those offering workplace learning, ratings were slightly lower for Level
3 qualifications compared with Levels 1,2 or 4.
These differences are slight and should not detract from the findings that the
majority of employers are positive about their experience and willing to act as
advocates for their provider.
There is some variation in employer views according to the LEP area in which
they are based. However, the findings do not show any clear pattern (slides
25-26, 29-30, 33-34).21
Detailed analysis continued- results by question
04 22
Mean score
8.05
% score 8-10
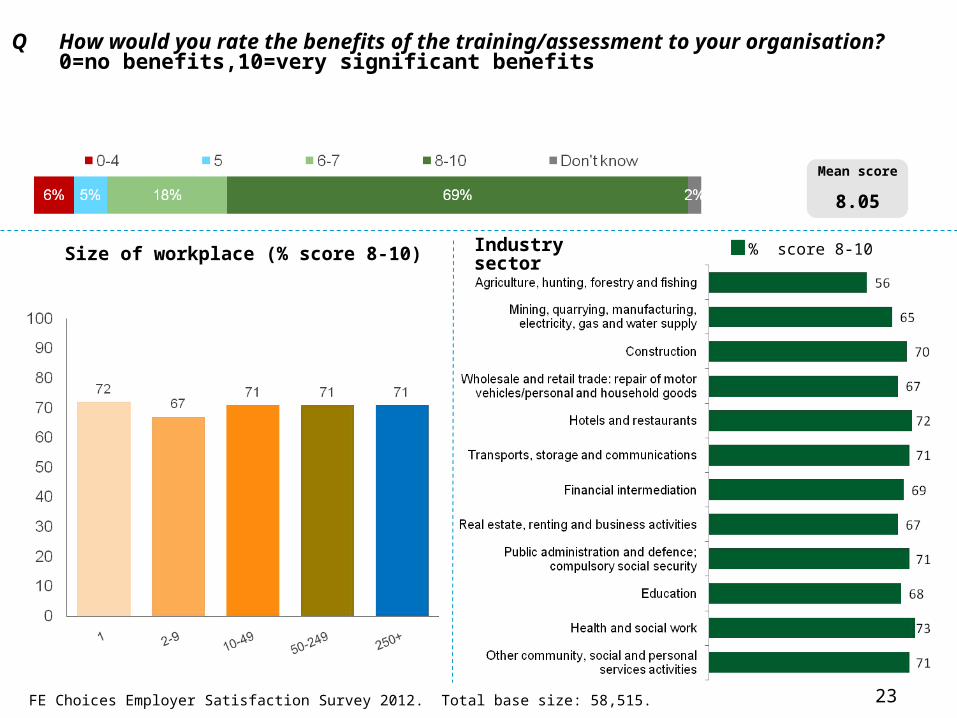
Q How would you rate the benefits of the training/assessment to your organisation? 0=no benefits,10=very significant benefits
FE Choices Employer Satisfaction Survey 2012. Total base size: 58,515.
Industry sectorSize of workplace (% score 8-10)
23
Mean score
8.05
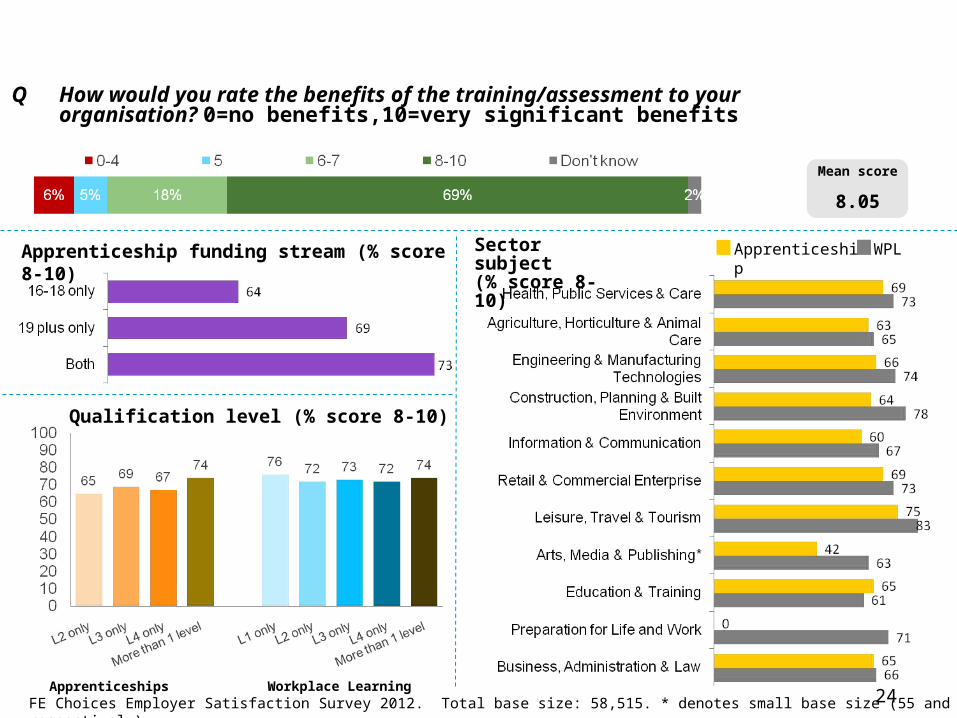
Q How would you rate the benefits of the training/assessment to your organisation? 0=no benefits,10=very significant benefits
Apprenticeships Workplace Learning
Apprenticeship funding stream (% score 8-10)
FE Choices Employer Satisfaction Survey 2012. Total base size: 58,515. * denotes small base size (55 and 41 respectively)
Sector subject (% score 8-10)
Apprenticeship WPL
Qualification level (% score 8-10)
24
FE Choices Employer Satisfaction Survey 2012. Total base size: 58,515. 25
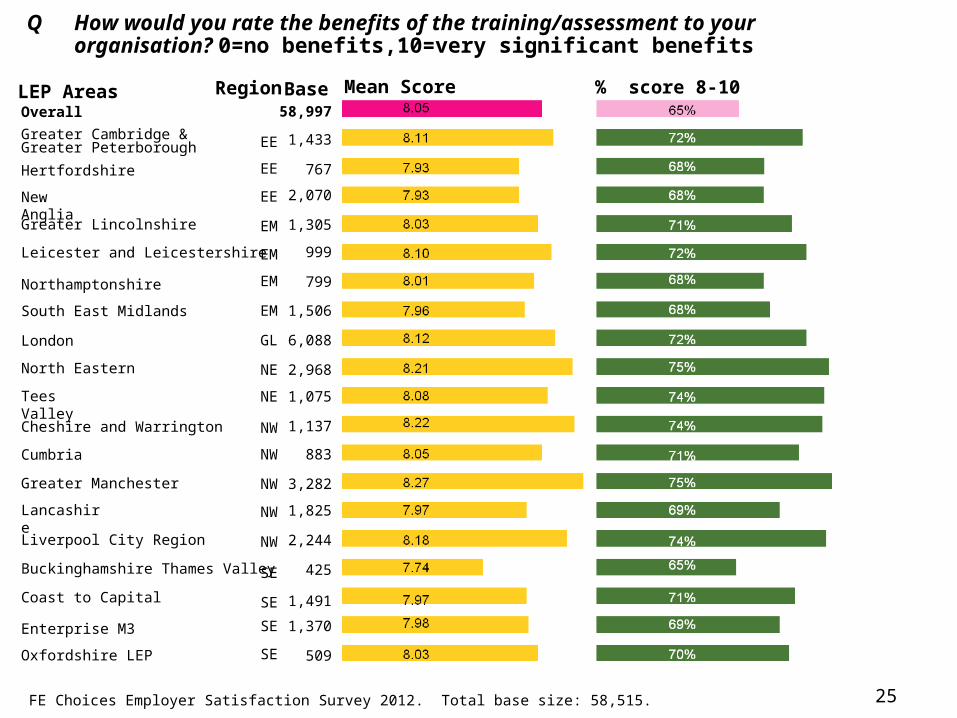
Mean ScoreBaseOverall
Greater Cambridge & Greater Peterborough
Hertfordshire
New Anglia
Greater Lincolnshire
Leicester and Leicestershire
Northamptonshire
South East Midlands
London
North Eastern
Tees Valley
Cheshire and Warrington
Cumbria
Greater Manchester
Lancashire
Liverpool City Region
Buckinghamshire Thames Valley
Coast to Capital
Enterprise M3
Oxfordshire LEP
% score 8-1058,997
1,433
767
2,070
1,305
999
799
1,506
6,088
2,968
1,075
1,137
883
3,282
1,825
2,244
425
1,491
1,370
509
EE
EE
EE
EM
EM
EM
EM
GL
NE
NE
NW
NW
NW
NW
NW
SE
SE
SE
SE
LEP Areas
Q How would you rate the benefits of the training/assessment to your organisation? 0=no benefits,10=very significant benefits
Region
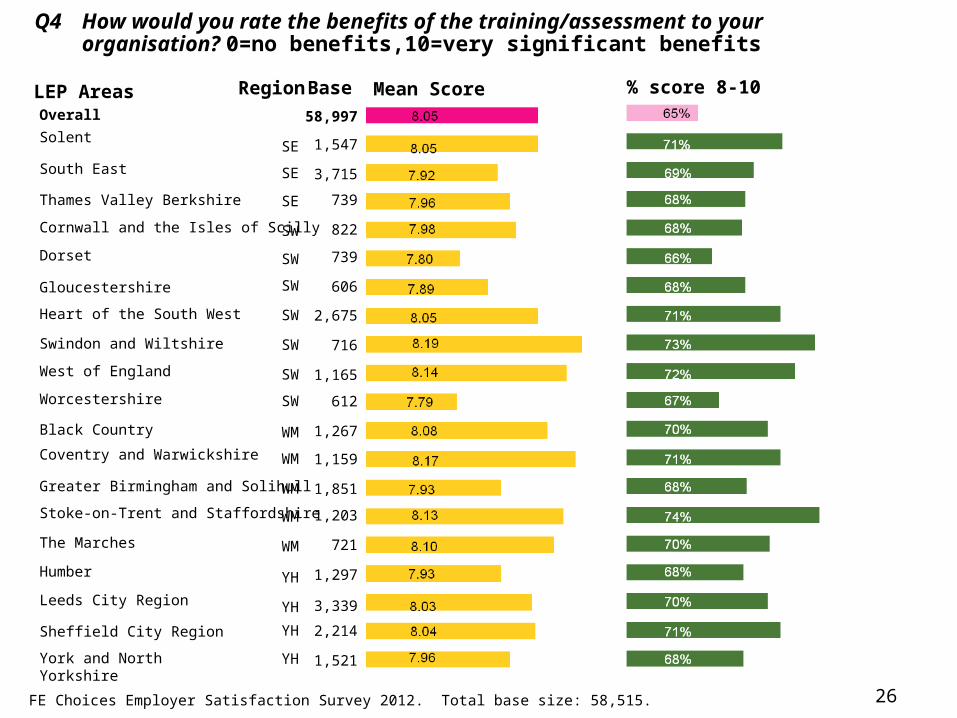
FE Choices Employer Satisfaction Survey 2012. Total base size: 58,515. 26
Mean Score % score 8-10
Overall
Solent
South East
Thames Valley Berkshire
Cornwall and the Isles of Scilly
Dorset
Gloucestershire
Heart of the South West
Swindon and Wiltshire
West of England
Worcestershire
Black Country
Coventry and Warwickshire
Greater Birmingham and Solihull
Stoke-on-Trent and Staffordshire
The Marches
Humber
Leeds City Region
Sheffield City Region
York and North Yorkshire
Base
58,997
1,547
3,715
739
822
739
606
2,675
716
1,165
612
1,267
1,159
1,851
1,203
721
1,297
3,339
2,214
1,521
SE
SE
SE
SW
SW
SW
SW
SW
SW
SW
WM
WM
WM
WM
WM
YH
YH
YH
YH
LEP Areas
Q4 How would you rate the benefits of the training/assessment to your organisation? 0=no benefits,10=very significant benefits
Region
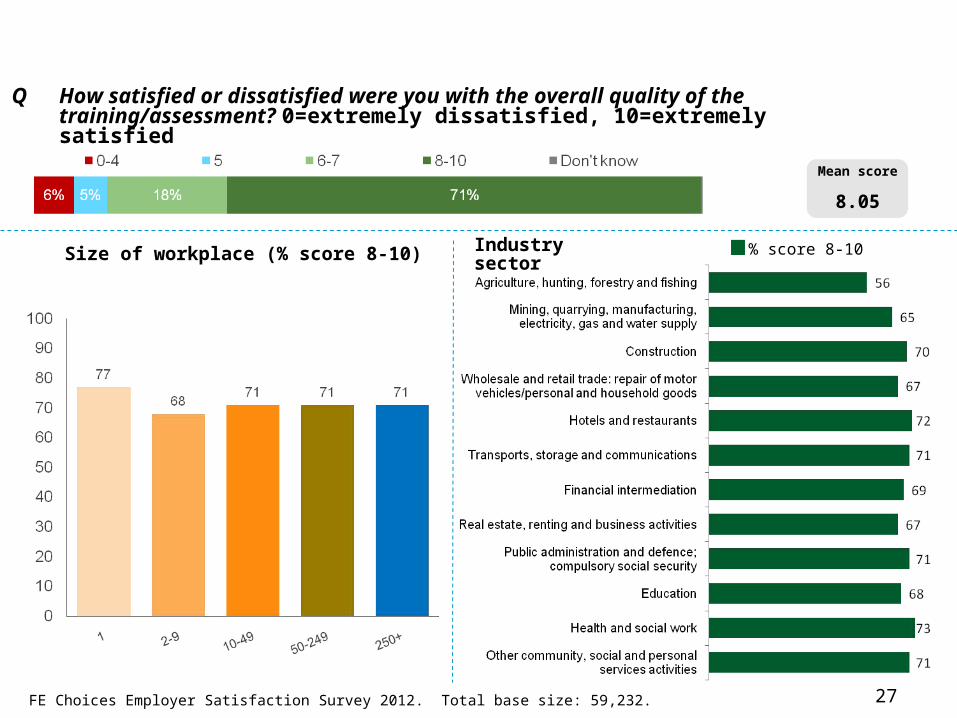
Mean score
8.05
Q How satisfied or dissatisfied were you with the overall quality of the training/assessment? 0=extremely dissatisfied, 10=extremely satisfied
% score 8-10
FE Choices Employer Satisfaction Survey 2012. Total base size: 59,232.
Industry sector Size of workplace (% score 8-10)
27
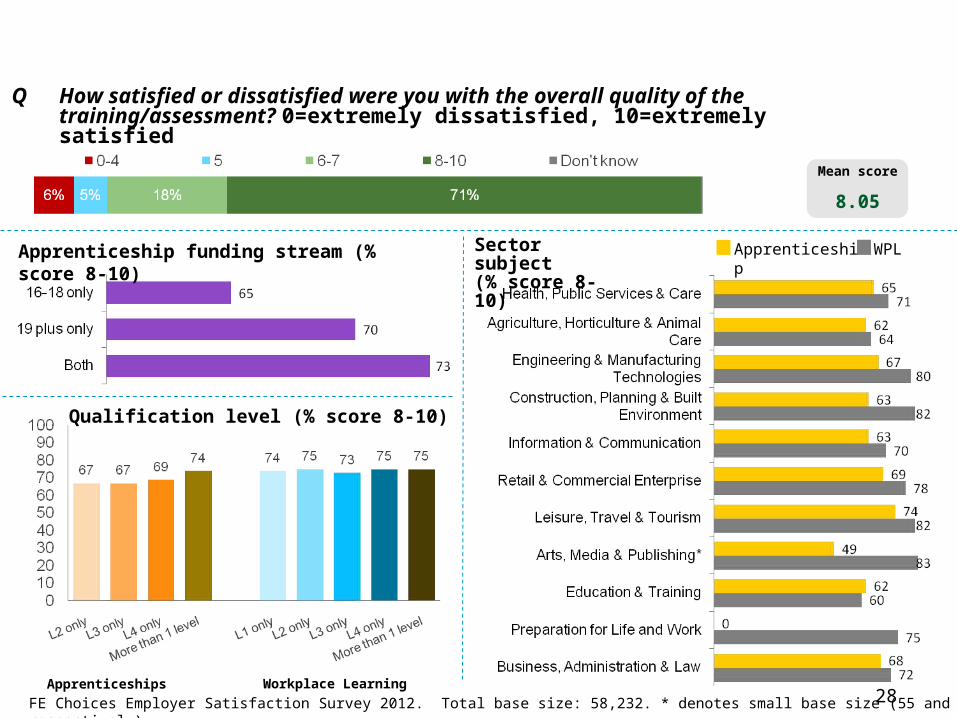
Mean score
8.05
Q How satisfied or dissatisfied were you with the overall quality of the training/assessment? 0=extremely dissatisfied, 10=extremely satisfied
Apprenticeships Workplace Learning
Apprenticeship funding stream (% score 8-10)
FE Choices Employer Satisfaction Survey 2012. Total base size: 58,232. * denotes small base size (55 and 41 respectively).
Sector subject (% score 8-10)
Apprenticeship WPL
Qualification level (% score 8-10)
28
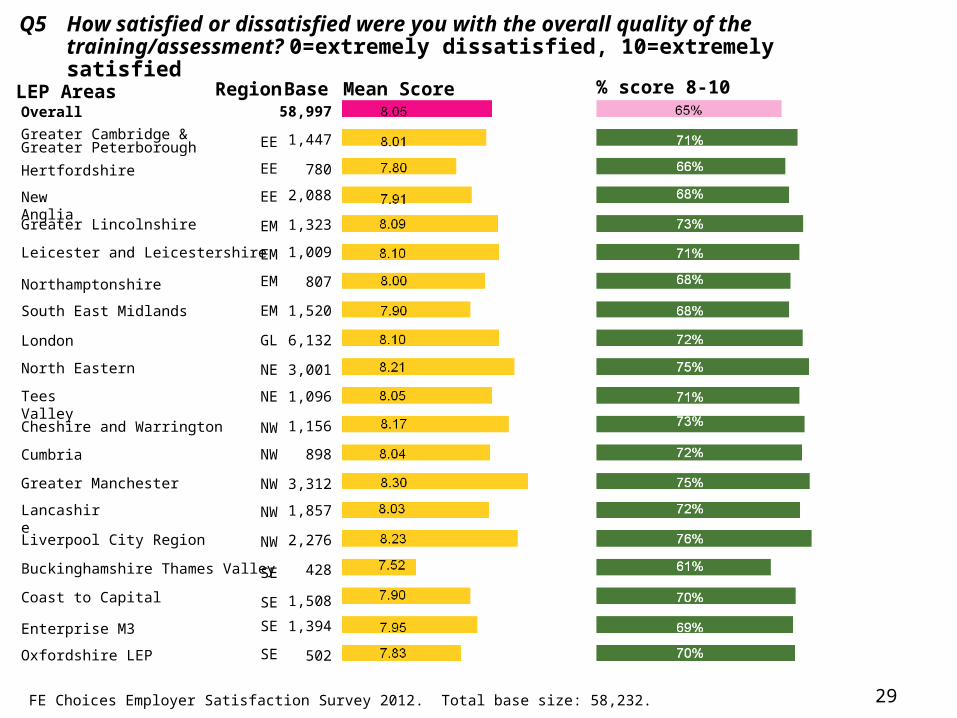
Overall
Greater Cambridge & Greater Peterborough
Hertfordshire
New Anglia
Greater Lincolnshire
Leicester and Leicestershire
Northamptonshire
South East Midlands
London
North Eastern
Tees Valley
Cheshire and Warrington
Cumbria
Greater Manchester
Lancashire
Liverpool City Region
Buckinghamshire Thames Valley
Coast to Capital
Enterprise M3
Oxfordshire LEP
FE Choices Employer Satisfaction Survey 2012. Total base size: 58,232. 29
Mean ScoreBase % score 8-1058,997
1,447
780
2,088
1,323
1,009
807
1,520
6,132
3,001
1,096
1,156
898
3,312
1,857
2,276
428
1,508
1,394
502
EE
EE
EE
EM
EM
EM
EM
GL
NE
NE
NW
NW
NW
NW
NW
SE
SE
SE
SE
LEP Areas
Q5 How satisfied or dissatisfied were you with the overall quality of the training/assessment? 0=extremely dissatisfied, 10=extremely satisfied
Region
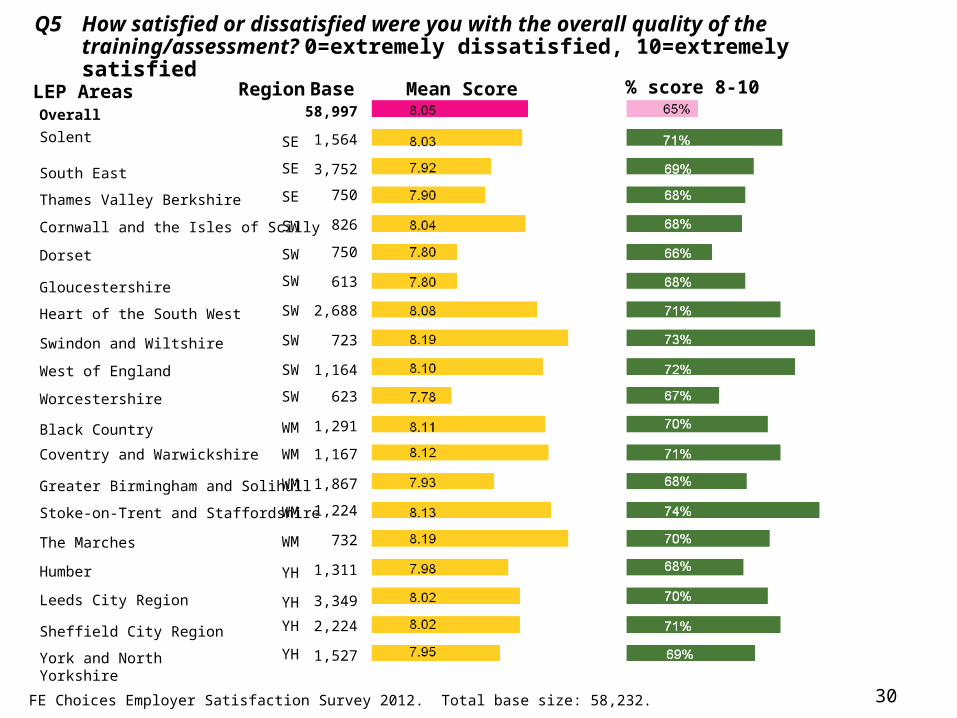
Overall
Solent
South East
Thames Valley Berkshire
Cornwall and the Isles of Scilly
Dorset
Gloucestershire
Heart of the South West
Swindon and Wiltshire
West of England
Worcestershire
Black Country
Coventry and Warwickshire
Greater Birmingham and Solihull
Stoke-on-Trent and Staffordshire
The Marches
Humber
Leeds City Region
Sheffield City Region
York and North Yorkshire
Base58,997
1,564
3,752
750
826
750
613
2,688
723
1,164
623
1,291
1,167
1,867
1,224
732
1,311
3,349
2,224
1,527
SE
SE
SE
SW
SW
SW
SW
SW
SW
SW
WM
WM
WM
WM
WM
YH
YH
YH
YH
FE Choices Employer Satisfaction Survey 2012. Total base size: 58,232. 30
Mean Score % score 8-10LEP Areas
Q5 How satisfied or dissatisfied were you with the overall quality of the training/assessment? 0=extremely dissatisfied, 10=extremely satisfied
Region
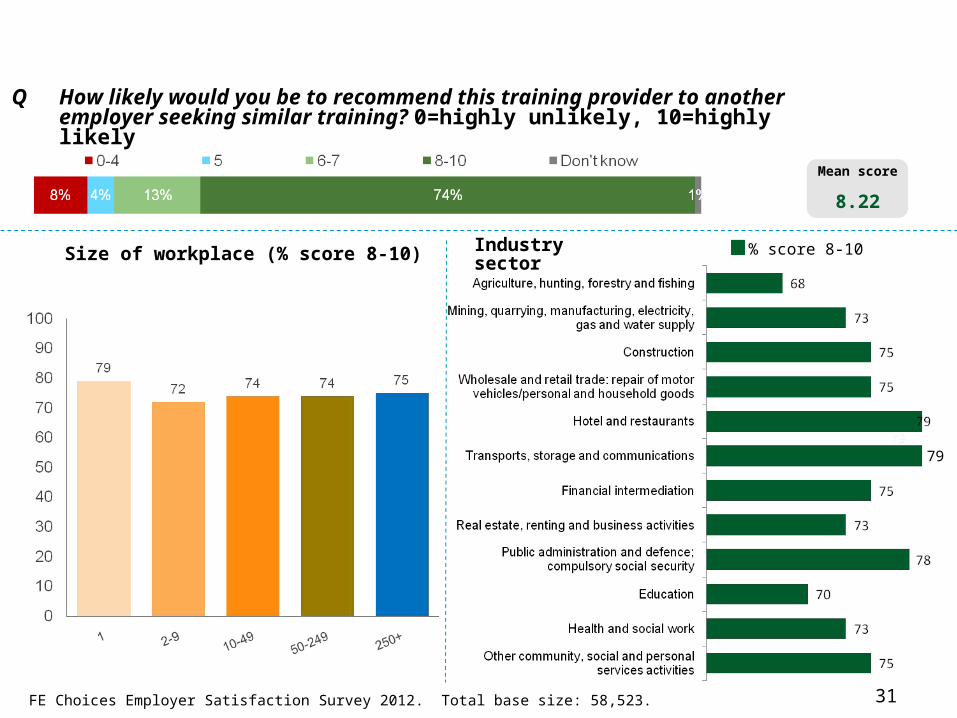
Mean score
8.22
Q How likely would you be to recommend this training provider to another employer seeking similar training? 0=highly unlikely, 10=highly likely
% score 8-10
79
FE Choices Employer Satisfaction Survey 2012. Total base size: 58,523.
Industry sectorSize of workplace (% score 8-10)
31
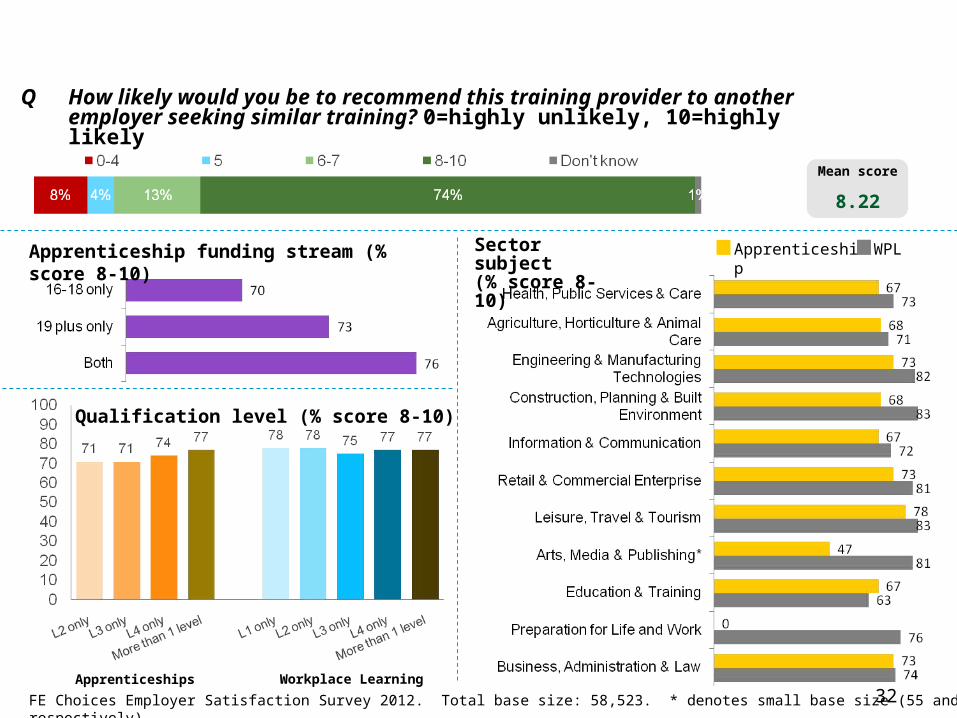
Mean score
8.22
Q How likely would you be to recommend this training provider to another employer seeking similar training? 0=highly unlikely, 10=highly likely
Apprenticeships Workplace Learning
Apprenticeship funding stream (% score 8-10)
FE Choices Employer Satisfaction Survey 2012. Total base size: 58,523. * denotes small base size (55 and 41 respectively).
Sector subject (% score 8-10)
Apprenticeship WPL
Qualification level (% score 8-10)
32
Overall
Greater Cambridge & Greater Peterborough
Hertfordshire
New Anglia
Greater Lincolnshire
Leicester and Leicestershire
Northamptonshire
South East Midlands
London
North Eastern
Tees Valley
Cheshire and Warrington
Cumbria
Greater Manchester
Lancashire
Liverpool City Region
Buckinghamshire Thames Valley
Coast to Capital
Enterprise M3
Oxfordshire LEP
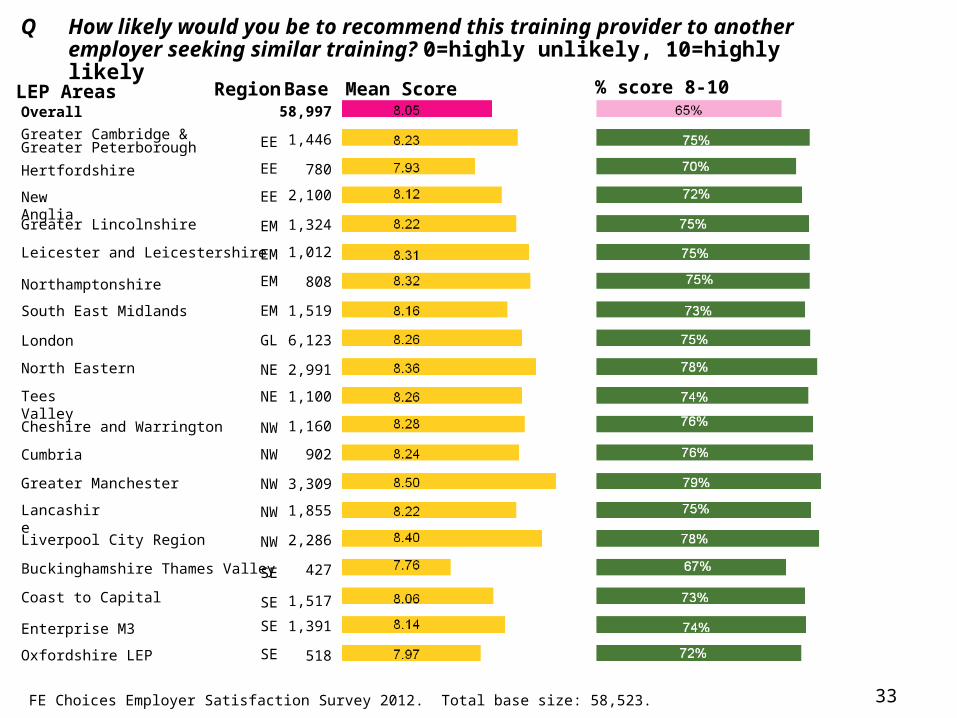
FE Choices Employer Satisfaction Survey 2012. Total base size: 58,523. 33
Mean ScoreBase % score 8-1058,997
1,446
780
2,100
1,324
1,012
808
1,519
6,123
2,991
1,100
1,160
902
3,309
1,855
2,286
427
1,517
1,391
518
EE
EE
EE
EM
EM
EM
EM
GL
NE
NE
NW
NW
NW
NW
NW
SE
SE
SE
SE
LEP Areas
Q How likely would you be to recommend this training provider to another employer seeking similar training? 0=highly unlikely, 10=highly likely
Region
Overall
Solent
South East
Thames Valley Berkshire
Cornwall and the Isles of Scilly
Dorset
Gloucestershire
Heart of the South West
Swindon and Wiltshire
West of England
Worcestershire
Black Country
Coventry and Warwickshire
Greater Birmingham and Solihull
Stoke-on-Trent and Staffordshire
The Marches
Humber
Leeds City Region
Sheffield City Region
York and North Yorkshire
757
SE
SW
SW
SW
SW
SW
SW
SW
WM
WM
WM
WM
WM
YH
YH
YH
YH
SE
58,997
1,564
3,748
831
753
607
2,687
721
1,162
617
1,288
1,171
1,872
1,222
732
1,315
3,361
2,231
1,532
Base
SE
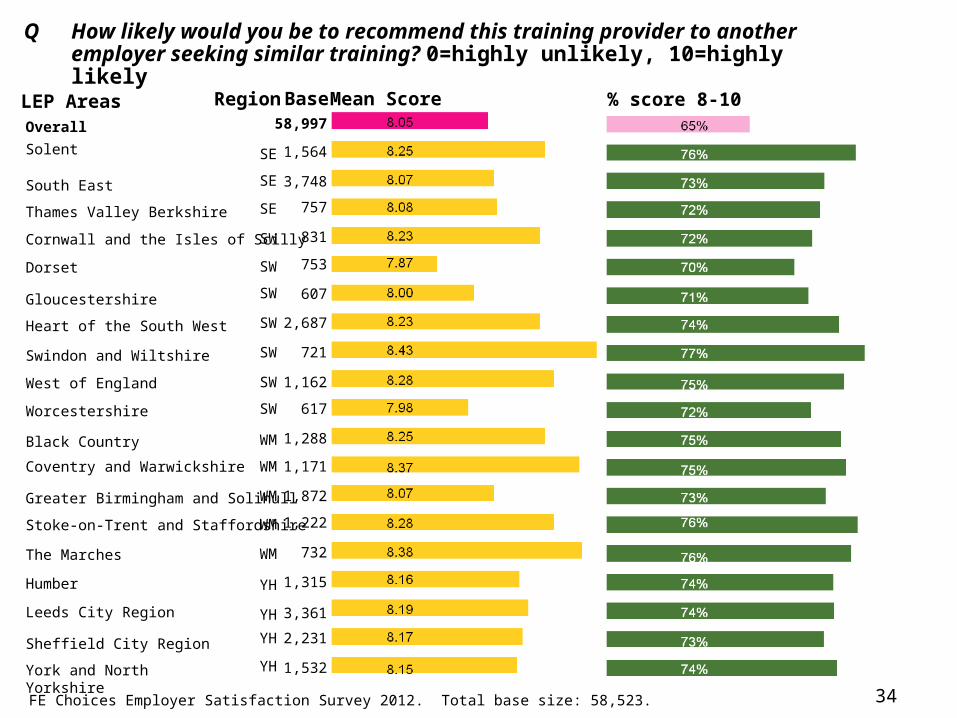
FE Choices Employer Satisfaction Survey 2012. Total base size: 58,523.
Mean Score % score 8-10
34
LEP Areas
Q How likely would you be to recommend this training provider to another employer seeking similar training? 0=highly unlikely, 10=highly likely
Region
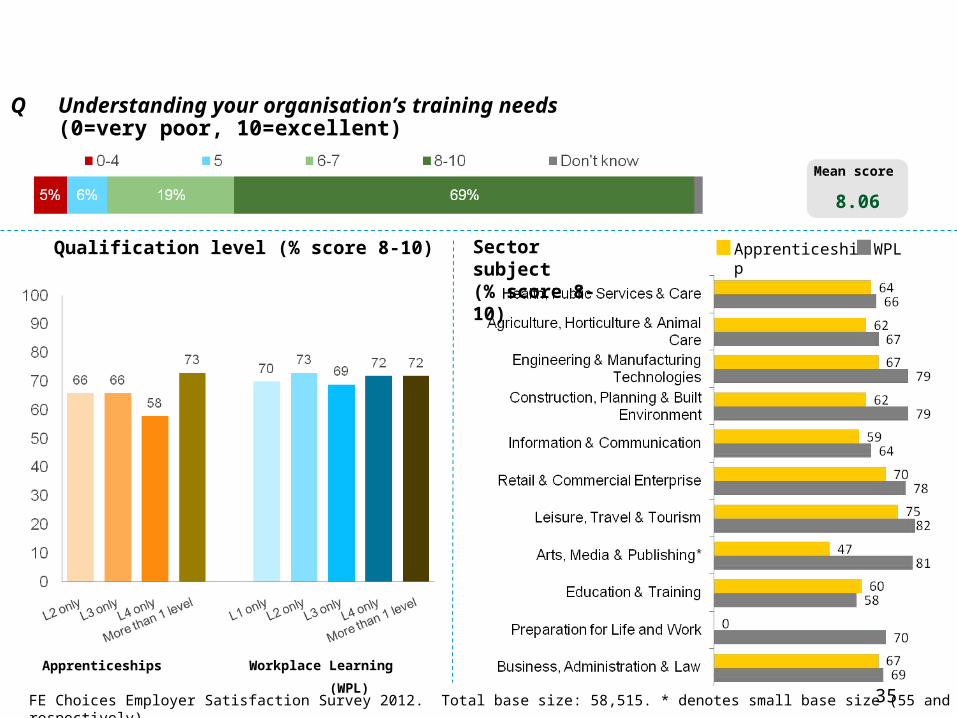
Mean score
8.06
Apprenticeship WPLSector subject (% score 8-10)
Q Understanding your organisation’s training needs (0=very poor, 10=excellent)
Apprenticeships Workplace Learning (WPL)
FE Choices Employer Satisfaction Survey 2012. Total base size: 58,515. * denotes small base size (55 and 41 respectively).
Qualification level (% score 8-10)
35
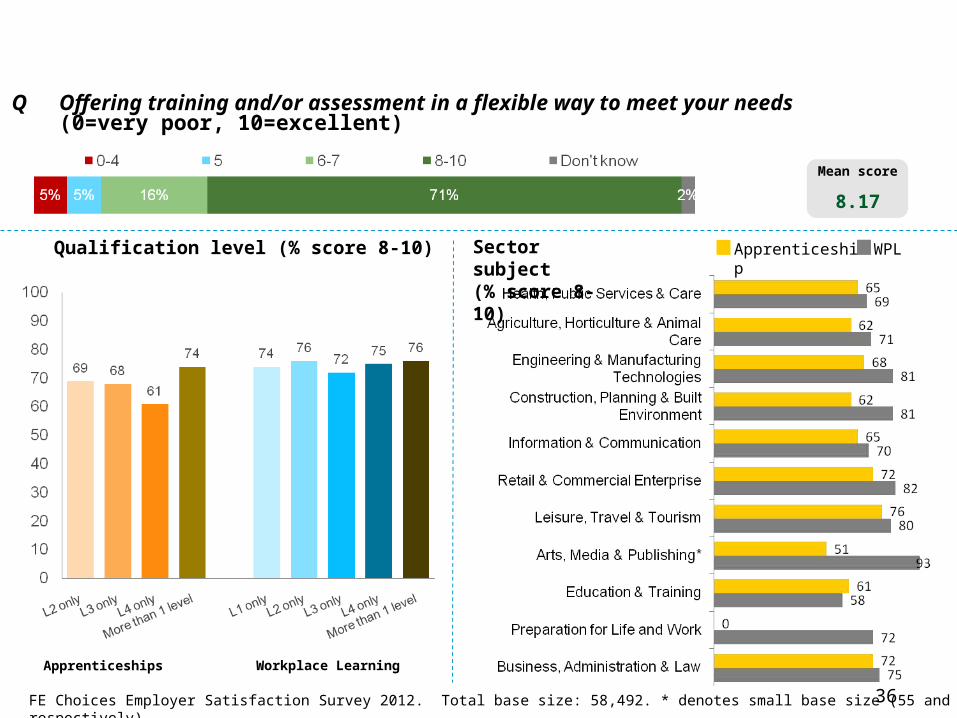
Mean score
8.17
Q Offering training and/or assessment in a flexible way to meet your needs(0=very poor, 10=excellent)
Apprenticeships Workplace Learning
FE Choices Employer Satisfaction Survey 2012. Total base size: 58,492. * denotes small base size (55 and 40 respectively).
Sector subject (% score 8-10)
Qualification level (% score 8-10) Apprenticeship WPL
36
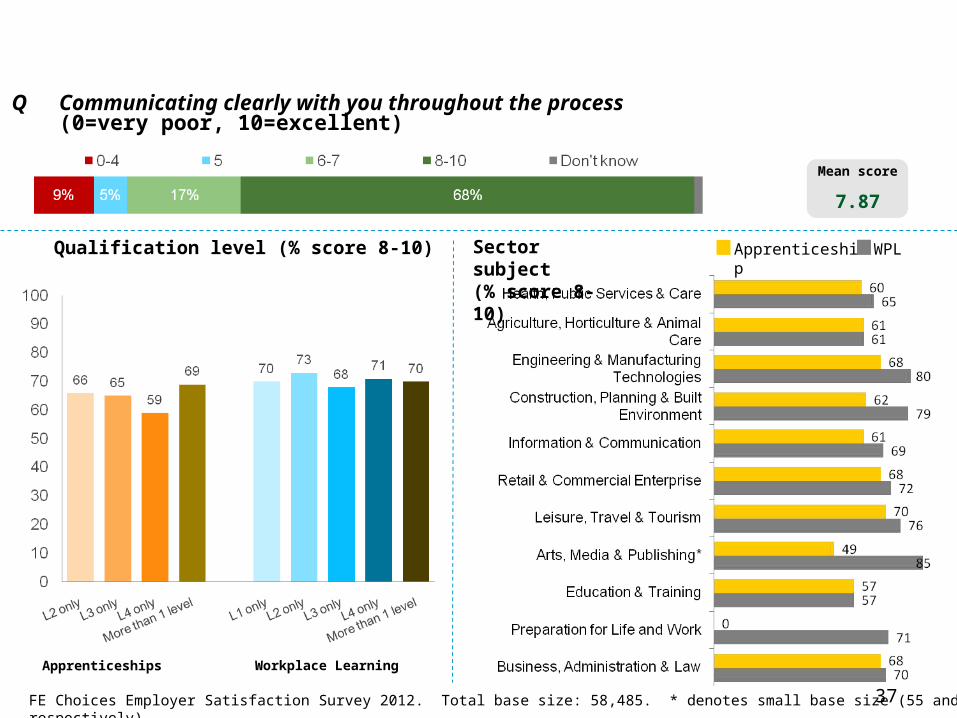
Mean score
7.87
Q Communicating clearly with you throughout the process (0=very poor, 10=excellent)
Apprenticeships Workplace Learning
FE Choices Employer Satisfaction Survey 2012. Total base size: 58,485. * denotes small base size (55 and 41 respectively).
Sector subject (% score 8-10)
Qualification level (% score 8-10) Apprenticeship WPL
37
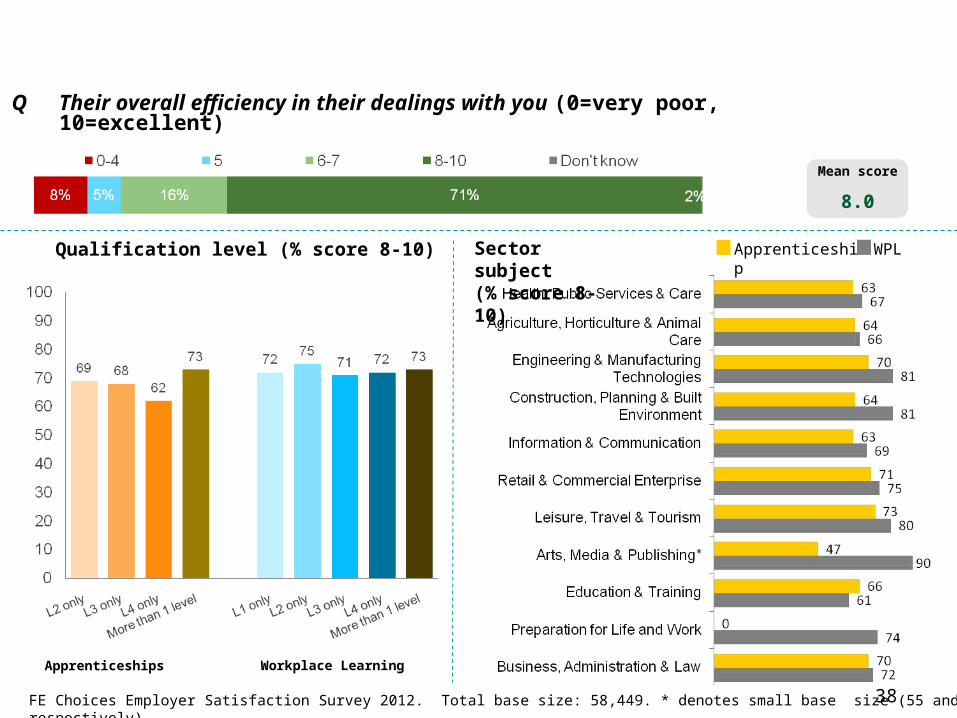
Mean score
8.0
Q Their overall efficiency in their dealings with you (0=very poor, 10=excellent)
Apprenticeships Workplace Learning
FE Choices Employer Satisfaction Survey 2012. Total base size: 58,449. * denotes small base size (55 and 41 respectively).
Sector subject (% score 8-10)
Qualification level (% score 8-10) Apprenticeship WPL
38
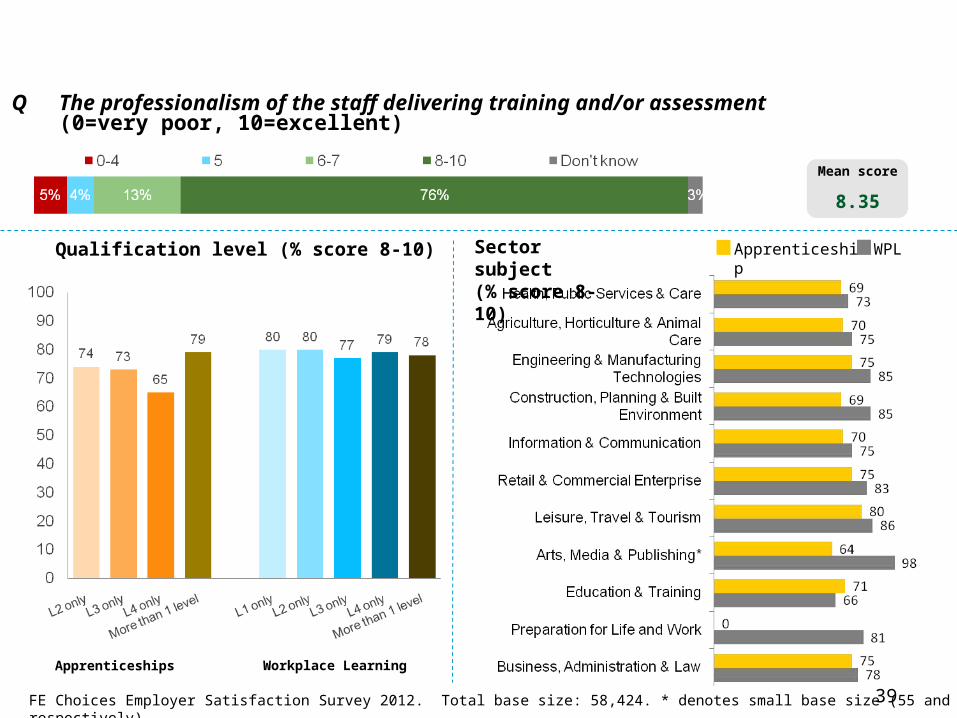
Mean score
8.35
Q The professionalism of the staff delivering training and/or assessment(0=very poor, 10=excellent)
Apprenticeships Workplace Learning
FE Choices Employer Satisfaction Survey 2012. Total base size: 58,424. * denotes small base size (55 and 41 respectively).
Sector subject (% score 8-10)
Qualification level (% score 8-10) Apprenticeship WPL
39
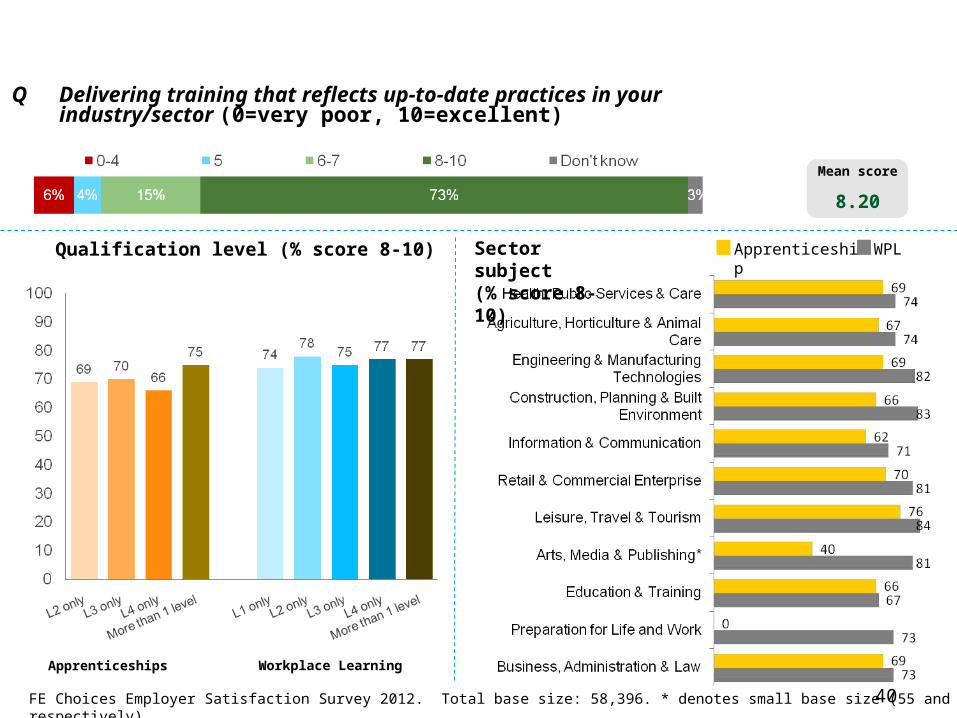
Mean score
8.20
Q Delivering training that reflects up-to-date practices in your industry/sector (0=very poor, 10=excellent)
Apprenticeships Workplace Learning
FE Choices Employer Satisfaction Survey 2012. Total base size: 58,396. * denotes small base size (55 and 41 respectively).
Sector subject (% score 8-10)
Qualification level (% score 8-10) Apprenticeship WPL
40