Embed Size (px)
Citation preview

Employees’ Provident Fund, the largest superannuation fund in Sri Lanka, continued to function with the ultimate
objective of securing members' retired lives by ensuring attractive return on investment while maintaining the safety of the Fund in the year 2013.
This year is a yet another special year for the Fund as it recorded the highest income, of 136 billion rupees in the history of EPF.
Further, with the decline interest rates, the Fund was able to announce a very attractive interest rate of 11 per cent in a low inflationary environment resulting a heathy real return to the members.
Employees' Provident Fund Annual Report - 2013

Page
Part 1
Vision and Mission 163Message from the Chairman of the Monetary Board and Governor 164of the Central Bank of Sri Lanka Message from the Commissioner General of Labour 166Performance Highlights 168Operational Highlights 170Regulatory Framework 171Review of Economy 175Review of the Performance of EPF 179
Part 2
FINANCIAL STATEMENTS
Statement of Income & Expenditure 188 Statement of Comprehensive Income 189 Statement of Financial Position 190 Receipts and Payments Account 191 Cash Flow Statement 192 Statement of Investments 193 Statement of Changes in Members' Equity/ Wealth 194 Accounting Policies 195
Notes to the Comprehensive Statement
1. Interest Income 202 2. Dividend Income 202 3. Realized Capital Gain/(Loss) 202 4. Amortization Gain 203 5. Net Gain From Financial Instruments At Fair Value Through Profit Or Loss 203 6. Other Income 203 7. Total Operating Expenditure 203 8. Income Tax Expensive 204 9. Net Change In Fair Value of Available-For-Sale Financial Assets 204
Notes to the Statement of Financial Position
10. Property, Plant and Equipment 205
Contents
11. Capital Work-In-Progress 206 12. Intangible Assets 206 13. Financial Assets 207 14. Other Receivable and Current Assets 208 15. Cash and Cash Equivalents 208 16. Creditors 208 17. Other Current Liabilities 209 18. Member Balances 210 19. Reserves 210
Notes to the Receipts and Payment Account
20. Receipts 211 21. Payments 212
Notes to the Statement of Investment
22. Fair Value Through Profit & Loss 213 23. Available For Sale 214 24. Held to Maturity 218 25. Loans & Receivables 222 26. Movement of Investment 223 27. Classification of Maturity Profile of the Portfolio 224
REPORT OF THE AUDITOR GENERAL 225
Part 3
Tables
1 Investments, Maturities and Return on Investments (1982 - 2013) 243
2 Rates of Return on Member Balances (1982 - 2013) 244
3 Member Balances, Interest on Member Balances and Effective Rates on Member Balances (1982 - 2013) 245
4 Statement of Investment Portfolio (1982 - 2013) 246
5 Summarized Cash Flow (Monetary Board) (1982 - 2013) 247
6 Summarized Income and Expenditure Statement (1992-2013) 250

To be the most caring superannuation fund in the region enabling our members to have a contented retirement life
Our VisiOn
To provide maximum retirement benefits and an efficient service to our members through prudent and innovative management of the Fund
Our MissiOn
164
Employees' Provident Fund - Annual Report 2013
Message from the Chairman of the Monetary Board and Governor of the Central Bank of Sri Lanka
I am pleased to present the Annual Report of Employees’ Provident Fund (EPF) of the year 2013 on behalf of the Monetary Board of Central Bank of Sri Lanka.
The EPF has continued its strong performance surpassing many landmarks in 2013. Total asset value reached Rs. 1.3 trillion and earnings recorded the highest ever investment income for a year amounting to Rs. 136 billion. Growth in value was driven by an impressive rate of return of 11.54 per cent on EPF’s investment portfolio. In turn, the Fund was able to pay 11 per cent
rate of return on the member balances. This is a commendable performance by the EPF given the environment of declining interest rate and depressed equity market conditions, witnessed in 2013, once again demonstrating its robust fund management, investment policies and practices. The EPF continued to invest its excess funds mainly in government securities while diversifying into equities and corporate debt instruments, tapping carefully on the appropriate risk-return trade-off. In this background, as the largest superannuation fund in the country, Fund’s long-term investment strategy has enabled us to pay a steady rate of interest above 10 per cent for the 8th consecutive year despite periodic fluctuations of return.
Considering the immense economic potential of our country the Fund is expected to expand further in the coming years. New focus to expand the industrial and service sectors is expected to increase the active memberships of EPF. At the same time, the aging population may reduce the number of new entrants to the labour market. The EPF, as a dynamic organization, anticipating these developments has made changes to its fund management strategies, administrative as well as risk management practices and procedures in order to arm itself with the necessary skills, tools, resources, systems and infrastructure. Hence, I wish to assure our members that EPF is well-equipped to realize maximum benefits from the economic development prospect of the country in the years to come, and will discharge its fiduciary responsibility of managing the Fund efficiently and effectively.
The year saw several new projects being launched with the objective of providing a more efficient service to its members. As a means of streamlining the collection of EPF contributions from employers, regulations for mandatory e–Returns were
165
Employees' Provident Fund - Annual Report 2013
gazetted during the year, which now require all employers who have more than 50 employees to submit their employees’ EPF contributions and member details on a monthly basis via the e-Return system. By the end of the year, 41 per cent of employers out of employers eligible for the system, have successfully registered with the system facilitating faster crediting and more efficient management of member accounts thus, enabling EPF to better serve its members.
Image Scanning Project is another significant step taken by the Fund, which progressed well during the year under review as well. The project targets conversion of the existing paper-based EPF system to a near paperless system, which entails converting the enormous amount of existing documents belonging to millions of our members into electronic form. On completion of the project, an e-Record room will be established linking the document management system with the existing EPF computer system, which will in turn significantly increase the productivity of the Fund.
Further, increasing awareness of members of the services of EPF was continued in the year 2013 as well. Several awareness programmes and mobile services on e-Return system, member re-registration and other member related services were conducted at various parts of the country, targeting largely diverse stakeholders of the Fund. The EPF has improved this further, by collaborating with other connected government bodies such as the Department of Labour, Department of Registration of Persons, Registrar General’s Department etc.
In this background, the Monetary Board wishes to express its appreciation to the staff of the Department of Labour, staff of the Employees’ Provident Fund Department of the Central Bank of Sri Lanka for their dedication and commitments.
The Monetary Board also wishes to express its sincere gratitude to all the Members and Employers of the EPF, for their undaunted confidence placed in the Fund energizing its steadfast journey to excellence.
Arjuna MahendranGovernor, Central Bank of Sri LankaChairman of the Monetary Board

166
Employees' Provident Fund - Annual Report 2013
Message from the Commissioner General of Labour
Let me at the outset thank staff of Employees’ Provident Fund Department of Central Bank of Sri Lanka, on the occasion of the release of Annual Report 2013, which carries the progress achieved by EPF during the year 2013.
Today, EPF, which was established under the Employees’ Provident Fund Act No. 15 of 1958, with the main objective of providing contended retirement life for the private and semi – government sector employees in Sri Lanka who do not enjoy pension benefits, has grown to be the largest social security system in the country.
The activation of the EPF payment monitoring system commenced in Colombo district in 2012, has been established in most of the district labour offices island wide during the year of 2013.
Furthermore, during the year of 2013 refund payments of deceased members of the Employees Provident Fund have been successfully decentralized island wide through zonal labour offices.
The data base was commenced in 2012 by using fingerprints of members obtained in digital format has been established for the convenience of members of Employees’ Provident Fund who are spread island wide. In order to fulfill that task efficiently the initial step has been taken in 2013 by establishing database system for collection of fingerprints of members in digital format in several district labour offices. In future we expect to establish this system in every district labour offices.
I would like to express my gratitude towards the staff of the Department of labour for their commendable contribution in discharging the statutory responsibilities and maintaining a healthy relationship with both employees and the employers and also the staff of Employees’ Provident Fund Department of Central Bank of Sri Lanka, for their support in carrying out activities of EPF successfully.
I hope this annual report would provide valuable information to employees, employers, officers of administrative and financial institutions and any other parties including students who are interested in this subject.
Mrs. Pearl WeerasingheCommissioner General of Labour

167
Employees' Provident Fund - Annual Report 2013
168
Employees' Provident Fund - Annual Report 2013
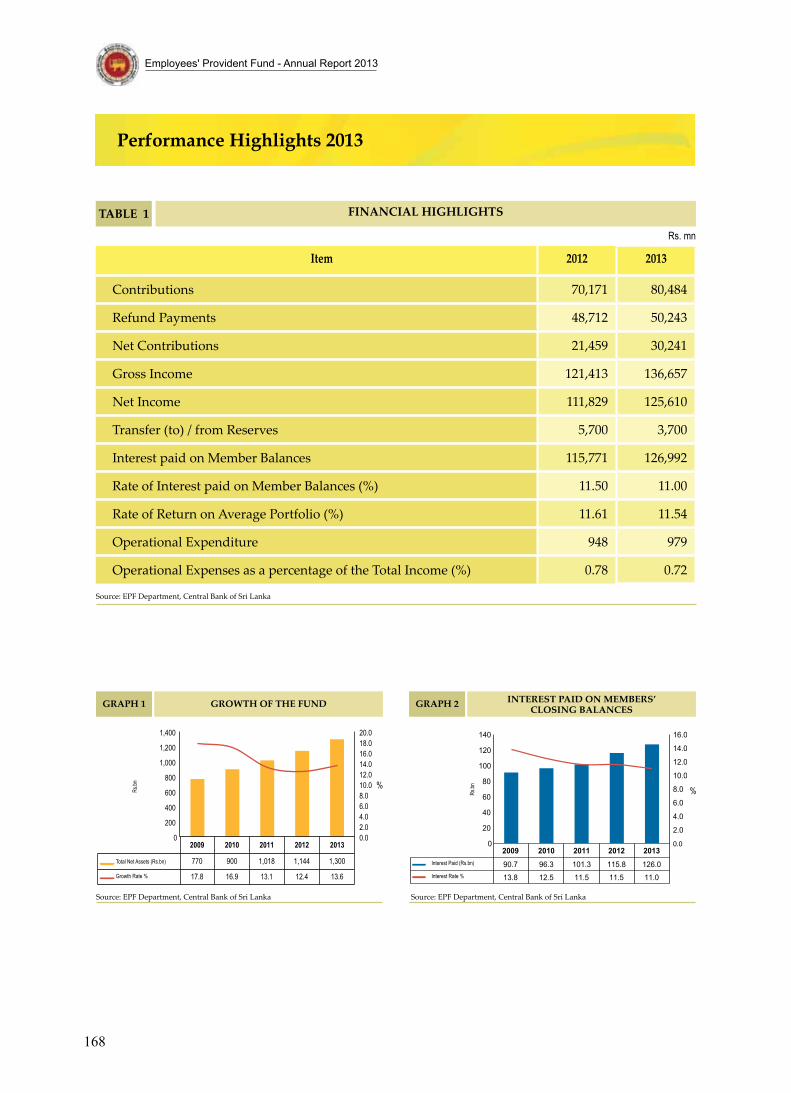
Performance Highlights 2013
Item 2012 2013
Contributions 70,171 80,484
Refund Payments 48,712 50,243
Net Contributions 21,459 30,241
Gross Income 121,413 136,657
Net Income 111,829 125,610
Transfer (to) / from Reserves 5,700 3,700
Interest paid on Member Balances 115,771 126,992
Rate of Interest paid on Member Balances (%) 11.50 11.00
Rate of Return on Average Portfolio (%) 11.61 11.54
Operational Expenditure 948 979
Operational Expenses as a percentage of the Total Income (%) 0.78 0.72
FinanCial HigHligHts
Rs. mn
table 1
2010 2011 2012 2013
900 1,018 1,144 1,300
2009
770
17.8 16.9 13.1 12.4 13.6
0.02.04.06.08.010.012.014.016.0
20.018.0
0
200
400
600
800
1,000
1,200
1,400
groWtH oF tHe FundgraPH 1
Total Net Assets (Rs.bn)
Rs.bn
Growth Rate %
Source: EPF Department, Central Bank of Sri Lanka
interest Paid on MeMbers’ Closing balanCesgraPH 2
2009 2010 2011 2012 2013
90.7 96.3 101.3 115.8 126.0
13.8 12.5 11.5 11.5 11.0
0.0
2.0
4.0
6.0
8.0
10.0
12.0
14.0
16.0
0
20
40
60
80
100
120
140
Interest Paid (Rs.bn)
Interest Rate %
Source: EPF Department, Central Bank of Sri Lanka
% %Rs.bn
Source: EPF Department, Central Bank of Sri Lanka
169
Employees' Provident Fund - Annual Report 2013
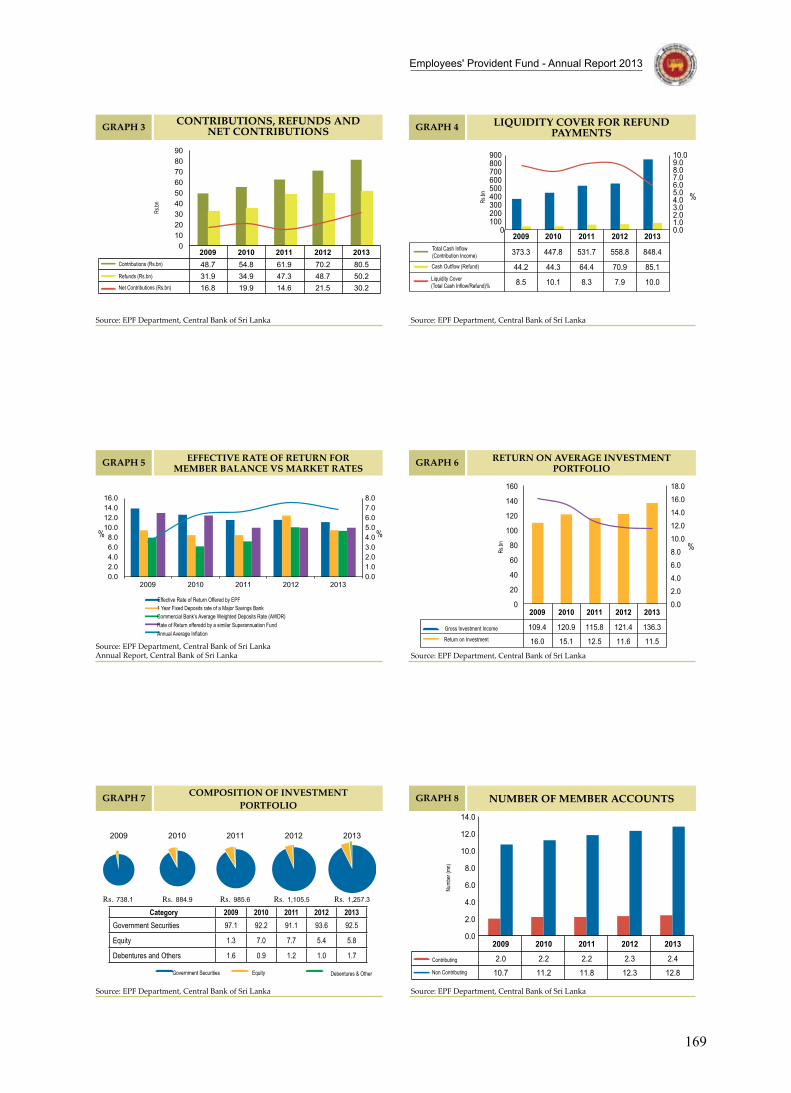
2009 2010 2011 2012 201348.7 54.8 61.9 70.2 80.531.9 34.9 47.3 48.7 50.216.8 19.9 14.6 21.5 30.2
0102030405060708090
Contributions, reFunds and net ContributionsgraPH 3
Contributions (Rs.bn)
Refunds (Rs.bn)
Net Contributions (Rs.bn)
Source: EPF Department, Central Bank of Sri Lanka
0.01.02.03.04.05.06.07.08.0
0.02.04.06.08.0
10.012.014.016.0
2009 2010 2011 2012 2013
eFFeCtive rate oF return For MeMber balanCe vs Market ratesgraPH 5
Effective Rate of Return Offered by EPF1 Year Fixed Deposits rate of a Major Savings BankCommercial Bank’s Average Weighted Deposits Rate (AWDR)Rate of Return offeredd by a similar Superannuation FundAnnual Average Inflation
Source: EPF Department, Central Bank of Sri Lanka
20102009 2011 2012 2013
Rs. 738.1 Rs. 884.9 Rs. 985.6 Rs. 1,105.5 Rs. 1,257.3
CoMPosition oF investMent PortFolio
graPH 7
Government Securities Equity Debentures & Other
Source: EPF Department, Central Bank of Sri Lanka
liquidity Cover For reFund PayMentsgraPH 4
2009 2010 2011 2012 2013
373.3 447.8 531.7 558.8 848.4
44.2 44.3 64.4 70.9 85.1
8.5 10.1 8.3 7.9 10.0
0.01.02.03.04.05.06.07.08.09.010.0
0100200300400500600700800900
Total Cash Inflow (Contribution Income)
Cash Outflow (Refund)
Liquidity Cover (Total Cash Inflow/Refund)%
Source: EPF Department, Central Bank of Sri Lanka
return on average investMent PortFoliograPH 6
2009 2010 2011 2012 2013
109.4 120.9 115.8 121.4 136.3
16.0 15.1 12.5 11.6 11.5
0.0
2.0
4.0
6.0
8.0
10.0
12.0
14.0
16.0
18.0
0
20
40
60
80
100
120
140
160
Gross Investment Income
Return on Investment
Source: EPF Department, Central Bank of Sri Lanka
nuMber oF MeMber aCCountsgraPH 8
2009 2010 2011 2012 2013
2.0 2.2 2.2 2.3 2.4
10.7 11.2 11.8 12.3 12.8
0.0
2.0
4.0
6.0
8.0
10.0
12.0
14.0
Contributing
Non Contributing
Source: EPF Department, Central Bank of Sri Lanka
Rs.bn
Rs.bn
Rs.bn
Numb
er (m
n)
%
% % %
Annual Report, Central Bank of Sri Lanka
Category 2009 2010 2011 2012 2013Government Securities 97.1 92.2 91.1 93.6 92.5
Equity 1.3 7.0 7.7 5.4 5.8
Debentures and Others 1.6 0.9 1.2 1.0 1.7
170
Employees' Provident Fund - Annual Report 2013
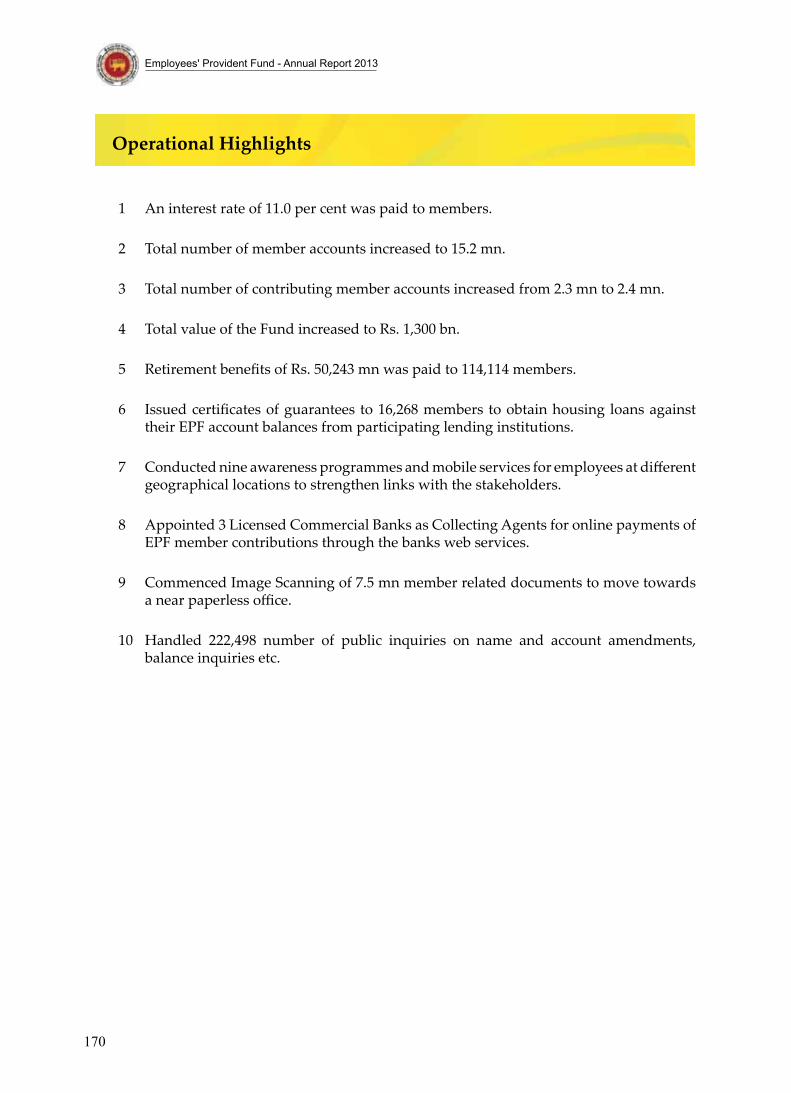
operational Highlights
1 An interest rate of 11.0 per cent was paid to members.
2 Total number of member accounts increased to 15.2 mn.
3 Total number of contributing member accounts increased from 2.3 mn to 2.4 mn.
4 Total value of the Fund increased to Rs. 1,300 bn.
5 Retirement benefits of Rs. 50,243 mn was paid to 114,114 members.
6 Issued certificates of guarantees to 16,268 members to obtain housing loans against their EPF account balances from participating lending institutions.
7 Conducted nine awareness programmes and mobile services for employees at different geographical locations to strengthen links with the stakeholders.
8 Appointed 3 Licensed Commercial Banks as Collecting Agents for online payments of EPF member contributions through the banks web services.
9 Commenced Image Scanning of 7.5 mn member related documents to move towards a near paperless office.
10 Handled 222,498 number of public inquiries on name and account amendments, balance inquiries etc.
171
Employees' Provident Fund - Annual Report 2013
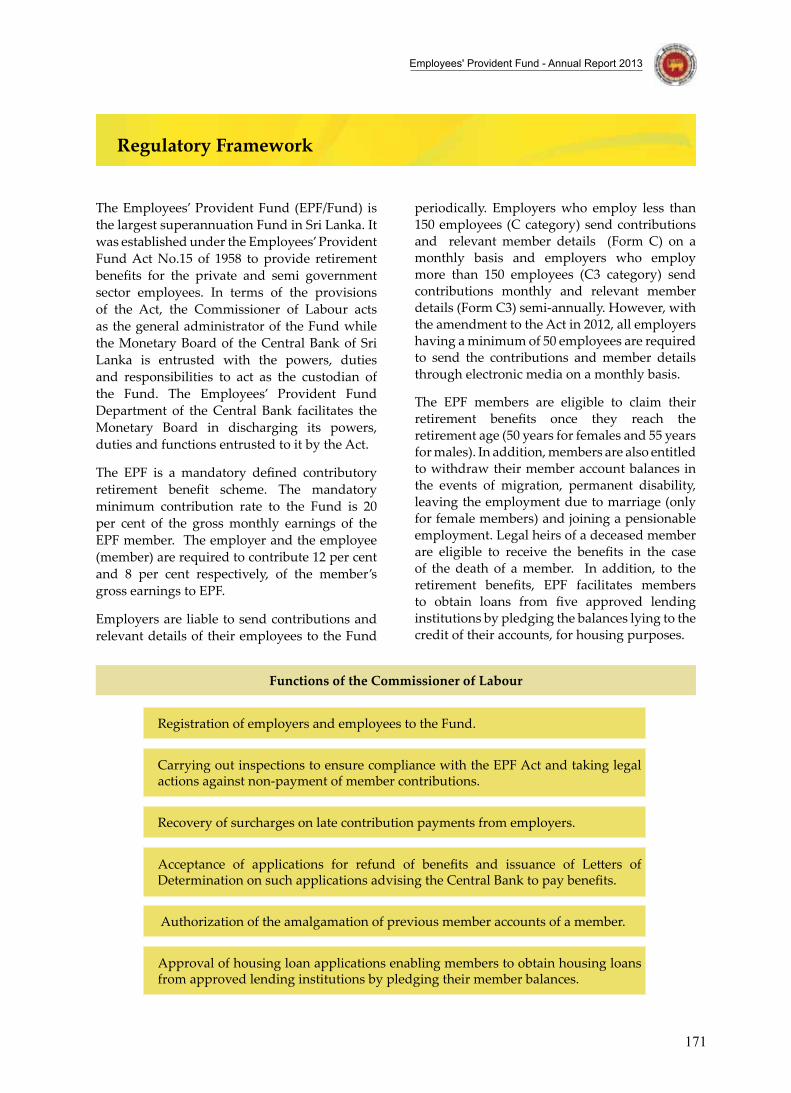
Regulatory Framework
The Employees’ Provident Fund (EPF/Fund) is the largest superannuation Fund in Sri Lanka. It was established under the Employees’ Provident Fund Act No.15 of 1958 to provide retirement benefits for the private and semi government sector employees. In terms of the provisions of the Act, the Commissioner of Labour acts as the general administrator of the Fund while the Monetary Board of the Central Bank of Sri Lanka is entrusted with the powers, duties and responsibilities to act as the custodian of the Fund. The Employees’ Provident Fund Department of the Central Bank facilitates the Monetary Board in discharging its powers, duties and functions entrusted to it by the Act.
The EPF is a mandatory defined contributory retirement benefit scheme. The mandatory minimum contribution rate to the Fund is 20 per cent of the gross monthly earnings of the EPF member. The employer and the employee (member) are required to contribute 12 per cent and 8 per cent respectively, of the member’s gross earnings to EPF.
Employers are liable to send contributions and relevant details of their employees to the Fund
periodically. Employers who employ less than 150 employees (C category) send contributions and relevant member details (Form C) on a monthly basis and employers who employ more than 150 employees (C3 category) send contributions monthly and relevant member details (Form C3) semi-annually. However, with the amendment to the Act in 2012, all employers having a minimum of 50 employees are required to send the contributions and member details through electronic media on a monthly basis.
The EPF members are eligible to claim their retirement benefits once they reach the retirement age (50 years for females and 55 years for males). In addition, members are also entitled to withdraw their member account balances in the events of migration, permanent disability, leaving the employment due to marriage (only for female members) and joining a pensionable employment. Legal heirs of a deceased member are eligible to receive the benefits in the case of the death of a member. In addition, to the retirement benefits, EPF facilitates members to obtain loans from five approved lending institutions by pledging the balances lying to the credit of their accounts, for housing purposes.
Functions of the Commissioner of labour
Registration of employers and employees to the Fund.
Carrying out inspections to ensure compliance with the EPF Act and taking legal actions against non-payment of member contributions.
Recovery of surcharges on late contribution payments from employers.
Acceptance of applications for refund of benefits and issuance of Letters of Determination on such applications advising the Central Bank to pay benefits.
Authorization of the amalgamation of previous member accounts of a member.
Approval of housing loan applications enabling members to obtain housing loans from approved lending institutions by pledging their member balances.
172
Employees' Provident Fund - Annual Report 2013
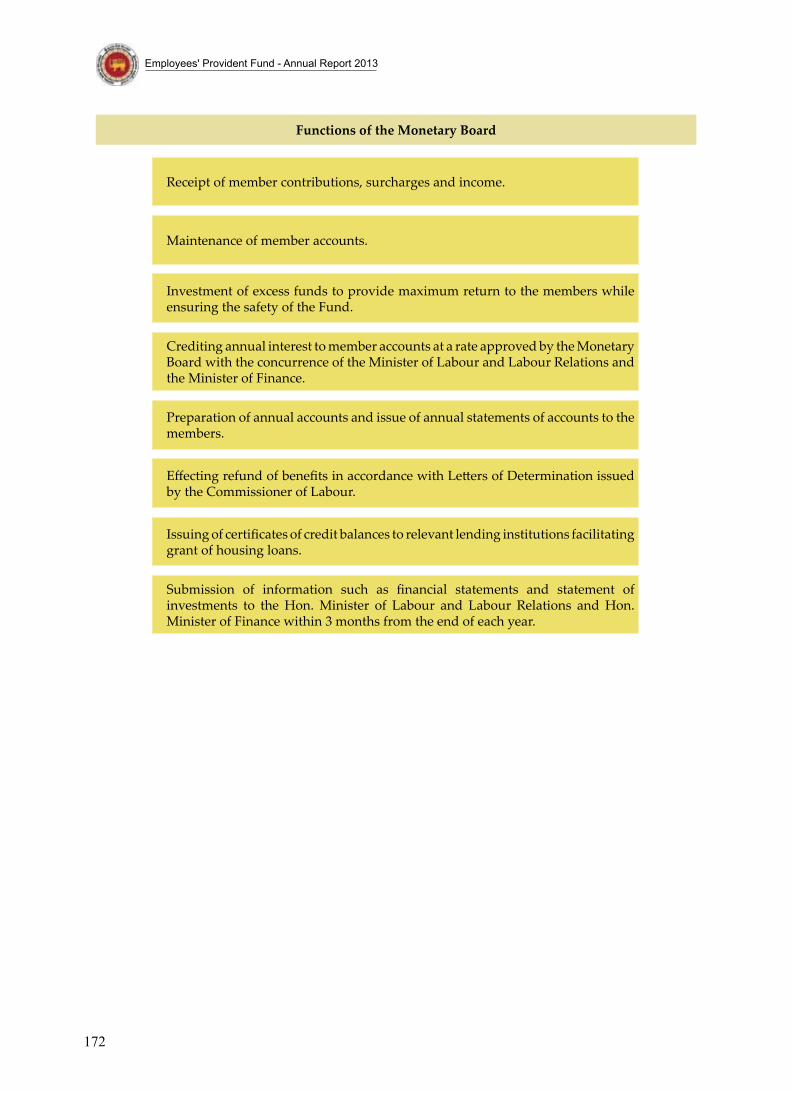
Functions of the Monetary board
Receipt of member contributions, surcharges and income.
Maintenance of member accounts.
Investment of excess funds to provide maximum return to the members while ensuring the safety of the Fund.
Crediting annual interest to member accounts at a rate approved by the Monetary Board with the concurrence of the Minister of Labour and Labour Relations and the Minister of Finance.
Preparation of annual accounts and issue of annual statements of accounts to the members.
Effecting refund of benefits in accordance with Letters of Determination issued by the Commissioner of Labour.
Issuing of certificates of credit balances to relevant lending institutions facilitating grant of housing loans.
Submission of information such as financial statements and statement of investments to the Hon. Minister of Labour and Labour Relations and Hon. Minister of Finance within 3 months from the end of each year.
173
Employees' Provident Fund - Annual Report 2013
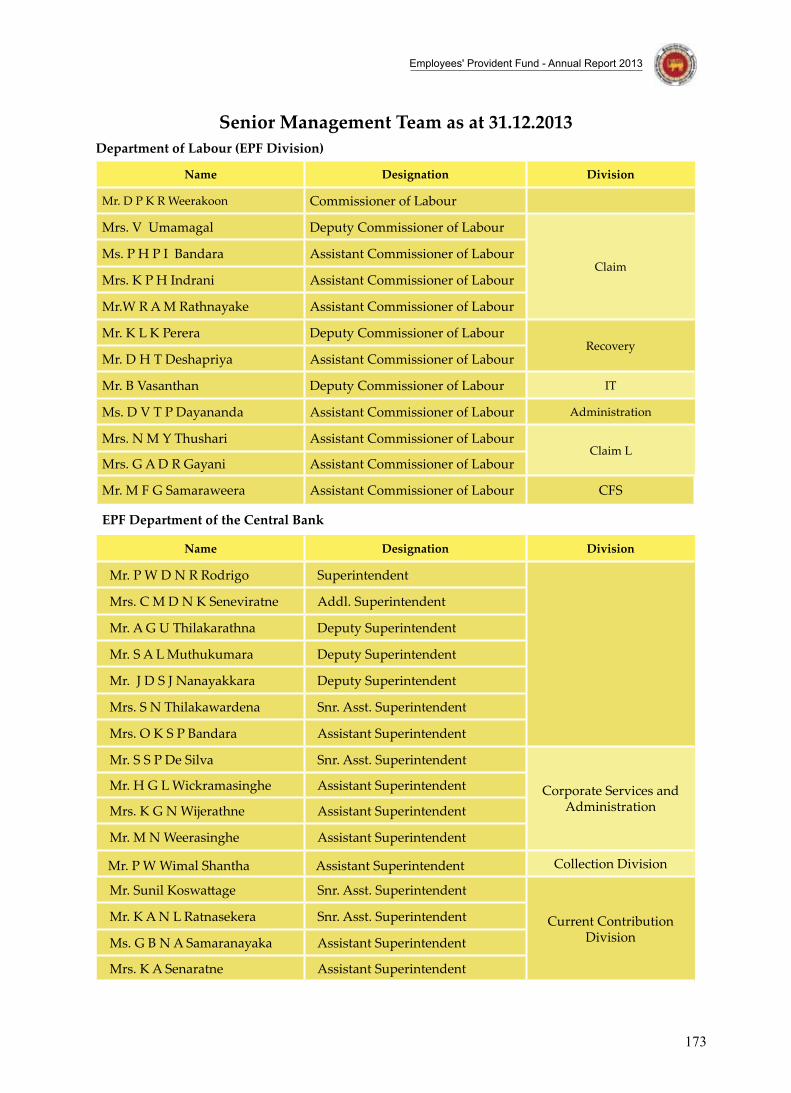
senior Management team as at 31.12.2013department of labour (ePF division)
name designation division
Mr. D P K R Weerakoon Commissioner of Labour
Mrs. V Umamagal Deputy Commissioner of Labour
ClaimMs. P H P I Bandara Assistant Commissioner of Labour
Mrs. K P H Indrani Assistant Commissioner of Labour
Mr.W R A M Rathnayake Assistant Commissioner of Labour
Mr. K L K Perera Deputy Commissioner of LabourRecovery
Mr. D H T Deshapriya Assistant Commissioner of Labour
Mr. B Vasanthan Deputy Commissioner of Labour IT
Ms. D V T P Dayananda Assistant Commissioner of Labour Administration
Mrs. N M Y Thushari Assistant Commissioner of LabourClaim L
Mrs. G A D R Gayani Assistant Commissioner of Labour
Mr. M F G Samaraweera Assistant Commissioner of Labour CFS
ePF department of the Central bank
name designation division
Mr. P W D N R Rodrigo Superintendent
Mrs. C M D N K Seneviratne Addl. Superintendent
Mr. A G U Thilakarathna Deputy Superintendent
Mr. S A L Muthukumara Deputy Superintendent
Mr. J D S J Nanayakkara Deputy Superintendent
Mrs. S N Thilakawardena Snr. Asst. Superintendent
Mrs. O K S P Bandara Assistant Superintendent
Mr. S S P De Silva Snr. Asst. Superintendent
Corporate Services and Administration
Mr. H G L Wickramasinghe Assistant Superintendent
Mrs. K G N Wijerathne Assistant Superintendent
Mr. M N Weerasinghe Assistant Superintendent
Mr. P W Wimal Shantha Assistant Superintendent Collection Division
Mr. Sunil Koswattage Snr. Asst. Superintendent
Current Contribution Division
Mr. K A N L Ratnasekera Snr. Asst. Superintendent
Ms. G B N A Samaranayaka Assistant Superintendent
Mrs. K A Senaratne Assistant Superintendent
174
Employees' Provident Fund - Annual Report 2013
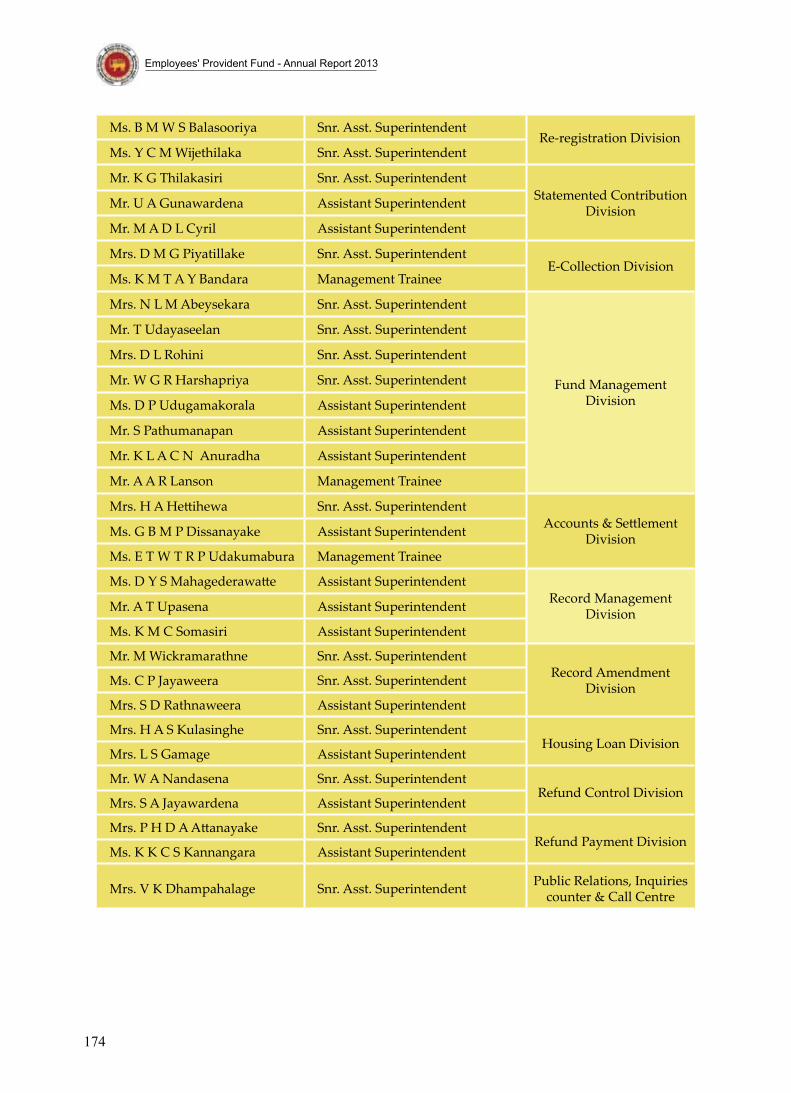
Ms. B M W S Balasooriya Snr. Asst. SuperintendentRe-registration Division
Ms. Y C M Wijethilaka Snr. Asst. Superintendent
Mr. K G Thilakasiri Snr. Asst. SuperintendentStatemented Contribution
DivisionMr. U A Gunawardena Assistant Superintendent
Mr. M A D L Cyril Assistant Superintendent
Mrs. D M G Piyatillake Snr. Asst. SuperintendentE-Collection Division
Ms. K M T A Y Bandara Management Trainee
Mrs. N L M Abeysekara Snr. Asst. Superintendent
Fund Management Division
Mr. T Udayaseelan Snr. Asst. Superintendent
Mrs. D L Rohini Snr. Asst. Superintendent
Mr. W G R Harshapriya Snr. Asst. Superintendent
Ms. D P Udugamakorala Assistant Superintendent
Mr. S Pathumanapan Assistant Superintendent
Mr. K L A C N Anuradha Assistant Superintendent
Mr. A A R Lanson Management Trainee
Mrs. H A Hettihewa Snr. Asst. SuperintendentAccounts & Settlement
DivisionMs. G B M P Dissanayake Assistant Superintendent
Ms. E T W T R P Udakumabura Management Trainee
Ms. D Y S Mahagederawatte Assistant SuperintendentRecord Management
DivisionMr. A T Upasena Assistant Superintendent
Ms. K M C Somasiri Assistant Superintendent
Mr. M Wickramarathne Snr. Asst. SuperintendentRecord Amendment
DivisionMs. C P Jayaweera Snr. Asst. Superintendent
Mrs. S D Rathnaweera Assistant Superintendent
Mrs. H A S Kulasinghe Snr. Asst. SuperintendentHousing Loan Division
Mrs. L S Gamage Assistant Superintendent
Mr. W A Nandasena Snr. Asst. SuperintendentRefund Control Division
Mrs. S A Jayawardena Assistant Superintendent
Mrs. P H D A Attanayake Snr. Asst. SuperintendentRefund Payment Division
Ms. K K C S Kannangara Assistant Superintendent
Mrs. V K Dhampahalage Snr. Asst. Superintendent Public Relations, Inquiries counter & Call Centre
175
Employees' Provident Fund - Annual Report 2013
1 . Review of the Economy 2013
1.1 economic growth
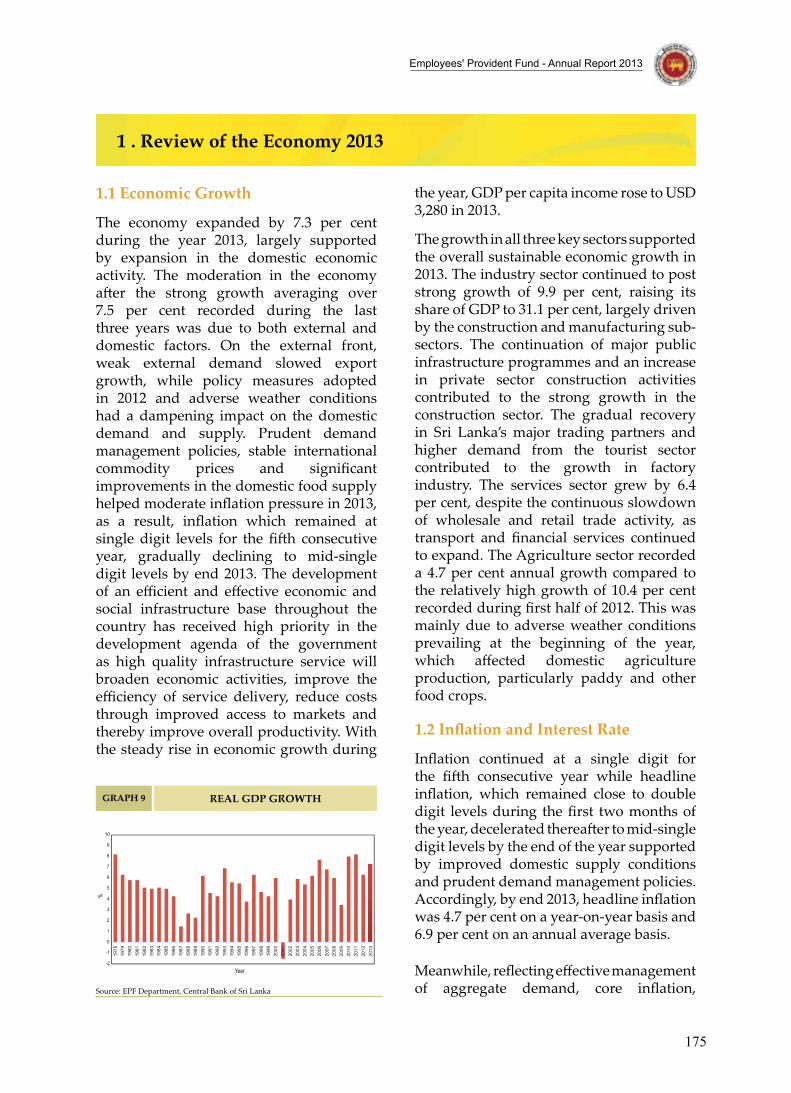
The economy expanded by 7.3 per cent during the year 2013, largely supported by expansion in the domestic economic activity. The moderation in the economy after the strong growth averaging over 7.5 per cent recorded during the last three years was due to both external and domestic factors. On the external front, weak external demand slowed export growth, while policy measures adopted in 2012 and adverse weather conditions had a dampening impact on the domestic demand and supply. Prudent demand management policies, stable international commodity prices and significant improvements in the domestic food supply helped moderate inflation pressure in 2013, as a result, inflation which remained at single digit levels for the fifth consecutive year, gradually declining to mid-single digit levels by end 2013. The development of an efficient and effective economic and social infrastructure base throughout the country has received high priority in the development agenda of the government as high quality infrastructure service will broaden economic activities, improve the efficiency of service delivery, reduce costs through improved access to markets and thereby improve overall productivity. With the steady rise in economic growth during
the year, GDP per capita income rose to USD 3,280 in 2013.
The growth in all three key sectors supported the overall sustainable economic growth in 2013. The industry sector continued to post strong growth of 9.9 per cent, raising its share of GDP to 31.1 per cent, largely driven by the construction and manufacturing sub-sectors. The continuation of major public infrastructure programmes and an increase in private sector construction activities contributed to the strong growth in the construction sector. The gradual recovery in Sri Lanka’s major trading partners and higher demand from the tourist sector contributed to the growth in factory industry. The services sector grew by 6.4 per cent, despite the continuous slowdown of wholesale and retail trade activity, as transport and financial services continued to expand. The Agriculture sector recorded a 4.7 per cent annual growth compared to the relatively high growth of 10.4 per cent recorded during first half of 2012. This was mainly due to adverse weather conditions prevailing at the beginning of the year, which affected domestic agriculture production, particularly paddy and other food crops.
1.2 Inflation and Interest Rate
Inflation continued at a single digit for the fifth consecutive year while headline inflation, which remained close to double digit levels during the first two months of the year, decelerated thereafter to mid-single digit levels by the end of the year supported by improved domestic supply conditions and prudent demand management policies. Accordingly, by end 2013, headline inflation was 4.7 per cent on a year-on-year basis and 6.9 per cent on an annual average basis.
Meanwhile, reflecting effective management of aggregate demand, core inflation,
graPH 9 real gdP groWtH
-2
-1
0
1
2
3
4
5
6
7
8
9
10
1978
1979
1980
1981
1982
1983
1984
1985
1986
1987
1988
1989
1990
1991
1992
1993
1994
1995
1996
1997
1998
1999
2000
2001
2002
2003
2004
2005
2006
2007
2008
2009
2010
2011
2012
2013
%
Year
Source: EPF Department, Central Bank of Sri Lanka
176
Employees' Provident Fund - Annual Report 2013
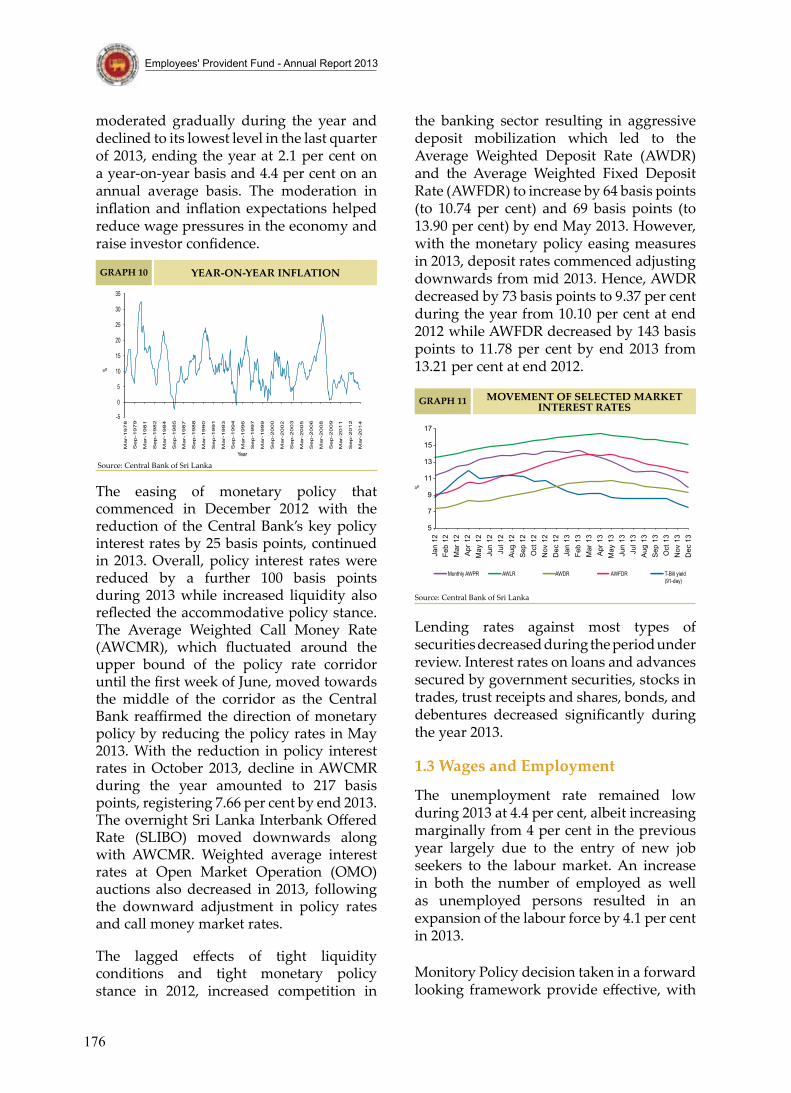
moderated gradually during the year and declined to its lowest level in the last quarter of 2013, ending the year at 2.1 per cent on a year-on-year basis and 4.4 per cent on an annual average basis. The moderation in inflation and inflation expectations helped reduce wage pressures in the economy and raise investor confidence.
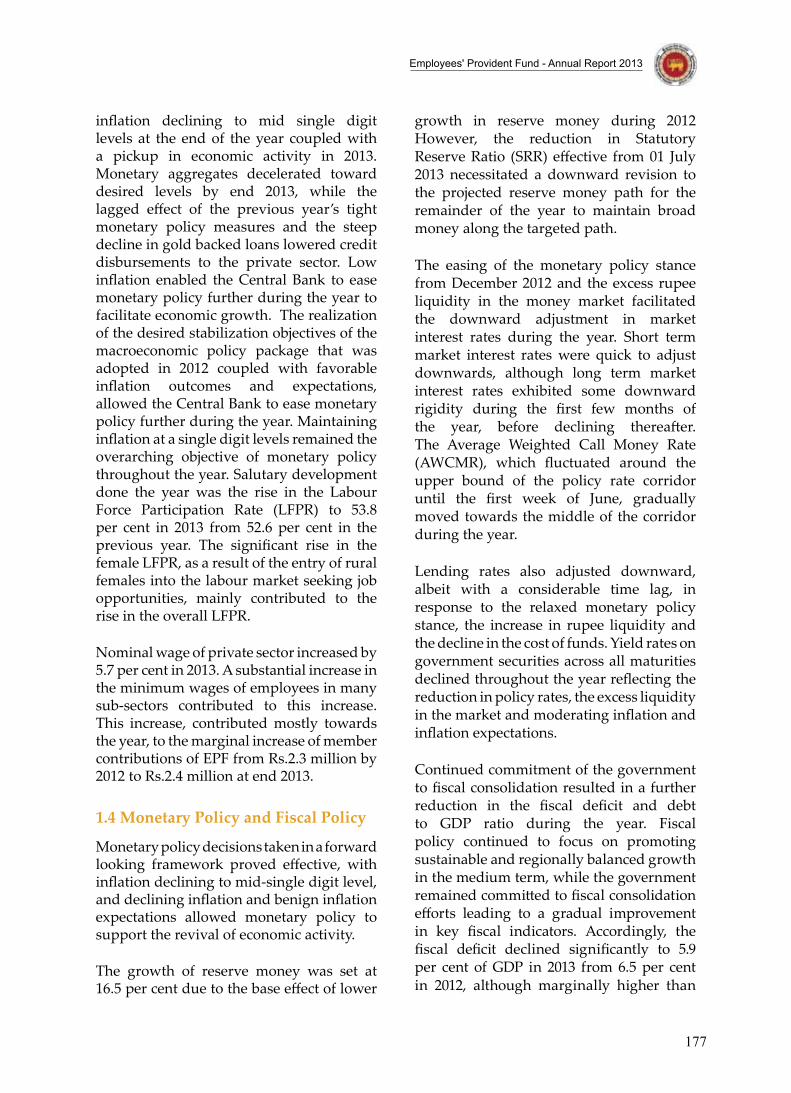
the banking sector resulting in aggressive deposit mobilization which led to the Average Weighted Deposit Rate (AWDR) and the Average Weighted Fixed Deposit Rate (AWFDR) to increase by 64 basis points (to 10.74 per cent) and 69 basis points (to 13.90 per cent) by end May 2013. However, with the monetary policy easing measures in 2013, deposit rates commenced adjusting downwards from mid 2013. Hence, AWDR decreased by 73 basis points to 9.37 per cent during the year from 10.10 per cent at end 2012 while AWFDR decreased by 143 basis points to 11.78 per cent by end 2013 from 13.21 per cent at end 2012.
year-on-year inFlationgraPH 10
-5
0
5
10
15
20
25
30
35
Mar-
1978
Sep-1
979
Mar-
1981
Sep-1
982
Mar-
1984
Sep-1
985
Mar-
1987
Sep-1
988
Mar-
1990
Sep-1
991
Mar-
1993
Sep-1
994
Mar-
1996
Sep-1
997
Mar-
1999
Sep-2
000
Mar-
2002
Sep-2
003
Mar-
2005
Sep-2
006
Mar-
2008
Sep-2
009
Mar-
2011
Mar-
2014
Sep-2
012
%
Year
Source: Central Bank of Sri Lanka
The easing of monetary policy that commenced in December 2012 with the reduction of the Central Bank’s key policy interest rates by 25 basis points, continued in 2013. Overall, policy interest rates were reduced by a further 100 basis points during 2013 while increased liquidity also reflected the accommodative policy stance. The Average Weighted Call Money Rate (AWCMR), which fluctuated around the upper bound of the policy rate corridor until the first week of June, moved towards the middle of the corridor as the Central Bank reaffirmed the direction of monetary policy by reducing the policy rates in May 2013. With the reduction in policy interest rates in October 2013, decline in AWCMR during the year amounted to 217 basis points, registering 7.66 per cent by end 2013. The overnight Sri Lanka Interbank Offered Rate (SLIBO) moved downwards along with AWCMR. Weighted average interest rates at Open Market Operation (OMO) auctions also decreased in 2013, following the downward adjustment in policy rates and call money market rates.
The lagged effects of tight liquidity conditions and tight monetary policy stance in 2012, increased competition in
Lending rates against most types of securities decreased during the period under review. Interest rates on loans and advances secured by government securities, stocks in trades, trust receipts and shares, bonds, and debentures decreased significantly during the year 2013.
1.3 Wages and employment
The unemployment rate remained low during 2013 at 4.4 per cent, albeit increasing marginally from 4 per cent in the previous year largely due to the entry of new job seekers to the labour market. An increase in both the number of employed as well as unemployed persons resulted in an expansion of the labour force by 4.1 per cent in 2013.
Monitory Policy decision taken in a forward looking framework provide effective, with
5
7
9
11
13
15
17Ja
n 12
Feb
12M
ar 1
2A
pr 1
2M
ay 1
2Ju
n 12
Jul 1
2A
ug 1
2S
ep 1
2O
ct 1
2N
ov 1
2D
ec 1
2Ja
n 13
Feb
13M
ar 1
3A
pr 1
3M
ay 1
3Ju
n 13
Jul 1
3A
ug 1
3S
ep 1
3O
ct 1
3N
ov 1
3D
ec 1
3
MoveMent oF seleCted Market interest ratesgraPH 11
Monthly AWPR AWLR AWDR AWFDR T-Bill yield (91-day)
Source: Central Bank of Sri Lanka
%
177
Employees' Provident Fund - Annual Report 2013
inflation declining to mid single digit levels at the end of the year coupled with a pickup in economic activity in 2013. Monetary aggregates decelerated toward desired levels by end 2013, while the lagged effect of the previous year’s tight monetary policy measures and the steep decline in gold backed loans lowered credit disbursements to the private sector. Low inflation enabled the Central Bank to ease monetary policy further during the year to facilitate economic growth. The realization of the desired stabilization objectives of the macroeconomic policy package that was adopted in 2012 coupled with favorable inflation outcomes and expectations, allowed the Central Bank to ease monetary policy further during the year. Maintaining inflation at a single digit levels remained the overarching objective of monetary policy throughout the year. Salutary development done the year was the rise in the Labour Force Participation Rate (LFPR) to 53.8 per cent in 2013 from 52.6 per cent in the previous year. The significant rise in the female LFPR, as a result of the entry of rural females into the labour market seeking job opportunities, mainly contributed to the rise in the overall LFPR.
Nominal wage of private sector increased by 5.7 per cent in 2013. A substantial increase in the minimum wages of employees in many sub-sectors contributed to this increase. This increase, contributed mostly towards the year, to the marginal increase of member contributions of EPF from Rs.2.3 million by 2012 to Rs.2.4 million at end 2013.
1.4 Monetary Policy and Fiscal Policy
Monetary policy decisions taken in a forward looking framework proved effective, with inflation declining to mid-single digit level, and declining inflation and benign inflation expectations allowed monetary policy to support the revival of economic activity.
The growth of reserve money was set at 16.5 per cent due to the base effect of lower
growth in reserve money during 2012 However, the reduction in Statutory Reserve Ratio (SRR) effective from 01 July 2013 necessitated a downward revision to the projected reserve money path for the remainder of the year to maintain broad money along the targeted path.
The easing of the monetary policy stance from December 2012 and the excess rupee liquidity in the money market facilitated the downward adjustment in market interest rates during the year. Short term market interest rates were quick to adjust downwards, although long term market interest rates exhibited some downward rigidity during the first few months of the year, before declining thereafter. The Average Weighted Call Money Rate (AWCMR), which fluctuated around the upper bound of the policy rate corridor until the first week of June, gradually moved towards the middle of the corridor during the year.
Lending rates also adjusted downward, albeit with a considerable time lag, in response to the relaxed monetary policy stance, the increase in rupee liquidity and the decline in the cost of funds. Yield rates on government securities across all maturities declined throughout the year reflecting the reduction in policy rates, the excess liquidity in the market and moderating inflation and inflation expectations.
Continued commitment of the government to fiscal consolidation resulted in a further reduction in the fiscal deficit and debt to GDP ratio during the year. Fiscal policy continued to focus on promoting sustainable and regionally balanced growth in the medium term, while the government remained committed to fiscal consolidation efforts leading to a gradual improvement in key fiscal indicators. Accordingly, the fiscal deficit declined significantly to 5.9 per cent of GDP in 2013 from 6.5 per cent in 2012, although marginally higher than
178
Employees' Provident Fund - Annual Report 2013
Despite the lower expected revenue collection, rationalization of expenditure enabled the overall fiscal deficit to be maintained at a level closer to the budgetary target, narrowing the government’s resource gap and reducing the government’s financing requirement.
In financing the overall deficit of Rs.516.1 billion during 2013, domestic financing contributed to 76 per cent of the total while foreign financing accounted for the balance 24 per cent. Further, net domestic financing amounted to Rs.392.4 billion compared to the original estimated amount of Rs.359.4 billion while net foreign financing of Rs.123.7 billion compared to the estimated amount of Rs.148 billion in 2013. The government heavily used banking sector as the domestic financing sources reflecting Rs.297 billion in 2013 exceeding the estimated amount of Rs.70 billion targeted for the year and was higher than the sum of Rs.131.5 billion borrowed from the banking sector in 2012. However, non-banking sector borrowings significantly decreased to Rs.95.4 billion compared to original estimated amount of Rs.289.4 billion during 2013 indicating the non-bank borrowings as a share of total domestic borrowing declined 24 per cent in 2013 from 35 per cent in 2012. Although decreasing trend of the contribution of non-banking sector to the reduction of overall budget deficit, still EPF is one of the key institutional investor in non-banking sector because the government increasingly relied on longer term marketable debt instruments to finance the budget deficit during the year and higher participation of those longer tenure instruments was done by EPF in 2013.
1.5 government security Market and yield rates Movements
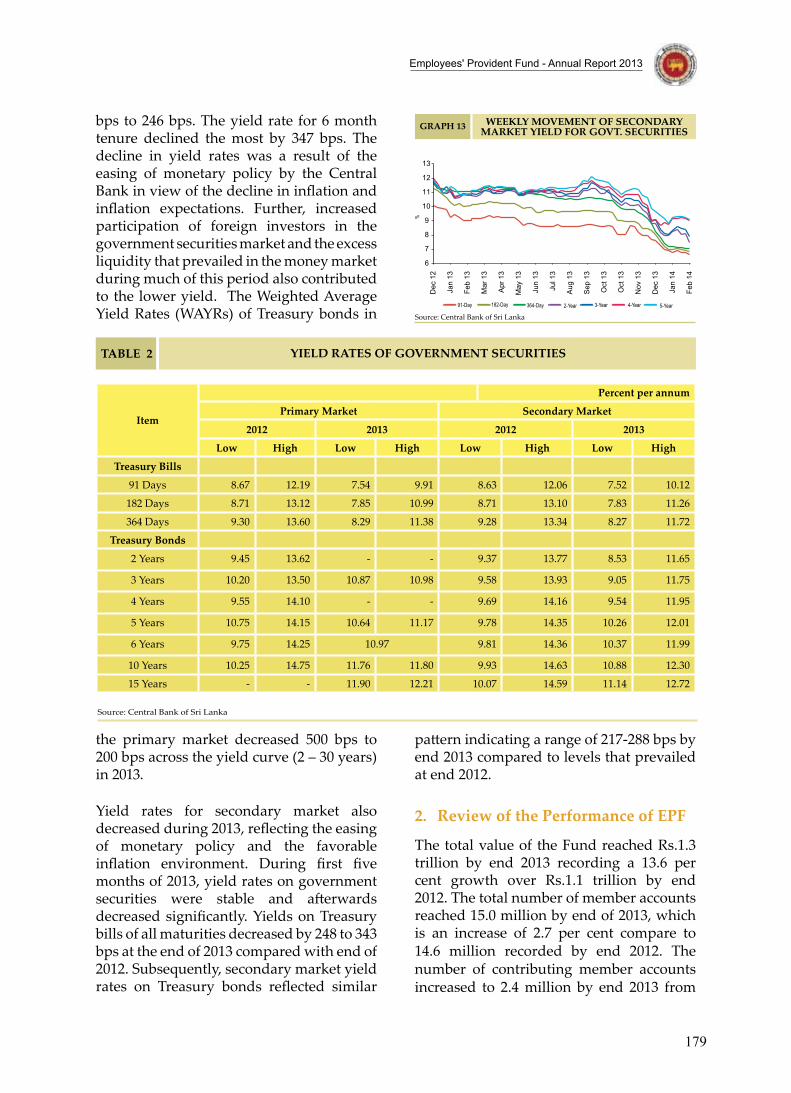
The yield rates in the government securities market declined gradually during the year 2013. Yield rates throughout the yield curve pertaining to government securities (i.e. Treasury bills and Treasury bonds) of 3 months to 20 years declined in a range of 24
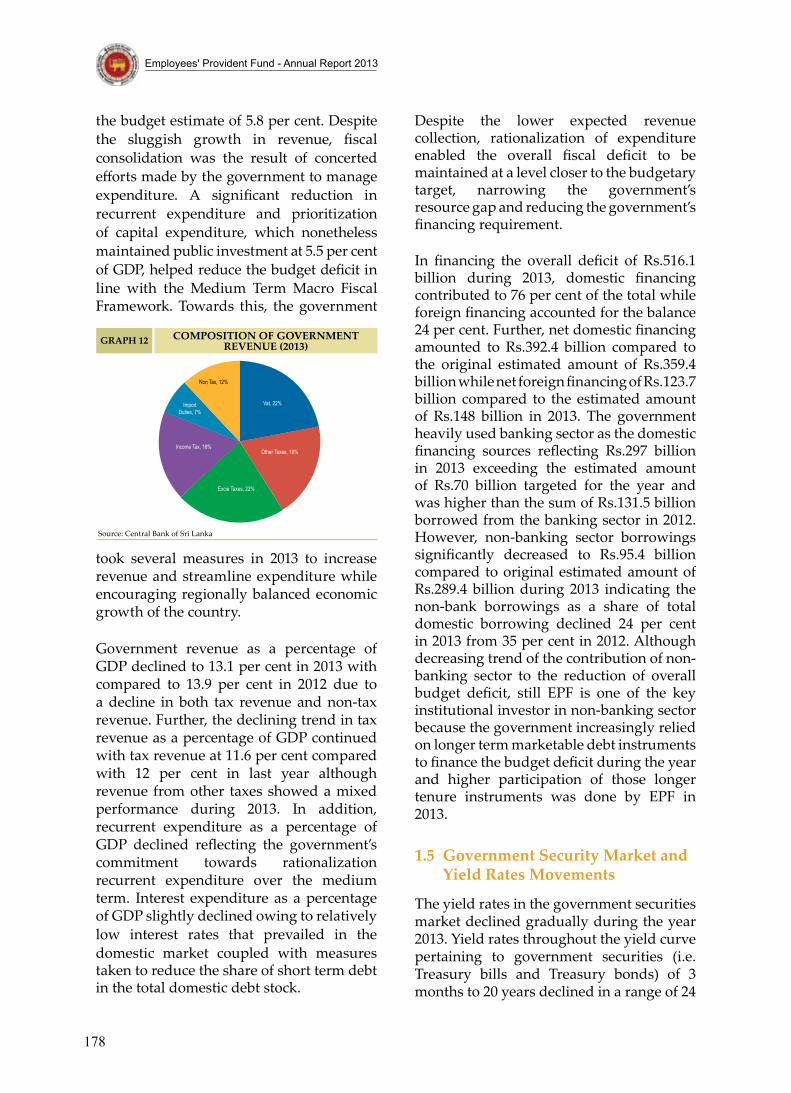
the budget estimate of 5.8 per cent. Despite the sluggish growth in revenue, fiscal consolidation was the result of concerted efforts made by the government to manage expenditure. A significant reduction in recurrent expenditure and prioritization of capital expenditure, which nonetheless maintained public investment at 5.5 per cent of GDP, helped reduce the budget deficit in line with the Medium Term Macro Fiscal Framework. Towards this, the government
CoMPosition oF governMent revenue (2013)graPH 12
Source: Central Bank of Sri Lanka
Non Tax, 12%
Income Tax, 18%Other Taxes, 19%
Excie Taxes, 22%
Vat, 22%Import Duties, 7%
took several measures in 2013 to increase revenue and streamline expenditure while encouraging regionally balanced economic growth of the country.
Government revenue as a percentage of GDP declined to 13.1 per cent in 2013 with compared to 13.9 per cent in 2012 due to a decline in both tax revenue and non-tax revenue. Further, the declining trend in tax revenue as a percentage of GDP continued with tax revenue at 11.6 per cent compared with 12 per cent in last year although revenue from other taxes showed a mixed performance during 2013. In addition, recurrent expenditure as a percentage of GDP declined reflecting the government’s commitment towards rationalization recurrent expenditure over the medium term. Interest expenditure as a percentage of GDP slightly declined owing to relatively low interest rates that prevailed in the domestic market coupled with measures taken to reduce the share of short term debt in the total domestic debt stock.
179
Employees' Provident Fund - Annual Report 2013
6
7
8
9
10
11
12
13
Dec
12
Jan
13
Feb
13
Mar
13
May
13
Apr
13
Jul 1
3
Jun
13
Aug
13
Sep
13
Oct
13
Oct
13
Nov
13
Dec
13
Jan
14
Feb
14
Weekly MoveMent oF seCondary Market yield For govt. seCuritiesgraPH 13
91-Day 182-Day 364-Day 2-Year 3-Year 4-Year 5-Year
%
Source: Central Bank of Sri Lanka
pattern indicating a range of 217-288 bps by end 2013 compared to levels that prevailed at end 2012.
2. review of the Performance of ePF
The total value of the Fund reached Rs.1.3 trillion by end 2013 recording a 13.6 per cent growth over Rs.1.1 trillion by end 2012. The total number of member accounts reached 15.0 million by end of 2013, which is an increase of 2.7 per cent compare to 14.6 million recorded by end 2012. The number of contributing member accounts increased to 2.4 million by end 2013 from
bps to 246 bps. The yield rate for 6 month tenure declined the most by 347 bps. The decline in yield rates was a result of the easing of monetary policy by the Central Bank in view of the decline in inflation and inflation expectations. Further, increased participation of foreign investors in the government securities market and the excess liquidity that prevailed in the money market during much of this period also contributed to the lower yield. The Weighted Average Yield Rates (WAYRs) of Treasury bonds in
table 2 yield rates oF governMent seCurities
item
Percent per annum
Primary Market secondary Market
2012 2013 2012 2013
low High low High low High low High
treasury bills
91 Days 8.67 12.19 7.54 9.91 8.63 12.06 7.52 10.12
182 Days 8.71 13.12 7.85 10.99 8.71 13.10 7.83 11.26
364 Days 9.30 13.60 8.29 11.38 9.28 13.34 8.27 11.72
treasury bonds
2 Years 9.45 13.62 - - 9.37 13.77 8.53 11.65
3 Years 10.20 13.50 10.87 10.98 9.58 13.93 9.05 11.75
4 Years 9.55 14.10 - - 9.69 14.16 9.54 11.95
5 Years 10.75 14.15 10.64 11.17 9.78 14.35 10.26 12.01
6 Years 9.75 14.25 10.97 9.81 14.36 10.37 11.99
10 Years 10.25 14.75 11.76 11.80 9.93 14.63 10.88 12.30
15 Years - - 11.90 12.21 10.07 14.59 11.14 12.72
Source: Central Bank of Sri Lanka
the primary market decreased 500 bps to 200 bps across the yield curve (2 – 30 years) in 2013.
Yield rates for secondary market also decreased during 2013, reflecting the easing of monetary policy and the favorable inflation environment. During first five months of 2013, yield rates on government securities were stable and afterwards decreased significantly. Yields on Treasury bills of all maturities decreased by 248 to 343 bps at the end of 2013 compared with end of 2012. Subsequently, secondary market yield rates on Treasury bonds reflected similar
180
Employees' Provident Fund - Annual Report 2013
2.3 million reported by end 2012 whilst non-contributing member accounts stood at 12.8 million by the end of 2013, compared to 12.3 million by end of 2012. Meanwhile, the number of contributing employers increased by 3.3 per cent to 70,392 by end 2013 from 68,140 reported at end 2012.
2.1 Member Contributions and Payment of Retirement Benefits
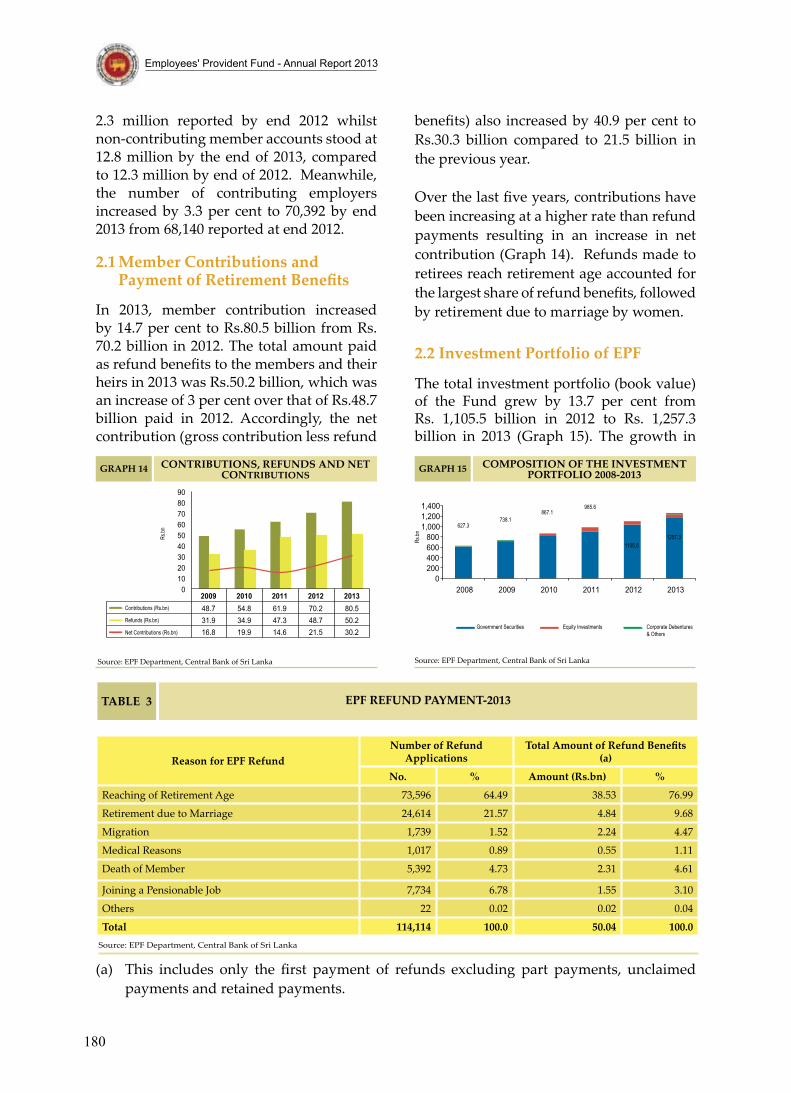
In 2013, member contribution increased by 14.7 per cent to Rs.80.5 billion from Rs. 70.2 billion in 2012. The total amount paid as refund benefits to the members and their heirs in 2013 was Rs.50.2 billion, which was an increase of 3 per cent over that of Rs.48.7 billion paid in 2012. Accordingly, the net contribution (gross contribution less refund
benefits) also increased by 40.9 per cent to Rs.30.3 billion compared to 21.5 billion in the previous year.
Over the last five years, contributions have been increasing at a higher rate than refund payments resulting in an increase in net contribution (Graph 14). Refunds made to retirees reach retirement age accounted for the largest share of refund benefits, followed by retirement due to marriage by women.
2.2 investment Portfolio of ePF
The total investment portfolio (book value) of the Fund grew by 13.7 per cent from Rs. 1,105.5 billion in 2012 to Rs. 1,257.3 billion in 2013 (Graph 15). The growth in
Contributions, reFunds and net Contributions
graPH 14
2009 2010 2011 2012 201348.7 54.8 61.9 70.2 80.531.9 34.9 47.3 48.7 50.216.8 19.9 14.6 21.5 30.2
0102030405060708090
Source: EPF Department, Central Bank of Sri Lanka
Contributions (Rs.bn)
Refunds (Rs.bn)
Net Contributions (Rs.bn)
table 3 ePF reFund PayMent-2013
reason for ePF refundnumber of refund
applicationsTotal Amount of Refund Benefits
(a)
no. % amount (rs.bn) %
Reaching of Retirement Age 73,596 64.49 38.53 76.99
Retirement due to Marriage 24,614 21.57 4.84 9.68
Migration 1,739 1.52 2.24 4.47
Medical Reasons 1,017 0.89 0.55 1.11
Death of Member 5,392 4.73 2.31 4.61
Joining a Pensionable Job 7,734 6.78 1.55 3.10
Others 22 0.02 0.02 0.04
total 114,114 100.0 50.04 100.0Source: EPF Department, Central Bank of Sri Lanka
0200400600800
1,0001,2001,400
2008 2009 2010 2011 2012 2013
CoMPosition oF tHe investMent PortFolio 2008-2013graPH 15
Government Securities Equity Investments Corporate Debentures & Others
Source: EPF Department, Central Bank of Sri Lanka
Rs.bn
Rs.bn
627.3738.1
867.1985.6
1105.51257.3
(a) This includes only the first payment of refunds excluding part payments, unclaimed payments and retained payments.
181
Employees' Provident Fund - Annual Report 2013
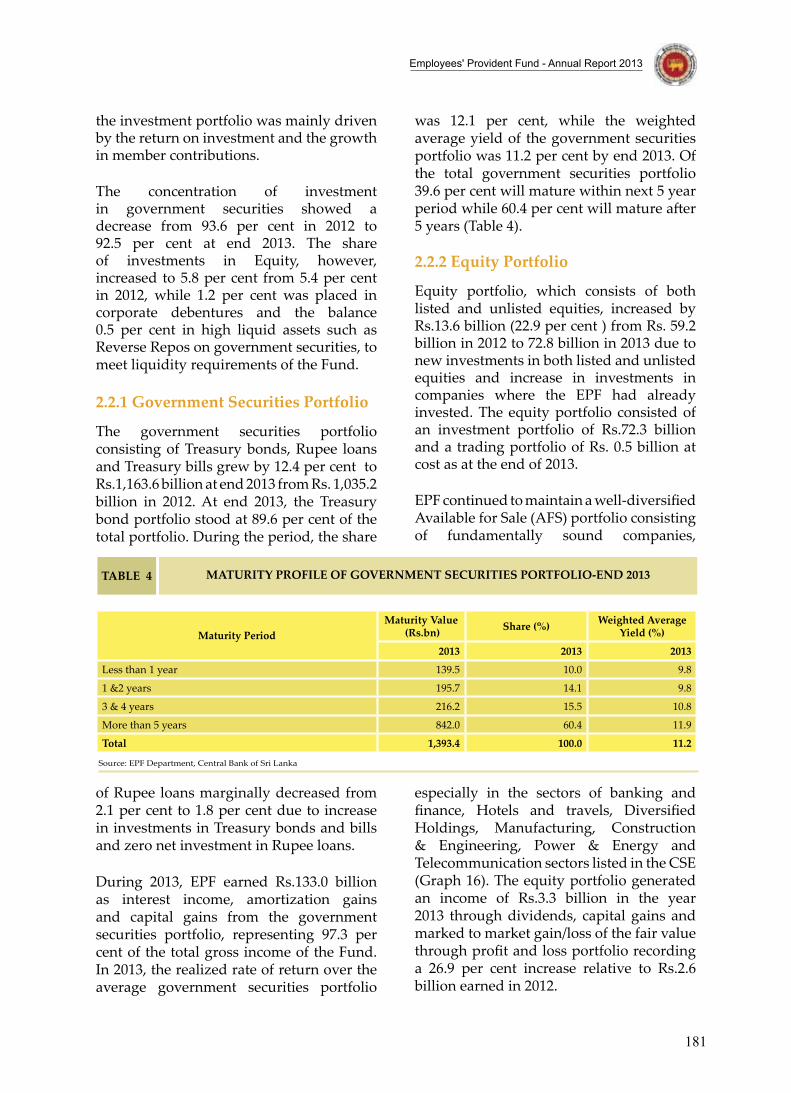
was 12.1 per cent, while the weighted average yield of the government securities portfolio was 11.2 per cent by end 2013. Of the total government securities portfolio 39.6 per cent will mature within next 5 year period while 60.4 per cent will mature after 5 years (Table 4).
2.2.2 equity Portfolio
Equity portfolio, which consists of both listed and unlisted equities, increased by Rs.13.6 billion (22.9 per cent ) from Rs. 59.2 billion in 2012 to 72.8 billion in 2013 due to new investments in both listed and unlisted equities and increase in investments in companies where the EPF had already invested. The equity portfolio consisted of an investment portfolio of Rs.72.3 billion and a trading portfolio of Rs. 0.5 billion at cost as at the end of 2013.
EPF continued to maintain a well-diversified Available for Sale (AFS) portfolio consisting of fundamentally sound companies,
the investment portfolio was mainly driven by the return on investment and the growth in member contributions.
The concentration of investment in government securities showed a decrease from 93.6 per cent in 2012 to 92.5 per cent at end 2013. The share of investments in Equity, however, increased to 5.8 per cent from 5.4 per cent in 2012, while 1.2 per cent was placed in corporate debentures and the balance 0.5 per cent in high liquid assets such as Reverse Repos on government securities, to meet liquidity requirements of the Fund.
2.2.1 government securities Portfolio
The government securities portfolio consisting of Treasury bonds, Rupee loans and Treasury bills grew by 12.4 per cent to Rs.1,163.6 billion at end 2013 from Rs. 1,035.2 billion in 2012. At end 2013, the Treasury bond portfolio stood at 89.6 per cent of the total portfolio. During the period, the share
table 4 Maturity ProFile oF governMent seCurities PortFolio-end 2013
Maturity PeriodMaturity value
(rs.bn) share (%) Weighted average yield (%)
2013 2013 2013
Less than 1 year 139.5 10.0 9.8
1 &2 years 195.7 14.1 9.8
3 & 4 years 216.2 15.5 10.8
More than 5 years 842.0 60.4 11.9
total 1,393.4 100.0 11.2
Source: EPF Department, Central Bank of Sri Lanka
of Rupee loans marginally decreased from 2.1 per cent to 1.8 per cent due to increase in investments in Treasury bonds and bills and zero net investment in Rupee loans.
During 2013, EPF earned Rs.133.0 billion as interest income, amortization gains and capital gains from the government securities portfolio, representing 97.3 per cent of the total gross income of the Fund. In 2013, the realized rate of return over the average government securities portfolio
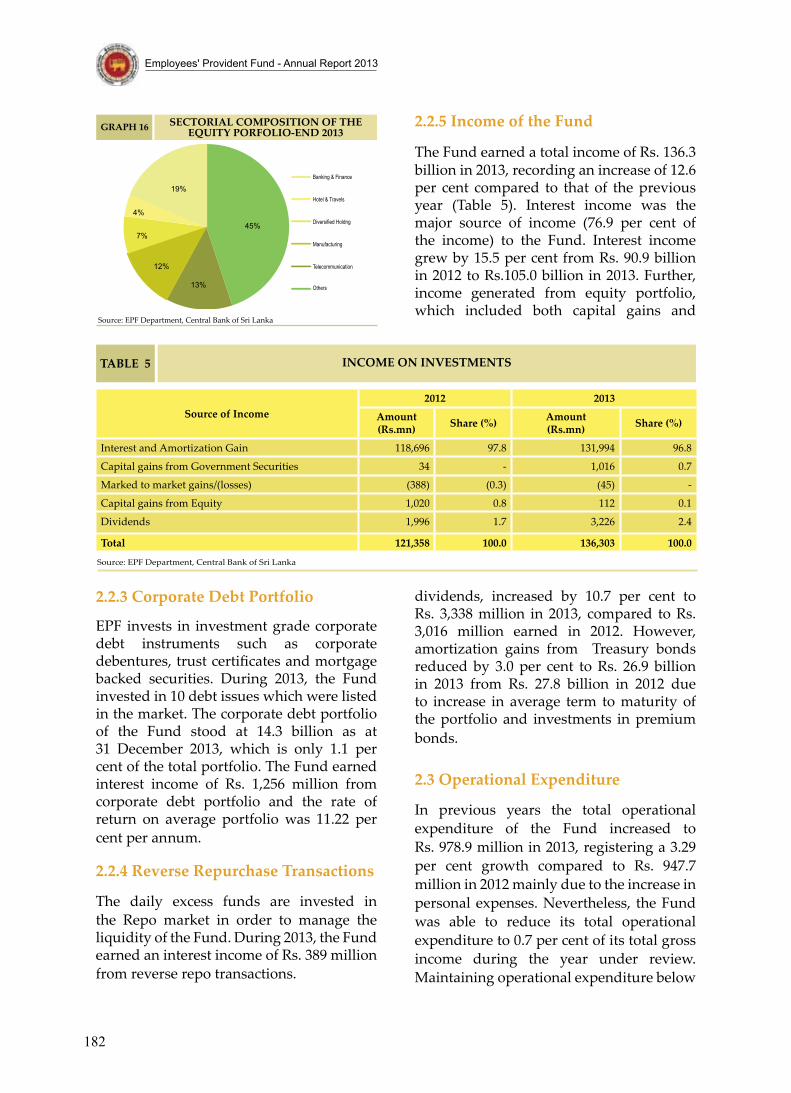
especially in the sectors of banking and finance, Hotels and travels, Diversified Holdings, Manufacturing, Construction & Engineering, Power & Energy and Telecommunication sectors listed in the CSE (Graph 16). The equity portfolio generated an income of Rs.3.3 billion in the year 2013 through dividends, capital gains and marked to market gain/loss of the fair value through profit and loss portfolio recording a 26.9 per cent increase relative to Rs.2.6 billion earned in 2012.
182
Employees' Provident Fund - Annual Report 2013
2.2.5 income of the Fund
The Fund earned a total income of Rs. 136.3 billion in 2013, recording an increase of 12.6 per cent compared to that of the previous year (Table 5). Interest income was the major source of income (76.9 per cent of the income) to the Fund. Interest income grew by 15.5 per cent from Rs. 90.9 billion in 2012 to Rs.105.0 billion in 2013. Further, income generated from equity portfolio, which included both capital gains and
2.2.3 Corporate debt Portfolio
EPF invests in investment grade corporate debt instruments such as corporate debentures, trust certificates and mortgage backed securities. During 2013, the Fund invested in 10 debt issues which were listed in the market. The corporate debt portfolio of the Fund stood at 14.3 billion as at 31 December 2013, which is only 1.1 per cent of the total portfolio. The Fund earned interest income of Rs. 1,256 million from corporate debt portfolio and the rate of return on average portfolio was 11.22 per cent per annum.
2.2.4 reverse repurchase transactions
The daily excess funds are invested in the Repo market in order to manage the liquidity of the Fund. During 2013, the Fund earned an interest income of Rs. 389 million from reverse repo transactions.
seCtorial CoMPosition oF tHe equity PorFolio-end 2013graPH 16
19%
4%
7%
12%
13%
45%
Banking & Finance
Hotel & Travels
Diversified Holdng
Manufacturing
Telecommunication
Others
Source: EPF Department, Central Bank of Sri Lanka
table 5 inCoMe on investMents
source of income2012 2013
amount (rs.mn) share (%) amount
(rs.mn) share (%)
Interest and Amortization Gain 118,696 97.8 131,994 96.8
Capital gains from Government Securities 34 - 1,016 0.7
Marked to market gains/(losses) (388) (0.3) (45) -
Capital gains from Equity 1,020 0.8 112 0.1
Dividends 1,996 1.7 3,226 2.4
total 121,358 100.0 136,303 100.0
Source: EPF Department, Central Bank of Sri Lanka
dividends, increased by 10.7 per cent to Rs. 3,338 million in 2013, compared to Rs. 3,016 million earned in 2012. However, amortization gains from Treasury bonds reduced by 3.0 per cent to Rs. 26.9 billion in 2013 from Rs. 27.8 billion in 2012 due to increase in average term to maturity of the portfolio and investments in premium bonds.
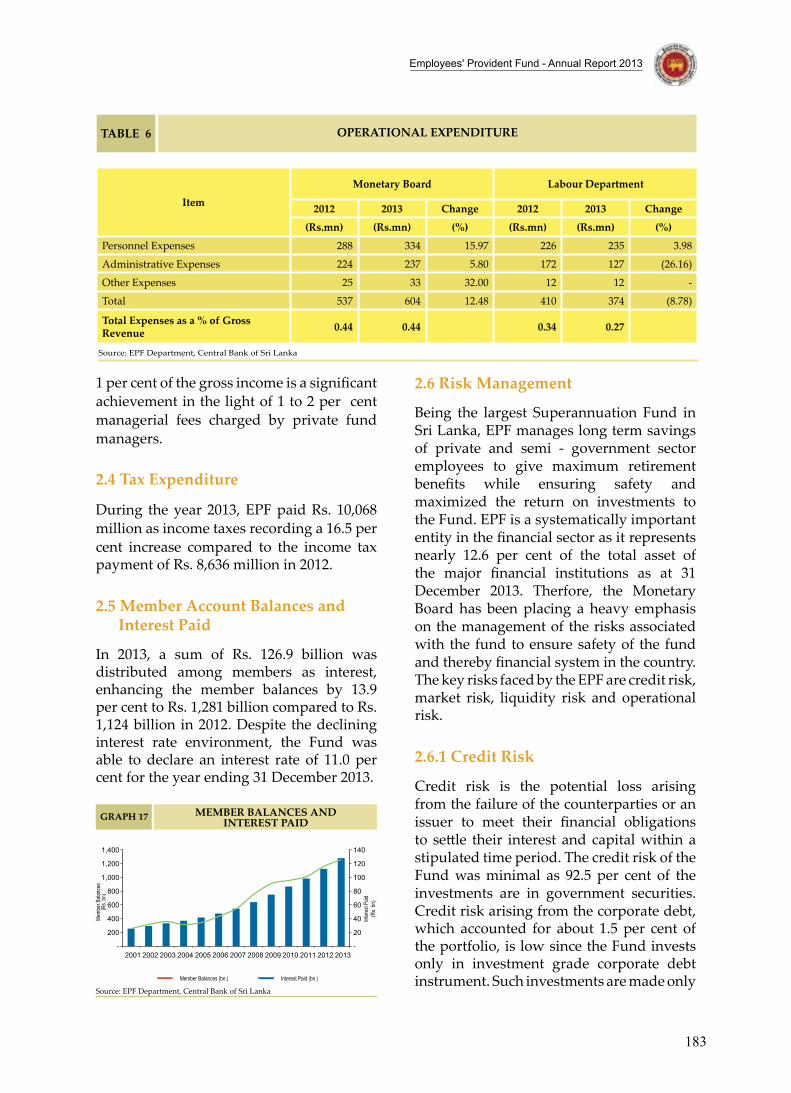
2.3 operational expenditure
In previous years the total operational expenditure of the Fund increased to Rs. 978.9 million in 2013, registering a 3.29 per cent growth compared to Rs. 947.7 million in 2012 mainly due to the increase in personal expenses. Nevertheless, the Fund was able to reduce its total operational expenditure to 0.7 per cent of its total gross income during the year under review. Maintaining operational expenditure below
183
Employees' Provident Fund - Annual Report 2013
table 6 oPerational exPenditure
item
Monetary board labour department
2012 2013 Change 2012 2013 Change
(rs.mn) (rs.mn) (%) (rs.mn) (rs.mn) (%)
Personnel Expenses 288 334 15.97 226 235 3.98
Administrative Expenses 224 237 5.80 172 127 (26.16)
Other Expenses 25 33 32.00 12 12 -
Total 537 604 12.48 410 374 (8.78)
total expenses as a % of gross revenue 0.44 0.44 0.34 0.27
Source: EPF Department, Central Bank of Sri Lanka
1 per cent of the gross income is a significant achievement in the light of 1 to 2 per cent managerial fees charged by private fund managers.
2.4 tax expenditure
During the year 2013, EPF paid Rs. 10,068 million as income taxes recording a 16.5 per cent increase compared to the income tax payment of Rs. 8,636 million in 2012.
2.5 Member account balances and interest Paid
In 2013, a sum of Rs. 126.9 billion was distributed among members as interest, enhancing the member balances by 13.9 per cent to Rs. 1,281 billion compared to Rs. 1,124 billion in 2012. Despite the declining interest rate environment, the Fund was able to declare an interest rate of 11.0 per cent for the year ending 31 December 2013.
2.6 risk Management
Being the largest Superannuation Fund in Sri Lanka, EPF manages long term savings of private and semi - government sector employees to give maximum retirement benefits while ensuring safety and maximized the return on investments to the Fund. EPF is a systematically important entity in the financial sector as it represents nearly 12.6 per cent of the total asset of the major financial institutions as at 31 December 2013. Therfore, the Monetary Board has been placing a heavy emphasis on the management of the risks associated with the fund to ensure safety of the fund and thereby financial system in the country. The key risks faced by the EPF are credit risk, market risk, liquidity risk and operational risk.
2.6.1 Credit risk
Credit risk is the potential loss arising from the failure of the counterparties or an issuer to meet their financial obligations to settle their interest and capital within a stipulated time period. The credit risk of the Fund was minimal as 92.5 per cent of the investments are in government securities. Credit risk arising from the corporate debt, which accounted for about 1.5 per cent of the portfolio, is low since the Fund invests only in investment grade corporate debt instrument. Such investments are made only
-
20
40
60
80
100
120
140
-
200
400
600
800
1,000
1,200
1,400
2001 2002 2003 2004 2005 2006 2007 2008 2009 2010 2011 2012 2013
MeMber balanCes and interest PaidgraPH 17
Member Balances (bn.) Interest Paid (bn.)
Source: EPF Department, Central Bank of Sri Lanka
Memb
er Ba
lance
s (R
s. bn
)
Intere
st Pa
id (R
s. bn
)
184
Employees' Provident Fund - Annual Report 2013
after a thorough analysis is done by taking the risk and return in to consideration. In addition, all reverse Repo investment which assumed about 0.5 per cent of the fund has been collateralized by adequate government securities. Therefore the credit risk of EPF was at a very low level.
2.6.2 Market risk
Market risk is the risk arising from changes in market prices such as interest rates, equity prices and exchange rates. At present, the market risks faced by the fund are two of fold: i.e. interest rate risk and equity price risk. When the market interest rates increase, the value of the Treasury bond trading portfolio deteriorates and when the interest rates decrease, the fund will have to invest at low interest rates. However, this risk has been managed periodically by selecting Treasury bonds of different maturity and yields appropriately and by limiting the size of the trading portfolio.
The equity price risk faced by the fund is the reduction in the value of the equity portfolio due to the decline in the share prices. This risk has been mitigated by setting upper limits on equity portfolio, diversifying equity portfolio into different sectors such as, banking, finance and insurance, diversified holdings, hotel and travels, construction and engineering, manufacturing and telecommunication, and by making investment after a careful analysis of all factors. Further, the market risk on equity portfolio is relatively low since exposure of equity is only 5.8 per cent of the total portfolio of the Fund.
2.6.3 liquidity risk
Liquidity risk is the risk arising from the inability to meet financial obligations as and when they fall due. The net contributions (approximately Rs. 2.3 bn) of the Fund is positive in each month resulting in minimized liquidity risk to the Fund. With the other cash flows such as income
and maturity proceeds, the annual refund payment as a percentage of total cash inflows was 5.9 per cent by end of 2013. In addition, availability of a high liquid government securities portfolio provides an additional buffer against any liquidity constraint. As a daily liquidity management tool, EPF invests in the over night Repo market to maintain adequate funds on a daily basis while earning a reasonable return. Therefore, liquidity risk of the Fund is also very minimal.
2.6.4 operational risk
Operational risk is the risk of a change in value caused by the fact that actual losses, incurred from inadequate or failed internal processes, people and systems, or from external events (including legal risk), differ from the expected losses. Main sources of operational risks of the fund include IT related risk, risk arising from human errors and intervention and natural disasters. In order to mitigate these risks, the Fund has put in place a sound operational risk management process. Operational activities are audited by an independent internal auditor and audit findings are discussed on a monthly basis to rectify weaknesses and deviations found immediately. Furthermore, the AS 400 computer system that adds EPF data maintains an online real time backup system which enables the Fund to carry out its functions without any disruption. In addition, the Business Continuity Plan (BCP) and the Disaster Recovery Sites (DRS) are tested every year by conducting operations from the DR Sites to ensure the smooth functioning of the operations due to any unforeseen event.
Other mechanisms deployed to mitigate operational risks include authority level for transactions, availability of operational manuals, restriction of access to information through pass words protection, maintaining of a separate risk management unit and an operational risk register.
2.7 Housing loan Facility
185
Employees' Provident Fund - Annual Report 2013
all provinces. More than 46 per cent of the employers registered during the year 2013, were from the Western province while the Northern and the Eastern provinces accounted for 10 per cent of the total employer registrations.
As per the provisions of the Act, the Department of Labour is empowered to take legal action against employers who do not pay member contributions. Accordingly, district labour offices and sub labour offices had sent 12,807 first notices and 8,411 red notices claiming Rs. 5,100 million and Rs. 6,132 million, respectively. Further, Rs. 2,442 million has been recovered by the Department of Labour by filing legal cases against 2,744 institutions which had failed to settle the arrears within 28 days after receiving the red notices.
2.9 re registration of ePF members
With the intention of providing an efficient service to EPF members in 2008, EPF Department and the Department of Labour launched a special project to re-register EPF members by names as appearing in their National Identity Card (NIC) and assign NIC number as the Unique Identification (UID) number. This enables both institutions to use a common Member Centric Database (MCD).
By end 2013, NIC details of approximately 1.4 million active EPF members (contributing members) had been collected. Of these, 79 per cent of the member accounts (1.1 million accounts) were assigned UIDs, while the details of the remaining members are being processed by obtaining verification from their employers on discrepancies between collected data and the existing data.
Registering of new EPF members under NIC details on real time basis commenced in November 2010. Accordingly, a monthly monitoring system has been put in place to capture NIC details of all new members to whom member contributions are received by EPF for the first time in each month.
Source: EPF Department, Central Bank of Sri Lanka
Year Certificates Issued (No)
Credit Approved by EPF (Rs.Mn)
Amount Remitted to Lending Institutions
(Rs.Mn)
2004 14,307 2,452 735
2005 14,600 2,766 900
2006 15,136 3,049 1,078
2007 12,969 2,872 1,240
2008 12,519 3,008 1,192
2009 10,383 2,680 1,552
2010 13,848 4,512 2,093
2011 20,041 6,355 1,896
2012 11,234 3,973 2,019
2013 16,268 6,914 2,178
Total 141,305 38,581 14,883
Housing loan FaCilitytable 7
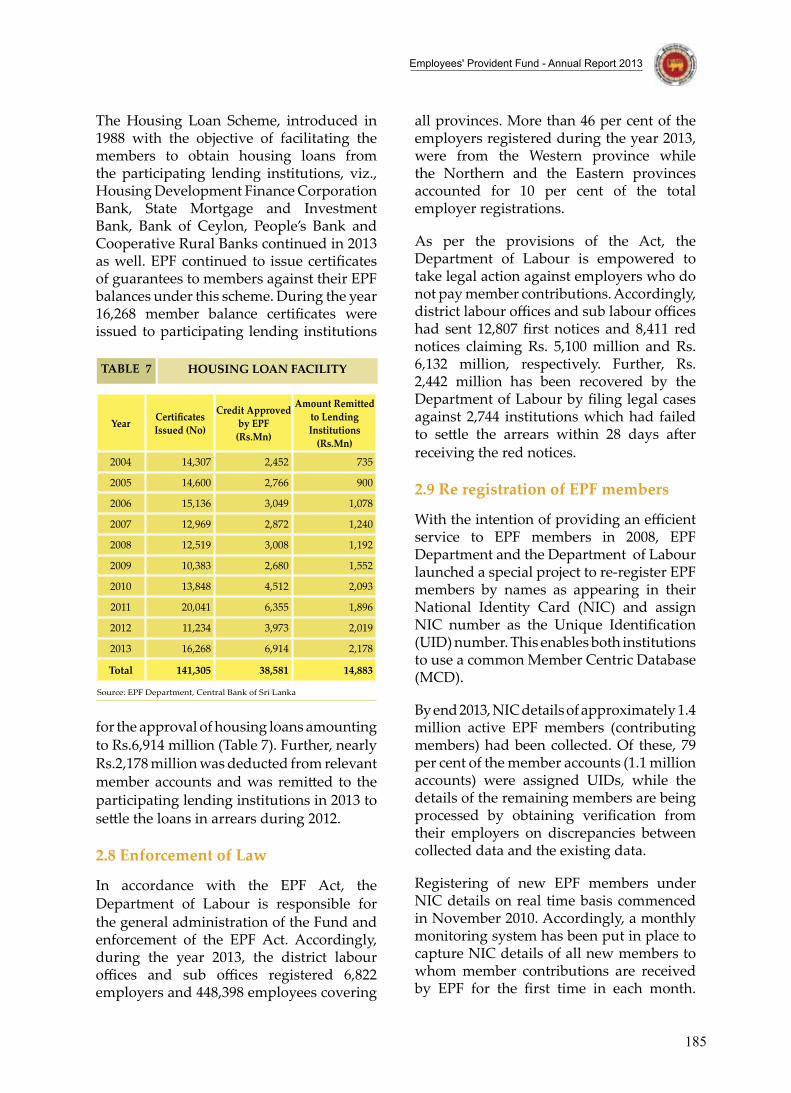
The Housing Loan Scheme, introduced in 1988 with the objective of facilitating the members to obtain housing loans from the participating lending institutions, viz., Housing Development Finance Corporation Bank, State Mortgage and Investment Bank, Bank of Ceylon, People’s Bank and Cooperative Rural Banks continued in 2013 as well. EPF continued to issue certificates of guarantees to members against their EPF balances under this scheme. During the year 16,268 member balance certificates were issued to participating lending institutions
for the approval of housing loans amounting to Rs.6,914 million (Table 7). Further, nearly Rs.2,178 million was deducted from relevant member accounts and was remitted to the participating lending institutions in 2013 to settle the loans in arrears during 2012.
2.8 enforcement of law
In accordance with the EPF Act, the Department of Labour is responsible for the general administration of the Fund and enforcement of the EPF Act. Accordingly, during the year 2013, the district labour offices and sub offices registered 6,822 employers and 448,398 employees covering
186
Employees' Provident Fund - Annual Report 2013
In 2013, 130,000 such new members were registered and the New Members Registry (NMR) was updated accordingly.
Linking of previous member accounts of active members to UID too was continued during the year. This facility enables members to access and view their multiple accounts by providing their NIC numbers through the internet and Short Messaging System (SMS). 565 employees’ accounts had been linked by end 2013.
In 2013, EPF opened a new window to offer a facility for inactive members as well to re-register under NIC.
2.10 e-return system for ePF Payments
EPF Department has taken several initiatives step by step, on e-Return system to encourage employers to submit member contribution details electronically (e-Returns) as a replacement for the manual payment system (C and C3 returns). Submission of e-Returns, a total paperless solution, minimizes the cost and delays and enhances the efficiency of the operation and enables EPF to provide a better service to the members. Further, availability of an online system to make EPF contributions together with details of contributions also helped in improving the Doing Business ranking of the country, which is crucial for attracting foreign investments to the country. The e-Return system had been in operation on a voluntary basis until 2012. In 2012, legal provisions had been incorporated to EPF Act as an amendment to the Act No. 2 of 2012 to make this system mandatory for employers. The regulations on the amendments were gazetted in May 2013.
EPF Department took steps to obtain services from licensed commercial banks by appointing them as collecting agents under this scheme. Accordingly, Commercial Bank of Ceylon PLC and Bank of Ceylon introduced electronic payment facilities to their customers with effect from October
2011 and September 2012, respectively. In 2013, People’s Bank, Sampath Bank PLC and Hatton National Bank PLC introduced their systems and joined as collecting agents with EPF to provide this value added service to their customers whose employers are contributing to the fund. Thus, a number of other commercial banks too are in the process of preparing the required IT systems to provide a similar service for their customers. By end 2013, 1,868 employers had registered to send member contribution details and payments online. This facility, which currently covers 40 per cent of total Rs. 2.4 million active members, enables EPF to update member accounts on receipts of contributions immediately and accurately.
Further, Direct Debit Payment Scheme has also been introduced for employers enabling them to transfer the monthly contribution directly from their bank to EPF’s bank account while sending contribution details through e-mail directly to EPF. EPF Department conducted 19 awareness campaigns and workshops on the e-Return system for employers and officers of the Department of Labour during 2013. As a result, registered number of employers with the system has increased to 1,868 by end 2013 from 1,385 as at end 2012.
2.11 the image scanning Project (isP)
ISP was initiated to meet one of the strategic objectives of providing an efficient and effective service to members and other EPF stakeholders by converting the existing paper-based EPF system to a near paperless system. ISP is expected to improve the operational efficiency of the Department by minimising the time, space, cost and human resources involved in handling paper work.The project is expected to be carried out in four phases.
(i) Conversion of existing documents into electronic form. The task was awarded to a service provider and the contract agreement
187
Employees' Provident Fund - Annual Report 2013
was signed on 29 July 2013. According to the scheduled time plan, scanning of existing documents such as Master Files (MFs), Form D (Employer registration form) and Re-registration documents are expected to be completed by end 2014.(ii) Real Time Scanning of Documents. The scanning of documents at the point of receipt to eliminate accumulation of paper documents will commence within the second quarter of 2014. In 2013, EPF Department was in the process of developing the Software Requirement Specification to customise the software to meet the requirements of the Department.(iii) Establishment of the e-Record room. Hardware to establish the e-Record room was procured in March 2014.(iv) Linking of the Document Management System with the existing EPF computer system. This phase will be carried out in collaboration with the IT Department after the completion of the three major phases described above.
2.12 Public awarenessConducting awareness programmes and mobile services on e-Return system, member re-registration and other member related services were major activities of the Department in 2013. Nine awareness programmes and mobile services were conducted targeting different categories of stakeholders such as members, employers, job market entrants, labour officials, rural bank officials and general public. All these awareness programmes were focused to cover entities, which are having a large
member base. Mobile services were held at MAS Intimates-Thulhiriya, Municipal Council-Sri Jayawardenapura Kotte, Deyata Kirula Exhibition-Ampara, Medical & Communal Hospitality Day-Moratuwa, Crystal Martin (Pvt) Ltd - Galagedera, National Namunukula Plantations PLC Uva Range - Battaramulla. EPF Collaborated with other organisations such as the Department of Labour, Department of Registration of Persons, Registrar General’s Department and Police Department. Following services were provided to the members.(i) Issuing of EPF balance statements to members(ii) Amendment of member accounts(iii) Re-registration of members (iv) Promoting registration for online member services such as SMS and Internet facilities(v) Counseling for members(vi) Issuing applications for EPF members to obtain NICs by officers of Department of Registration of Persons(vii) Issuing applications for EPF members to obtain Birth Certificates/Presumptive Age certificates by Officers of Registrar General’s Department
In addition, Public Relations and Inquiries Counter (PR & IC) and the Help Desk of EPF too were engaged in educating the members on EPF procedures, over the counters, through email, letters, faxes and telephones. During the year 2013, PR & IC and Help Desk have responded to 222,498 member inquiries of which 118,380 members have been served over the counter, 76,916 telephone inquiries were responded, 16,057 e-mails, 10,185 letters and 960 faxes have been replied.
188
Employees' Provident Fund - Annual Report 2013
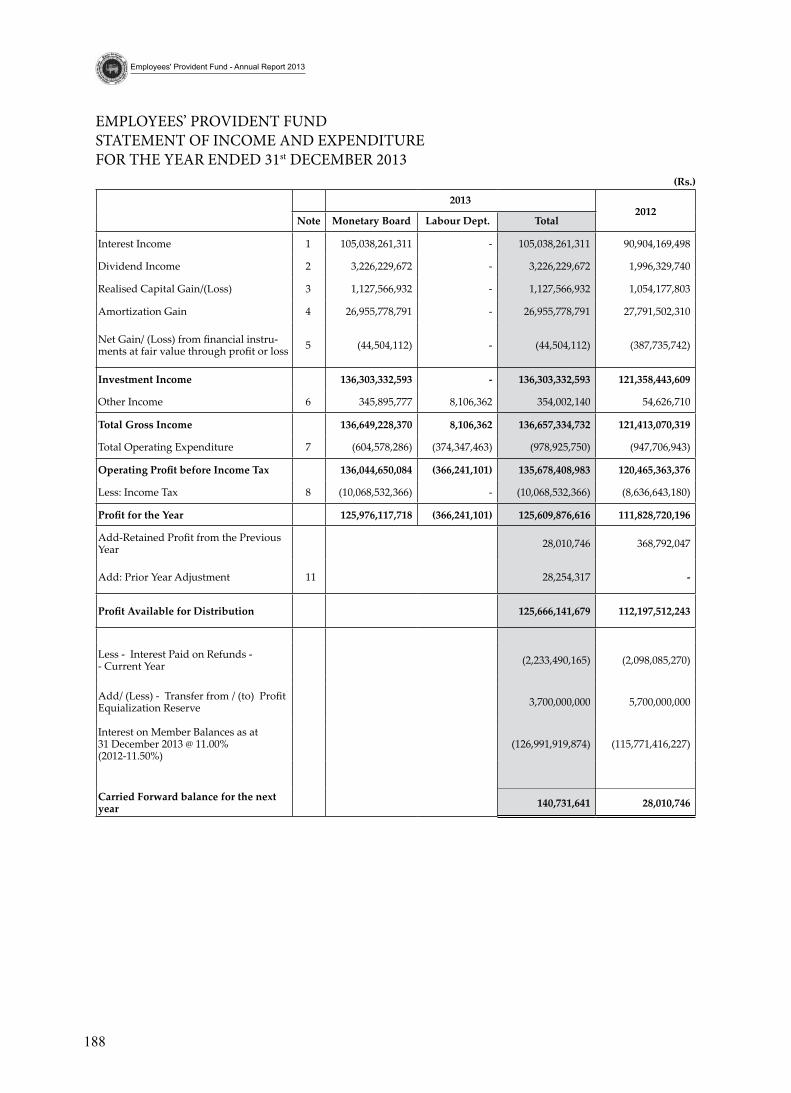
EMPLOYEES’ PROVIDENT FUND STATEMENT OF INCOME AND EXPENDITURE FOR THE YEAR ENDED 31st DECEMBER 2013
20132012
Note Monetary Board Labour Dept. Total
Interest Income 1 105,038,261,311 - 105,038,261,311 90,904,169,498
Dividend Income 2 3,226,229,672 - 3,226,229,672 1,996,329,740
Realised Capital Gain/(Loss) 3 1,127,566,932 - 1,127,566,932 1,054,177,803
Amortization Gain 4 26,955,778,791 - 26,955,778,791 27,791,502,310
Net Gain/ (Loss) from financial instru-ments at fair value through profit or loss 5 (44,504,112) - (44,504,112) (387,735,742)
investment income 136,303,332,593 - 136,303,332,593 121,358,443,609
Other Income 6 345,895,777 8,106,362 354,002,140 54,626,710
total gross income 136,649,228,370 8,106,362 136,657,334,732 121,413,070,319
Total Operating Expenditure 7 (604,578,286) (374,347,463) (978,925,750) (947,706,943)
Operating Profit before Income Tax 136,044,650,084 (366,241,101) 135,678,408,983 120,465,363,376
Less: Income Tax 8 (10,068,532,366) - (10,068,532,366) (8,636,643,180)
Profit for the Year 125,976,117,718 (366,241,101) 125,609,876,616 111,828,720,196
Add-Retained Profit from the Previous Year 28,010,746 368,792,047
Add: Prior Year Adjustment 11 28,254,317 -
Profit Available for Distribution 125,666,141,679 112,197,512,243
Less - Interest Paid on Refunds - - Current Year (2,233,490,165) (2,098,085,270)
Add/ (Less) - Transfer from / (to) Profit Equialization Reserve 3,700,000,000 5,700,000,000
Interest on Member Balances as at 31 December 2013 @ 11.00% (2012-11.50%)
(126,991,919,874) (115,771,416,227)
Carried Forward balance for the next year 140,731,641 28,010,746
(rs.)
189
Employees' Provident Fund - Annual Report 2013
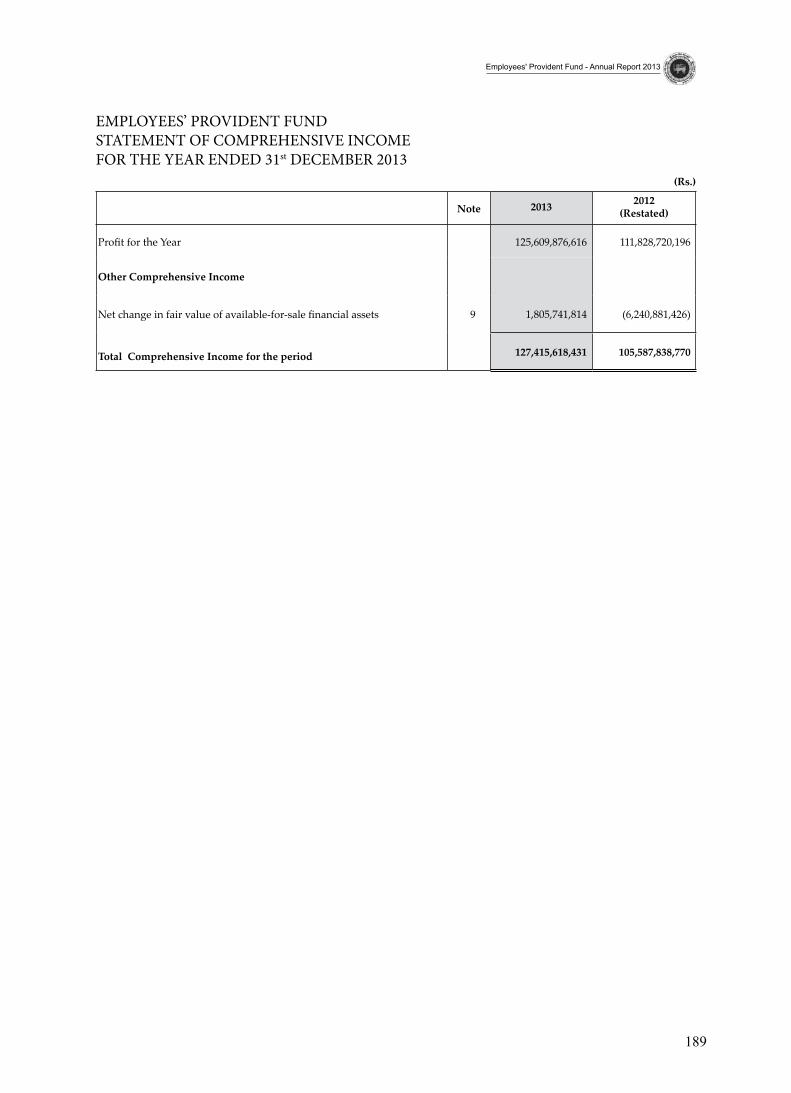
EMPLOYEES’ PROVIDENT FUND STATEMENT OF COMPREHENSIVE INCOME FOR THE YEAR ENDED 31st DECEMBER 2013
(rs.)
Note 2013 2012 (Restated)
Profit for the Year 125,609,876,616 111,828,720,196
other Comprehensive income
Net change in fair value of available-for-sale financial assets 9 1,805,741,814 (6,240,881,426)
Total Comprehensive Income for the period 127,415,618,431 105,587,838,770
190
Employees' Provident Fund - Annual Report 2013
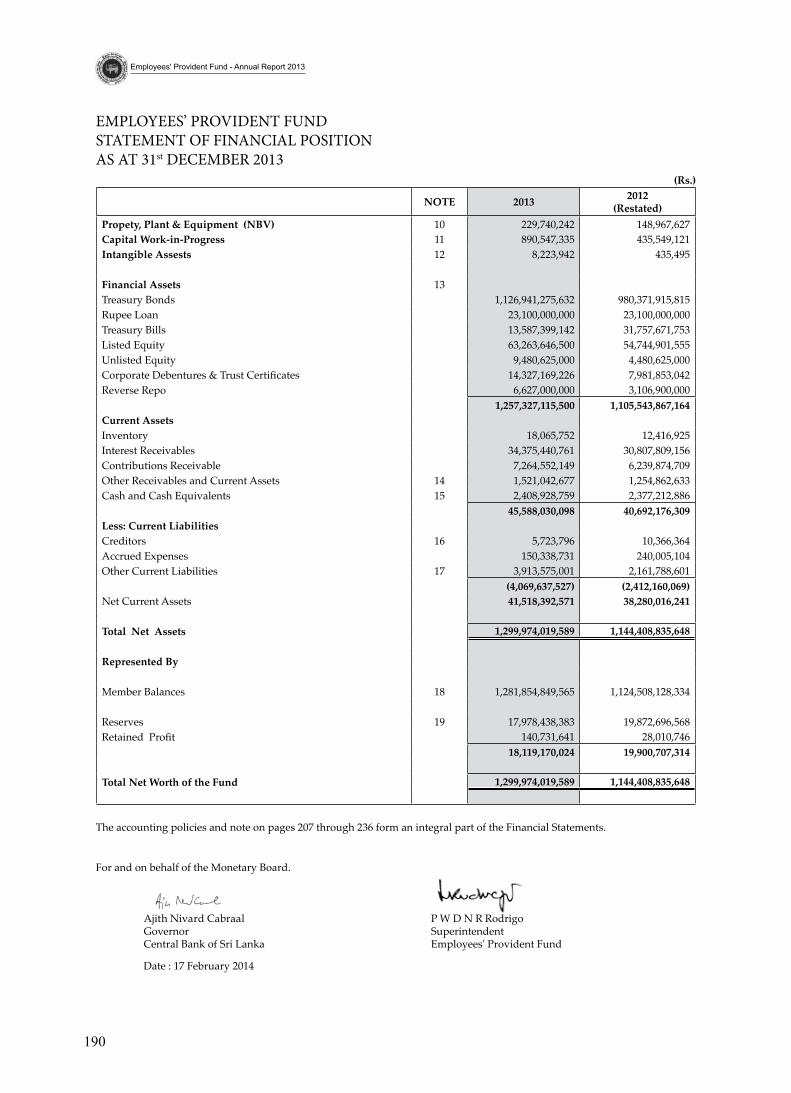
note 2013 2012 (restated)
Propety, Plant & Equipment (NBV) 10 229,740,242 148,967,627 Capital Work-in-Progress 11 890,547,335 435,549,121 Intangible Assests 12 8,223,942 435,495
Financial Assets 13Treasury Bonds 1,126,941,275,632 980,371,915,815 Rupee Loan 23,100,000,000 23,100,000,000 Treasury Bills 13,587,399,142 31,757,671,753 Listed Equity 63,263,646,500 54,744,901,555 Unlisted Equity 9,480,625,000 4,480,625,000 Corporate Debentures & Trust Certificates 14,327,169,226 7,981,853,042 Reverse Repo 6,627,000,000 3,106,900,000
1,257,327,115,500 1,105,543,867,164 Current AssetsInventory 18,065,752 12,416,925 Interest Receivables 34,375,440,761 30,807,809,156 Contributions Receivable 7,264,552,149 6,239,874,709 Other Receivables and Current Assets 14 1,521,042,677 1,254,862,633 Cash and Cash Equivalents 15 2,408,928,759 2,377,212,886
45,588,030,098 40,692,176,309 Less: Current LiabilitiesCreditors 16 5,723,796 10,366,364 Accrued Expenses 150,338,731 240,005,104 Other Current Liabilities 17 3,913,575,001 2,161,788,601
(4,069,637,527) (2,412,160,069)Net Current Assets 41,518,392,571 38,280,016,241
Total Net Assets 1,299,974,019,589 1,144,408,835,648
Represented By
Member Balances 18 1,281,854,849,565 1,124,508,128,334
Reserves 19 17,978,438,383 19,872,696,568 Retained Profit 140,731,641 28,010,746
18,119,170,024 19,900,707,314
Total Net Worth of the Fund 1,299,974,019,589 1,144,408,835,648
EMPLOYEES’ PROVIDENT FUND STATEMENT OF FINANCIAL POSITION AS AT 31st DECEMBER 2013
(rs.)
For and on behalf of the Monetary Board. Ajith Nivard Cabraal P W D N R Rodrigo Governor Superintendent Central Bank of Sri Lanka Employees' Provident Fund
Date : 17 February 2014
The accounting policies and note on pages 207 through 236 form an integral part of the Financial Statements.
191
Employees' Provident Fund - Annual Report 2013
(rs.)
note2013 2012
Monetary board labour dept. total total
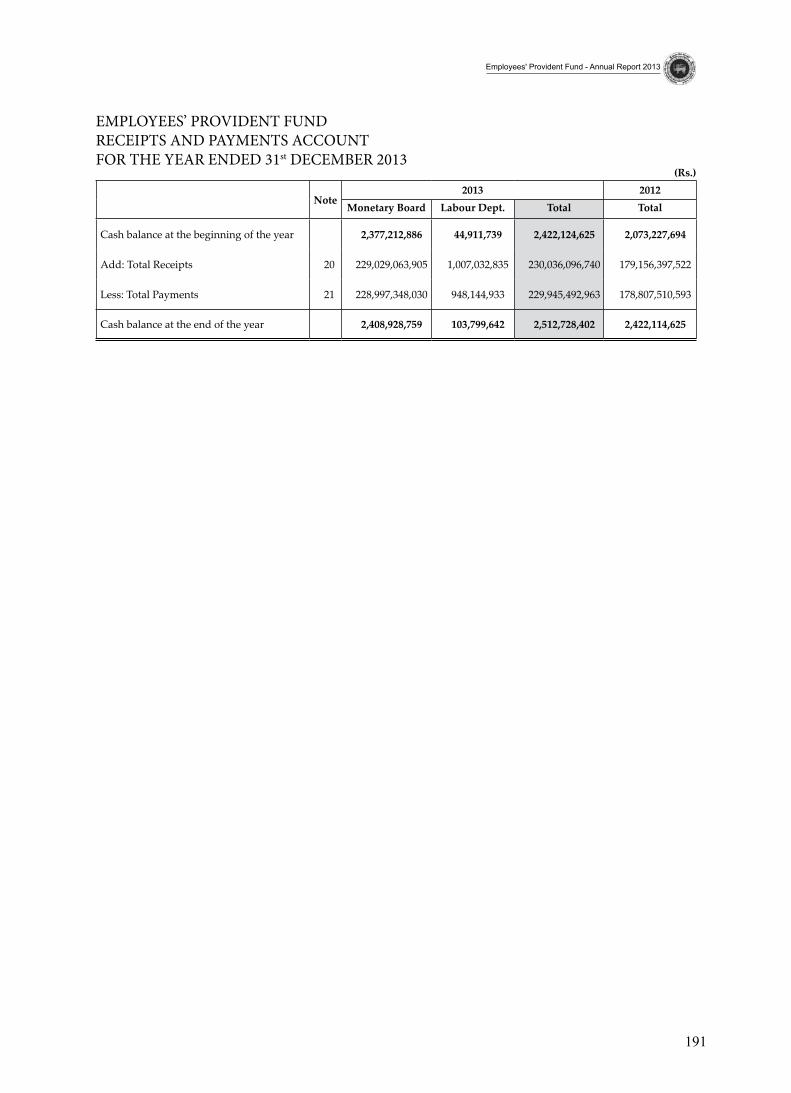
Cash balance at the beginning of the year 2,377,212,886 44,911,739 2,422,124,625 2,073,227,694
Add: Total Receipts 20 229,029,063,905 1,007,032,835 230,036,096,740 179,156,397,522
Less: Total Payments 21 228,997,348,030 948,144,933 229,945,492,963 178,807,510,593
Cash balance at the end of the year 2,408,928,759 103,799,642 2,512,728,402 2,422,114,625
EMPLOYEES’ PROVIDENT FUND RECEIPTS AND PAYMENTS ACCOUNT FOR THE YEAR ENDED 31st DECEMBER 2013
192
Employees' Provident Fund - Annual Report 2013
(rs.)
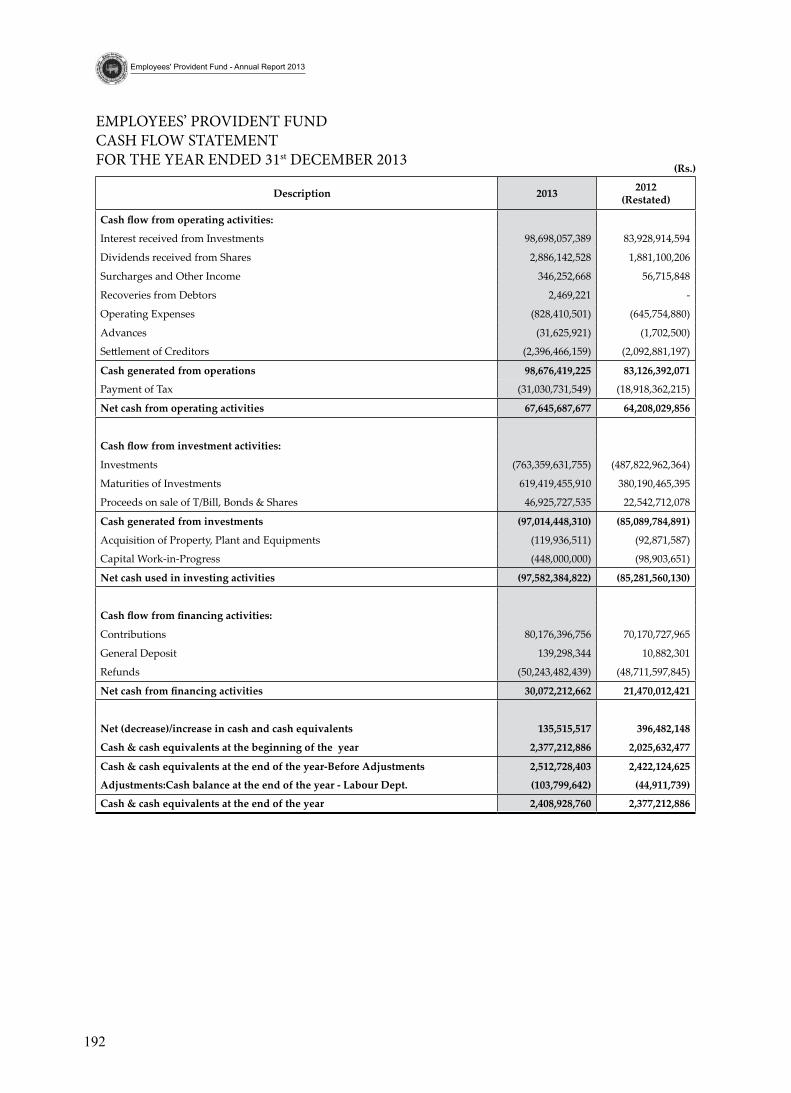
EMPLOYEES’ PROVIDENT FUND CASH FLOW STATEMENT FOR THE YEAR ENDED 31st DECEMBER 2013
description 2013 2012 (restated)
Cash flow from operating activities:
Interest received from Investments 98,698,057,389 83,928,914,594
Dividends received from Shares 2,886,142,528 1,881,100,206
Surcharges and Other Income 346,252,668 56,715,848
Recoveries from Debtors 2,469,221 -
Operating Expenses (828,410,501) (645,754,880)
Advances (31,625,921) (1,702,500)
Settlement of Creditors (2,396,466,159) (2,092,881,197)
Cash generated from operations 98,676,419,225 83,126,392,071
Payment of Tax (31,030,731,549) (18,918,362,215)
net cash from operating activities 67,645,687,677 64,208,029,856
Cash flow from investment activities:
Investments (763,359,631,755) (487,822,962,364)
Maturities of Investments 619,419,455,910 380,190,465,395
Proceeds on sale of T/Bill, Bonds & Shares 46,925,727,535 22,542,712,078
Cash generated from investments (97,014,448,310) (85,089,784,891)
Acquisition of Property, Plant and Equipments (119,936,511) (92,871,587)
Capital Work-in-Progress (448,000,000) (98,903,651)
net cash used in investing activities (97,582,384,822) (85,281,560,130)
Cash flow from financing activities:
Contributions 80,176,396,756 70,170,727,965
General Deposit 139,298,344 10,882,301
Refunds (50,243,482,439) (48,711,597,845)
Net cash from financing activities 30,072,212,662 21,470,012,421
net (decrease)/increase in cash and cash equivalents 135,515,517 396,482,148
Cash & cash equivalents at the beginning of the year 2,377,212,886 2,025,632,477
Cash & cash equivalents at the end of the year-before adjustments 2,512,728,403 2,422,124,625
Adjustments:Cash balance at the end of the year - Labour Dept. (103,799,642) (44,911,739)
Cash & cash equivalents at the end of the year 2,408,928,760 2,377,212,886
193
Employees' Provident Fund - Annual Report 2013
(rs.
)
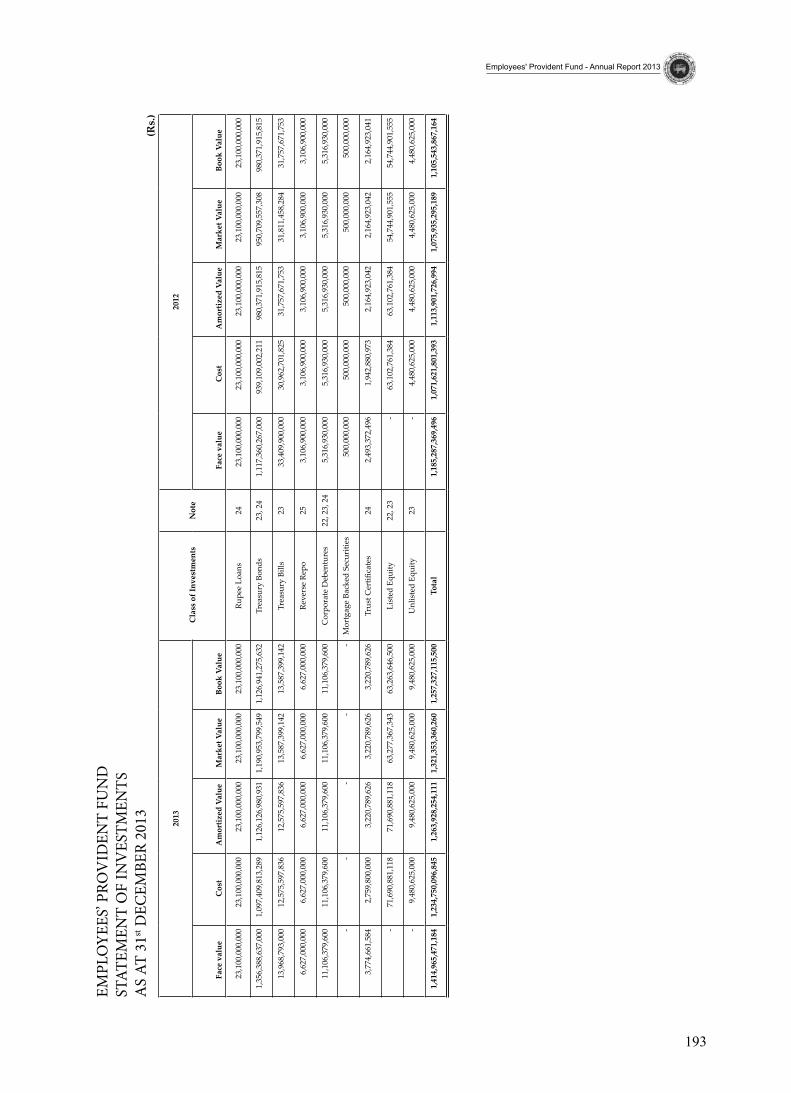
EMPL
OYE
ES’ P
ROV
IDEN
T FU
ND
ST
ATEM
ENT
OF
INV
ESTM
ENTS
A
S AT
31st
DEC
EMBE
R 20
13 2013
Cla
ss o
f inv
estm
ents
n
ote
2012
Fac
e va
lue
Cos
t a
mor
tized
val
ue
Mar
ket v
alue
b
ook
valu
e F
ace
valu
e C
ost
am
ortiz
ed v
alue
M
arke
t val
ue
boo
k va
lue
23,
100,
000,
000
23,
100,
000,
000
23,
100,
000,
000
23,
100,
000,
000
23,
100,
000,
000
Rup
ee L
oans
24
23,
100,
000,
000
23,
100,
000,
000
23,
100,
000,
000
23,
100,
000,
000
23,
100,
000,
000
1,3
56,3
88,6
37,0
00
1,0
97,4
09,8
13,2
89
1,1
26,1
26,9
80,9
31
1,1
90,9
53,7
99,5
49
1,1
26,9
41,2
75,6
32
Tre
asur
y Bo
nds
23, 2
4 1
,117
,360
,267
,000
9
39,1
09,0
02,2
11
980
,371
,915
,815
9
50,7
09,5
57,3
08
980
,371
,915
,815
13,
968,
793,
000
12,
575,
597,
836
12,
575,
597,
836
13,
587,
399,
142
13,
587,
399,
142
Tre
asur
y Bi
lls
23 3
3,40
9,90
0,00
0 3
0,96
2,70
1,82
5 3
1,75
7,67
1,75
3 3
1,81
1,45
8,28
4 3
1,75
7,67
1,75
3
6,6
27,0
00,0
00
6,6
27,0
00,0
00
6,6
27,0
00,0
00
6,6
27,0
00,0
00
6,6
27,0
00,0
00
Rev
erse
Rep
o 25
3,1
06,9
00,0
00
3,1
06,9
00,0
00
3,1
06,9
00,0
00
3,1
06,9
00,0
00
3,1
06,9
00,0
00
11,
106,
379,
600
11,
106,
379,
600
11,
106,
379,
600
11,
106,
379,
600
11,
106,
379,
600
Cor
pora
te D
eben
ture
s 22
, 23,
24
5,3
16,9
30,0
00
5,3
16,9
30,0
00
5,3
16,9
30,0
00
5,3
16,9
30,0
00
5,3
16,9
30,0
00
- -
- -
- M
ortg
age
Back
ed S
ecur
ities
5
00,0
00,0
00
500
,000
,000
5
00,0
00,0
00
500
,000
,000
5
00,0
00,0
00
3,7
74,6
61,5
84
2,7
59,8
00,0
00
3,2
20,7
89,6
26
3,2
20,7
89,6
26
3,2
20,7
89,6
26
Tru
st C
ertifi
cate
s 24
2,4
93,3
72,4
96
1,9
42,8
80,9
73
2,1
64,9
23,0
42
2,1
64,9
23,0
42
2,1
64,9
23,0
41
- 7
1,69
0,88
1,11
8 7
1,69
0,88
1,11
8 6
3,27
7,36
7,34
3 6
3,26
3,64
6,50
0 L
iste
d Eq
uity
22
, 23
- 6
3,10
2,76
1,38
4 6
3,10
2,76
1,38
4 5
4,74
4,90
1,55
5 5
4,74
4,90
1,55
5
- 9
,480
,625
,000
9
,480
,625
,000
9
,480
,625
,000
9
,480
,625
,000
U
nlis
ted
Equi
ty
23 -
4,4
80,6
25,0
00
4,4
80,6
25,0
00
4,4
80,6
25,0
00
4,4
80,6
25,0
00
1,4
14,9
65,4
71,1
84
1,2
34,7
50,0
96,8
45
1,2
63,9
28,2
54,1
11
1,3
21,3
53,3
60,2
60
1,2
57,3
27,1
15,5
00
tot
al
1,1
85,2
87,3
69,4
96
1,0
71,6
21,8
01,3
93
1,1
13,9
01,7
26,9
94
1,0
75,9
35,2
95,1
89
1,1
05,5
43,8
67,1
64

194
Employees' Provident Fund - Annual Report 2013
(rs.
)
eMPl
oye
es’ P
ro
vid
ent
Fun
d
st
ate
Men
t o
F C
Ha
ng
es in
eq
uit
y / M
eMbe
rs’
Wea
ltH
Fo
r t
He
yea
r e
nd
ed 3
1st d
eCeM
ber
201
3
des
crip
tion
Mem
bers
bal
ance
b
uild
ing
res
erve
Fun
d
tec
hnol
ogy
adv
ance
men
t r
eser
ve F
und
Pro
fit
equa
lisat
ion
res
erve
Fun
d
gen
eral
r
eser
ve F
und
inv
estm
ent
rev
alua
tion
res
erve
R
etai
ned
Profi
t t
otal
bala
nce
as a
t 31s
t dec
embe
r 201
1 9
86,0
45,9
58,6
91
3,1
57,0
00,0
00
350
,000
,000
2
3,50
0,00
0,00
0 6
,650
,000
,000
(2
,367
,430
,983
) 3
68,7
92,0
48
1,0
17,7
04,3
19,7
56
Prio
r Yea
r Adj
ustm
ent
- -
- -
- -
- -
Net
cha
nge
in fa
ir v
alue
of a
vaila
ble-
for-
sale
fina
ncia
l ass
ets
- -
- -
- (6
,240
,881
,426
) -
(6,2
40,8
81,4
26)
Net
cha
nge
in fa
ir v
alue
of a
vaila
ble-
for-
sale
fina
ncia
l ass
ets
tran
sfer
red
to p
rofit
or l
oss
- -
- -
- 5
24,0
08,9
77
- 5
24,0
08,9
77
Net
Pro
fit fo
r the
yea
r - 2
012
- -
- -
- -
111
,828
,720
,196
11
1,82
8,72
0,19
6
Net
Con
trib
utio
ns
22,
690,
753,
416
- -
- -
- -
22,
690,
753,
416
Mem
ber I
nter
est P
aid
- 201
2 -
- -
- -
- (2
,098
,085
,270
) (2
,098
,085
,270
)
Mem
ber I
nter
est (
2012
:11.
50%
) 1
15,7
71,4
16,2
27
- -
- -
- (1
15,7
71,4
16,2
27)
-
Tran
sfer
s fr
om R
etai
ned
Profi
t -
- -
(5,7
00,0
00,0
00)
- -
5,7
00,0
00,0
00
-
bala
nce
as a
t 31s
t dec
embe
r 20
12
1,1
24,5
08,1
28,3
34
3,1
57,0
00,0
00
350
,000
,000
1
7,80
0,00
0,00
0 6
,650
,000
,000
(8
,084
,303
,432
) 2
8,01
0,74
7 1
,144
,408
,835
,648
Prio
r Yea
r Adj
ustm
ent
- -
- -
- -
28,
254,
317
28,
254,
317
Net
cha
nge
in fa
ir v
alue
of a
vaila
ble-
for-
sale
fina
ncia
l ass
ets
- -
- -
- 1
,805
,741
,814
-
1,8
05,7
41,8
14
Net
cha
nge
in fa
ir v
alue
of a
vaila
ble-
for-
sale
fina
ncia
l ass
ets
tran
sfer
red
to p
rofit
or l
oss
- -
- -
- -
- -
Net
Pro
fit fo
r the
yea
r - 2
013
- -
- -
- -
125
,609
,876
,616
1
25,6
09,8
76,6
16
Net
Con
trib
utio
ns fo
r 201
3 3
0,35
4,80
1,35
8 -
- -
- -
- 3
0,35
4,80
1,35
8
Mem
ber I
nter
est P
aid
on R
efun
ds -
2013
-
- -
- -
- (2
,233
,490
,165
) (2
,233
,490
,165
)
Mem
ber I
nter
est (
2013
at 1
1.00
%)
126
,991
,919
,874
-
- -
- -
(126
,991
,919
,874
) -
Tran
sfer
s fr
om R
etai
ned
Profi
t -
- -
(3,7
00,0
00,0
00)
- -
3,7
00,0
00,0
00
-
bala
nce
as a
t 31s
t dec
embe
r 20
13
1,2
81,8
54,8
49,5
65
3,1
57,0
00,0
00
350
,000
,000
1
4,10
0,00
0,00
0 6
,650
,000
,000
(6
,278
,561
,616
) 1
40,7
31,6
41
1,2
99,9
74,0
19,5
89
195
Employees' Provident Fund - Annual Report 2013
eMPloyees’ Provident Fund aCCounting PoliCy
1. Reporting Entity and Statutory Base
The Employees’ Provident Fund (“EPF” or “the Fund”) is a mandatory defined contributory retirement scheme for the corporate and mercantile sector employees in Sri Lanka established under the EPF Act No.15 of 1958. The general administration of the Fund has been vested with the Commissioner of Labour, while the Monetary Board of the Central Bank of Sri Lanka has been charged with the responsibility as the custodian of the Fund.
In terms of Section 5(1) (h) and (i) of EPF Act No.15 of 1958, the Monetary Board is required to maintain a general account in respect of the Fund and prepare the following financial statements annually.
a. Statement of Income and Expenditure,
b. Statement of Assets and Liabilities,
c. Statement of Receipts and Payments, and
d. Statement of Investments, showing the face value, purchase price and market value of each type of investment.
2. Accounting Policies
2.1 Basis of Preparation
The financial statements have been prepared on a historical cost basis, except for financial assets designated at fair value through profit and loss and available for sale. The financial statements of the Fund are presented in Sri Lankan Rupees (SLR) except where otherwise indicated.
2.2 Statement of Compliance
The financial statements of the Fund incorporating the above financial statements have been prepared in accordance with the new Sri Lanka Accounting Standards (SLFRS & LKAS) laid down by the Institute of Chartered Accountants of Sri Lanka. These SLFRS/LKAS have materially converged with the International Reporting Standards (IFRS) as issued by the International Accounting Standard Board (IASB).
2.3 Changes in Accounting Policies
As SLFRS and LKAS are effective from 01st January 2012, certain accounting policies, methods and presentations have been changed or improved and the significant changes are described below. Except for those changes, the accounting policies adopted are consistent with those used in the previous year except the
196
Employees' Provident Fund - Annual Report 2013
improvements in the presentation as per Sri Lanka Accounting Standards.
2.4 Use of Estimates and Assumptions
The preparation of financial statements requires the use of estimates and assumptions about future conditions. The use of available information and the application of judgment are inherent in the formation of estimates; actual results in the future may differ from estimates upon which financial information is prepared. The significant accounting policies where judgment is necessarily applied are those which relate to the valuation of financial instruments, the impairment of assets, depreciation of Property Plant and Equipment, deferred tax assets and provisions for liabilities.
2.5 Going Concern
The Fund is satisfied with its ability to continue as a going concern as it has the resources to continue in business for the foreseeable future. Therefore, the financial statements have been prepared on the going concern basis.
2.6 Events Occurring after the Balance Sheet Date and Contingent Liabilities
All material events occurring after the date of the Balance Sheet have been considered when preparing the financial statements. Provisions have been made for all known liabilities.
3. Summary of Significant Accounting Policies
3.1 Financial Assets and Bases of their Valuation
3.1.1 Recognition and Measurement of Financial Assets
Financial assets are recognized when, and only when the Fund becomes a party to the contractual provision of a financial instrument. The financial assets mainly include held to maturity investments, securities at fair value through profit and loss, loans and receivables and available for sale investments. All financial assets are initially recognized at cost, being the fair value of the consideration given, plus, in the case of financial assets not at fair value through profit and loss, directly attributable transaction cost including acquisition charges associated with the transactions.
Classification and subsequent measurement bases of financial assets are as follows.
(a) Held to Maturity (HTM) Investments
Financial assets with fixed or determinable payments and fixed maturity that EPF intend and is able to hold until maturity are categorized under held for maturity investments. HTM investments are subsequently measured at amortised cost using the effective interest rate method, less any impairment. Premiums and discounts
197
Employees' Provident Fund - Annual Report 2013
arising on the purchase of HTM investments are included in the calculation of their effective interest rates. Gains and losses are recognized in the income statement when HTM investments are derecognized or impaired.
(b) Securities at Fair Value through Profit or Loss (FVTPL)
Financial assets classified as held for trading are included in the category of Securities at fair value through profit or loss and financial assets designated upon initial recognition as securities at FVTPL. Attributable transaction costs are recognized in the Income Statement.
FVTPL securities are subsequently valued at fair value as indicated by market values. Changes in market value are recognized as an increase or decrease in the value of the securities while resulting net gains and losses are recognized in the Income Statement.
(c) Loans & Receivables (L&R)
Financial assets that EPF has received with fixed or determinable payments that are not quoted in an active market are classified under L & R. Securities purchased under agreement to re-sell (Reverse Repos) are also classified as L & R. L & R are subsequently measured at amortized cost using the effective interest method, less any impairment losses. Gains and losses are recognized in the income statement when L & R are de recognized or impaired.
(d) Available For Sale (AFS)
Equity instruments that are not classified as FVTPL, debt instruments that are not classified under the above three categories and those securities designated as AFS investments at the initial acquisitions are classified as AFS financial assets.
AFS assets are continued to be measured at fair value in the statement of financial position. Fair value changes on AFS assets are recognized in Other Comprehensive Income and accumulated under members’ wealth, through the Revaluation Reserve until AFS assets are either sold or become impaired.
If the available-for-sale financial asset is impaired, the difference between the financial assets’ carrying cost and the current fair value is recognized in the Income Statement. Interest income is recognized on available-for-sale debt securities using the effective interest rate method. Dividends are recognized in the income statement when the right to receive payment has been established.
3.1.2 Impairment of Financial Assets
At each balance sheet date, an assessment is made of whether there is any objective evidence of impairment in the value of a financial asset. Impairment losses are recognised if, and only if, there is objective evidence of impairment as a result of one or more events that occurred after the initial recognition of the financial asset
198
Employees' Provident Fund - Annual Report 2013
(a ‘loss event’) and that loss event (or events) has an impact on the estimated future cash flows of the financial asset that can be reliably estimated.
Objective evidence of impairment of securities may include specific information about the issuer such as a significant financial difficulty of the issuer, a breach of contract such as a default, bankruptcy or other financial distress, but may also include information about significant changes in the market condition that provides evidence that the cost of the securities may not be recovered. A significant or prolonged decline in the fair value of the asset below its cost is also objective evidence of impairment. In assessing whether it is significant, the decline in fair value is evaluated against the original cost of the asset at initial recognition. In assessing whether it is prolonged, the decline is evaluated against the period in which the fair value of the asset has been below its original cost at initial recognition.
3.1.3 De-recognition of Financial Assets
Financial assets are de-recognised when the contractual right to receive cash flows from the assets has expired; or when the Fund has transferred its contractual right to receive the cash flows of the financial assets, and either:
– Substantially all the risks and rewards of ownership have been transferred; or
– The Fund has neither retained nor transferred substantially all the risks and rewards, but has not retained control.
3.2 Other Assets
3.2.1 Property, Plant and Equipment (PPE)
PPE is stated at cost less accumulated depreciation and accumulated impairment in value. Depreciation has been charged on straight-line method at the following rates in order to write off the cost of such assets over their estimated effective life-time.
Asset Class Depreciation rate
Buildings 02% Plant and Machinery 25% OfficeEquipment 25% Furniture & Fittings 10% Motor Vehicles 20% ComputerEquipment 50% Other 20%
The carrying values of PPE are reviewed for impairment when events or changes in circumstances indicate that the carrying value may not be recoverable.
199
Employees' Provident Fund - Annual Report 2013
An item of PPE is de-recognized upon disposal or when no future economic benefits are expected from its use or disposal. Any gain or loss arising on de-recognition is included in the Income Statement in the year the asset is de-recognized.
3.2.2 Intangible Assets
Computer software not integral to computer hardware are shown as intangible assets and recognized at cost. Subsequent to the initial recognition, they are carried at cost less any accumulated amortization based on useful life of two years.
3.2.3 Inventories
Inventories are carried at weighted average cost. Allowance is made for slow moving inventories.
3.2.4 Receivables
Receivables are carried at expected realizable value after making due allowance for doubtful debts, based on an objective evidence.
3.2.5 Impairment of Non- Financial Assets
The Fund assesses at the end of each financial period if events or changes in circumstances indicate that there is an indication that a non- financial assets may be impaired. If such indication exists, the Fund makes an estimated recoverable amount of the asset. Where the carrying amount of an asset exceeds its recoverable amount, the asset is considered impaired and written down to its recoverable amount.
3.3 Liabilities
3.3.1 Unclaimed Benefits
EPF benefits which are duly refunded to the members or the beneficiaries, but returned for various reasons and retained in the Retained Benefit Account over one year are credited to the Unclaimed Benefits Account until they are re-claimed.
3.3.2 Retained Benefits
EPF benefits, retained on the instructions of the Commissioner of Labour are shown as Retained Benefits until instructions are received to release them. Such credits are not retained for more than one accounting period in this account.
3.3.3 Under Payments & Over Payments (Refunds)
The balance shown in the Under Payments & Over Payments (Refunds) Account represents payment of benefits to be made as part payments.
3.3.4 Provisions
Provisions are recognised when the Fund has an obligation at present ( legal or constructive) as a result of a past event and it is probable that an outflow of
200
Employees' Provident Fund - Annual Report 2013
resources embodying economic benefits will be required to settle the obligation and reliable estimate can be made of the amount of the obligation.
3.3.5 De-recognistion of Liabilities
Financial liabilities are de-recognised when they are extinguished, that is when the obligation is discharged, cancelled, or expires.
3.4 Revenue and Expenses
Revenue is recognised to the extent that it is probable that the economic benefits will flow to the Fund and revenue can be reliably measured. Expenses are recognized in the income statement on the basis of a direct association between the cost incurred and the earning of specific items of income. All expenditure incurred in managing the Fund by both the EPF Department of the Central Bank and the EPF Section of the Department of Labour has been charged to the Fund as its expenditure.
The following specific recognition criteria are considered before revenues and expenses are recognised.
3.4.1 Interest Income
Interest income is recognised in the Income Statement for all interest bearing instruments on an accrual basis using the effective yield method based on actual purchase price less impairment loss. Interest income includes coupon income and any gain or loss on amortization of discount or premium of the instruments.
3.4.2 Dividends
Dividend income is recognized when the Fund’s right to receive the payment is established.
3.4.3 Personnel Expenses
Personnel expenses include all staff related expenses incurred by both the EPF Department of the Central Bank and the EPF Section of the Department of Labour. The Fund does not maintain separate pension fund or other post employee benefits plans.
3.4.4 Income Tax
The income tax is calculated to the extent of the tax payable on investment income. Income tax liability of the Fund is 10% of the gross income earned as interest, dividends and net surcharges. There is no liability on capital gains earned on Treasury bills, Treasury bonds and shares, since they are exempted from tax as per the Inland Revenue Act.
Since EPF changed its accounting policy (w.e.f. 01.09.2006) to value the Treasury bonds and bills portfolio at after tax weighted average cost (WAC) and to amortize subsequently, the amortization gain was recorded net of tax.
201
Employees' Provident Fund - Annual Report 2013
Accordingly, the proportion of With Holding Tax (WHT) applicable for the income earned on Treasury bonds and bills for the year is added back to the amortization gain account in order to give a fair view about the amortization gain and the income tax expenditure.
3.5 Statement of Income
EPF prepares its Income Statement using two separate statements to show comprehensive income and other comprehensive income.
3.6 Cash Flow Statement
The Cash Flow Statement has been prepared using the “direct method” of preparing cash flows in accordance with LKAS 07– Cash Flow Statement. Cash and cash equivalents comprise short term, highly- liquid investments that are readily convertible to cash and subject to an insignificant risk of changes in value.
3.7 Receipts and Payments Account
Statement of Receipts and Payments represents all receipts received in the form of cash during the year and payments made in cash during the year
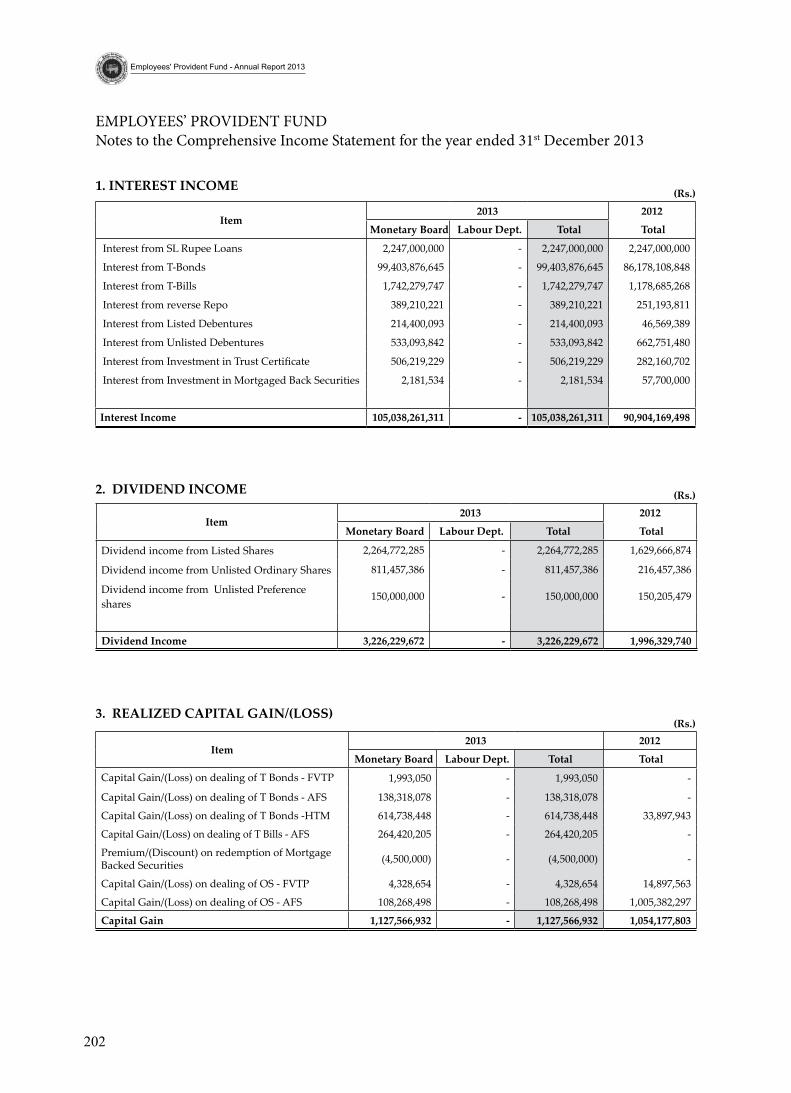
202
Employees' Provident Fund - Annual Report 2013
EMPLOYEES’ PROVIDENT FUND Notes to the Comprehensive Income Statement for the year ended 31st December 2013
item2013 2012
Monetary board labour dept. total total
Interest from SL Rupee Loans 2,247,000,000 - 2,247,000,000 2,247,000,000
Interest from T-Bonds 99,403,876,645 - 99,403,876,645 86,178,108,848
Interest from T-Bills 1,742,279,747 - 1,742,279,747 1,178,685,268
Interest from reverse Repo 389,210,221 - 389,210,221 251,193,811
Interest from Listed Debentures 214,400,093 - 214,400,093 46,569,389
Interest from Unlisted Debentures 533,093,842 - 533,093,842 662,751,480
Interest from Investment in Trust Certificate 506,219,229 - 506,219,229 282,160,702
Interest from Investment in Mortgaged Back Securities 2,181,534 - 2,181,534 57,700,000
interest income 105,038,261,311 - 105,038,261,311 90,904,169,498
1. interest inCoMe (rs.)
(rs.)
item2013 2012
Monetary board labour dept. total total
Dividend income from Listed Shares 2,264,772,285 - 2,264,772,285 1,629,666,874
Dividend income from Unlisted Ordinary Shares 811,457,386 - 811,457,386 216,457,386
Dividend income from Unlisted Preference shares
150,000,000 - 150,000,000 150,205,479
dividend income 3,226,229,672 - 3,226,229,672 1,996,329,740
2. dividend inCoMe
(rs.)
item2013 2012
Monetary board labour dept. total total
Capital Gain/(Loss) on dealing of T Bonds - FVTP 1,993,050 - 1,993,050 -
Capital Gain/(Loss) on dealing of T Bonds - AFS 138,318,078 - 138,318,078 -
Capital Gain/(Loss) on dealing of T Bonds -HTM 614,738,448 - 614,738,448 33,897,943
Capital Gain/(Loss) on dealing of T Bills - AFS 264,420,205 - 264,420,205 -
Premium/(Discount) on redemption of Mortgage Backed Securities (4,500,000) - (4,500,000) -
Capital Gain/(Loss) on dealing of OS - FVTP 4,328,654 - 4,328,654 14,897,563
Capital Gain/(Loss) on dealing of OS - AFS 108,268,498 - 108,268,498 1,005,382,297
Capital gain 1,127,566,932 - 1,127,566,932 1,054,177,803
3. realized CaPital gain/(loss)
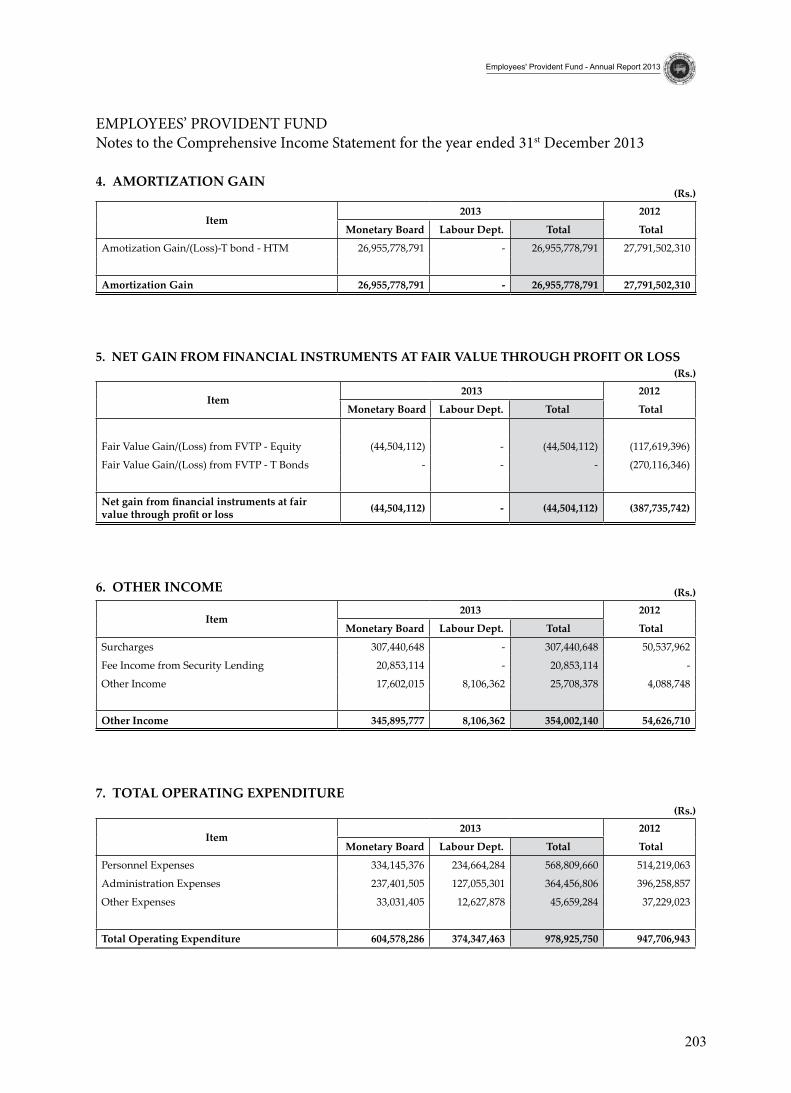
203
Employees' Provident Fund - Annual Report 2013
EMPLOYEES’ PROVIDENT FUND Notes to the Comprehensive Income Statement for the year ended 31st December 2013
(rs.)
item2013 2012
Monetary board labour dept. total total
Amotization Gain/(Loss)-T bond - HTM 26,955,778,791 - 26,955,778,791 27,791,502,310
amortization gain 26,955,778,791 - 26,955,778,791 27,791,502,310
4. aMortization gain
(rs.)
item2013 2012
Monetary board labour dept. total total
Fair Value Gain/(Loss) from FVTP - Equity (44,504,112) - (44,504,112) (117,619,396)
Fair Value Gain/(Loss) from FVTP - T Bonds - - - (270,116,346)
Net gain from financial instruments at fair value through profit or loss (44,504,112) - (44,504,112) (387,735,742)
5. net gain FroM FinanCial instruMents at Fair value tHrougH ProFit or loss
(rs.)
item2013 2012
Monetary board labour dept. total total
Surcharges 307,440,648 - 307,440,648 50,537,962
Fee Income from Security Lending 20,853,114 - 20,853,114 -
Other Income 17,602,015 8,106,362 25,708,378 4,088,748
other income 345,895,777 8,106,362 354,002,140 54,626,710
6. otHer inCoMe
(rs.)
item2013 2012
Monetary board labour dept. total total
Personnel Expenses 334,145,376 234,664,284 568,809,660 514,219,063
Administration Expenses 237,401,505 127,055,301 364,456,806 396,258,857
Other Expenses 33,031,405 12,627,878 45,659,284 37,229,023
total operating expenditure 604,578,286 374,347,463 978,925,750 947,706,943
7. total oPerating exPenditure
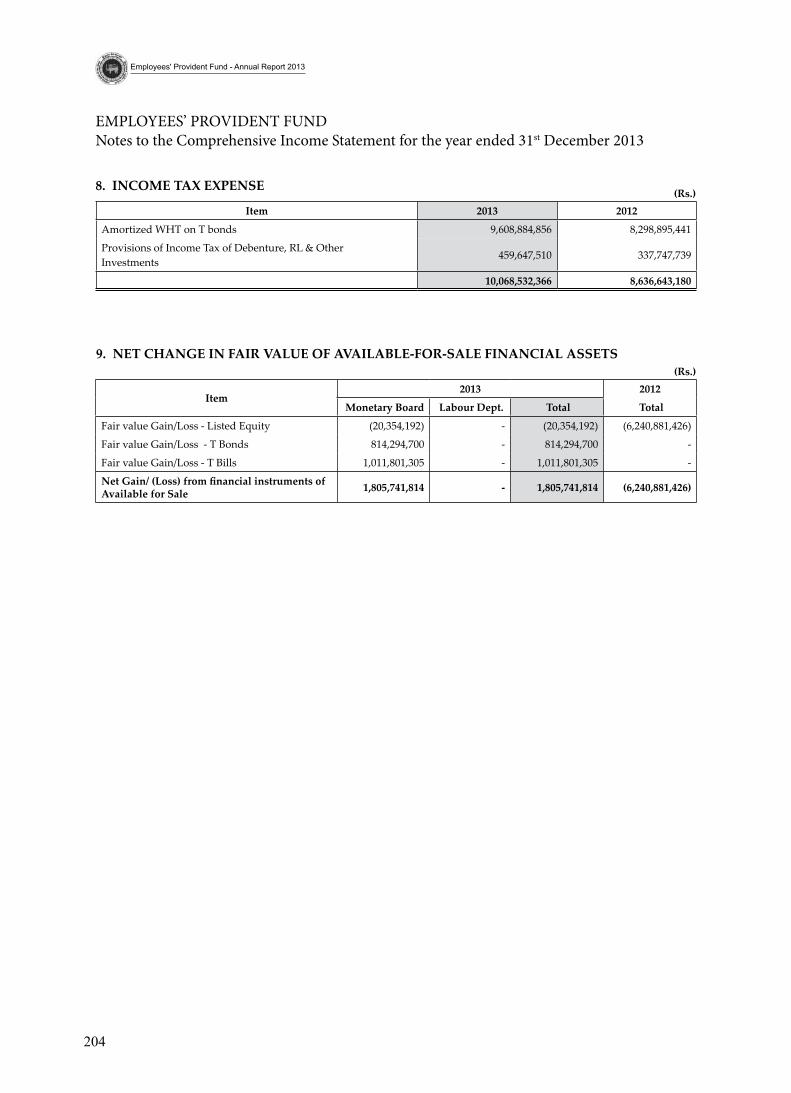
204
Employees' Provident Fund - Annual Report 2013
item 2013 2012
Amortized WHT on T bonds 9,608,884,856 8,298,895,441
Provisions of Income Tax of Debenture, RL & Other Investments
459,647,510 337,747,739
10,068,532,366 8,636,643,180
8. inCoMe tax exPense (rs.)
EMPLOYEES’ PROVIDENT FUND Notes to the Comprehensive Income Statement for the year ended 31st December 2013
(rs.)
item2013 2012
Monetary board labour dept. total total
Fair value Gain/Loss - Listed Equity (20,354,192) - (20,354,192) (6,240,881,426)
Fair value Gain/Loss - T Bonds 814,294,700 - 814,294,700 -
Fair value Gain/Loss - T Bills 1,011,801,305 - 1,011,801,305 -
Net Gain/ (Loss) from financial instruments of available for sale 1,805,741,814 - 1,805,741,814 (6,240,881,426)
9. net CHange in Fair value oF available-For-sale FinanCial assets
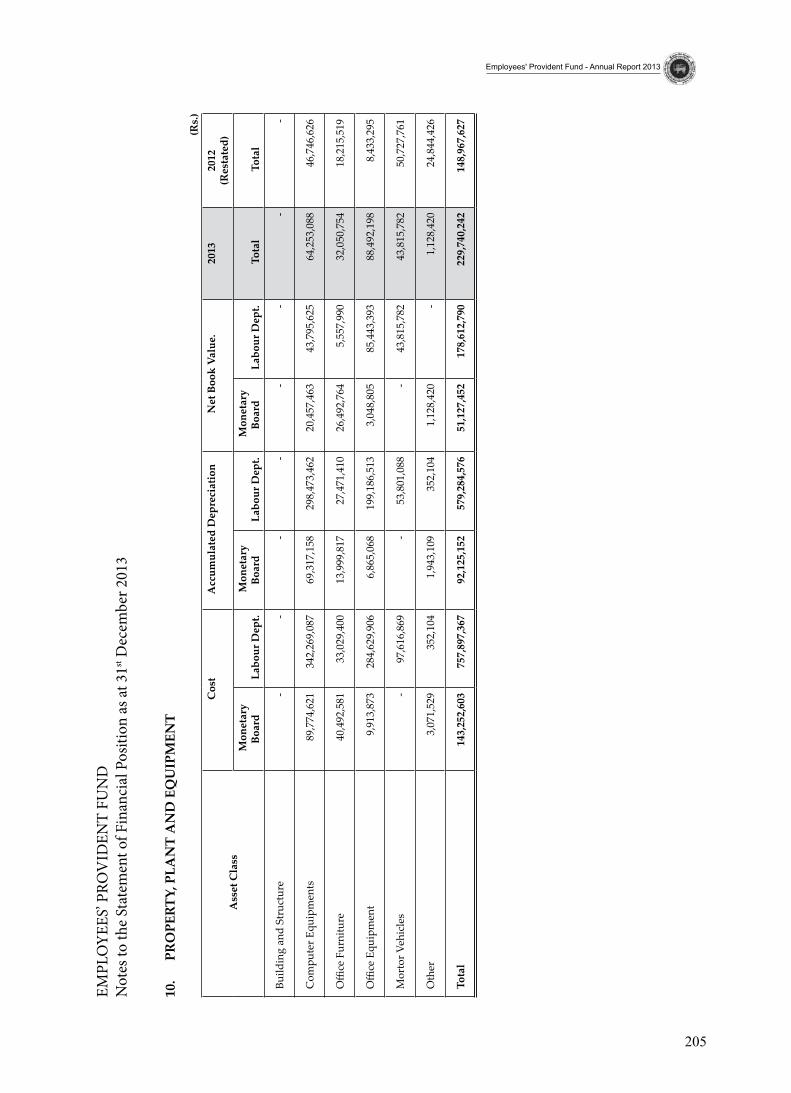
205
Employees' Provident Fund - Annual Report 2013
(rs.
)
10.
P
ro
Pert
y, P
lan
t a
nd
eq
uiP
Men
t
ass
et C
lass
Cos
t a
ccum
ulat
ed d
epre
ciat
ion
net
boo
k va
lue.
20
1320
12
(r
esta
ted)
Mon
etar
y bo
ard
lab
our d
ept.
Mon
etar
y bo
ard
lab
our d
ept.
Mon
etar
y bo
ard
lab
our d
ept.
tot
al
tot
al
Bui
ldin
g an
d St
ruct
ure
- -
- -
- -
- -
Com
pute
r Equ
ipm
ents
8
9,77
4,62
1 3
42,2
69,0
87
69,
317,
158
298
,473
,462
2
0,45
7,46
3 4
3,79
5,62
5 6
4,25
3,08
8 4
6,74
6,62
6
Offi
ce F
urni
ture
4
0,49
2,58
1 3
3,02
9,40
0 1
3,99
9,81
7 2
7,47
1,41
0 2
6,49
2,76
4 5
,557
,990
3
2,05
0,75
4 1
8,21
5,51
9
Offi
ce E
quip
men
t 9
,913
,873
2
84,6
29,9
06
6,8
65,0
68
199
,186
,513
3
,048
,805
8
5,44
3,39
3 8
8,49
2,19
8 8
,433
,295
Mor
tor V
ehic
les
- 9
7,61
6,86
9 -
53,
801,
088
- 4
3,81
5,78
2 4
3,81
5,78
2 5
0,72
7,76
1
Oth
er
3,0
71,5
29
352
,104
1
,943
,109
3
52,1
04
1,1
28,4
20
- 1
,128
,420
2
4,84
4,42
6
tot
al
143
,252
,603
7
57,8
97,3
67
92,
125,
152
579
,284
,576
5
1,12
7,45
2 1
78,6
12,7
90
229
,740
,242
1
48,9
67,6
27
EMPL
OYE
ES’ P
ROV
IDEN
T FU
ND
Not
es to
the
Stat
emen
t of F
inan
cial
Pos
ition
as a
t 31st
Dec
embe
r 201
3
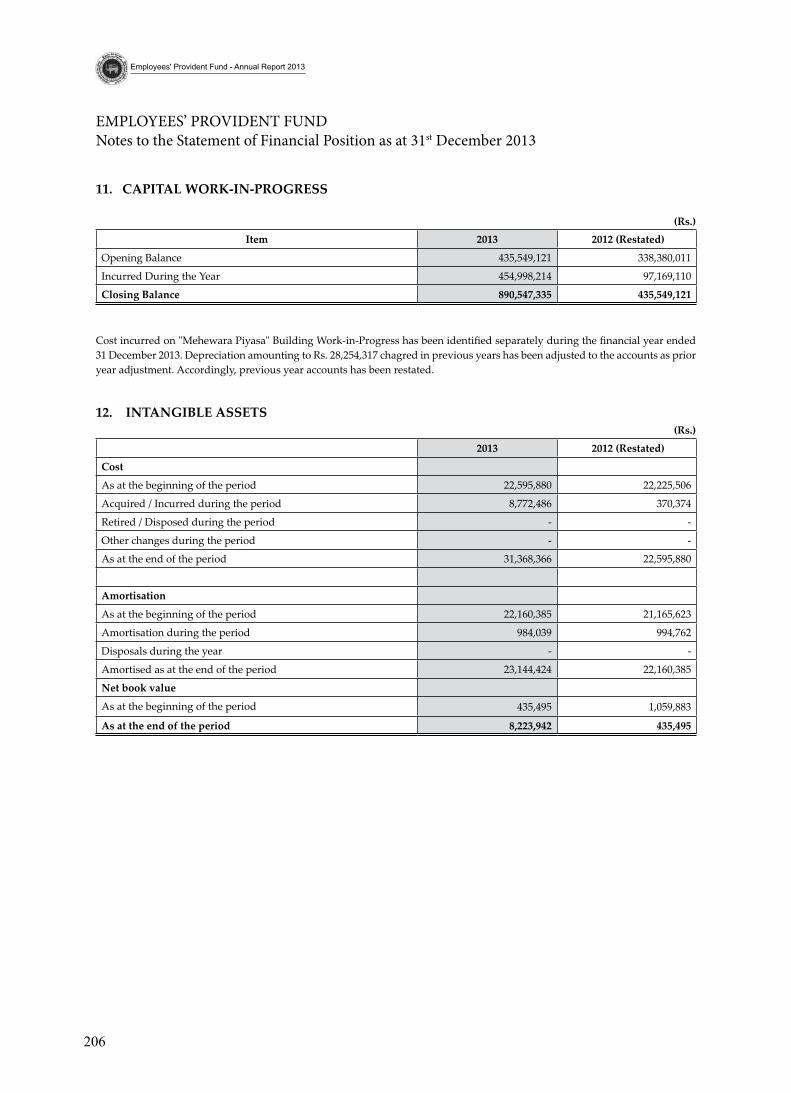
206
Employees' Provident Fund - Annual Report 2013
item 2013 2012 (restated)
Opening Balance 435,549,121 338,380,011
Incurred During the Year 454,998,214 97,169,110
Closing balance 890,547,335 435,549,121
11. CaPital Work-in-Progress
(rs.)
EMPLOYEES’ PROVIDENT FUND Notes to the Statement of Financial Position as at 31st December 2013
2013 2012 (restated)
Cost
As at the beginning of the period 22,595,880 22,225,506
Acquired / Incurred during the period 8,772,486 370,374
Retired / Disposed during the period - -
Other changes during the period - -
As at the end of the period 31,368,366 22,595,880
amortisation
As at the beginning of the period 22,160,385 21,165,623
Amortisation during the period 984,039 994,762
Disposals during the year - -
Amortised as at the end of the period 23,144,424 22,160,385
net book value
As at the beginning of the period 435,495 1,059,883
as at the end of the period 8,223,942 435,495
12. intangible assets (rs.)
Cost incurred on "Mehewara Piyasa" Building Work-in-Progress has been identified separately during the financial year ended 31 December 2013. Depreciation amounting to Rs. 28,254,317 chagred in previous years has been adjusted to the accounts as prior year adjustment. Accordingly, previous year accounts has been restated.
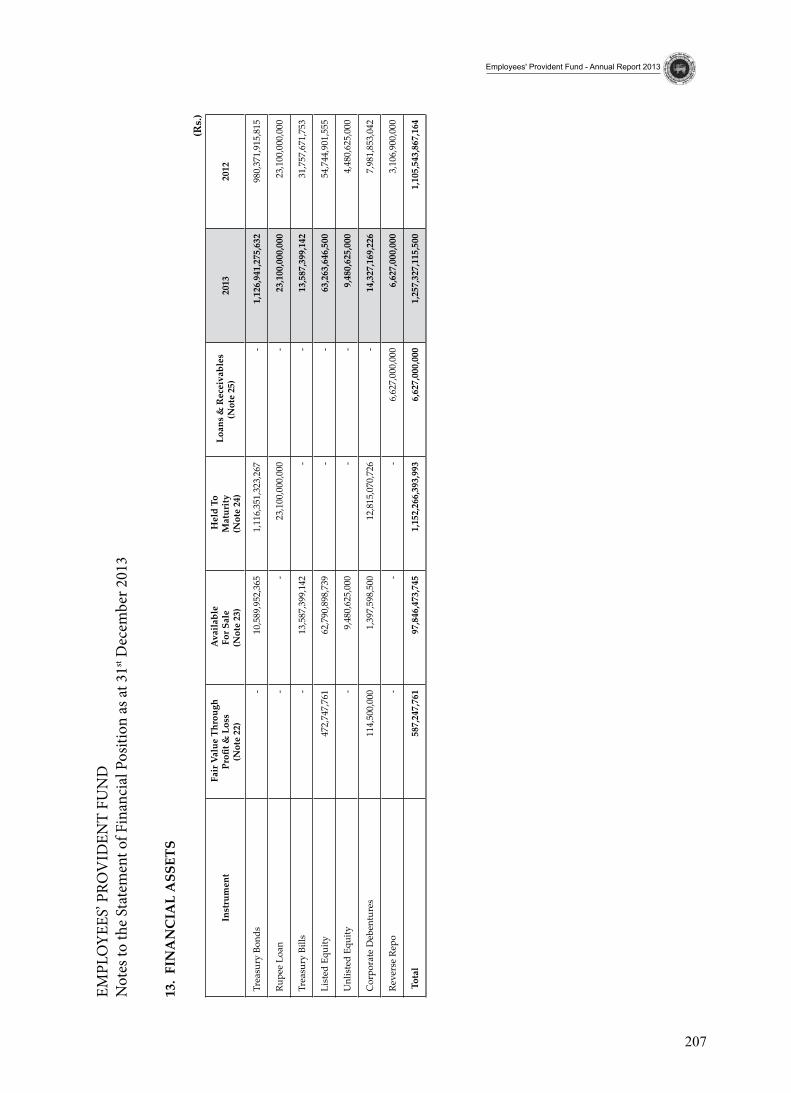
207
Employees' Provident Fund - Annual Report 2013
EMPL
OYE
ES’ P
ROV
IDEN
T FU
ND
Not
es to
the
Stat
emen
t of F
inan
cial
Pos
ition
as a
t 31st
Dec
embe
r 201
3
inst
rum
ent
Fai
r val
ue t
hrou
gh
Profi
t & L
oss
(n
ote
22)
ava
ilabl
e
For s
ale
(n
ote
23)
Hel
d to
M
atur
ity
(not
e 24
)
loa
ns &
rec
eiva
bles
(n
ote
25)
2013
2012
Trea
sury
Bon
ds
- 10
,589
,952
,365
1,1
16,3
51,3
23,2
67
- 1
,126
,941
,275
,632
980
,371
,915
,815
Rupe
e Lo
an -
- 2
3,10
0,00
0,00
0 -
23,
100,
000,
000
23,
100,
000,
000
Trea
sury
Bill
s -
13,
587,
399,
142
- -
13,
587,
399,
142
31,
757,
671,
753
List
ed E
quity
472
,747
,761
6
2,79
0,89
8,73
9 -
- 6
3,26
3,64
6,50
0 5
4,74
4,90
1,55
5
Unl
iste
d Eq
uity
- 9
,480
,625
,000
-
- 9
,480
,625
,000
4
,480
,625
,000
Cor
pora
te D
eben
ture
s 1
14,5
00,0
00
1,3
97,5
98,5
00
12,
815,
070,
726
- 1
4,32
7,16
9,22
6 7
,981
,853
,042
Reve
rse
Repo
- -
- 6
,627
,000
,000
6
,627
,000
,000
3
,106
,900
,000
tot
al
587
,247
,761
97
,846
,473
,745
1,
152,
266,
393,
993
6,6
27,0
00,0
00
1,25
7,32
7,11
5,50
0 1,
105,
543,
867,
164
13.
Fin
an
Cia
l a
sset
s
(rs.
)
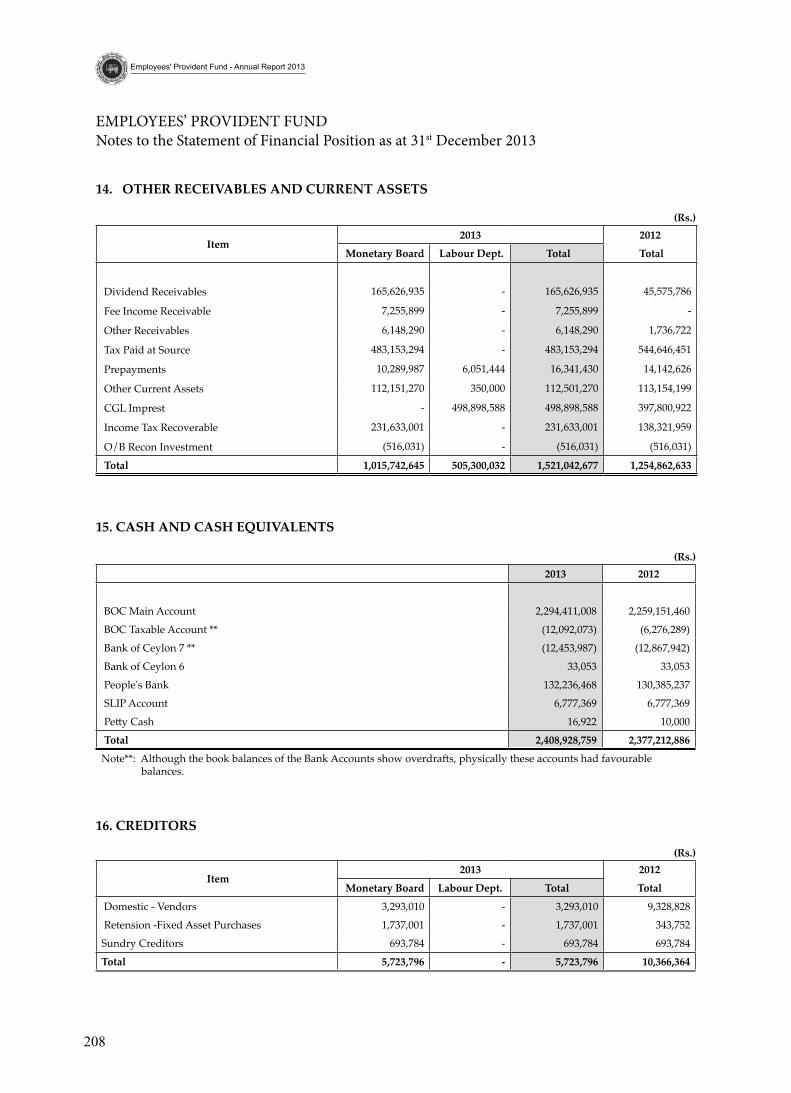
208
Employees' Provident Fund - Annual Report 2013
16. Creditors
item 2013 2012
Monetary board labour dept. total total
Domestic - Vendors 3,293,010 - 3,293,010 9,328,828
Retension -Fixed Asset Purchases 1,737,001 - 1,737,001 343,752
Sundry Creditors 693,784 - 693,784 693,784
total 5,723,796 - 5,723,796 10,366,364
(rs.)
EMPLOYEES’ PROVIDENT FUND Notes to the Statement of Financial Position as at 31st December 2013
(rs.)
14. otHer reCeivables and Current assets
item 2013 2012
Monetary board labour dept. total total
Dividend Receivables 165,626,935 - 165,626,935 45,575,786
Fee Income Receivable 7,255,899 - 7,255,899 -
Other Receivables 6,148,290 - 6,148,290 1,736,722
Tax Paid at Source 483,153,294 - 483,153,294 544,646,451
Prepayments 10,289,987 6,051,444 16,341,430 14,142,626
Other Current Assets 112,151,270 350,000 112,501,270 113,154,199
CGL Imprest - 498,898,588 498,898,588 397,800,922
Income Tax Recoverable 231,633,001 - 231,633,001 138,321,959
O/B Recon Investment (516,031) - (516,031) (516,031)
total 1,015,742,645 505,300,032 1,521,042,677 1,254,862,633
15. CasH and CasH equivalents
2013 2012
BOC Main Account 2,294,411,008 2,259,151,460
BOC Taxable Account ** (12,092,073) (6,276,289)
Bank of Ceylon 7 ** (12,453,987) (12,867,942)
Bank of Ceylon 6 33,053 33,053
People's Bank 132,236,468 130,385,237
SLIP Account 6,777,369 6,777,369
Petty Cash 16,922 10,000
total 2,408,928,759 2,377,212,886
Note**: Although the book balances of the Bank Accounts show overdrafts, physically these accounts had favourable balances.
(rs.)
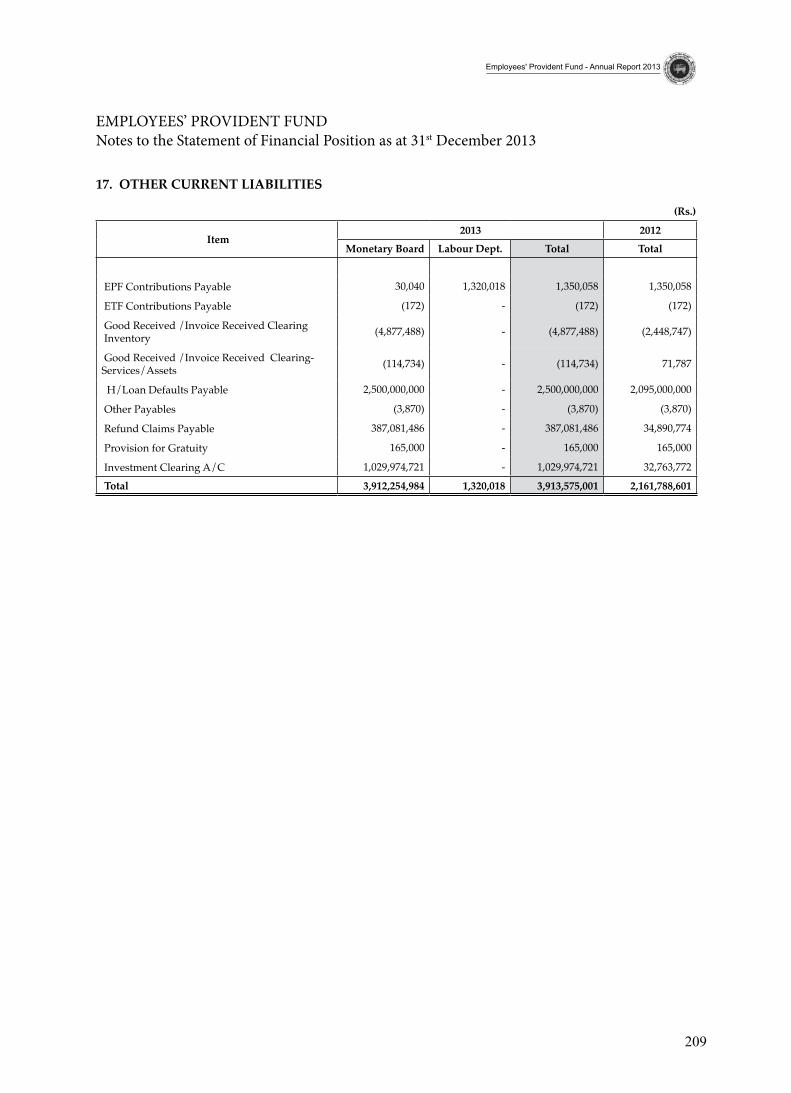
209
Employees' Provident Fund - Annual Report 2013
EMPLOYEES’ PROVIDENT FUND Notes to the Statement of Financial Position as at 31st December 2013
17. otHer Current liabilities
item 2013 2012
Monetary board labour dept. total total
EPF Contributions Payable 30,040 1,320,018 1,350,058 1,350,058
ETF Contributions Payable (172) - (172) (172)
Good Received /Invoice Received Clearing Inventory (4,877,488) - (4,877,488) (2,448,747)
Good Received /Invoice Received Clearing-Services/Assets (114,734) - (114,734) 71,787
H/Loan Defaults Payable 2,500,000,000 - 2,500,000,000 2,095,000,000
Other Payables (3,870) - (3,870) (3,870)
Refund Claims Payable 387,081,486 - 387,081,486 34,890,774
Provision for Gratuity 165,000 - 165,000 165,000
Investment Clearing A/C 1,029,974,721 - 1,029,974,721 32,763,772
total 3,912,254,984 1,320,018 3,913,575,001 2,161,788,601
(rs.)
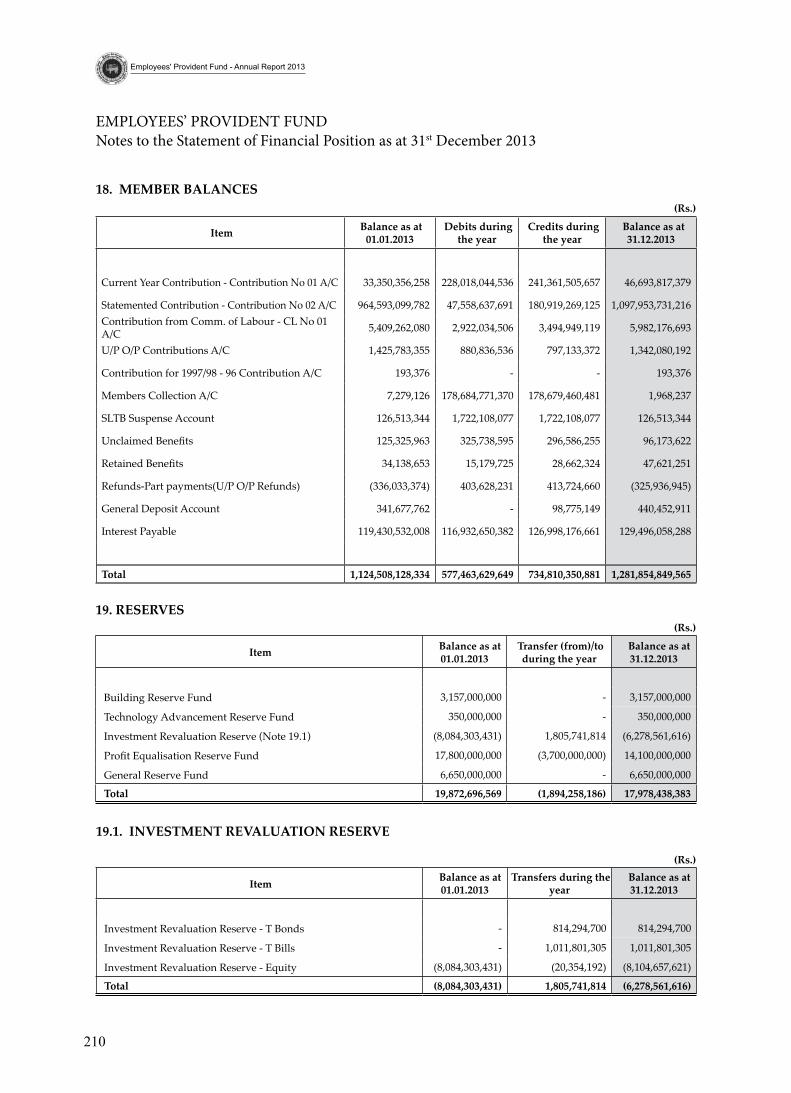
210
Employees' Provident Fund - Annual Report 2013
EMPLOYEES’ PROVIDENT FUND Notes to the Statement of Financial Position as at 31st December 2013
18. MeMber balanCes
item balance as at 01.01.2013
debits during the year
Credits during the year
balance as at 31.12.2013
Current Year Contribution - Contribution No 01 A/C 33,350,356,258 228,018,044,536 241,361,505,657 46,693,817,379
Statemented Contribution - Contribution No 02 A/C 964,593,099,782 47,558,637,691 180,919,269,125 1,097,953,731,216 Contribution from Comm. of Labour - CL No 01 A/C 5,409,262,080 2,922,034,506 3,494,949,119 5,982,176,693
U/P O/P Contributions A/C 1,425,783,355 880,836,536 797,133,372 1,342,080,192
Contribution for 1997/98 - 96 Contribution A/C 193,376 - - 193,376
Members Collection A/C 7,279,126 178,684,771,370 178,679,460,481 1,968,237
SLTB Suspense Account 126,513,344 1,722,108,077 1,722,108,077 126,513,344
Unclaimed Benefits 125,325,963 325,738,595 296,586,255 96,173,622
Retained Benefits 34,138,653 15,179,725 28,662,324 47,621,251
Refunds-Part payments(U/P O/P Refunds) (336,033,374) 403,628,231 413,724,660 (325,936,945)
General Deposit Account 341,677,762 - 98,775,149 440,452,911
Interest Payable 119,430,532,008 116,932,650,382 126,998,176,661 129,496,058,288
total 1,124,508,128,334 577,463,629,649 734,810,350,881 1,281,854,849,565
(rs.)
19. reserves
19.1. investMent revaluation reserve
Item Balance as at 01.01.2013
Transfer (from)/to during the year
Balance as at 31.12.2013
Building Reserve Fund 3,157,000,000 - 3,157,000,000
Technology Advancement Reserve Fund 350,000,000 - 350,000,000
Investment Revaluation Reserve (Note 19.1) (8,084,303,431) 1,805,741,814 (6,278,561,616)
Profit Equalisation Reserve Fund 17,800,000,000 (3,700,000,000) 14,100,000,000
General Reserve Fund 6,650,000,000 - 6,650,000,000
total 19,872,696,569 (1,894,258,186) 17,978,438,383
Item balance as at 01.01.2013
transfers during the year
balance as at 31.12.2013
Investment Revaluation Reserve - T Bonds - 814,294,700 814,294,700
Investment Revaluation Reserve - T Bills - 1,011,801,305 1,011,801,305
Investment Revaluation Reserve - Equity (8,084,303,431) (20,354,192) (8,104,657,621)
total (8,084,303,431) 1,805,741,814 (6,278,561,616)
(rs.)
(rs.)
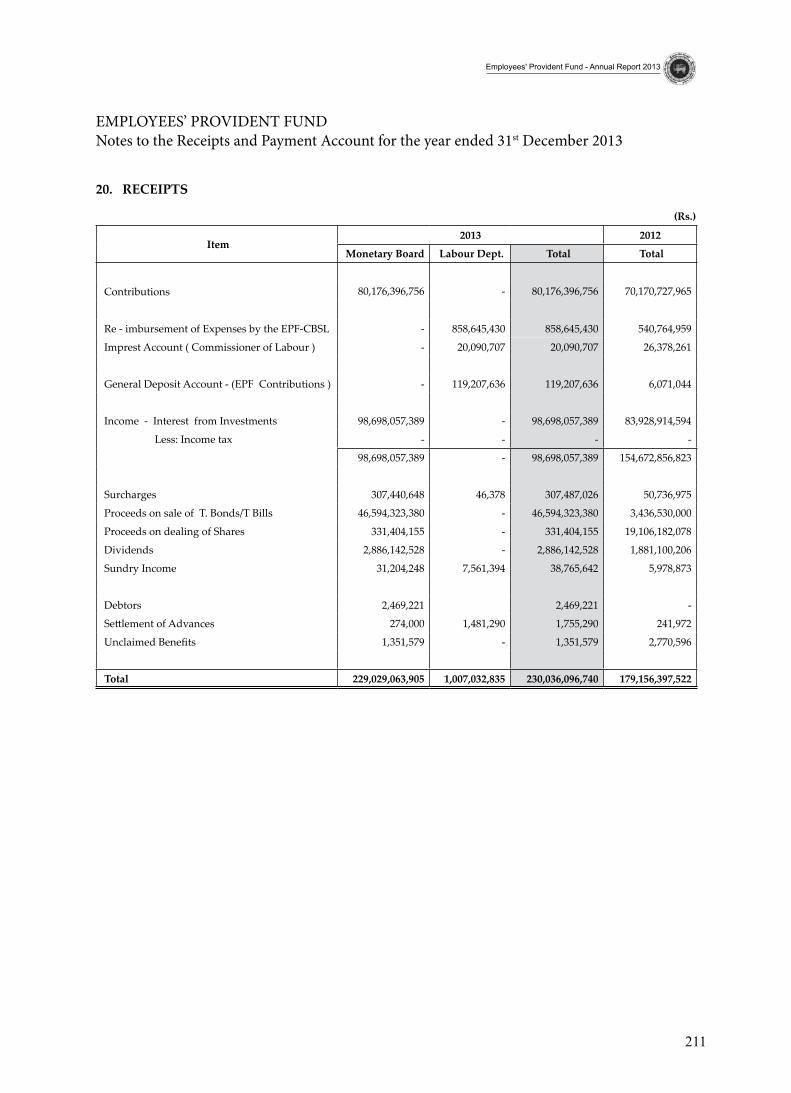
211
Employees' Provident Fund - Annual Report 2013
EMPLOYEES’ PROVIDENT FUND Notes to the Receipts and Payment Account for the year ended 31st December 2013
20. reCeiPts
item 2013 2012
Monetary board labour dept. total total
Contributions 80,176,396,756 - 80,176,396,756 70,170,727,965
Re - imbursement of Expenses by the EPF-CBSL - 858,645,430 858,645,430 540,764,959
Imprest Account ( Commissioner of Labour ) - 20,090,707 20,090,707 26,378,261
General Deposit Account - (EPF Contributions ) - 119,207,636 119,207,636 6,071,044
Income - Interest from Investments 98,698,057,389 - 98,698,057,389 83,928,914,594
Less: Income tax - - - -
98,698,057,389 - 98,698,057,389 154,672,856,823
Surcharges 307,440,648 46,378 307,487,026 50,736,975
Proceeds on sale of T. Bonds/T Bills 46,594,323,380 - 46,594,323,380 3,436,530,000
Proceeds on dealing of Shares 331,404,155 - 331,404,155 19,106,182,078
Dividends 2,886,142,528 - 2,886,142,528 1,881,100,206
Sundry Income 31,204,248 7,561,394 38,765,642 5,978,873
Debtors 2,469,221 2,469,221 -
Settlement of Advances 274,000 1,481,290 1,755,290 241,972
Unclaimed Benefits 1,351,579 - 1,351,579 2,770,596
total 229,029,063,905 1,007,032,835 230,036,096,740 179,156,397,522
(rs.)
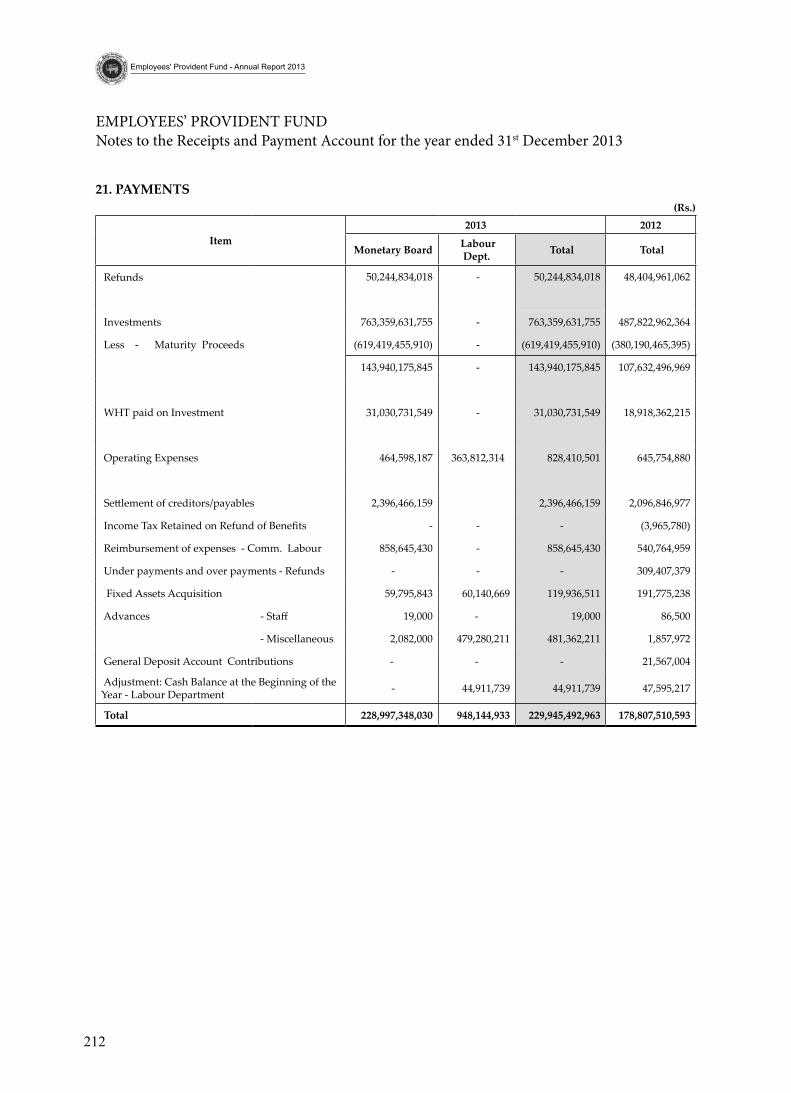
212
Employees' Provident Fund - Annual Report 2013
21. PayMents
item2013 2012
Monetary board labour dept. total total
Refunds 50,244,834,018 - 50,244,834,018 48,404,961,062
Investments 763,359,631,755 - 763,359,631,755 487,822,962,364
Less - Maturity Proceeds (619,419,455,910) - (619,419,455,910) (380,190,465,395)
143,940,175,845 - 143,940,175,845 107,632,496,969
WHT paid on Investment 31,030,731,549 - 31,030,731,549 18,918,362,215
Operating Expenses 464,598,187 363,812,314 828,410,501 645,754,880
Settlement of creditors/payables 2,396,466,159 2,396,466,159 2,096,846,977
Income Tax Retained on Refund of Benefits - - - (3,965,780)
Reimbursement of expenses - Comm. Labour 858,645,430 - 858,645,430 540,764,959
Under payments and over payments - Refunds - - - 309,407,379
Fixed Assets Acquisition 59,795,843 60,140,669 119,936,511 191,775,238
Advances - Staff 19,000 - 19,000 86,500
- Miscellaneous 2,082,000 479,280,211 481,362,211 1,857,972
General Deposit Account Contributions - - - 21,567,004
Adjustment: Cash Balance at the Beginning of the Year - Labour Department - 44,911,739 44,911,739 47,595,217
total 228,997,348,030 948,144,933 229,945,492,963 178,807,510,593
(rs.)
EMPLOYEES’ PROVIDENT FUND Notes to the Receipts and Payment Account for the year ended 31st December 2013
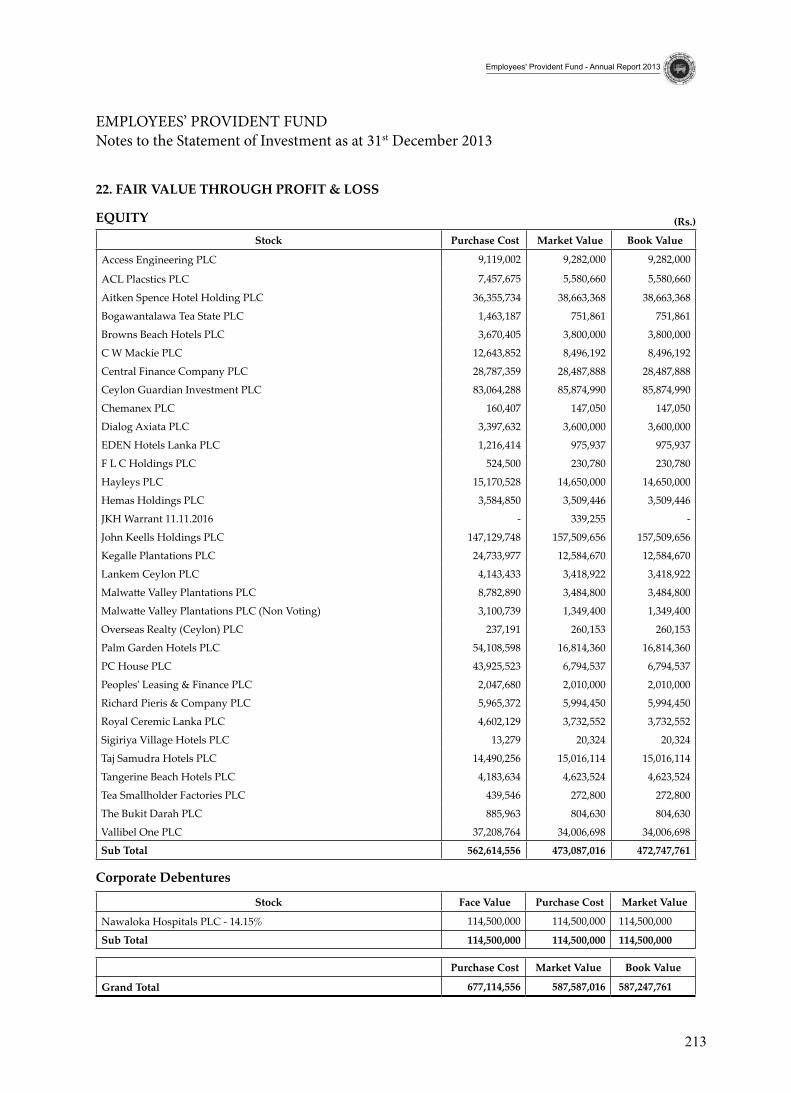
213
Employees' Provident Fund - Annual Report 2013
EMPLOYEES’ PROVIDENT FUND Notes to the Statement of Investment as at 31st December 2013
(rs.)
22. Fair value tHrougH ProFit & loss
equityStock Purchase Cost Market Value Book Value
Access Engineering PLC 9,119,002 9,282,000 9,282,000
ACL Placstics PLC 7,457,675 5,580,660 5,580,660
Aitken Spence Hotel Holding PLC 36,355,734 38,663,368 38,663,368
Bogawantalawa Tea State PLC 1,463,187 751,861 751,861
Browns Beach Hotels PLC 3,670,405 3,800,000 3,800,000
C W Mackie PLC 12,643,852 8,496,192 8,496,192
Central Finance Company PLC 28,787,359 28,487,888 28,487,888
Ceylon Guardian Investment PLC 83,064,288 85,874,990 85,874,990
Chemanex PLC 160,407 147,050 147,050
Dialog Axiata PLC 3,397,632 3,600,000 3,600,000
EDEN Hotels Lanka PLC 1,216,414 975,937 975,937
F L C Holdings PLC 524,500 230,780 230,780
Hayleys PLC 15,170,528 14,650,000 14,650,000
Hemas Holdings PLC 3,584,850 3,509,446 3,509,446
JKH Warrant 11.11.2016 - 339,255 -
John Keells Holdings PLC 147,129,748 157,509,656 157,509,656
Kegalle Plantations PLC 24,733,977 12,584,670 12,584,670
Lankem Ceylon PLC 4,143,433 3,418,922 3,418,922
Malwatte Valley Plantations PLC 8,782,890 3,484,800 3,484,800
Malwatte Valley Plantations PLC (Non Voting) 3,100,739 1,349,400 1,349,400
Overseas Realty (Ceylon) PLC 237,191 260,153 260,153
Palm Garden Hotels PLC 54,108,598 16,814,360 16,814,360
PC House PLC 43,925,523 6,794,537 6,794,537
Peoples' Leasing & Finance PLC 2,047,680 2,010,000 2,010,000
Richard Pieris & Company PLC 5,965,372 5,994,450 5,994,450
Royal Ceremic Lanka PLC 4,602,129 3,732,552 3,732,552
Sigiriya Village Hotels PLC 13,279 20,324 20,324
Taj Samudra Hotels PLC 14,490,256 15,016,114 15,016,114
Tangerine Beach Hotels PLC 4,183,634 4,623,524 4,623,524
Tea Smallholder Factories PLC 439,546 272,800 272,800
The Bukit Darah PLC 885,963 804,630 804,630
Vallibel One PLC 37,208,764 34,006,698 34,006,698
sub total 562,614,556 473,087,016 472,747,761
Corporate debentures
Stock Face Value Purchase Cost Market Value
Nawaloka Hospitals PLC - 14.15% 114,500,000 114,500,000 114,500,000
sub total 114,500,000 114,500,000 114,500,000
Purchase Cost Market value book value
Grand Total 677,114,556 587,587,016 587,247,761
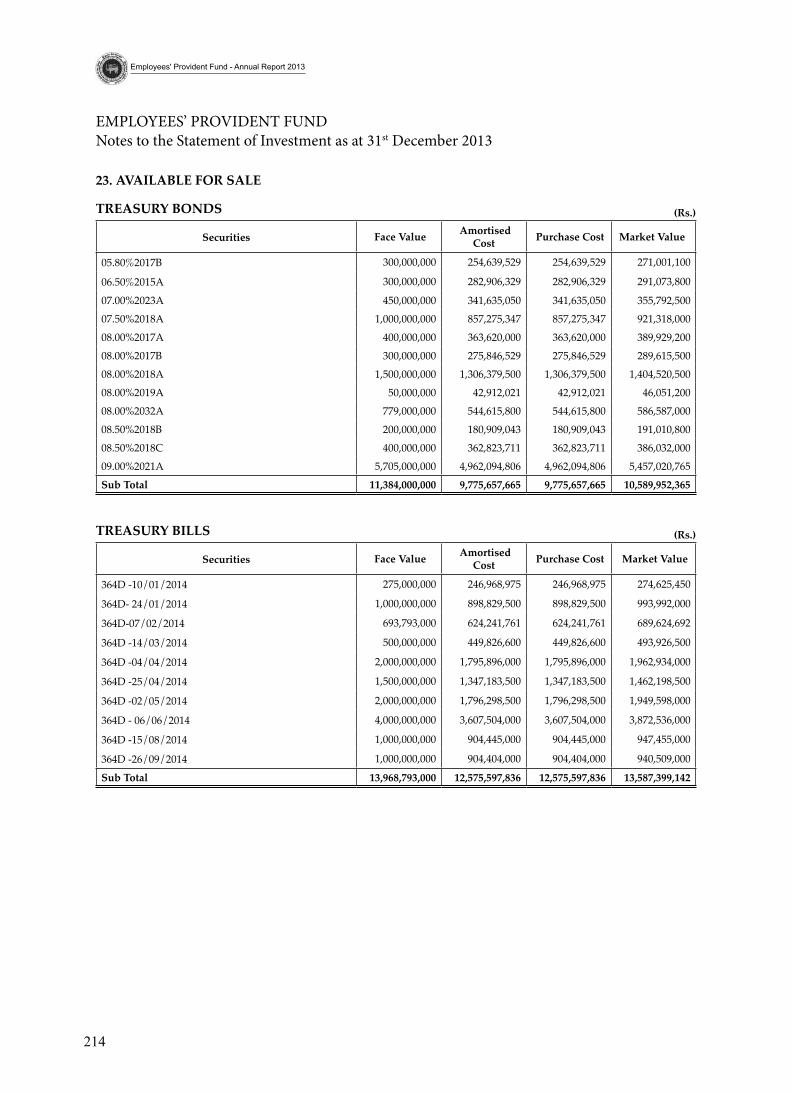
214
Employees' Provident Fund - Annual Report 2013
EMPLOYEES’ PROVIDENT FUND Notes to the Statement of Investment as at 31st December 2013
(rs.)
(rs.)
23. available For sale
treasury bonds
treasury bills
Securities Face value amortised Cost Purchase Cost Market value
05.80%2017B 300,000,000 254,639,529 254,639,529 271,001,100
06.50%2015A 300,000,000 282,906,329 282,906,329 291,073,800
07.00%2023A 450,000,000 341,635,050 341,635,050 355,792,500
07.50%2018A 1,000,000,000 857,275,347 857,275,347 921,318,000
08.00%2017A 400,000,000 363,620,000 363,620,000 389,929,200
08.00%2017B 300,000,000 275,846,529 275,846,529 289,615,500
08.00%2018A 1,500,000,000 1,306,379,500 1,306,379,500 1,404,520,500
08.00%2019A 50,000,000 42,912,021 42,912,021 46,051,200
08.00%2032A 779,000,000 544,615,800 544,615,800 586,587,000
08.50%2018B 200,000,000 180,909,043 180,909,043 191,010,800
08.50%2018C 400,000,000 362,823,711 362,823,711 386,032,000
09.00%2021A 5,705,000,000 4,962,094,806 4,962,094,806 5,457,020,765
sub total 11,384,000,000 9,775,657,665 9,775,657,665 10,589,952,365
Securities Face value amortised Cost Purchase Cost Market value
364D -10/01/2014 275,000,000 246,968,975 246,968,975 274,625,450
364D- 24/01/2014 1,000,000,000 898,829,500 898,829,500 993,992,000
364D-07/02/2014 693,793,000 624,241,761 624,241,761 689,624,692
364D -14/03/2014 500,000,000 449,826,600 449,826,600 493,926,500
364D -04/04/2014 2,000,000,000 1,795,896,000 1,795,896,000 1,962,934,000
364D -25/04/2014 1,500,000,000 1,347,183,500 1,347,183,500 1,462,198,500
364D -02/05/2014 2,000,000,000 1,796,298,500 1,796,298,500 1,949,598,000
364D - 06/06/2014 4,000,000,000 3,607,504,000 3,607,504,000 3,872,536,000
364D -15/08/2014 1,000,000,000 904,445,000 904,445,000 947,455,000
364D -26/09/2014 1,000,000,000 904,404,000 904,404,000 940,509,000
sub total 13,968,793,000 12,575,597,836 12,575,597,836 13,587,399,142

215
Employees' Provident Fund - Annual Report 2013
EMPLOYEES’ PROVIDENT FUND Notes to the Statement of Investment as at 31st December 2013
(rs.)equityStock Book value Purchase Cost Market value
Listed Equity
Access Engineering PLC 718,425,054 708,923,190 718,425,054
ACL Cables PLC 204,300,397 151,706,495 204,300,397
Aitken Spence Company PLC 466,596,745 494,336,252 466,596,745
Aitken Spence Hotels Holdings PLC 2,077,774,005 1,590,089,511 2,077,774,005
Amaya Leisure PLC 341,934,686 340,028,021 341,934,686
Asian Hotels & Properties PLC 2,727,069,239 3,116,355,022 2,727,069,239
Asiri Surgical Hospital PLC 2,448,825 1,680,649 2,448,825
Browns & Co PLC 547,610,042 1,769,404,852 547,610,042
Cargills (Cey) PLC 1,073,728,572 1,364,040,065 1,073,728,572
Carsons Cumberbatch PLC 1,796,681,250 2,420,550,983 1,796,681,250
Central Finance Company PLC 1,728,742,928 2,348,771,536 1,728,742,928
Ceylon Cold Stores PLC 177,399,040 27,026,584 177,399,040
Ceylon Grain Elevators PLC 189,944,490 1,005,584,993 189,944,490
Ceylon Guardian Investment PLC 294,999,417 320,182,231 294,999,417
Ceylon Hospitals PLC (Non Voting) 86,577,825 25,410,556 86,577,825
Ceylon Tea Services PLC 1,009,733,364 1,006,252,143 1,009,733,364
Ceylon Theatres PLC 972,672,410 1,080,050,500 972,672,410
Chevron Lubricants Lanka PLC 684,112,775 249,263,948 684,112,775
CIC Holdings PLC (Non Voting) 84,079,571 192,174,270 84,079,571
CIC Holdings PLC (Voting) 212,817,688 486,078,762 212,817,688
Colombo Dockyard PLC 2,019,119,604 2,571,844,873 2,019,119,604
Commercial Bank of Ceylon PLC 9,341,394,734 7,992,962,707 9,341,394,734
Ceylon Hotel Co-operation 314,239,280 711,242,903 314,239,280
DFCC Bank 3,143,600,355 3,395,967,521 3,143,600,355
Dialog Axiata PLC 1,920,020,292 1,986,277,573 1,920,020,292
Diesel & Motor Engineering PLC 590,813,743 1,265,738,355 590,813,743
Dipped Products PLC 703,823,040 888,569,146 703,823,040
EDEN Hotels Lanka PLC 143,839,050 216,935,905 146,700,270
Galadari Hotels (Lanka) PLC 267,947,860 810,321,610 267,947,860
Hatton National Bank PLC 4,679,981,964 5,166,481,391 4,679,981,964
Haycarb PLC 241,806,339 212,329,485 241,806,339
Hayleys MGT Knitting Mills PLC 45,101,520 199,555,228 45,101,520
Hayleys PLC 692,226,564 620,010,109 692,226,564
Hemas Holdings PLC 926,810,148 607,825,728 926,810,148
JKH Warrant 11.11.2016 - - 9,036,657
John Keells Holdings PLC 730,108,179 670,381,103 731,374,498
John Keells Hotels PLC 980,929,425 1,166,287,946 980,929,425
Lanka IOC PLC 522,546,887 505,031,731 522,546,887
Lanka Orix Leasing Co PLC 1,102,232,003 1,611,012,568 1,102,232,003
Lanka Tiles PLC 417,822,998 432,883,507 417,822,998
Lanka Walltiles PLC 75,520,907 74,559,013 75,520,907
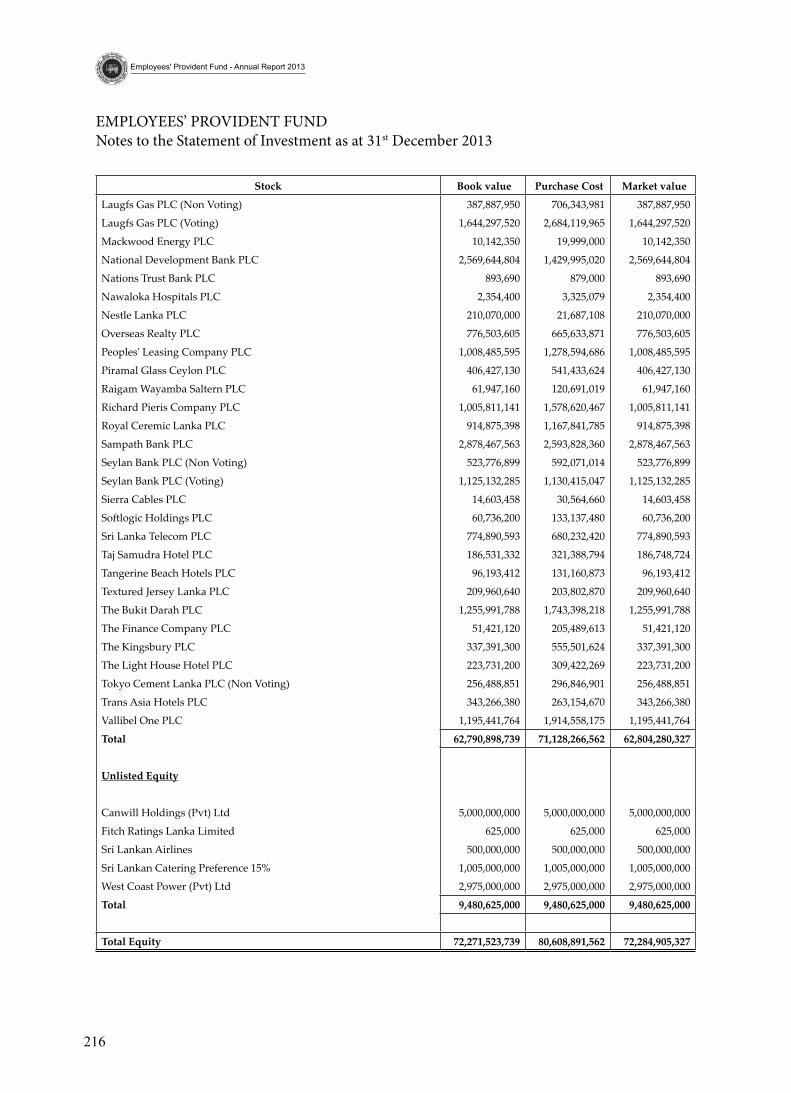
216
Employees' Provident Fund - Annual Report 2013
EMPLOYEES’ PROVIDENT FUND Notes to the Statement of Investment as at 31st December 2013
Stock Book value Purchase Cost Market value
Laugfs Gas PLC (Non Voting) 387,887,950 706,343,981 387,887,950
Laugfs Gas PLC (Voting) 1,644,297,520 2,684,119,965 1,644,297,520
Mackwood Energy PLC 10,142,350 19,999,000 10,142,350
National Development Bank PLC 2,569,644,804 1,429,995,020 2,569,644,804
Nations Trust Bank PLC 893,690 879,000 893,690
Nawaloka Hospitals PLC 2,354,400 3,325,079 2,354,400
Nestle Lanka PLC 210,070,000 21,687,108 210,070,000
Overseas Realty PLC 776,503,605 665,633,871 776,503,605
Peoples' Leasing Company PLC 1,008,485,595 1,278,594,686 1,008,485,595
Piramal Glass Ceylon PLC 406,427,130 541,433,624 406,427,130
Raigam Wayamba Saltern PLC 61,947,160 120,691,019 61,947,160
Richard Pieris Company PLC 1,005,811,141 1,578,620,467 1,005,811,141
Royal Ceremic Lanka PLC 914,875,398 1,167,841,785 914,875,398
Sampath Bank PLC 2,878,467,563 2,593,828,360 2,878,467,563
Seylan Bank PLC (Non Voting) 523,776,899 592,071,014 523,776,899
Seylan Bank PLC (Voting) 1,125,132,285 1,130,415,047 1,125,132,285
Sierra Cables PLC 14,603,458 30,564,660 14,603,458
Softlogic Holdings PLC 60,736,200 133,137,480 60,736,200
Sri Lanka Telecom PLC 774,890,593 680,232,420 774,890,593
Taj Samudra Hotel PLC 186,531,332 321,388,794 186,748,724
Tangerine Beach Hotels PLC 96,193,412 131,160,873 96,193,412
Textured Jersey Lanka PLC 209,960,640 203,802,870 209,960,640
The Bukit Darah PLC 1,255,991,788 1,743,398,218 1,255,991,788
The Finance Company PLC 51,421,120 205,489,613 51,421,120
The Kingsbury PLC 337,391,300 555,501,624 337,391,300
The Light House Hotel PLC 223,731,200 309,422,269 223,731,200
Tokyo Cement Lanka PLC (Non Voting) 256,488,851 296,846,901 256,488,851
Trans Asia Hotels PLC 343,266,380 263,154,670 343,266,380
Vallibel One PLC 1,195,441,764 1,914,558,175 1,195,441,764
total 62,790,898,739 71,128,266,562 62,804,280,327
unlisted equity
Canwill Holdings (Pvt) Ltd 5,000,000,000 5,000,000,000 5,000,000,000
Fitch Ratings Lanka Limited 625,000 625,000 625,000
Sri Lankan Airlines 500,000,000 500,000,000 500,000,000
Sri Lankan Catering Preference 15% 1,005,000,000 1,005,000,000 1,005,000,000
West Coast Power (Pvt) Ltd 2,975,000,000 2,975,000,000 2,975,000,000
total 9,480,625,000 9,480,625,000 9,480,625,000
total equity 72,271,523,739 80,608,891,562 72,284,905,327
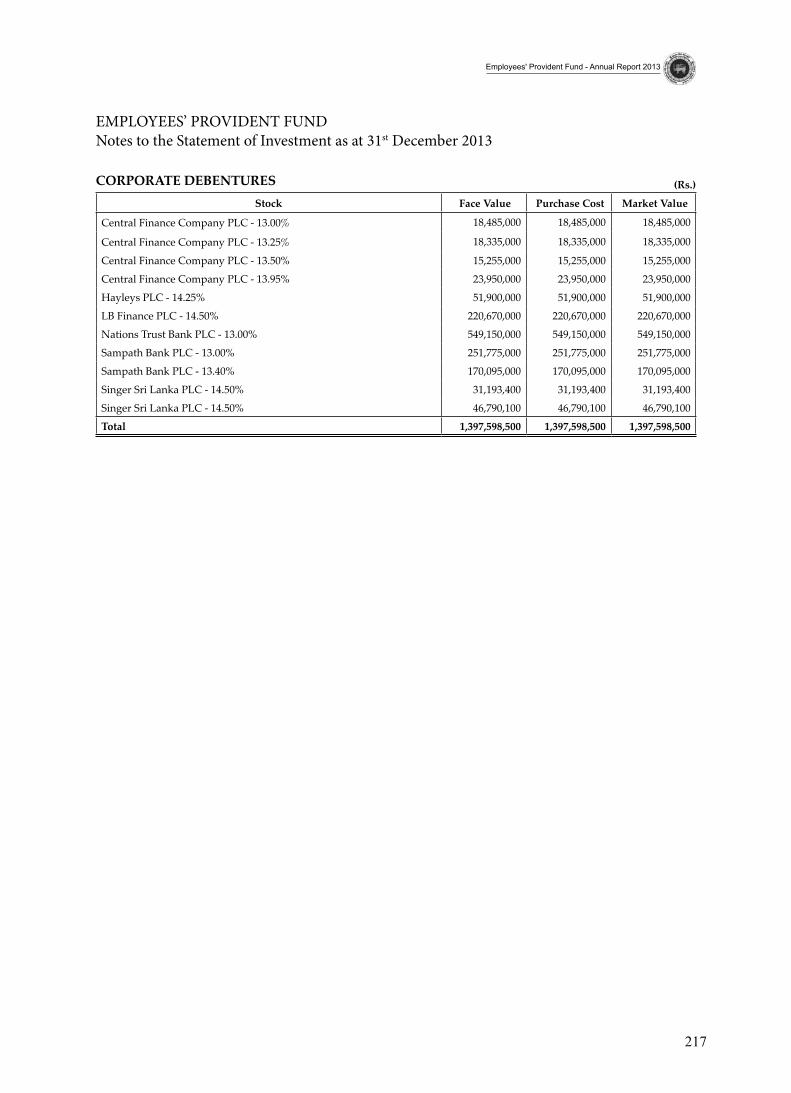
217
Employees' Provident Fund - Annual Report 2013
EMPLOYEES’ PROVIDENT FUND Notes to the Statement of Investment as at 31st December 2013
(rs.)CorPorate debenturesStock Face Value Purchase Cost Market Value
Central Finance Company PLC - 13.00% 18,485,000 18,485,000 18,485,000
Central Finance Company PLC - 13.25% 18,335,000 18,335,000 18,335,000
Central Finance Company PLC - 13.50% 15,255,000 15,255,000 15,255,000
Central Finance Company PLC - 13.95% 23,950,000 23,950,000 23,950,000
Hayleys PLC - 14.25% 51,900,000 51,900,000 51,900,000
LB Finance PLC - 14.50% 220,670,000 220,670,000 220,670,000
Nations Trust Bank PLC - 13.00% 549,150,000 549,150,000 549,150,000
Sampath Bank PLC - 13.00% 251,775,000 251,775,000 251,775,000
Sampath Bank PLC - 13.40% 170,095,000 170,095,000 170,095,000
Singer Sri Lanka PLC - 14.50% 31,193,400 31,193,400 31,193,400
Singer Sri Lanka PLC - 14.50% 46,790,100 46,790,100 46,790,100
total 1,397,598,500 1,397,598,500 1,397,598,500
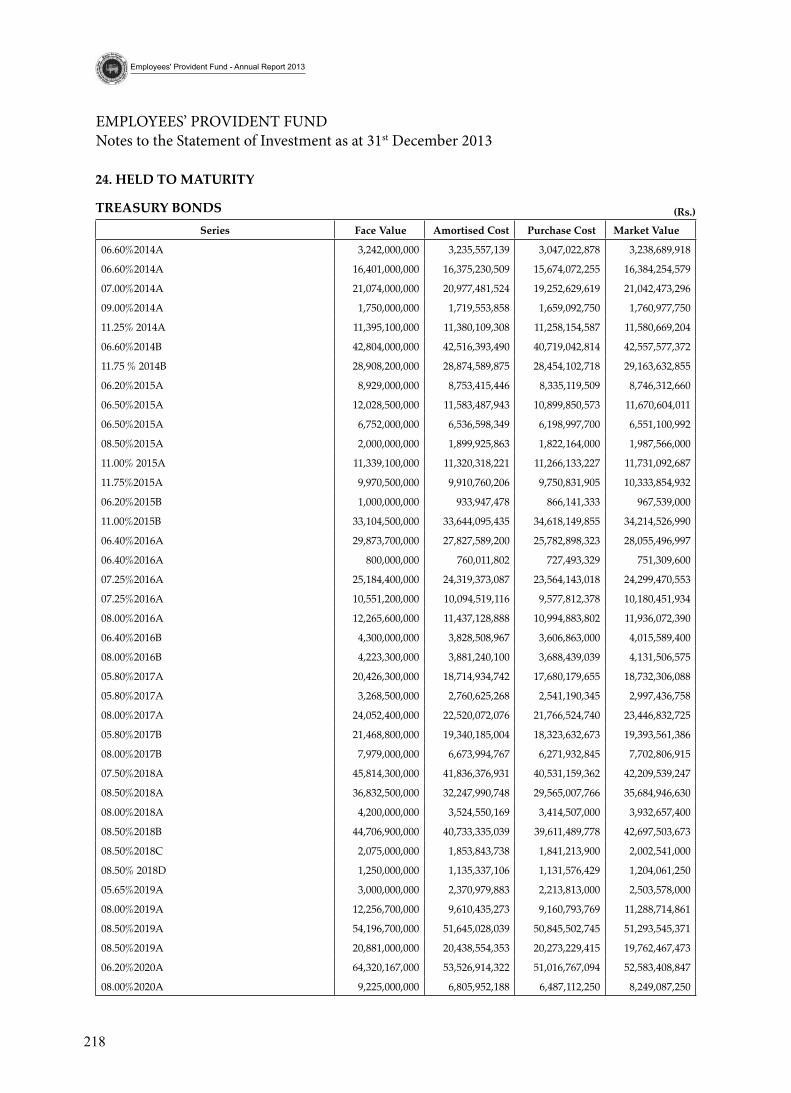
218
Employees' Provident Fund - Annual Report 2013
EMPLOYEES’ PROVIDENT FUND Notes to the Statement of Investment as at 31st December 2013
(rs.)
24. Held to Maturity
treasury bondsSeries Face Value Amortised Cost Purchase Cost Market Value
06.60%2014A 3,242,000,000 3,235,557,139 3,047,022,878 3,238,689,918
06.60%2014A 16,401,000,000 16,375,230,509 15,674,072,255 16,384,254,579
07.00%2014A 21,074,000,000 20,977,481,524 19,252,629,619 21,042,473,296
09.00%2014A 1,750,000,000 1,719,553,858 1,659,092,750 1,760,977,750
11.25% 2014A 11,395,100,000 11,380,109,308 11,258,154,587 11,580,669,204
06.60%2014B 42,804,000,000 42,516,393,490 40,719,042,814 42,557,577,372
11.75 % 2014B 28,908,200,000 28,874,589,875 28,454,102,718 29,163,632,855
06.20%2015A 8,929,000,000 8,753,415,446 8,335,119,509 8,746,312,660
06.50%2015A 12,028,500,000 11,583,487,943 10,899,850,573 11,670,604,011
06.50%2015A 6,752,000,000 6,536,598,349 6,198,997,700 6,551,100,992
08.50%2015A 2,000,000,000 1,899,925,863 1,822,164,000 1,987,566,000
11.00% 2015A 11,339,100,000 11,320,318,221 11,266,133,227 11,731,092,687
11.75%2015A 9,970,500,000 9,910,760,206 9,750,831,905 10,333,854,932
06.20%2015B 1,000,000,000 933,947,478 866,141,333 967,539,000
11.00%2015B 33,104,500,000 33,644,095,435 34,618,149,855 34,214,526,990
06.40%2016A 29,873,700,000 27,827,589,200 25,782,898,323 28,055,496,997
06.40%2016A 800,000,000 760,011,802 727,493,329 751,309,600
07.25%2016A 25,184,400,000 24,319,373,087 23,564,143,018 24,299,470,553
07.25%2016A 10,551,200,000 10,094,519,116 9,577,812,378 10,180,451,934
08.00%2016A 12,265,600,000 11,437,128,888 10,994,883,802 11,936,072,390
06.40%2016B 4,300,000,000 3,828,508,967 3,606,863,000 4,015,589,400
08.00%2016B 4,223,300,000 3,881,240,100 3,688,439,039 4,131,506,575
05.80%2017A 20,426,300,000 18,714,934,742 17,680,179,655 18,732,306,088
05.80%2017A 3,268,500,000 2,760,625,268 2,541,190,345 2,997,436,758
08.00%2017A 24,052,400,000 22,520,072,076 21,766,524,740 23,446,832,725
05.80%2017B 21,468,800,000 19,340,185,004 18,323,632,673 19,393,561,386
08.00%2017B 7,979,000,000 6,673,994,767 6,271,932,845 7,702,806,915
07.50%2018A 45,814,300,000 41,836,376,931 40,531,159,362 42,209,539,247
08.50%2018A 36,832,500,000 32,247,990,748 29,565,007,766 35,684,946,630
08.00%2018A 4,200,000,000 3,524,550,169 3,414,507,000 3,932,657,400
08.50%2018B 44,706,900,000 40,733,335,039 39,611,489,778 42,697,503,673
08.50%2018C 2,075,000,000 1,853,843,738 1,841,213,900 2,002,541,000
08.50% 2018D 1,250,000,000 1,135,337,106 1,131,576,429 1,204,061,250
05.65%2019A 3,000,000,000 2,370,979,883 2,213,813,000 2,503,578,000
08.00%2019A 12,256,700,000 9,610,435,273 9,160,793,769 11,288,714,861
08.50%2019A 54,196,700,000 51,645,028,039 50,845,502,745 51,293,545,371
08.50%2019A 20,881,000,000 20,438,554,353 20,273,229,415 19,762,467,473
06.20%2020A 64,320,167,000 53,526,914,322 51,016,767,094 52,583,408,847
08.00%2020A 9,225,000,000 6,805,952,188 6,487,112,250 8,249,087,250
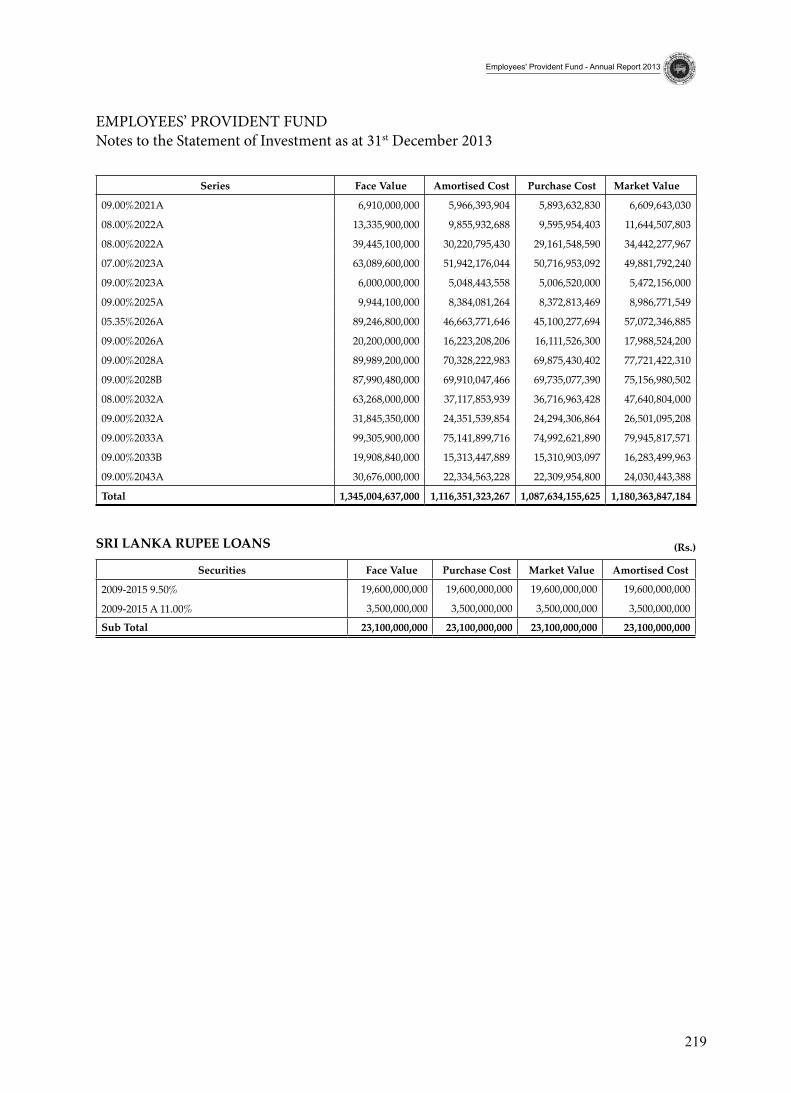
219
Employees' Provident Fund - Annual Report 2013
EMPLOYEES’ PROVIDENT FUND Notes to the Statement of Investment as at 31st December 2013
Series Face Value Amortised Cost Purchase Cost Market Value
09.00%2021A 6,910,000,000 5,966,393,904 5,893,632,830 6,609,643,030
08.00%2022A 13,335,900,000 9,855,932,688 9,595,954,403 11,644,507,803
08.00%2022A 39,445,100,000 30,220,795,430 29,161,548,590 34,442,277,967
07.00%2023A 63,089,600,000 51,942,176,044 50,716,953,092 49,881,792,240
09.00%2023A 6,000,000,000 5,048,443,558 5,006,520,000 5,472,156,000
09.00%2025A 9,944,100,000 8,384,081,264 8,372,813,469 8,986,771,549
05.35%2026A 89,246,800,000 46,663,771,646 45,100,277,694 57,072,346,885
09.00%2026A 20,200,000,000 16,223,208,206 16,111,526,300 17,988,524,200
09.00%2028A 89,989,200,000 70,328,222,983 69,875,430,402 77,721,422,310
09.00%2028B 87,990,480,000 69,910,047,466 69,735,077,390 75,156,980,502
08.00%2032A 63,268,000,000 37,117,853,939 36,716,963,428 47,640,804,000
09.00%2032A 31,845,350,000 24,351,539,854 24,294,306,864 26,501,095,208
09.00%2033A 99,305,900,000 75,141,899,716 74,992,621,890 79,945,817,571
09.00%2033B 19,908,840,000 15,313,447,889 15,310,903,097 16,283,499,963
09.00%2043A 30,676,000,000 22,334,563,228 22,309,954,800 24,030,443,388
Total 1,345,004,637,000 1,116,351,323,267 1,087,634,155,625 1,180,363,847,184
(rs.)sri lanka ruPee loans
Securities Face Value Purchase Cost Market Value Amortised Cost
2009-2015 9.50% 19,600,000,000 19,600,000,000 19,600,000,000 19,600,000,000
2009-2015 A 11.00% 3,500,000,000 3,500,000,000 3,500,000,000 3,500,000,000
sub total 23,100,000,000 23,100,000,000 23,100,000,000 23,100,000,000
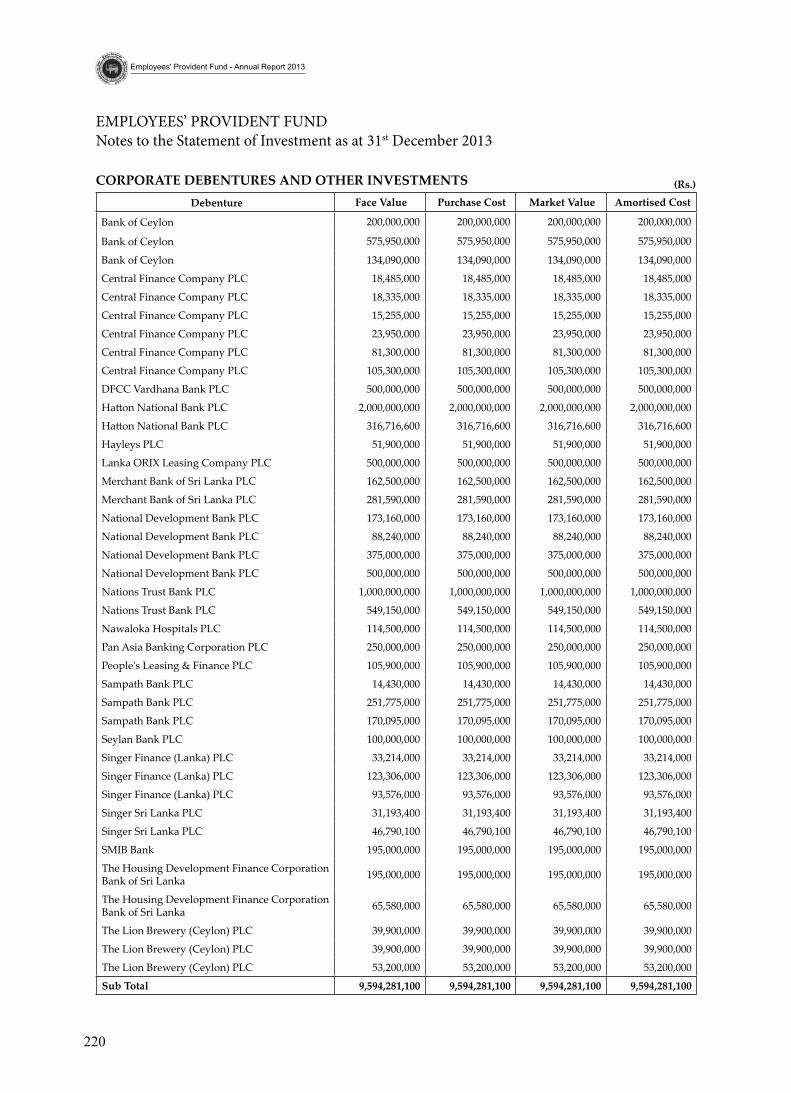
220
Employees' Provident Fund - Annual Report 2013
EMPLOYEES’ PROVIDENT FUND Notes to the Statement of Investment as at 31st December 2013
(rs.)CorPorate debentures and otHer investMents Debenture Face value Purchase Cost Market value amortised Cost
Bank of Ceylon 200,000,000 200,000,000 200,000,000 200,000,000
Bank of Ceylon 575,950,000 575,950,000 575,950,000 575,950,000
Bank of Ceylon 134,090,000 134,090,000 134,090,000 134,090,000
Central Finance Company PLC 18,485,000 18,485,000 18,485,000 18,485,000
Central Finance Company PLC 18,335,000 18,335,000 18,335,000 18,335,000
Central Finance Company PLC 15,255,000 15,255,000 15,255,000 15,255,000
Central Finance Company PLC 23,950,000 23,950,000 23,950,000 23,950,000
Central Finance Company PLC 81,300,000 81,300,000 81,300,000 81,300,000
Central Finance Company PLC 105,300,000 105,300,000 105,300,000 105,300,000
DFCC Vardhana Bank PLC 500,000,000 500,000,000 500,000,000 500,000,000
Hatton National Bank PLC 2,000,000,000 2,000,000,000 2,000,000,000 2,000,000,000
Hatton National Bank PLC 316,716,600 316,716,600 316,716,600 316,716,600
Hayleys PLC 51,900,000 51,900,000 51,900,000 51,900,000
Lanka ORIX Leasing Company PLC 500,000,000 500,000,000 500,000,000 500,000,000
Merchant Bank of Sri Lanka PLC 162,500,000 162,500,000 162,500,000 162,500,000
Merchant Bank of Sri Lanka PLC 281,590,000 281,590,000 281,590,000 281,590,000
National Development Bank PLC 173,160,000 173,160,000 173,160,000 173,160,000
National Development Bank PLC 88,240,000 88,240,000 88,240,000 88,240,000
National Development Bank PLC 375,000,000 375,000,000 375,000,000 375,000,000
National Development Bank PLC 500,000,000 500,000,000 500,000,000 500,000,000
Nations Trust Bank PLC 1,000,000,000 1,000,000,000 1,000,000,000 1,000,000,000
Nations Trust Bank PLC 549,150,000 549,150,000 549,150,000 549,150,000
Nawaloka Hospitals PLC 114,500,000 114,500,000 114,500,000 114,500,000
Pan Asia Banking Corporation PLC 250,000,000 250,000,000 250,000,000 250,000,000
People's Leasing & Finance PLC 105,900,000 105,900,000 105,900,000 105,900,000
Sampath Bank PLC 14,430,000 14,430,000 14,430,000 14,430,000
Sampath Bank PLC 251,775,000 251,775,000 251,775,000 251,775,000
Sampath Bank PLC 170,095,000 170,095,000 170,095,000 170,095,000
Seylan Bank PLC 100,000,000 100,000,000 100,000,000 100,000,000
Singer Finance (Lanka) PLC 33,214,000 33,214,000 33,214,000 33,214,000
Singer Finance (Lanka) PLC 123,306,000 123,306,000 123,306,000 123,306,000
Singer Finance (Lanka) PLC 93,576,000 93,576,000 93,576,000 93,576,000
Singer Sri Lanka PLC 31,193,400 31,193,400 31,193,400 31,193,400
Singer Sri Lanka PLC 46,790,100 46,790,100 46,790,100 46,790,100
SMIB Bank 195,000,000 195,000,000 195,000,000 195,000,000
The Housing Development Finance Corporation Bank of Sri Lanka 195,000,000 195,000,000 195,000,000 195,000,000
The Housing Development Finance Corporation Bank of Sri Lanka 65,580,000 65,580,000 65,580,000 65,580,000
The Lion Brewery (Ceylon) PLC 39,900,000 39,900,000 39,900,000 39,900,000
The Lion Brewery (Ceylon) PLC 39,900,000 39,900,000 39,900,000 39,900,000
The Lion Brewery (Ceylon) PLC 53,200,000 53,200,000 53,200,000 53,200,000
sub total 9,594,281,100 9,594,281,100 9,594,281,100 9,594,281,100
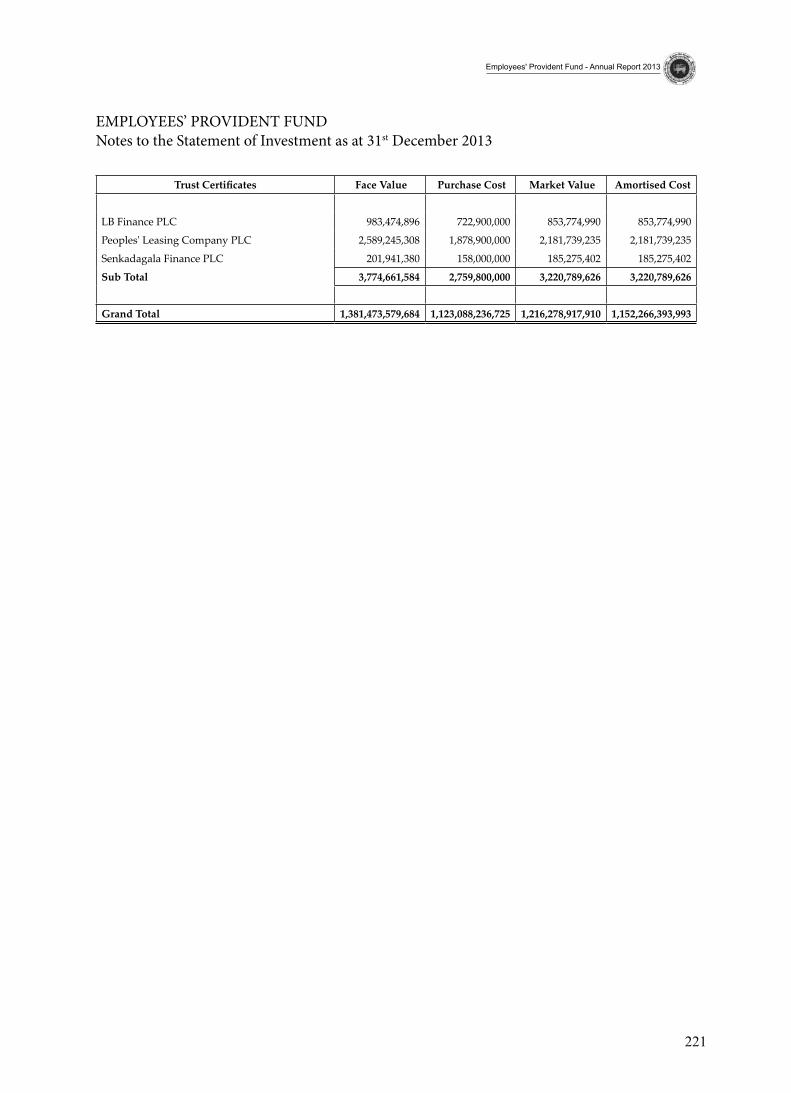
221
Employees' Provident Fund - Annual Report 2013
EMPLOYEES’ PROVIDENT FUND Notes to the Statement of Investment as at 31st December 2013
Trust Certificates Face value Purchase Cost Market value amortised Cost
LB Finance PLC 983,474,896 722,900,000 853,774,990 853,774,990
Peoples' Leasing Company PLC 2,589,245,308 1,878,900,000 2,181,739,235 2,181,739,235
Senkadagala Finance PLC 201,941,380 158,000,000 185,275,402 185,275,402
sub total 3,774,661,584 2,759,800,000 3,220,789,626 3,220,789,626
grand total 1,381,473,579,684 1,123,088,236,725 1,216,278,917,910 1,152,266,393,993
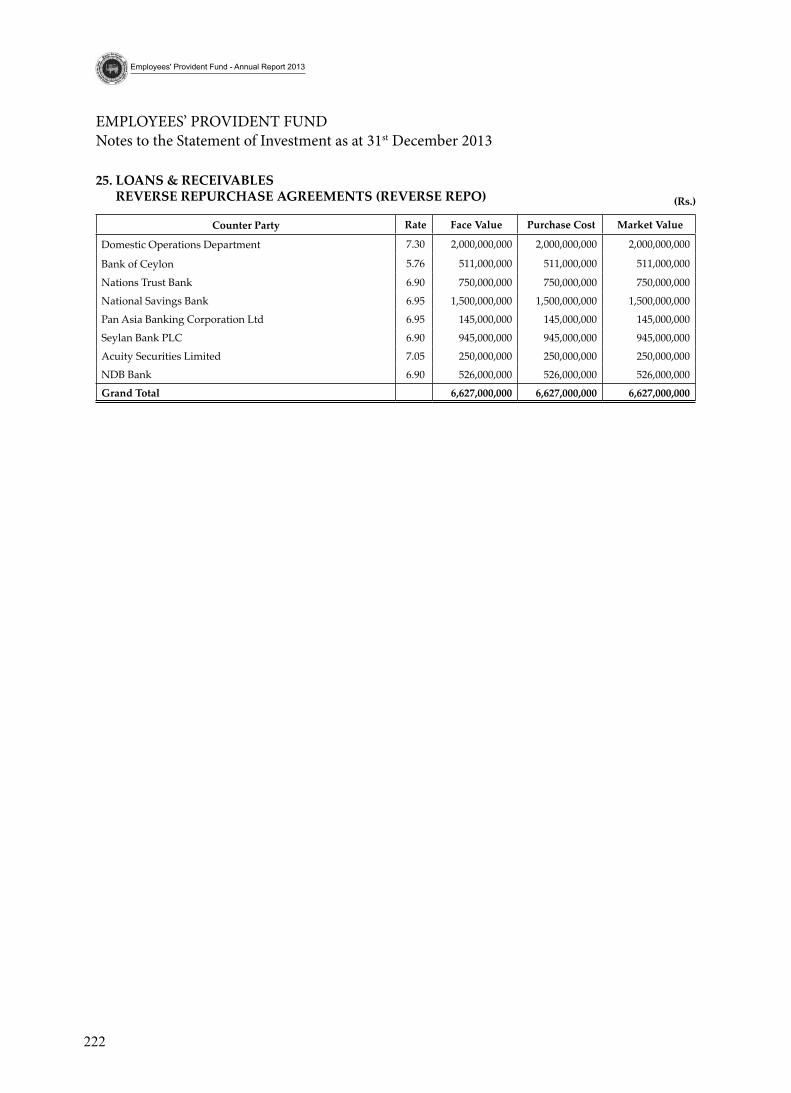
222
Employees' Provident Fund - Annual Report 2013
EMPLOYEES’ PROVIDENT FUND Notes to the Statement of Investment as at 31st December 2013
(rs.)
Counter Party rate Face value Purchase Cost Market value
Domestic Operations Department 7.30 2,000,000,000 2,000,000,000 2,000,000,000
Bank of Ceylon 5.76 511,000,000 511,000,000 511,000,000
Nations Trust Bank 6.90 750,000,000 750,000,000 750,000,000
National Savings Bank 6.95 1,500,000,000 1,500,000,000 1,500,000,000
Pan Asia Banking Corporation Ltd 6.95 145,000,000 145,000,000 145,000,000
Seylan Bank PLC 6.90 945,000,000 945,000,000 945,000,000
Acuity Securities Limited 7.05 250,000,000 250,000,000 250,000,000
NDB Bank 6.90 526,000,000 526,000,000 526,000,000
grand total 6,627,000,000 6,627,000,000 6,627,000,000
25. loans & reCeivables reverse rePurCHase agreeMents (reverse rePo)
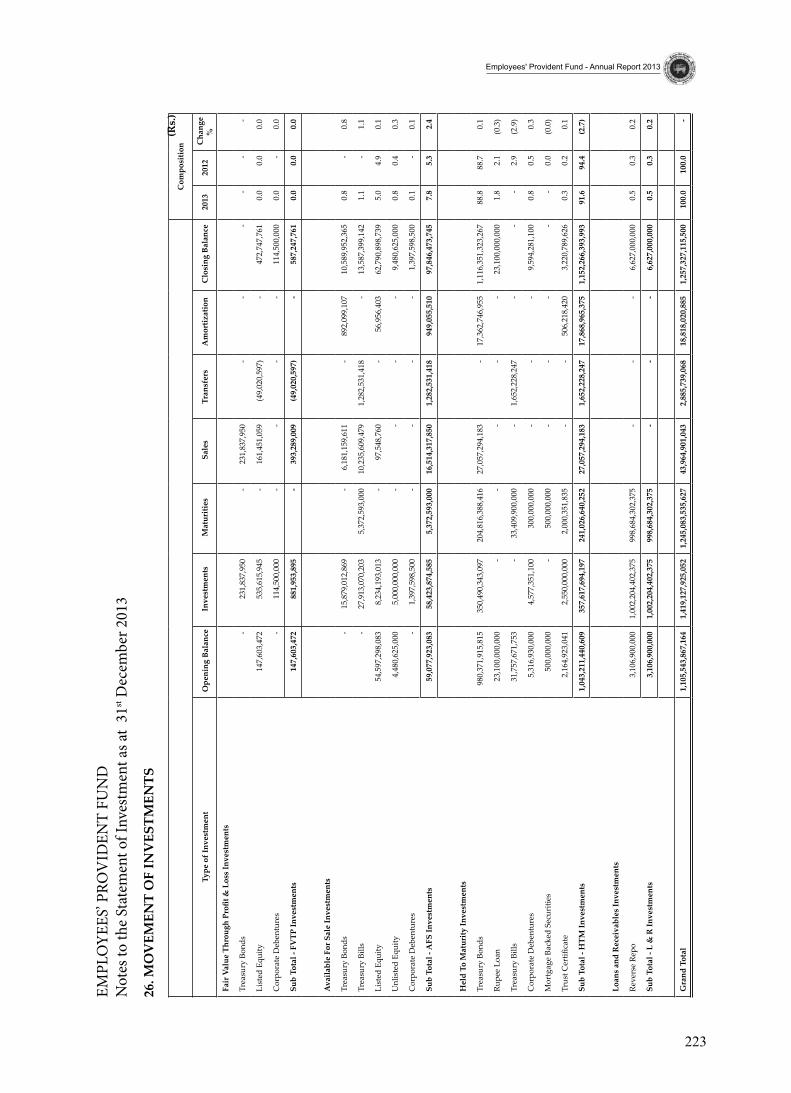
223
Employees' Provident Fund - Annual Report 2013
Com
posi
tion
Type
of I
nves
tmen
t O
peni
ng B
alan
ce
inve
stm
ents
M
atur
ities
s
ales
tr
ansf
ers
am
ortiz
atio
n C
losi
ng b
alan
ce
2013
2012
Cha
nge
%
Fair
Val
ue T
hrou
gh P
rofit
& L
oss
Inve
stm
ents
Trea
sury
Bon
ds
- 2
31,8
37,9
50
- 2
31,8
37,9
50
- -
- -
- -
List
ed E
quity
147
,603
,472
5
35,6
15,9
45
- 1
61,4
51,0
59
(49,
020,
597)
- 4
72,7
47,7
61
0.0
0
.0
0.0
Cor
pora
te D
eben
ture
s -
114
,500
,000
-
- -
- 1
14,5
00,0
00
0.0
-
0.0
sub
tota
l - F
vtP
inve
stm
ents
147
,603
,472
8
81,9
53,8
95
- 3
93,2
89,0
09
(49,
020,
597)
- 5
87,2
47,7
61
0.0
0
.0
0.0
ava
ilabl
e Fo
r sal
e in
vest
men
ts
Trea
sury
Bon
ds -
15,
879,
012,
869
- 6
,181
,159
,611
-
892
,099
,107
1
0,58
9,95
2,36
5 0
.8
- 0
.8
Trea
sury
Bill
s -
27,
913,
070,
203
5,3
72,5
93,0
00
10,
235,
609,
479
1,2
82,5
31,4
18
- 1
3,58
7,39
9,14
2 1
.1
- 1
.1
List
ed E
quity
54,
597,
298,
083
8,2
34,1
93,0
13
- 9
7,54
8,76
0 -
56,
956,
403
62,
790,
898,
739
5.0
4
.9
0.1
Unl
iste
d Eq
uity
4,4
80,6
25,0
00
5,0
00,0
00,0
00
- -
- -
9,4
80,6
25,0
00
0.8
0
.4
0.3
Cor
pora
te D
eben
ture
s -
1,3
97,5
98,5
00
- -
- -
1,3
97,5
98,5
00
0.1
-
0.1
sub
tota
l - a
Fs in
vest
men
ts 5
9,07
7,92
3,08
3 5
8,42
3,87
4,58
5 5
,372
,593
,000
1
6,51
4,31
7,85
0 1
,282
,531
,418
9
49,0
55,5
10
97,
846,
473,
745
7.8
5
.3
2.4
Hel
d to
Mat
urity
inve
stm
ents
Trea
sury
Bon
ds 9
80,3
71,9
15,8
15
350
,490
,343
,097
2
04,8
16,3
88,4
16
27,
057,
294,
183
- 1
7,36
2,74
6,95
5 1,
116,
351,
323,
267
88.
8 8
8.7
0.1
Rupe
e Lo
an 2
3,10
0,00
0,00
0 -
- -
- -
23,
100,
000,
000
1.8
2
.1
(0.3
)
Trea
sury
Bill
s 3
1,75
7,67
1,75
3 -
33,
409,
900,
000
- 1
,652
,228
,247
-
- -
2.9
(2
.9)
Cor
pora
te D
eben
ture
s 5
,316
,930
,000
4
,577
,351
,100
3
00,0
00,0
00
- -
- 9
,594
,281
,100
0
.8
0.5
0
.3
Mor
tgag
e Ba
cked
Sec
uriti
es 5
00,0
00,0
00
- 5
00,0
00,0
00
- -
- -
- 0
.0
(0.0
)
Trus
t Cer
tifica
te 2
,164
,923
,041
2
,550
,000
,000
2
,000
,351
,835
-
- 5
06,2
18,4
20
3,2
20,7
89,6
26
0.3
0
.2
0.1
sub
tota
l - H
tM in
vest
men
ts1,
043,
211,
440,
609
357
,617
,694
,197
2
41,0
26,6
40,2
52
27,
057,
294,
183
1,6
52,2
28,2
47
17,
868,
965,
375
1,15
2,26
6,39
3,99
3 9
1.6
94.
4 (2
.7)
loan
s an
d r
ecei
vabl
es in
vest
men
ts
Reve
rse
Repo
3,1
06,9
00,0
00
1,0
02,2
04,4
02,3
75
998
,684
,302
,375
-
- -
6,6
27,0
00,0
00
0.5
0
.3
0.2
sub
tota
l - l
& r
inve
stm
ents
3,1
06,9
00,0
00
1,0
02,2
04,4
02,3
75
998
,684
,302
,375
-
- -
6,6
27,0
00,0
00
0.5
0
.3
0.2
gra
nd t
otal
1,10
5,54
3,86
7,16
4 1
,419
,127
,925
,052
1,
245,
083,
535,
627
43,
964,
901,
043
2,8
85,7
39,0
68
18,
818,
020,
885
1,25
7,32
7,11
5,50
0 1
00.0
1
00.0
-
26. M
ov
eMen
t o
F in
ves
tMen
ts
(rs.
)
EMPL
OYE
ES’ P
ROV
IDEN
T FU
ND
Not
es to
the
Stat
emen
t of I
nves
tmen
t as a
t 31
st D
ecem
ber 2
013
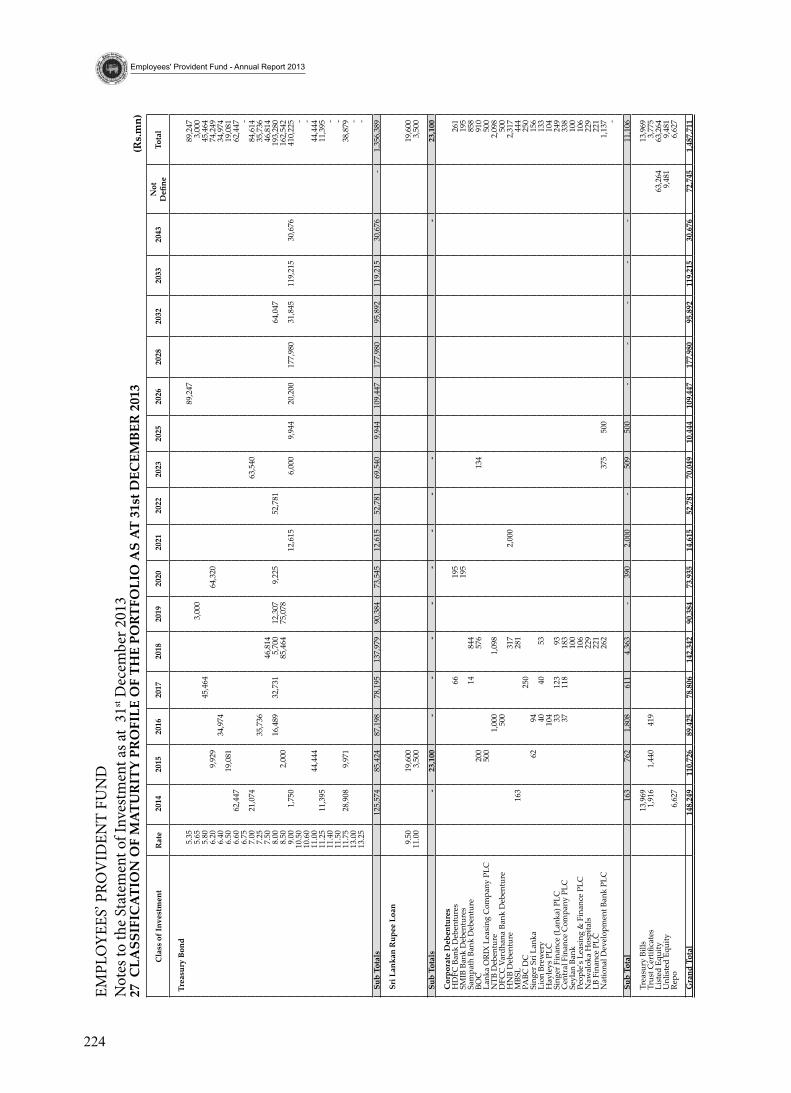
224
Employees' Provident Fund - Annual Report 2013
(rs.
mn)
Cla
ss o
f Inv
estm
ent
Rat
e 2
014
2015
2016
2017
2018
2019
2020
2021
2022
2023
2025
2026
2028
2032
2033
2043
not
D
efine
tota
l
trea
sury
bon
d 5
.35
89,
247
89,
247
5.6
5 3
,000
3
,000
5
.80
45,
464
45,
464
6.2
0 9
,929
6
4,32
0 7
4,24
9 6
.40
34,
974
34,
974
6.5
0 1
9,08
1 1
9,08
1 6
.60
62,
447
62,
447
6.7
5 -
7.0
0 2
1,07
4 6
3,54
0 8
4,61
4 7
.25
35,
736
35,
736
7.5
0 4
6,81
4 4
6,81
4 8
.00
16,
489
32,
731
5,7
00
12,
307
9,2
25
52,
781
64,
047
193
,280
8
.50
2,0
00
85,
464
75,
078
162
,542
9
.00
1,7
50
12,
615
6,0
00
9,9
44
20,
200
177
,980
3
1,84
5 1
19,2
15
30,
676
410
,225
1
0.50
-
10.
60
- 1
1.00
4
4,44
4 4
4,44
4 1
1.25
1
1,39
5 1
1,39
5 1
1.40
-
11.
50
- 1
1.75
2
8,90
8 9
,971
3
8,87
9 1
3.00
-
13.
25
-
sub
tot
als
125
,574
8
5,42
4 8
7,19
8 7
8,19
5 1
37,9
79
90,
384
73,
545
12,
615
52,
781
69,
540
9,9
44
109
,447
1
77,9
80
95,
892
119
,215
3
0,67
6 -
1,3
56,3
89
sri
lan
kan
rup
ee l
oan
9.5
0 1
9,60
0 1
9,60
0 1
1.00
3
,500
3
,500
sub
tot
als
- 2
3,10
0 -
- -
- -
- -
- -
23,
100
Cor
pora
te d
eben
ture
s H
DFC
Ban
k D
eben
ture
s
66
195
2
61
SM
IB B
ank
Deb
entu
res
195
1
95
Sam
path
Ban
k D
eben
ture
1
4 8
44
858
B
OC
2
00
576
1
34
910
L
anka
ORI
X Le
asin
g C
ompa
ny P
LC
500
5
00
NTB
Deb
entu
re
1,0
00
1,0
98
2,0
98
DFC
C V
ardh
ana
Bank
Deb
entu
re
500
5
00
HN
B D
eben
ture
3
17
2,0
00
2,3
17
MBS
L
163
2
81
444
P
ABC
DC
2
50
250
S
inge
r Sri
Lan
ka
62
94
156
L
ion
Brew
ery
4
0 4
0 5
3 1
33
Hay
leys
PLC
1
04
104
S
inge
r Fin
ance
(Lan
ka) P
LC
33
123
9
3 2
49
Cen
tral
Fin
ance
Com
pany
PLC
3
7 1
18
183
3
38
Sey
lan
Bank
1
00
100
P
eopl
e's
Leas
ing
& F
inan
ce P
LC
106
1
06
Naw
alok
a H
ospi
tals
2
29
229
L
B Fi
nanc
e PL
C
221
2
21
Nat
iona
l Dev
elop
men
t Ban
k PL
C
262
3
75
500
1
,137
-
sub
tot
al
163
7
62
1,8
08
611
4
,363
-
390
2
,000
-
509
5
00
- -
- -
- 1
1,10
6
Tre
asur
y Bi
lls
13,
969
13,
969
Tru
st C
ertifi
cate
s 1
,916
1
,440
4
19
3,7
75
Lis
ted
Equi
ty
63,
264
63,
264
Unl
iste
d Eq
uity
9
,481
9
,481
R
epo
6,6
27
6,6
27
gra
nd t
otal
1
48,2
49
110
,726
8
9,42
5 7
8,80
6 1
42,3
42
90,
384
73,
935
14,
615
52,
781
70,
049
10,
444
109
,447
1
77,9
80
95,
892
119
,215
3
0,67
6 7
2,74
5 1
,487
,711
27 C
lass
iFiC
ati
on
oF
Ma
tur
ity
Pro
File
oF
tHe
Port
Foli
o a
s a
t 31
st d
eCeM
ber
201
3
EMPL
OYE
ES’ P
ROV
IDEN
T FU
ND
Not
es to
the
Stat
emen
t of I
nves
tmen
t as a
t 31
st D
ecem
ber 2
013
225225
226
Employees' Provident Fund - Annual Report 2013
227
Employees' Provident Fund - Annual Report 2013
228
Employees' Provident Fund - Annual Report 2013
229
Employees' Provident Fund - Annual Report 2013
230
Employees' Provident Fund - Annual Report 2013
231
Employees' Provident Fund - Annual Report 2013
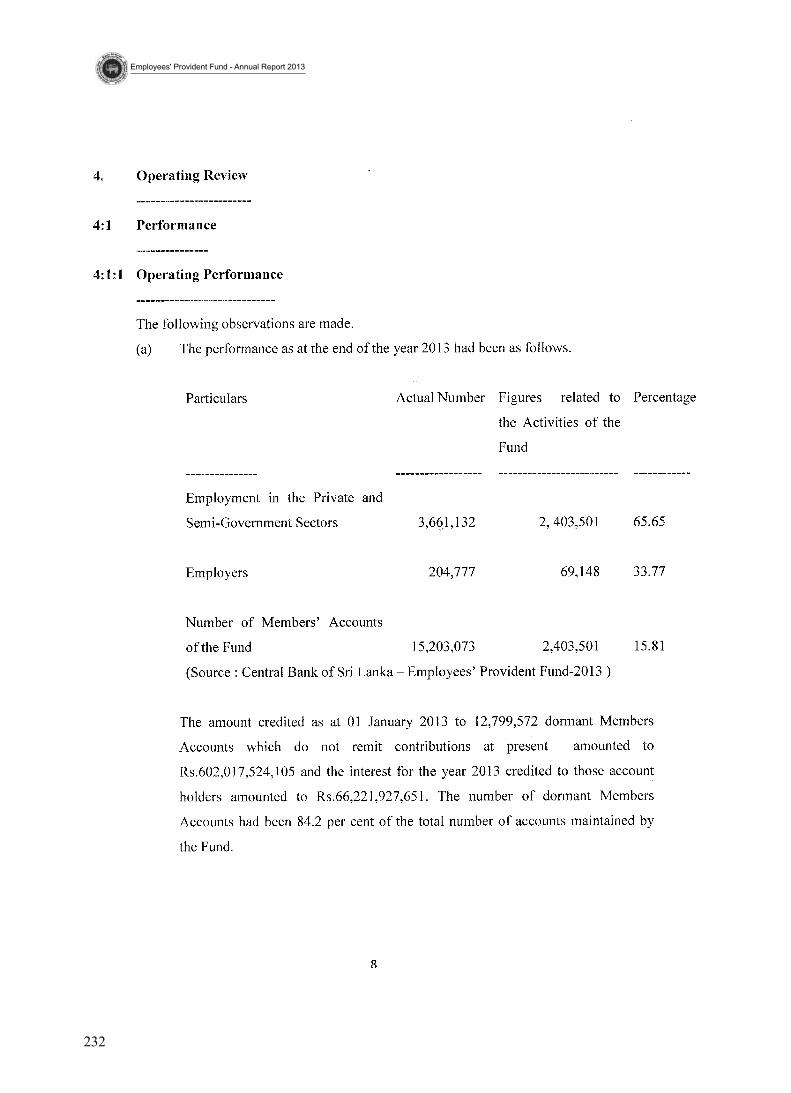
232
Employees' Provident Fund - Annual Report 2013
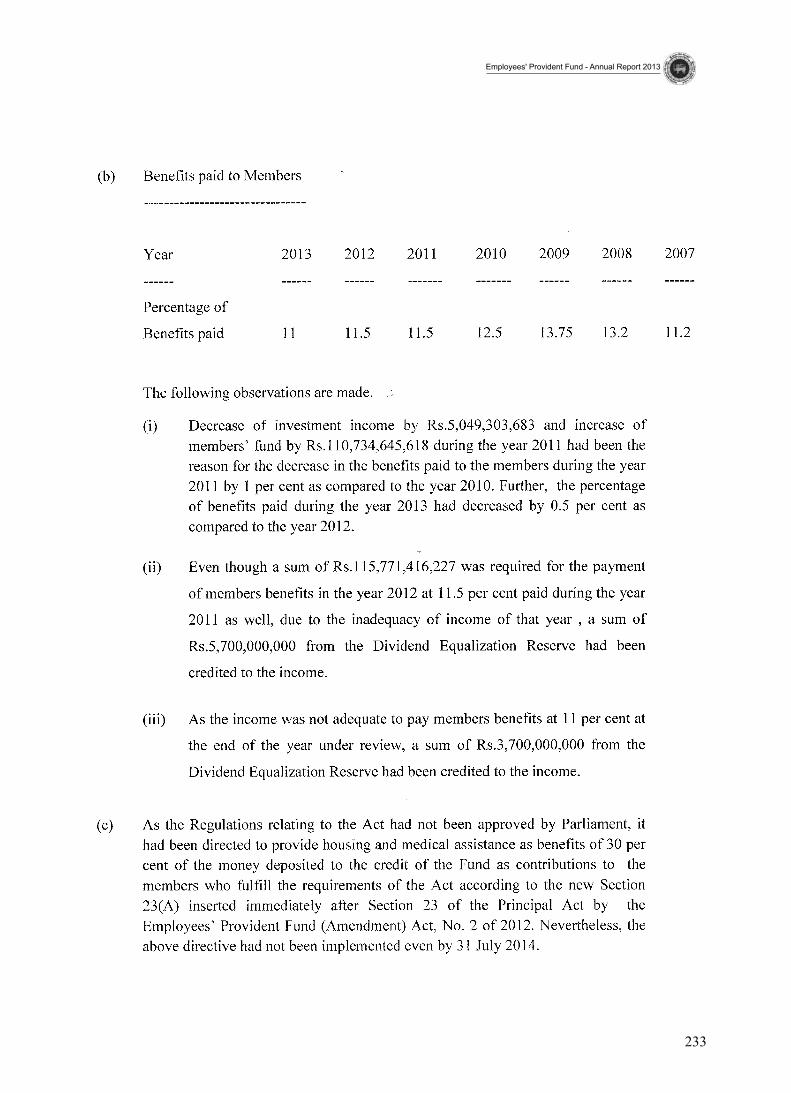
233
Employees' Provident Fund - Annual Report 2013
234
Employees' Provident Fund - Annual Report 2013
235
Employees' Provident Fund - Annual Report 2013
236
Employees' Provident Fund - Annual Report 2013
237
Employees' Provident Fund - Annual Report 2013

238
Employees' Provident Fund - Annual Report 2013
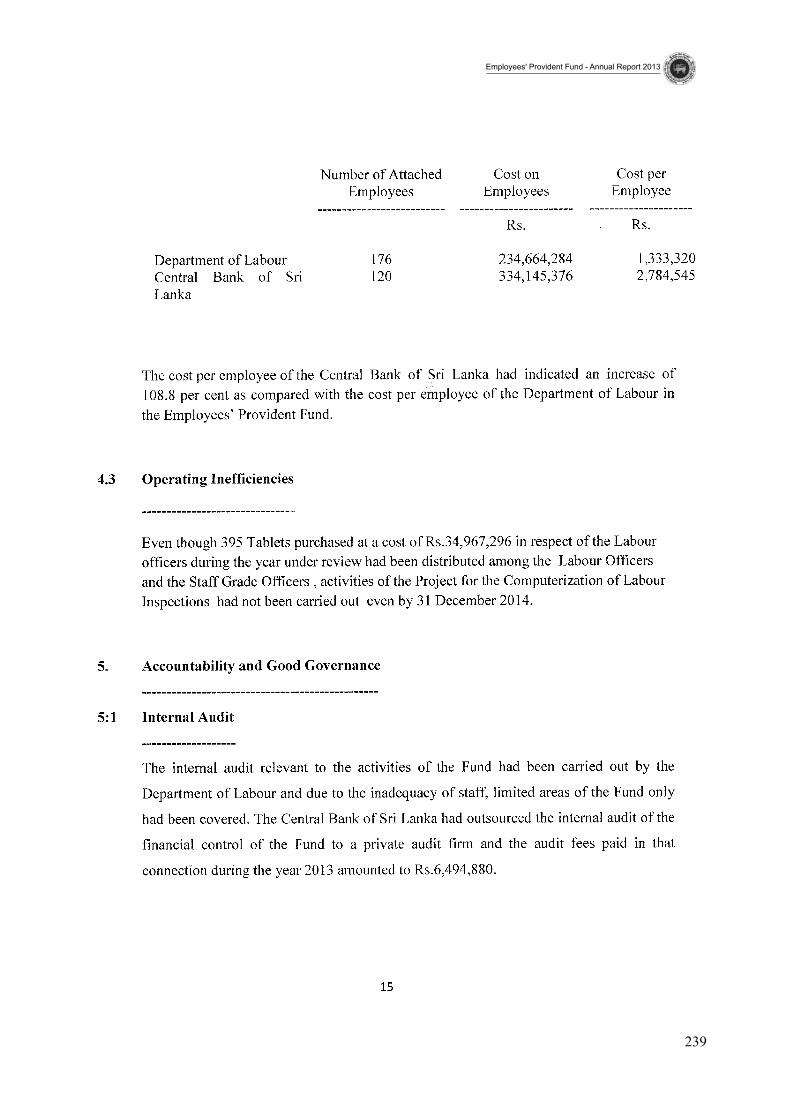
239
Employees' Provident Fund - Annual Report 2013
240
Employees' Provident Fund - Annual Report 2013
241
Employees' Provident Fund - Annual Report 2013
242
Employees' Provident Fund - Annual Report 2013