Embed Size (px)
Citation preview
Employee Stock Consideration
in 401(k) Plans
David Blanchett, CFA
Head of Retirement Research
Morningstar Investment Management
©2012 Morningstar. All rights reserved. This document includes proprietary material of Morningstar Investment Management. Reproduction, transcription or
other use, by any means, in whole or in part, without the prior written consent of Morningstar is prohibited. Morningstar Investment Management is a division of
Morningstar. Morningstar Investment Management includes Morningstar Associates, Ibbotson Associates, and Morningstar Investment Services, all registered
investment advisors and wholly owned subsidiaries of Morningstar, Inc. The Morningstar name and logo are registered marks of Morningstar.
2
Abstract
This paper will provide an overview of the various considerations for plan sponsors that
currently include employer stock or are thinking about doing so should be aware of. This paper
includes an overview of: employer stock in 401(k) plans today, fiduciary considerations for
plan sponsors, the risk associated with holding an individual security, the risk contribution of a single
security to a portfolio, the human capital dynamic, some retirement balance projections, and the
potential benefits associated with a Net Unrealized Appreciation (NUA) strategy when distributing
appreciated employer stock. For those plans that offer employer securities in a defined contribution
framework, it makes sense to attempt to limit the participant’s total allocation to employer stock
(e.g., absolutely no more than 25% of the account balance and likely a 10% target) as well as to
encourage some type of phased divestment program.
©2012 Morningstar. All rights reserved. This document includes proprietary material of Morningstar Investment Management. Reproduction, transcription or
other use, by any means, in whole or in part, without the prior written consent of Morningstar is prohibited. Morningstar Investment Management is a division of
Morningstar. Morningstar Investment Management includes Morningstar Associates, Ibbotson Associates, and Morningstar Investment Services, all registered
investment advisors and wholly owned subsidiaries of Morningstar, Inc. The Morningstar name and logo are registered marks of Morningstar.
3
Employer Stock Considerations in 401(k) Plans
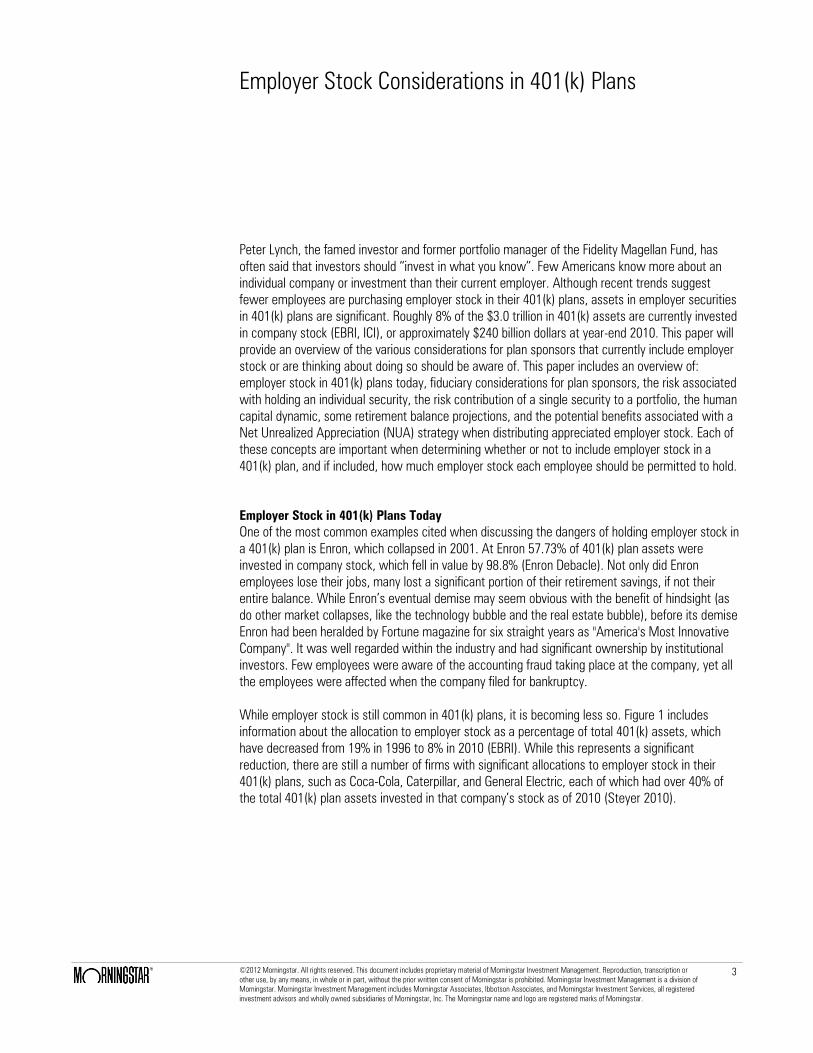
Peter Lynch, the famed investor and former portfolio manager of the Fidelity Magellan Fund, has
often said that investors should “invest in what you know”. Few Americans know more about an
individual company or investment than their current employer. Although recent trends suggest
fewer employees are purchasing employer stock in their 401(k) plans, assets in employer securities
in 401(k) plans are significant. Roughly 8% of the $3.0 trillion in 401(k) assets are currently invested
in company stock (EBRI, ICI), or approximately $240 billion dollars at year-end 2010. This paper will
provide an overview of the various considerations for plan sponsors that currently include employer
stock or are thinking about doing so should be aware of. This paper includes an overview of:
employer stock in 401(k) plans today, fiduciary considerations for plan sponsors, the risk associated
with holding an individual security, the risk contribution of a single security to a portfolio, the human
capital dynamic, some retirement balance projections, and the potential benefits associated with a
Net Unrealized Appreciation (NUA) strategy when distributing appreciated employer stock. Each of
these concepts are important when determining whether or not to include employer stock in a
401(k) plan, and if included, how much employer stock each employee should be permitted to hold.
Employer Stock in 401(k) Plans Today
One of the most common examples cited when discussing the dangers of holding employer stock in
a 401(k) plan is Enron, which collapsed in 2001. At Enron 57.73% of 401(k) plan assets were
invested in company stock, which fell in value by 98.8% (Enron Debacle). Not only did Enron
employees lose their jobs, many lost a significant portion of their retirement savings, if not their
entire balance. While Enron’s eventual demise may seem obvious with the benefit of hindsight (as
do other market collapses, like the technology bubble and the real estate bubble), before its demise
Enron had been heralded by Fortune magazine for six straight years as "America's Most Innovative
Company". It was well regarded within the industry and had significant ownership by institutional
investors. Few employees were aware of the accounting fraud taking place at the company, yet all
the employees were affected when the company filed for bankruptcy.
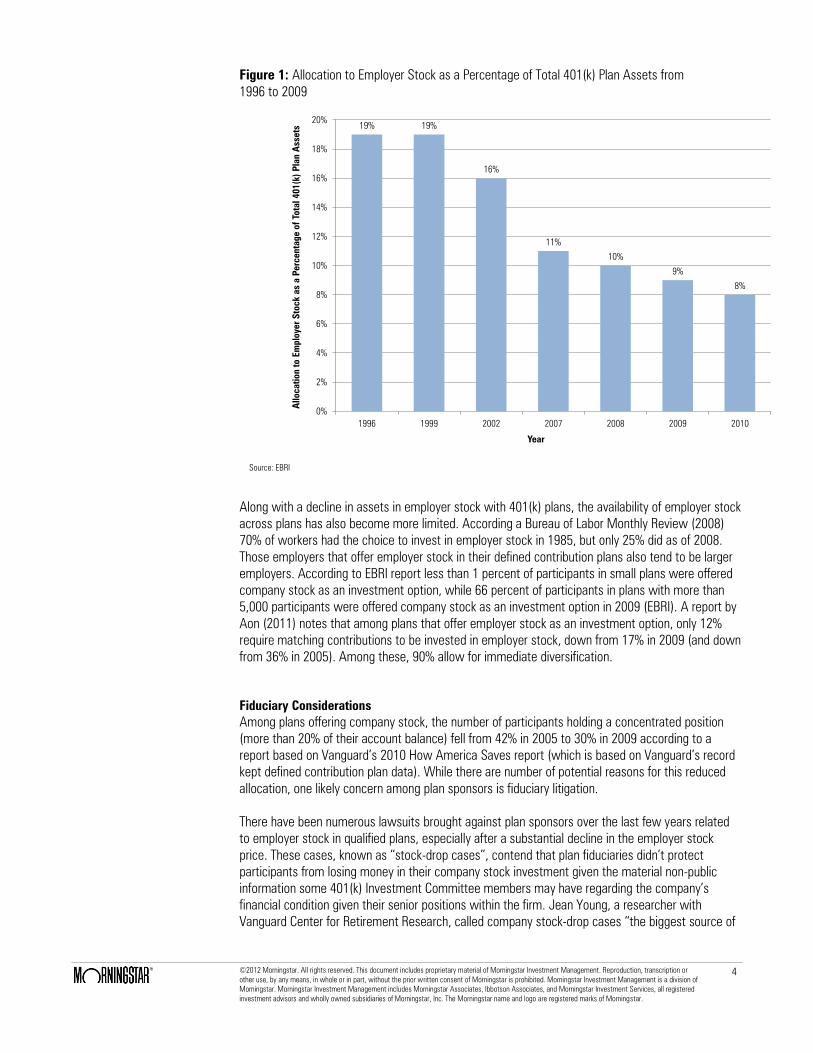
While employer stock is still common in 401(k) plans, it is becoming less so. Figure 1 includes
information about the allocation to employer stock as a percentage of total 401(k) assets, which
have decreased from 19% in 1996 to 8% in 2010 (EBRI). While this represents a significant
reduction, there are still a number of firms with significant allocations to employer stock in their
401(k) plans, such as Coca-Cola, Caterpillar, and General Electric, each of which had over 40% of
the total 401(k) plan assets invested in that company’s stock as of 2010 (Steyer 2010).
©2012 Morningstar. All rights reserved. This document includes proprietary material of Morningstar Investment Management. Reproduction, transcription or
other use, by any means, in whole or in part, without the prior written consent of Morningstar is prohibited. Morningstar Investment Management is a division of
Morningstar. Morningstar Investment Management includes Morningstar Associates, Ibbotson Associates, and Morningstar Investment Services, all registered
investment advisors and wholly owned subsidiaries of Morningstar, Inc. The Morningstar name and logo are registered marks of Morningstar.
4
Figure 1: Allocation to Employer Stock as a Percentage of Total 401(k) Plan Assets from
1996 to 2009
19% 19%
16%
11%
10%
9%
8%
0%
2%
4%
6%
8%
10%
12%
14%
16%
18%
20%
1996 1999 2002 2007 2008 2009 2010
Allocatio
n t
o E
mplo
yer S
tock a
s a
Percentage o
f T
otal 401(k) P
lan A
ssets
Year
Source: EBRI
Along with a decline in assets in employer stock with 401(k) plans, the availability of employer stock
across plans has also become more limited. According a Bureau of Labor Monthly Review (2008)
70% of workers had the choice to invest in employer stock in 1985, but only 25% did as of 2008.
Those employers that offer employer stock in their defined contribution plans also tend to be larger
employers. According to EBRI report less than 1 percent of participants in small plans were offered
company stock as an investment option, while 66 percent of participants in plans with more than
5,000 participants were offered company stock as an investment option in 2009 (EBRI). A report by
Aon (2011) notes that among plans that offer employer stock as an investment option, only 12%
require matching contributions to be invested in employer stock, down from 17% in 2009 (and down
from 36% in 2005). Among these, 90% allow for immediate diversification.
Fiduciary Considerations
Among plans offering company stock, the number of participants holding a concentrated position
(more than 20% of their account balance) fell from 42% in 2005 to 30% in 2009 according to a
report based on Vanguard’s 2010 How America Saves report (which is based on Vanguard’s record
kept defined contribution plan data). While there are number of potential reasons for this reduced
allocation, one likely concern among plan sponsors is fiduciary litigation.
There have been numerous lawsuits brought against plan sponsors over the last few years related
to employer stock in qualified plans, especially after a substantial decline in the employer stock
price. These cases, known as “stock-drop cases”, contend that plan fiduciaries didn’t protect
participants from losing money in their company stock investment given the material non-public
information some 401(k) Investment Committee members may have regarding the company’s
financial condition given their senior positions within the firm. Jean Young, a researcher with
Vanguard Center for Retirement Research, called company stock-drop cases “the biggest source of
©2012 Morningstar. All rights reserved. This document includes proprietary material of Morningstar Investment Management. Reproduction, transcription or
other use, by any means, in whole or in part, without the prior written consent of Morningstar is prohibited. Morningstar Investment Management is a division of
Morningstar. Morningstar Investment Management includes Morningstar Associates, Ibbotson Associates, and Morningstar Investment Services, all registered
investment advisors and wholly owned subsidiaries of Morningstar, Inc. The Morningstar name and logo are registered marks of Morningstar.
5
litigation in 401(k) plans,” a sentiment echoed by Gene Paranczak, an ERISA attorney and senior
consultant with Vanguard Strategic Retirement Consulting (Vanguard).
Recent court rulings have provided mixed relief to plan sponsors. In George v. Kraft Foods Global the
Seventh Circuit ruled that fiduciaries should consider whether their efforts to deliberate, decide, and
document issues affecting plan investments are sufficient. Good news for plan sponsors is the
Second Circuit recently became the latest Circuit Court to adopt the “presumption of prudence” test
for retirement plans holding company stock as an investment option based on Gearren v. McGraw-
Hill Cos., Inc. and Gray v. Citigroup, Inc. In both cases plaintiffs filed suit against the companies
allege the 401(k) plan’s fiduciaries violated ERISA by continuing to offer company stock as a plan
investment option. Plaintiffs alleged the 401(k) plan fiduciaries “knew or should have known” each
company’s subprime mortgage exposure made the company stock a poor retirement plan
investment. The Second Circuit observed that the presumption of prudence alleviates the pressure
on plan fiduciaries to predict the future of the company stock fund’s performance (Winston &
Strawn). See Dell and Nassau (2010) for a more thorough examination of the “presumption of
prudence” investment standard and fiduciary responsibility with respect to stock in defined
contribution plans.
On May 18, 2010, the IRS and the Treasury Department released final regulations on Code
§401(a)(35) investment diversification requirements for certain defined contribution
plans with publicly traded employer securities. Defined contribution plans holding publicly traded
employer securities are considered "applicable defined contribution plans” and subject to the
diversification requirements of Code §401(a)(35), which apply to employee contributions and
employer contributions allocated to participants (or their beneficiaries) with at least three years
of service. These plans must contain at least three investment options other than employer
securities (which is already a general requirement for 404(c) compliance). A plan can’t restrict a
participant’s right to invest in or to divest employer securities any more than it restricts any
other plan investment options.
When considering offering company stock as an investment option in a retirement plan, there are a
number of important considerations according to Murray and Singleton (2010). These include
educating participants about diversification, asset allocation requirements, and the risks related to
investments in company stock. Any restrictions on the transfer or sale of the company stock to
ensure the interests of participants are considered and company stock should be monitored in the
same manner as other plan investments. It may also be prudent to set limits on the amount of
company stock a participant may hold in his or her account (e.g., limit the company stock to 20% of
the account balance).
Thinking About Risks
Meulbroek (2002) estimates that employees in firms within the highest quintile of company stock
ownership sacrifice 42% of their wealth compared to investing in a well-diversified portfolio. She
also finds that companies seem to be aware of this problem, at least to some degree, since there is
a negative correlation between company stock ownership and the cost of company stock
ownership. Huberman and Sengmueller (2002) note that current high company stock price relative
to the benchmark price – is associated with increased flows and with transfers of 401(k)
investments into company stock. The reverse does not hold for bad past performance.
There are a number of risks associated with holding employer securities in a qualified plan. Five main
considerations will be reviewed: the risk dynamic of individual securities, the contribution of risk of
an individual security to a diversified portfolio, the potential impact on human capital, balance and
retirement projections, and finally the potential benefit of a net unrealized appreciation (NUA)
©2012 Morningstar. All rights reserved. This document includes proprietary material of Morningstar Investment Management. Reproduction, transcription or
other use, by any means, in whole or in part, without the prior written consent of Morningstar is prohibited. Morningstar Investment Management is a division of
Morningstar. Morningstar Investment Management includes Morningstar Associates, Ibbotson Associates, and Morningstar Investment Services, all registered
investment advisors and wholly owned subsidiaries of Morningstar, Inc. The Morningstar name and logo are registered marks of Morningstar.
6
strategy with respect to appreciated employer securities. Given the “costs” associated with holding
employer stock are relatively straightforward, the largest section focuses on the NUA strategy,
since this is a potential benefit of holding employer stock, but is very dependent on modeling
assumptions, therefore the unique situation of each participant.
Risk Dynamic of Individual Securities
Holding an individual stock is riskier than holding a well-diversified portfolio. A key assumption of the
Capital Asset Pricing Model (CAPM) is that any excess return of an individual security over the
market portfolio is only compensating for the non-idiosyncratic portion of the stock volatility. In other
words, it’s the company’s unique beta factors to the market (e.g., whether it’s more Value or
Growth) that an investor should be rewarded for, not for the risks associated with that one individual
security (which is the idiosyncratic risk). Therefore, individual securities, when viewed as a distinct
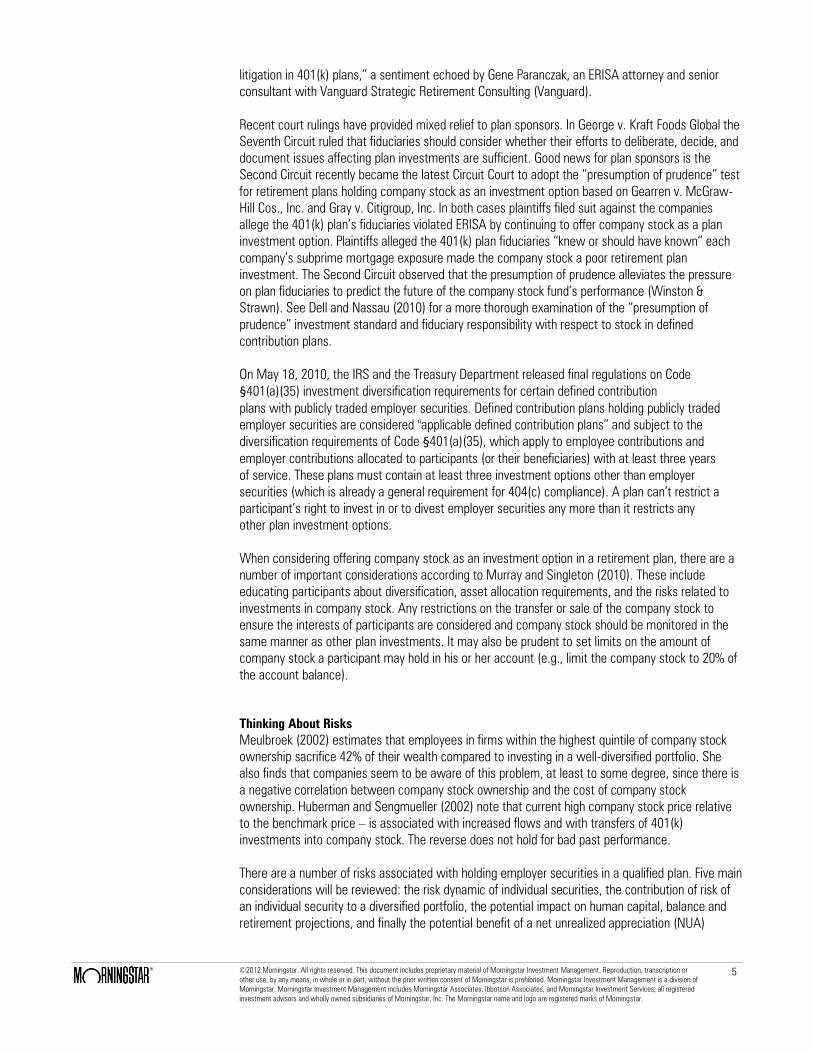
investment, are far more risky than holding a diversified portfolio of individual securities. This
concept is displayed in Figure 2, which includes the annual standard deviation for the S&P 500, and
the median Large Cap, Mid Cap, and Small Cap stocks from 1997 to 2011.
Figure 2: Annual Historical Volatility 1997-2011
19%
37%
41%
54%
0%
10%
20%
30%
40%
50%
60%
Annual S
tandard D
evia
tio
n
Source: Morningstar
S&P 500 Median Large Cap Stock Median Mid Cap Stock Median Small Cap Stock
The median annual volatility of Large Cap stocks, which are based on Morningstar style rankings as
of December 31, 20111
, was slightly less than half of the annual volatility of the S&P 500 over the
same period. Not surprisingly, Mid Cap and Small Cap stocks had larger median standard deviations
than Large Cap stocks. Worth noting, assuming Small Cap stock annual returns follow a normal
1 This approach introduces some bias into the estimate, since the Morningstar Direct database is not survivorship
bias free (i.e., only those stocks in existence on December 31, 2011 where included as available securities. Also,
the classifications are based on December 31, 2011, which may not reflect the average capitalization or style
exposure of the security over the entire period. Therefore, these should be viewed as general approximations for
the risk of securities at these levels, not precise estimates.
©2012 Morningstar. All rights reserved. This document includes proprietary material of Morningstar Investment Management. Reproduction, transcription or
other use, by any means, in whole or in part, without the prior written consent of Morningstar is prohibited. Morningstar Investment Management is a division of
Morningstar. Morningstar Investment Management includes Morningstar Associates, Ibbotson Associates, and Morningstar Investment Services, all registered
investment advisors and wholly owned subsidiaries of Morningstar, Inc. The Morningstar name and logo are registered marks of Morningstar.
7
distribution and have an average return is 14%, a 54% standard deviation implies an approximate
1.2% probability of bankruptcy within a given year (i.e., achieving a return less than or equal
to -100%).
While the average return of Large Cap stocks should be the same as a Large Cap index (if weighted
by market capitalization, at least roughly speaking) given that the average risk, or annual standard
deviation, is roughly double for individual securities, the return the investor actually experiences
when holding the two securities (an individual security or a diversified portfolio of Large Cap stocks)
will be materially different, especially over longer time periods. This is because the geometric return,
or compounded return, which is the actual growth in dollars experienced by an investor, is more
negatively affected by negative returns than it is positively affected by positive returns. For example,
if a security returns +100% in the first year and then -50% the second year, while the arithmetic
average return over the two periods may be +25% ( (100% - 50%) / 2 = 25%), the compounded
return is 0%. Assuming the investor started with $100, he will have $200 at the end of year one
(+100%), but will only have $100 (-50%) remaining at the end of year two, for a realized
return of 0%.
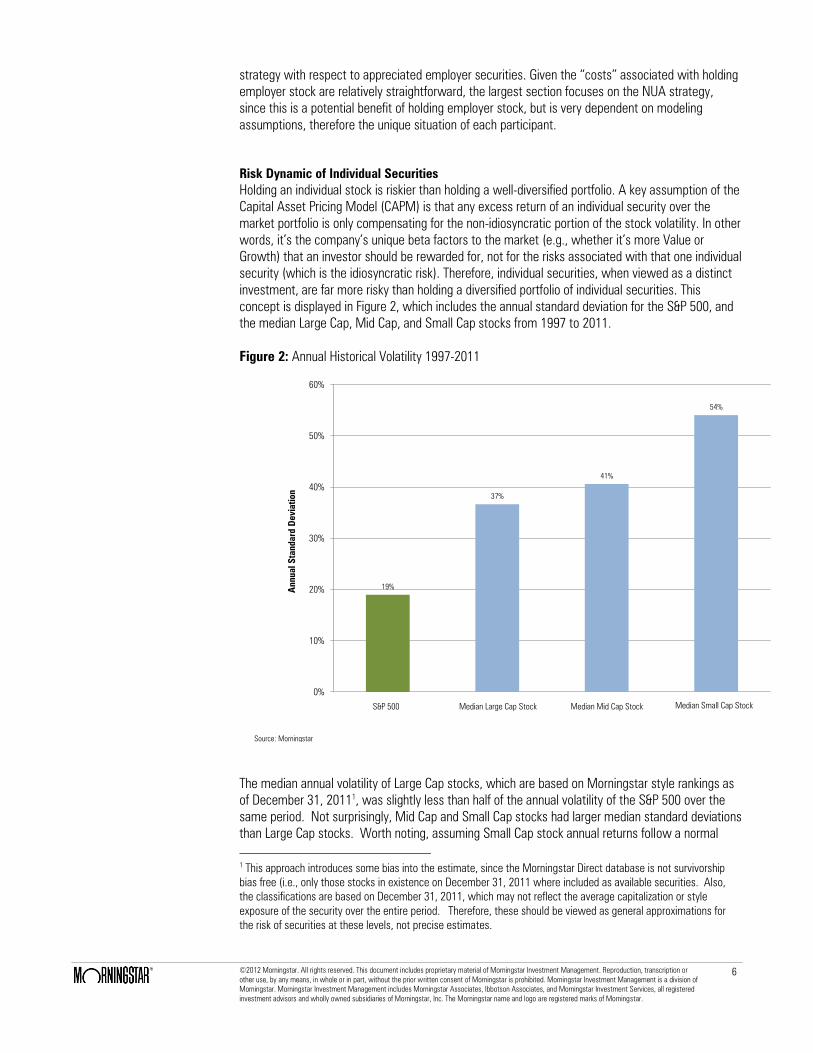
The compounded return can be roughly estimated by subtracting half the variance (which is the
standard deviation squared) from the arithmetic return, although this estimation approach tends to
overestimate returns for higher levels of standard deviations. Table I has been included to give the
reader an idea of the expected impact of higher levels of standard deviation on arithmetic returns
(i.e., the actual compounded return). Table 1 includes the average compounded (geometric) returns
for various arithmetic returns and standard deviations, based on a 100,000 random number
generation process, assuming returns follow a normal distribution. Note, since it is technically
impossible for an individual security to return lower than -100%, the minimum return is assumed to
be -100% (i.e., the investor loses everything).
Table 1: Compounded Returns for Various Arithmetic Returns and Standard Deviations
0.0% 2.0% 4.0% 6.0% 8.0% 10.0% 12.0% 14.0% 16.0% 18.0% 20.0%
0.0% 0.0% 2.0% 4.0% 6.0% 8.0% 10.0% 12.0% 14.0% 16.0% 18.0% 20.0%
4.0% -0.1% 1.9% 3.9% 5.9% 7.9% 9.9% 11.9% 13.9% 15.9% 17.9% 19.9%
8.0% -0.3% 1.7% 3.7% 5.7% 7.7% 9.7% 11.7% 13.7% 15.7% 17.7% 19.7%
12.0% -0.7% 1.3% 3.3% 5.3% 7.3% 9.3% 11.3% 13.4% 15.4% 17.4% 19.4%
16.0% -1.3% 0.7% 2.7% 4.7% 6.8% 8.8% 10.8% 12.8% 14.9% 16.9% 18.9%
20.0% -2.1% -0.1% 2.0% 4.0% 6.0% 8.1% 10.1% 12.2% 14.2% 16.2% 18.3%
24.0% -3.2% -1.1% 1.0% 3.0% 5.1% 7.2% 9.2% 11.3% 13.3% 15.4% 17.4%
28.0% -4.6% -2.5% -0.3% 1.8% 3.9% 6.0% 8.1% 10.2% 12.3% 14.3% 16.4%
32.0% -6.6% -4.4% -2.1% 0.1% 2.2% 4.4% 6.6% 8.7% 10.9% 13.0% 15.1%
36.0% -9.4% -7.1% -4.7% -2.4% -0.1% 2.2% 4.5% 6.7% 9.0% 11.2% 13.4%
40.0% -13.1% -10.6% -8.1% -5.6% -3.1% -0.7% 1.6% 4.0% 6.4% 8.7% 11.0%
44.0% -17.5% -14.9% -12.2% -9.6% -7.0% -4.5% -1.9% 0.5% 3.1% 5.5% 8.0%
48.0% -22.4% -19.7% -17.0% -14.3% -11.6% -8.9% -6.2% -3.6% -1.0% 1.6% 4.1%
52.0% -27.4% -24.7% -21.9% -19.2% -16.5% -13.8% -11.1% -8.4% -5.7% -3.0% -0.3%
56.0% -32.3% -29.7% -27.0% -24.3% -21.5% -18.8% -16.1% -13.3% -10.6% -7.9% -5.2%
60.0% -37.0% -34.4% -31.8% -29.2% -26.5% -23.9% -21.2% -18.4% -15.7% -13.0% -10.2%
S&P 500 Index Large Cap Individual Security
Sta
nd
ard
De
via
tio
n
Arithmetic Return
The approximate average historical risk attributes of the S&P 500 index and an individual Large Cap
security have been highlighted in Table 1 for informational purposes. Note while both have had the
same approximate arithmetic return (12%) the approximate doubling of the standard deviation for
the individual security (20% to 36%) reduces the compounded return by more than 50% (from
©2012 Morningstar. All rights reserved. This document includes proprietary material of Morningstar Investment Management. Reproduction, transcription or
other use, by any means, in whole or in part, without the prior written consent of Morningstar is prohibited. Morningstar Investment Management is a division of
Morningstar. Morningstar Investment Management includes Morningstar Associates, Ibbotson Associates, and Morningstar Investment Services, all registered
investment advisors and wholly owned subsidiaries of Morningstar, Inc. The Morningstar name and logo are registered marks of Morningstar.
8
10.1% to 4.5%). While the S&P 500 is just a collection of individual Large Cap securities (for the
most part), the higher return can be attributed to the diversification benefits of holding multiple
securities, which is one of the key tenants of Modern Portfolio Theory, a concept introduced by
Harry Markowitz (1952) over 50 years ago.
Table 1 demonstrates the importance of the underlying risk and return attributes for each individual
security. For example, a larger firm is likely to be more attractive as an option in a 401(k) plan than a
smaller company because larger companies tend be less volatile, and therefore have higher
compounded returns. For example, while the median standard deviation for all Large Cap securities
was 36%, the median standard deviation for those companies in the Dow Jones Industrial Average
as of December 31, 2011 had a median standard deviation was 28% (a reduction of 50% of the
excess volatility over the S&P 500 volatility). Based on the same arithmetic return of 12%, a reduced
standard deviation of 28% (versus 36%) increases the compounded return almost 50%, to 8.1%
from 4.5%. Also, more diversified companies are likely to have more favorably risk attributes than
companies that have a more narrow focus (e.g., GE versus Google).
The Risk Contribution of a Single Security to a Portfolio
The previous section discussed the risk of an individual security (i.e., employer stock) when viewed
in isolation. While this a reasonable starting point to understand the risks associated with holding
employer securities versus more diversified investments (like mutual funds), the portfolio risk for an
investor holding twenty individual stocks should viewed at the aggregate portfolio level, not at the
individual security level, assuming there is some diversification benefits among the securities (i.e.,
the correlations for the securities are not all 1). This section will explore the impact on the risk of a
total portfolio from holding an employer stock, i.e., the risk contribution of an individual security
to a portfolio.
This analysis assumes an investor has already determined that he or she would like an all equity
portfolio. The only remaining question for this investor is how much to allocate to employer
securities and the respective risk impact of doing so. The inputs used for the Mean Variance
Optimization are included in Table 2, which are approximations of Ibbotson Associates long-term
market forecasts (but are reasonably similar to long-term historical data for the respective asset
categories). The individual employer security is assumed to be Large Cap stock with same expected
return and correlation with other securities as the Large Cap asset class, but twice the standard
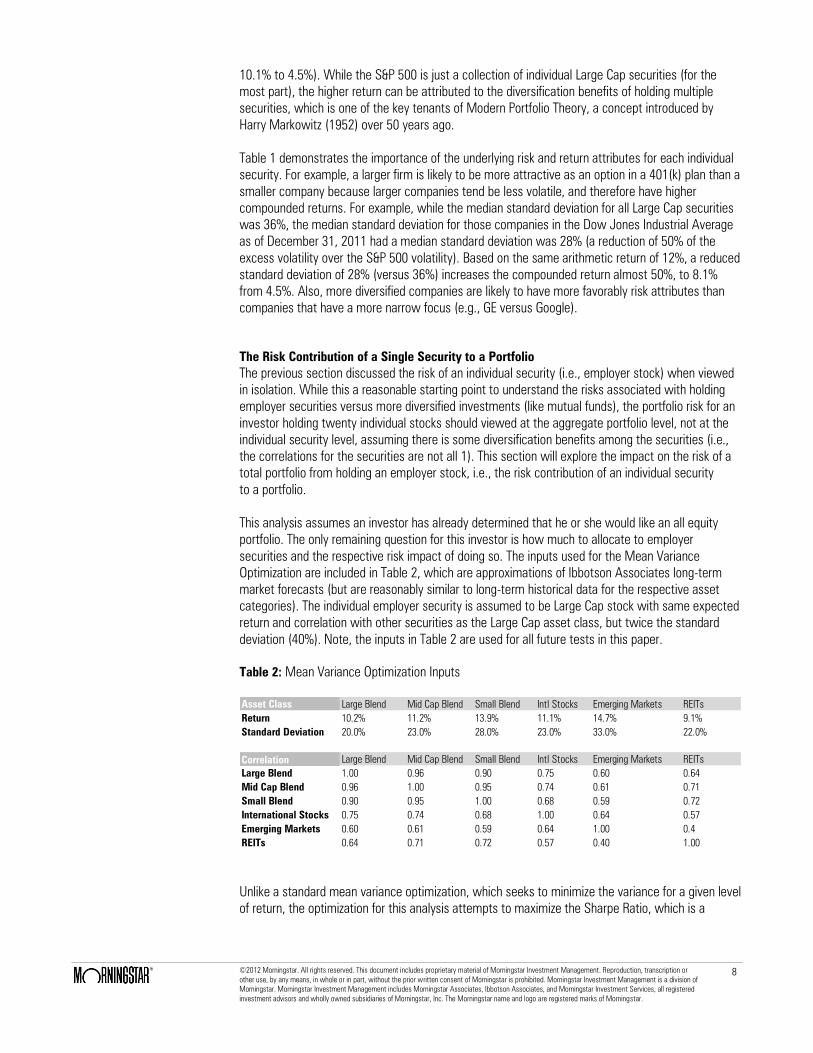
deviation (40%). Note, the inputs in Table 2 are used for all future tests in this paper.
Table 2: Mean Variance Optimization Inputs
Asset Class Large Blend Mid Cap Blend Small Blend Intl Stocks Emerging Markets REITs
Return 10.2% 11.2% 13.9% 11.1% 14.7% 9.1%
Standard Deviation 20.0% 23.0% 28.0% 23.0% 33.0% 22.0%
Correlation Large Blend Mid Cap Blend Small Blend Intl Stocks Emerging Markets REITs
Large Blend 1.00 0.96 0.90 0.75 0.60 0.64
Mid Cap Blend 0.96 1.00 0.95 0.74 0.61 0.71
Small Blend 0.90 0.95 1.00 0.68 0.59 0.72
International Stocks 0.75 0.74 0.68 1.00 0.64 0.57
Emerging Markets 0.60 0.61 0.59 0.64 1.00 0.4
REITs 0.64 0.71 0.72 0.57 0.40 1.00
Unlike a standard mean variance optimization, which seeks to minimize the variance for a given level
of return, the optimization for this analysis attempts to maximize the Sharpe Ratio, which is a
©2012 Morningstar. All rights reserved. This document includes proprietary material of Morningstar Investment Management. Reproduction, transcription or
other use, by any means, in whole or in part, without the prior written consent of Morningstar is prohibited. Morningstar Investment Management is a division of
Morningstar. Morningstar Investment Management includes Morningstar Associates, Ibbotson Associates, and Morningstar Investment Services, all registered
investment advisors and wholly owned subsidiaries of Morningstar, Inc. The Morningstar name and logo are registered marks of Morningstar.
9
measure of risk-adjusted return, for that level of employer securities (e.g., 25% of the portfolio).
Returns are randomly generated using a multivariate normal distribution and the Sharpe Ratio is
calculated by dividing the average geometric (compounded) return minus the risk-free rate (which is
assumed to be 2.5%) by volatility of returns (standard deviation). This approach was taken, versus
an optimization based entirely on the inputs, so the impact on the realized return for higher levels of
standard deviation would be correctly incorporated into the optimal portfolio decision process.
No constraints are placed on the optimizer, and while this approach is impractical for actual client
portfolios, the objective of this section is simply to highlight the risk implications associated with
adding individual securities into a diversified portfolio r framework. This analysis is also based on the
implicit assumption that if the investor did not invest in the employer stock he or she would invest in
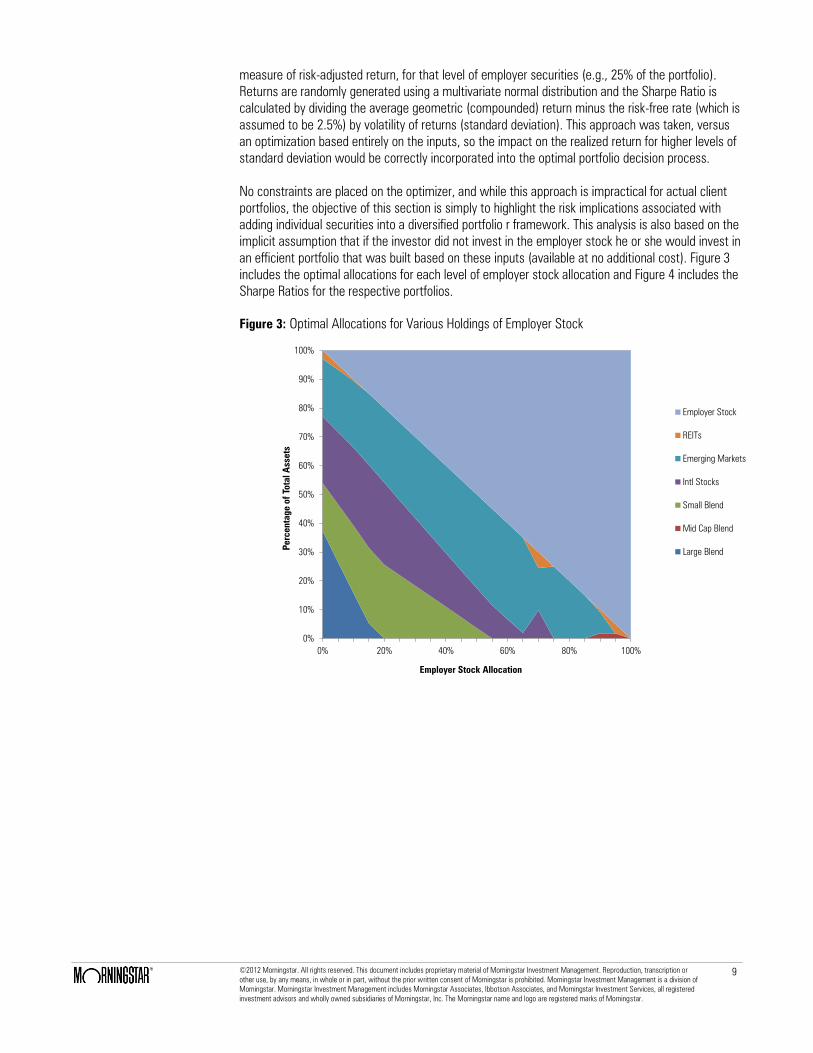
an efficient portfolio that was built based on these inputs (available at no additional cost). Figure 3
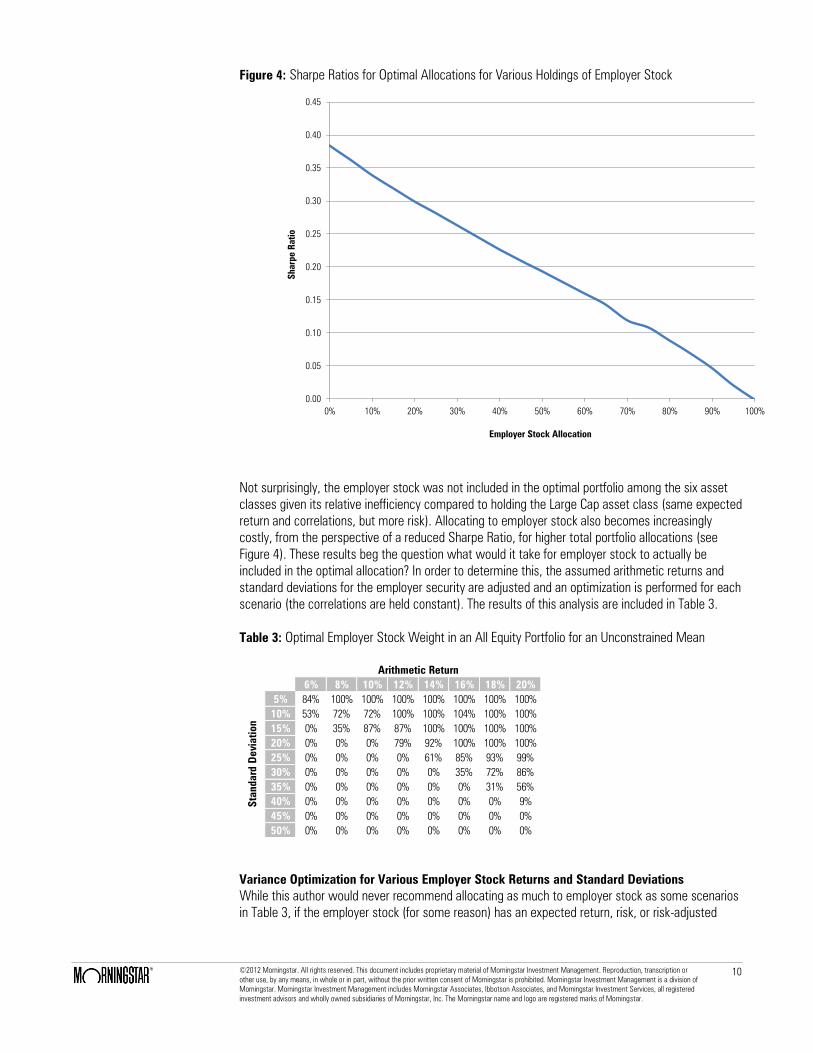
includes the optimal allocations for each level of employer stock allocation and Figure 4 includes the
Sharpe Ratios for the respective portfolios.
Figure 3: Optimal Allocations for Various Holdings of Employer Stock
0%
10%
20%
30%
40%
50%
60%
70%
80%
90%
100%
0% 20% 40% 60% 80% 100%
Percentage o
f T
otal A
ssets
Employer Stock Allocation
Employer Stock
REITs
Emerging Markets
Intl Stocks
Small Blend
Mid Cap Blend
Large Blend
©2012 Morningstar. All rights reserved. This document includes proprietary material of Morningstar Investment Management. Reproduction, transcription or
other use, by any means, in whole or in part, without the prior written consent of Morningstar is prohibited. Morningstar Investment Management is a division of
Morningstar. Morningstar Investment Management includes Morningstar Associates, Ibbotson Associates, and Morningstar Investment Services, all registered
investment advisors and wholly owned subsidiaries of Morningstar, Inc. The Morningstar name and logo are registered marks of Morningstar.
10
Figure 4: Sharpe Ratios for Optimal Allocations for Various Holdings of Employer Stock
0.00
0.05
0.10
0.15
0.20
0.25
0.30
0.35
0.40
0.45
0% 10% 20% 30% 40% 50% 60% 70% 80% 90% 100%
Sharpe R
atio
Employer Stock Allocation
Not surprisingly, the employer stock was not included in the optimal portfolio among the six asset
classes given its relative inefficiency compared to holding the Large Cap asset class (same expected
return and correlations, but more risk). Allocating to employer stock also becomes increasingly
costly, from the perspective of a reduced Sharpe Ratio, for higher total portfolio allocations (see
Figure 4). These results beg the question what would it take for employer stock to actually be
included in the optimal allocation? In order to determine this, the assumed arithmetic returns and
standard deviations for the employer security are adjusted and an optimization is performed for each
scenario (the correlations are held constant). The results of this analysis are included in Table 3.
Table 3: Optimal Employer Stock Weight in an All Equity Portfolio for an Unconstrained Mean
6% 8% 10% 12% 14% 16% 18% 20%
5% 84% 100% 100% 100% 100% 100% 100% 100%
10% 53% 72% 72% 100% 100% 104% 100% 100%
15% 0% 35% 87% 87% 100% 100% 100% 100%
20% 0% 0% 0% 79% 92% 100% 100% 100%
25% 0% 0% 0% 0% 61% 85% 93% 99%
30% 0% 0% 0% 0% 0% 35% 72% 86%
35% 0% 0% 0% 0% 0% 0% 31% 56%
40% 0% 0% 0% 0% 0% 0% 0% 9%
45% 0% 0% 0% 0% 0% 0% 0% 0%
50% 0% 0% 0% 0% 0% 0% 0% 0%
Arithmetic Return
Sta
nd
ard
De
via
tio
n
Variance Optimization for Various Employer Stock Returns and Standard Deviations
While this author would never recommend allocating as much to employer stock as some scenarios
in Table 3, if the employer stock (for some reason) has an expected return, risk, or risk-adjusted
©2012 Morningstar. All rights reserved. This document includes proprietary material of Morningstar Investment Management. Reproduction, transcription or
other use, by any means, in whole or in part, without the prior written consent of Morningstar is prohibited. Morningstar Investment Management is a division of
Morningstar. Morningstar Investment Management includes Morningstar Associates, Ibbotson Associates, and Morningstar Investment Services, all registered
investment advisors and wholly owned subsidiaries of Morningstar, Inc. The Morningstar name and logo are registered marks of Morningstar.
11
return (i.e., both) that vastly exceeds other available investment options it would actually make
sense to allocate monies to employer stock. Assuming the employer stock will outperform on a risk-
adjusted basis, though, is a difficult assumption to make to justify holding employer stock in a
retirement plan. Obviously very few Enron employees thought there company would rapidly move
into bankruptcy, otherwise more than half the 401(k) assets (57%) would not have been invested in
Enron stock.
Human Capital Considerations
Human capital is mathematically defined as the present value of the anticipated earnings over one’s
remaining lifetime. Or, more simply, it represents the “earnings power” of an individual. The
implications of human capital can vary widely across workers. Some individuals, such as
stockbrokers, have human capital that is highly correlated to their financial capital, whereby shocks
to the stock market are also likely to affect their human capital (i.e., income). Other professions,
such as tenured university professors, have expected lifetime earnings that are likely to be far more
consistent and exhibit characteristics that are more bond-like than stock-like. Since human capital is
a largely illiquid, untradeable asset, unlike institutional investors which have portfolios that can be
easily diversified, it must be considered when building a portfolio.
Getting back to the Enron example (a common whipping boy for anyone noting the potential risk of
holding employer securities, although there are numerous other examples), when Enron employees
purchased Enron stock, they mixed their human capital (i.e., their job) and their financial capital (i.e.,
their 401(k) plan assets). When Enron when bankrupt, Enron employees not only their jobs (a shock
to their financial capital) but many also lost significant financial capital (i.e., their entire retirement
savings). Between the two, though, for most, the shock to their human capital was far less
severe than the impact on their retirement plans. The author would guess the vast majority of those
employees who used to work at Enron have since found employment (obviously excluding one
particular former company President who remains incarcerated), yet the damage to the retirement
portfolio was permanent, and will materially affect the ability of many former Enron employees
to retire. Human capital will modeled to some extent in next section. For more information on
human capital considerations for portfolios, see Ibbotson, Milvesky, Chen, and Zhu (2007) as an
excellent reference.
Retirement Modeling
In order to demonstrate the potential impact on holding employer stock on a retirement account for
an extended period an analysis was conducted. The analysis assumes the existence of three distinct
assets: employer stock, human capital, and a test portfolio. The financial capital therefore is
assumed to be invested 100% in equities, either a test portfolio or employer stock. While the
average 401(k) participant is likely to be invested more conservatively, the impact of investing in
fixed income from a risk reduction perspective is relatively similar regardless of whether the
employee is invested in employer stock or a diversified portfolio. Therefore, this analysis provides
insight as the potential impact on the retirement balance for whatever amount is invested in
employer stock.
The underlying assumptions for each asset class are included in Table 4. Returns are converted into
real terms (i.e., adjusted for inflation) for the analysis so everything is in today’s dollars. The
assumed real return on human capital (i.e., growth in income) is 0%, i.e., income keeps pace with
inflation but doesn’t grow any faster than inflation. Inflation is assumed to be 2.5%.
©2012 Morningstar. All rights reserved. This document includes proprietary material of Morningstar Investment Management. Reproduction, transcription or
other use, by any means, in whole or in part, without the prior written consent of Morningstar is prohibited. Morningstar Investment Management is a division of
Morningstar. Morningstar Investment Management includes Morningstar Associates, Ibbotson Associates, and Morningstar Investment Services, all registered
investment advisors and wholly owned subsidiaries of Morningstar, Inc. The Morningstar name and logo are registered marks of Morningstar.
12
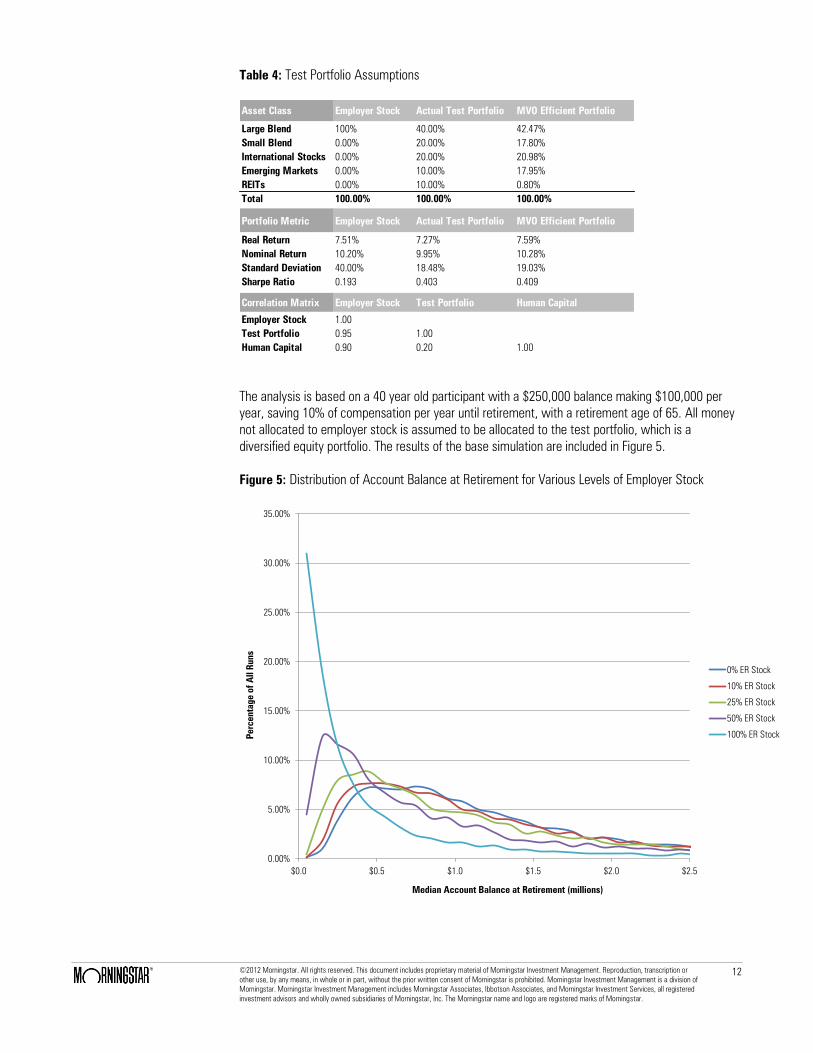
Table 4: Test Portfolio Assumptions
Asset Class Employer Stock Actual Test Portfolio MVO Efficient Portfolio
Large Blend 100% 40.00% 42.47%
Small Blend 0.00% 20.00% 17.80%
International Stocks 0.00% 20.00% 20.98%
Emerging Markets 0.00% 10.00% 17.95%
REITs 0.00% 10.00% 0.80%
Total 100.00% 100.00% 100.00%
Portfolio Metric Employer Stock Actual Test Portfolio MVO Efficient Portfolio
Real Return 7.51% 7.27% 7.59%
Nominal Return 10.20% 9.95% 10.28%
Standard Deviation 40.00% 18.48% 19.03%
Sharpe Ratio 0.193 0.403 0.409
Correlation Matrix Employer Stock Test Portfolio Human Capital
Employer Stock 1.00
Test Portfolio 0.95 1.00
Human Capital 0.90 0.20 1.00
The analysis is based on a 40 year old participant with a $250,000 balance making $100,000 per
year, saving 10% of compensation per year until retirement, with a retirement age of 65. All money
not allocated to employer stock is assumed to be allocated to the test portfolio, which is a
diversified equity portfolio. The results of the base simulation are included in Figure 5.
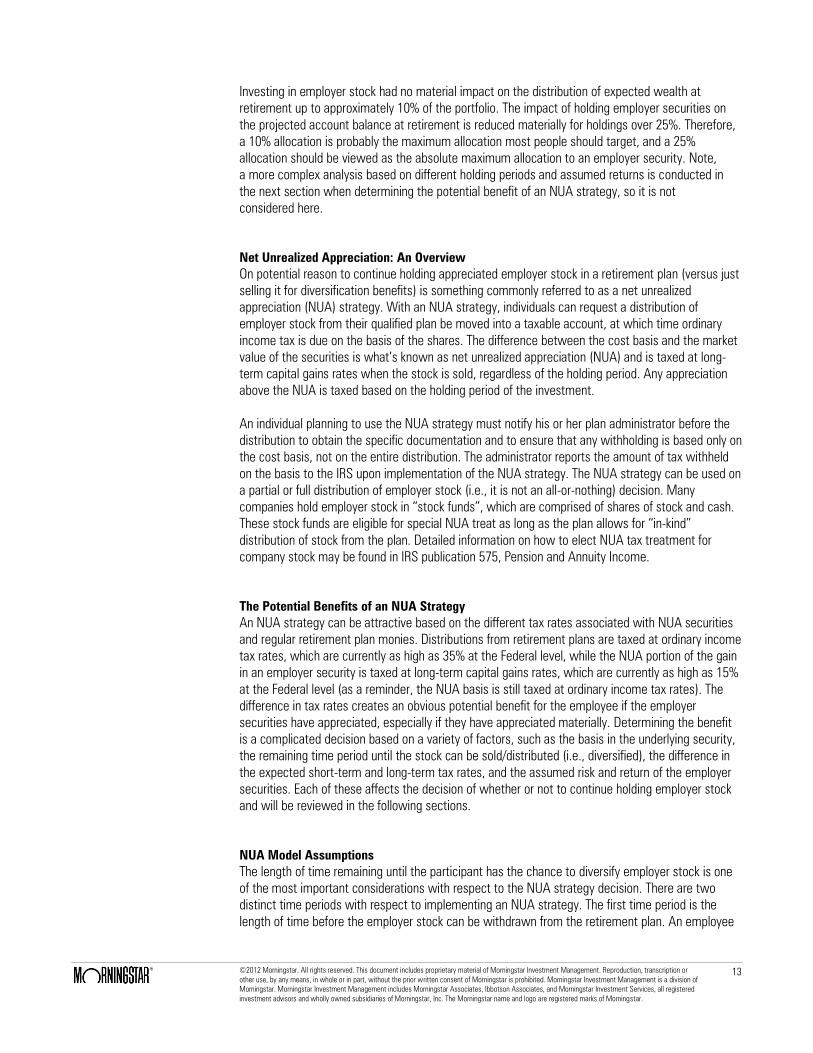
Figure 5: Distribution of Account Balance at Retirement for Various Levels of Employer Stock
0.00%
5.00%
10.00%
15.00%
20.00%
25.00%
30.00%
35.00%
$0.0 $0.5 $1.0 $1.5 $2.0 $2.5
Percentage o
f A
ll R
uns
Median Account Balance at Retirement (millions)
0% ER Stock
10% ER Stock
25% ER Stock
50% ER Stock
100% ER Stock
©2012 Morningstar. All rights reserved. This document includes proprietary material of Morningstar Investment Management. Reproduction, transcription or
other use, by any means, in whole or in part, without the prior written consent of Morningstar is prohibited. Morningstar Investment Management is a division of
Morningstar. Morningstar Investment Management includes Morningstar Associates, Ibbotson Associates, and Morningstar Investment Services, all registered
investment advisors and wholly owned subsidiaries of Morningstar, Inc. The Morningstar name and logo are registered marks of Morningstar.
13
Investing in employer stock had no material impact on the distribution of expected wealth at
retirement up to approximately 10% of the portfolio. The impact of holding employer securities on
the projected account balance at retirement is reduced materially for holdings over 25%. Therefore,
a 10% allocation is probably the maximum allocation most people should target, and a 25%
allocation should be viewed as the absolute maximum allocation to an employer security. Note,
a more complex analysis based on different holding periods and assumed returns is conducted in
the next section when determining the potential benefit of an NUA strategy, so it is not
considered here.
Net Unrealized Appreciation: An Overview
On potential reason to continue holding appreciated employer stock in a retirement plan (versus just
selling it for diversification benefits) is something commonly referred to as a net unrealized
appreciation (NUA) strategy. With an NUA strategy, individuals can request a distribution of
employer stock from their qualified plan be moved into a taxable account, at which time ordinary
income tax is due on the basis of the shares. The difference between the cost basis and the market
value of the securities is what’s known as net unrealized appreciation (NUA) and is taxed at long-
term capital gains rates when the stock is sold, regardless of the holding period. Any appreciation
above the NUA is taxed based on the holding period of the investment.
An individual planning to use the NUA strategy must notify his or her plan administrator before the
distribution to obtain the specific documentation and to ensure that any withholding is based only on
the cost basis, not on the entire distribution. The administrator reports the amount of tax withheld
on the basis to the IRS upon implementation of the NUA strategy. The NUA strategy can be used on
a partial or full distribution of employer stock (i.e., it is not an all-or-nothing) decision. Many
companies hold employer stock in “stock funds”, which are comprised of shares of stock and cash.
These stock funds are eligible for special NUA treat as long as the plan allows for “in-kind”
distribution of stock from the plan. Detailed information on how to elect NUA tax treatment for
company stock may be found in IRS publication 575, Pension and Annuity Income.
The Potential Benefits of an NUA Strategy
An NUA strategy can be attractive based on the different tax rates associated with NUA securities
and regular retirement plan monies. Distributions from retirement plans are taxed at ordinary income
tax rates, which are currently as high as 35% at the Federal level, while the NUA portion of the gain
in an employer security is taxed at long-term capital gains rates, which are currently as high as 15%
at the Federal level (as a reminder, the NUA basis is still taxed at ordinary income tax rates). The
difference in tax rates creates an obvious potential benefit for the employee if the employer
securities have appreciated, especially if they have appreciated materially. Determining the benefit
is a complicated decision based on a variety of factors, such as the basis in the underlying security,
the remaining time period until the stock can be sold/distributed (i.e., diversified), the difference in
the expected short-term and long-term tax rates, and the assumed risk and return of the employer
securities. Each of these affects the decision of whether or not to continue holding employer stock
and will be reviewed in the following sections.
NUA Model Assumptions
The length of time remaining until the participant has the chance to diversify employer stock is one
of the most important considerations with respect to the NUA strategy decision. There are two
distinct time periods with respect to implementing an NUA strategy. The first time period is the
length of time before the employer stock can be withdrawn from the retirement plan. An employee
©2012 Morningstar. All rights reserved. This document includes proprietary material of Morningstar Investment Management. Reproduction, transcription or
other use, by any means, in whole or in part, without the prior written consent of Morningstar is prohibited. Morningstar Investment Management is a division of
Morningstar. Morningstar Investment Management includes Morningstar Associates, Ibbotson Associates, and Morningstar Investment Services, all registered
investment advisors and wholly owned subsidiaries of Morningstar, Inc. The Morningstar name and logo are registered marks of Morningstar.
14
who does not plan on retiring (or have the ability to distribute the shares) for 10 years must
therefore be willing to hold the employer securities (i.e., not diversify) for at least another 10 years.
If we assume the other option available to the employee with the dollars currently invested in
employer stock is to sell the shares and purchase a diversified portfolio the potential tax advantages
of continuing to hold the employer stock must outweigh the costs associated with the lack of
diversification (which were covered in previous sections).
The second time period is how long the employee holds the stock after electing the NUA treatment
and has rolled the employer stock out of the retirement plan. Any additional appreciation (on top of
the NUA) will be taxed based on holding period, either short-term or long-term capital gains. If we
assume the employer stock does not pay any dividends, the eventual gain on the employer stock
(on top of the NUA) will be taxed at long-term capital gains rates (assuming a holding period more
than year). Therefore, there is not a large effective difference in holding employer stock in a
retirement plan for five years, electing NUA treatment, and then selling the shares in five years and
purchasing a diversified portfolio, versus holding the securities in a retirement plan for 10 years and
selling the employer stock for a diversified portfolio.
This “total employer stock period held” perspective is one that will be taken into account for
this analysis; however, there are three factors this approach does not consider. The first
consideration is that someone electing to distribute NUA shares will incur ordinary income taxes
on the cost basis of the securities. This tax must paid when electing NUA treatment from some
source that monies can longer compound from for retirement. The effect of this lost potential
compounding is assumed to be de minimus, and would be for securities that have appreciated
materially (i.e., have a small cost basis).
The second consideration is that once NUA is elected, and the employer stock eventually sold, the
securities are no longer contained in a tax-deferred account like the monies would be if they
remained in a diversified portfolio either still in the employer’s 401(k) plan or an IRA. Therefore,
realized gains in this now taxable portfolio must be paid every year which creates a potential “tax
drag” on performance. This potential impact can actually be either a benefit or a cost, depending on
the tax status of other assets when considered in conjunction with things like Asset Location
(considering tax factors when building optimal portfolios), Required Minimum Distributions (RMDs),
and potential changes in future tax rates. These items would need to be considered at the individual
participant level, and this is a complex discussion that should take place with an experienced
financial planner, accountant, or tax attorney before any decision is made.
The third consideration not included in this analysis that the reader should be aware with respect to
employer stock as an NUA strategy is the potential estate tax implications. Currently, assets in
taxable accounts receive a “step-up” in basis when someone passes away. This means that taxes
are not paid on any embedded gains in the securities, regardless of the amount of appreciation, and
is a potential benefit for a retiree with assets that have significant level of appreciation that he or
she is looking to pass on to heirs after his or her death. With respect to an NUA strategy, taxes must
still be paid on the on the NUA amount upon death, but any additional appreciation is “stepped-up”, and
therefore does not incur any capital gain taxes. In order for the potential step-up in basis to benefit the
retiree (or really his or her heirs) the stock must appreciate after the NUA status is elected, since no tax
will be due on the increased value. There are also potential benefits, though, for leaving “stretch IRAs” to
heirs. Again, this is a complex consideration for individuals with significant gains and complex estate
planning needs that should be reviewed with an experienced financial planner, accountant, or tax
attorney before any decision is made.
The remaining two factors, expected tax rates and the assumed risk and return of the employer
securities will be reviewed within a model framework similar to the previous tests. The base
©2012 Morningstar. All rights reserved. This document includes proprietary material of Morningstar Investment Management. Reproduction, transcription or
other use, by any means, in whole or in part, without the prior written consent of Morningstar is prohibited. Morningstar Investment Management is a division of
Morningstar. Morningstar Investment Management includes Morningstar Associates, Ibbotson Associates, and Morningstar Investment Services, all registered
investment advisors and wholly owned subsidiaries of Morningstar, Inc. The Morningstar name and logo are registered marks of Morningstar.
15
assumption, like the previous tests, is that the employer security is a Large Cap stock with the same
return and correlation as the Large Cap asset class. The base annual standard deviation is assumed
to be double the Large Cap amount (40% and 20%, respectively), which (again) is based on the
additional historical risk that has typically been associated with holding individual securities versus a
diversified portfolio. The employer stock return and standard deviation assumptions will be relaxed
during some tests to determine the impact of varying returns and standard deviations on an NUA
strategy. The diversified test portfolio will the same used in the Retirement Modeling section,
highlighted in Table 4.
Three primary methodologies will be tested to determine the potential benefit of an NUA approach.
The first approach is hold the employer security (“Hold ER Stock”), the second approach is to
immediately sell the employer security and invest in a diversified portfolio (“Immediate”), and the
third approach involves a systematic liquidation of the employer securities (“Phase”). For this
approach, 25% of the total value of the employer securities is sold at the end of each year. This
approach will not reduce the employee’s value in employer securities to $0 (unless the employer
stock itself becomes worthless), but instead serves as a reasonable approach to minimize the risks
of holding individual securities while potentially maintaining some benefit from an NUA strategy (the
remaining dollars in the employer securities will be tracked and an NUA approach will be assumed
to occur for those securities).
The base ordinary income tax rate is assumed to be 35% and the base long-term capital gains rate
is assumed to be 15%. While these will these tax rates will likely change at some point in the
future, the key information in the test is from the respective difference between the two rates (i.e.,
how much greater one is than the other). The assumed balance in employer stock is $100,000 for
all simulations. Each NUA simulation is based on a 10,000 run Monte Carlo simulation. Similar to
previous tests, returns are generated at the asset class level and assumed to follow a multivariate
normal distribution.
NUA Results
The first test to determine the potential benefit of an NUA strategy assumes a 401(k) participant
has ten years until he or she is going to retire. At which time it assumed he or she will distribute all
monies from the plan and pay all applicable taxes and diversify the portfolio. The basis at the time of
liquidation (i.e., 10 years from now) is assumed to be 25% of the value. The NUA amount (75% of
the value of the employer securities), will be taxed at a 15% long-term capital gains rate and the
basis (25% of the value) will be taxed at a 35% ordinary income tax rate. The return and market
correlation for the employer stock is the same as the Large Cap asset class (which is 40% of the
diversified test portfolio), although the annual standard deviation is double (40%). The distribution of
account balances at retirement, whether or not the employer stock is held in its entirely (“Hold ER
Stock”), liquidated in 25% increments per year (“Phased”), or immediately sold and invested in a
diversified portfolio (“Immediate”) are included in Figure 6.
©2012 Morningstar. All rights reserved. This document includes proprietary material of Morningstar Investment Management. Reproduction, transcription or
other use, by any means, in whole or in part, without the prior written consent of Morningstar is prohibited. Morningstar Investment Management is a division of
Morningstar. Morningstar Investment Management includes Morningstar Associates, Ibbotson Associates, and Morningstar Investment Services, all registered
investment advisors and wholly owned subsidiaries of Morningstar, Inc. The Morningstar name and logo are registered marks of Morningstar.
16
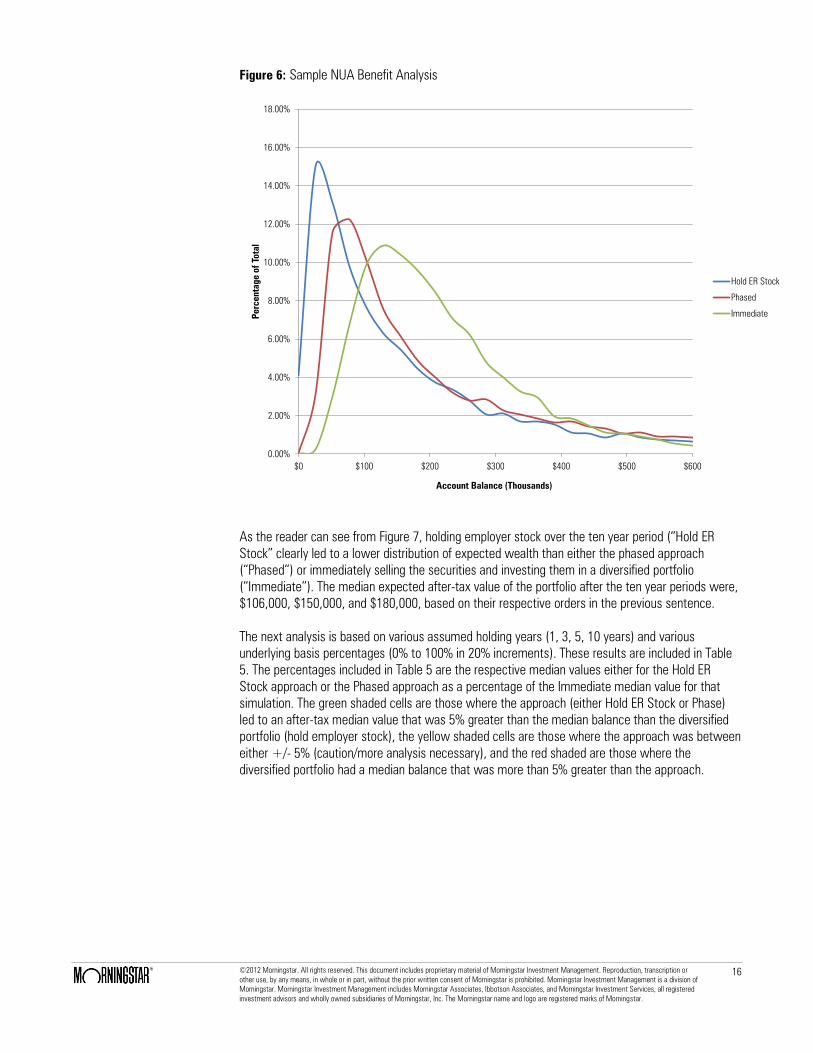
Figure 6: Sample NUA Benefit Analysis
0.00%
2.00%
4.00%
6.00%
8.00%
10.00%
12.00%
14.00%
16.00%
18.00%
$0 $100 $200 $300 $400 $500 $600
Percentage o
f T
otal
Account Balance (Thousands)
Hold ER Stock
Phased
Immediate
As the reader can see from Figure 7, holding employer stock over the ten year period (“Hold ER
Stock” clearly led to a lower distribution of expected wealth than either the phased approach
(“Phased”) or immediately selling the securities and investing them in a diversified portfolio
(“Immediate”). The median expected after-tax value of the portfolio after the ten year periods were,
$106,000, $150,000, and $180,000, based on their respective orders in the previous sentence.
The next analysis is based on various assumed holding years (1, 3, 5, 10 years) and various
underlying basis percentages (0% to 100% in 20% increments). These results are included in Table
5. The percentages included in Table 5 are the respective median values either for the Hold ER
Stock approach or the Phased approach as a percentage of the Immediate median value for that
simulation. The green shaded cells are those where the approach (either Hold ER Stock or Phase)
led to an after-tax median value that was 5% greater than the median balance than the diversified
portfolio (hold employer stock), the yellow shaded cells are those where the approach was between
either +/- 5% (caution/more analysis necessary), and the red shaded are those where the
diversified portfolio had a median balance that was more than 5% greater than the approach.
©2012 Morningstar. All rights reserved. This document includes proprietary material of Morningstar Investment Management. Reproduction, transcription or
other use, by any means, in whole or in part, without the prior written consent of Morningstar is prohibited. Morningstar Investment Management is a division of
Morningstar. Morningstar Investment Management includes Morningstar Associates, Ibbotson Associates, and Morningstar Investment Services, all registered
investment advisors and wholly owned subsidiaries of Morningstar, Inc. The Morningstar name and logo are registered marks of Morningstar.
17
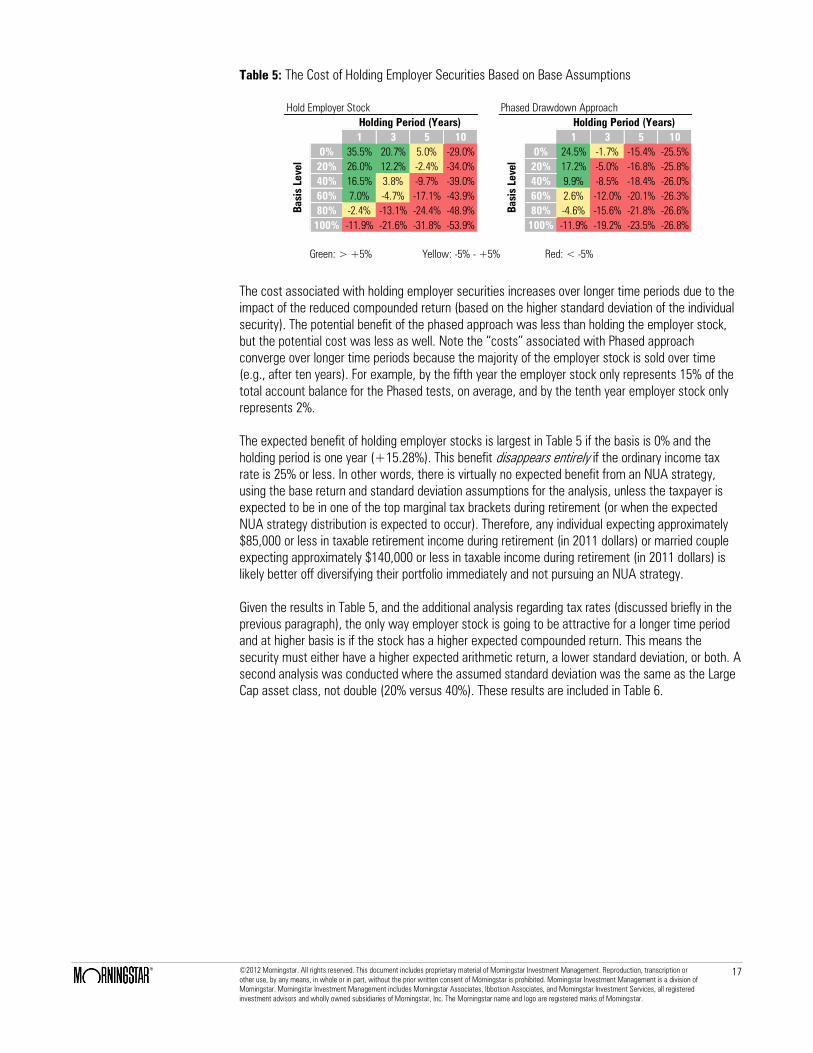
Table 5: The Cost of Holding Employer Securities Based on Base Assumptions
1 3 5 10 1 3 5 10
0% 35.5% 20.7% 5.0% -29.0% 0% 24.5% -1.7% -15.4% -25.5%
20% 26.0% 12.2% -2.4% -34.0% 20% 17.2% -5.0% -16.8% -25.8%
40% 16.5% 3.8% -9.7% -39.0% 40% 9.9% -8.5% -18.4% -26.0%
60% 7.0% -4.7% -17.1% -43.9% 60% 2.6% -12.0% -20.1% -26.3%
80% -2.4% -13.1% -24.4% -48.9% 80% -4.6% -15.6% -21.8% -26.6%
100% -11.9% -21.6% -31.8% -53.9% 100% -11.9% -19.2% -23.5% -26.8%
Hold Employer Stock Phased Drawdown Approach
Green: > +5% Yellow: -5% - +5% Red: < -5%
Holding Period (Years)
Ba
sis
Le
ve
l
Holding Period (Years)
Ba
sis
Le
ve
l
The cost associated with holding employer securities increases over longer time periods due to the
impact of the reduced compounded return (based on the higher standard deviation of the individual
security). The potential benefit of the phased approach was less than holding the employer stock,
but the potential cost was less as well. Note the “costs” associated with Phased approach
converge over longer time periods because the majority of the employer stock is sold over time
(e.g., after ten years). For example, by the fifth year the employer stock only represents 15% of the
total account balance for the Phased tests, on average, and by the tenth year employer stock only
represents 2%.
The expected benefit of holding employer stocks is largest in Table 5 if the basis is 0% and the
holding period is one year (+15.28%). This benefit disappears entirely if the ordinary income tax
rate is 25% or less. In other words, there is virtually no expected benefit from an NUA strategy,
using the base return and standard deviation assumptions for the analysis, unless the taxpayer is
expected to be in one of the top marginal tax brackets during retirement (or when the expected
NUA strategy distribution is expected to occur). Therefore, any individual expecting approximately
$85,000 or less in taxable retirement income during retirement (in 2011 dollars) or married couple
expecting approximately $140,000 or less in taxable income during retirement (in 2011 dollars) is
likely better off diversifying their portfolio immediately and not pursuing an NUA strategy.
Given the results in Table 5, and the additional analysis regarding tax rates (discussed briefly in the
previous paragraph), the only way employer stock is going to be attractive for a longer time period
and at higher basis is if the stock has a higher expected compounded return. This means the
security must either have a higher expected arithmetic return, a lower standard deviation, or both. A
second analysis was conducted where the assumed standard deviation was the same as the Large
Cap asset class, not double (20% versus 40%). These results are included in Table 6.
©2012 Morningstar. All rights reserved. This document includes proprietary material of Morningstar Investment Management. Reproduction, transcription or
other use, by any means, in whole or in part, without the prior written consent of Morningstar is prohibited. Morningstar Investment Management is a division of
Morningstar. Morningstar Investment Management includes Morningstar Associates, Ibbotson Associates, and Morningstar Investment Services, all registered
investment advisors and wholly owned subsidiaries of Morningstar, Inc. The Morningstar name and logo are registered marks of Morningstar.
18
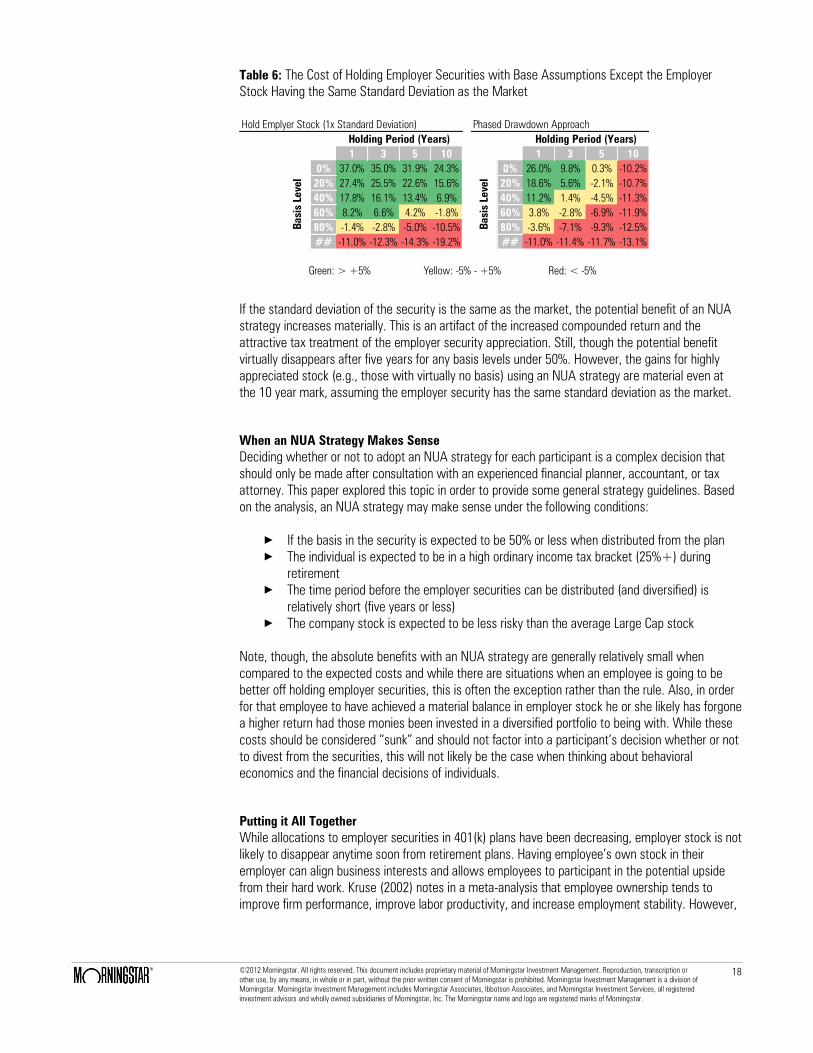
Table 6: The Cost of Holding Employer Securities with Base Assumptions Except the Employer
Stock Having the Same Standard Deviation as the Market
1 3 5 10 1 3 5 10
0% 37.0% 35.0% 31.9% 24.3% 0% 26.0% 9.8% 0.3% -10.2%
20% 27.4% 25.5% 22.6% 15.6% 20% 18.6% 5.6% -2.1% -10.7%
40% 17.8% 16.1% 13.4% 6.9% 40% 11.2% 1.4% -4.5% -11.3%
60% 8.2% 6.6% 4.2% -1.8% 60% 3.8% -2.8% -6.9% -11.9%
80% -1.4% -2.8% -5.0% -10.5% 80% -3.6% -7.1% -9.3% -12.5%
## -11.0% -12.3% -14.3% -19.2% ## -11.0% -11.4% -11.7% -13.1%
Green: > +5% Yellow: -5% - +5% Red: < -5%
Ba
sis
Le
ve
l
Holding Period (Years)
Ba
sis
Le
ve
l
Phased Drawdown Approach
Holding Period (Years)
Hold Emplyer Stock (1x Standard Deviation)
If the standard deviation of the security is the same as the market, the potential benefit of an NUA
strategy increases materially. This is an artifact of the increased compounded return and the
attractive tax treatment of the employer security appreciation. Still, though the potential benefit
virtually disappears after five years for any basis levels under 50%. However, the gains for highly
appreciated stock (e.g., those with virtually no basis) using an NUA strategy are material even at
the 10 year mark, assuming the employer security has the same standard deviation as the market.
When an NUA Strategy Makes Sense
Deciding whether or not to adopt an NUA strategy for each participant is a complex decision that
should only be made after consultation with an experienced financial planner, accountant, or tax
attorney. This paper explored this topic in order to provide some general strategy guidelines. Based
on the analysis, an NUA strategy may make sense under the following conditions:
× If the basis in the security is expected to be 50% or less when distributed from the plan
× The individual is expected to be in a high ordinary income tax bracket (25%+) during
retirement
× The time period before the employer securities can be distributed (and diversified) is
relatively short (five years or less)
× The company stock is expected to be less risky than the average Large Cap stock
Note, though, the absolute benefits with an NUA strategy are generally relatively small when
compared to the expected costs and while there are situations when an employee is going to be
better off holding employer securities, this is often the exception rather than the rule. Also, in order
for that employee to have achieved a material balance in employer stock he or she likely has forgone
a higher return had those monies been invested in a diversified portfolio to being with. While these
costs should be considered “sunk” and should not factor into a participant’s decision whether or not
to divest from the securities, this will not likely be the case when thinking about behavioral
economics and the financial decisions of individuals.
Putting it All Together
While allocations to employer securities in 401(k) plans have been decreasing, employer stock is not
likely to disappear anytime soon from retirement plans. Having employee’s own stock in their
employer can align business interests and allows employees to participant in the potential upside
from their hard work. Kruse (2002) notes in a meta-analysis that employee ownership tends to
improve firm performance, improve labor productivity, and increase employment stability. However,
©2012 Morningstar. All rights reserved. This document includes proprietary material of Morningstar Investment Management. Reproduction, transcription or
other use, by any means, in whole or in part, without the prior written consent of Morningstar is prohibited. Morningstar Investment Management is a division of
Morningstar. Morningstar Investment Management includes Morningstar Associates, Ibbotson Associates, and Morningstar Investment Services, all registered
investment advisors and wholly owned subsidiaries of Morningstar, Inc. The Morningstar name and logo are registered marks of Morningstar.
19
what is good business sense for the plan sponsor does not necessarily translate into good financial
planning sense for individuals preparing for retirement.
In a totally rational world, employees would only be holding employer stock if the benefits
outweighed the costs (i.e., assuming every person followed the theory of homo economicus). Given
that in most cases the costs associated with holding employer appear to outweigh the benefits of
investing those dollars in a diversified portfolio (especially for allocations to employer stock over
25% of one’s portfolio) it would make sense for many employees to today to sell most of all their
employer security holdings immediately. The author recognizes, though, such a recommendation is
not likely to be practical (or attractive) to plan sponsors offering employer stock or employees with
substantial holdings. Therefore, here are some general guidelines that plan sponsors and
participants should be aware with respect to employer securities in a 401(k) plan:
1. Having employer stock in a 401(k) plan increases the fiduciary risk to the plan sponsor, therefore,
the perceived benefit of including from an employee morale or corporate culture perspective must
outweigh these risks.
2. Limiting the total allocation to employer stock in an employee’s account makes sense. For
example, mandating that no individual can hold more than 25% of employer securities as a core
investment option, reduces the risk of holding securities in the 401(k) to both the employer and the
employee. Using an even more conservative maximum target (e.g., 10%) should also be considered.
3. For those plans with employees that have high allocations to employer stock, especially those
employees near retirement, it would likely make sense to implement a “phased approach” to reduce
each employee’s allocation to employer stock. The approach taken in this paper was to reduce the
allocation by 25% per year.
4. Employees holding employer stock should likely take less risk in other areas of their portfolio. A
participant with a 100% allocation to employer stock does not have the same risk characteristics as
someone with a 100% allocation to a diversified equity portfolio.
5. Employees with employer securities should regularly be notified about the risks of such a
strategy, potentially beyond the IRS mandated disclosures (that the author would contend few
participant’s actually read).
There are additional complicating factors with respect to employer securities that warrant
consideration at the individual participant level, especially for those employees with large holdings in
employer stock that have appreciated materially. These include potential estate tax benefits as well
as asset allocation in light of taxation (something known as Asset Location).
©2012 Morningstar. All rights reserved. This document includes proprietary material of Morningstar Investment Management. Reproduction, transcription or
other use, by any means, in whole or in part, without the prior written consent of Morningstar is prohibited. Morningstar Investment Management is a division of
Morningstar. Morningstar Investment Management includes Morningstar Associates, Ibbotson Associates, and Morningstar Investment Services, all registered
investment advisors and wholly owned subsidiaries of Morningstar, Inc. The Morningstar name and logo are registered marks of Morningstar.
20
Conclusions
This paper explored the potential benefits and costs associated with holding employer securities in a
401(k) plan. While investing in “what he knew” enabled Peter Lynch to put together one of the best
mutual fund performance track records of all time, investing in employer securities inside a 401(k)
plan introduces additional risk to both the employer/plan sponsor and the individual employees. For
those plans that offer employer securities in a defined contribution framework, it makes sense to
attempt to limit the participant’s total allocation to employer stock (e.g., absolutely no more than
25% of the account balance and likely a 10% target) as well as to encourage some type of phased
divestment program. While selling all employer securities immediately is likely the best
mathematical solution, it is not likely a practical solution given employer and employee attitudes
towards employer stock. Therefore, implementing a program where employer stock is regularly sold
through time (e.g., 25% per year) is an intelligent way to reduce exposure to employer securities
and increase the likelihood of participant’s being able to retire successfully.
©2012 Morningstar. All rights reserved. This document includes proprietary material of Morningstar Investment Management. Reproduction, transcription or
other use, by any means, in whole or in part, without the prior written consent of Morningstar is prohibited. Morningstar Investment Management is a division of
Morningstar. Morningstar Investment Management includes Morningstar Associates, Ibbotson Associates, and Morningstar Investment Services, all registered
investment advisors and wholly owned subsidiaries of Morningstar, Inc. The Morningstar name and logo are registered marks of Morningstar.
21
References
Aon Hewitt. 2011. “Trends & Experience in Defined Contribution Plans Report.” Retrieved from
http://www.aon.com/attachments/thought-
leadership/2011_Trends_Experience_Executive_Summary_v5.pdf
Dell, Michael J. and Michael J. Nassau. 2009. “Stock Drop Cases and the Presumption of Prudence:
When It Applies, How It Is Overcome.” Journal of Retirement Planning. November/December.
EBRI Issue Brief. 2011. “401(k) Plan Asset Allocation, Account Balances, and Loan Activity in 2010”.
Retrieved from: http://www.ebri.org/publications/ib/index.cfm?fa=ibDisp&content_id=4968
“Enron Debacle Will Force Clean Up of Company Stock Use in DC Plans,” IOMA’s DC Plan
Investing, Dec. 11, 2001, p 1.
Huberman, Gur and Sengmueller, Paul F. 2002. Company Stock in 401(k) Plans (October 1, 2002).
EFA 2003 Annual Conference Paper No. 659. Available at SSRN: http://ssrn.com/abstract=423992
or doi:10.2139/ssrn.423992
Ibbotson, Roger G., Moshe A. Milevsky, Peng Chen, CFA, and Kevin X. Zhu. 2007. Lifetime Financial
Advice: Human Capital, Asset Allocation, and Insurance. The Research Foundation of CFA Institute.
ICI Press Release: Retrieved from: http://www.ici.org/pressroom/news/ret_11_q3
Kruse, Douglas. 2002. Research Evidence on Prevalence and Effects of Employee Ownership.
Special testimony before the Subcommittee on Employer-Employee Relations, Committee on
Education and the Workforce, U.S. House of Representatives, February 13, 2002. Retrieved from:
http://esop.com/pdf/esopHistoryAndResearch/researchEvidence.pdf
Markowitz, H.M. (March 1952). "Portfolio Selection". The Journal of Finance 7 (1): 77–91.
Meulbroek, Lisa. 2002. Company Stock in Pension Plans: How Costly Is It? Working Paper No. 02-
058. Harvard Business School, Boston, Mass.
Murray, Ann E. and Leah Morgan Singleton. 2010. “Focus On…Compensation Offering Company
Stock as an Investment Option in Retirement Plans.” Retrieved from:
http://www.mckennalong.com/media/site_files/1521_Compensation%20Offering%20Company%20
Stock%20As%20An%20Investment.pdf
Steyer, Robert. 2010. “Some plans remain company-stock heavy”. Pensions and Investments.
Retrieved from: http://www.pionline.com/article/20100712/PRINTSUB/307129967
©2012 Morningstar. All rights reserved. This document includes proprietary material of Morningstar Investment Management. Reproduction, transcription or
other use, by any means, in whole or in part, without the prior written consent of Morningstar is prohibited. Morningstar Investment Management is a division of
Morningstar. Morningstar Investment Management includes Morningstar Associates, Ibbotson Associates, and Morningstar Investment Services, all registered
investment advisors and wholly owned subsidiaries of Morningstar, Inc. The Morningstar name and logo are registered marks of Morningstar.
22
Vanguard. 2010. Company stock revisited: Some good news, room for improvement Retrieved from:
https://institutional.vanguard.com/VGApp/iip/site/institutional/researchcommentary/article?File=Ne
wsCoCompanyRevisted.
Wiatrowski, William J. 2008. “Bureau of Labor Monthly Review.” Retrieved from:
http://www.bls.gov/opub/mlr/2008/11/art1full.pdf
Winston & Strawn. 2011. “Second Circuit Joins Five Other Circuits in Ruling Company Stock
Investments in 401(k) Plans Are Presumptively Prudent.” Retrieved from:
http://www.winston.com/siteFiles/Publications/Citigroup_McGraw-Hill_ERISA_Cases.pdf
Important Disclosures
The above commentary is for informational purposes only and should not be viewed as an offer to
buy or sell a particular security. The data and/or information noted are from what we believe to be
reliable sources, however Morningstar Associates has no control over the means or methods used
to collect the data/information and therefore cannot guarantee their accuracy or completeness. The
opinions and estimates noted herein are accurate as of a certain date and are subject to change.
The indices referenced are unmanaged and cannot be invested in directly. Past performance is no
guarantee of future results.
This commentary may contain forward-looking statements, which reflect our current expectations or
forecasts of future events. Forward-looking statements are inherently subject to, among other
things, risks, uncertainties and assumptions which could cause actual events, results, performance
or prospects to differ materiality from those expressed in, or implied by, these forward-looking
statements. The forward-looking information contained in this commentary is as of the date of this
report and subject to change. There should not be an expectation that such information will in all
circumstances be updated, supplemented or revised whether as a result of new information,
changing circumstances, future events or otherwise.
Unless otherwise noted, all tables and charts are author’s calculations.