Embed Size (px)
Citation preview
International Journal of Management and Social Sciences Research (IJMSSR) ISSN: 2319-4421 Volume 2, No. 10, October 2013
i-Xplore International Research Journal Consortium www.irjcjournals.org
64
Employee Productivity of Private Sector Banks in India
Dr. Hawa Singh, Department of Commerce, Kurukshetra University, Kurukshetra, India Kamlesh , Research Scholar, Department of Commerce, Kurukshetra University, Kurukshetra, India ABSTRACT The Indian banking industry is said to have an excessive use of labour due to the significant market share of government owned banks. Indian government has undertaken a process of regulatory reform to bring about market discipline in the usage of inputs and to increase the employee efficiency and productivity. Banks, just like any other firm, need to transform inputs into outputs at an efficient rate in order to maximize profitability and to survive under competitive conditions. Human resource is the most important resource of the organization. Due to motivated and talented manpower the banking sector is giving good results every year. In Indian banking sector public, private, foreign, development and cooperative banks are performing banking service very well under competitive situation. In this situation, for survival and growth management in banks is adopting different strategies to improve employee productivity. The focus of this paper is the estimation employee productivity in the Indian banking sectors. To analyze the employee productivity of the private sector banks eight parameter like profit, deposit, advances, spread, burden, total income, business and total expenses are selected and statistical tools like average, standard deviation, coefficient of variation, exponential growth rate (EGR) and trend analysis have been used for analyzing the data. The time period selected for the study is 2002-2012. This study will help the private sector banks in India to make some financial decision for further years. Keywords: Productivity, Private Sector Banks, Employee and Performance. INTRODUCTION Commercial banks play an important role in the any country's economy by financing the requirements of trade, industry and agriculture with a greater degree of responsibility. Banks mop up deposits by drawing the community savings into the organized sector, which are then priorities laid down by the RBI in consonance with the fiscal policies of the GOI. Commercial banks can be described as a type of financial intermediary. Commercial banks provide a number of import financial and trading documents such as letters of credit, performance bonds, standby letters of credit, security underwriting
commitments and various other types of balance sheet guarantees. They also take responsibility for safeguarding such documents and other valuables by safe deposit boxes. For the past three decades India’s banking system has several outstanding achievements system to its credit. The most striking is its extensive reach. It is no longer confined to only metropolitans or cosmopolitans in India. In fact, Indian banking system has reached even to the remote corners of the country. Thus, Growing Indian economy is the result of effective Indian banking system amongst many other responsible internal and external factors, in which the role played by public commercial banks in the country is also a crucial one. Banking in India has its origin as early or Vedic period. It is believed that the transitions from many lending to banking must have occurred even before Manu, the great Hindu furriest, who has devoted a section of his work to deposit and advances and laid down rules relating to the rate of interest. During the mogul period, the indigenous banker played a very important role in lending money and financing foreign trade and commerce. During the days of the East India Company it was the turn of agency house to carry on the banking business. The General Bank of India was the first joint stock bank to be established in the year 1786. The other which followed was the Bank of Hindustan and Bengal Bank. The Bank of Hindustan is reported to have continued till 1906. While other two failed in the meantime. In the first half of the 19th century the East India Company established there banks, the bank of Bengal in 1809, the Bank of Bombay in 1840 and the Bank of Bombay in1843. These three banks also known as the Presidency banks were the independent units and functioned well. These three banks were amalgamated in 1920 and new bank, the Imperial Bank of India was established on 27th January, 1921. With the passing of the State Bank of India Act in 1955 the undertaking of the Imperial Bank of India was taken over by the newly constituted SBI. The Reserve Bank of India (RBI) which is the Central bank was established in April, 1935 by passing Reserve bank of India act 1935. The Central office of RBI is in Mumbai and it controls all the other banks in the country. In the wake of Swadeshi Movement, number of banks with the Indian management were established in the country namely, Punjab National Bank Ltd., Bank of India Ltd., Bank of Baroda Ltd., Canara Bank. Ltd. on 19th July 1969, 14 major banks of the country were nationalized and on 15th April 1980, 6
International Journal of Management and Social Sciences Research (IJMSSR) ISSN: 2319-4421 Volume 2, No. 10, October 2013
i-Xplore International Research Journal Consortium www.irjcjournals.org
65
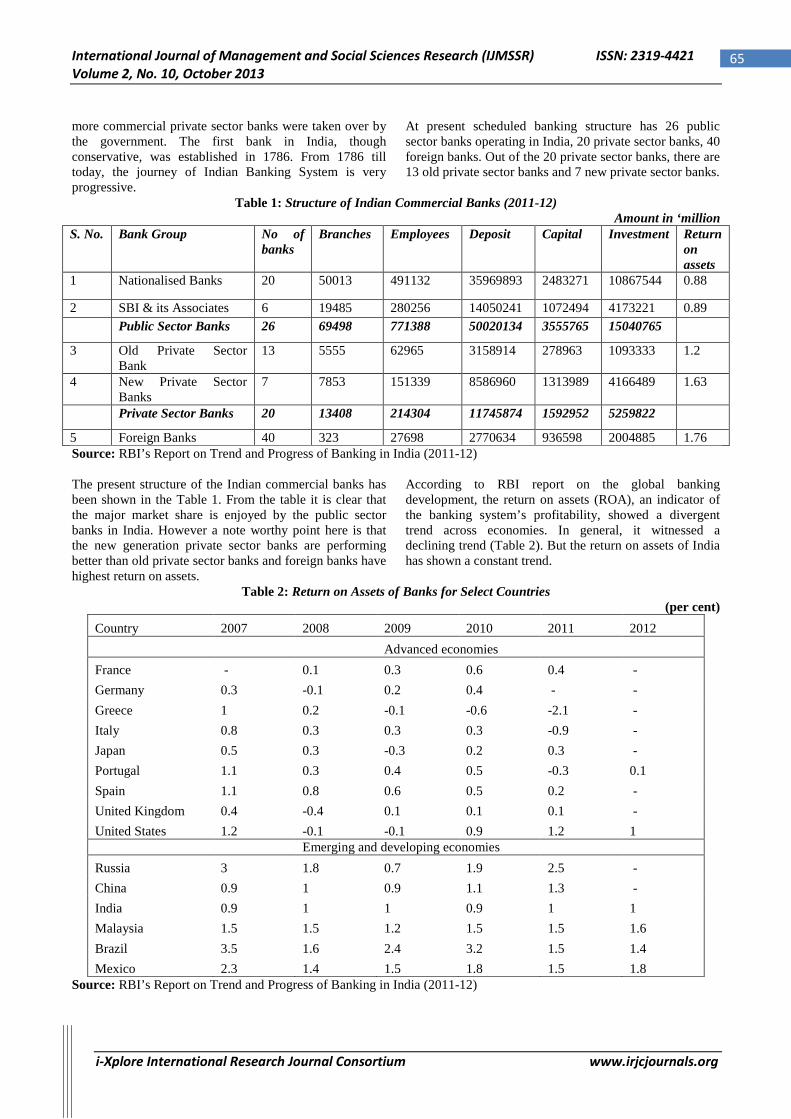
more commercial private sector banks were taken over by the government. The first bank in India, though conservative, was established in 1786. From 1786 till today, the journey of Indian Banking System is very progressive.
At present scheduled banking structure has 26 public sector banks operating in India, 20 private sector banks, 40 foreign banks. Out of the 20 private sector banks, there are 13 old private sector banks and 7 new private sector banks.
Table 1: Structure of Indian Commercial Banks (2011-12) Amount in ‘million
S. No. Bank Group No of banks
Branches Employees Deposit Capital Investment Return on assets
1 Nationalised Banks 20 50013 491132 35969893 2483271 10867544 0.88
2 SBI & its Associates 6 19485 280256 14050241 1072494 4173221 0.89 Public Sector Banks 26 69498 771388 50020134 3555765 15040765
3 Old Private Sector Bank
13 5555 62965 3158914 278963 1093333 1.2
4 New Private Sector Banks
7 7853 151339 8586960 1313989 4166489 1.63
Private Sector Banks 20 13408 214304 11745874 1592952 5259822
5 Foreign Banks 40 323 27698 2770634 936598 2004885 1.76 Source: RBI’s Report on Trend and Progress of Banking in India (2011-12) The present structure of the Indian commercial banks has been shown in the Table 1. From the table it is clear that the major market share is enjoyed by the public sector banks in India. However a note worthy point here is that the new generation private sector banks are performing better than old private sector banks and foreign banks have highest return on assets.
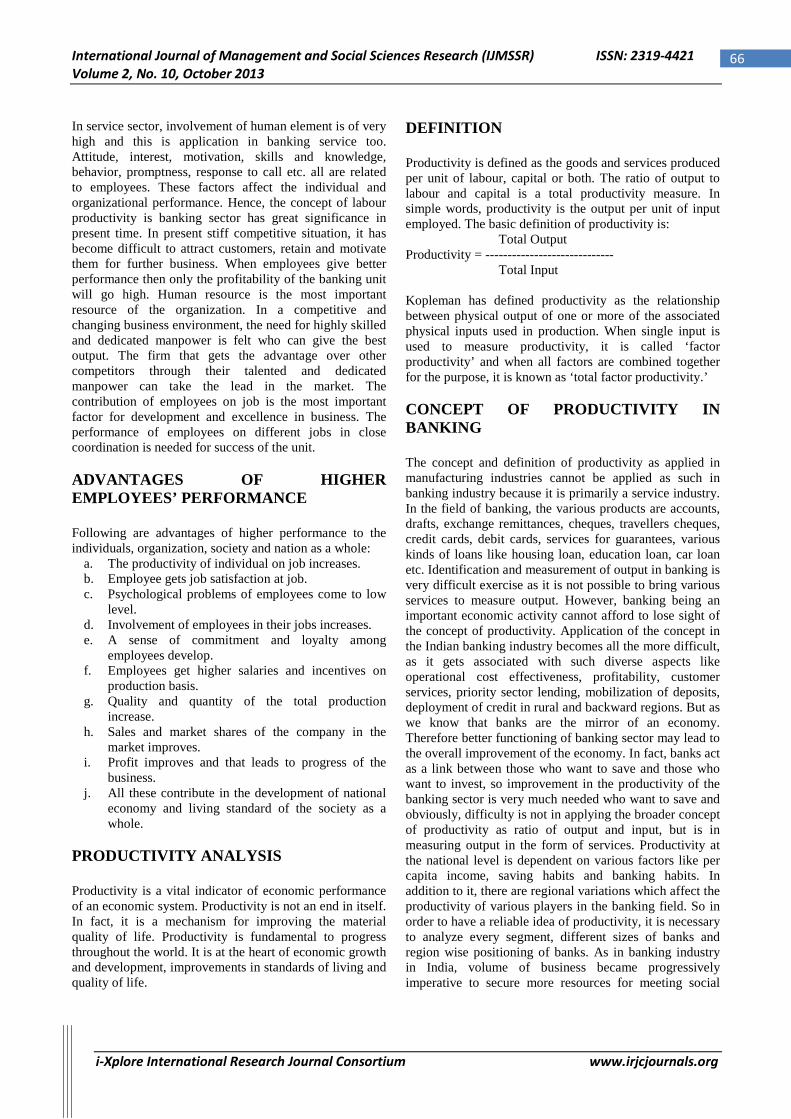
According to RBI report on the global banking development, the return on assets (ROA), an indicator of the banking system’s profitability, showed a divergent trend across economies. In general, it witnessed a declining trend (Table 2). But the return on assets of India has shown a constant trend.
Table 2: Return on Assets of Banks for Select Countries (per cent)
Country 2007 2008 2009 2010 2011 2012
Advanced economies
France - 0.1 0.3 0.6 0.4 - Germany 0.3 -0.1 0.2 0.4 - - Greece 1 0.2 -0.1 -0.6 -2.1 - Italy 0.8 0.3 0.3 0.3 -0.9 - Japan 0.5 0.3 -0.3 0.2 0.3 - Portugal 1.1 0.3 0.4 0.5 -0.3 0.1 Spain 1.1 0.8 0.6 0.5 0.2 - United Kingdom 0.4 -0.4 0.1 0.1 0.1 - United States 1.2 -0.1 -0.1 0.9 1.2 1
Emerging and developing economies
Russia 3 1.8 0.7 1.9 2.5 - China 0.9 1 0.9 1.1 1.3 - India 0.9 1 1 0.9 1 1 Malaysia 1.5 1.5 1.2 1.5 1.5 1.6 Brazil 3.5 1.6 2.4 3.2 1.5 1.4 Mexico 2.3 1.4 1.5 1.8 1.5 1.8
Source: RBI’s Report on Trend and Progress of Banking in India (2011-12)
International Journal of Management and Social Sciences Research (IJMSSR) ISSN: 2319-4421 Volume 2, No. 10, October 2013
i-Xplore International Research Journal Consortium www.irjcjournals.org
66
In service sector, involvement of human element is of very high and this is application in banking service too. Attitude, interest, motivation, skills and knowledge, behavior, promptness, response to call etc. all are related to employees. These factors affect the individual and organizational performance. Hence, the concept of labour productivity is banking sector has great significance in present time. In present stiff competitive situation, it has become difficult to attract customers, retain and motivate them for further business. When employees give better performance then only the profitability of the banking unit will go high. Human resource is the most important resource of the organization. In a competitive and changing business environment, the need for highly skilled and dedicated manpower is felt who can give the best output. The firm that gets the advantage over other competitors through their talented and dedicated manpower can take the lead in the market. The contribution of employees on job is the most important factor for development and excellence in business. The performance of employees on different jobs in close coordination is needed for success of the unit. ADVANTAGES OF HIGHER EMPLOYEES’ PERFORMANCE Following are advantages of higher performance to the individuals, organization, society and nation as a whole:
a. The productivity of individual on job increases. b. Employee gets job satisfaction at job. c. Psychological problems of employees come to low
level. d. Involvement of employees in their jobs increases. e. A sense of commitment and loyalty among
employees develop. f. Employees get higher salaries and incentives on
production basis. g. Quality and quantity of the total production
increase. h. Sales and market shares of the company in the
market improves. i. Profit improves and that leads to progress of the
business. j. All these contribute in the development of national
economy and living standard of the society as a whole.
PRODUCTIVITY ANALYSIS Productivity is a vital indicator of economic performance of an economic system. Productivity is not an end in itself. In fact, it is a mechanism for improving the material quality of life. Productivity is fundamental to progress throughout the world. It is at the heart of economic growth and development, improvements in standards of living and quality of life.
DEFINITION Productivity is defined as the goods and services produced per unit of labour, capital or both. The ratio of output to labour and capital is a total productivity measure. In simple words, productivity is the output per unit of input employed. The basic definition of productivity is: Total Output Productivity = ----------------------------- Total Input Kopleman has defined productivity as the relationship between physical output of one or more of the associated physical inputs used in production. When single input is used to measure productivity, it is called ‘factor productivity’ and when all factors are combined together for the purpose, it is known as ‘total factor productivity.’ CONCEPT OF PRODUCTIVITY IN BANKING The concept and definition of productivity as applied in manufacturing industries cannot be applied as such in banking industry because it is primarily a service industry. In the field of banking, the various products are accounts, drafts, exchange remittances, cheques, travellers cheques, credit cards, debit cards, services for guarantees, various kinds of loans like housing loan, education loan, car loan etc. Identification and measurement of output in banking is very difficult exercise as it is not possible to bring various services to measure output. However, banking being an important economic activity cannot afford to lose sight of the concept of productivity. Application of the concept in the Indian banking industry becomes all the more difficult, as it gets associated with such diverse aspects like operational cost effectiveness, profitability, customer services, priority sector lending, mobilization of deposits, deployment of credit in rural and backward regions. But as we know that banks are the mirror of an economy. Therefore better functioning of banking sector may lead to the overall improvement of the economy. In fact, banks act as a link between those who want to save and those who want to invest, so improvement in the productivity of the banking sector is very much needed who want to save and obviously, difficulty is not in applying the broader concept of productivity as ratio of output and input, but is in measuring output in the form of services. Productivity at the national level is dependent on various factors like per capita income, saving habits and banking habits. In addition to it, there are regional variations which affect the productivity of various players in the banking field. So in order to have a reliable idea of productivity, it is necessary to analyze every segment, different sizes of banks and region wise positioning of banks. As in banking industry in India, volume of business became progressively imperative to secure more resources for meeting social
International Journal of Management and Social Sciences Research (IJMSSR) ISSN: 2319-4421 Volume 2, No. 10, October 2013
i-Xplore International Research Journal Consortium www.irjcjournals.org
67
objectives while maintaining viability of operations, business level may be preferred as being more representative of productivity. Productivity helps firms, industries and nations to achieve sustainable competitive advantage. Industry is a thrust area for countries in their quest for competitiveness. It must be noted that banks which have maintained the momentum of continuous growth, and profitability showed better ratio of manpower effectiveness. Each element has crucial sub- components which serve as building blocks for productivity. The Government policies effectively support competitiveness if they are structures around productivity driven reform mechanism, cost deflating tariff structure and technology and industry vision. REVIEW OF LITERATURE Performance evaluation of banks, has received lot of attention over the past several years (Seifrd and Zhu, 1999). A number of studies were conducted to compare different types of banks operating in India based on different performance/efficiency criteria/ parameters from time to time. After nationalization of banks, there was a growing concern on the deteriorating of banking sector’s efficiency in several spheres. The Reserve Bank of India constituted a number of committees, notably Tondon Committee (1975), Luther Committee (1977), Chakravarty Committee (1986) and Narsimham Committee (1991) which inter-alia examined various parameters of efficiency and given a number of suggestions to improve the efficiency of the banks in India. Nag and Shivaswamy (1990) compared the performance of Foreign Banks operating in India with the Indian scheduled commercial banks in terms of growth of deposits and loans and found that the performance of foreign banks stand out significantly higher. Sarkar and Das (1998) used 15 indicators in their study to compare public sector, private sector and foreign banks based on major criteria representing efficiency viz. profitability, productivity and financial management on which bank-wise/ bank group wise information was available. According to CRISIL study (2002) it was concluded that lower operating expenses improved the profitability of banks, contrary to the popular perception that only trading profits helped the banking sector shore up their bottom lines. Karam and Puja (2008) compare the productivity of public, private and foreign banks using ACGR and regression and concluded that public sector banks are growing with consistent pace and intra group variations are also less than other sector. K.V.N. Prasad (2012) compares the performance of public and private sector banks through CAMEL model and concluded that there is no significant difference between performance of public and private sector banks. OBJECTIVES OF THE STUDY The broad objectives of this study are as under:
1. To evaluate the employee productivity of private banks during the period 2002-2012.
2. To compare the relative performance of private banks during the period 2002-2012.
RESEARCH METHODOLOGY
The study is primarily based on the secondary data and the same has been collected from “The Trend and Progress of Banking in India” an annual publication of RBI. Data was collected from 20 Private Banks during the period 2001-02 to 2011-2012 SAMPLING DESIGN The detailed list of banks selected as follow:
1. City Union Bank Ltd. 2. ING Vysya Bank Ltd. 3. Tamilnad Mercantile Bank Ltd. 4. The Catholic Syrian Bank Ltd. 5. The Dhanalakshmi Bank Ltd. 6. The Federal Bank Ltd. 7. The Jammu & Kashmir Bank Ltd. 8. The Karnataka Bank Ltd. 9. The Karur Vysya Bank Ltd. 10. The Lakshmi Vilas Bank Ltd. 11. Nainital Bank Ltd. 12. The Ratnakar Bank Ltd. 13. The South Indian Bank Ltd.
New Private sector Banks 14. Axis Bank Ltd. 15. Development Credit Bank Ltd. 16. HDFC Bank Ltd. 17. ICICI Bank Ltd. 18. Indusind Bank Ltd. 19. Kotak Mahindra Bank Ltd. 20. YES Bank
The selected ratios that are used to compute the productivity of private sector banks: Per Employee Indicators (Labour Productivity):
1. Deposit per employee = Deposit / No. of employees
2. Advance per employee = Advances / No. of employees
3. Business per employee = Business / No. of employees
4. Total expenditure per employee = Total expenditure / No. of employees
5. Total income per employee = Total Income / No. of employees
6. Spread per employee = Spread / No. of employees
7. Net profit per employee = Total net profit / No. of employees
8. Burden per employee = Burden / No. of employees
International Journal of Management and Social Sciences Research (IJMSSR) ISSN: 2319-4421 Volume 2, No. 10, October 2013
i-Xplore International Research Journal Consortium www.irjcjournals.org
68
The statistical tools like standard deviation, coefficient of variation, exponential growth rate (EGR) and trend analysis have been used for analyzing the data. To have a better view of the performance of banks, the ratios have been analyzed and interpreted by calculating Mean (X), Standard Deviation (S.D.) and Co-efficient of variation (C.V.). Mean ( X ) = Σ X/N Where ΣX = Sum of series of observations N = Number of items S.D. (σ) = Σx/N where x = (X- X ), X is the mean of the series and (X- X ) is the deviation from the mean. N = Number of items C.V. = (σ/ X ) x 100 Where σ is Standard Deviation (S.D.) and X is the mean of the series. As the operations of the commercial banks normally grow from year to year and each year enables it to have an enlarged base to compound the growth rate, therefore exponential growth function shall be fitted to analyze the trends in selected parameters. The equation of the exponential curve is of the form, Y = abx
Putting the equation in logarithmic form, we get Log Y = Log a+X Log b To obtain the values of constants ‘a’ and ‘b’, the two ‘normal equations’ to be solved are: ΣLog Y = n Log a + Log b ΣX Σ(X.Log Y) = Log a ΣX+Log bΣX2
Where Y is the variable for which rate of growth is calculated at time‘t’ and ‘a’ is the Y intercept and ‘b’ the slope of the curve. Under the growth function, growth rate is actually equal to Log b, which implies that there is growth over the period, provided Log b>0. Antilog of Log b gives the value of ‘b’ and the growth rate in percentage form shall be equal to: [{(Antilog of Log b) x 100} – 100]
Apart from the exponential growth rate, percentage growth rate over the base year will be calculated to analyze the trends on year-to-year basis. The percentage growth rate over the base year is given as: Vc – Vb = --------------------------------- x 100 Vb Where: Vc = Value of the given parameter in the current year. Vb = Value of the given parameter in the base year. ANALYSIS AND INTERPRETATION The study seeks to access the labour productivity of private sector banks and relative performance of various banks with respect to the eight parameter which talks about the productivity of the banks.
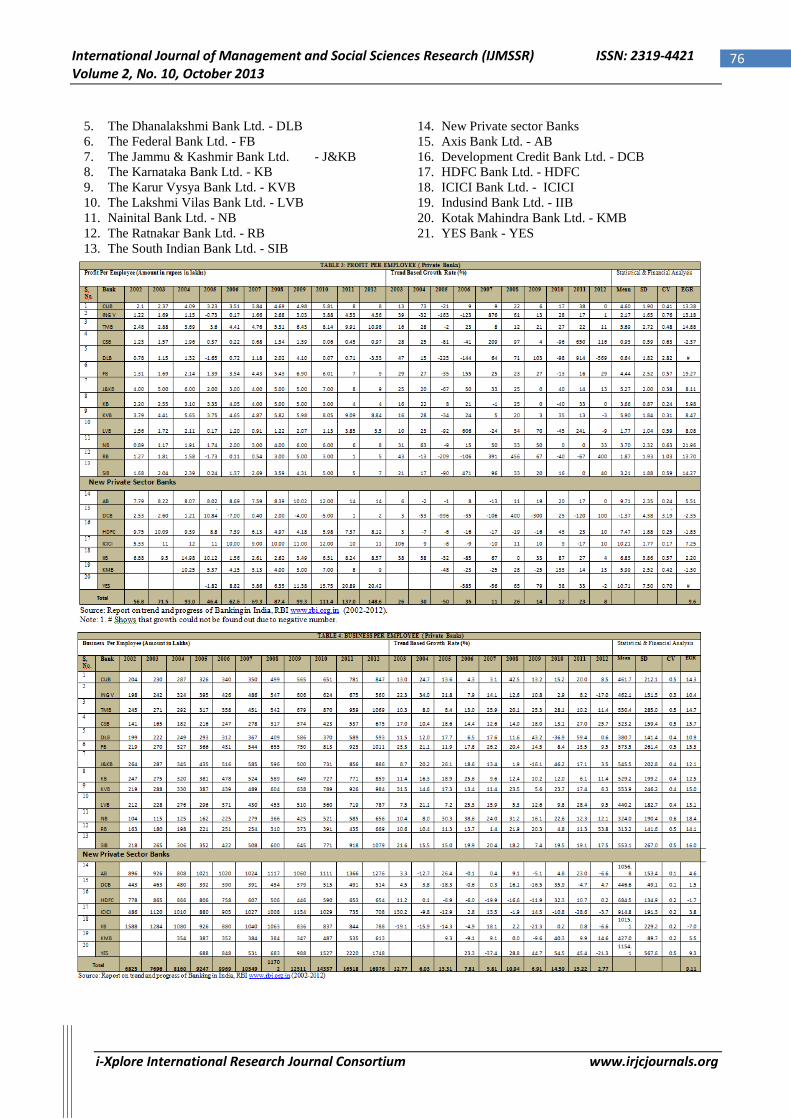
TABLE: 3 PROFIT PER EMPLOYEE
Table 3 deals with profit per employee which is calculated by profit divided by no. of employees. Every business exists in order to earn profit. Without profit no commercial activity can sustain for a long period. Similarly, profit earning has become the main motive of commercial banks operating in India. Profit earning and timely growth in the profit earning is an essential feature for the continued success of a bank. An analysis of data on the basis of percentage growth rate (as shown in Table 3) over the base year shows that the maximum percentage growth rate was recorded in 2003 to 2012 respectively ICICI Bank Ltd. (106 %) in 2003, City Union Bank Ltd. (73%) in 2004, Karnataka Bank Ltd. (8%) in 2005, Lakshmi Vilas Bank (606 %) in 2006 ,ING Vysya Bank (876 %) in 2007 and Ratnakar Bank Ltd. (456 %) in 2008, Dhanalakshmi Bank Ltd. (103 %) in 2009, Kotak Mahindra Bank Ltd. (133 %) in 2010 and again Dhanalakshmi Bank Ltd. (914%) in 2011 and again Ratnakar Bank Ltd. (400 %) in 2012. The maximum exponential growth rate was witnessed by Nainital Bank Ltd. (21.96%) followed by Federal Bank Ltd. (19.27%) then by Tamilnad Mercantile Bank Ltd. (14.88 %), South Indian Bank Ltd. (14.27%), Ratnakar Bank Ltd. (13.74%) while the negative exponential growth rate was witnessed by Catholic Syrian Bank Ltd. (-2.37% ), Development Credit Bank Ltd. (-2.35%), HDFC Bank Ltd. (-1.83%) and Kotak Mahindra Bank Ltd. (-1.3%). Overall private banks shows increasing trend from 56.8 lakhs in 2002 to 148.6 lakhs in 2012 in absolute terms but over the base year it shows decreasing growth rate 26% to 8% and overall private sector banks has 9.6% exponential growth rate for the period 2002-2012.
International Journal of Management and Social Sciences Research (IJMSSR) ISSN: 2319-4421 Volume 2, No. 10, October 2013
i-Xplore International Research Journal Consortium www.irjcjournals.org
69
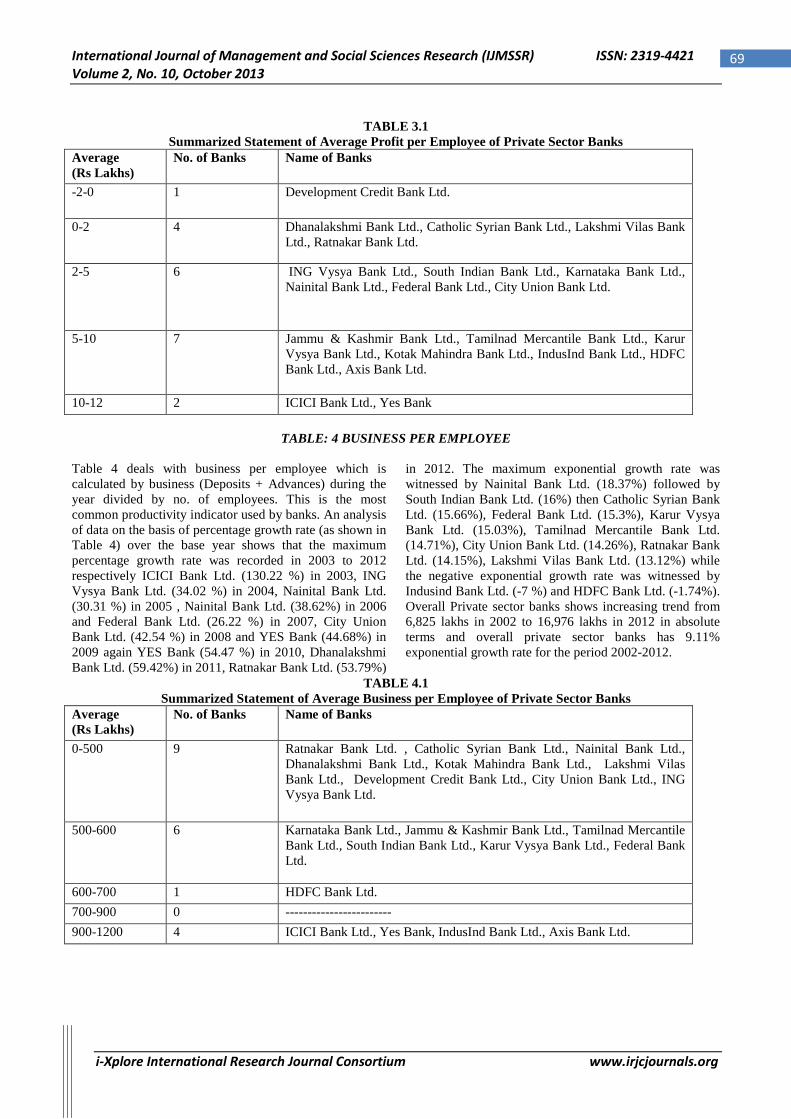
TABLE 3.1 Summarized Statement of Average Profit per Employee of Private Sector Banks
Average (Rs Lakhs)
No. of Banks Name of Banks
-2-0 1 Development Credit Bank Ltd.
0-2 4 Dhanalakshmi Bank Ltd., Catholic Syrian Bank Ltd., Lakshmi Vilas Bank Ltd., Ratnakar Bank Ltd.
2-5 6 ING Vysya Bank Ltd., South Indian Bank Ltd., Karnataka Bank Ltd., Nainital Bank Ltd., Federal Bank Ltd., City Union Bank Ltd.
5-10 7 Jammu & Kashmir Bank Ltd., Tamilnad Mercantile Bank Ltd., Karur Vysya Bank Ltd., Kotak Mahindra Bank Ltd., IndusInd Bank Ltd., HDFC Bank Ltd., Axis Bank Ltd.
10-12 2 ICICI Bank Ltd., Yes Bank
TABLE: 4 BUSINESS PER EMPLOYEE Table 4 deals with business per employee which is calculated by business (Deposits + Advances) during the year divided by no. of employees. This is the most common productivity indicator used by banks. An analysis of data on the basis of percentage growth rate (as shown in Table 4) over the base year shows that the maximum percentage growth rate was recorded in 2003 to 2012 respectively ICICI Bank Ltd. (130.22 %) in 2003, ING Vysya Bank Ltd. (34.02 %) in 2004, Nainital Bank Ltd. (30.31 %) in 2005 , Nainital Bank Ltd. (38.62%) in 2006 and Federal Bank Ltd. (26.22 %) in 2007, City Union Bank Ltd. (42.54 %) in 2008 and YES Bank (44.68%) in 2009 again YES Bank (54.47 %) in 2010, Dhanalakshmi Bank Ltd. (59.42%) in 2011, Ratnakar Bank Ltd. (53.79%)
in 2012. The maximum exponential growth rate was witnessed by Nainital Bank Ltd. (18.37%) followed by South Indian Bank Ltd. (16%) then Catholic Syrian Bank Ltd. (15.66%), Federal Bank Ltd. (15.3%), Karur Vysya Bank Ltd. (15.03%), Tamilnad Mercantile Bank Ltd. (14.71%), City Union Bank Ltd. (14.26%), Ratnakar Bank Ltd. (14.15%), Lakshmi Vilas Bank Ltd. (13.12%) while the negative exponential growth rate was witnessed by Indusind Bank Ltd. (-7 %) and HDFC Bank Ltd. (-1.74%). Overall Private sector banks shows increasing trend from 6,825 lakhs in 2002 to 16,976 lakhs in 2012 in absolute terms and overall private sector banks has 9.11% exponential growth rate for the period 2002-2012.
TABLE 4.1 Summarized Statement of Average Business per Employee of Private Sector Banks
Average (Rs Lakhs)
No. of Banks Name of Banks
0-500 9 Ratnakar Bank Ltd. , Catholic Syrian Bank Ltd., Nainital Bank Ltd., Dhanalakshmi Bank Ltd., Kotak Mahindra Bank Ltd., Lakshmi Vilas Bank Ltd., Development Credit Bank Ltd., City Union Bank Ltd., ING Vysya Bank Ltd.
500-600 6 Karnataka Bank Ltd., Jammu & Kashmir Bank Ltd., Tamilnad Mercantile Bank Ltd., South Indian Bank Ltd., Karur Vysya Bank Ltd., Federal Bank Ltd.
600-700 1 HDFC Bank Ltd. 700-900 0 ------------------------ 900-1200 4 ICICI Bank Ltd., Yes Bank, IndusInd Bank Ltd., Axis Bank Ltd.
International Journal of Management and Social Sciences Research (IJMSSR) ISSN: 2319-4421 Volume 2, No. 10, October 2013
i-Xplore International Research Journal Consortium www.irjcjournals.org
70
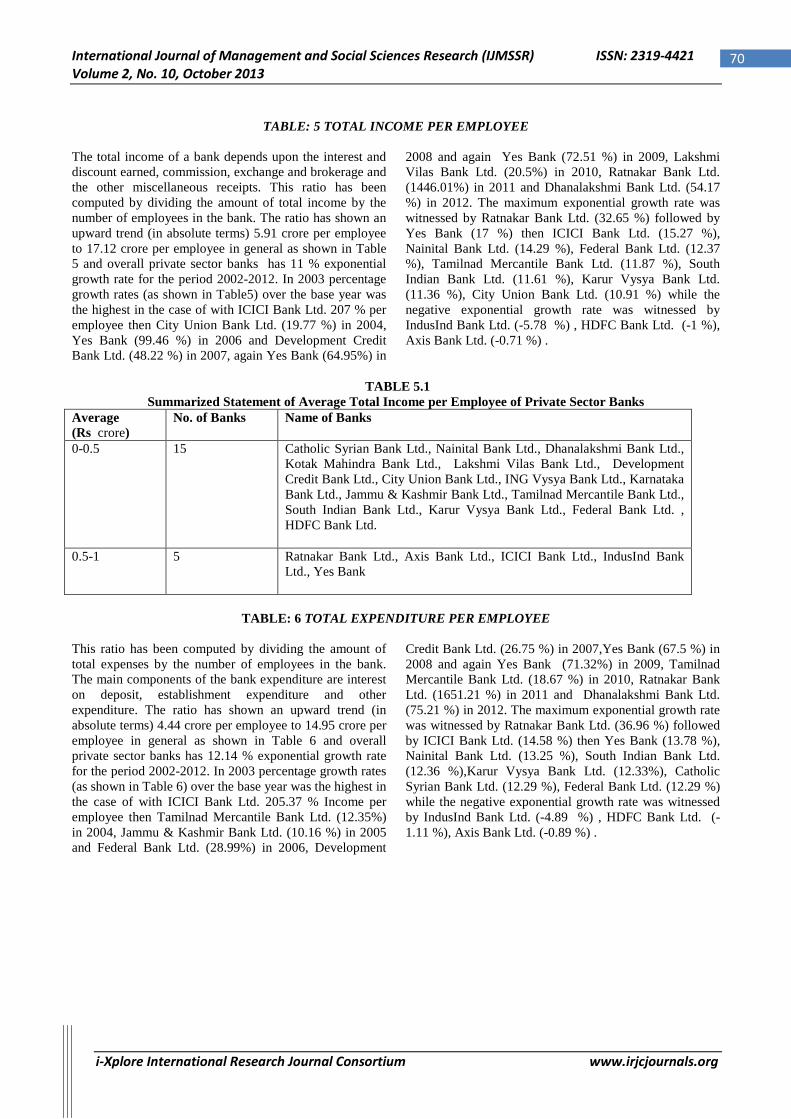
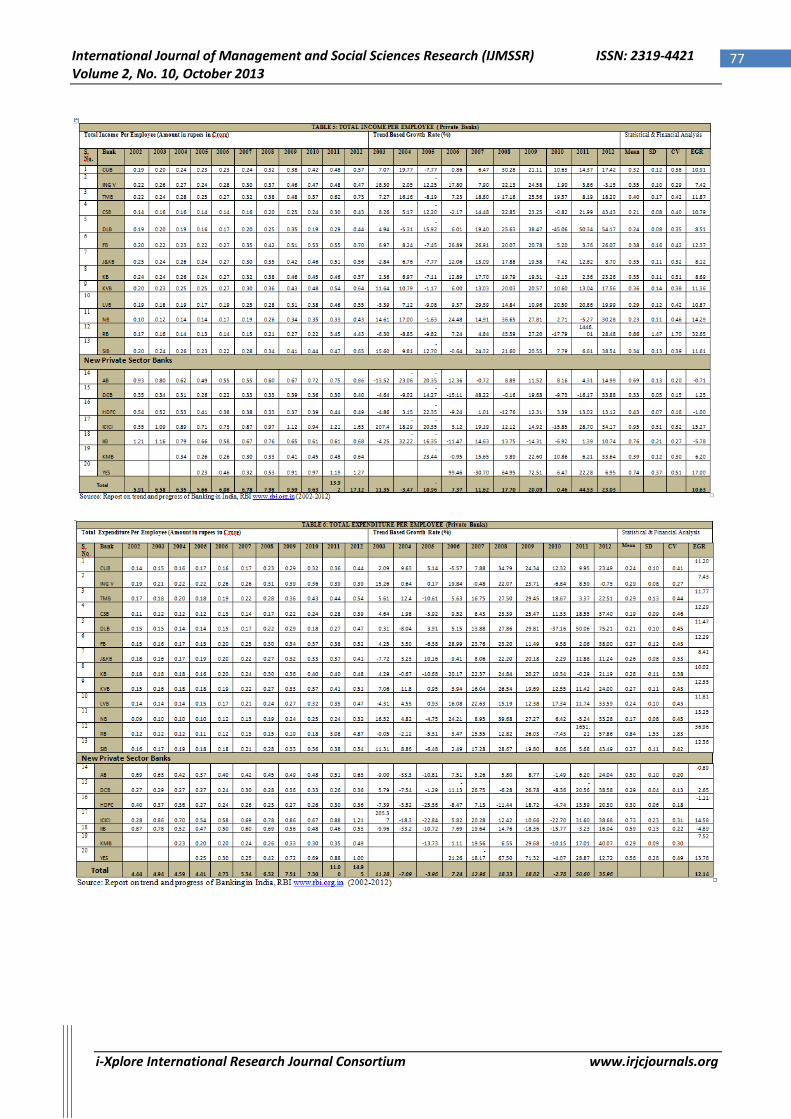
TABLE: 5 TOTAL INCOME PER EMPLOYEE
The total income of a bank depends upon the interest and discount earned, commission, exchange and brokerage and the other miscellaneous receipts. This ratio has been computed by dividing the amount of total income by the number of employees in the bank. The ratio has shown an upward trend (in absolute terms) 5.91 crore per employee to 17.12 crore per employee in general as shown in Table 5 and overall private sector banks has 11 % exponential growth rate for the period 2002-2012. In 2003 percentage growth rates (as shown in Table5) over the base year was the highest in the case of with ICICI Bank Ltd. 207 % per employee then City Union Bank Ltd. (19.77 %) in 2004, Yes Bank (99.46 %) in 2006 and Development Credit Bank Ltd. (48.22 %) in 2007, again Yes Bank (64.95%) in
2008 and again Yes Bank (72.51 %) in 2009, Lakshmi Vilas Bank Ltd. (20.5%) in 2010, Ratnakar Bank Ltd. (1446.01%) in 2011 and Dhanalakshmi Bank Ltd. (54.17 %) in 2012. The maximum exponential growth rate was witnessed by Ratnakar Bank Ltd. (32.65 %) followed by Yes Bank (17 %) then ICICI Bank Ltd. (15.27 %), Nainital Bank Ltd. (14.29 %), Federal Bank Ltd. (12.37 %), Tamilnad Mercantile Bank Ltd. (11.87 %), South Indian Bank Ltd. (11.61 %), Karur Vysya Bank Ltd. (11.36 %), City Union Bank Ltd. (10.91 %) while the negative exponential growth rate was witnessed by IndusInd Bank Ltd. (-5.78 %) , HDFC Bank Ltd. (-1 %), Axis Bank Ltd. (-0.71 %) .
TABLE 5.1
Summarized Statement of Average Total Income per Employee of Private Sector Banks Average (Rs crore)
No. of Banks Name of Banks
0-0.5 15 Catholic Syrian Bank Ltd., Nainital Bank Ltd., Dhanalakshmi Bank Ltd., Kotak Mahindra Bank Ltd., Lakshmi Vilas Bank Ltd., Development Credit Bank Ltd., City Union Bank Ltd., ING Vysya Bank Ltd., Karnataka Bank Ltd., Jammu & Kashmir Bank Ltd., Tamilnad Mercantile Bank Ltd., South Indian Bank Ltd., Karur Vysya Bank Ltd., Federal Bank Ltd. , HDFC Bank Ltd.
0.5-1 5 Ratnakar Bank Ltd., Axis Bank Ltd., ICICI Bank Ltd., IndusInd Bank Ltd., Yes Bank
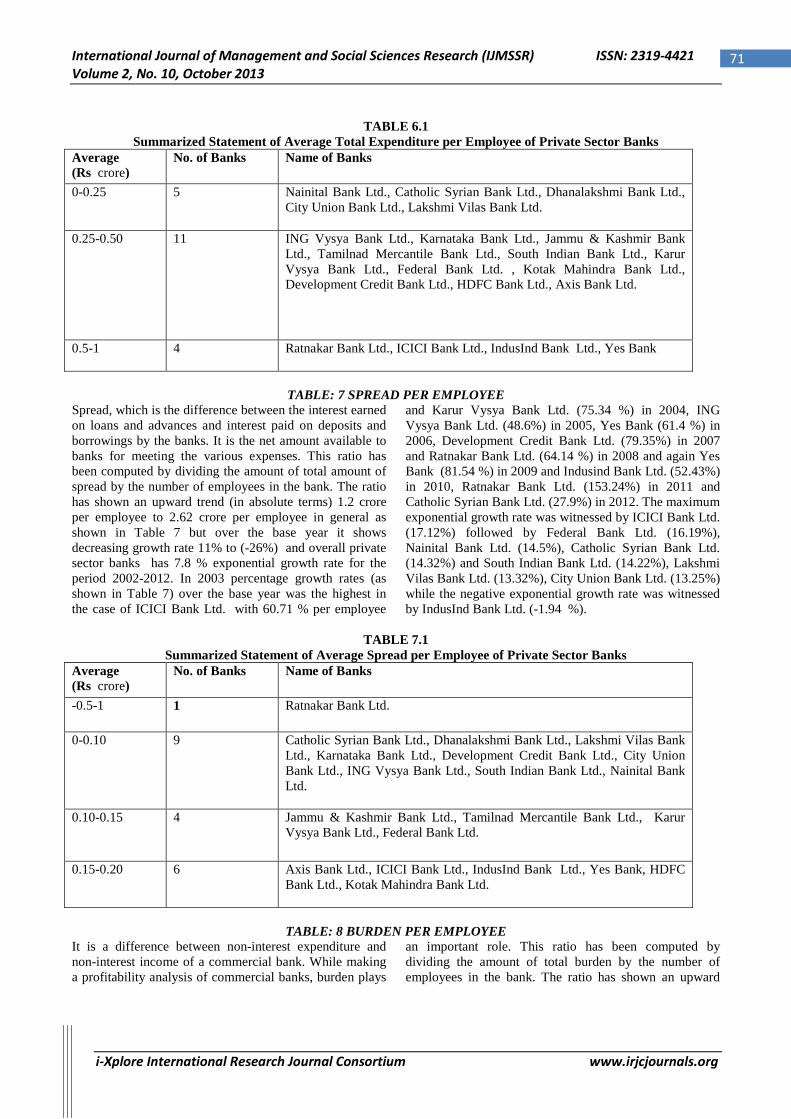
TABLE: 6 TOTAL EXPENDITURE PER EMPLOYEE
This ratio has been computed by dividing the amount of total expenses by the number of employees in the bank. The main components of the bank expenditure are interest on deposit, establishment expenditure and other expenditure. The ratio has shown an upward trend (in absolute terms) 4.44 crore per employee to 14.95 crore per employee in general as shown in Table 6 and overall private sector banks has 12.14 % exponential growth rate for the period 2002-2012. In 2003 percentage growth rates (as shown in Table 6) over the base year was the highest in the case of with ICICI Bank Ltd. 205.37 % Income per employee then Tamilnad Mercantile Bank Ltd. (12.35%) in 2004, Jammu & Kashmir Bank Ltd. (10.16 %) in 2005 and Federal Bank Ltd. (28.99%) in 2006, Development
Credit Bank Ltd. (26.75 %) in 2007,Yes Bank (67.5 %) in 2008 and again Yes Bank (71.32%) in 2009, Tamilnad Mercantile Bank Ltd. (18.67 %) in 2010, Ratnakar Bank Ltd. (1651.21 %) in 2011 and Dhanalakshmi Bank Ltd. (75.21 %) in 2012. The maximum exponential growth rate was witnessed by Ratnakar Bank Ltd. (36.96 %) followed by ICICI Bank Ltd. (14.58 %) then Yes Bank (13.78 %), Nainital Bank Ltd. (13.25 %), South Indian Bank Ltd. (12.36 %),Karur Vysya Bank Ltd. (12.33%), Catholic Syrian Bank Ltd. (12.29 %), Federal Bank Ltd. (12.29 %) while the negative exponential growth rate was witnessed by IndusInd Bank Ltd. (-4.89 %) , HDFC Bank Ltd. (-1.11 %), Axis Bank Ltd. (-0.89 %) .
International Journal of Management and Social Sciences Research (IJMSSR) ISSN: 2319-4421 Volume 2, No. 10, October 2013
i-Xplore International Research Journal Consortium www.irjcjournals.org
71
TABLE 6.1 Summarized Statement of Average Total Expenditure per Employee of Private Sector Banks
Average (Rs crore)
No. of Banks Name of Banks
0-0.25 5 Nainital Bank Ltd., Catholic Syrian Bank Ltd., Dhanalakshmi Bank Ltd., City Union Bank Ltd., Lakshmi Vilas Bank Ltd.
0.25-0.50 11 ING Vysya Bank Ltd., Karnataka Bank Ltd., Jammu & Kashmir Bank Ltd., Tamilnad Mercantile Bank Ltd., South Indian Bank Ltd., Karur Vysya Bank Ltd., Federal Bank Ltd. , Kotak Mahindra Bank Ltd., Development Credit Bank Ltd., HDFC Bank Ltd., Axis Bank Ltd.
0.5-1 4 Ratnakar Bank Ltd., ICICI Bank Ltd., IndusInd Bank Ltd., Yes Bank
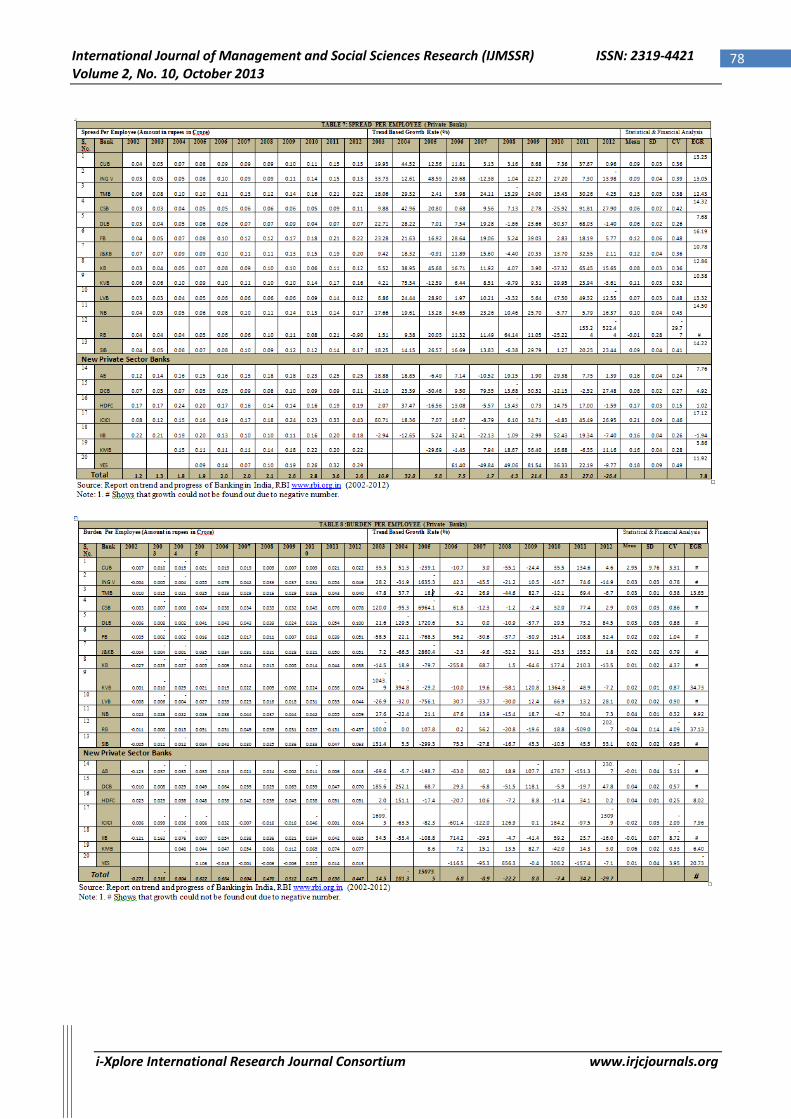
TABLE: 7 SPREAD PER EMPLOYEE
Spread, which is the difference between the interest earned on loans and advances and interest paid on deposits and borrowings by the banks. It is the net amount available to banks for meeting the various expenses. This ratio has been computed by dividing the amount of total amount of spread by the number of employees in the bank. The ratio has shown an upward trend (in absolute terms) 1.2 crore per employee to 2.62 crore per employee in general as shown in Table 7 but over the base year it shows decreasing growth rate 11% to (-26%) and overall private sector banks has 7.8 % exponential growth rate for the period 2002-2012. In 2003 percentage growth rates (as shown in Table 7) over the base year was the highest in the case of ICICI Bank Ltd. with 60.71 % per employee
and Karur Vysya Bank Ltd. (75.34 %) in 2004, ING Vysya Bank Ltd. (48.6%) in 2005, Yes Bank (61.4 %) in 2006, Development Credit Bank Ltd. (79.35%) in 2007 and Ratnakar Bank Ltd. (64.14 %) in 2008 and again Yes Bank (81.54 %) in 2009 and Indusind Bank Ltd. (52.43%) in 2010, Ratnakar Bank Ltd. (153.24%) in 2011 and Catholic Syrian Bank Ltd. (27.9%) in 2012. The maximum exponential growth rate was witnessed by ICICI Bank Ltd. (17.12%) followed by Federal Bank Ltd. (16.19%), Nainital Bank Ltd. (14.5%), Catholic Syrian Bank Ltd. (14.32%) and South Indian Bank Ltd. (14.22%), Lakshmi Vilas Bank Ltd. (13.32%), City Union Bank Ltd. (13.25%) while the negative exponential growth rate was witnessed by IndusInd Bank Ltd. (-1.94 %).
TABLE 7.1
Summarized Statement of Average Spread per Employee of Private Sector Banks Average (Rs crore)
No. of Banks Name of Banks
-0.5-1 1 Ratnakar Bank Ltd.
0-0.10 9 Catholic Syrian Bank Ltd., Dhanalakshmi Bank Ltd., Lakshmi Vilas Bank Ltd., Karnataka Bank Ltd., Development Credit Bank Ltd., City Union Bank Ltd., ING Vysya Bank Ltd., South Indian Bank Ltd., Nainital Bank Ltd.
0.10-0.15 4 Jammu & Kashmir Bank Ltd., Tamilnad Mercantile Bank Ltd., Karur Vysya Bank Ltd., Federal Bank Ltd.
0.15-0.20 6 Axis Bank Ltd., ICICI Bank Ltd., IndusInd Bank Ltd., Yes Bank, HDFC Bank Ltd., Kotak Mahindra Bank Ltd.
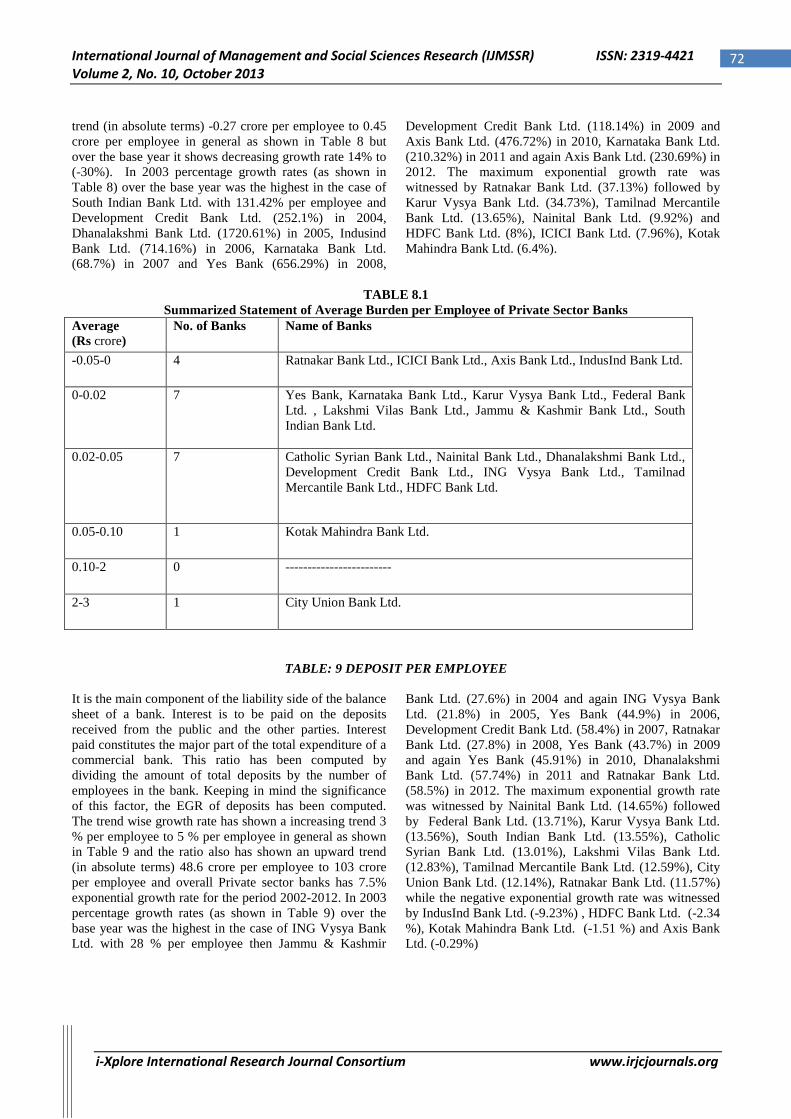
TABLE: 8 BURDEN PER EMPLOYEE
It is a difference between non-interest expenditure and non-interest income of a commercial bank. While making a profitability analysis of commercial banks, burden plays
an important role. This ratio has been computed by dividing the amount of total burden by the number of employees in the bank. The ratio has shown an upward
International Journal of Management and Social Sciences Research (IJMSSR) ISSN: 2319-4421 Volume 2, No. 10, October 2013
i-Xplore International Research Journal Consortium www.irjcjournals.org
72
trend (in absolute terms) -0.27 crore per employee to 0.45 crore per employee in general as shown in Table 8 but over the base year it shows decreasing growth rate 14% to (-30%). In 2003 percentage growth rates (as shown in Table 8) over the base year was the highest in the case of South Indian Bank Ltd. with 131.42% per employee and Development Credit Bank Ltd. (252.1%) in 2004, Dhanalakshmi Bank Ltd. (1720.61%) in 2005, Indusind Bank Ltd. (714.16%) in 2006, Karnataka Bank Ltd. (68.7%) in 2007 and Yes Bank (656.29%) in 2008,
Development Credit Bank Ltd. (118.14%) in 2009 and Axis Bank Ltd. (476.72%) in 2010, Karnataka Bank Ltd. (210.32%) in 2011 and again Axis Bank Ltd. (230.69%) in 2012. The maximum exponential growth rate was witnessed by Ratnakar Bank Ltd. (37.13%) followed by Karur Vysya Bank Ltd. (34.73%), Tamilnad Mercantile Bank Ltd. (13.65%), Nainital Bank Ltd. (9.92%) and HDFC Bank Ltd. (8%), ICICI Bank Ltd. (7.96%), Kotak Mahindra Bank Ltd. (6.4%).
TABLE 8.1
Summarized Statement of Average Burden per Employee of Private Sector Banks Average (Rs crore)
No. of Banks Name of Banks
-0.05-0 4 Ratnakar Bank Ltd., ICICI Bank Ltd., Axis Bank Ltd., IndusInd Bank Ltd.
0-0.02 7 Yes Bank, Karnataka Bank Ltd., Karur Vysya Bank Ltd., Federal Bank Ltd. , Lakshmi Vilas Bank Ltd., Jammu & Kashmir Bank Ltd., South Indian Bank Ltd.
0.02-0.05 7 Catholic Syrian Bank Ltd., Nainital Bank Ltd., Dhanalakshmi Bank Ltd., Development Credit Bank Ltd., ING Vysya Bank Ltd., Tamilnad Mercantile Bank Ltd., HDFC Bank Ltd.
0.05-0.10 1 Kotak Mahindra Bank Ltd.
0.10-2 0 ------------------------
2-3 1 City Union Bank Ltd.
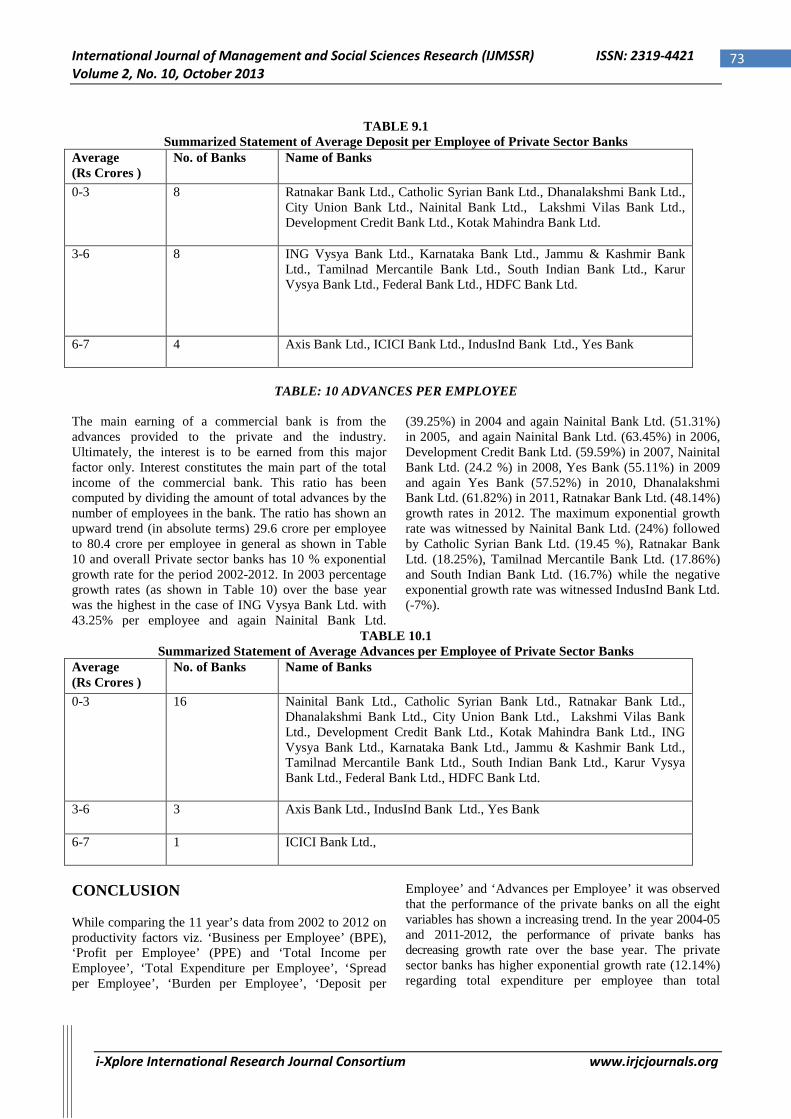
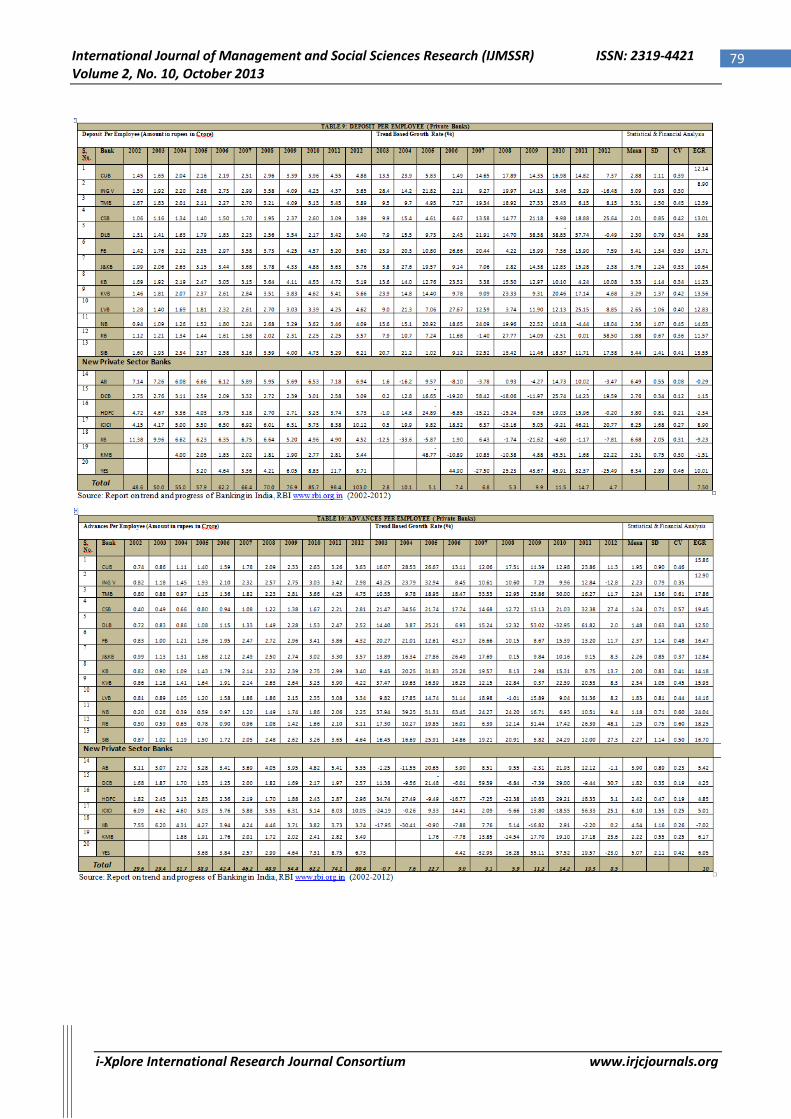
TABLE: 9 DEPOSIT PER EMPLOYEE It is the main component of the liability side of the balance sheet of a bank. Interest is to be paid on the deposits received from the public and the other parties. Interest paid constitutes the major part of the total expenditure of a commercial bank. This ratio has been computed by dividing the amount of total deposits by the number of employees in the bank. Keeping in mind the significance of this factor, the EGR of deposits has been computed. The trend wise growth rate has shown a increasing trend 3 % per employee to 5 % per employee in general as shown in Table 9 and the ratio also has shown an upward trend (in absolute terms) 48.6 crore per employee to 103 crore per employee and overall Private sector banks has 7.5% exponential growth rate for the period 2002-2012. In 2003 percentage growth rates (as shown in Table 9) over the base year was the highest in the case of ING Vysya Bank Ltd. with 28 % per employee then Jammu & Kashmir
Bank Ltd. (27.6%) in 2004 and again ING Vysya Bank Ltd. (21.8%) in 2005, Yes Bank (44.9%) in 2006, Development Credit Bank Ltd. (58.4%) in 2007, Ratnakar Bank Ltd. (27.8%) in 2008, Yes Bank (43.7%) in 2009 and again Yes Bank (45.91%) in 2010, Dhanalakshmi Bank Ltd. (57.74%) in 2011 and Ratnakar Bank Ltd. (58.5%) in 2012. The maximum exponential growth rate was witnessed by Nainital Bank Ltd. (14.65%) followed by Federal Bank Ltd. (13.71%), Karur Vysya Bank Ltd. (13.56%), South Indian Bank Ltd. (13.55%), Catholic Syrian Bank Ltd. (13.01%), Lakshmi Vilas Bank Ltd. (12.83%), Tamilnad Mercantile Bank Ltd. (12.59%), City Union Bank Ltd. (12.14%), Ratnakar Bank Ltd. (11.57%) while the negative exponential growth rate was witnessed by IndusInd Bank Ltd. (-9.23%) , HDFC Bank Ltd. (-2.34 %), Kotak Mahindra Bank Ltd. (-1.51 %) and Axis Bank Ltd. (-0.29%)
International Journal of Management and Social Sciences Research (IJMSSR) ISSN: 2319-4421 Volume 2, No. 10, October 2013
i-Xplore International Research Journal Consortium www.irjcjournals.org
73
TABLE 9.1 Summarized Statement of Average Deposit per Employee of Private Sector Banks
Average (Rs Crores )
No. of Banks Name of Banks
0-3 8 Ratnakar Bank Ltd., Catholic Syrian Bank Ltd., Dhanalakshmi Bank Ltd., City Union Bank Ltd., Nainital Bank Ltd., Lakshmi Vilas Bank Ltd., Development Credit Bank Ltd., Kotak Mahindra Bank Ltd.
3-6 8 ING Vysya Bank Ltd., Karnataka Bank Ltd., Jammu & Kashmir Bank Ltd., Tamilnad Mercantile Bank Ltd., South Indian Bank Ltd., Karur Vysya Bank Ltd., Federal Bank Ltd., HDFC Bank Ltd.
6-7 4 Axis Bank Ltd., ICICI Bank Ltd., IndusInd Bank Ltd., Yes Bank
TABLE: 10 ADVANCES PER EMPLOYEE
The main earning of a commercial bank is from the advances provided to the private and the industry. Ultimately, the interest is to be earned from this major factor only. Interest constitutes the main part of the total income of the commercial bank. This ratio has been computed by dividing the amount of total advances by the number of employees in the bank. The ratio has shown an upward trend (in absolute terms) 29.6 crore per employee to 80.4 crore per employee in general as shown in Table 10 and overall Private sector banks has 10 % exponential growth rate for the period 2002-2012. In 2003 percentage growth rates (as shown in Table 10) over the base year was the highest in the case of ING Vysya Bank Ltd. with 43.25% per employee and again Nainital Bank Ltd.
(39.25%) in 2004 and again Nainital Bank Ltd. (51.31%) in 2005, and again Nainital Bank Ltd. (63.45%) in 2006, Development Credit Bank Ltd. (59.59%) in 2007, Nainital Bank Ltd. (24.2 %) in 2008, Yes Bank (55.11%) in 2009 and again Yes Bank (57.52%) in 2010, Dhanalakshmi Bank Ltd. (61.82%) in 2011, Ratnakar Bank Ltd. (48.14%) growth rates in 2012. The maximum exponential growth rate was witnessed by Nainital Bank Ltd. (24%) followed by Catholic Syrian Bank Ltd. (19.45 %), Ratnakar Bank Ltd. (18.25%), Tamilnad Mercantile Bank Ltd. (17.86%) and South Indian Bank Ltd. (16.7%) while the negative exponential growth rate was witnessed IndusInd Bank Ltd. (-7%).
TABLE 10.1 Summarized Statement of Average Advances per Employee of Private Sector Banks
Average (Rs Crores )
No. of Banks Name of Banks
0-3 16 Nainital Bank Ltd., Catholic Syrian Bank Ltd., Ratnakar Bank Ltd., Dhanalakshmi Bank Ltd., City Union Bank Ltd., Lakshmi Vilas Bank Ltd., Development Credit Bank Ltd., Kotak Mahindra Bank Ltd., ING Vysya Bank Ltd., Karnataka Bank Ltd., Jammu & Kashmir Bank Ltd., Tamilnad Mercantile Bank Ltd., South Indian Bank Ltd., Karur Vysya Bank Ltd., Federal Bank Ltd., HDFC Bank Ltd.
3-6 3 Axis Bank Ltd., IndusInd Bank Ltd., Yes Bank
6-7 1 ICICI Bank Ltd.,
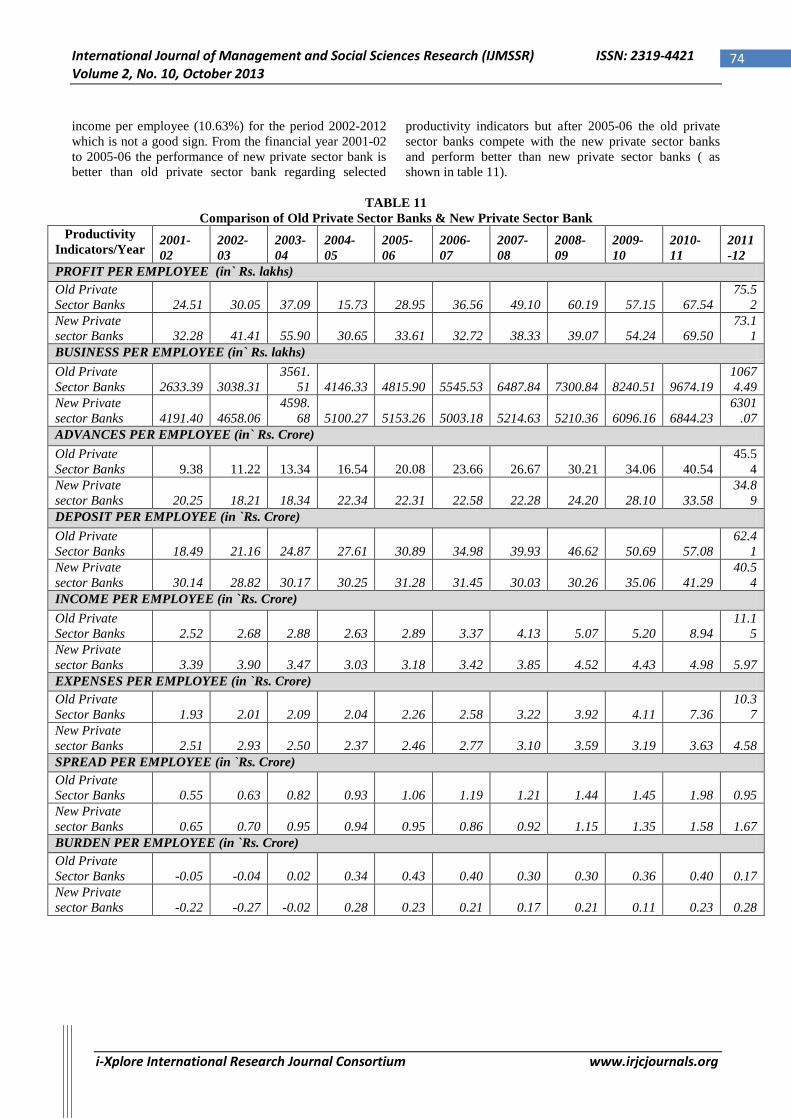
CONCLUSION While comparing the 11 year’s data from 2002 to 2012 on productivity factors viz. ‘Business per Employee’ (BPE), ‘Profit per Employee’ (PPE) and ‘Total Income per Employee’, ‘Total Expenditure per Employee’, ‘Spread per Employee’, ‘Burden per Employee’, ‘Deposit per
Employee’ and ‘Advances per Employee’ it was observed that the performance of the private banks on all the eight variables has shown a increasing trend. In the year 2004-05 and 2011-2012, the performance of private banks has decreasing growth rate over the base year. The private sector banks has higher exponential growth rate (12.14%) regarding total expenditure per employee than total
International Journal of Management and Social Sciences Research (IJMSSR) ISSN: 2319-4421 Volume 2, No. 10, October 2013
i-Xplore International Research Journal Consortium www.irjcjournals.org
74
income per employee (10.63%) for the period 2002-2012 which is not a good sign. From the financial year 2001-02 to 2005-06 the performance of new private sector bank is better than old private sector bank regarding selected
productivity indicators but after 2005-06 the old private sector banks compete with the new private sector banks and perform better than new private sector banks ( as shown in table 11).
TABLE 11
Comparison of Old Private Sector Banks & New Private Sector Bank Productivity
Indicators/Year 2001-02
2002-03
2003-04
2004-05
2005-06
2006-07
2007-08
2008-09
2009-10
2010-11
2011-12
PROFIT PER EMPLOYEE (in` Rs. lakhs) Old Private Sector Banks 24.51 30.05 37.09 15.73 28.95 36.56 49.10 60.19 57.15 67.54
75.52
New Private sector Banks 32.28 41.41 55.90 30.65 33.61 32.72 38.33 39.07 54.24 69.50
73.11
BUSINESS PER EMPLOYEE (in` Rs. lakhs) Old Private Sector Banks 2633.39 3038.31
3561.51 4146.33 4815.90 5545.53 6487.84 7300.84 8240.51 9674.19
10674.49
New Private sector Banks 4191.40 4658.06
4598.68 5100.27 5153.26 5003.18 5214.63 5210.36 6096.16 6844.23
6301.07
ADVANCES PER EMPLOYEE (in` Rs. Crore) Old Private Sector Banks 9.38 11.22 13.34 16.54 20.08 23.66 26.67 30.21 34.06 40.54
45.54
New Private sector Banks 20.25 18.21 18.34 22.34 22.31 22.58 22.28 24.20 28.10 33.58
34.89
DEPOSIT PER EMPLOYEE (in `Rs. Crore) Old Private Sector Banks 18.49 21.16 24.87 27.61 30.89 34.98 39.93 46.62 50.69 57.08
62.41
New Private sector Banks 30.14 28.82 30.17 30.25 31.28 31.45 30.03 30.26 35.06 41.29
40.54
INCOME PER EMPLOYEE (in `Rs. Crore) Old Private Sector Banks 2.52 2.68 2.88 2.63 2.89 3.37 4.13 5.07 5.20 8.94
11.15
New Private sector Banks 3.39 3.90 3.47 3.03 3.18 3.42 3.85 4.52 4.43 4.98 5.97 EXPENSES PER EMPLOYEE (in `Rs. Crore) Old Private Sector Banks 1.93 2.01 2.09 2.04 2.26 2.58 3.22 3.92 4.11 7.36
10.37
New Private sector Banks 2.51 2.93 2.50 2.37 2.46 2.77 3.10 3.59 3.19 3.63 4.58 SPREAD PER EMPLOYEE (in `Rs. Crore) Old Private Sector Banks 0.55 0.63 0.82 0.93 1.06 1.19 1.21 1.44 1.45 1.98 0.95 New Private sector Banks 0.65 0.70 0.95 0.94 0.95 0.86 0.92 1.15 1.35 1.58 1.67 BURDEN PER EMPLOYEE (in `Rs. Crore) Old Private Sector Banks -0.05 -0.04 0.02 0.34 0.43 0.40 0.30 0.30 0.36 0.40 0.17 New Private sector Banks -0.22 -0.27 -0.02 0.28 0.23 0.21 0.17 0.21 0.11 0.23 0.28
International Journal of Management and Social Sciences Research (IJMSSR) ISSN: 2319-4421 Volume 2, No. 10, October 2013
i-Xplore International Research Journal Consortium www.irjcjournals.org
75
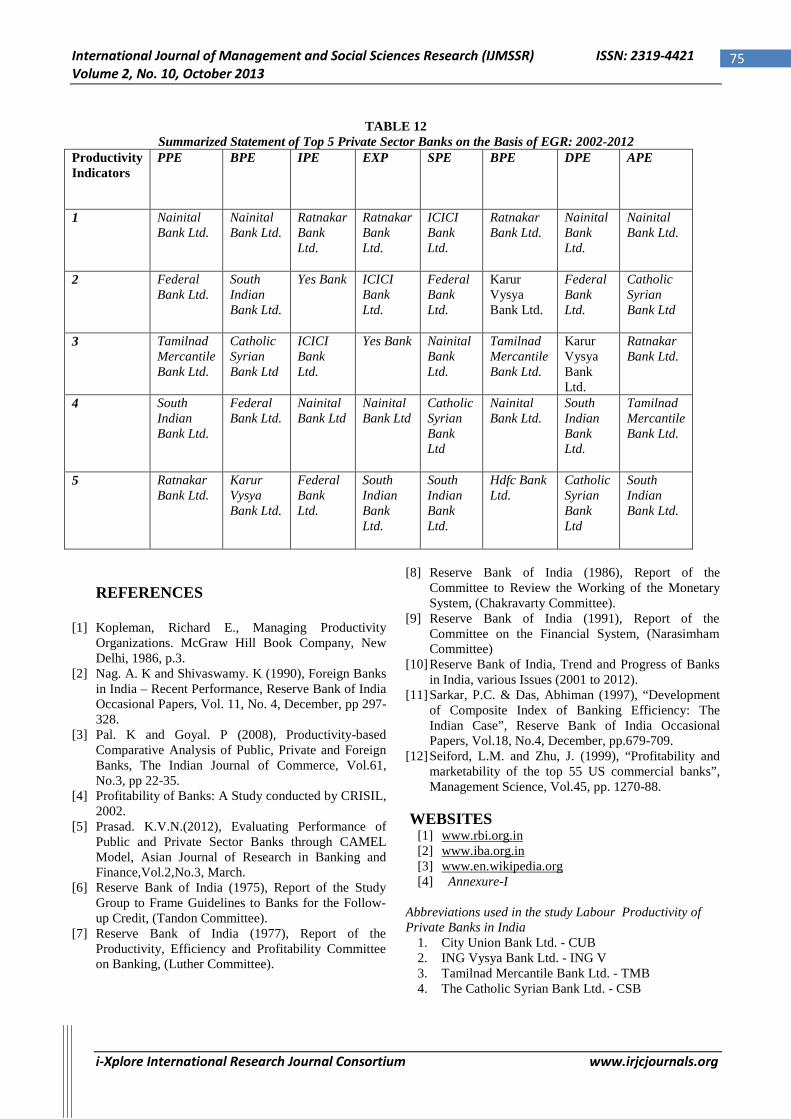
TABLE 12 Summarized Statement of Top 5 Private Sector Banks on the Basis of EGR: 2002-2012
Productivity Indicators
PPE BPE IPE EXP SPE BPE DPE APE
1 Nainital Bank Ltd.
Nainital Bank Ltd.
Ratnakar Bank Ltd.
Ratnakar Bank Ltd.
ICICI Bank Ltd.
Ratnakar Bank Ltd.
Nainital Bank Ltd.
Nainital Bank Ltd.
2 Federal Bank Ltd.
South Indian Bank Ltd.
Yes Bank
ICICI Bank Ltd.
Federal Bank Ltd.
Karur Vysya Bank Ltd.
Federal Bank Ltd.
Catholic Syrian Bank Ltd
3 Tamilnad Mercantile Bank Ltd.
Catholic Syrian Bank Ltd
ICICI Bank Ltd.
Yes Bank
Nainital Bank Ltd.
Tamilnad Mercantile Bank Ltd.
Karur Vysya Bank Ltd.
Ratnakar Bank Ltd.
4 South Indian Bank Ltd.
Federal Bank Ltd.
Nainital Bank Ltd
Nainital Bank Ltd
Catholic Syrian Bank Ltd
Nainital Bank Ltd.
South Indian Bank Ltd.
Tamilnad Mercantile Bank Ltd.
5 Ratnakar Bank Ltd.
Karur Vysya Bank Ltd.
Federal Bank Ltd.
South Indian Bank Ltd.
South Indian Bank Ltd.
Hdfc Bank Ltd.
Catholic Syrian Bank Ltd
South Indian Bank Ltd.
REFERENCES
[1] Kopleman, Richard E., Managing Productivity Organizations. McGraw Hill Book Company, New Delhi, 1986, p.3.
[2] Nag. A. K and Shivaswamy. K (1990), Foreign Banks in India – Recent Performance, Reserve Bank of India Occasional Papers, Vol. 11, No. 4, December, pp 297-328.
[3] Pal. K and Goyal. P (2008), Productivity-based Comparative Analysis of Public, Private and Foreign Banks, The Indian Journal of Commerce, Vol.61, No.3, pp 22-35.
[4] Profitability of Banks: A Study conducted by CRISIL, 2002.
[5] Prasad. K.V.N.(2012), Evaluating Performance of Public and Private Sector Banks through CAMEL Model, Asian Journal of Research in Banking and Finance,Vol.2,No.3, March.
[6] Reserve Bank of India (1975), Report of the Study Group to Frame Guidelines to Banks for the Follow-up Credit, (Tandon Committee).
[7] Reserve Bank of India (1977), Report of the Productivity, Efficiency and Profitability Committee on Banking, (Luther Committee).
[8] Reserve Bank of India (1986), Report of the Committee to Review the Working of the Monetary System, (Chakravarty Committee).
[9] Reserve Bank of India (1991), Report of the Committee on the Financial System, (Narasimham Committee)
[10] Reserve Bank of India, Trend and Progress of Banks in India, various Issues (2001 to 2012).
[11] Sarkar, P.C. & Das, Abhiman (1997), “Development of Composite Index of Banking Efficiency: The Indian Case”, Reserve Bank of India Occasional Papers, Vol.18, No.4, December, pp.679-709.
[12] Seiford, L.M. and Zhu, J. (1999), “Profitability and marketability of the top 55 US commercial banks”, Management Science, Vol.45, pp. 1270-88.
WEBSITES
[1] www.rbi.org.in [2] www.iba.org.in [3] www.en.wikipedia.org [4] Annexure-I
Abbreviations used in the study Labour Productivity of Private Banks in India
1. City Union Bank Ltd. - CUB 2. ING Vysya Bank Ltd. - ING V 3. Tamilnad Mercantile Bank Ltd. - TMB 4. The Catholic Syrian Bank Ltd. - CSB
International Journal of Management and Social Sciences Research (IJMSSR) ISSN: 2319-4421 Volume 2, No. 10, October 2013
i-Xplore International Research Journal Consortium www.irjcjournals.org
76
5. The Dhanalakshmi Bank Ltd. - DLB 6. The Federal Bank Ltd. - FB 7. The Jammu & Kashmir Bank Ltd. - J&KB 8. The Karnataka Bank Ltd. - KB 9. The Karur Vysya Bank Ltd. - KVB 10. The Lakshmi Vilas Bank Ltd. - LVB 11. Nainital Bank Ltd. - NB 12. The Ratnakar Bank Ltd. - RB 13. The South Indian Bank Ltd. - SIB
14. New Private sector Banks 15. Axis Bank Ltd. - AB 16. Development Credit Bank Ltd. - DCB 17. HDFC Bank Ltd. - HDFC 18. ICICI Bank Ltd. - ICICI 19. Indusind Bank Ltd. - IIB 20. Kotak Mahindra Bank Ltd. - KMB 21. YES Bank - YES
International Journal of Management and Social Sciences Research (IJMSSR) ISSN: 2319-4421 Volume 2, No. 10, October 2013
i-Xplore International Research Journal Consortium www.irjcjournals.org
77
International Journal of Management and Social Sciences Research (IJMSSR) ISSN: 2319-4421 Volume 2, No. 10, October 2013
i-Xplore International Research Journal Consortium www.irjcjournals.org
78
International Journal of Management and Social Sciences Research (IJMSSR) ISSN: 2319-4421 Volume 2, No. 10, October 2013
i-Xplore International Research Journal Consortium www.irjcjournals.org
79