Embed Size (px)
Citation preview

Employee Perceptions and Financial Performance
A THESIS SUBMITTED TO THE FACULTY OF THE GRADUATE SCHOOL
OF THE UNIVERSITY OF MINNESOTA BY
Michael R. De Georgeo
IN PARTIAL FULFILLMENT OF THE REQUIREMENTS FOR THE DEGREE OF
DOCTOR OF PHILOSOPHY
Gary N. McLean, Advisor
July, 2011

© 2011 Michael R. De Georgeo

i
ACKNOWLEDGEMENTS
I would like to acknowledge and thank my dissertation committee. I will be
forever grateful to my advisor, Dr. Gary N. McLean, for his inspiration, guidance, and
support through both my Master’s and Doctoral degrees and a multi-year period of
professional life blended between these two academic milestones. Drs. Ross Azevedo,
James Brown, and Lou Quast provided helpful feedback, encouragement, and support to
me throughout the dissertation process. In addition, Drs. Richard Swanson and George
Shapiro also played significant roles in my professional life and academic work, and I
would be remiss if I did not mention their contributions. Also, Amanuel Medhanie, from
the Office of Research Consultation and Services at the University of Minnesota,
provided essential advisement and support during the dissertation process. Finally,
sincere appreciation and thanks are also extended to my family, friends, and colleagues
who supported me in this work.

ii
ABSTRACT
A number of studies have found evidence supporting a link between the
organizational environment and financial performance. However, several studies have
found a mixed support or no support for this link. This study builds on these findings to
address the question: Is there a relationship between organizational environment factors
and financial performance?
Organizational environment data for this study came from employees of a sales
and service division of a global manufacturer located in the Midwest of the U.S. A
sample of 1,518 respondents, from a total population of 1,615 employees organized in
100 teams, completed a 68-item survey instrument for a response rate of 94%. An
exploratory factor analysis generated a model with 11 subscales using 52 items from the
original instrument. The subscales are (1) operational effectiveness, (2) immediate
manager/supervisor, (3) senior management, (4) mission, (5) valuing employees, (6)
training, (7) involvement, (8) corporate social responsibility, (9) satisfaction, (10)
teamwork, and (11) inclusion. Cronbach’s alpha coefficients for all subscales on the
survey were acceptable, ranging from .85 to .90. Team-level factor scores, the predictor
variables, were generated by computing factor scores for individual respondents,
followed by computing a mean of each of the factor scores from members of each team.
This approach produced 11 factor scores for each team. Contribution margin ratio, a
measure of profitability, was the outcome variable. This variable was calculated at the
team level and is the quotient created when dividing operating income by revenue. This

iii
study used contribution margin ratios from five financial periods: four consecutive fiscal
quarters and the fiscal year overall.
This study found that team-level employee perceptions of organizational
environment factors had no to weak relationships between various organizational
environment factors and various measures of financial performance. The regression
analyses, subsequently, found that organizational environment factors were able to
explain only single-digit percentages of variation in financial performance. Implications
of these findings with regard to organizational performance are discussed.

iv
TABLE OF CONTENTS
ACKNOWLEDGEMENTS................................................................................................. i
ABSTRACT........................................................................................................................ ii
TABLE OF CONTENTS................................................................................................... iv
LIST OF TABLES........................................................................................................... viii
LIST OF FIGURES .............................................................................................................x
CHAPTER 1 ........................................................................................................................1
Background......................................................................................................................1
Problem Statement ...........................................................................................................4
Purpose of the Study ........................................................................................................5
Significance of the Study .................................................................................................6
Assumptions of the Study ................................................................................................8
Definition of Key Terms..................................................................................................9
Summary ........................................................................................................................10
CHAPTER 2 ......................................................................................................................12
Enduring Attention on Organizational Culture and Climate .........................................12
Culture and Climate: Comparisons of Concepts............................................................14
Culture versus Climate...............................................................................................14
Definitions of Culture and Climate............................................................................17
Organizational Environment Factors and Financial Performance .................................21
Studies Supporting the Culture-Performance Relationship .......................................23
Studies with Mixed Results on the Culture-Performance Relationship.....................37

v
Studies Not Supporting the Culture-Performance Relationship ................................39
Summary ........................................................................................................................42
CHAPTER 3 ......................................................................................................................44
Target Population...........................................................................................................44
Data Collection ..............................................................................................................45
Instrumentation ..............................................................................................................46
Bartlett’s Test.............................................................................................................48
Design of Exploratory Factor Analysis......................................................................48
Extraction Process......................................................................................................50
Interpreting Factors....................................................................................................56
Team Level Predictor Variables ....................................................................................58
Outcome Variables.........................................................................................................61
Methods for Data Analysis ............................................................................................62
Summary ........................................................................................................................64
CHAPTER 4 ......................................................................................................................66
Correlation Analysis ......................................................................................................67
Regression Analysis.......................................................................................................70
First Quarter Financial Results ..................................................................................70
Second Quarter Financial Results..............................................................................72
Third Quarter Financial Results.................................................................................75
Fourth Quarter Financial Results ...............................................................................75
Fiscal Year Financial Results.....................................................................................77

vi
Summary ........................................................................................................................79
CHAPTER 5 ......................................................................................................................81
Summary ........................................................................................................................81
Purpose and Research Question.................................................................................82
Results........................................................................................................................83
Conclusions....................................................................................................................84
Discussion......................................................................................................................85
Operational Effectiveness ..........................................................................................88
Immediate Manager ...................................................................................................89
Senior Management ...................................................................................................89
Mission.......................................................................................................................90
Valuing Employees....................................................................................................91
Training......................................................................................................................92
Involvement ...............................................................................................................92
Corporate Social Responsibility ................................................................................93
Satisfaction.................................................................................................................94
Teamwork ..................................................................................................................95
Inclusion.....................................................................................................................95
Limitations of the Study.................................................................................................96
Implications and Recommendations ..............................................................................98
Implications for Human Resource Development Practice.........................................98
Implications for Theory ...........................................................................................100

vii
Recommendations for Future Research ...................................................................101
REFERENCES ................................................................................................................103
Appendix A: Organizational Culture and Financial Performance Studies ......................119
Appendix B: IRB Approval Letter...................................................................................140
Appendix C: Survey Questions........................................................................................142
Appendix D: Factor Loadings - First EFA (68 Items).....................................................147
Appendix E: Factor Loadings - Second EFA (56 Items).................................................152
Appendix F: Factor Loadings - Third EFA (54 Items) ....................................................156
Appendix G: Factor Loadings - Fourth (Final) EFA (52 Items)......................................160
Appendix H: Comparison of Items and Factor Loadings: Original and Extracted..........164
Appendix I: Structure Matrix...........................................................................................173

viii
LIST OF TABLES
Table 1: Definitions of Organizational Culture .................................................................18
Table 2: Definitions of Organizational Climate.................................................................20
Table 3: Previous Studies of Employee Perceptions and Financial Performance ............22
Table 4: Eigenvalues of Extracted Factors with Total Variance Explained ......................52
Table 5: Correlations Among Extracted Factors (Cronbach Alphas in Parentheses)........54
Table 6: Communalities of Observed Variables in Extracted Factor Model.....................55
Table 7: Factor Definitions ................................................................................................57
Table 8: Descriptive Statistics of Team Level Organizational Environment
Factor Scores (n=93)...........................................................................................61
Table 9: Descriptive Statistics of Team Level Financial Performance..............................62
Table 10: Descriptive Statistics of All Variables of Interest .............................................66
Table 11: Correlations of All Variables of Interest (n=92-93) ..........................................68
Table 12: Stepwise Regression of Q1 Financial Results ...................................................71
Table 13: Regression Analysis of Q1 Financial Results....................................................71
Table 14: Analysis of Variance of Q1 Financial Results...................................................72
Table 15: Stepwise Regression of Q2 Financial Results ...................................................73
Table 16: Regression Analysis of Q2 Financial Results....................................................74
Table 17: Analysis of Variance of Q2 Financial Results...................................................74
Table 18: Sequential Sums of Squares of Q2 Financial Results........................................74
Table 19: Stepwise Regression of Q4 Financial Results ...................................................76
Table 20: Regression Analysis of Q4 Financial Results....................................................77

ix
Table 21: Analysis of Variance of Q4 Financial Results...................................................77
Table 22: Sequential Sums of Squares of Q4 Financial Results........................................77
Table 23: Stepwise Regression of Fiscal Year Financial Results......................................78
Table 24: Regression Analysis of Fiscal Year Financial Results ......................................79
Table 25: Analysis of Variance of Fiscal Year Financial Results .....................................79

x
LIST OF FIGURES
Figure 1: Scree Plot of Eigenvalues...................................................................................53
1
CHAPTER 1
INTRODUCTION
In this chapter, the background for the enduring interest in employee perceptions
is discussed, followed by the problem statement and the purpose of the study, the
significance of the problem, the assumptions underlying the research, and, finally,
definition of key terms of this study.
Background
A belief persists in the literature of both organizational culture and organizational
climate, reflected by both researchers and practitioners, that a strong link exists between
organizational culture and organizational effectiveness. This assumption has been put
forth in both the popular press by practitioners (Deal & Kennedy, 1982; Peters &
Waterman, 1982; Rucci, Kirn, & Quinn, 1998; Stringer, 2001) and in the academic press
(Denison, 1984, 1990; Gordon, 1985). Two assumptions support the interest and
persistence of the link between the climate of the work environment and organizational
performance (Ogbonna & Harris, 2002); one is that performance of a company is
dependent on the perceptions of employees being aligned with the company strategy, and
the other is that organizational culture can be controlled by management to facilitate a
realization of the strategy. The first assumption, pertaining to the relationship between
employee perceptions of the work environment and performance, is the focus of this
study. Specifically, is there a relationship between organizational environment factors
and performance? The state of the research focusing on the relationship between culture
and performance is inconclusive (Kirby, 2005; Lim, 1995; Siehl & Martin, 1990;

2
Wilderom, Glunk, & Maslowski, 2000). Wilderom et al. (2000) examined the history and
development of the literature focusing on organizational culture and performance, and
they suggested that four historical phases of literature can be observed. Phase 1, called
Emergence, reflected the initial proposition that a link between culture and performance
exits, and this initial phase occurred from World War II to the late 1970s. These authors
cited two representative authors from this era (Jaques, 1951; Silverzweig & Allen, 1976).
Promulgation, the second phase of the literature, was relatively brief, occurring from the
late 1970s to the early 1980s. This phase was characterized by semi-scientific literature
with several representative sources from this stage (Deal & Kennedy, 1982; Ouchi &
Jaeger, 1978; Peters & Waterman, 1982). The third phase, Defiance, occurred from the
early 1980s to 1990. This stage provided criticism of the relatively untested belief in the
link between culture and performance. The literature from this period specifically
criticized the earlier literature as being too light conceptually or lacking in scientific rigor
(Saffold, 1988; Siehl & Martin, 1990). The final stage of literature is the one that
continues today, the Testing phase. This phase is characterized by empirical testing of the
link between organizational culture and performance. Numerous studies from the early
1990s until the present characterize this phase (Booth & Hamer, 2009; Calori & Sarnin,
1991; Davidson, Coetzee, & Visser, 2007; Denison, 1984; Denison & Mishra, 1995;
Flamholtz, 2001; Flamholtz & Kannan-Narasimhan, 2005; Flatt & Kowalczyk, 2008;
Gordon & DiTomaso, 1992; Hansen & Wernerfelt, 1989; Kotter & Heskett, 1992;
Marcoulides & Heck, 1993; Ogbonna & Harris, 2000; Petty, Beadles II, Lowery,
Chapman, & Connell, 1995; Rousseau, 1990b; Sorensen, 2003; Thompson, 1996; Van

3
Der Post, De Coning, & Smit, 1998). Many of these studies provide evidence supporting
the notion of a relationship between organizational culture and performance; however,
some of these studies found little evidence supporting this relationship. Finally, as studies
on the relationship between organizational culture and performance continue to be
generated, Wilderom et al. (2000) suggested that a fifth phase could be in the making,
Theory-Testing, which will help to confirm or reject the work completed to date.
Similarly, the organizational climate literature also reflects a perceived link
between climate and performance. Reichers and Schneider (1990) traced the history of
the organizational climate concept beginning with the first time the term, climate, was
coined, by Lewin, Lippitt, and White (1939), as an approach to studying groups. The
early work in climate studies emphasized the global nature of employee perceptions of
their organizations, but this work evolved to a focus on specific dimensions of climate
and their relationships to various organizational outcomes (Schulte, Shmulyian, Ostroff,
& Kinicki, 2009). Numerous studies have focused on the relationship between
organizational climate and business performance, and many of these have focused on
examining the relationship between organizational climate and financial performance
(Borucki & Burke, 1999; Cooil, Aksoy, Keiningham, & Maryott, 2009; Gelade & Young,
2005; Koys, 2001; Leung, 1997; Paradise-Tornow, 1991; Rucci et al., 1998; Schneider,
Ehrhart, Mayer, Saltz, & Niles-Jolly, 2005; Schulte et al., 2009; Van De Voorde, Van
Veldhoven, & Paauwe, 2010). These studies also report a variety of results on whether
organizational climate is related to financial performance.

4
While the topics of organizational culture and organizational climate have
different histories and developed in parallel fashion, many have argued for more
integration of these two concepts as they share the objective of studying complex
organizational phenomena (Ashkanasy, Wilderom, & Peterson, 2000; Denison, 1996;
Payne, 2000; Reichers & Schneider, 1990). While different definitions conceptually and
operationally have been offered for the terms organizational culture and organizational
climate, much common ground between these two concepts can be seen. Regardless of
the term used, both climate and culture refer to “fairly enduring multileveled, organized
work contexts entailing the following: organizing values, norms, take-for-granted
assumptions, behavioral regularities, rituals, practices, procedures, patterns of discourse,
use of symbols, ways identity is constructed, and so on” (Ashkanasy, Wilderom, &
Peterson, 2011, p. 4). Numerous definitions of both organizational culture and
organizational climate can be found in the literature. However, Schein (2011) provided
some advice: “My advice to readers is to view both climate and culture as abstractions
that lead them to taking a useful perspective toward human behavior in complex systems”
(p. xiii). While definitions of organizational culture and organizational climate are
provided later in this chapter, culture will be the term used to refer to the organizational
phenomenon that is the subject of this research.
Problem Statement
Culture has been used to understand organizations and the experience of people
working in them (Alvesson, 2002; Martin, 2002; Reichers & Schneider, 1990; E. H.
Schein, 1992) and as a means for explaining their performance (Denison, 1990; Kotter &

5
Heskett, 1992). Several studies have attempted to measure a link between culture and
performance; however, varying results have been reported (Lim, 1995; Siehl & Martin,
1990; Wilderom et al., 2000). Taken together, the existing research on the relationship
between employee perceptions of the work environment and performance indicates that
some kind of relationship exists, but the evidence is not conclusive. Challenges shared by
all of the research in this area involve assessing organizational culture, assessing
organizational performance, and demonstrating a convincing link between the two.
Furthermore, each study in this area faces challenges in gaining access to organizations
and obtaining potentially sensitive data on both cultural measures and financial
performance. Wilderom et al. (2000) summarized the need for additional research as
follows: “The great intuitive appeal of the C-P [culture-performance] linkage, the
preliminary evidence found so far, and the many research challenges involved in
obtaining the evidence give some reasons to still believe in this link” (p. 201). This study
aimed to provide a meaningful addition to the literature by demonstrating how
organizational culture explains the variance in organizational performance.
Purpose of the Study
The purpose of this study was to determine if there is a relationship between
organizational culture and financial performance. This study explored the relationships
between a measure of financial performance and factors of organizational culture for a
sales and service organization of a global manufacturer. The measure of financial
performance used for the study was contribution margin ratio (Magoon, 2008).
Contribution margin ratio, calculated by dividing operating income by revenue, is a

6
financial ratio measuring profitability, and it reflects the efficiency with which an
organization achieves its financial performance. This research was focused on the
explanation of financial performance through the influence of factors of organizational
culture. Two decades of research testing the link between organizational culture and
financial performance have demonstrated some evidence for its existence; however,
additional study is warranted to confirm the initial findings from the literature.
Significance of the Study
The outcomes of this study may provide potential insights for both research and
practice. A number of culture and climate studies have demonstrated support for the
relationship between employee perceptions of the work environment and financial
performance (Borucki & Burke, 1999; Calori & Sarnin, 1991; Denison, 1984, 1996;
Flamholtz, 2001; Flamholtz & Kannan-Narasimhan, 2005; Flatt & Kowalczyk, 2008;
Gordon & DiTomaso, 1992; Hansen & Wernerfelt, 1989; Harter, Schmidt, & Hayes,
2002; Johnson, Davis, & Albright, 2009; Kotter & Heskett, 1992; Leung, 1997;
Marcoulides & Heck, 1993; Petty et al., 1995; Schneider, Hanges, Smith, & Salvaggio,
2003; Schulte et al., 2009; Sorensen, 2003; Thompson, 1996; Van De Voorde et al.,
2010; Van Der Post et al., 1998). Additionally, several studies focused in this same area
failed to find general support for the link between organizational culture and financial
performance (Booth & Hamer, 2009; Cooil et al., 2009; Davidson et al., 2007; Paradise-
Tornow, 1991; A. M. Ryan, Schmit, & Johnson, 1996) or found only mixed support for
this relationship (Gelade & Young, 2005; Koys, 2001; Ogbonna & Harris, 2000;
Rousseau, 1990b). Ashkanasy, Wilderom, and Peterson (2000) suggested that the

7
question of the link between organizational culture and financial performance remains
open because of methodological shortcomings in the current literature and because of the
formidable challenges associated with completing studies of this nature.
Because of the inconclusive research results, one may think of the link between
perceptions of organizational environment and organizational performance as espoused
theory. Based on Lynham’s (2002) theory building framework, if a conceptual
framework is developed and translated into observable, confirmable components, but it
remains unconfirmed through data and research, one could think of that idea as an
espoused theory. Such is the case for the notion that organizational culture has a link with
financial performance. Some research results have been generated that provide some
initial evidence supporting this link, but questions remain about the link between culture
and performance, as well as the organizational factors that make up this relationship.
Taken together, the results of the previous research in this area suggest the need for
further examination of the relationship of organizational culture and performance. This
study builds on the findings of the previous studies, and it hopes to confirm or reject
previous results in a different population.
This study may also benefit practitioners. Culture is often praised or blamed in the
literature as an explanation for high or low performance (Charan, 2001; LaGuardia, 2008;
Munck, 2001; O'Toole & Bennis, 2009; Peters & Waterman, 1982). Schein (1999) neatly
summarized the impact of culture as a set of forces that determine individual and
collective behavior and that influence strategy, goals, and modes of operating. He stated,
“If we want to make organizations more efficient and effective, then we must understand

8
the role that culture plays in organizational life” (p. 14). Practitioners who are interested
in having informed practice, where research results help to guide their work, may find
benefit in the research.
Assumptions of the Study
The perceptions of factors representing organizational culture and their
relationship with performance are the main topic of this research. Some have raised
questions about the appropriateness of using self-reported perceptions collected through a
survey to measure organizational culture (Lim, 1995; Saffold, 1988; Siehl & Martin,
1990). Earlier definitions of organizational culture suggested that organizational culture
was best examined through interpretive epistemologies because they were founded on
social construction, but, as the organizational culture research developed from the 1990s
onward, the use of quantitative methods, such as survey research, became commonplace
and accepted (Van Den Berg & Wilderom, 2004). Studies using surveys to measure
organizational culture have been criticized as being organizational climate studies vs.
organizational culture studies (Martin, 2002). However, many authors now recognize the
value of multiple types of data to inform organizational culture research (Reichers &
Schneider, 1990; Rousseau, 1990a; Schneider, 2000). Denison (1996) wrote, “The
endless debate over what constitutes the ‘right’ kind of data [for organizational culture
research] can be given a decent burial” (p. 645).
Martin (2002) suggested that most literature on organizational culture can be
described using one of three paradigms, and these reflect assumptions about the concept
of organizational culture. Organizational culture literature that reflects the integrative
9
paradigm shows a view where cultural manifestations are consistent, and there is
agreement about the culture within the organization. The differentiation paradigm is
shown when literature reflects organizational culture as something inconsistent and
lacking in consensus within an organization; here, the organization can be thought of as a
cluster of subcultures without organization-wide consensus. A third perspective, the
fragmentation paradigm reflects organizational culture and subcultures as uncertain,
fluctuating, blurred, or overlapping. Given the three paradigms provided by Martin
(2002), this research takes on assumptions associated with the integration paradigm,
including the notion that culture can be understood from the etic point of view, that
objectivity is valued, that the generalization of results is both possible and desirable, and
that the relationships among variables are valued because of their contribution to theory
building based on quantitative data.
Definition of Key Terms
For the purpose of this study, organizational culture was defined as the “shared
perceptions of organizational work practices within organizational units that may differ
from other organizational units” (Van Den Berg & Wilderom, 2004, p. 571).
Organizational climate was defined as “the shared perception of ‘the way things are
around here.’ More precisely, climate is shared perceptions of organizational policies,
practices, and procedures, both formal and informal” (Schneider, 1990, p. 22). As
demonstrated by the definitions of organizational culture and organizational climate,
these two terms refer to the perception of the organizational environment by members of
the organization.

10
Performance has been defined as “the valued productive output of a system in the
form of goods or services” (Swanson & Holton III, 2001, p. 89). The measurement of
organizational performance, like organizational culture and organizational climate, is a
complex issue, and a variety of measures from financial to operational metrics have been
used to demonstrate organizational performance (Venkatraman & Ramanujam, 1986).
Economic performance of organizations can be reflected in a variety of financial metrics
(Venkatraman & Ramanujam, 1987). This study used a financial performance
measurement called contribution margin ratio, which is a measure of profitability, as the
outcome variable. Contribution margin is a ratio that demonstrates the efficiency with
which an organization achieves financial performance through a ratio that combines cost,
volume, and profit. Contribution margin ratio was defined as follows: “The difference
between sales revenue and the variable costs of a product or service (e.g., labor and
materials)” (Magoon, 2008, p. 175). The ratio is calculated by dividing operating income
by revenue.
Summary
Organizational culture of a firm is often praised or blamed as a key factor in
explaining organizational performance; however, the evidence supporting the link
between organizational culture and financial performance requires further investigation.
Much of the extant research investigating this relationship has been troubled by
methodological challenges of organizational access and sampling. Research methodology
has also been challenged by issues associated with operationalizing organizational
culture, operationalizing organizational performance, and substantiating the relationship
11
between culture and performance. Despite these challenges and obstacles, culture remains
a lens on which to view organizations, and a clear relationship between organizational
culture and financial performance has not yet been demonstrated. Therefore, the research
question for this study was: is there a relationship between organizational environment
factors and performance?

12
CHAPTER 2
REVIEW OF LITERATURE
This chapter presents relevant literature investigating the relationship between
organizational environment factors and financial performance, and it discusses the
continuing interest in organizational culture and organizational climate as subjects of
research. Definitions of organizational culture and organizational climate are provided,
including how culture is distinguished from climate. Finally, organizational culture and
organizational climate research, where financial performance was the outcome variable
of interest, is reviewed and summarized.
Enduring Attention on Organizational Culture and Climate
The study of organizational culture and organizational climate is an approach for
understanding how organizations perform, ways in which organizations change, and ways
in which organizations are experienced by those who are a part of them (Schneider,
2000). In particular, research on both organizational climate and organizational culture
and its potential link with organizational performance has been a prominent topic of
study within the larger field of organizational culture and organizational climate research
(Kirby, 2005; Lee & Yu, 2004; Lim, 1995; Sackmann, 2011; Wilderom et al., 2000).
Two assumptions underlie such research: organizational performance is dependent on the
alignment of the values and perceptions of employees to the company strategy and
organizational culture can be manipulated by management in order to control
performance towards predictable outcomes (Ogbonna & Harris, 2002).

13
Historically, support for these two main assumptions emerged over time.
Wilderom et al. (2000) reported that these assumptions were initially suggested by
several sources from the 1930s-1950s, namely, the Hawthorne studies (Roethlisberger &
Dickson, 1975), a case study of culture change in a factory (Jaques, 1951), and in a
popular management text from the early 1960s (Pfiffner & Sherwood, 1960). Wilderom
et al. indicated that the 1960s through the early 1970s was a relatively quiet period for the
topic of organizational culture and its links to organizational performance. However,
from the late 1970s onward, the topic of organizational culture and its potential link to
organizational performance received a great deal more attention with prominent
publications in the practitioner press (Collins, 2001; Collins & Porras, 1994; Deal &
Kennedy, 1982; Kotter & Heskett, 1992; Peters & Waterman, 1982) as well as in
academic circles (Barney, 1986; Chatman & Cha, 2003; Lee & Yu, 2004; Pettigrew,
1979; Siehl & Martin, 1990). In contrast, Reichers and Schneider (1990) noted that in this
same time period in the 1960s, researchers focusing on organizational climate generated
several studies of collected data and focused on assessing the validity of the climate
concept, and they note that these early studies considered climate to be a correlate of
work productivity and motivation.
Several reasons support the enduring interest in organizational culture and
organizational climate and their potential link to organizational performance. First, the
lenses of organizational culture and organizational climate can provide a way to
understand how organizations function and change, and how they are experienced by
those within them. Second, there has been practitioner and academic interest in the
14
relationship between employee perceptions of the work environment and performance.
This stems not only from understanding how organizations perform, but this is from the
interest of organizational stakeholders in controlling and predicting organizational
performance. Before reviewing the specific literature that investigated the link between
organizational environment factors and financial performance, definitions of
organizational culture an organizational climate are provided and discussed.
Culture and Climate: Comparisons of Concepts
No widespread agreement of the definitions of organizational culture or
organizational climate has yet emerged from the literature, and many definitions of the
terms appear in the literature and often interchangeably (Ashkanasy et al., 2000; Martin,
2002). Because of this the meaning of these concepts has become blurred over time
(Payne, 2000; Pettigrew, 1990). A discussion comparing these two concepts follows.
Culture versus Climate
Considerable discussion about the similarities, differences, and conflict between
the concepts of organizational culture and organizational climate can be found in the
literature, and camps have emerged representing both sides of the debate (Denison, 1996;
Martin, 2002; E. H. Schein, 2000). The literature on organizational culture and
organizational climate overlap by a great deal as both concepts are linked conceptually
and practically to the study of organizational life and how organizational participants
experience organizations (Schneider, 2000). However, it is helpful to relate briefly the
origins of each concept as a way to understand their distinctions. Reichers and Schneider
(1990) and Ashkanasy, Wilderom, and Peterson (2000) provided thorough histories of the

15
two terms and the development of their respective literature and research. These sources
trace both concepts back to their first points of publication as a way to trace the
development of each concept.
In the context of organizational behavior studies, culture is a comparatively
younger concept than climate. The first time the climate term was used appears to have
been in 1939 in a study by Kurt Lewin and his team from the University of Michigan in
reference to experimentally created social climates (Lewin et al., 1939). Lewin’s area of
study emerged from his interest in field theory and social climate. The work in the area of
climate continued with Rensis Likert who pioneered the use of surveys as a means for the
measurement of employee attitudes (Ashkanasy et al., 2000). In contrast, the first time
culture, a concept whose roots are traced to anthropology, was used as an approach for
understanding the workings of organizational life appears to have been in 1979 in a study
about a private British boarding school (Pettigrew, 1979). Climate studies employing
survey techniques that operationalized climate emerged in the 1960s (Reichers &
Schneider, 1990). The early culture research emerged out of qualitative approaches to
gathering information about the meaning of symbols, language, beliefs, and values that
are resident in specific organizations. It was not long before both organizational culture
and climate became associated with organizational performance.
Reichers and Schneider (1990) suggested that climate researchers were more
concerned about organizational effectiveness than the culture researchers, per se, and that
climate researchers viewed climate as a means to understand organizational effectiveness
overall. These authors suggested that the early culture researchers were more concerned

16
with meaning and description of the organizational context. Reichers and Schneider
(1990) stated, “The early studies of climate considered climate to be a correlate of work
motivation and productivity” (p.14). In contrast, culture was thought to be a sound means
to explore an organization and what the experience of it meant to the members. Reichers
and Schneider (1990), of the organizational culture paradigm, stated, “effectiveness is not
an important concept in anthropology, especially in comparative or cultural
anthropology; description is the issue” (p. 20, italics in original). However, in the early
1980s, literature emerged that claimed that effective management of organizational
culture is associated with improved organizational performance (Deal & Kennedy, 1982;
Peters & Waterman, 1982). Following these initial claims, the notion of organizational
culture was further developed and refined as a concept, and cultural researchers began to
use surveys as a means of studying culture as a means for exploring the link between
culture and performance (Denison, 1984). Climate researchers now agree that the use of
case study and other qualitative research methods can yield data and richness of
understanding that cannot be achieved through survey research alone (Schneider, 2000).
And in some parts of the culture camp, the use of survey and quantitative research are
valid methods for defining, measuring, and comparing organizational culture (Van Den
Berg & Wilderom, 2004). To summarize, organizational studies researchers may or may
not specify a distinction between organizational culture and organizational climate, and
some cultural researchers would include organizational climate studies, such as those
suggested by Martin (2002), to be a subset of the broader study of organizational culture.

17
Definitions of Culture and Climate
Because of the plethora of definitions of culture, each with its own theoretical
implications, defining organizational culture is a dilemma and one that reflects the
richness of the organizational culture body of work (Martin, 2002). Schein’s (1990) well-
known definition of culture has provided a reference point for many organizational
culture researchers (Pettigrew, 2000):
Culture can now be defined as (a) a pattern of basic assumptions, (b)
invented, discovered, or developed by a given group, (c) as it learns to
cope with its problems of external adaptation and internal integration, (d)
that has worked well enough to be considered valid and, therefore (e) is to
be taught to new members as the (f) correct way to perceive, think, and
feel in relation to those problems. (E. H. Schein, 1990, p. 111)
In terms of shared meanings, one point that Schein has made is that culture is both a static
state of an organization as well as a constantly emerging process of constructing shared
meaning (E. H. Schein, 2000).
In research investigating the link between employee perceptions of the work
environment and financial performance, culture has been defined in many ways, but
many of these definitions still manage to reflect some of the themes provided by Schein’s
definition. The definitions in Table 1 reflect several authors’ attempts to operationalize
culture for research purposes. This table shows some of the various ways organizational
culture has been defined, and it demonstrates that there is no broad agreement on the
definition of this term.

18
Table 1
Definitions of Organizational Culture
Reference Definition of organizational culture
Booth & Hammer (2009) “Corporate culture can be defined as the expressed values of the organization. These may derive from the values of the founders, transmitted through management rules and practices, and seen in the corporately approved rituals and procedures that all members of the firm take part in” (p. 712).
Calori & Sarnin (1991) The culture of an organization is a set of values.
Davidson, Coetzee, & Visser (2007)
“It is a collective phenomenon shared by members of a group and is socially constructed. It deals predominantly with intangible and emotional concepts (such as meanings, values, understanding and beliefs) rather than rational concepts. It provides a group with identity, a sense of meaning, purpose, and direction, and involves the establishment of a set of norms that shape the behavior of individuals within that group. Culture has a significant influence on the extent to which there is internal integration (the ways in which people work together in order to adapt to the external environment and remain competitive). Furthermore, it is historically determined and is difficult to change” (p. 46).
Flamholtz & Kannan-Narisimhan (2005)
“Five different areas in which culture is manifest: these include: (1) the way in which people are viewed and treated by the organization, (2) the way customers are viewed and treated by the organization, (3) the standards of performance and accountability, (4) the teamwork among people in an organization, and (5) corporate citizenship or the way in which the organization operates as a member of its communities” (p. 52).
Gordon & DiTomaso (1992) “The pattern of shared and stable beliefs and values that are developed within a company across time” (p. 784).
Kotter & Heskett (1992) “We have found it helpful to think of organizational culture as having two levels which differ in terms of their visibility and their resistance to change. At the deeper and

19
Reference Definition of organizational culture
less visible level, culture refers to values that are shared by the people in a group and that tend to persist over time even when group membership changes. At the more visible level, culture represents the behavior patterns of style of an organization... Each level of culture has a natural tendency to influence the other” (p. 4).
Petty et al. (1995) One view of culture is “how an organization sets strategy, develops goals, measures progress, and defines products and markets. Culture is considered a mechanism for governing rationale behavior, a system of broad rules for appropriate action under specified contingencies... [A second view of culture] focuses on underlying systems of unconscious assumptions and beliefs which are shared by members of an organization (L. Schein, 1989)…We seek to resolve some of the conflict between the two views [of culture] by proposing that the two views of culture are not in conflict but are rather complementary” (p. 4).
Rousseau (1990) “Many cognitive and behavioral elements comprise culture from unconscious assumptions, values, and behavioral norms to characteristic patterns of behavior associated with a work group, department, or organization” (p. 449).
Similarly, the concept of organizational climate has been defined in numerous
ways by many researchers. Benjamin Schneider has been considered by many to be an
acknowledged leader in the study of organizational climate (Ashkanasy, Wilderom, &
Peterson, 2011a). Schneider’s definition of climate is as follows: “Climate is widely
defined as the shared perception of ‘the way things are around here.’ More precisely,
climate is shared perceptions of organizational policies, practices, and procedures, both
formal and informal” (Reichers & Schneider, 1990, p. 22).

20
Many of the climate definitions refer to the role that employee perceptions play in the
measurement of a climate. Operationalizing climate in this way has supported the wide-
spread use of survey research in organizational research as a means of measuring the
work environment. Table 2 shows various definitions of the term organizational climate.
Table 2
Definitions of Organizational Climate
Reference Definition of organizational climate
(Cooil et al., 2009) Perceptions attributed to the work environment [that are used] primarily as a framework to understand how employees experience their work environment.
(Gelade & Young, 2005) Shared perceptions of policies, practices, and procedures.
(Schulte et al., 2009) Organizational climate represents shared perceptions among employees within work units regarding what the unit is like in terms of its formal and informal policies, practices, events, and procedures. Organizational researchers view climate as an abstraction of the environment that is based on employees’ perceptions and is examined at multiple levels of analysis.
(Lewin et al., 1939) The attitudes, feelings, and social processes that occur in groups.
(Ashkanasy et al., 2000) Configurations of attitudes and perceptions by organization members that, in combination, reflect a substantial part of the context in which they are a part and within which they work
For the purpose of this research, the following definition of organizational culture
will be used: “Shared perceptions of organizational work practices with organizational
units that may differ from other organizational units” (Wilderom et al., 2000, p. 571).
And, organizational climate will be defined as “the shared perception of ‘the way things

21
are around here.’ More precisely, climate is shared perceptions of organizational policies,
practices, and procedures, both formal and informal” (Reichers & Schneider, 1990, p.
22). Having established a context for understanding and defining these terms, the results
of previous studies are described next.
Organizational Environment Factors and Financial Performance
A variety of research has attempted to identify a relationship between
organizational environment factors and organizational performance. Organizational
performance has been defined in numerous ways to include variables such as satisfied
customers, operational excellence, and financial results, among many variables
(Venkatraman & Ramanujam, 1986). Of particular interest here are the studies that
focused primarily on the identification and description of organizational culture
constructs that might influence financial results. Table 3 summarizes the findings of this
literature. Those studies which generally provide evidence for the relationship between
employee perceptions and financial performance are listed in the column labeled support.
Those studies which identified only mixed support or little evidence supporting the link
between employee perceptions and financial performance are shown in these columns
respectively.

22
Table 3
Previous Studies of Employee Perceptions and Financial Performance
Supporting Mixed Results Not Supporting
Borucki & Burke (1999)
Calori & Sarnin (1991)
Denison & Mishra (1995)
Denison (1984)
Flamholtz & Kannan-Narasimhan (2005)
Flamholtz (2001)
Flatt & Kowalczyk (2008)
Gordon & DiTomaso (1992)
Hansen & Wernerfelt (1989)
Harter, Schmidt, and Hayes (2002)
Johnson, Davis, & Albright (2009)
Kotter & Heskett (1992)
Leung (1997)
Marcoulides & Heck (1993)
Petty et al. (1995)
Schneider et al. (2003)
Schulte, Shmulyian, Ostroff, & Kinicki (2009)
Sorensen (2003
Gelade & Young (2005)
Koys (2001)
Ogbonna & Harris (2000)
Rousseau (1990)
Booth & Hamer (2009)
Cooil, Aksoy, Keiningham, & Maryott (2009)
Davidson et al. (2007)
Paradise-Tornow (1991)
Ryan, Schmit, & Johnson (1996)

23
Supporting Mixed Results Not Supporting
Thompson (1996)
Van De Voorde, Van Veldhoven, & Paauwe (2010)
Van Der Post et al. (1998)
The following three sections provide a summary of these studies: Studies
supporting the link between employee perceptions of the work environment and financial
performance, studies claiming mixed results on this relationship, and studies with results
that do not support this hypothesized relationship.
Studies Supporting the Culture-Performance Relationship
Borucki and Burke (1999) examined the role of organizational climate variables
and their influence on sales personnel performance and financial performance in stores in
a retail chain located in the U.S. Two samples of survey data were collected from store
employees located in 594 stores. Sample one had 34,866 respondents, and the second
sample had 34,365 respondents. Individual respondent data was calculated to represent
store-level data. Employee perceptions of the work environment included measures of the
following variables: (1) Goal emphasis, (2) Means emphasis/general training, (3) Means
emphasis/specific training, (4) Management support, (5) Non-monetary reward
orientation, (6) Monetary reward orientation, (7) Organizational service orientation, (8)
Merchandise-related obstacles, (9) Employee preparation-related obstacles, and (10)
Human resource-related obstacles. Path analysis was used to demonstrate linkage

24
between organizational climate, service performance of employees, and store financial
performance. The authors of this study found a relationship between management’s
support of customer service as an organizational value, a measure of the climate related
to customer service, the performance of service related behaviors, and store financial
performance. This study found support for the linkage between variables in the
organizational climate and financial performance.
Calori and Sarnin (1991) completed a two-part research program using a survey to
assess culture, and they administered the survey to identify a link between culture and
performance. Numerous co-linear relationships between items/factors were found. In the
second phase of the study, the questionnaire was administered to 280 people in five
companies in different industries in France. The response rate was not reported. This
culture questionnaire has not been used subsequently in other research (Wilderom et al.,
2000). Three performance measures were used in this study: return on investment, return
on sales, and annual variation in net turnover. In terms of substantiating the link between
organizational environment factors and financial performance, culture strength as a
concept was used, and it was operationalized as both the homogeneity of responses and
the intensity of responses. Many culture values and their corresponding management
practices were related to company growth: (1) personal fulfillment, (2) listening to others,
(3) team spirit, (4) responsibility, (5) trust, (6) openness to the environment adaptation,
(7) anticipation, (8) entrepreneurship, (9) quality, and (10) consistency. The strength of
culture was positively related to high growth. However, only a few culture attributes and

25
management practices were related to profitability, among them were openness to the
environment, participation in local activities, societal contribution, and flexibility.
Denison (1984) used 43,747 responses from 34 companies taking the Survey of
Organizations questionnaire (Taylor & Bowers, 1972). He created two indices: The
Organization of Work index which was made up of 4 survey items and the Decision-
Making Practices index which was made up of 2 survey items. For performance, he used
two measures: income over investment ratio which measured effective use of resources
and income over sales to reflect operating efficiency. Few statistical values of this study
were provided in this article; however, graphs were provided to show the difference
between the 17 higher performing and 17 lower performing organizations. Thus, some
questions remain unanswered by this article summarizing this work. For example, despite
the large sample size, the fact that the indexes were each composed of so few items raises
doubts about validity and reliability (Lim, 1995). Despite the lack of detail provided in
this article about the study, the Denison suggested that the study’s data clearly show that
those companies having a well organized work environment have a significantly higher
return on investment. In addition, a participative culture appeared to provide a small
advantage early on and that this advantage steadily increased over a five-year period.
Denison and Mishra (1995) created a questionnaire of items with a focus on four
culture traits: (1) adaptability, (2) consistency, (3) involvement, and (4) mission. One
survey was sent to each organization with 3,625 total surveys being distributed and 764
surveys being returned for a response rate of 21%. The respondents were top managers
such as the CEO, the COO, or the CFO. Objective measures for performance were return

26
on assets and sales growth. The correlations for the total sample were positive but quite
weak. However, when the authors analyzed separately the results from organizations with
greater than 100 employees (about 10% of the original sample), the correlations moved
from weak relationships to include moderate relationships between employee perceptions
of the mission category with return on assets. Relationships between culture and sales
growth were all positive, many of which were significant, but with the overall
relationship being weak. Various moderate relationships between subscales were shown
between the following: input and collaboration, collaboration and agreement,
predictability and agreement, and vision and direction. The relationships between
subscales call into question whether the subscales are clearly distinguishable. To
summarize, the relationships between culture and performance are moderate at best, and
they seem to hold for only the larger firms. A criticism of this study was that the
subscales only contained two items which is a narrow basis for the study of culture
(Wilderom et al., 2000). Denison & Mishra’s best evidence for the link between
employee perceptions and financial performance is as follows: (1) For large firms
profitability is best predicted by stability traits such as mission and consistency (2) Sales
growth is best predicted by flexibility traits such as involvement and adaptability, and (3)
All cultural traits were positively related to return on assets, with mission as the strongest
predictor (Wilderom et al., 2000).
Flamholtz and Kannan-Narasimhan (2005) conducted additional analysis on the
link between culture and performance using data gathered from a previous study
(Flamholtz, 2001). 950 people were given a questionnaire from a single organization

27
developed by Flamholtz, and 702 individuals responded for a response rate of 78%. The
factor analysis on indicated that there were six culture variables, and they were named (1)
customer focus, (2) corporate citizenship, (3) performance standards, (4) identification
with the company, (5) human resource practices, and (6) organizational communication.
The dependent variable for this study was earnings before interest and taxes (EBIT). The
survey instrument consisted of 29 items which were assessed on a 5-point Likert scale.
All of the organizational environment factors have moderate to strong correlations with
one another. The authors conclude that the first four culture factors above have moderate
to strong relationship with EBIT (however, one of these factors, Corporate Citizenship,
does not have a p-value which indicated statistical significance). The last two culture
factors above were correlated with several of the first four culture factors, and the authors
suggest that they are potentially drivers of the other four.
Flamholtz (2001) created a survey and administered it to 950 individuals in a
company with 20 operating divisions that manufactured parts for industrial, truck, and
other automotive businesses. The author worked with the organization to articulate a
desired corporate culture; statements of values and practices which would reflect this
culture were used to construct a survey. The administration of the survey had a response
rate of 78%. The culture variables were summarized into one predictor variable called
“degree to which each division was perceived by its own personnel to be ‘living’ the
desired corporate culture” (Flamholtz, 2001, p. 272). The response variable was earnings
before interest and taxes (EBIT). The findings were as follows: 46% of variation in EBIT
is explained by corporate culture buy-in.

28
Flatt and Kowalczyk (2008) reused the data from the Kotter and Heskett study
(1992). To the original data, Flatt and Kowalczyk added data about corporate reputation.
A single computed variable, culture strength, was used, and it was a calculation of the
extent to which managers in competing firms commonly spoke of a (company name)
"style" or way of doing things, the extent to which the firm made its values known in a
credo, and the extent to which the firm is managed against long-standing policies and
procedures and not just the most recent CEO's edicts. Two measures were used for
financial performance: market value / total shareholder equity, and return on assets
(ROA). Findings related to the culture-performance relationship are as follows: culture
was moderately related to book value and ROA, and firm reputation was a mediating
variable between culture and financial performance.
Gordon and DiTomaso (1992) used a survey created by Gordon and Cummins
(1979) to measure managers’ perceptions of how their organizations operate and, by
extension, the values that drive the behaviors of individuals in the organization. There
were 61 items on the survey, and it used a 7-point Likert scale. Eight factors were
identified: (1) clarity of strategy/shared goals, (2) systematic decision making, (3)
integration/communication, (4) innovation/risk-taking, (5) accountability, (6) action
orientation, (7) fairness of rewards, and (8) development and promotion from within.
Eleven companies were in the sample with respondents being in the top four or five
levels of management. The response rate was greater than 90%, and it ranged from 34 -
132 respondents per company with a mean of 77 for a total number of responses of 850.
The eight factors were combined to construct three predictor variables: (1) culture

29
strength, which was a composite of all eight above factors; (2) adaptability, which was a
combination of factors four and six above; and (3) stability, which was a combination of
factors three, seven, and eight above. Measures of financial performance were those that
were important to the insurance industry which was the context for the study. These
measures were (1) growth in assets and (2) growth in premiums. Results reported were as
follows: A strong culture was related positively to firm performance. The adaptability
measure was also predictive of short term performance. Stability was not found to be
predictive of firm performance.
Hansen and Wernerfelt (1989) attempted to identify the contributions made by
economic factors and culture factors on firm performance respectively. Economic factors
were (1) size of firm, (2) industry of firm, and (3) relative market share. Culture factors
were (1) emphasis on human resources and (2) emphasis on goal accomplishment.
Culture and financial data from a total of 60 organizations were used for this study. The
culture data, interestingly, came primarily from the same source that was used by
Denison (1984) which was the Survey of Organizations (Taylor & Bowers, 1972);
however, this study appears to take a different grouping of data from the Survey of
Organizations data because of the reported sample size. The response variable was five-
year average ROA. Results were as follows: Both organizational factors and economic
factors were important in explaining performance. However, the results indicated that
organizational factors explained twice as much variance in firm profit rates compared to
economic factors.

30
Harter et al. (2002) studied the relationships between employee perceptions of
work characteristics, management practices, and overall employee satisfaction and
profitability. Profit was defined as a percentage of revenue, and it was included in other
performance variables of productivity for the purpose of the study. This study used a
large data base of 198,514 employees in 7,939 business units of 36 unique companies
from various industries. Using a meta-analytic approach, this study found that employee
attitude measures were related to business-unit outcomes, supporting a link between
employee perceptions of the work environment and financial performance. However,
correlations between climate and financial performance were positive but of a lower
magnitude than were shown for other outcome variables in the study. The outcome of this
study suggested that employee perception variables may only indirectly relate to financial
and other organizational performance outcomes. The findings of this study suggest that
other variables which are not within the scope of this study may influence organizational
outcomes.
Johnson, Davies, and Albright (2009) examined the relationship between
employee attitudes and a firm’s financial performance, testing the hypothesis that firm
performance predicts attitudes. Four dimensions of the organizational environment were
measured in this study: job satisfaction, pay satisfaction, organizational commitment, and
organizational justice. The financial measure for this study was return on assets. The
organization involved with this study was a community bank with 45 branches and one
headquarters location located in the U.S. Two samples of employee perceptions were
gathered as a part of this study: 293 employees in sample 1 and 364 employees in sample

31
2. The findings of this study suggested that financial performance leads to employee
attitudes most specifically when the financial performance improved. Employees working
in branches that were performing well financially were found to be more satisfied with
their jobs, more committed to the organization, and more satisfied with their pay.
Kotter and Heskett (1992) conducted a set of studies to examine the relationship
between culture and performance. They created a survey that was mailed to the top six
officers in 207 companies, and 600 responses were collected for a 48% response rate. The
culture survey was used to gather data on culture strength using the following approach:
A single culture indicator was computed based on responses from leaders of other firms
in the same industry to three questions: the extent to which managers in competing firms
commonly spoke of a (company name) "style" or way of doing things, the extent to
which the firm made its values known in a credo, and the extent to which the firm is
managed against long-standing policies and procedures and not just the most recent
CEO's edicts. Dependent variables were created using financial performance indices with
the following data: (1) average yearly increase in net income, (2) average yearly return on
investment, (3) average yearly increase in stock price. A key finding from this study was
the modest, positive relationship between the strength of corporate culture and long-term
economic performance. However, Kotter and Heskett’s study is open to criticism because
of issues associated with its operationalization of culture using the “strong culture” thesis
as well as having respondents assess organizational cultures of which they are not
members. In addition, the Kotter and Heskett data were sourced from a set of respondents
who represented only the top-most level of individuals in each of the organizations

32
participating and not a broader set of responses from the employee base. Nevertheless,
the authors found that culture strength described a quarter of the variance in performance.
Leung (1997) also studied employee satisfaction and organizational commitment
to identify their relationships with financial performance. This study defined financial
performance as total revenue. The sample for this study was 231 sales staff employees
from a casual clothing retail chain with 26 locations in Hong Kong. The number of sales
staff in the individual retail locations ranged from three to eighteen employees. Both
employee perceptions of the work environment and financial performance were reported
at the shop level. Job satisfaction showed a moderate relationship with financial
performance.
Marcoulides and Heck (1993) used the following five cultural factors to create a
structural equation model to explain performance: (1) organizational structure and
purpose, (2) organizational values, (3) task organization, (4) organizational climate, and
(5) worker attitudes and goals. The predictor variable for the study was a combination of
several factors including volume of sales fulfillment, share, profit, and return. Study
participants came from 26 organizations in various industries, and 392 respondents
participated in the study. The response rate is not reported. The results suggest that
variables associated with organizational culture are predictive of organizational
performance. The strongest relationships between cultural and financial performance
were organizational climate and worker attitudes.
Petty et al. (Petty et al., 1995) examined the culture-performance relationship in a
study which used survey data collected from a firm in the utility industry. A 55-item

33
survey was used to collect data at two points in time from the same organizations within a
company. The first sample collected responses from 832 employees, and the second (a
year later) from 884 employees. Culture was operationalized to reflect four factors: (1)
teamwork, (2) trust and credibility, (3) performance and common goals, and (4)
organizational functioning. Performance was measured internally by the company as a
composite score of five areas: (1) operations, (2) customer accounting, (3) support
services, (4) marketing, and (5) employee safety and health. Results are as follows: The
authors found that organizational performance was linked to organizational culture, and
in particular, the strongest link of this relationship was shown between teamwork and
performance. A moderate positive relationship was also shown between performance and
trust and credibility.
Schneider et al. (2003) studied the culture-performance relationship using archival
data from a consortium of large, admired (according to Fortune Magazine) companies in
the U.S. who agreed to administer a subset of common items from an attitude survey to
their employees. The authors shared no information on response rate or how the surveys
were administered. In terms of scale development, seven factors were used: (1)
satisfaction with empowerment, (2) satisfaction with job fulfillment, (3) satisfaction with
pay, (4) satisfaction with work group, (5) satisfaction with security, (6) satisfaction with
work fulfillment, and (7) overall job satisfaction. The response variables were (1) return
on assets and (2) earnings per share. The results were as follows: Consistent and
significant positive relationships over various time lags between attitudes concerning
34
satisfaction with security, satisfaction with pay, and overall job satisfaction with both
return on assets and earnings per share.
Schulte et al. (2009) investigated how different patterns found in climate data,
such as elevation, variability, and shape, can be used to explain how climate operates in
relation to internal and external indicators of organizational effectiveness. Employee
perception variables of the work environment included managerial task support, company
vision, employee relationships, intra-organizational relationships, job adequacy,
performance management and recognition, and external service. A food distribution
company located in the U.S. was the site of this study, and 4,317 employee respondents
from 86 stores participated in the study. The financial performance measure for this study
was total store sales per square foot. These authors found that the shape of an
organization’s climate profile is related to customer satisfaction and financial
performance, suggesting that organizational climate has a relationship with indicators of
financial performance.
Sorensen (2003) reused data from the original Kotter and Heskett culture study
(1992) to examine the argument that strong cultures drive firm performance. The
predictor variable was summarized as a strong culture per Kotter and Heskett. The
response variables were (1) return on invested capital (ROIC) and (2) yearly operating
cash flow. Adding to the original data set, the author reviewed information about the
market and the environmental volatility. Industry volatility was estimated from a capital
asset pricing model. Results of analyses of a sample of firms from a broad variety of
industries showed that in relatively stable environments, strong-culture firms have more

35
consistent performance providing support for the link between work environment
perceptions and financial performance. However, in volatile environments, the reliability
benefits of strong cultures disappear. The author speculated that those organizations
demonstrating a strong culture had difficulty in adapting to changing market conditions.
Thompson (1996) studied 71 districts of a large utility having primary
responsibility for customer service and sales. A survey was developed internally at the
utility that reflected the company’s vision and statements of behaviors and practices that
aligned with the vision. The instrument collected employee perceptions of several
variables in the work environment: (1) Core values, (2) Customer commitment, (3)
Business dimensions, (4) Communication, (5) Safety, (6) Business results, (7)
Empowerment, (8) Innovation & risk taking, (9) Rewards & recognition, (10)
Community involvement, (11) Environmental responsibility, and (12) Teamwork. A
composite score of 60 core items on the survey was computed. The correlation between
the composite score and financial performance was significant but moderate. The
financial performance variable for this study was contribution margin ratio, a
measurement of profitability. When comparing the districts with a high composite score
to districts with a low composite score, the differences in profitability were great
suggesting that agreement of employees with the vision of the organization was
associated with better financial performance. Districts with high rates on the composite
index experienced twelve times the profitability than those districts with low employee
ratings.

36
Van de Vorde et al (2010) studied what they called the temporal order in the
relationship between organizational climate and performance. Their study was conducted
in a financial services organization in the Netherlands with 171 branches. Two samples of
employee perceptions were collected: 14,477 respondents and 14,860 employees at time
points one and two respectively. Four dimensions of the work environment were gathered
in their data from employees: (1) goal and means orientation, (2) reward orientation, (3)
socio-emotional support, and (4) task support. The financial performance metric used for
this study was branch profit per full-time equivalent employee. These authors found that
the organizational climate measures at time point one influenced organizational
performance at time point two, providing support for the link between employee
perceptions of the work environment and financial performance.
Finally, Van Der Post et al. (1998) examined the culture-performance link in a
South African context. These authors created a questionnaire of 97 items, each with a 7-
point Likert scale, to collect perceptions of fifteen organizational culture constructs. The
fifteen factors are as follows: (1) conflict resolution, (2) culture management, (3)
customer orientation, (4) disposition towards change, (5) employee participation, (6) goal
clarity, (7) human resource orientation, (8) identification with the organization, (9) locus
of authority, (10) management style, (11) organization focus, (12) organization
integration, (13) performance orientation, (14) reward orientation, and (15) task structure.
This study involved respondents from numerous organizations, and 49% of the initial 128
companies invited to participate in the study did so with 3,617 usable responses for a
response rate of 38.2%. Four financial performance variables were used in this study: (1)

37
return on average equity, (2) return on average assets, (3) total asset growth rate, and (4)
share return. Positive, significant relationships were found to exist between financial
performance and all culture measures.
Studies with Mixed Results on the Culture-Performance Relationship
Gelade and Young (2005), studying 1,405 branches from four banks in the UK
and Ireland, hoped to explain organizational performance as a function of climate factors
influencing customer service factors which influence financial performance. Their sample
of over 26,000 respondents identified four organizational variables from the work
environment: (1) commitment, (2) team climate, (3) job enablers, and (4) support climate.
Sales achievement, a financial performance measure of actual bank branch sales as a
percentage of planned sales, obtained a correlation of .31 with the employee perception
factor called commitment. Sales achievement showed weak correlations only with team
climate, job enablers, and support climate. These authors found limited support for the
service profit chain theory where customer satisfaction mediates the relationship between
climate and financial performance.
Koys (2001) investigated the relationships between unit-level measures of
employee satisfaction, organizational citizenship behavior, employee turnover, customer
satisfaction, and financial performance. Two variables were used to reflect financial
performance: profits after controllable expenses and profits after controllable expenses as
a percent of sales. Twenty-eight locations of a restaurant chain participated in the study,
and two samples of data were collected. Sample one had 774 hourly employee
respondents, and sample two had 693 hourly-employee respondents. While employee
38
satisfaction and organizational citizenship behaviors predicted unit-level profitability, the
relationships between these variables were week, providing limited support for the link
between employee perceptions of the work environment and financial performance.
Ogbonna and Harris (2000) examined the relationship between culture and
performance in a study which also examined leadership style. Culture was categorized as
one of four types postulated by Deshpande et al. (1993): (1) competitive, (2) innovative,
(3) bureaucratic, and (4) community. Performance was measured using an index of five
metrics, including (1) customer satisfaction, (2) sales growth, (3) market share, (4)
competitive advantage, and (5) sales volume. The sample for the study came from firms
in the UK, and a single-respondent approach was adopted for the study where a senior
executive was selected as a key respondent from each firm. Responses from 322
organizations were received for a response rate of 34%. Competitive and innovative
cultural traits were directly linked with performance as predicted. Contrary to
expectations, community and bureaucratic cultural traits were not directly related. This
study provided mixed support for the view that organizational culture is directly linked to
the performance of an organization. The linkage found between perceptions of the work
environment and financial performance in this study is weak.
Rousseau (1990b) examined the link between culture and performance in the
context of a fund raising organization. In this study, 32 units of a geographically
dispersed non-profit organization participated in the study. The leader of each unit
received 10 questionnaires to distribute among each unit’s staff. In total, 263
questionnaires were returned for a response rate of 82%. Three organizational culture

39
variables were used in this study: (1) Team-oriented/satisfaction-oriented, (2)
People/security and perceptions, and (3) Task/security. In terms of performance, the
amount of incoming funds raised by each unit was used as the response variable. No
significant positive correlations were found between the perceptions of the work
environment and financial performance. The author speculated whether this finding was a
result of the restricted sample size used for this study.
Studies Not Supporting the Culture-Performance Relationship
Booth and Hamer (2009) studied the impact of cultural factors on financial
performance. Using annual employee survey data from a major retailer with 500
locations in the UK, this study reviewed the impact of several organizational factors and
store characteristic data on sales intensity (revenue per square foot). Results from
multiple regression analysis indicated that the best model generated in the analysis
explained 32.7% of the variance in sales per square foot with the remainder of the
variance in sales intensity remaining unexplained. Store characteristics (such as the
region in which the stores were located, the format of the store, and the hours of
operation) were the most important variables explaining the variance in sales. While
corporate culture played a role in explaining the variation in sales, its significance was
less important overall than the variables representing store characteristics. Two culture
variables were both positively related to sales: the level of employee morale and the level
of employee’s perceptions of workload manageability. Curiously, two variables, job
satisfaction and the other tools and support infrastructure, had negative relationships with
sales. While all four of the culture factors were statistically significant, none played a

40
major role in predicting sales. The key conclusion is that store format had the greatest
impact on predicting sales. Also, the strong culture theory is undermined in that both
positive and negative relationships between culture factors and the response variable
were shown.
Cooil et al. (2009) identified three latent climate variables: self-efficacy vs.
leader’s efficacy, personal empowerment vs. management facilitation, and a measure of
the overall organizational climate. The relationship between these climate variables and
financial performance was examined using data from 107 “superstore” locations of a
large grocery chain located in Europe. Store-level revenue per employee was the final
metric used at the outcome variable in this study. Approximately 360 employees per store
completed the survey for an average response rate of 80% per store. While the overall
organizational climate variable was found to have a modest relationship to employee
retention and customer satisfaction, overall organizational climate, which indicates
overall positive employee perceptions, was not significantly linked to revenue per
employee. The results of this study do not provide support for the link between employee
perceptions of the work environment and financial performance.
Davidson, Coetzee, and Visser (2007) examined the culture-performance link in
an investment banking organization in South Africa using the Denison Organizational
Culture Survey (Denison, 1990) using a sample of 327 employees (response rate of 66%)
from 14 departments of one company. The study reported that this is the first known
study documented of this instrument’s use in the context of South Africa. Five metrics
were used as response variables in this survey: (1) effective tax rate, (2) net interest

41
income/operating income, (3) non-interest revenue/operating income, (4) operating
expenses/operating income, and (5) net income after interest and taxes/operating income.
Top level survey results were as follows: High correlations between the four cultural
traits were reported which suggests, according to these researchers, that the cultural
factors may not be clearly distinguishable; similar results had been obtained in previous
studies indicating that the items may be in fact measuring a single trait instead of four
clearly distinguishable cultural traits. The authors reported that the culture-performance
correlation results were disappointing; very few of the financial ratios used in this study
were significantly correlated with the Denison cultural traits or subscales. Two results
that stood out were as follows: Team orientation was negatively correlated with
profitability. And, higher scores on the consistency trait were related to higher expenses
relative to income and thus the lower the profitability of the organization.
Paradise-Tornow (Paradise-Tornow, 1991) examined the role and impact of
leadership and management in creating a organizational culture emphasizing quality of
service. Twenty-five bank branches of a financial services holding company located in
the Midwest of the U.S. participated in this study, and the sample of respondents was
1,415 employees. The bank branches had a size of 20-128 employees. Dimensions of
employee perceptions gathered in this study were defined as leadership practices,
management culture, and employee connectedness. Various measures of financial
performance were used in this study, including contribution margin ratio. A key finding
of this study is that management culture factors show strong, but negative, relationships
to the financial performance measures. The findings of this study do not support the

42
expected link between positive employee perceptions of the work environment and
financial performance. The authors discuss the implications for these findings, and
suggest that financial performance is a multidimensional variable that relates to more
than management practices or factors within the organizational environment.
Ryan et al. (1996) examined the relationship between attitudes and effectiveness
at group levels, using climate as the shared perceptions of employees. About 5,300
employees from 142 branches of a financial services organization in North America
participated in the study with an average of 41 responses per branch. Dimensions of
employee perceptions of the work environment included three main factors: job/company
satisfaction, supervision, and work group/teamwork. Various response variables were
included in this study, including profit and market share. No clear relationship was found
between attitude measures and financial performance outcomes.
Summary
Organizational culture and organizational climate have maintained a presence in
both the academic and practitioner press because of their perceived ability to explain a
link between organizational environment factors and organizational performance.
Furthermore, these concepts of culture and climate provide a means for to view and better
understand the workings of an organization. Organizational culture and organizational
climate are two closely associated terms which have been used in the study of
organizations. Despite their differing histories and definitions, the literature now reflects
a similarity of the terms despite the lack of agreement on their definitions or the
appropriate methods which should be used to investigate each. Numerous quantitative
43
studies have examined the link between organizational environment factors and financial
performance. Many of these studies found support for this relationship, but others found
results which question the strength of this relationship or whether the relationship exists
between organizational environment factors and financial performance. These studies
were reviewed in this chapter, and Appendix A summarizes each of these studies for
further reference and comparison.

44
CHAPTER 3
METHODS
This chapter describes the research methods employed in this study, and it
provides information on the target population, the data collection process,
instrumentation, descriptions of both predictor and outcome variables, and information
about the data analysis process.
Target Population
The population for this study was employees of a U.S. sales and service
organization of a large, global manufacturing company. The data were obtained by the
host organization using an employee survey that had been completed once every two
years for approximately 18 years. At the time of the survey, the population in question
was 1,615 employees, and 1,518 employees in the population completed the survey for a
response rate of 94.0%. The population was distributed among 100 intact teams located
across the U.S., and each team had the same sales and service objectives with the same
set of products and customer types. Each organization in the study was composed of
individuals performing various roles, including sales, support, training, administration,
and team management.
The data were reviewed to determine if an adequate sample size was represented
in each of the teams. The full size of each team was not available to me, though the size
of each team was estimated to be approximately 16-20 people. Teams with fewer than
eight respondents were eliminated. Including teams with eight or more respondents was
rationalized because a minimal number of teams would be eliminated from the study and

45
each team had at least 40% of the team responding in the survey. Based on this
requirement, four teams were eliminated from the sample because they had fewer than
eight respondents, bringing the total number of respondents to 1,503 over 96 teams.
Data Collection
The survey was paper-based and administered to respondents in employee
meetings held in person in the geography of each team by representatives of the human
resource function. The completed survey forms were sealed in envelopes in the presence
of the employees at the in-person meetings to protect the anonymity of the survey
respondents. The sealed envelopes containing the completed employee survey forms
were mailed to the third-party research organization for processing. The survey research
organization retained by the host organization used scanning technology to transfer
individual survey responses into a data base.
Any research project involving participation of human participants requires
careful consideration to protect them from possible harm (Gall, Gall, & Borg, 2003). The
Institutional Review Board (IRB) process used for this study was exempt from full IRB
committee review under the category of pre-existing data bases. Appendix B shows the
IRB study approval. Various measures were taken by the host organization to protect
participants from harm and ensure candid responses on the instrument. Specific team
membership was identified as a part of the survey, but respondents were not asked to
identify themselves by name. Demographic information, such as function (i.e., marketing,
information technology, finance, etc.), level (i.e., director, exempt professional,
technician, etc.), length of service to the organization, gender, race, and age were all

46
collected on the survey form. However, the survey administrators communicated to
respondents that results of demographic information would be reported only for groups
with at least ten respondents, and they also reported that individual responses would not
be identified. This same promise of anonymity was also printed on the survey forms. The
survey was administered by members of the human resources organization in group
meetings with employees.
A subset of the collected data was provided for the purpose of the present study
directly from the third-party research organization through permission granted by the host
organization. None of the demographic information described above was provided. The
entire data set continues to be housed by the third party survey organization. The host
organization providing permission to use this data for research purposes required that
neither the organization nor industry of which it is a part may be identified by name in
any published documentation associated with the written results of the research.
Instrumentation
A 68 item questionnaire composed of several parts, as shown in Appendix C, was
used to collect perceptions of employees. In approximately 1999, seven years after the
survey was first created, the in-house leader responsible for the employee questionnaire’s
design, implementation, analysis, and feedback significantly redesigned and implemented
revisions to the previous survey using items constructed in-house and using the Baldrige
Quality Criteria (Baldrige National Quality Award, 2000) as a guide. The questionnaire
continued to develop over time, and additional categories of questions were added.
47
Simultaneously, the organization retained a climate survey administrator to assist with the
design, implementation, and analysis of the original instrument.
The items for the survey were grouped into 12 categories: (1) mission and
strategic direction, (2) corporate citizenship, (3) senior management, (4) customer focus,
(5) measurement, (6) operating effectiveness, (7) immediate manager/supervisor, (8)
teamwork, (9) valuing employees, (10) involvement, (11) employee development, and
(12) overall satisfaction. Conforming to advisement on questionnaire construction from
Dillman et al (2009), this survey clustered and labeled items to create visual groupings of
related information to help “respondents to easily process and organize the information
on the page” (Dillman et al., 2009, p. 174). However, this approach also creates a
potential halo effect, making each item in each category dependent rather than
independent, which is a limitation of the survey construction (Scriven, 1991). The survey
used five-point Likert-type scales on all items to assess the level of agreement (strongly
agree, agree, neither agree nor disagree, disagree, or strongly disagree) with each item.
Data collected from previous administrations of this survey were analyzed to
examine the reliability and validity of the questionnaire. Construct validity of the
questionnaire was reported to have been determined by the results of confirmatory factor
analysis conducted by the third-party survey provider, as well as through a review of the
survey with leaders in the organization and subject matter experts from the third-party
survey firm retained by the organization. However, upon additional consultation with a
subject-matter expert implementing the survey, who was an employee of the host
organization, it was revealed that it was a principal components analysis and not a

48
confirmatory factor analysis that was previously conducted on the instrument. In
addition, it was unclear how the study designers came up with the structure of the
instrument after the principal component analysis documentation was reviewed.
Consequently, it was determined that the best approach would be to proceed with an
exploratory factor analysis using the sample provided by the host organization for this
study.
Bartlett’s Test
Bartlett’s test of sphericity was completed to determine if the correlation matrix of
items was an identity matrix (one where none of the variables correlate with one another).
Without correlations among the items, it would not be possible to obtain a factor model,
and there could be as many factors as there are items (Pett, Lackey, & Sullivan, 2003). A
significant result suggests that the sample correlation matrix does not come from a
population in which the correlation matrix is an identity matrix, and the exploratory
factor analysis (EFA) can proceed (Yang, 2005). The p value for this data set was .000,
suggesting that the null hypothesis (that the correlation matrix is an identity matrix) can
be rejected, and the EFA for this study could proceed.
Design of Exploratory Factor Analysis
Several decisions regarding the exploratory factor analysis (EFA) needed to be
made next. The first question was whether to use common factor analysis or principal
component analysis. Yang (2005) recommended common factor analysis over principal
component analysis because organizational studies can be assumed to have some degree
of measurement error, and common factor analysis allows the researcher to interpret the

49
meaning of the results better than is the case with principal component analysis. Taking
Yang’s recommendation, common factor analysis was used for this study. Following the
advisement of Tinsley and Tinsley (1987) and Conway and Huffcutt (2003), principal
axis factoring was selected as the extraction method. Regarding the criterion used to
decide on the number of extracted factors, the Kaiser-Guttman rule of selecting factors,
which suggests retaining factors with eigenvalues greater than 1.00, was used (Pett et al.,
2003). The promax rotation method with kappa set to 4 was used for this research.
Promax is generally thought to produce satisfactory solutions (Fabrigar, Wegener,
MacCallum, & Strahan, 1999). Using an oblique (vs. orthogonal) rotation, such as
promax, was recommended by Yang (2005) who suggested that factors having a degree
of correlation tend to be more realistic for studies in organizational research. The
loadings of measured variables on factors were set at .40 as is common in exploratory
factor analysis (Pett et al., 2003; Yang, 2005). Items were dropped from the final factor
solution if they loaded at less than .40 on all factors or if they loaded greater than .40 on
two or more factors (Hinkin, 2005). Factors were removed from the factor solution if they
were composed of fewer than three items. Finally, coefficient alphas were generated for
the set of items in each factor in the final factor model. A coefficient alpha of .70
provides evidence of strong internal consistency, and it suggests that the sampling
domain has been adequately represented (Hinkin, 2005).

50
Extraction Process
Following these design parameters for the EFA, four iterations of the EFA were
required to obtain a factor model. As noted previously, the instrument had 68 items. After
the first EFA was run, a 12-factor model was produced with 12 items dropped from the
instrument based on the criteria outlined above (see new factor loadings in Appendix D).
The omitted items were removed from subsequent rounds of analysis.
A second EFA was run (see new factor loadings in Appendix E), and an 11-factor
solution was generated. Two additional items were removed because their factor loadings
were less than .40. These two additional items were also excluded from subsequent
rounds of analysis.
A third EFA was run (see new factor loadings in Appendix F), and two additional
items were dropped. Like the second EFA, the third EFA also generated a model with 11
factors. After three rounds of analysis, a total of 16 items were removed from the
instrument.
A fourth and final round of EFA was completed (see new factor loadings in
Appendix G), and all items loaded at .40 or greater on only one factor, and all factors in
the final model had at least three items. The results of the EFA provided a model with 11
factors using 52 items from the instrument.
An examination of the items that were removed during the EFA revealed that
many of the items were vague or open to multiple interpretations by respondents (i.e.,
these individual items in the instrument frequently used the word “and” to join two or
more constructs). See Appendix H for a listing of all items on the original instrument,

51
their original subscale assignments, and the disposition of each item on the final factor
solution. Also, as the extraction process proceeded, list-wise exclusion was used in the
analysis; if a respondent was missing one or more responses to an item, that individual
was removed from the analysis. During this portion of the analysis, 193 respondents had
missing data, and these individuals were dropped from the analysis, leaving a sample of
1,310 in the EFA.
Table 4, Eigenvalues of Extracted Factors with Total Variance Explained, and
Figure 1, Scree Plot of Eigenvalues, show the eigenvalues generated by the extracted
factors. As shown, the eleven extracted factors explained 71% of the total variance. This
level of explained variance meets the rule of thumb explained by Yang (2005) an
adequate EFA should retain factors that explain at least 60-70% of total variance.

52
Table 4
Eigenvalues of Extracted Factors with Total Variance Explained
Initial Eigenvalues
Extraction Sums of
Squared Loadings
Rotation Sums
of Squared
Loadingsa
Factor
Total % of
Variance Cumulative
% Total % of
Variance Cumulative
% Total
1 20.27 38.98 38.98 19.91 38.30 38.30 14.60
2 2.93 5.64 44.62 2.61 5.03 43.32 13.17
3 2.39 4.60 49.22 2.00 3.86 47.18 13.76
4 2.13 4.10 53.31 1.77 3.41 50.59 6.53
5 1.73 3.32 56.64 1.42 2.73 53.32 12.11
6 1.59 3.07 59.70 1.25 2.40 55.71 8.95
7 1.44 2.76 62.46 1.10 2.12 57.84 15.31
8 1.29 2.48 64.94 0.95 1.82 59.66 8.01
9 1.16 2.23 67.18 0.83 1.59 61.25 11.00
10 1.07 2.05 69.23 0.71 1.37 62.62 10.94
11 1.01 1.94 71.17 0.66 1.26 63.88 11.89
Extraction Method: Principal Axis Factoring. a. When factors are correlated, sums of squared loadings cannot be added to obtain a total variance.
A scree test is another approach to determining the number of extracted factors
(Pett et al., 2003; Yang, 2005). The scree plot depicts the eigenvalues in descending order
of magnitude. Although difficult to see unless the plot is magnified considerably, the
distinct break in the slope lines between values identifies the number of factors (Pett et
al., 2003).

53
Figure 1. Scree plot of eigenvalues
Cronbach’s alpha coefficients for all measurements on the items on this
instrument were previously calculated by the host organization and the third party survey
provider to examine the reliability of the questionnaire. Cronbach’s alpha coefficients for
all subscales on the survey were reported to be acceptable, ranging from .85 to .90. Table
5 shows the correlations among extracted factors and Cronbach’s alphas for each factor
based on an analysis of the data used in this study. In addition, Yang (2005) advised that,
when an oblique solution is used, the structure matrix should also be reported (see
Appendix I). The structure matrix is used for generating factor scores, a procedure
described later in this chapter.

54
Table 5
Correlations Among Extracted Factors (Cronbach’s Alphas in Parentheses)
Factor 1 2 3 4 5 6 7 8 9 10 11
1 (.90)
2 .56 (.94)
3 .63 .51 (.91)
4 .38 .32 .44 (.82)
5 .51 .57 .58 .28 (.87)
6 .51 .46 .44 .29 .48 (.88)
7 .72 .62 .68 .35 .69 .55 (.88)
8 .46 .41 .49 .38 .40 .39 .51 (.81)
9 .52 .44 .61 .42 .62 .44 .59 .38 (.85)
10 .64 .57 .49 .29 .51 .40 .57 .36 .47 (.87)
11 .56 .59 .56 .36 .61 .45 .63 .44 .54 .58 (.83)
Finally, Yang (2005) suggested that communalities should be reported in
exploratory factor analyses. Communality estimates explain variance in each item that is
explained by the extracted factors. Communalities are reported in Table 6.

55
Table 6 Communalities of Observed Variables in Extracted Factor Model
Item Initial Extraction Item Initial Extraction Item Initial Extraction
q01 0.58 0.70 q22 0.59 0.60 q47 0.65 0.64
q02 0.56 0.64 q23 0.59 0.58 q48 0.62 0.73
q03 0.52 0.58 q24 0.56 0.55 q49 0.59 0.60
q04 0.49 0.48 q25 0.64 0.65 q50 0.75 0.77
q06 0.49 0.54 q26 0.64 0.64 q51 0.55 0.56
q07 0.59 0.81 q28 0.65 0.65 q52 0.64 0.67
q08 0.44 0.48 q29 0.75 0.71 q53 0.66 0.69
q09 0.65 0.66 q30 0.80 0.80 q54 0.58 0.55
q10 0.65 0.66 q31 0.72 0.72 q55 0.70 0.71
q11 0.56 0.55 q32 0.64 0.65 q59 0.63 0.71
q12 0.67 0.69 q33 0.77 0.77 q60 0.68 0.78
q13 0.71 0.73 q34 0.66 0.63 q61 0.60 0.65
q14 0.69 0.70 q35 0.66 0.73 q63 0.65 0.66
q15 0.52 0.49 q36 0.61 0.72 q64 0.58 0.61
q16 0.53 0.49 q38 0.60 0.64 q65 0.55 0.60
q17 0.55 0.52 q43 0.55 0.63 q66 0.67 0.74
q18 0.47 0.42 q44 0.60 0.74
q19 0.42 0.40 q45 0.57 0.59

56
Interpreting Factors
Pett et al. (2003) provided some guidance on interpreting factors. Pedhazur and
Schmelkin (1991) suggested that items that were selected as representing similar aspects
of a phenomenon should share high loadings on the same factors, and the observed
variables should lead to a factor useful for defining a construct. Comrey and Lee (1992)
suggested that loadings of .45 (indicating 20% shared variance) should be considered
“fair,” loadings of.55 (indicating 30% shared variance) should be considered “good,”
loadings of .63 (indicating 40% shared variance) should be considered “very good,” and
loadings of .71 (indicating 50% shared variance) should be considered excellent. Comrey
and Lee (1992) provided some conditions to facilitate the process of interpreting factors.
The higher the factor loading, the more the factor is like the item. Also, the greater the
number of items with high loadings on a factor, the easier it is to isolate what the factor
represents. In terms of naming factors, Pett et al. (2003) suggested that if the items for an
EFA were derived from a conceptualization, then the researcher should return to the
original conceptualization to name the factors.
As noted previously, the instrument was constructed to reflect a 12 factor model.
The results of the obtained EFA indicated that four of the original factors were
unchanged, and these were previously named “Corporate Citizenship,” “Senior
Management,” “Immediate Manager/Supervisor,” and “Involvement.” These remain
appropriate labels. In addition, four of the original factors had one or more items that
were removed from the original factor design because one or more of the individual items
failed to load at .40 or higher. These factors were named “Mission and Strategic

57
Direction,” “Teamwork,” “Employee Development,” and “Overall Satisfaction.”, These
labels still are appropriate. Three of the previous factors, “Customer Focus,”
“Measurement,” and “Operating Effectiveness” were extracted as one factor, but three of
the items in this grouping were dropped in the extracted factor solution. The label for this
factor in the final solution is Operational Effectiveness. Finally, the factor previously
called “Valuing Employees” produced two factors in the extracted solution, and some of
the items previously loading into this factor were also eliminated in the final solution.
The two factors from the previous category called “Valuing Employees” were renamed
“Inclusion” and “Pay and Rewards.” Definitions of each of the factors are found in Table
7.
Table 7
Factor Definitions
Factor High ratings indicate that respondents have a favorable impression of…
Factor 1 - Operational Effectiveness
“any number of practices that allow a company to better utilize its inputs by, for example, reducing defects in products or developing better products faster” (Porter, 1996, p. 62).
Factor 2 - Immediate Managers/Supervisor
the individuals directing the work of survey respondents and responsible for the system of action for coping with complexity by planning, budgeting, organizing, staffing, problem solving, and controlling for results (Kotter, 1990).
Factor 3 - Senior Management
the individuals in senior corporate roles who are responsible for the system of action for coping with organizational change by setting direction, aligning people, and motivating and inspiring people (Kotter, 1990).

58
Factor High ratings indicate that respondents have a favorable impression of…
Factor 4 - Mission the organization’s reason for its existence combined with an explanation of its strategic framework describing the desired future state, key values, and major goals (Hill & Jones, 2009).
Factor 5 - Valuing Employees
the human resources practices of an organization involving the treatment of people and including the promotion of safe working conditions, employee welfare, and employee recognition (Flamholtz & Kannan-Narasimhan, 2005).
Factor 6 - Training the process of developing knowledge and expertise in people (Swanson & Holton III, 2001).
Factor 7 – Involvement the process of gaining organization members’ input into decisions that affect organization performance and employee well-being (Cummings & Worley, 1997).
Factor 8 - Corporate Social Responsibility
the economic, legal, discretionary, and philanthropic expectations that society has of the organization at a given point in time (Carroll, 1991).
Factor 9 – Satisfaction “positive emotional reactions to a particular job. It is an affective reaction to a job that results from the person's comparison of actual outcomes with those that are desired, anticipated or deserved” (Oshagbemi, 1999, p. 338)
Factor 10 - Teamwork group(s) of interdependent individuals who hare a common purpose, have common work methods, and hold each other accountable (Katzenbach & Smith, 1993).
Factor 11 - Inclusion a climate for truly valuing, not just accepting, differences in people in order to maximize its performance benefits (McLean, 2005).
Team Level Predictor Variables
To compare the employee perceptions of the organizational environment factors
with financial performance, both individual factor scores and team factor scores of the

59
organizational environment needed to be estimated to enable a regression analysis of a
possible relationship. Factor scores are composite variables that provide information
about an individual’s placement on a set of factors (DiStefano, Zhu, & Mindrila, 2009),
and they are generated using a linear combination of the observed variables loading onto
each factor (Pett et al., 2003). The generation of factor scores can be used after an EFA
when the objective is to identify a set of variables for inclusion in a subsequent statistical
analysis (Hair, Anderson, Tatham, & Black, 1995). While there are several approaches to
generating factor scores, the factor scores in this study were estimated for each
respondent using a regression approach (DiStefano et al., 2009; Pett et al., 2003). The
regression approach for generating factor scores was selected for this study because this
procedure is thought to maximize the validity of estimates because each respondent’s
location on each factor is predicted by the factor score (DiStefano et al., 2009), and it
reflects a possible correlation among scores reflecting the oblique rotation used in the
study’s EFA (Pett et al., 2003). Factor scores generated by regression are standard scores
having a mean equal to 0 and a variance equal to the squared multiple correlation
between the estimated factor scores and the true factor values (Pett et al., 2003).
Factor scores for this study were generated using SPSS. All of a respondents’
scores on the observed variables on the instrument were standardized, weighted by a
generated factor structure coefficient (see Appendix I) for the factor under consideration,
and then summed across all items (Pett et al., 2003). This portion of the analysis yielded a
factor score per individual. Restated differently, each recipient’s actual response on each
of the 52 final items in the instrument was standardized. The standardized scores of the
60
respondents were multiplied by the factor structure coefficient for each item on a given
factor. These products were then summed to produce a factor score. Loadings for each of
the 52 items were different for each of the 11 factors. This linear combination of
individual responses on the instrument multiplied by the factor structure coefficient for an
individual factor was repeated for each of the eleven factors. Using the regression
approach, eleven factor scores were generated for each respondent.
In order to compare organizational environment factors at the team level with
financial performance variables at the team level, team organizational environment factor
scores needed to be generated. Team factor scores were created by generating a mean of
each respondent’s factor score within a team. The result was eleven average factor scores
per team. Table 8 shows descriptive statistics (means and standard deviations) for the
team factor scores that are the predictor variables of this study.

61
Table 8
Descriptive Statistics of Team Level Organizational
Environment Factor Scores (n=93)
Factor Factor Name Mean SD
Factor 1 Operational Effectiveness -.01 .38
Factor 2 Immediate Manager/Supervisor .00 .41
Factor 3 Senior Management -.01 .34
Factor 4 Mission .01 .27
Factor 5 Valuing Employees .00 .32
Factor 6 Training .00 .38
Factor 7 Involvement .00 .35
Factor 8 Corporate Social Responsibility .01 .32
Factor 9 Satisfaction -.01 .31
Factor 10 Teamwork .00 .37
Factor 11 Inclusion -.01 .30
Outcome Variables
The outcome variables for this study are measures of financial performance called
contribution margin ratio; the contribution margin ratio is calculated by dividing
operating income by revenue (Magoon, 2008). At approximately the start of the first
quarter of this study, the management of the sales and service organization was changing
its focus from top line revenue to contribution margin ratio. The organization provided
financial performance data for each of the teams in the target population of the study.

62
Contribution margin ratio for each team was measured at the end of four consecutive
quarters. In addition, the entire period, a fiscal year made up of the same four quarters,
was provided to the researcher. The climate survey was administered to the entire
population in the three week period immediately following the close of the second
quarter. In summary, this study had five outcome variables, shown in Table 9: the
contribution margin ratios calculated after quarters one, two, three, and four, and the
contribution margin ratio for the entire fiscal year.
Table 9
Descriptive Statistics of Team Level Financial
Performance
Variable Mean SD Valid n
Financial Performance Q1 .69 .05 93
Financial Performance Q2 .69 .03 93
Financial Performance Q3 .67 .05 92
Financial Performance Q4 .67 .04 92
Financial Performance FY .68 .03 93
Methods for Data Analysis
With factor scores for each subscale per team for the work environment and
outcome variables for each team for financial performance, correlation and regression
analyses were used to answer the research questions. Correlation analysis was used to
determine the relationship between individual variables. Regression analysis was used to
seek the best combination of predictor variables to explain the variance in a single

63
outcome variable. In particular, stepwise regression analysis was used to identify a
regression model that contained those predictors that maximize R2 and minimize the sum
of squares error (Bates, 2005). Stepwise regression employs forward selection and
backward elimination simultaneously, and it is effective when there is little theoretical
basis for choosing one variable over another (Wand, 2003).
According to the Minitab Handbook (B. F. Ryan, Joiner, & Cryer, 2005), the
software used for the regression analysis, Minitab combines both forward selection and
backwards elimination, testing at each stage for variables that should be included or
excluded. Minitab first fit all regression models with one predictor, the variable with the
lowest p-value. This variable was added to the equation if the p-value was less than the
Alpha to Enter. For this study, the Alpha to Enter and the Alpha to Remove were both set
at .15, the Minitab default for stepwise regression. These alpha values are somewhat
liberal, and they increase the potential for Type 1 errors. However, this study had a large
number of predictor variables, and there was an interest in using all of the predictor
variables in the analysis. I reasoned that using a more liberal approach may help to
narrow the list of predictor variables. If a variable entered the model, Minitab then
attempted to add an additional variable to the first, again by entering the remaining
variables one at a time using the smallest p-values as criteria. Next, Ryan et al. (2005)
reported:
At this point in the procedure, Stepwise looks to see if any other variables in the
equation (other than the one that was just entered) can be removed. At this stage,
there is just one possible variable to remove… Later, when the equation contains

64
more variables, there will be many more candidates [for removal]. The variable
with the largest p-value is removed, provided its p-value is larger than the value
specified than the Alpha to Remove…If no variable has a p-value larger than the
Alpha to Remove, Stepwise goes on to the next step, where it attempts to enter
another predictor. (p. 420)
The ability to eliminate variables already in the model is a distinguishing feature of
stepwise regression from simple forward regression models (Hair et al., 1995). The
stepwise procedure continues in this fashion until the variables making up the model
were identified and reported in the output. After the variables were identified by the
stepwise regression, a regression analysis containing the regression equation was
generated along with the adjusted R2 and other information.
Summary
This chapter described the methods of the study. The target population for this
study was the employees of a U.S.-based sales and service division of a large, global
manufacturer. A paper-based survey instrument with 68 items was administered to the
entire population within a three-week period. Of the 1,615 employees in the host
organization, 1,518 responses were collected for a response rate of 94%. An exploratory
factor analysis was conducted, and a factor model with 11 subscales was generated from
52 items after four iterations of the factor analysis. Individual-level factor scores on each
subscale were generated using the regression method in SPSS, and team-level scores
were created by generating a mean of each respondent’s factor score within a team. This
procedure generated one factor score for each of the 11 factors per team, and these scores

65
were the predictor variables for this study. The outcome variable for this study was
contribution margin ratio at the team level. This financial performance variable was
gathered for the two quarters prior to the administration of the survey and the two
quarters following the administration of the survey, as well as the entire fiscal year
overall. Correlation analysis and step-wise regression analysis were used to determine
whether there was a relationship between any of the team-level organizational
environmental factor scores and the team-level financial performance results.

66
CHAPTER 4
RESULTS
This chapter reports the results of this study: correlation analysis and regression
analysis. Table 10 reports descriptive statistics for all variables of interest.
Table 10
Descriptive Statistics of All Variables of Interest
Variable Variable Description n M SD
Factor 1 Operational Effectiveness 93 -.01 .38
Factor 2 Immediate Manager/Supervisor 93 .00 .41
Factor 3 Senior Management 93 -.01 .34
Factor 4 Mission 93 .01 .27
Factor 5 Valuing Employees 93 .00 .32
Factor 6 Training 93 .00 .38
Factor 7 Involvement 93 .00 .35
Factor 8 Corporate Social Responsibility 93 .01 .32
Factor 9 Satisfaction 93 -.01 .31
Factor 10 Teamwork 93 .00 .37
Factor 11 Inclusion 93 -.01 .30
Financial Performance Q1 Contribution Margin Ratio – Q1 93 .69 .05
Financial Performance Q2 Contribution Margin Ratio – Q2 93 .69 .03
Financial Performance Q3 Contribution Margin Ratio – Q3 92 .67 .05
Financial Performance Q4 Contribution Margin Ratio – Q4 92 .67 .04
Financial Performance FY Contribution Margin Ratio – Fiscal Year 93 .68 .03

67
Correlation Analysis
Table 11 shows the correlations of all variables. Cohen (1988) suggested that
interpreting the size of a correlation is somewhat arbitrary and should not be observed too
strictly. For educational research, McMillan (2008), suggested that a correlation between
.10 and .30 is a small or weak relationship, a correlation between .40 and .60 is a
moderate relationship, and a correlation of .70 and above shows a high relationship.
Based on these guidelines, correlations between these categories, such as those between
.31 and .39 can be considered weak to moderate. Similarly, correlations between .61 and
.69 can be considered moderate to strong.
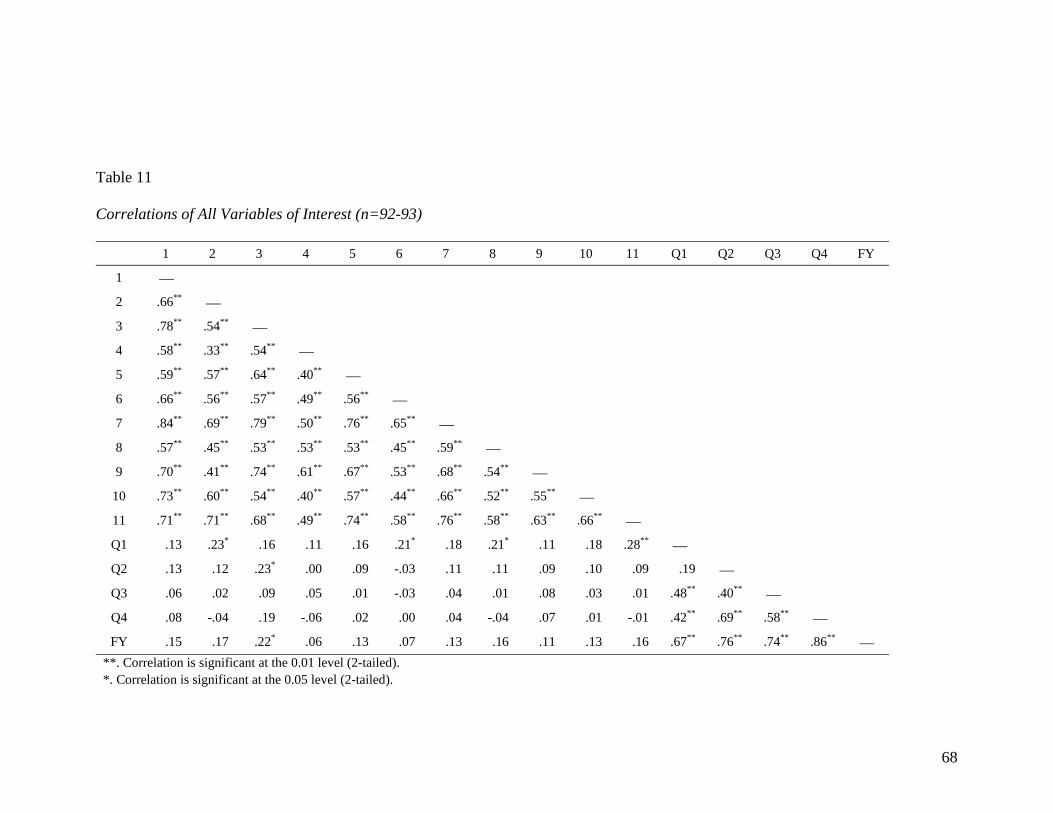
68
Table 11
Correlations of All Variables of Interest (n=92-93)
1 2 3 4 5 6 7 8 9 10 11 Q1 Q2 Q3 Q4 FY
1
2 .66**
3 .78** .54**
4 .58** .33** .54**
5 .59** .57** .64** .40**
6 .66** .56** .57** .49** .56**
7 .84** .69** .79** .50** .76** .65**
8 .57** .45** .53** .53** .53** .45** .59**
9 .70** .41** .74** .61** .67** .53** .68** .54**
10 .73** .60** .54** .40** .57** .44** .66** .52** .55**
11 .71** .71** .68** .49** .74** .58** .76** .58** .63** .66**
Q1 .13 .23* .16 .11 .16 .21* .18 .21* .11 .18 .28**
Q2 .13 .12 .23* .00 .09 -.03 .11 .11 .09 .10 .09 .19
Q3 .06 .02 .09 .05 .01 -.03 .04 .01 .08 .03 .01 .48** .40**
Q4 .08 -.04 .19 -.06 .02 .00 .04 -.04 .07 .01 -.01 .42** .69** .58**
FY .15 .17 .22* .06 .13 .07 .13 .16 .11 .13 .16 .67** .76** .74** .86**
**. Correlation is significant at the 0.01 level (2-tailed). *. Correlation is significant at the 0.05 level (2-tailed).

69
Twenty-three of the relationships between culture variables were considered high or
strong, and 32 of the relationships between culture variables were considered moderate. The
strongest correlation, with a value of .84, was between Environment Factor 1 (Operational
Effectiveness) and Environment Factor 7 (Involvement). The two environment factors with
high correlations with the most other factors were Factor 1 (Operational Effectiveness) and
Factor 11 (Inclusion), each having strong correlations with seven other environment factors.
As a reference point for understanding these results, the instrument was administered
immediately following the completion of second quarter. Financial results from the first
quarter demonstrated a weak relationship with four of the eleven environment factors: Factor
2 (Immediate Manager/Supervisor), Factor 6 (Training), Factor 8 (Corporate Social
Responsibility), and Factor 11 (Inclusion). Financial results from the second quarter
demonstrated a weak relationship with only one of the eleven environment factors, Factor 3
(Senior Management). Financial results from the third quarter showed no relationship with
any of the organizational environment factors. Financial results from fourth quarter
demonstrated a weak relationship with only one of the environment factors, Factor 3 (Senior
Management). Finally, the financial performance for the fiscal year overall showed only one
significant, but weak, relationship to an environment factor, and this was to Factor 3 (Senior
Management).
Based on correlation analysis, alone, there is no to weak relationship between the
environment factors and financial performance.

70
Regression Analysis
Regression analysis for each of the five outcome variables are addressed in this
section.
First Quarter Financial Results
The stepwise regression procedure for the financial results from first quarter showed
that only Factor 11, Inclusion, could be used to explain financial performance for the first
quarter given the regression parameters. The results of this regression analysis are shown in
Tables 12, 13, and 14. The environment factor called Inclusion explained 6.7% of the
variation in first quarter financial results. The regression equation is Q1 = 0.688 + 0.0458
F11 (Inclusion).
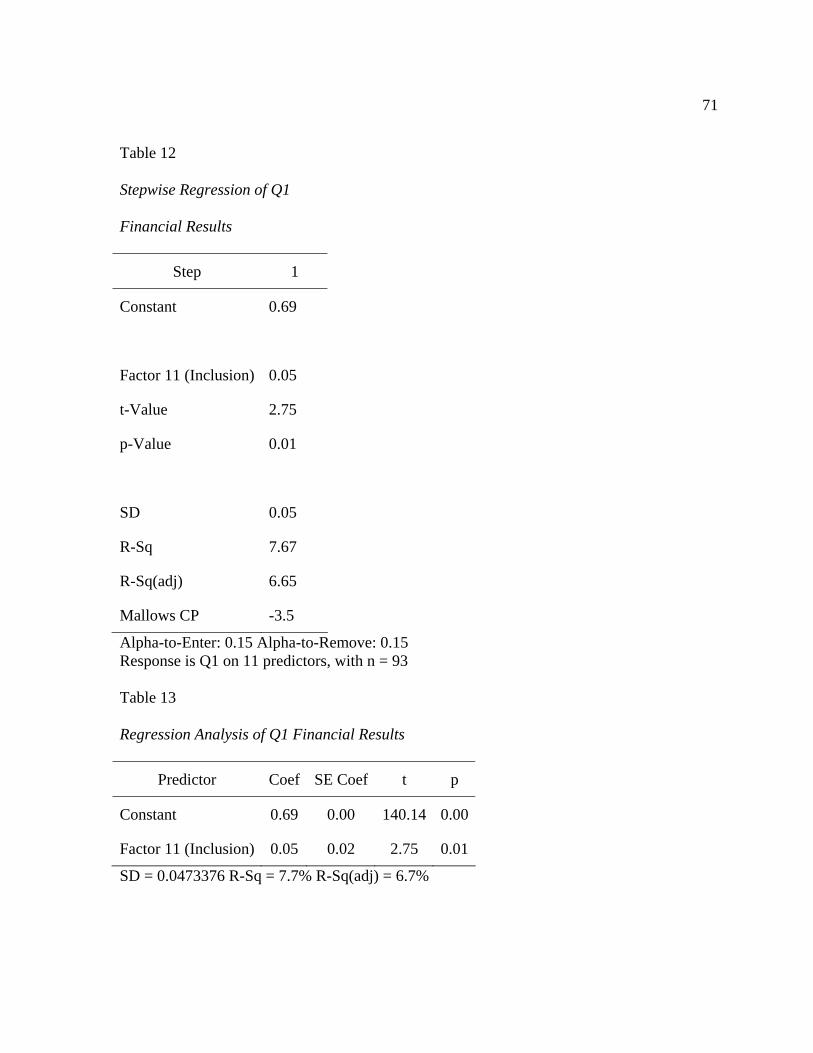
71
Table 12
Stepwise Regression of Q1
Financial Results
Step 1
Constant 0.69
Factor 11 (Inclusion) 0.05
t-Value 2.75
p-Value 0.01
SD 0.05
R-Sq 7.67
R-Sq(adj) 6.65
Mallows CP -3.5
Alpha-to-Enter: 0.15 Alpha-to-Remove: 0.15 Response is Q1 on 11 predictors, with n = 93 Table 13
Regression Analysis of Q1 Financial Results
Predictor Coef SE Coef t p
Constant 0.69 0.00 140.14 0.00
Factor 11 (Inclusion) 0.05 0.02 2.75 0.01
SD = 0.0473376 R-Sq = 7.7% R-Sq(adj) = 6.7%

72
Table 14
Analysis of Variance of Q1 Financial Results
Source DF SS MS F P
Regression 1 0.02 0.02 7.56 0.01
Residual Error 91 0.20 0.00
Total 92 0.22
Second Quarter Financial Results
The stepwise regression procedure for the financial results from second quarter
showed that Factors 3 and 6, Senior Management and Training, respectively, can be used to
explain financial performance for second quarter. The results of this regression analysis are
shown in Tables 15, 16, 17, and 18. Taken together, the two factors, Senior Management and
Training, explain 7.2% of the variance in the financial performance for second quarter. The
regression equation is Q2 = 0.691 + 0.0363 F3 (Senior Management) - 0.0208 F6 (Training).

73
Table 15
Stepwise Regression of Q2 Financial Results
Step 1 2
Constant 0.69 0.69
Factor 3 (Senior Management) 0.02 0.04
t-Value 2.26 3.00
p-Value 0.03 0.00
Factor 6 (Training) -0.02
t-Value -1.96
p-Value 0.05
SD 0.03 0.03
R-Sq 5.29 9.18
R-Sq(adj) 4.25 7.17
Mallows CP -1.5 -3.1
Alpha-to-Enter: 0.15 Alpha-to-Remove: 0.15 Response is Q1 on 11 predictors, with n = 93
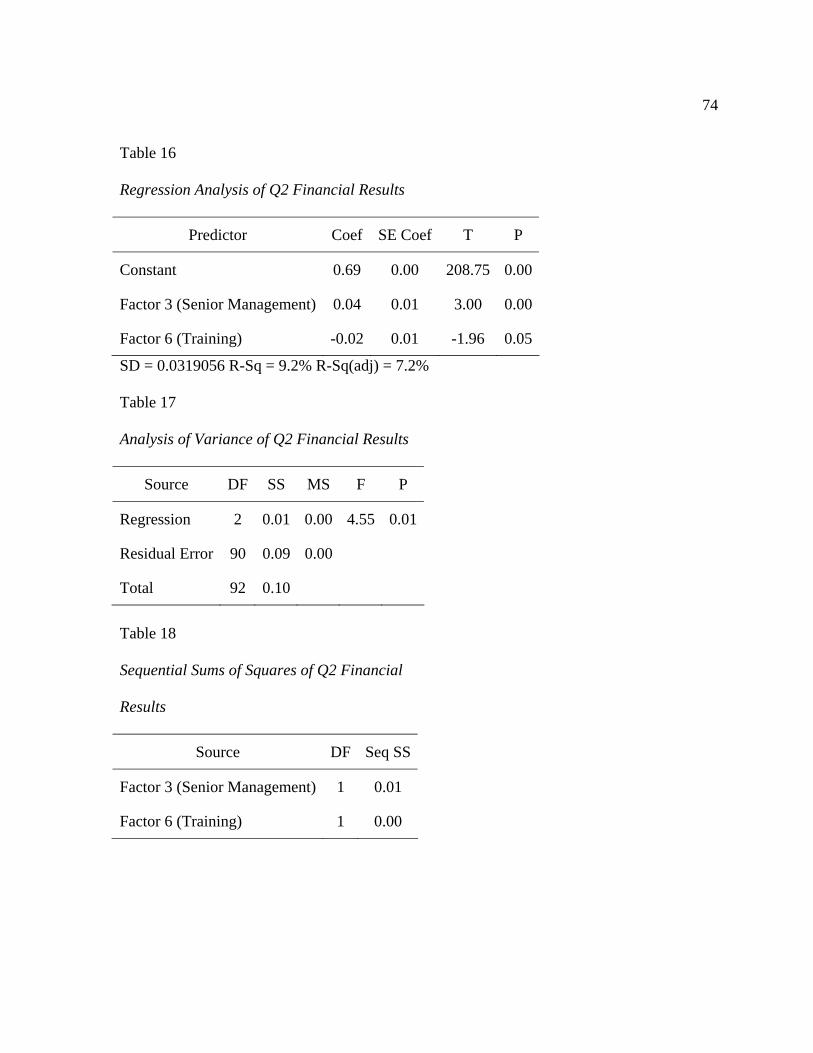
74
Table 16
Regression Analysis of Q2 Financial Results
Predictor Coef SE Coef T P
Constant 0.69 0.00 208.75 0.00
Factor 3 (Senior Management) 0.04 0.01 3.00 0.00
Factor 6 (Training) -0.02 0.01 -1.96 0.05
SD = 0.0319056 R-Sq = 9.2% R-Sq(adj) = 7.2% Table 17
Analysis of Variance of Q2 Financial Results
Source DF SS MS F P
Regression 2 0.01 0.00 4.55 0.01
Residual Error 90 0.09 0.00
Total 92 0.10
Table 18
Sequential Sums of Squares of Q2 Financial
Results
Source DF Seq SS
Factor 3 (Senior Management) 1 0.01
Factor 6 (Training) 1 0.00

75
Third Quarter Financial Results
With regard to the financial results from third quarter, none of the environment
factors entered the regression model using an alpha of .15. No regression equation was
generated for this response variable. None of the employee perception variables are better
able to predict response of financial performance better than the mean value of Quarter 3
financial results.
Fourth Quarter Financial Results
The stepwise regression procedure for the financial results from fourth quarter
showed that Factors 3 and 4, Senior Management and Mission, respectively, can be used to
explain financial performance for second quarter. The results of this regression analysis are
shown in Tables 19, 20, 21, and 22. Taken together, the two factors, Senior Management and
Mission, explain 5.3% of the variance in the financial performance for fourth quarter. The
regression equation is Q4 = 0.669 + 0.0362 F3 (Senior Management) - 0.0318 F4 (Mission).

76
Table 19
Stepwise Regression of Q4 Financial Results
Step 1 2
Constant 0.67 0.67
Factor 3 (Senior Management) 0.022 0.036
t-Value 1.84 2.61
p-Value 0.07 0.01
Factor 4 (Mission) -0.03
t-Value -1.91
p-Value 0.06
SD 0.04 0.04
R-Sq 3.61 7.42
R-Sq(adj) 2.54 5.34
Mallows CP -1.0 -2.5
Alpha-to-Enter: 0.15 Alpha-to-Remove: 0.15 Response is Q1 on 11 predictors, with n = 92 n (cases with missing observations) = 1, n (all cases) = 93

77
Table 20
Regression Analysis of Q4 Financial Results
Predictor Coef SE Coef T P
Constant 0.67 0.00 175.99 0.00
Factor 3 (Senior Management) 0.04 0.01 2.61 0.01
Factor 4 (Mission) -0.03 0.02 -1.91 0.06
SD = 0.0364197 R-Sq = 7.4% R-Sq(adj) = 5.3% Table 21
Analysis of Variance of Q4 Financial Results
Source DF SS MS F P
Regression 2 0.01 0.00 3.57 0.03
Residual Error 89 0.12 0.00
Total 91 0.13
Table 22
Sequential Sums of Squares of Q4 Financial
Results
Source DF Seq SS
Factor 3 (Senior Management) 1 0.00
Factor 4 (Mission) 1 0.00
Fiscal Year Financial Results
The stepwise regression procedure for the financial results from the fiscal year
showed that only Factor 3, Senior Management, can be used to explain financial performance

78
for the fiscal year given the regression parameters. The results of this regression analysis are
shown in Tables 23, 24, and 25. The factor called Senior Management explains 3.6% of the
variation in the financial results of the fiscal year. The regression equation is FY = 0.683 +
0.0187 F3 (Senior Management).
Table 23
Stepwise Regression of Fiscal Year
Financial Results
Step 1
Constant 0.68
Factor 3 (Senior Management) 0.02
t-Value 2.11
p-Value 0.04
SD 0.03
R-Sq 4.68
R-Sq(adj) 3.64
Mallows CP -5.0
Alpha-to-Enter: 0.15 Alpha-to-Remove: 0.15 Response is Q1 on 11 predictors, with n = 93

79
Table 24
Regression Analysis of Fiscal Year Financial Results
Predictor Coef SE Coef T P
Constant 0.68 0.00 231.69 0.00
Factor 3 (Senior Management) 0.02 0.01 2.11 0.04
SD = 0.0283965 R-Sq = 4.7% R-Sq(adj) = 3.6% Table 25
Analysis of Variance of Fiscal Year Financial
Results
Source DF SS MS F P
Regression 1 0.00 0.00 4.47 0.04
Residual Error 91 0.07 0.00
Total 92 0.08
Summary
This chapter showed the Pearson correlations between each of the variables and the
regression analyses for each of the outcome variables for this study. Results suggest that
there is at best a weak relationship between employee perceptions of the work environment
and financial performance. This study found that five organizational environment factors had
a weak relationship to at least one financial performance variable. These organizational
environment factors were Factor 2 (Immediate Manager/Supervisor), Factor 3 (Senior
Management), Factor 6 (Training), Factor 8 (Corporate Social Responsibility), and Factor 11
(Inclusion). This study also found that six organizational environment factors had no
80
relationship to financial performance, and these factors were Factor 1 (Operational
Effectiveness), Factor 4 (Mission), Factor 5 (Valuing Employees), Factor 7 (Involvement),
Factor 9 (Satisfaction), and Factor 10 (Teamwork).
The results of the regression analysis revealed that organizational environment factors
can explain only a single-digit percentage of the variation in financial performance some of
the time, reinforcing the key finding of this study. The four environmental factors most able
to explain the variation in financial performance were Senior Management, Training,
Mission, and Inclusion. However, these four factors can explain only single-digit percentages
of the variance in financial performance.
81
CHAPTER 5
SUMMARY, DISCUSSION, IMPLICATIONS, AND RECOMMENDATIONS
The purpose of this chapter is to summarize the purpose and methods of the study,
present conclusions based on the findings of the study, provide discussion of the research
findings, review the limitations of this study, discuss implications for human resource
development practice, and offer recommendations for human resource development research
and theory.
Summary
Interest in organizational environments continue to be a source of interest for both
practitioners and researchers (Ashkanasy et al., 2011b), and part of this interest is due to an
apparent assumption of linkage between employee perceptions of the work environment and
organizational performance. While organizational performance can be described using many
measures (Venkatraman & Ramanujam, 1986), both practitioners and researchers have
maintained an interest in the financial performance of organizations and its potential
relationship with organizational environment factors (Lim, 1995; Sackmann, 2011; Siehl &
Martin, 1990; Wilderom et al., 2000). While many previously published studies have
examined the relationship between employee perceptions of the work environment and
financial performance of an organization (see Appendix A for summaries of these studies
from the organizational culture/climate literature), the results of this question can so far be
considered inconclusive. Many studies have found support for this linkage (Borucki &
Burke, 1999; Calori & Sarnin, 1991; Denison, 1984; Denison & Mishra, 1995; Flamholtz,
2001; Flamholtz & Kannan-Narasimhan, 2005; Flatt & Kowalczyk, 2008; Gordon &

82
DiTomaso, 1992; Hansen & Wernerfelt, 1989; Harter et al., 2002; Johnson et al., 2009;
Kotter & Heskett, 1992; Leung, 1997; Marcoulides & Heck, 1993; Petty et al., 1995;
Schneider et al., 2003; Schulte et al., 2009; Sorensen, 2003; Thompson, 1996; Van De
Voorde et al., 2010; Van Der Post et al., 1998), while several others have found mixed results
(Gelade & Young, 2005; Koys, 2001; Ogbonna & Harris, 2000; Rousseau, 1990b) or little to
no support (Booth & Hamer, 2009; Cooil et al., 2009; Davidson et al., 2007; Paradise-
Tornow, 1991; A. M. Ryan et al., 1996) for this relationship. This study was conducted to
shed further light into this topic using 1,296 respondents in 93 teams from a sales and service
organization of a large, global manufacturer located in the Midwest of the U.S.
Purpose and Research Question
The purpose of this study was to determine if there is a relationship between
organizational environment factors and financial performance. Several challenges are present
in a study such as this, including assessing organizational environment factors, assessing
organizational performance, and demonstrating a convincing link between the two. To assess
the organizational environment, employee perceptions of the work environment were used
from a previously collected data base based on an instrument containing 68 items. An
exploratory factor analysis was conducted. The EFA yielded a factor model with 11 factors
from 52 of the items in the instrument, compared with the original instrument that contained
12 factors from the 68 items. Factor scores were generated at the individual level for each
respondent using a multiple regression procedure. Team-level factor scores were generated
by computing a mean of each factor score from individual factor scores from members of
each team (Pett et al., 2003). Each of the 93 teams in the correlation and regression analysis,
83
then, had one factor score for each of the eleven factors. To assess financial performance,
five response variables at the team level were examined as a part of this study. These five
response variables were the contribution margin ratio (a measure of profitability) for the two
financial quarters before the survey was administered, the two financial quarters after the
survey was administered, and the entire four-quarter period overall. As noted, correlation and
regression analyses were conducted to determine if a link exists between employee
perceptions of the organizational environment and financial performance.
Results
The results of the correlation and regression analyses revealed that, at best, there is a
weak relationship between employee perceptions of the work environment and financial
performance.
First Quarter Financial Results. The correlation analysis for the financial results
from the first quarter demonstrated that only 4 of the 11 organizational environment factors
demonstrated a significant, but weak, relationship to financial performance in the first
quarter, the highest correlation at .28. These four factors were Factor 2 (Immediate
Manager/Supervisor), Factor 6 (Training), Factor 8 (Corporate Social Responsibility), and
Factor 11 (Inclusion). The regression analysis for first quarter financial results found that
only Factor 11 (Inclusion) could be used to explain financial performance for the first
quarter, explaining 6.7% of the variation in first quarter financial results.
Second Quarter Financial Results. The correlation analysis for the financial results
from the second quarter found only one organizational environment factor, Factor 3 (Senior
Management), with a significant, weak relationship with second quarter financial results.

84
However, the regression analysis showed that two factors, Factor 3 (Senior Management) and
Factor 6 (Training), explained 7.2% of the variance in second quarter financial performance.
Third Quarter Financial Results. No correlations were found to be significant
between any of the 11 organizational environment factors and third quarter financial
performance. Similarly, none of the organizational environment variables could be used in
the regression analysis to explain the variation in third quarter financial results.
Fourth Quarter Financial Results. Financial results from the fourth quarter
demonstrated a weak significant relationship with only one of the organizational environment
factors, Factor 3 (Senior Management). The regression analysis showed that two
organizational environment factors, Factor 3 (Senior Management) and Factor 4 (Mission),
explained 5.3% of the variance in fourth quarter financial performance.
Fiscal Year Financial Results. Finally, the financial performance for the fiscal year
overall showed only one significant, but weak, relationship to an organizational environment
factor, Factor 3 (Senior Management). The regression analysis, likewise, found that only
Factor 3 (Senior Management) explained the variance in fiscal year financial performance for
the fiscal year, and that explanation was only 3.6% of variation.
Conclusions
The literature has not shown a clear connection between employee perceptions of the
work environment and financial performance outcomes. The goal of the present study was to
explore the relationship between employee perceptions and financial performance. The large,
existing data base of employee perceptions along with the actual financial performance of
each of the teams in the host organization provided a unique opportunity study this question.

85
This study concludes that employee perceptions of organizational environment factors have,
at best, a weak relationship to financial performance.
Discussion
The results of this study illuminate limitations on the claims of a link between
organizational environment factors and financial performance. This study found, at best,
weak support for the relationship between employee perceptions of organizational
environment factors and financial performance. These results stand in counterpoint to the
propositions and beliefs that a strong link exists between organizational environment factors
and financial performance coming from both the practitioner press (Collins & Porras, 1994;
Katzenbach, 2000; Kotter & Heskett, 1992; Peters & Waterman, 1982) and the academic
press (Borucki & Burke, 1999; Calori & Sarnin, 1991; Denison, 1984; Denison & Mishra,
1995; Flamholtz, 2001; Flamholtz & Kannan-Narasimhan, 2005; Flatt & Kowalczyk, 2008;
Gordon & DiTomaso, 1992; Hansen & Wernerfelt, 1989; Harter et al., 2002; Johnson et al.,
2009; Leung, 1997; Marcoulides & Heck, 1993; Petty et al., 1995; Schneider et al., 2003;
Schulte et al., 2009; Sorensen, 2003; Thompson, 1996; Van De Voorde et al., 2010; Van Der
Post et al., 1998). However, not all of the previous literature in this area has provided
evidence supporting this relationship. The findings from the present research join a group of
studies whose findings also fail to demonstrate linkage between employee perceptions of
organizational environment factors and financial performance (Booth & Hamer, 2009; Cooil
et al., 2009; Davidson et al., 2007; Paradise-Tornow, 1991; A. M. Ryan et al., 1996).
Wilderom et al. (2000) recapped the phases of organizational literature focused on the
potential linkage between organizational environment factors and organizational

86
performance: Emergence, Promulgation, Defiance, and Testing. This study, using
quantitative data analysis techniques on a relatively large data base from a large organization,
fits well into the phase they call Testing. Wilderom et al. (2000) suggested that the Testing
phase is appropriate at this time in the development of the organizational environment
literature to confirm or disconfirm the earlier studies and the hypothesized link. Thus, this
study is in harmony with the generation of new studies having a shared purpose of
identifying the potential linkage between the organizational environment and performance
(Sackmann, 2011).
Why are these findings different from the majority of findings from the literature?
These studies reflect a diversity of approaches on numerous levels. Few studies had
agreement on how to define and measure the organizational environment. Few studies had
agreement on the sub-scales that were used. Few of the studies used the same instrument to
collect data. The previous studies each used sampling techniques that yielded sample sizes
that varied widely. For example, the range of survey respondents by study was extremely
wide, from 231 individuals (Leung, 1997) to 198,514 individuals (Harter, Schmidt, & Hayes,
2002). Similarly, the range of organizational groupings by study also had a wide range from
5 groups (Calori & Sarnin, 1991) to 7,939 groups (Harter, Schmidt, & Hayes, 2002).
What key insights were generated by this study? Employee perceptions of
organizational environment factors on a broad range of topics explain a minimal amount of
the variation in financial performance. I speculate that other variables may explain this
variation more effectively. These variables may include Years of experience of the team
members performing sales and service roles, length of the relationship between sales and

87
service team members and customer decision makers and buyers, customer service
capabilities and performance, monetary commissions and incentives to team members,
quantity of training and education of team members, team member attendance, hours spent at
work, market size, geographic size of the sales territories and districts, population size of the
sales territories and districts, product quality and features compared with competitors’,
marketplace fluctuations, industry regulations, and competitor activity. These are potential
covariates that could be used in future research.
This study dispels a popular notion occasionally discussed in the practitioner press:
“Culture eats strategy for lunch” (Ford, 2007, p. 16). This phrase has been used by
practitioners to describe how the informal controls within an organization, while often
invisible, can have more power than those controls that are formal and more easily seen
(McLaughlin, 2006). Instead, this study suggests that variables other than those associated
with the organizational environment can better explain a greater percentage of the variation
in financial performance.
A number of observations can be made about the organizational environment
subscales that were a part of this study. Of the 11 subscales in this study, 6 were found to
have no relationship with financial performance. The remaining subscales were found to
have significant but weak relationships to at least one measure of financial performance. Of
these, only 4 subscales (Senior Management, Mission, Training, and Inclusion) explained the
variation in at least one measure of financial performance. All subscales are now discussed in
the context of findings from previous studies.
88
Operational Effectiveness
Employee perceptions of Operational Effectiveness, defined as “any number of
practices that allow a company to better utilize its inputs by, for example, reducing defects in
products or developing better products faster” (Porter, 1996, p. 62), were found to have no
relationship with any of the financial performance variables used in this study. This result
stands in contrast to other studies that found various notions of operational effectiveness and
customer focus to be important in explaining financial performance. Flamholtz and Kannan-
Narasimhan (2005) found performance standards to be a significant predictor of financial
performance with a moderate to strong correlation between performance and behavior
standards and earnings before interest and taxes. Hanson and Wernerfelt (1989) found a
moderate relationship between employees’ perceptions of the importance of achieving
organizational goals and financial performance. Marcoulides and Heck (1993) found a
moderate to high relationship between organizational structure and the operational processes
and organizational performance. Gordon and DiTomaso (1992) found that their scale, called
Adaptability, which is composed of risk taking and innovation, was predictive of short term
profitability. Van Der Post et al. (1998) found a moderate relationship between actively
responding to customer feedback and financial performance. However, similar to the results
of this study, Gibson et al. (2007), examining relationships between high-performance work
practices and organizational outcomes, found only weak relationships between organizational
environment factors and firm performance. While many of these studies contradict my
findings, I speculate that operational effectiveness may relate more closely to non-financial
performance measures that were not a part of this study, such as customer satisfaction,

89
reductions in cycle time and lead time measures, and measurements of quality. Gibson et al.
(2007) supported this line of thinking. They examined the relationship between high
performing work practices and various organizational performance measures, and they found
a weak relationship between information-sharing practices and financial performance. Two
other variables, boundary-setting practices and team-enabling practices, were weakly related
to firm-level customer service outcomes and firm-level quality outcomes, respectively.
Immediate Manager
This study found a significant, weak relationship between employee perceptions of
their immediate managers and one of the financial performance variables of this study. This
subscale was defined as the individuals directing the work of survey respondents and
responsible for the system of action for coping with complexity by planning, budgeting,
organizing, staffing, problem solving, and controlling for results (Kotter, 1990). Other studies
have found that management effects differ. Booth and Hamer (2009) found that management
support was not a significant predictor of financial performance. However, Borucki and
Burke (1999) found that the role and support of management played a moderating role in
influencing financial results, as did Van Der Post et al. (1998) and Calori and Sarnin (1991).
Harter et al. (2002) found employee perceptions of management practices to be positive but
having a lower impact on financial performance than other climate variables in their study.
Senior Management
Senior management was defined as the individuals in senior corporate roles who are
responsible for the system of action for coping with organizational change by setting
direction, aligning people, and motivating and inspiring people (Kotter, 1990). This study

90
found weak but significant correlations between employee perceptions on this subscale and
two of the five financial performance variables. In addition, senior management was useful in
explaining a small portion of the variance in financial performance. Similarly, two studies
found a relationship between senior leadership and financial performance. Asree et al.
(2010), in their study on hotel operations and performance, found moderate relationships
between leadership competency, a variable called organizational responsiveness, and
revenue. Koene et al. (2002), in their study of leadership and financial performance in
grocery stores, found a moderate relationship between leadership style, organizational
climate, and profit. In contrast, Ogbonna and Harris (2000) found that leadership style of
senior management was not directly linked to performance.
Mission
The mission subscale, defined as the organization’s reason for its existence combined
with an explanation of its strategic framework describing the desired future state, key values,
and major goals (Hill & Jones, 2009), was found to have no relationship to any of the
financial performance variables based on correlation analysis; however, it was useful in
explaining a small portion of the variation in financial performance. This result stands in
contrast to other findings from the literature. Davidson et al. (2007) claimed that their
mission subscale to be weakly correlated with financial measures; however, these results
were statistically insignificant. Denison and Mishra (1995) also found the mission subscale to
be moderately associated with financial performance. When examining a subset of their
sample (larger firms with more than 100 employees and with a top executive reporting), they
found a moderate relationship between mission and return on assets. Flatt and Kowalczyk

91
(2008), used a construct called credo as part of their definition of strong culture, and they
found that a strong culture was moderately related to financial performance. Finally,
Marcoulides and Heck (1993) used numerous notions of organizational purpose to support
definitions of organizational structure, organizational values, and organizational climate, all
of which were found to have strong relationships to financial performance.
Valuing Employees
This subscale, defined as the human resources practices of an organization involving
the treatment of people and including the promotion of safe working conditions, employee
welfare, and employee recognition (Flamholtz & Kannan-Narasimhan, 2005), showed no
significant relationship with any of the financial performance variables. These results also
stand in contrast to previous findings from other studies. Calori and Sarnin (1991) found that
trust, listening to others, and team spirit were all moderately correlated to participatory
management practices that were found to be moderately associated with the annual variation
of the net turnover (an indicator of the growth performance of the firm). Hansen and
Wernerfelt (1989) studied employee perceptions of how concerned the organization was with
employee welfare and work conditions, and they found this variable to be significant in its
relationship with financial performance, showing a moderate to high relationship. Schneider
et al. (2003) examined employee perceptions of satisfaction with pay and security, and they
found that both variables demonstrated a moderate relationship with financial performance.
Finally, Marcoulides and Heck (1993) found that a number of variables showed a moderate
to high relationship with financial performance, and these included employee perceptions of

92
employee selection, compensation, and the extent to which the organization is concerned
about the welfare and protection of employees.
Training
In this study training, defined as the process of developing knowledge and expertise
in people (Swanson & Holton III, 2001), had a weak but significant relationship with one of
five financial performance variables. In addition, this subscale was useful in explaining a
small percentage of variation in financial performance. Other studies also found that training
had a relationship with financial performance. Borucki and Burke (1999) had training as a
part of their organizational climate variable, and they found a relationship between training
and financial performance. However, the specific relationship or influence of training on
performance was not clearly specified. Gordon and DiTomaso (1992) identified development
and promotion from within as a component of their strong culture variable, and they found
that strong culture was found to be positively related to firm performance. Booth and Hamer
(2009) included employee perceptions of a related topic, career development, as a component
of culture; however, they found that organizational culture was a weak predictor of firm
performance.
Involvement
The process of gaining organization members’ input into decisions that affect
organizational performance and employee well-being (Cummings & Worley, 1997) was
found to have no relationship with any of the financial performance variables in this study.
These results are inconsistent with other findings associated with this factor. Denison (1984,
1990) suggested that involvement has a positive impact on short-term and long-term

93
organizational effectiveness. He found correlations of .15 to .54 between his human
resources index and financial performance. He stated, “Using measures of both informal
involvement in decision making and more formal participation through organizational design
and governance, these results present convincing evidence that there are positive short- and
long-term impacts of high involvement systems” (pp. 177-8). Denison and Mishra (1995)
also found involvement to be a strong predictor of growth in financial performance.
Corporate Social Responsibility
Corporate social responsibility, defined as the economic, legal, discretionary, and
philanthropic expectations that society has of the organization at a given point in time
(Carroll, 1991), was found to have a weak but significant correlation with one of the five
financial performance variables for this study. These results are not altogether surprising as
researchers have found positive, neutral, and negative relationships between corporate social
responsibility and financial performance (Foote, Gaffney, & Evans, 2010). Foote et al.
reported that issues with the research between Corporate social responsibility and financial
performance may relate to difficulties associated with defining and measuring corporate
social responsibility, as well as the impact of differing social contexts associated with this
concept. Despite the inconclusive results in the literature, as well as published criticisms and
limitations, Carroll and Shabana (2010) stated that there is growing support for the
acceptance of arguments for the business case of corporate social responsibility. However,
recent studies focused on a quantifiable link between have shown no to weak results.
Surroca, Tribo, and Waddock (2010) found no direct relationship between corporate social
responsibility and firm performance. Peloza (2009), in his meta-analysis of literature,

94
concluded that there is a positive, but weak, relationship between corporate social
responsibility and financial performance. The results of the current study do not support a
link between employee perceptions of corporate social responsibility and financial
performance.
Satisfaction
The satisfaction subscale, defined as “positive emotional reactions to a particular job”
(Oshagbemi, 1999, p. 338), showed no relationship with financial performance. This finding
is different from many other studies that had a similar subscale. Booth and Hamer (2009)
found a weak, negative relationship between job satisfaction and sales intensity, a measure of
retail store performance. Calori and Sarnin (1991) found that personal fulfillment was a
factor moderately associated with participative management practices which were found to
have a moderate relationship with growth in financial performance. Gelade and Young
(2005) found that a factor they called commitment, which has a component of job
satisfaction included with it, had a moderate relationship with achievement. Koys (2001)
found a moderate relationship between employee satisfaction and commitment and short-
term profitability in a restaurant chain. Leung (1997) also found that job satisfaction had a
moderate relationship with financial performance. Ryan et al. (1996) demonstrated that
average levels of job/company satisfaction, positive perceptions of teamwork, and (lack of)
stress in the branches of a finance company, are weakly associated with superior market
share, reduced debt delinquency, and fewer credit losses. Finally, Schneider (2003) found a
moderate relationship between return on assets and employee satisfaction.

95
Teamwork
Teamwork, defined as group(s) of interdependent individuals who hare a common
purpose, have common work methods, and hold each other accountable (Katzenbach &
Smith, 1993), was found to have no relationship with any of the financial metrics used in this
study. This finding stands generally in contrast to previous findings. Calori and Sarnin
(1991), as mentioned earlier, found that trust and team spirit were moderately correlated to
participatory management practices that were found to be moderately associated with
financial performance. Petty et al. (1995) found both moderate and strong relationships
between teamwork and financial performance. Delarue et al. (2008), in their survey of
previous literature that focused on the relationship between teamwork and organizational
performance, found that teamwork had a positive impact on various dimensions of
organizational performance, including financial performance; however, the strength of this
relationship is not reported. Similarly, Proctor and Burridge (2008) found that teamwork was
moderately related to both productivity and financial performance. However, in contrast to
these many findings, one study (Gonzalez-Roma, Fortes-Ferreira, & Peiro, 2009) found that
team support was found to have only a weak, but statistically significant, relationship with
financial performance.
Inclusion
Finally, inclusion, which was defined as a climate for truly valuing, not just
accepting, differences in people in order to maximize its performance benefits (McLean,
2005), was found to have a significant but weak relationship with one of five financial
performance metrics used in this study. Previous studies examining the relationship between

96
concepts of inclusion and financial performance are scarce. However, one source that appears
to be focused on promoting notions similar to inclusion is the Great Place to Work Institute
(Our Model, 2011). On its website, the Great Place to Work organization describes a great
place to work as “one in which you trust the people you work for, have pride in what you do,
and enjoy the people you work with,” and its model describes trust as an interaction of
credibility, respect, fairness, pride, and camaraderie (Our Model, 2011). They also provided
listings of “best companies,” and they link to Fortune Magazine’s list of 100 best places to
work (Best Companies, 2011). Fulmer, Gerhart, and Scott (2003) examined the relationship
between being a best place to work and financial performance. These authors found that
companies on the best place to work list also demonstrated financial performance advantages
over the broader market and, in some cases, over a matched group of similar companies.
Fawcett, Rhodes, and Burnah (2004) completed interviews and content analyses of employee
responses from great places to work to determine the shared characteristics of these
organizations from the perspectives of employees. One of the key traits was a facilitative
company culture that was built on a foundation of affirmation, belonging, and competence.
The results of the current study suggest that inclusion has a small, at best, relationship with
an organization’s financial performance.
Limitations of the Study
A number of areas may be a source of limitations for the findings of this study. First,
the instrument used to collect employee perceptions of organizational environment factors
may be limited in its design. While an attempt was made by the survey designers to collect
comprehensive data on numerous subscales, it is possible that some important factors may

97
have been missed, including employee perceptions of organizational, process, and product
innovation; and employee perceptions of the organization’s approach and capabilities to
planning and managing change. Second, this study focused only on financial performance at
the team level; it did not include individual performance nor did it include non-financial
variables, such as customer service, productivity, or other non-financial performance
measures. Non-financial performance measures reflecting process or organizational
indicators or outputs may well serve as mediating variables between employee perceptions of
the organizational environment and financial performance. Third, the financial performance
measures used for this study covered a period of one fiscal year. The one-year timeframe
could be considered as too short and could be considered a limitation. In addition, an
expanding or contracting business cycle may well span more than one year. The financial
performance during a period of contraction or explanation could affect the results of this
study. Fourth, the environment within which the organization operates was outside the scope
of this study, but it may be a source of limitation of this survey. The environment, to the
extent it is open, regulated, or politicized, may exert some influence on financial
performance. Fifth, all of the organizational and financial data were collected from within the
same organization. This approach may constrain the amount of variation that might have
been observed if I had collected data from more than one organization. As such, the
homogeneity of the data may reduce the size of the relationships that were observed.
Another potential limitation of this study is factor score indeterminacy. This study
used common factor analysis with principal axis factoring as the method of extraction, and it
used a multiple regression approach to generating factor scores. Because factors are not exact

98
linear combinations of shared variance using this extraction method, an infinite number of
factor score coefficient matrices could be used to create factor scores (Pett et al., 2003). This
situation, one where there is no unique solution to generating factor scores, is called factor
score indeterminacy (Pett et al., 2003). Different approaches to generating factor scores have
been proposed in the factor analysis literature. Each approach has different properties and the
resulting scores are different. Because there is no single, correct approach for generating
factor score estimates, there are no clear guidelines. Thus, a potential limitation of this study
is that different factor score estimates will be generated based on approach used.
The outcome variable, contribution margin ratio, is another potential limitation of this
study. Because this is a ratio, it is range is from zero to one. In addition, this variable is
composed of total revenue and various types of costs (costs of sales, product costs,
commissions, and other expenses) that may not be related directly to the organizational
environment measures.
Implications and Recommendations
This study found that financial performance is not easily explained using employee
perceptions of organizational environment factors. Implications and recommendations for
human resource development may be suggested based on this finding, and they are outlined
in the following sections on human resource development practice, research, and theory.
Implications for Human Resource Development Practice
The findings of this study suggest that practitioners focused on human resource
development may need to look to other mediating variables between employee perceptions of
organizational environment factors and financial performance. These factors may include

99
measures of productivity, customer satisfaction, or other non-financial performance
measures. The findings of this study may also suggest that employee perceptions are not a
key variable overall in explaining the variation in financial performance of organizations.
This does not suggest that employee perceptions are not useful as a means for measuring
aspects of the organizational environment or for providing feedback to management on the
quality of the experience of employees of the organization. However, the results of this study
suggest that organizational performance is complex. Practitioners would be advised against
providing overly simplistic explanations for organizational performance to client partners or
accepting overly simplistic explanations of performance from the press. Conventional
wisdom from both the practitioner and scholarly communities have suggested a moderate
relationship between employee perceptions of the organizational environment and financial
performance; however, the results of this study do not support this assumption. The findings
of this study suggest that this assumption should be questioned, and more practitioners
should continue to seek better explanations of the financial performance of organizations.
In addition, results such as those found here may suggest that values statements about
a participatory work environment may need to be refined or refocused. If practitioners have a
personal bias that a participatory work environment is valued, this findings may change how
that argument should be delivered to the client organization’s leadership. Results of this
study suggest that it may not be accurate to suggest that participatory work environments
yield better financial performance. If arguments for participatory work environments are put
forth from practitioners to client partners, practitioners are advised to consider the rationale
for this approach and adopt a rationale that is consistent with research results.

100
Implications for Theory
The results of this study suggest that financial performance is based on numerous
variables, and employee perceptions of the organizational environment provide only a
minimal, at best, explanation for the variation in financial performance. This suggests that
explanations about organizational performance may currently be too simplistic and have a
limited ability to explain organizational performance. The current literature requires
improvement so that the process of theory building related to financial performance of
organizations can continue based on research results. The results of this study suggest that
phenomena found in the organizational environment and our explanations for organizational
performance need further development, refinement, and confirmation. Simple explanations
about the impact of employee perceptions of the work environment on financial performance
do not provide adequate explanations of how organizational performance works.
Organizational environment theories would benefit from the application of research
results from this and other similar studies. Drawing on Dubin’s eight step model of theory
building (Dubin, 1978), a few potential, notable next steps could be taken. The units of the
relationship of variables explaining organizational phenomena and financial performance
should be revisited. As noted previously, varying results on the relationship between
organizational environment factors and financial performance provide inconclusive results.
Consequently, the units and concepts of theories of the organizational environment and their
relationships to financial performance should be reviewed and revised. Furthermore, the
interaction between the units or concepts should be articulated in new ways that better

101
explain the relationships between the variables. Finally, testing of the reconceptualized
variables is needed to continue the process of theory building and validation.
Recommendations for Future Research
Organizational performance needs better explanations, both practically and
theoretically (Kirby, 2005), and several areas of future research on topics related to this study
would be useful for both the academic and practitioner communities. To answer the question
of how financial performance can be explained, additional research could focus on the
interaction between organizational environment factors and other variables such as measures
of customer satisfaction, process performance, quality, and productivity. Mediating factors
might include years of experience of the team members performing sales and service roles,
length of relationship between sales and service team members and customer decision
makers and buyers, customer service capabilities, monetary commissions and incentives,
quantity of training and education of team members, team member attendance, hours spent at
work, market place size, geographic size of sales territories and districts, population size of
the sales territories and districts, product quality and features compared to competitor
products, marketplace fluctuations, industry regulations, and competitor behavior. Theories
of organizational performance have not conclusively explained financial results (Kirby,
2005). Additional research on organizational performance could be useful for developing and
confirming additional explanations and theory, and these would have both their heuristic and
practical value.
Future studies could also examine the relationships between employee perceptions of
the work environment and non-financial performance variables. While this study found that

102
employee perceptions of organizational environment factors provided only a single-digit
percentage explanation of the variation in financial performance, perhaps these perceptions
can better explain non-financial performance measures, such as those related to quality,
productivity, and customer satisfaction. Future research in this area would be useful as
organizational performance is multi-faceted and consists of both financial and non-financial
variables (Venkatraman & Ramanujam, 1986). In addition, future studies could examine the
economic environment in which the organizations operate. Because the economic
environment impacts the amount of sales, the environment itself is a variable worthy of
further investigation because of its impact on financial performance.
Finally, as shown in both this study and other studies of a similar nature, the sub-
scales may be a useful area of future research. First, meta-analytic studies comparing and
examining the contributions of these sub-scales to our understanding of different types of
organizational performance would be useful. I have reported these results piecemeal
throughout this study and compared the sub-scale results of this study to these findings;
however, a more systematic review of previous research results could be helpful. Second, this
study, like many others, reported moderate to strong correlations among organizational
environment factors. These relationships are interesting, but it would be helpful to have
greater insight as to why these relationships exist and how they function. The instruments
used in the current study include subscales. Including the information from these subscales
could be helpful in deepening our understanding of how organizations function as a system.

103
REFERENCES
Alvesson, M. (2002). Understanding organizational culture. London: Sage.
Ashkanasy, N. M., Wilderom, C. P. M., & Peterson, M. F. (2000). Introduction. In N. M.
Ashkanasy, C. P. M. Wilderom, & M. F. Peterson (Eds.), Handbook of organizational
culture and climate (pp. 1-18). Thousand Oaks: Sage.
Ashkanasy, N. M., Wilderom, C. P. M., & Peterson, M. F. (2011a). Introduction to the
handbook of organizational culture and climate, second edition. In N. M. Ashkanasey,
C. P. M. Wilderom, & M. F. Peterson (Eds.), Handbook of organizational culture and
climate (2nd ed.) (pp. 3-10). Los Angeles: Sage.
Ashkanasy, N. M., Wilderom, C. P. M., & Peterson, M. F. (Eds.). (2011b). The handbook of
organizational culture and climate (2nd ed.). Los Angeles: Sage.
Asree, S., Zain, M., & Razalli, R. R. (2010). Influence of leadership competency and
organizational culture on responsiveness and performance of firms. International
Journal of Contemporary Hospitality Management, 22, 500-516. doi:
10.1108/09596111011042712
Barney, J. B. (1986). Organizational culture: Can it be a source of sustained competitive
advantage? Academy of Management Review, 11, 656-665.
Bates, R. A. (2005). Multivariate research methods. In R. A. Swanson & E. F. Holton III
(Eds.), Research in organizations (pp. 115-141). San Francisco: Berrett-Koehler.
Best Companies. (2011) Retrieved March 18, 2011, from
http://www.greatplacetowork.com/what_we_do/lists-us-bestusa.htm
104
Booth, S. A., & Hamer, K. (2009). Corporate culture and financial performance: An
empirical test of a UK retailer. International Journal of Retail & Distribution
Management, 37, 711-727. doi: 10.1108/09590550910966204
Borucki, C. C., & Burke, M. J. (1999). An examination of service-related antecedents to
retail store performance. Journal of Organizational Behavior, 20, 943-962.
Calori, R., & Sarnin, P. (1991). Corporate culture and economic performance: A French
study. Organization Studies, 12, 49-74.
Carroll, A. B. (1991). The pyramid of corporate social responsibility: Toward the moral
management of organizational stakeholders. Business Horizons, 34(4), 39-49.
Carroll, A. B., & Shabana, K. M. (2010). The business case for corporate social
responsibility: A review of concepts, research and practice. International Journal of
Management Reviews, 12, 85-105. doi: 10.1111/j.1468-2370.2009.00275.x
Charan, R. (2001). Conquering a culture of indecision. Harvard Business Review, 79(4), 74-
82.
Chatman, J. A., & Cha, S. E. (2003). Leading by leveraging culture. California Management
Review, 45(4), 20-34.
Cohen, J. (1988). Statistical power analysis for the behavioral sciences (2nd ed.). Hillsdale,
NJ: Lawrence Erlbaum.
Collins, J. (2001). Good to great. New York: HarperCollins.
Collins, J., & Porras, J. I. (1994). Built to last: Successful habits of visionary companies.
New York: HarperCollins.

105
Comrey, A. L., & Lee, H. B. (1992). A first course in factor analysis. Hillsdale, NJ:
Lawrence Erlbaum.
Conway, J. M., & Huffcutt, A. I. (2003). A review and evaluation of exploratory factor
analysis practices in organizational research. Organizational Research Methods, 6(2),
147-168. doi: 10.1177/1094428103251541
Cooil, B., Aksoy, L., Keiningham, T. L., & Maryott, K. M. (2009). The relationship of
employee perceptions of organizational cliomate to business-unit outcomes: An
MPLS approach. Journal of Service Research, 11, 277-294. doi:
10.1177/1094670508328984
Criteria for Performance Excellence. (2000). Retrieved March 18, 2011, from
http://www.nist.gov/baldrige/publications/archive/upload/2000_Business_Criteria.pdf
Cummings, T. G., & Worley, C. (1997). Organization development & change (6th ed.).
Cincinnati, OH: South-Western College.
Davidson, G., Coetzee, M., & Visser, D. (2007). Organizational culture and financial
performance in a South African investment bank. South African Journal of Industrial
Psychology, 33, 38-48.
Deal, T. E., & Kennedy, A. A. (1982). Corporate cultures: The rites and rituals of corporate
life. Reading, MA: Addison-Wesley.
Delarue, A., Van Hootegem, G., Procter, S., & Burridge, M. (2008). Teamworking and
organizational performance: A review of survey-based research. International
Journal of Management Reviews, 10(2), 127-148. doi: 10.1111/j.1468-
2370.2007.00227.x

106
Denison, D. R. (1984). Bringing corporate culture to the bottom line. Organizational
Dynamics, 13(2), 5-22.
Denison, D. R. (1990). Corporate culture and organizational effectiveness. New York:
Wiley.
Denison, D. R. (1996). What is the difference between organizational culture and
organizational climate? A native's point of view on a decade of paradigm wars.
Academy of Management Review, 21, 619-654.
Denison, D. R., & Mishra, A. K. (1995). Toward a theory of organizational culture and
effectiveness. Organization Science, 6, 204-223.
Deshpande, R., Farley, J. U., & Webster, F. E. (1993). Corporate culture, customer
orientation, and innovativeness in Japanese firms: A quadrad analysis. Journal of
Marketing, 57, 23-37.
Dillman, D. A., Smyth, J. D., & Christian, L. M. (2009). Internet, mail, and mixed-mode
surveys: The tailored design method (3rd ed.). Hobokken, NJ: John Wiley & Sons.
DiStefano, C., Zhu, M., & Mindrila, D. (2009). Understanding and using factor scores:
Considerations for the applied researcher. Practical Assessment, Research &
Evaluation, 14(20). Retrieved from http://pareonline.net/pdf/v14n20.pdf
Dubin, R. (1978). Theory building (Revised ed.). New York: The Free Press.
Fabrigar, L. R., Wegener, D. T., MacCallum, R. C., & Strahan, E. J. (1999). Evaluating the
use of exploratory factor analysis in psychological research. Psychological Methods,
4, 272-299.

107
Fawcett, S. E., Rhodes, G. K., & Burnah, P. (2004). People as the bridge to competitiveness:
Benchmarking the "ABCs" of an empowered workforce. Benchmarking: An
International Journal, 11, 346-360. doi: 10.1108/14635770410546755
Flamholtz, E. (2001). Corporate culture and the bottom line. European Management Journal,
19, 268-275.
Flamholtz, E., & Kannan-Narasimhan, R. (2005). Differential impact of cultural elements on
financial performance. European Management Journal, 23, 50-64. doi:
10.1016/j.emj.2004.12.009
Flatt, S. J., & Kowalczyk, S. J. (2008). Creating competitive advantage through intangible
assets: The direct and indirect effects of corporate culture and reputation. Advances in
Competitiveness Research, 16(1), 13-30.
Foote, J., Gaffney, N., & Evans, J. R. (2010). Corporate social responsibility: Implications
for performance excellence. Total Quality Management, 21, 799-812. doi:
10.1080/14783363.2010.487660
Ford, L. (2007). The fourth factor: Managing corporate culture. Indianapolis: Dog Ear
Publishing.
Fulmer, I. S., Gerhart, B., & Scott, K. S. (2003). Are the 100 best better? An empirical
investigation of the relationship between being a "great place to work" and firm
performance. Personnel Psychology, 56, 965-993.
Gall, M. D., Gall, J. P., & Borg, W. R. (2003). Educational research: An introduction (7th
ed.). Boston: Allyn and Bacon.

108
Gelade, G. A., & Young, S. (2005). Test of a service profit chain model in the retail banking
sector. Journal of Occupational and Organizational Psychology, 78, 1-22. doi:
10.1348/096317904X22926
Gibson, C. B., Benson, G. S., Porath, C. L., & Lawler, E. E. (2007). What results when firms
implement practices: The differential relationship between specific practices, firm
financial performance, customer service, and quality. Journal of Applied Psychology,
92, 1467-1480. doi: 10.1037/0021-9010.92.6.1467
Gonzalez-Roma, V., Fortes-Ferreira, L., & Peiro, J. M. (2009). Team climate, climate
strength and team performance: A longitudinal study. Journal of Occupational and
Organizational Psychology, 82, 511-536. doi: 10.1348/096317908X370025
Gordon, G. G. (1985). The relationship of corporate culture to industry sector and corporate
performance. In R. H. Kilmann, M. J. Saxton, & R. Serpa (Eds.), Gaining control of
the corporate culture (pp. 103-125). San Francisco: Jossey-Bass.
Gordon, G. G., & Cummins, W. M. (1979). Managing management climate. Lexington, MA:
Lexington Books.
Gordon, G. G., & DiTomaso, N. (1992). Predicting corporate performance from
organizational culture. Journal of Management Studies, 29, 783-798.
Hair, J. F., Anderson, R. E., Tatham, R. L., & Black, W. C. (1995). Multivariate data
analysis (4th ed.). Englewood Cliffs, NJ: Prentice Hall.
Hansen, G. S., & Wernerfelt, B. (1989). Determinants of firm performance: The relative
impact of economic and organizational factors. Strategic Management Journal, 10,
399-411.

109
Harter, J. K., Schmidt, F. L., & Hayes, T. L. (2002). Business-unit-level relationship between
employee satisfaction, employee engagement, and business outcomes: A meta-
analysis. Journal of Applied Psychology, 87, 268-279. doi: 10.1037//0021-
9010.87.2.268
Hill, C. W. L., & Jones, G. R. (2009). Strategic management: An integrated approach (9th
ed.). Cincinnati, OH: South-Western.
Hinkin, T. R. (2005). Scale development principles and practices. In R. A. Swanson & E. F.
Holton III (Eds.), Research in organizations: Foundations and methods of inquiry
(pp. 161-179). San Francisco: Berrett-Koehler.
Jaques, E. (1951). The changing culture of a factory. London: Tavistock.
Johnson, D. E., Davis, S. B., & Albright, T. L. (2009). Examining the relationship between
employee attitudes and a firm's financial performance: A Theoretical Framework and
causal investigation. Journal of Management Issues, 21, 367-382.
Katzenbach, J. R. (2000). Peak performance: Aligning the hearts and minds of your
employees. Boston: Harvard Business School Press.
Katzenbach, J. R., & Smith, D. K. (1993). The wisdom of teams. Boston: Harvard Business
School Press.
Kirby, J. (2005). Toward a theory of high performance. Harvard Business Review, 83(7/8),
30-39.
Koene, B. A. S., Vogelaar, A. L. W., & Soeters, J. L. (2002). Leadership effects on
organizational climate and financial performance: Local leadership effect in chain
organizations. The Leadership Quarterly, 13(3), 193-215.

110
Kotter, J. P. (1990). What leaders really do. Harvard Business Review, 68(3), 103-111.
Kotter, J. P., & Heskett, J. L. (1992). Corporate culture and performance. New York: Free
Press.
Koys, D. J. (2001). The effects of employee satisfaction, organizational citizenship behaviour
and turnover on organizational effectiveness: A unit-level, longitudinal study.
Personnel Psychology, 54, 101-114.
LaGuardia, D. (2008). Organizational culture. T+D, 62(3), 56-61.
Lee, S. K. J., & Yu, K. (2004). Corporate culture and organizational performance. Journal of
Managerial Psychology, 19, 340-359. doi: 10.1108/02683940410537927
Leung, K. (1997). Relationships among satisfaction, commitment, and performance: A
group-level analysis. Applied Psychology: An International Review, 46, 199-206.
Lewin, K., Lippitt, R., & White, R. K. (1939). Patterns of aggressive behavior in
experimentally created "social climates". The Journal of Social Psychology, 10, 271-
299.
Lim, B. (1995). Examining the organizational culture and organizational performance link.
Leadership & Organization Development Journal, 16(5), 16-21.
Lynham, S. A. (2002). The general method of theory-building research in applied disciplines.
Advances in Developing Human Resources, 4, 221-241. doi:
10.1177/1523422302043002
Magoon, L. M. (2008). Dictionary of financial formulas and ratios. London: Globe
Professional Publishing.

111
Marcoulides, G. A., & Heck, R. H. (1993). Organizational culture and performance:
Proposing and testing a model. Organization Science, 4, 209-225.
Martin, J. (2002). Organizational culture: Mapping the terrain. Thousand Oaks: Sage.
McLaughlin, T. A. (2006). Nonprofit strategic positioning: Decide where to be, plan what to
do. Hoboken, NJ: John Wiley & Sons.
McLean, G. N. (2005). Organization development: Principles, processes, performance. San
Francisco: Berrett-Koehler.
McMillan, J. H. (2008). Educational research: Fundamentals for the consumer (5th ed.).
Boston: Pearson Education.
Munck, B. (2001). Changing a culture of face time. Harvard Business Review, 79(10), 125-
131.
O'Toole, J., & Bennis, W. (2009). What's needed next: A culture of candor. Harvard
Business Review, 87(6), 54-61.
Ogbonna, E., & Harris, L. C. (2000). Leadership style, organizational culture and
performance: Empirical evidence from UK companies. International Journal of
Human Resource Management, 11, 766-788.
Ogbonna, E., & Harris, L. C. (2002). Organizational culture: A ten year, two-phase study of
change in the UK food retailing sector. Journal of Management Studies, 39, 673-706.
Oshagbemi, T. (1999). Overall job satisfaction: How good are single versus multiple-item
measures? Journal of Managerial Psychology, 14, 388-403.
Ouchi, W. G., & Jaeger, A. M. (1978). Type Z organization: Stability in the midst of
mobility. Academy of Management Review, 3, 305-314.

112
Our Model – Great Place to Work. (2011). Retrieved February 18, 2011, from
http://www.greatplacetowork.com/what_we_do/model.php
Paradise-Tornow, C. A. (1991). Management effectiveness, service quality, and
organizational performance in banks. Human Resource Planning, 14(2), 129-139.
Payne, R. L. (2000). Climate and culture: How close can they get? In N. M. Ashkanasy, C. P.
M. Wilderom, & M. F. Peterson (Eds.), Handbook of organizational culture &
climate (pp. 163-176). Thousand Oaks: Sage.
Pedhazur, E. J., & Schmelkin, L. P. (1991). Measurement, design, and analysis: An
integrated approach. Hillsdale, NJ: Lawrence Erlbaum.
Peloza, J. (2009). The challenge of measuring financial impacts from investments in
corporate social performance. Journal of Management, 35, 1518-1541.
Peters, T. J., & Waterman, R. H. (1982). In search of excellence: Lessons from America's
best-run companies. New York: Harper & Row.
Pett, M. A., Lackey, N. R., & Sullivan, J. J. (2003). Making sense of factor analysis.
Thousand Oaks: Sage.
Pettigrew, A. M. (1979). On studying organizational culture. Administrative Science
Quarterly, 24, 570-581.
Pettigrew, A. M. (1990). Organizational climate and culture: Two constructs in search of a
role. In B. Schneider (Ed.), Organizational climate and culture (pp. 413-433). San
Francisco: Jossey-Bass Publishers.

113
Pettigrew, A. M. (2000). Forward. In N. M. Ashkanasy, C. P. M. Wilderom, & M. F.
Peterson (Eds.), Handbook of organizational culture and climate (pp. xiii-xv).
Thousand Oaks: Sage.
Petty, M. M., Beadles II, N. A., Lowery, C. M., Chapman, D. F., & Connell, D. W. (1995).
Relationships between organizational culture and organizational performance.
Psychological Reports, 76, 483-492.
Pfiffner, J. M., & Sherwood, F. P. (1960). Administrative Organization. Englewood Cliffs,
NJ: Prentice Hall.
Porter, M. E. (1996). What is strategy? Harvard Business Review, 74(6), 61-78.
Proctor, S., & Burridge, M. (2008). Teamworking and performance: The extent and intensity
of teamworking in the 1998 UK Workplace Employee Relations Survey (WERS98).
The International Journal of Human Resource Management, 19(1), 153-168. doi:
10.1080/09585190701764097
Reichers, A. E., & Schneider, B. (1990). Climate and culture: An evolution of constructs. In
B. Schneider (Ed.), Organizational climate and culture (pp. 5-39). San Francisco:
Jossey-Bass Publishers.
Roethlisberger, F. J., & Dickson, W. J. (1975). Management and the worker: An account of a
research programme conducted by Western Electric Company, Hawthorne Works
Chicago. Cambridge, MA: Harvard University Press.
Rousseau, D. M. (1990a). Assessing organizational culture: The case for multiple methods.
In B. Schneider (Ed.), Organizational climate and culture (pp. 153-192). San
Francisco: Jossey-Bass Publishers.

114
Rousseau, D. M. (1990b). Normative beliefs in fund-raising organizations: Linking culture to
organizational performance and individual responses Group and Organization
Studies, 15, 448-460.
Rucci, A. J., Kirn, S. P., & Quinn, R. T. (1998). The employee-customer-profit chain at
Sears. Harvard Business Review, 76(1), 82-97.
Ryan, A. M., Schmit, M. J., & Johnson, R. (1996). Attitudes and effectiveness: Examining
relations at an organizational level. Personnel Psychology, 49, 853-882.
Ryan, B. F., Joiner, B. L., & Cryer, J. D. (2005). MINITAB Handbook: Updated for Release
14 (5th ed.). Pacific Cove, CA: Brooks/Cole.
Sackmann, S. A. (2011). Culture and performance. In N. M. Ashkanasy, C. P. M. Wilderom,
& M. F. Peterson (Eds.), The handbook of organizational culture and climate (2nd
ed., pp. 188-224). Los Angeles: Sage.
Saffold, G. S. (1988). Culture traits, strength, and organizational performance: Moving
beyond "strong" culture. Academy of Management Review, 13, 546-558.
Schein, E. H. (1990). Organizational culture. American Psychologist, 45(2), 109-119.
Schein, E. H. (1992). Organizational culture and leadership (2nd ed.). San Francisco:
Jossey-Bass.
Schein, E. H. (1999). The corporate culture survival guide. San Francisco: Jossey-Bass.
Schein, E. H. (2000). Commentary: Sense and nonsense about culture and climate. In N. M.
Ashkanasy, C. P. M. Wilderom, & T. J. Peters (Eds.), Handbook of organizational
culture & climate (Vol. xxiii-xxx). Thousand Oaks: Sage.

115
Schein, E. H. (2011). Preface. In N. M. Ashkanasy, C. P. M. Wilderom, & M. F. Peterson
(Eds.), The handbook of organizational culture and climate (Vol. 2, pp. xi-xiii). Los
Angeles: Sage.
Schein, L. (1989). A manager's guide to corporate culture. New York: The Conference
Board.
Schneider, B. (2000). Commentary: The psychological life of organizations. In N. M.
Ashkanasy, C. P. M. Wilderom, & M. F. Peterson (Eds.), Handbook of organizational
culture & climate (pp. xvii-xxi). Thousand Oaks: Sage.
Schneider, B. (Ed.). (1990). Organizational climate and culture. San Francisco: Jossey-Bass.
Schneider, B., Ehrhart, M. G., Mayer, D. M., Saltz, J. L., & Niles-Jolly, K. (2005).
Understanding organization-customer links in service settings. Academy of
Management Journal, 48, 1017-1032.
Schneider, B., Hanges, P. J., Smith, D. B., & Salvaggio, A. N. (2003). Which comes first:
Employee attitudes or organizational financial and market performance? Journal of
Applied Psychology, 88, 836-851. doi: 10.1037/0021-9010.88.5.836
Schulte, M., Shmulyian, S., Ostroff, C., & Kinicki, A. (2009). Organizational climate
configurations: Relationships to collective attitudes, customer satisfaction, and
financial performance. Journal of Applied Psychology, 94, 618-634. doi:
10.1037/a0014365
Scriven, M. (1991). Evaluation Thesaurus (4th ed.). Newbury Park, CA: Sage.

116
Siehl, C., & Martin, J. (1990). Organizational culture: A key to financial performance? In B.
Schneider (Ed.), Organizational culture and climate (pp. 241-281). San Francisco:
Jossey-Bass.
Silverzweig, S., & Allen, R. F. (1976). Changing the corporate culture. Sloan Management
Review, 17(3), 33-49.
Sorensen, J. B. (2003). Strength of corporate culture and the reliability of firm performance.
Administrative Science Quarterly, 47(1), 70-91.
Stringer, R. (2001). Leadership and organizational climate. Upper Saddle River: Prentice
Hall.
Surroca, J., Tribo, J. A., & Waddock, S. (2010). Corporate responsibility and financial
performance: The role of intangible resources. Strategic Management Journal, 31,
364-390.
Swanson, R. A., & Holton III, E. F. (2001). Foundations of human resource development.
San Francisco: Berrett-Koehler.
Taylor, J. C., & Bowers, D. G. (1972). Survey of organizations. Ann Arbor: University of
Michigan.
Thompson, J. W. (1996). Employee attitudes, organizational performance, and qualitative
factors underlying success. Journal of Business and Psychology, 11(2), 171-191.
Tinsley, H. E. A., & Tinsley, D. J. (1987). Use of factor analysis in counseling psychology
research. Journal of Counseling Psychology, 34, 414-424.
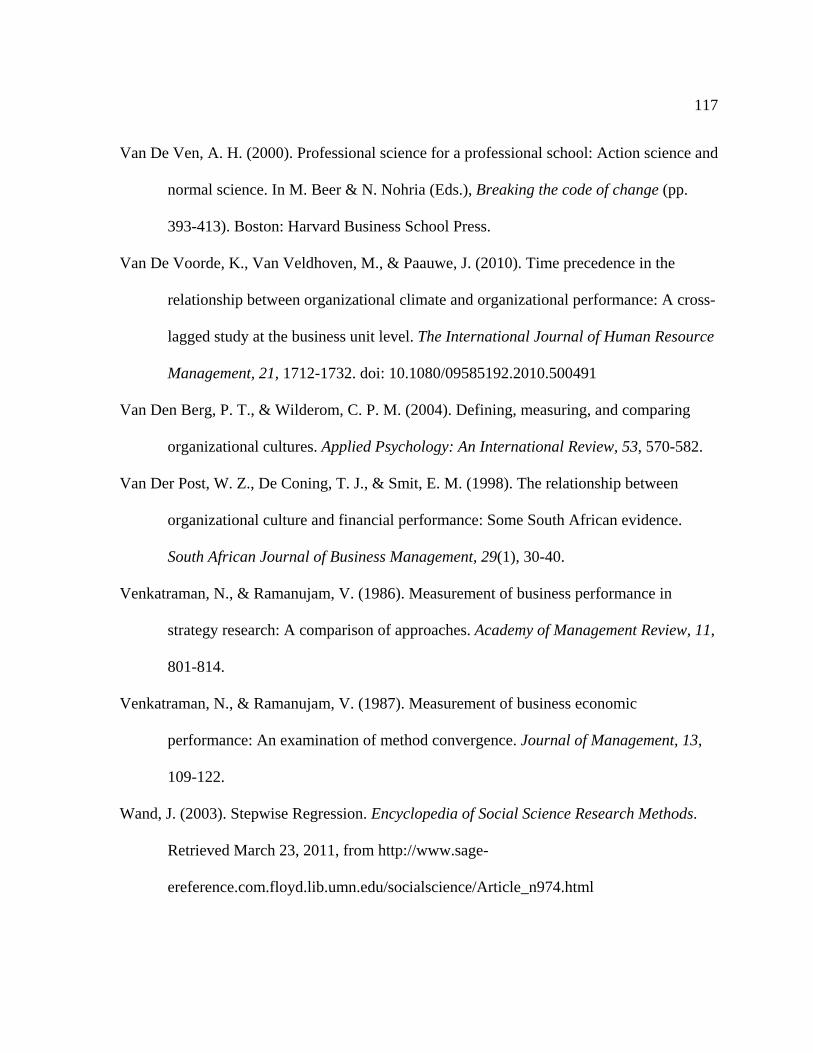
117
Van De Ven, A. H. (2000). Professional science for a professional school: Action science and
normal science. In M. Beer & N. Nohria (Eds.), Breaking the code of change (pp.
393-413). Boston: Harvard Business School Press.
Van De Voorde, K., Van Veldhoven, M., & Paauwe, J. (2010). Time precedence in the
relationship between organizational climate and organizational performance: A cross-
lagged study at the business unit level. The International Journal of Human Resource
Management, 21, 1712-1732. doi: 10.1080/09585192.2010.500491
Van Den Berg, P. T., & Wilderom, C. P. M. (2004). Defining, measuring, and comparing
organizational cultures. Applied Psychology: An International Review, 53, 570-582.
Van Der Post, W. Z., De Coning, T. J., & Smit, E. M. (1998). The relationship between
organizational culture and financial performance: Some South African evidence.
South African Journal of Business Management, 29(1), 30-40.
Venkatraman, N., & Ramanujam, V. (1986). Measurement of business performance in
strategy research: A comparison of approaches. Academy of Management Review, 11,
801-814.
Venkatraman, N., & Ramanujam, V. (1987). Measurement of business economic
performance: An examination of method convergence. Journal of Management, 13,
109-122.
Wand, J. (2003). Stepwise Regression. Encyclopedia of Social Science Research Methods.
Retrieved March 23, 2011, from http://www.sage-
ereference.com.floyd.lib.umn.edu/socialscience/Article_n974.html

118
Wilderom, C. P. M., Glunk, U., & Maslowski, R. (2000). Organizational culture as a
predictor of organizational performance. In N. M. Ashkanasy, C. P. M. Wilderom, &
M. F. Peterson (Eds.), Handbook of organizational culture and climate (pp. 193-211).
Thousand Oaks: Sage.
Yang, B. (2005). Factor analysis methods. In R. A. Swanson & E. F. Holton III (Eds.),
Research in organizations: Foundations and methods of inquiry (pp. 181-199). San
Francisco: Berrett-Koehler.

119
Appendix A: Organizational Culture and Financial Performance Studies

120
Appendix A Organizational Culture and Financial Performance Studies
Reference Purpose(s) of
the Study
Dimensions of Employee
Perceptions
Financial Measure
Organizations Involved
Respondents Involved
Results
Booth & Hamer (2009)
To determine if culture is a significant factor in determining financial performance
Employee responses were categorized under 5 themes: (1) Degree of commitment, (2) Job satisfaction, trust, and respect; (3) Management support; (4) Career development and fairness; and (5) Work conditions and improvements
Sales Intensity reflecting corporate financial performance at the retail store level
500 stores of a major retailing organization based in the UK
Approximately 100,000 respondents
Culture was not found to be a strong predictor of performance overall. Morale and satisfaction were found to have a modest influence financial performance

121
Reference Purpose(s) of
the Study
Dimensions of Employee
Perceptions
Financial Measure
Organizations Involved
Respondents Involved
Results
Borucki & Burke (1999)
To examine the role of organizational climate variables and their influence on sales personnel performance and financial performance
(1) Goal emphasis, (2) Means emphasis/general training, (3) Means emphasis/specific training, (4) Management support, (5) Non-monetary reward orientation, (6) Monetary reward orientation, (7) Organizational service orientation, (8) Merchandise-related obstacles, (9) Employee preparation-related obstacles, and (10) Human resource-related obstacles
Return on Sales, defined as operating profit/loss as a percentage of total sales
594 stores of a large retail chain located in the U.S.
34,866 employees for sample 1 and 34,365 employees for sample 2
Results support hypothesized linkage between organizational climate, service performance, and financial performance

122
Reference Purpose(s) of
the Study
Dimensions of Employee
Perceptions
Financial Measure
Organizations Involved
Respondents Involved
Results
Calori & Sarnin (1991)
(1) To build and test a tool for assessing corporate culture and (2) To test some hypotheses about the relationship between culture and financial performance.
Numerous employee perception variables were a part of this study including 88 management practices corresponding to 17 culture dimensions
(1) Return on investment, (2) Return on sales, and (3) Annual variation of net turnover (a measure of sales growth)
5 organizations from various industries
260 individuals The following variables were found to relate to financial performance: (1) Personal fulfillment, (2) Listening to others, (3) Team spirit, (4) Responsibility, (5) Trust, (6) Openness to the environment, (7) Adaptation, (8) Anticipation, (9) Entrepreneurship, (10) Quality and consistency, (11) Participation in local activities, (12) Societal contribution, and (13) Flexibility

123
Reference Purpose(s) of
the Study
Dimensions of Employee
Perceptions
Financial Measure
Organizations Involved
Respondents Involved
Results
Cooil, Aksoy, Keiningham, & Maryott (2009)
To use multivariable partial least squares technique to identify latent climate variables which were used to explore the relationship between climate and performance
(1) Overall organizational climate, (2) Self-efficacy versus leader's efficacy, (3) Personal empowerment versus management facilitation
Store-level revenue per employee
107 "superstore" locations from a large, multinational retail grocery chain based in continental Western Europe
About 38,000 employees with an average of 360 employees per store
Overall organizational climate was not found to be significantly linked to revenue per employee

124
Reference Purpose(s) of
the Study
Dimensions of Employee
Perceptions
Financial Measure
Organizations Involved
Respondents Involved
Results
Davidson et al. (2007)
To determine if a relationship exists between organizational culture profile and financial performance of a bank in South Africa.
(1) Involvement, (2) Consistency, (3) Adaptability, and (4) Mission
(1) Net interest income / operating income; (2) Non-interest revenue / operating income; (3) Operating expenses / operating income, and (4) Net income after interest and taxes / operating income
14 departments of an investment bank in South Africa
327 employees Few financial measures were found to correlate with components of culture specified in the study

125
Reference Purpose(s) of
the Study
Dimensions of Employee
Perceptions
Financial Measure
Organizations Involved
Respondents Involved
Results
Denison & Mishra (1995)
To determine what characteristics of organizational culture relate to effectiveness?
(1) Involvement, (2) Consistency, (3) Adaptability, and (4) Mission
(1) Return on assets and (2) Sales growth
Organizations from numerous industries
764 senior executives from various organizations
Culture measures were found to be weak predictors of sales growth and profits but instead were stronger predictors of quality, employee satisfaction, and overall performance
Denison (1984)
To determine the relationship between organizational culture and with effectiveness
(1) Organization of work, (2) Emphasis on human resources, (3) Job design, (4) Involvement, (5) Adaptability, and (6) Mission
(1) Return on sales and (2) Return on investment
6,671 work groups from 34 firms in 25 different industries
43,747 respondents
Organization of work and decision-making practices were found to have the closest relationships with financial performance

126
Reference Purpose(s) of
the Study
Dimensions of Employee
Perceptions
Financial Measure
Organizations Involved
Respondents Involved
Results
Flamholtz & Kannan-Narasimhan (2005)
(1) To identify the elements of an organization's culture and (2) To determine which elements are important in influencing the financial performance
(1) Customer focus, (2) Corporate citizenship, (3) Performance standards, (4) Identification with the company, (5) Human resource practices, (6) Organizational communication
Earnings before interest and taxes
An industrial manufacturer located in the U.S. with 18 divisions
702 employees The following variables were found to relate to financial performance: (1) Customer focus, (2) Corporate citizenship, (3) Performance standards, and (4) Identification with the company
Flamholtz (2001)
To determine if there is a relationship between corporate culture and financial performance
The degree to which the people in the division were "living the desired corporate culture" as perceived by employees
Earnings before interest and taxes
20 divisions of an industrial manufacturer located in the U.S.
741 employees A moderately strong relationship was found between financial performance and corporate culture buy-in

127
Reference Purpose(s) of
the Study
Dimensions of Employee
Perceptions
Financial Measure
Organizations Involved
Respondents Involved
Results
Flatt & Kowalczyk (2008)
To examine the relationship of reputation as a mediating variable between culture and firm performance
(1) Strength of corporate culture and (2) Reputation
(1) Market to book value and (2) Return on assets
Numerous companies in various industries; only the top executives in each company were invited to participate
600 top executives
Culture was found to have a moderate relationship with financial performance, and reputation was found to be a mediating variable between culture and financial performance
Gelade & Young (2005)
To explain bank performance as a function of climate factors influencing customer service factors which influence financial performance
(1) Commitment, (2) Team climate, (3) Job enablers, and (4) Support climate
Sales achievement, defined as actual branch sales as a percentage of target
1,407 branches of 4 banks operating in the United Kingdom and Ireland
26,109 employees
Results provided only limited support for the service profit chain theory where customer satisfaction mediates the relationship between climate and financial performance

128
Reference Purpose(s) of
the Study
Dimensions of Employee
Perceptions
Financial Measure
Organizations Involved
Respondents Involved
Results
Gordon & DiTomaso (1992)
To investigate the relationship between culture and performance by looking at culture strength.
(1) Clarity of strategy/shared goals, (2) Systematic decision making, (3) Integration / communication, (4) Innovation / Risk-taking, (5) Accountability, (6) Action orientation, (7) Fairness of rewards, (8) Development and promotion from within
(1) Assets and (2) Total premiums
11 insurance companies
850 respondents
Culture strength, a composite of all factors, was found to relate positively to firm performance
Hansen & Wernerfelt (1989)
To create a model of performance that integrates economic and organizational factors
(1) Emphasis on human resources and (2) Emphasis on goal attainment
Average return on assets
60 firms, representing 300 lines of business from the Fortune 1000
Over 50,000 respondents
Organizational factors emphasizing human resources and goal attainment were found to relate moderately to financial performance

129
Reference Purpose(s) of
the Study
Dimensions of Employee
Perceptions
Financial Measure
Organizations Involved
Respondents Involved
Results
Harter, Schmidt, and Hayes (2002)
To examine employee perceptions of the work environment and their relationships to business outcomes
(1) Employee perceptions of work characteristics and management practices and (2) Overall employee satisfaction
Profitability, defined as profit as a percentage of revenue as well as other productivity measures
7,939 business units of 36 unique companies from various industries
198,514 employees
Correlations between climate and financial performance were positive but of a lower magnitude than were shown for other outcome variables in the study
Johnson, Davis, & Albright (2009)
To investigate the hypothesis that firm performance predicts attitudes
(1) Job satisfaction, (2) Pay satisfaction, (3) Organizational commitment, and (4) Organizational justice
Return On Assets (ROA)
45 branches and one headquarters location of a community bank operating within one state in the U.S.
293 employees in sample 1 and 364 employees in sample 2
Findings suggest financial performance leads to employee attitudes most specifically when the financial performance improved

130
Reference Purpose(s) of
the Study
Dimensions of Employee
Perceptions
Financial Measure
Organizations Involved
Respondents Involved
Results
Kotter & Heskett (1992)
To test whether culture relates to firm financial performance under different conditions
Strength of culture (1) Average yearly increase in net income, (2) Average yearly return on investment, and (3) Average yearly increase in stock price
Numerous companies in various industries; only the top executives in each company were invited to participate
600 top executives
A modest, positive relationship between culture and financial performance was found

131
Reference Purpose(s) of
the Study
Dimensions of Employee
Perceptions
Financial Measure
Organizations Involved
Respondents Involved
Results
Koys (2001) To investigate the relationship between unit-level measures employee satisfaction, organizational citizenship behavior, employee turnover, customer satisfaction, and financial performance
(1) Employee satisfaction and (2) Organizational citizenship
(1) Profits after controllable expenses and (2) Profits after controllable expenses as a percent of sales
28 locations of a restaurant chain
774 hourly employees in sample 1 and 693 employees in sample 2
Employee satisfaction and organizational citizenship behavior predicted unit-level profitability but the relationships are weak
Leung (1997)
To examine the link between attitudes and performance using a group-level analysis of individual responses
(1) General satisfaction and (2) Organizational commitment
Total revenue 26 locations of a retail chain specializing in casual apparel in Hong Kong
231 sales staff employees
Job satisfaction showed a moderate relationship with financial performance

132
Reference Purpose(s) of
the Study
Dimensions of Employee
Perceptions
Financial Measure
Organizations Involved
Respondents Involved
Results
Marcoulides & Heck (1993)
To create and test a model of organizational culture and performance
(1) Organizational structure and purpose, (2) Organizational values, (3) Task organization, (4) Organizational climate, (5) Work attitudes and goals
A composite variable composed of (1) Volume, (2) Share, (3) Profit, and (4) Return
26 organizations in various industries
392 respondents
The organizational variables together were found to predict financial performance
Ogbonna & Harris (2000)
To demonstrate links between three variables: (1) leadership, (2) organizational culture, and (3) organizational performance
Four culture profiles: (1) Community, (2) Competitive, (3) Bureaucratic, and (4) Innovative; Three styles of leadership: (1) Participative, (2) Supportive, and (3) Instrumental
Organizational Performance (derived from customer satisfaction, sales growth, market share, competitive advantage, and volume)
322 organization in multiple industries with one senior executive response per organization
322 respondents
Claims that strong culture and performance are linked were not supported; however, competitive and innovative culture was moderately linked to performance

133
Reference Purpose(s) of
the Study
Dimensions of Employee
Perceptions
Financial Measure
Organizations Involved
Respondents Involved
Results
Paradise-Tornow (1991)
To examine the role and impact of leadership and management in creating a service-quality organizational culture
(1) Leadership practices, (2) Management culture, and (3) Employee connectedness
Various, including a measure of contribution margin
25 bank branches of a financial services holding company located in the Midwest of the U.S.
1,415 employees from branches with sizes of 20-128 employees
Management culture factors showed strong, but negative, relationships to the financial performance measures
Petty et al. (1995)
To identify a relationship between culture and performance
(1) Teamwork, (2) Trust and credibility, (3) Organizational functioning, and (4) Performance and common goals
Organizational Performance (derived from Operations, Customer Accounting, Support Services, Marketing, and Employee Safety and Health)
12 service organizations within the utility industry in the U.S. with 11,000 employees total
832 employees in sample 1 and 884 employees in sample 2
Measures of culture were significantly related to performance; the strongest link was between teamwork and performance

134
Reference Purpose(s) of
the Study
Dimensions of Employee
Perceptions
Financial Measure
Organizations Involved
Respondents Involved
Results
Rousseau (1990)
The purpose of this research is to investigate differences in normative beliefs between high and low fund raising units.
Employee perceptions in three categories: (1) Team-oriented/satisfaction-oriented, (2) People/security, and perceptions, and (3) Task/security
Funds raised annually
32 units of a geographically dispersed non-profit. Each leader got 10 questionnaires to distribute
263 respondents
A statistically significant relationship between culture and performance was not found; however, the study found a link between beliefs and performance
Ryan, Schmit, & Johnson (1996)
To examine the relationship between attitudes and effectiveness at group levels
(1) Job/company satisfaction, (2) Supervision, and (3) Work group/teamwork
Various, including (1) profit, (2) market share
142 branches of a financial services organization in North America.
About 5,300 employees with an average of 41 responses per branch
No clear relationship was found between attitude measures and financial performance outcomes

135
Reference Purpose(s) of
the Study
Dimensions of Employee
Perceptions
Financial Measure
Organizations Involved
Respondents Involved
Results
Schneider et al. (2003)
To study the relationship between employee attitudes and performance with both variables indexed at the organizational level of analysis
Employee satisfaction with (1) Empowerment, (2) Job fulfillment, (3) Pay, (4) Work group, (5) Security, (6) Work fulfillment, and (7) Overall job satisfaction
(1) Return on assets and (2) Earnings per share
35 companies with an average sample size per company of 450 individuals
Over 7,700 respondents
This study found that organizational performance can be a driver of employee perceptions and attitudes

136
Reference Purpose(s) of
the Study
Dimensions of Employee
Perceptions
Financial Measure
Organizations Involved
Respondents Involved
Results
Schulte, Shmulyian, Ostroff, & Kinicki (2009)
To investigate how different characteristics of climate (elevation, variability, and shape) can be used to explain how climate operates in relation to internal and external indicators of organizational effectiveness
(1) Managerial task support, (2) Company vision, (3) Employee relationships, (4) Intra-organizational relationships, (5) Job adequacy, (6) Performance management and recognition, and (7) External service
Total store sales per square foot
86 stores of a national food distribution company
4,317 employees
Shape of a climate profile, but not elevation, was important for understanding the external effectiveness outcomes of customer satisfaction and financial performance

137
Reference Purpose(s) of
the Study
Dimensions of Employee
Perceptions
Financial Measure
Organizations Involved
Respondents Involved
Results
Sorensen (2002)
To examine the implications of the strong culture and performance claim by analyzing the effect of strong cultures on the variability of firm performance
Strength of culture (1) Return on invested capital and (2) Yearly operating cash flow
Numerous companies in various industries; only the top executives in each company were invited to participate
600 top executives
In stable environments, firms with strong culture were found to have less variability and more reliable performance; when the environment was more volatile, the reliability benefits of strong cultures diminished
Thompson (1996)
To determine the nature and strength of the relationships between various measures of employee perceptions and performance.
(1) Core values, (2) Customer commitment, (3) Business dimensions, (4) Communication, (5) Safety, (6) Business results, (7) Empowerment, (8) Innovation & risk taking, (9) Rewards & recognition, (10) Community
Contribution margin (profitability)
71 districts of a large utility with approximately 30,000 employees
Over 24,000 surveys
Overall climate index was found to positively related to financial performance
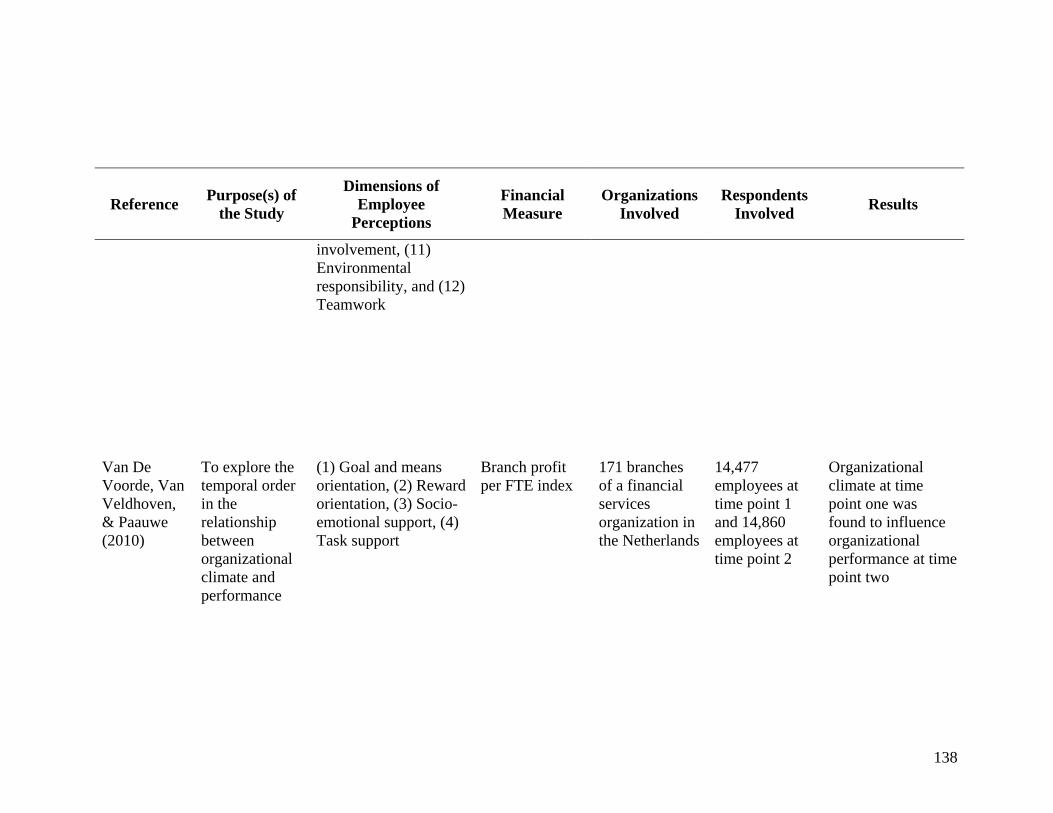
138
Reference Purpose(s) of
the Study
Dimensions of Employee
Perceptions
Financial Measure
Organizations Involved
Respondents Involved
Results
involvement, (11) Environmental responsibility, and (12) Teamwork
Van De Voorde, Van Veldhoven, & Paauwe (2010)
To explore the temporal order in the relationship between organizational climate and performance
(1) Goal and means orientation, (2) Reward orientation, (3) Socio-emotional support, (4) Task support
Branch profit per FTE index
171 branches of a financial services organization in the Netherlands
14,477 employees at time point 1 and 14,860 employees at time point 2
Organizational climate at time point one was found to influence organizational performance at time point two
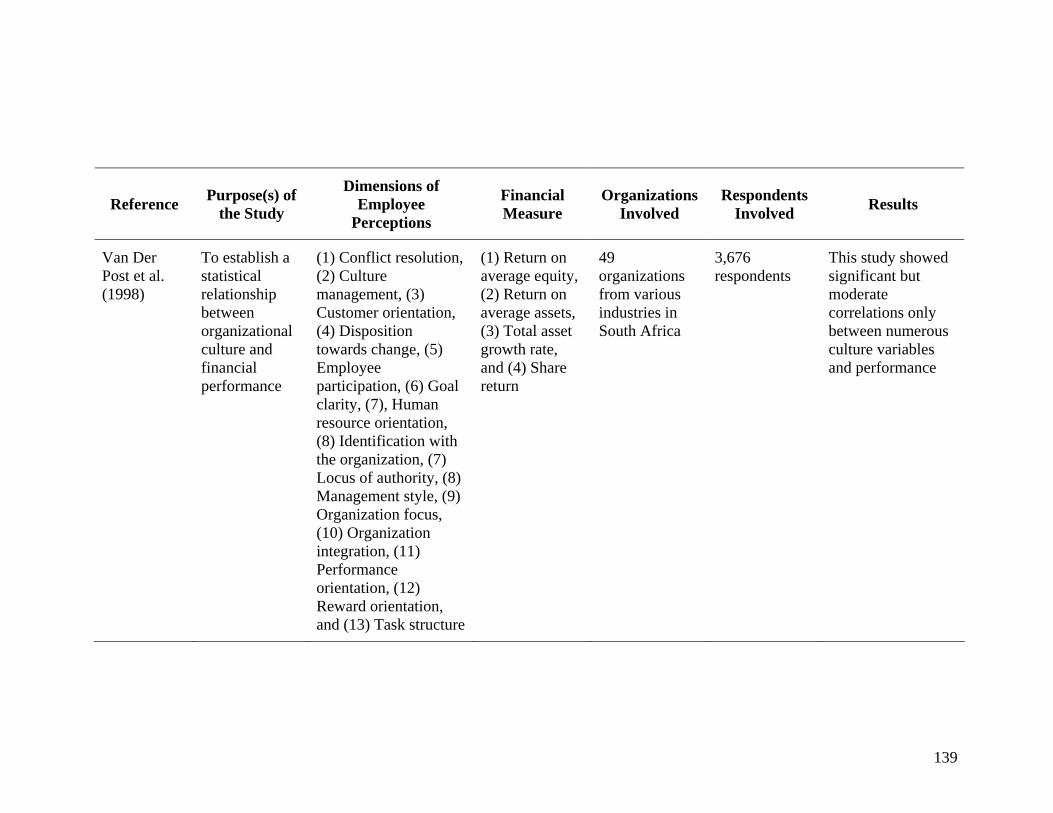
139
Reference Purpose(s) of
the Study
Dimensions of Employee
Perceptions
Financial Measure
Organizations Involved
Respondents Involved
Results
Van Der Post et al. (1998)
To establish a statistical relationship between organizational culture and financial performance
(1) Conflict resolution, (2) Culture management, (3) Customer orientation, (4) Disposition towards change, (5) Employee participation, (6) Goal clarity, (7), Human resource orientation, (8) Identification with the organization, (7) Locus of authority, (8) Management style, (9) Organization focus, (10) Organization integration, (11) Performance orientation, (12) Reward orientation, and (13) Task structure
(1) Return on average equity, (2) Return on average assets, (3) Total asset growth rate, and (4) Share return
49 organizations from various industries in South Africa
3,676 respondents
This study showed significant but moderate correlations only between numerous culture variables and performance

140
Appendix B: IRB Approval Letter

141
The IRB: Human Subjects Committee determined that the referenced study is exempt from review under federal guidelines 45 CFR Part 46.101(b) category #4 EXISTING DATA; RECORDS REVIEW; PATHOLOGICAL SPECIMENS. Study Number: 1101E94572 Principal Investigator: Michael De Georgeo Title(s): Employee Perceptions and Financial Performance This e-mail confirmation is your official University of Minnesota RSPP notification of exemption from full committee review. You will not receive a hard copy or letter. This secure electronic notification between password protected authentications has been deemed by the University of Minnesota to constitute a legal signature. The study number above is assigned to your research. That number and the title of your study must be used in all communication with the IRB office. If you requested a waiver of HIPAA Authorization and received this e-mail, the waiver was granted. Please note that under a waiver of the HIPAA Authorization, the HIPAA regulation [164.528] states that the subject has the right to request and receive an accounting of Disclosures of PHI made by the covered entity in the six years prior to the date on which the accounting is requested. If you are accessing a limited Data Set and received this email, receipt of the Data Use Agreement is acknowledged. This exemption is valid for five years from the date of this correspondence and will be filed inactive at that time. You will receive a notification prior to inactivation. If this research will extend beyond five years, you must submit a new application to the IRB before the study's expiration date. Upon receipt of this email, you may begin your research. If you have questions, please call the IRB office at (612) 626-5654. You may go to the View Completed section of eResearch Central at http://eresearch.umn.edu/ to view further details on your study. The IRB wishes you success with this research.

142
Appendix C: Survey Questions

143
Survey Definitions MY ORGANIZATION – The business unit, geographic location, or facility that you primarily identify as “where I work.” SENIOR MANAGEMENT - The “people at the top” of the organization where you work. Vice Presidents, business unit heads, site managers, general managers, country managers, organization heads in your specific organization or at corporate headquarters. Directions Please read each question carefully and respond by filling in the response square that most closely represents your opinion.
Strongly Agree Agree Neither Agree nor Disagree Disagree Strongly Disagree
Use only black or blue pen (preferred) or pencil. Make an “X” mark that fills the square completely IF YOU CANNOT ANSWER A QUESTION BECAUSE IT DOES NOT APPLY TO YOU, PLEASE LEAVE IT BLANK. Mission and Strategic Direction
1. I have a clear understanding of the organization’s mission. 2. The organization’s mission is consistent with my personal values. 3. The work I do supports the organization’s mission. 4. I have a clear understanding of my organization’s goals and priorities. 5. Decisions, actions, and plans in my organization support the organization’s
mission. Corporate Citizenship
6. The organization does a good job of maintaining good citizenship in the community where I work (for example, employee involvement, help for those in need, financial contributions, disaster relief).

144
7. My organization encourages employees to be involved in making a positive impact in their community (for example, volunteering time for community projects).
8. My organization demonstrates concern for the environment (for example, recycling, waste reduction, air and water).
Senior Management
9. Senior management at my organization has the ability to deal with the challenges we face.
10. Senior management gives employees a clear picture of the direction in which my organization is headed.
11. Senior management supports and practices high standards of ethical conduct. 12. When senior management at my organization says something, you can believe it’s
true. 13. In what they say and do, senior management demonstrates its commitment to the
organization’s mission. 14. Senior management demonstrates that employees are important to the success of
my organization. Customer Focus
15. Customer/client problems get corrected quickly. 16. Where I work, we set clear performance standards for product/service quality. 17. My organization places a higher priority on customer/client satisfaction than on
achieving short-term business goals. 18. Overall, customers/clients are very satisfied with the products and services they
receive from my organization. Measurement
19. We regularly use customer/client feedback to improve our work processes. 20. I get enough information about how well my work group is meeting its goals. 21. I have measures of quality for my work (for example, scorecards, customer/client
satisfaction, cycle time, re-work, financial). Operating Effectiveness
22. In my work group, we adapt and respond quickly to changing business needs. 23. In my work group, we are effective at increasing the speed of delivery of our
products/services. 24. In my work group, we are effective at eliminating unnecessary tasks and steps. 25. When there are problems in my work group, they get corrected quickly.

145
26. Where I work, day-to-day decisions demonstrate that quality and improvement are top priorities.
27. Where I work, managers effectively drive continuous improvement efforts. Immediate Manager/Supervisor
28. My immediate manager/supervisor makes it clear what I am expected to do. 29. My immediate manager/supervisor actively works with me to develop my job
skills and abilities. 30. My immediate manager/supervisor gives me feedback that helps me improve my
performance. 31. My immediate manager/supervisor treats employees fairly. 32. My performance on the job is evaluated fairly. 33. My immediate manager/supervisor creates an environment of trust, respect, and
appreciation for individual differences. 34. My immediate manager/supervisor supports and practices high standards of
ethical conduct. Teamwork
35. In my organization, we are all in this together. 36. The people I work with cooperate to get the job done. 37. Other work groups give us the support we need to serve our customers/clients. 38. In my organization, teams are used effectively to get the job done. 39. Where I work, we exchange ideas and best practices with other groups across the
organization. Valuing Employees
40. I have the tools, technology, and equipment I need to do my job. 41. I am satisfied with the safety and health conditions in my work area. 42. Employees are encouraged to balance their work life and personal life. 43. My organization makes it easy for people from diverse backgrounds to fit in and
be accepted. 44. My organization supports the development and advancement of employees
without regard to individual differences (for example, disability, race, gender). 45. I can be myself around here. 46. Where I work, employees are recognized for delivering outstanding customer
service. 47. I am satisfied with the recognition I receive for doing a good job. 48. I am paid fairly for the work I do. 49. I am satisfied with my total benefits program. 50. I feel valued as an employee.
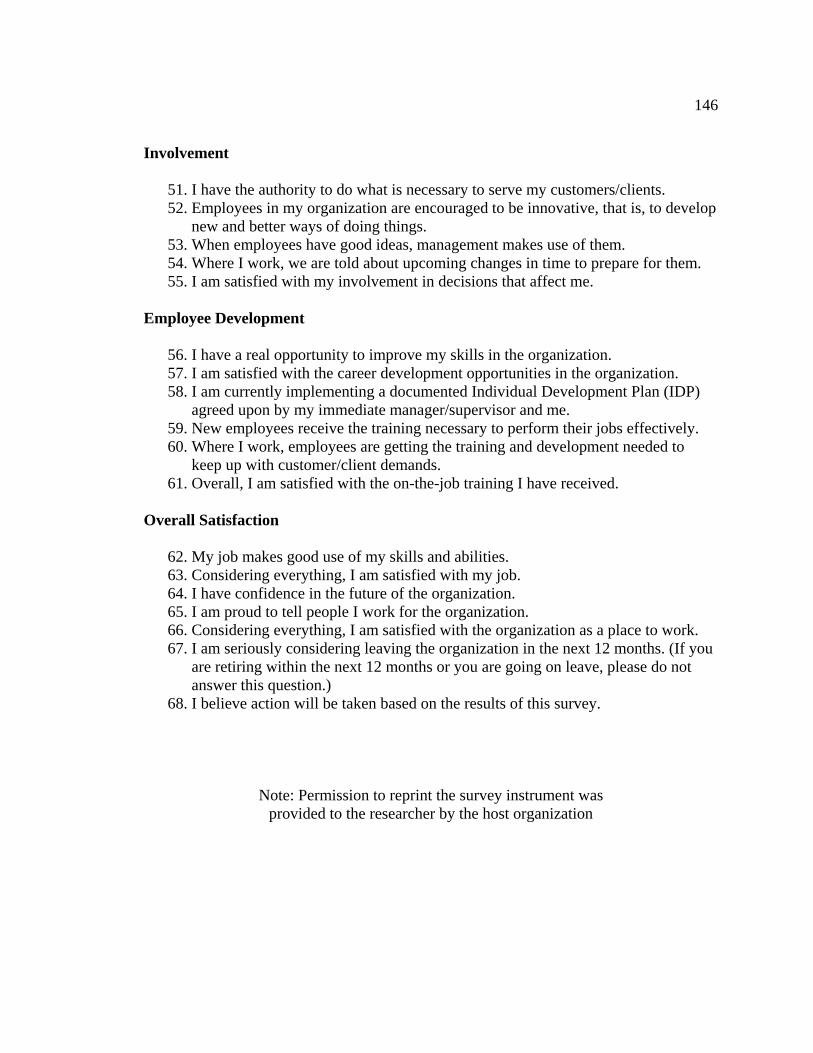
146
Involvement
51. I have the authority to do what is necessary to serve my customers/clients. 52. Employees in my organization are encouraged to be innovative, that is, to develop
new and better ways of doing things. 53. When employees have good ideas, management makes use of them. 54. Where I work, we are told about upcoming changes in time to prepare for them. 55. I am satisfied with my involvement in decisions that affect me.
Employee Development
56. I have a real opportunity to improve my skills in the organization. 57. I am satisfied with the career development opportunities in the organization. 58. I am currently implementing a documented Individual Development Plan (IDP)
agreed upon by my immediate manager/supervisor and me. 59. New employees receive the training necessary to perform their jobs effectively. 60. Where I work, employees are getting the training and development needed to
keep up with customer/client demands. 61. Overall, I am satisfied with the on-the-job training I have received.
Overall Satisfaction
62. My job makes good use of my skills and abilities. 63. Considering everything, I am satisfied with my job. 64. I have confidence in the future of the organization. 65. I am proud to tell people I work for the organization. 66. Considering everything, I am satisfied with the organization as a place to work. 67. I am seriously considering leaving the organization in the next 12 months. (If you
are retiring within the next 12 months or you are going on leave, please do not answer this question.)
68. I believe action will be taken based on the results of this survey.
Note: Permission to reprint the survey instrument was provided to the researcher by the host organization

147
Appendix D: Factor Loadings - First EFA (68 Items)

148
EFA Loadings Using Promax Rotation of Employee Perception Items (68 items)
Pattern Matrixa
Factor
1 2 3 4 5 6 7 8 9 10 11 12
q01 .88
q02 .83
q03 .76
q04 .57
q05
q06 .77
q07 .96
q08 .66
q09 .75
q10 .81
q11 .67
q12 .86
q13 .84
q14 .74
q15 .57
q16 .58
q17 .57
q18 .51
q19 .50
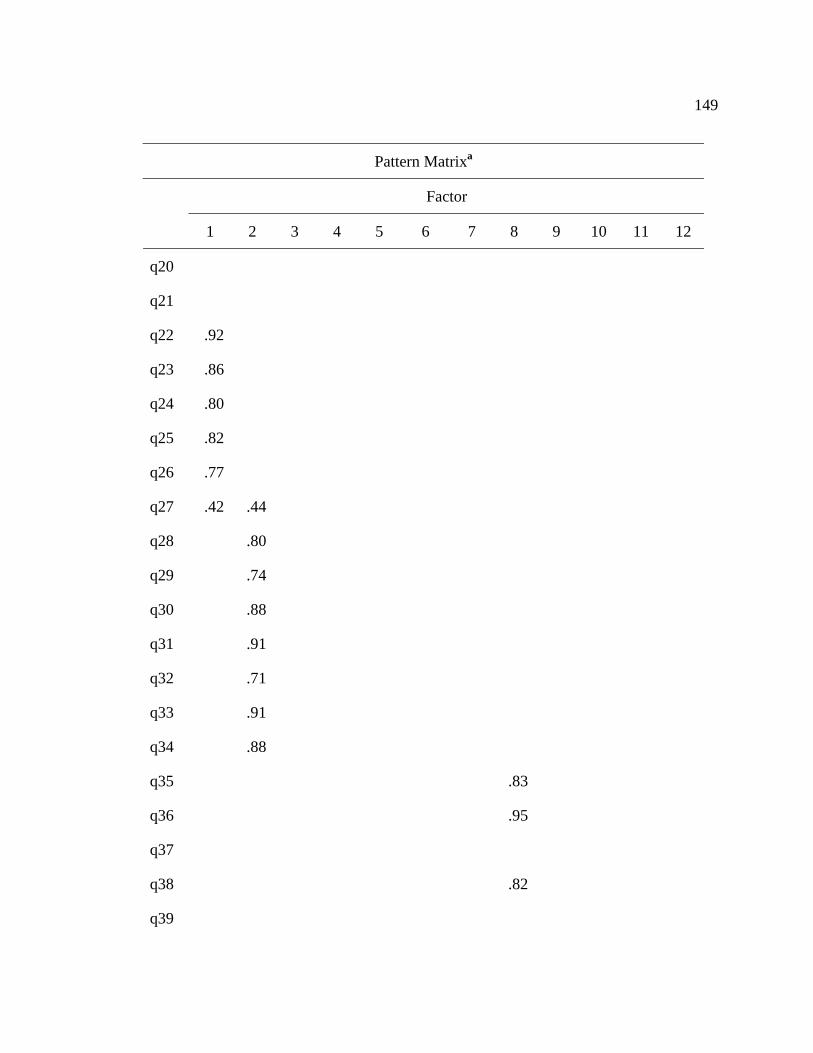
149
Pattern Matrixa
Factor
1 2 3 4 5 6 7 8 9 10 11 12
q20
q21
q22 .92
q23 .86
q24 .80
q25 .82
q26 .77
q27 .42 .44
q28 .80
q29 .74
q30 .88
q31 .91
q32 .71
q33 .91
q34 .88
q35 .83
q36 .95
q37
q38 .82
q39

150
Pattern Matrixa
Factor
1 2 3 4 5 6 7 8 9 10 11 12
q40
q41
q42
q43 .87
q44 .89
q45 .49
q46
q47 .63
q48 1.06
q49 .87
q50 .63
q51 .79
q52 .89
q53 .83
q54 .50
q55 .56
q56 .86
q57 .90
q58 .41
q59 .87

151
Pattern Matrixa
Factor
1 2 3 4 5 6 7 8 9 10 11 12
q60 .90
q61 .72
q62 .46
q63 .44
q64 .50
q65 .50
q66 .54
q67
q68
Extraction Method: Principal Axis Factoring. Rotation Method: Promax with Kaiser Normalization. a. Rotation converged in 12 iterations.

152
Appendix E: Factor Loadings - Second EFA (56 Items)
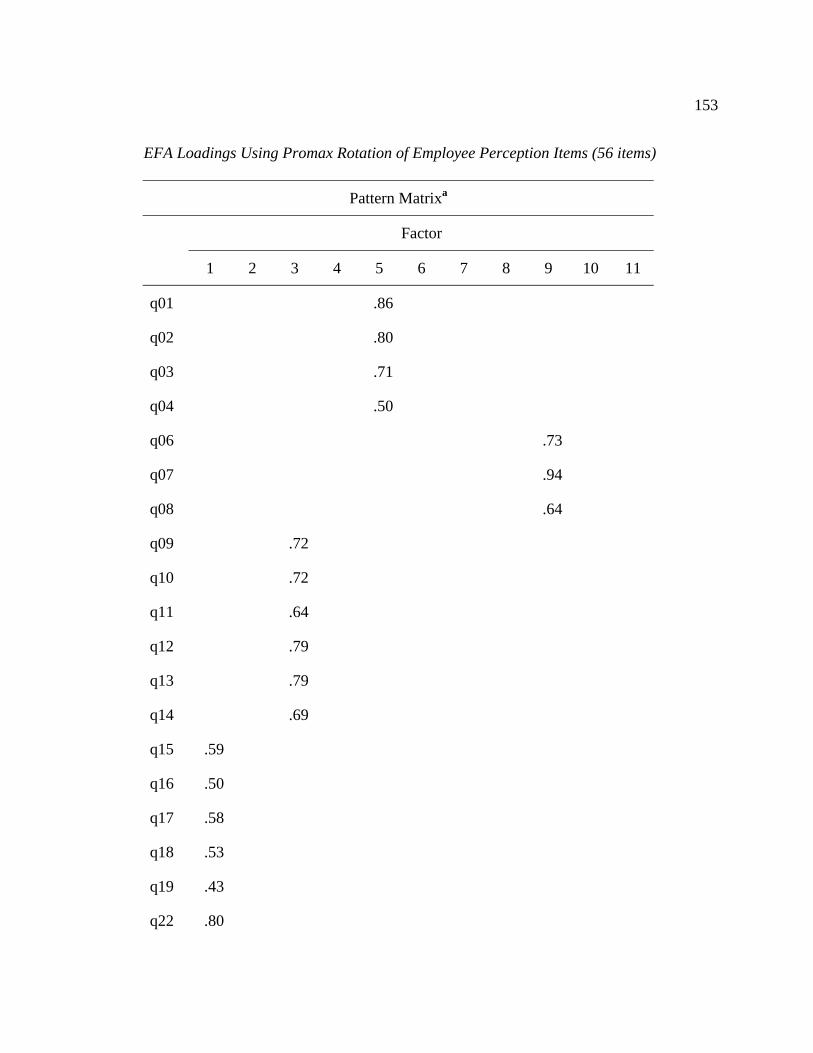
153
EFA Loadings Using Promax Rotation of Employee Perception Items (56 items)
Pattern Matrixa
Factor
1 2 3 4 5 6 7 8 9 10 11
q01 .86
q02 .80
q03 .71
q04 .50
q06 .73
q07 .94
q08 .64
q09 .72
q10 .72
q11 .64
q12 .79
q13 .79
q14 .69
q15 .59
q16 .50
q17 .58
q18 .53
q19 .43
q22 .80

154
Pattern Matrixa
Factor
1 2 3 4 5 6 7 8 9 10 11
q23 .76
q24 .67
q25 .70
q26 .65
q28 .82
q29 .85
q30 .95
q31 .88
q32 .75
q33 .90
q34 .83
q35 .78
q36 .89
q38 .67
q43 .87
q44 .97
q45 .49
q47 .46
q48 .93
q49 .74

155
Pattern Matrixa
Factor
1 2 3 4 5 6 7 8 9 10 11
q50 .49
q51 .68
q52 .85
q53 .85
q54 .67
q55 .69
q56
q57 .42
q58
q59 .88
q60 .88
q61 .74
q62 .44
q63 .64
q64 .71
q65 .77
q66 .80
Extraction Method: Principal Axis Factoring. Rotation Method: Promax with Kaiser Normalization. a. Rotation converged in 8 iterations.

156
Appendix F: Factor Loadings - Third EFA (54 Items)

157
EFA Loadings Using Promax Rotation of Employee Perception Items (54 items)
Pattern Matrixa
Factor
1 2 3 4 5 6 7 8 9 10 11
q01 .88
q02 .81
q03 .72
q04 .51
q06 .73
q07 .93
q08 .64
q09 .74
q10 .76
q11 .65
q12 .82
q13 .81
q14 .71
q15 .57
q16 .53
q17 .55
q18 .50
q19 .43
q22 .84

158
Pattern Matrixa
Factor
1 2 3 4 5 6 7 8 9 10 11
q23 .80
q24 .73
q25 .77
q26 .68
q28 .82
q29 .85
q30 .96
q31 .88
q32 .74
q33 .90
q34 .84
q35 .80
q36 .91
q38 .68
q43 .87
q44 .96
q45 .51
q47 .50
q48 1.06
q49 .83

159
Pattern Matrixa
Factor
1 2 3 4 5 6 7 8 9 10 11
q50 .55
q51 .74
q52 .91
q53 .88
q54 .59
q55 .63
q57
q59 .88
q60 .88
q61 .76
q62
q63 .54
q64 .67
q65 .78
q66 .78
Extraction Method: Principal Axis Factoring. Rotation Method: Promax with Kaiser Normalization. a. Rotation converged in 8 iterations.

160
Appendix G: Factor Loadings - Fourth (Final) EFA (52 Items)

161
EFA Loadings Using Promax Rotation of Employee Perception Items (52 items)
Pattern Matrixa
Factor
1 2 3 4 5 6 7 8 9 10 11
q01 .88
q02 .81
q03 .72
q04 .51
q06 .72
q07 .93
q08 .63
q09 .76
q10 .79
q11 .67
q12 .85
q13 .83
q14 .74
q15 .56
q16 .54
q17 .55
q18 .50
q19 .44
q22 .86

162
Pattern Matrixa
Factor
1 2 3 4 5 6 7 8 9 10 11
q23 .81
q24 .75
q25 .78
q26 .69
q28 .81
q29 .84
q30 .95
q31 .87
q32 .74
q33 .89
q34 .83
q35 .79
q36 .91
q38 .67
q43 .86
q44 .92
q45 .51
q47 .49
q48 1.02
q49 .81
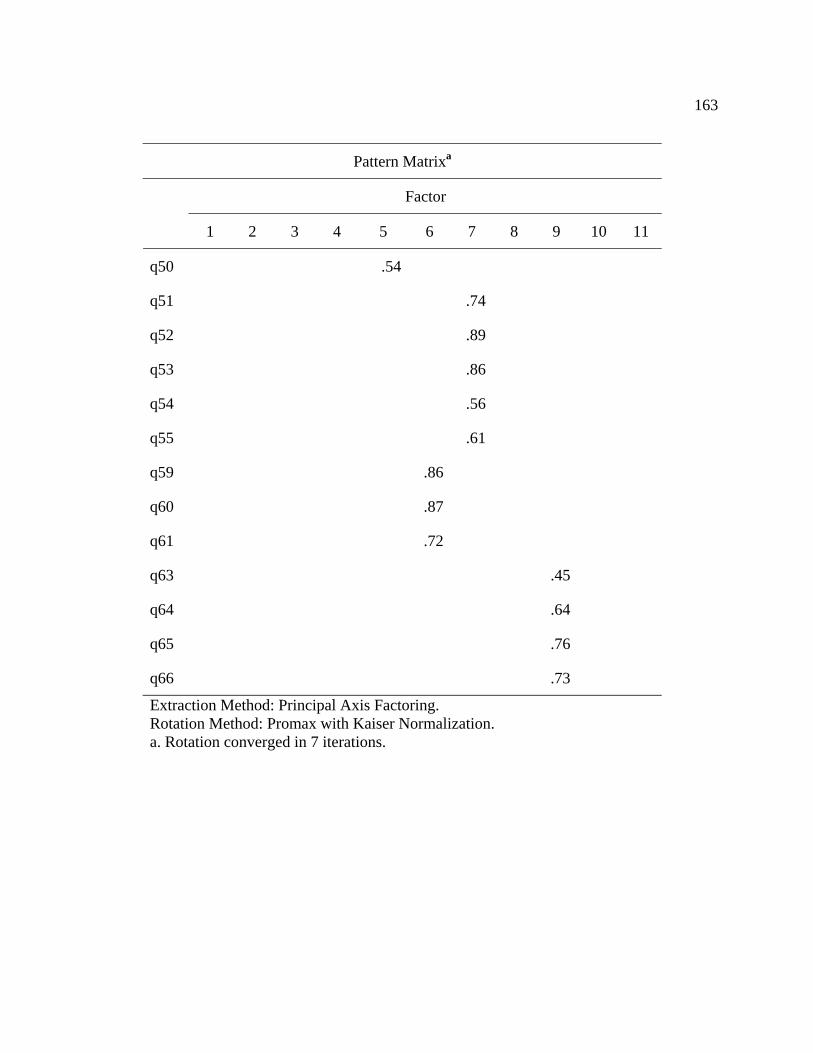
163
Pattern Matrixa
Factor
1 2 3 4 5 6 7 8 9 10 11
q50 .54
q51 .74
q52 .89
q53 .86
q54 .56
q55 .61
q59 .86
q60 .87
q61 .72
q63 .45
q64 .64
q65 .76
q66 .73
Extraction Method: Principal Axis Factoring. Rotation Method: Promax with Kaiser Normalization. a. Rotation converged in 7 iterations.

164
Appendix H: Comparison of Items and Factor Loadings: Original and Extracted

165
Comparison of Items and Factor Loadings: Original and Extracted
Item Original Factor
Assignment Revised Factor
Assignment
1. I have a clear understanding of the organization’s mission.
Mission and Strategic Direction
Factor 4 (Mission)
2. The organization’s mission is consistent with my personal values.
Mission and Strategic Direction
Factor 4 (Mission)
3. The work I do supports the organization’s mission.
Mission and Strategic Direction
Factor 4 (Mission)
4. I have a clear understanding of my organization’s goals and priorities.
Mission and Strategic Direction
Factor 4 (Mission)
5. Decisions, actions, and plans in my organization support the organization’s mission.
Mission and Strategic Direction
Excluded – Items dropped after EFA
Round #1
6. The organization does a good job of maintaining good citizenship in the community where I work (for example, employee involvement, help for those in need, financial contributions, disaster relief).
Corporate Citizenship Factor 8 (Corporate Social Responsibility)
7. My organization encourages employees to be involved in making a positive impact in their community (for example, volunteering time for community projects).
Corporate Citizenship Factor 8 (Corporate Social Responsibility)

166
Item Original Factor
Assignment Revised Factor
Assignment
8. My organization demonstrates concern for the environment (for example, recycling, waste reduction, air and water).
Corporate Citizenship Factor 8 (Corporate Social Responsibility)
9. Senior management at my organization has the ability to deal with the challenges we face.
Senior Management Factor 8 (Corporate Social Responsibility)
10. Senior management gives employees a clear picture of the direction in which my organization is headed.
Senior Management Factor 3 (Senior Management)
11. Senior management supports and practices high standards of ethical conduct.
Senior Management Factor 3 (Senior Management)
12. When senior management at my organization says something, you can believe it’s true.
Senior Management Factor 3 (Senior Management)
13. In what they say and do, senior management demonstrates its commitment to the organization’s mission.
Senior Management Factor 3 (Senior Management)
14. Senior management demonstrates that employees are important to the success of my organization.
Senior Management Factor 3 (Senior Management)
15. Customer/client problems get corrected quickly.
Customer Focus Factor 1 (Operational Effectiveness)
16. Where I work, we set clear performance standards for
Customer Focus Factor 1 (Operational

167
Item Original Factor
Assignment Revised Factor
Assignment
product/service quality. Effectiveness)
17. My organization places a higher priority on customer/client satisfaction than on achieving short-term business goals.
Customer Focus Factor 1 (Operational Effectiveness)
18. Overall, customers/clients are very satisfied with the products and services they receive from my organization.
Customer Focus Factor 1 (Operational Effectiveness)
19. We regularly use customer/client feedback to improve our work processes.
Measurement Factor 1 (Operational Effectiveness)
20. I get enough information about how well my work group is meeting its goals.
Measurement Excluded – Items dropped after EFA
Round #1
21. I have measures of quality for my work (for example, scorecards, customer/client satisfaction, cycle time, re-work, financial).
Measurement Excluded – Items dropped after EFA
Round #1
22. In my work group, we adapt and respond quickly to changing business needs.
Operating Effectiveness
Factor 1 (Operational Effectiveness)
23. In my work group, we are effective at increasing the speed of delivery of our products/services.
Operating Effectiveness
Factor 1 (Operational Effectiveness)
24. In my work group, we are effective at eliminating unnecessary tasks and steps.
Operating Effectiveness
Factor 1 (Operational Effectiveness)

168
Item Original Factor
Assignment Revised Factor
Assignment
25. When there are problems in my work group, they get corrected quickly.
Operating Effectiveness
Factor 1 (Operational Effectiveness)
26. Where I work, day-to-day decisions demonstrate that quality and improvement are top priorities.
Operating Effectiveness
Factor 1 (Operational Effectiveness)
27. Where I work, managers effectively drive continuous improvement efforts.
Operating Effectiveness
Excluded – Items dropped after EFA
Round #1
28. My immediate manager/supervisor makes it clear what I am expected to do.
Immediate Manager/Supervisor
Factor 2 (Immediate Manager/Supervisor)
29. My immediate manager/supervisor actively works with me to develop my job skills and abilities.
Immediate Manager/Supervisor
Factor 2 (Immediate Manager/Supervisor)
30. My immediate manager/supervisor gives me feedback that helps me improve my performance.
Immediate Manager/Supervisor
Factor 2 (Immediate Manager/Supervisor)
31. My immediate manager/supervisor treats employees fairly.
Immediate Manager/Supervisor
Factor 2 (Immediate Manager/Supervisor)
32. My performance on the job is evaluated fairly.
Immediate Manager/Supervisor
Factor 2 (Immediate Manager/Supervisor)
33. My immediate manager/supervisor creates an environment of trust, respect, and appreciation for individual differences.
Immediate Manager/Supervisor
Factor 2 (Immediate Manager/Supervisor)

169
Item Original Factor
Assignment Revised Factor
Assignment
34. My immediate manager/supervisor supports and practices high standards of ethical conduct.
Immediate Manager/Supervisor
Factor 2 (Immediate Manager/Supervisor)
35. In my organization, we are all in this together.
Teamwork Factor 10 (Teamwork)
36. The people I work with cooperate to get the job done.
Teamwork Factor 10 (Teamwork)
37. Other work groups give us the support we need to serve our customers/clients.
Teamwork Excluded – Items dropped after EFA
Round #1
38. In my organization, teams are used effectively to get the job done.
Teamwork Factor 10 (Teamwork)
39. Where I work, we exchange ideas and best practices with other groups across the organization.
Teamwork Excluded – Items dropped after EFA
Round #1
40. I have the tools, technology, and equipment I need to do my job.
Valuing Employees Excluded – Items dropped after EFA
Round #1
41. I am satisfied with the safety and health conditions in my work area.
Valuing Employees Excluded – Items dropped after EFA
Round #1
42. Employees are encouraged to balance their work life and personal life.
Valuing Employees Excluded – Items dropped after EFA
Round #1
43. My organization makes it easy for people from diverse backgrounds to fit in and be accepted.
Valuing Employees Factor 11 (Inclusion)

170
Item Original Factor
Assignment Revised Factor
Assignment
44. My organization supports the development and advancement of employees without regard to individual differences (for example, disability, race, gender).
Valuing Employees Factor 11 (Inclusion)
45. I can be myself around here. Valuing Employees Factor 11 (Inclusion)
46. Where I work, employees are recognized for delivering outstanding customer service.
Valuing Employees Excluded – Items dropped after EFA
Round #1
47. I am satisfied with the recognition I receive for doing a good job.
Valuing Employees Factor 5 (Valuing Employees)
48. I am paid fairly for the work I do.
Valuing Employees Factor 5 (Valuing Employees)
49. I am satisfied with my total benefits program.
Valuing Employees Factor 5 (Valuing Employees)
50. I feel valued as an employee.
Valuing Employees Factor 5 (Valuing Employees)
51. I have the authority to do what is necessary to serve my customers/clients.
Involvement Factor 7 (Involvement)
52. Employees in my organization are encouraged to be innovative, that is, to develop new and better ways of doing things.
Involvement Factor 7 (Involvement)
53. When employees have good ideas, management makes use of them.
Involvement Factor 7 (Involvement)

171
Item Original Factor
Assignment Revised Factor
Assignment
54. Where I work, we are told about upcoming changes in time to prepare for them.
Involvement Factor 7 (Involvement)
55. I am satisfied with my involvement in decisions that affect me.
Involvement Factor 7 (Involvement)
56. I have a real opportunity to improve my skills in the organization.
Employee Development
Excluded – Items dropped after EFA
Round #2
57. I am satisfied with the career development opportunities in the organization.
Employee Development
Excluded – Items dropped after EFA
Round #3
58. I am currently implementing a documented Individual Development Plan (IDP) agreed upon by my immediate manager/supervisor and me.
Employee Development
Excluded – Items dropped after EFA
Round #2
59. New employees receive the training necessary to perform their jobs effectively.
Employee Development
Factor 6 (Training)
60. Where I work, employees are getting the training and development needed to keep up with customer/client demands.
Employee Development
Factor 6 (Training)
61. Overall, I am satisfied with the on-the-job training I have received.
Employee Development
Factor 6 (Training)
62. My job makes good use of my skills and abilities.
Overall Satisfaction Excluded – Items dropped after EFA

172
Item Original Factor
Assignment Revised Factor
Assignment
Round #3
63. Considering everything, I am satisfied with my job.
Overall Satisfaction Factor 9 (Satisfaction)
64. I have confidence in the future of the organization.
Overall Satisfaction Factor 9 (Satisfaction)
65. I am proud to tell people I work for the organization.
Overall Satisfaction Factor 9 (Satisfaction)
66. Considering everything, I am satisfied with the organization as a place to work.
Overall Satisfaction Factor 9 (Satisfaction)
67. I am seriously considering leaving the organization in the next 12 months. (If you are retiring within the next 12 months or you are going on leave, please do not answer this question.)
Overall Satisfaction Excluded – Items dropped after EFA
Round #1
68. I believe action will be taken based on the results of this survey.
Overall Satisfaction Excluded – Items dropped after EFA
Round #1

173
Appendix I: Structure Matrix

174
EFA Structure Matrix
Structure Matrix
Factor
1 2 3 4 5 6 7 8 9 10 11
q01 .28 .22 .34 .83 .22 .21 .27 .27 .31 .20 .27
q02 .28 .25 .33 .80 .21 .21 .25 .29 .34 .20 .29
q03 .33 .25 .35 .76 .26 .26 .31 .33 .39 .26 .28
q04 .42 .35 .50 .64 .35 .30 .40 .38 .38 .30 .35
q06 .35 .31 .39 .29 .30 .28 .38 .73 .32 .26 .31
q07 .38 .35 .42 .33 .35 .33 .43 .90 .34 .33 .38
q08 .36 .32 .39 .30 .30 .29 .39 .69 .27 .29 .39
q09 .54 .39 .80 .30 .48 .36 .58 .43 .51 .38 .44
q10 .51 .44 .81 .35 .49 .36 .58 .42 .46 .39 .42
q11 .45 .43 .71 .39 .38 .33 .45 .37 .50 .41 .48
q12 .51 .42 .83 .35 .51 .36 .56 .39 .50 .41 .48
q13 .53 .43 .85 .44 .48 .40 .57 .43 .54 .42 .50
q14 .55 .47 .82 .32 .58 .39 .61 .40 .57 .47 .49
q15 .63 .31 .52 .20 .39 .35 .58 .31 .41 .30 .34
q16 .67 .45 .47 .37 .30 .41 .50 .33 .36 .46 .40
q17 .69 .42 .55 .28 .39 .36 .60 .37 .42 .40 .45
q18 .62 .35 .46 .31 .32 .35 .50 .30 .44 .40 .40
q19 .61 .40 .47 .25 .35 .35 .52 .34 .30 .41 .38
q22 .77 .40 .44 .28 .37 .37 .52 .33 .42 .46 .41

175
Structure Matrix
Factor
1 2 3 4 5 6 7 8 9 10 11
q23 .76 .38 .45 .28 .36 .36 .51 .31 .41 .47 .42
q24 .73 .43 .42 .26 .41 .37 .49 .37 .34 .51 .43
q25 .78 .49 .44 .27 .44 .39 .52 .34 .35 .60 .46
q26 .79 .53 .49 .36 .43 .43 .57 .38 .42 .58 .49
q28 .46 .79 .38 .28 .42 .42 .50 .36 .33 .42 .42
q29 .47 .82 .39 .22 .44 .45 .52 .39 .32 .42 .44
q30 .47 .88 .40 .27 .44 .45 .53 .39 .34 .42 .44
q31 .45 .84 .42 .24 .46 .30 .47 .27 .37 .50 .51
q32 .46 .79 .42 .23 .55 .36 .51 .35 .40 .45 .52
q33 .48 .87 .45 .26 .48 .34 .52 .32 .38 .53 .52
q34 .40 .77 .44 .29 .39 .28 .42 .26 .37 .42 .47
q35 .59 .52 .47 .27 .46 .35 .54 .33 .43 .85 .50
q36 .53 .40 .39 .23 .37 .32 .44 .27 .39 .84 .44
q38 .60 .49 .45 .24 .44 .37 .56 .37 .42 .78 .50
q43 .44 .42 .41 .28 .41 .40 .47 .34 .38 .40 .78
q44 .46 .49 .47 .28 .47 .35 .50 .38 .41 .47 .86
q45 .53 .52 .49 .33 .56 .42 .62 .40 .53 .52 .73
q47 .48 .62 .49 .28 .74 .42 .64 .39 .47 .50 .63
q48 .35 .39 .44 .21 .84 .35 .50 .27 .46 .34 .41
q49 .35 .36 .45 .24 .76 .40 .47 .31 .52 .32 .41

176
Structure Matrix
Factor
1 2 3 4 5 6 7 8 9 10 11
q50 .53 .62 .60 .33 .84 .48 .72 .42 .63 .55 .65
q51 .56 .39 .49 .24 .51 .38 .74 .38 .48 .39 .46
q52 .58 .49 .50 .31 .51 .42 .81 .40 .49 .49 .49
q53 .59 .53 .59 .32 .52 .44 .83 .43 .48 .49 .52
q54 .58 .50 .56 .28 .51 .47 .72 .38 .38 .47 .47
q55 .63 .59 .60 .28 .67 .47 .82 .41 .48 .54 .58
q59 .41 .35 .36 .25 .41 .84 .43 .30 .36 .31 .39
q60 .49 .40 .40 .24 .43 .88 .50 .34 .39 .38 .40
q61 .43 .46 .41 .26 .46 .79 .51 .34 .45 .38 .45
q63 .54 .54 .55 .33 .70 .45 .62 .38 .74 .52 .57
q64 .45 .32 .58 .31 .53 .34 .51 .33 .76 .38 .44
q65 .41 .38 .48 .40 .44 .37 .45 .34 .77 .38 .42
q66 .53 .47 .57 .36 .61 .44 .59 .34 .84 .47 .49
Extraction Method: Principal Axis Factoring. Rotation Method: Promax with Kaiser Normalization.