Embed Size (px)
Citation preview
Employee Engagement &Corporate Social Responsibility
INDUSTRY REVIEW
AUGUST 2017
ISSUE 5
Case Study: Prime Therapeutics YourCause Global Goals Gateway
Discover how YourCause supports the
United Nations’ Global Goals and the
Impact 2030 initiatives.
60 Second Blog: Citrix
We sat down with the Global Director of
Corporate Citizenship at Citrix to discuss
their Cause Card incentive program for
socially conscious employees.
Infographic: The YourCause Difference
Understand what sets YourCause apart
from other employee engagement
platforms.
YourCause creates resources to enhance and educate professionals throughout the employee engagement industry. We encourage you to take full advantage of these additional resources and invite you to sign up for our e-newsletter. Visit www.YourCause.com to start exploring!
GETTING STARTED
THE MISSION
ADDITIONAL RESOURCES
Access these resources and more at www.YourCause.com
Learn how Prime Therapeutics exceeded
employee engagement levels AND reduced
time spent in program administration, all
while moving to a new CSR platform.
Twice a year, the YourCause team publishes our Industry Review focused on evaluating employee engagement and corporate social responsibility programs. This report uses performance data collected by the YourCause Employee Engagement platform between January and December of 2016. Throughout the following pages, we identify trends, activities and benchmarks in employee engagement and corporate social responsibility. Our clients, industry peers, and other interested parties may use this data as a barometer for performance measure-ment.
It is our hope that this fifth issue of the Industry Review continues our tradition of challenging, questioning, and improving the effectiveness of employee engagement efforts for both for-profit and nonprofit organizations. Please remember: the intent of this Industry Review is to encourage a better understanding of employee engagement and cross-program trends.
THE CONTENTS
Trends by Industry
Geographic Trends
2016 Disaster Campaigns
Nonprofit Trends
Global Goals Gateway
Payment Processing
Nonprofit Showcase
Overall Methodology
Glossary of Terms
YourCause Snapshot
What to Know
Founder’s Message
Key Findings
Global Employee Engagement
Domestic Giving by Region
Enterprise Engagement Trends
Donation Method Trends
Calendar Year Engagement
Program Trends
3
4
5
6
7 / 8
9 / 10
11 / 12
13
14
15 / 16
17 / 18
19 / 24
25 / 26
27 / 28
29 / 30
31 / 32
33 / 34
35 / 36
37 / 38
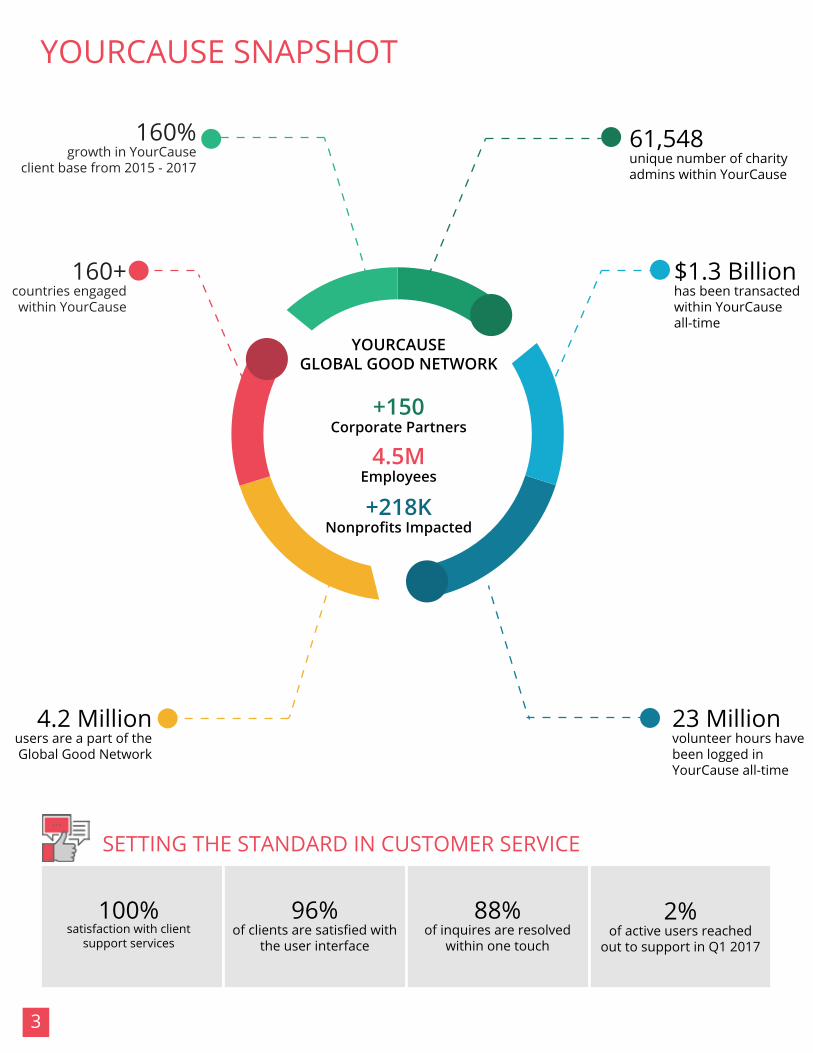
160% growth in YourCause
client base from 2015 - 2017
160+countries engaged within YourCause
4.2 Millionusers are a part of the Global Good Network
3
YOURCAUSE SNAPSHOT
YOURCAUSEGLOBAL GOOD NETWORK
+150 Corporate Partners
4.5MEmployees
+218KNonprofits Impacted
61,548unique number of charity admins within YourCause
100%satisfaction with client
support services
$1.3 Billionhas been transacted within YourCause all-time
23 Millionvolunteer hours havebeen logged in YourCause all-time
96% of clients are satisfied with
the user interface
SETTING THE STANDARD IN CUSTOMER SERVICE
160% growth in YourCause
client base from 2015 - 2017
160+countries engaged within YourCause
4.2 Millionusers are a part of the Global Good Network
88% of inquires are resolved
within one touch
2% of active users reached
out to support in Q1 2017
4
61,548unique number of charity admins within YourCause
$1.3 Billionhas been transacted within YourCause all-time
23 Millionvolunteer hours havebeen logged in YourCause all-time
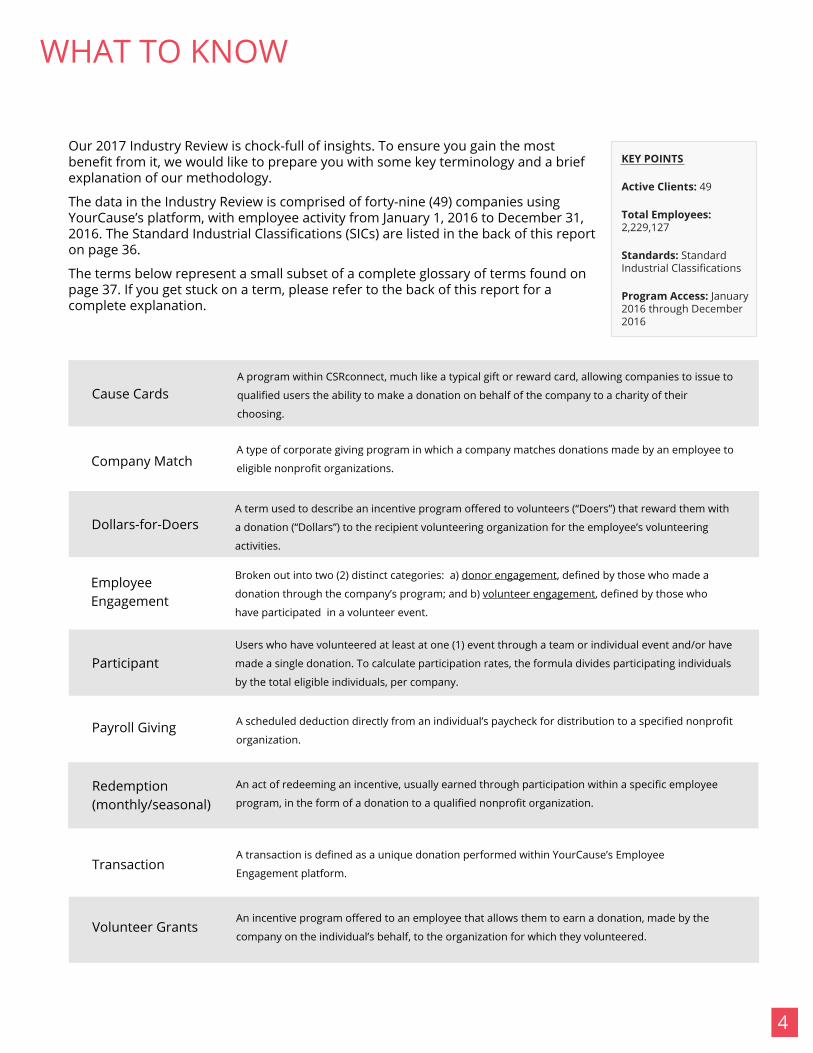
WHAT TO KNOW
Our 2017 Industry Review is chock-full of insights. To ensure you gain the most benefit from it, we would like to prepare you with some key terminology and a brief explanation of our methodology.
The data in the Industry Review is comprised of forty-nine (49) companies using YourCause’s platform, with employee activity from January 1, 2016 to December 31, 2016. The Standard Industrial Classifications (SICs) are listed in the back of this reporton page 36.
The terms below represent a small subset of a complete glossary of terms found on page 37. If you get stuck on a term, please refer to the back of this report for a complete explanation.
KEY POINTS
Active Clients: 49
Total Employees: 2,229,127
Standards: Standard Industrial Classifications
Program Access: January 2016 through December 2016
Cause Cards
Dollars-for-Doers
Broken out into two (2) distinct categories: a) donor engagement, defined by those who made a
donation through the company’s program; and b) volunteer engagement, defined by those who
have participated in a volunteer event.
Employee Engagement
Users who have volunteered at least at one (1) event through a team or individual event and/or have
made a single donation. To calculate participation rates, the formula divides participating individuals
by the total eligible individuals, per company.
Participant
An incentive program offered to an employee that allows them to earn a donation, made by the
company on the individual’s behalf, to the organization for which they volunteered.
A transaction is defined as a unique donation performed within YourCause’s Employee
Engagement platform.
An act of redeeming an incentive, usually earned through participation within a specific employee
program, in the form of a donation to a qualified nonprofit organization.
Volunteer Grants
Redemption (monthly/seasonal)
Transaction
A scheduled deduction directly from an individual’s paycheck for distribution to a specified nonprofit
organization.Payroll Giving
A program within CSRconnect, much like a typical gift or reward card, allowing companies to issue to
qualified users the ability to make a donation on behalf of the company to a charity of their
choosing.
A term used to describe an incentive program offered to volunteers (“Doers”) that reward them with
a donation (“Dollars”) to the recipient volunteering organization for the employee’s volunteering
activities.
Company MatchA type of corporate giving program in which a company matches donations made by an employee to
eligible nonprofit organizations.
5Issue 5 - Review overall methodology and glossary of terms found on pages 35 / 38.
FOUNDER’S MESSAGE
Matthew W. CombsFounder & CEO
Dear current and future clients, supporters and friends:
The collection of data, today, isn’t what it used to be. When I first started YourCause, people asked us some pretty basic and straightforward questions: “How does my match cap compare to that of others?” The answers were always straightforward, easy to obtain, and did not fluctuate dramatically as we grew. Today, that has all changed. Today, we live in a world whereby “big data” and “analytics” and “ad hoc” isn’t just a buzz term or product feature/enhancement, but rather a general expectation. It’s the new norm for how we run our programs and how we live our lives. In many ways, we’ve almost forgotten how to successfully operate without it. The fifth edition of our Industry Review supports the latest view of how we all can use data and analytics to drive the success of our programs – and it’s pretty cool to see.
We initially launched our Industry Review to answer our clients’ questions before they were asked. We wanted to deliver to our industry a consistent and standardized data set from which we could form logical conclusions year-over-year. Yet at the same time, we saw the production of this report as a chance for us to show our clients, prospects, and friends a small glimpse into YourCause. We wanted to combine both these elements into one – as we have always seen both to be equally as important as one another. This Industry Review accomplishes both of our objectives. While you’re reading through the data insights, check out the photos and look at some of the things important to us. We believe it says a lot about who we are.
By using our own tools and the very data collected from our system, we have been able to expand our analysis to now include true, valuable, and practicable conclusions that can be used by our clients to make better and more informed decisions for their respective programs. We’re hoping this serves as a guide to support your programs throughout the year, and sparks in you some new ideas as to how you can expand your engagement and drive further impact in our world. If, at any time, you feel there are additional ways in which we can expand this offering and make it more effective, then we want to encourage you to reach out and share with us your thoughts. As is with everything we do, we’re always gathering the feedback from our clients and seeking to make everything we do better.
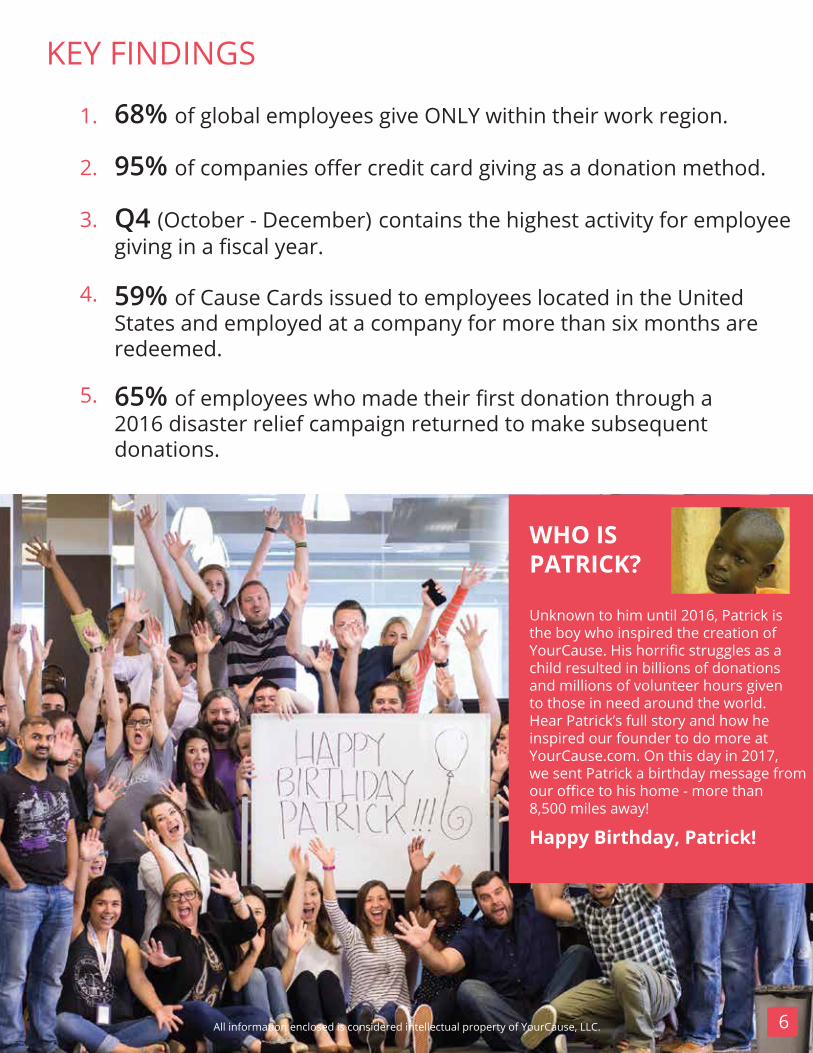
WHO IS PATRICK?
Unknown to him until 2016, Patrick is the boy who inspired the creation of YourCause. His horrific struggles as achild resulted in billions of donations and millions of volunteer hours given to those in need around the world. Hear Patrick’s full story and how he inspired our founder to do more at YourCause.com. On this day in 2017, we sent Patrick a birthday message from our office to his home - more than 8,500 miles away!
Happy Birthday, Patrick!
666
KEY FINDINGS
All information enclosed is considered intellectual property of YourCause, LLC.
1.
2.
3.
4.
5.
68% of global employees give ONLY within their work region.
95% of companies offer credit card giving as a donation method.
Q4 (October - December) contains the highest activity for employee giving in a fiscal year.
59% of Cause Cards issued to employees located in the United States and employed at a company for more than six months are redeemed.
65% of employees who made their first donation through a 2016 disaster relief campaign returned to make subsequent donations.
Full-Time Employees
11
Data includes all industries
[domestic and international]
n = eligible employee sample size
22%
Retired Employees
9
6%
$664n = 1,682,916
$3,251n = 98,804
15n = 1,721,793
181n = 95,590
Average Hoursper Volunteer
Average Transactionsper Donor
Employee Engagement
15% / 14%(giving / volunteering)
6% / 2%(giving / volunteering)
Employee Engagement by Program Type
$590 $2,406
Average Annual Employee Donation per Donor
Average Annual Company Match per Participant
GLOBAL EMPLOYEE ENGAGEMENT
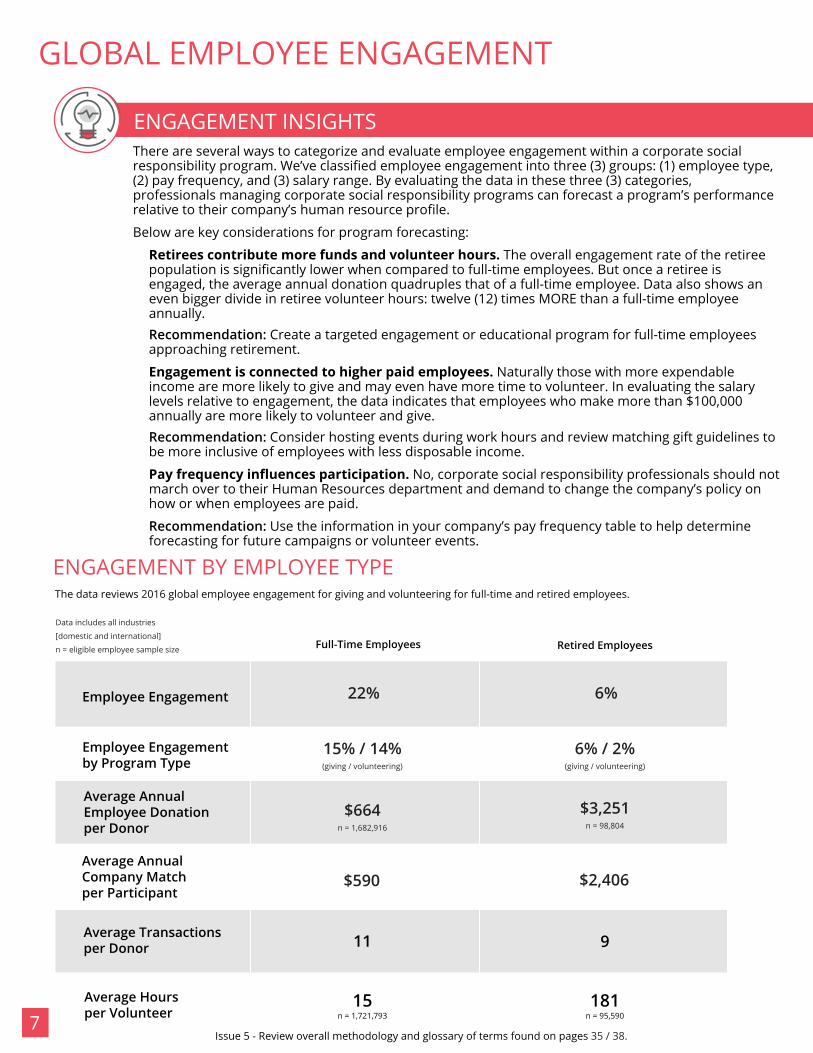
The data reviews 2016 global employee engagement for giving and volunteering for full-time and retired employees.
7
ENGAGEMENT INSIGHTS
Issue 5 - Review overall methodology and glossary of terms found on pages 35 / 38.
ENGAGEMENT BY EMPLOYEE TYPE
There are several ways to categorize and evaluate employee engagement within a corporate social responsibility program. We’ve classified employee engagement into three (3) groups: (1) employee type, (2) pay frequency, and (3) salary range. By evaluating the data in these three (3) categories, professionals managing corporate social responsibility programs can forecast a program’s performance relative to their company’s human resource profile.
Below are key considerations for program forecasting:
Retirees contribute more funds and volunteer hours. The overall engagement rate of the retiree population is significantly lower when compared to full-time employees. But once a retiree is engaged, the average annual donation quadruples that of a full-time employee. Data also shows an even bigger divide in retiree volunteer hours: twelve (12) times MORE than a full-time employee annually. Recommendation: Create a targeted engagement or educational program for full-time employees approaching retirement.
Engagement is connected to higher paid employees. Naturally those with more expendable income are more likely to give and may even have more time to volunteer. In evaluating the salary levels relative to engagement, the data indicates that employees who make more than $100,000 annually are more likely to volunteer and give. Recommendation: Consider hosting events during work hours and review matching gift guidelines to be more inclusive of employees with less disposable income.
Pay frequency influences participation. No, corporate social responsibility professionals should not march over to their Human Resources department and demand to change the company’s policy on how or when employees are paid.
Recommendation: Use the information in your company’s pay frequency table to help determine forecasting for future campaigns or volunteer events.
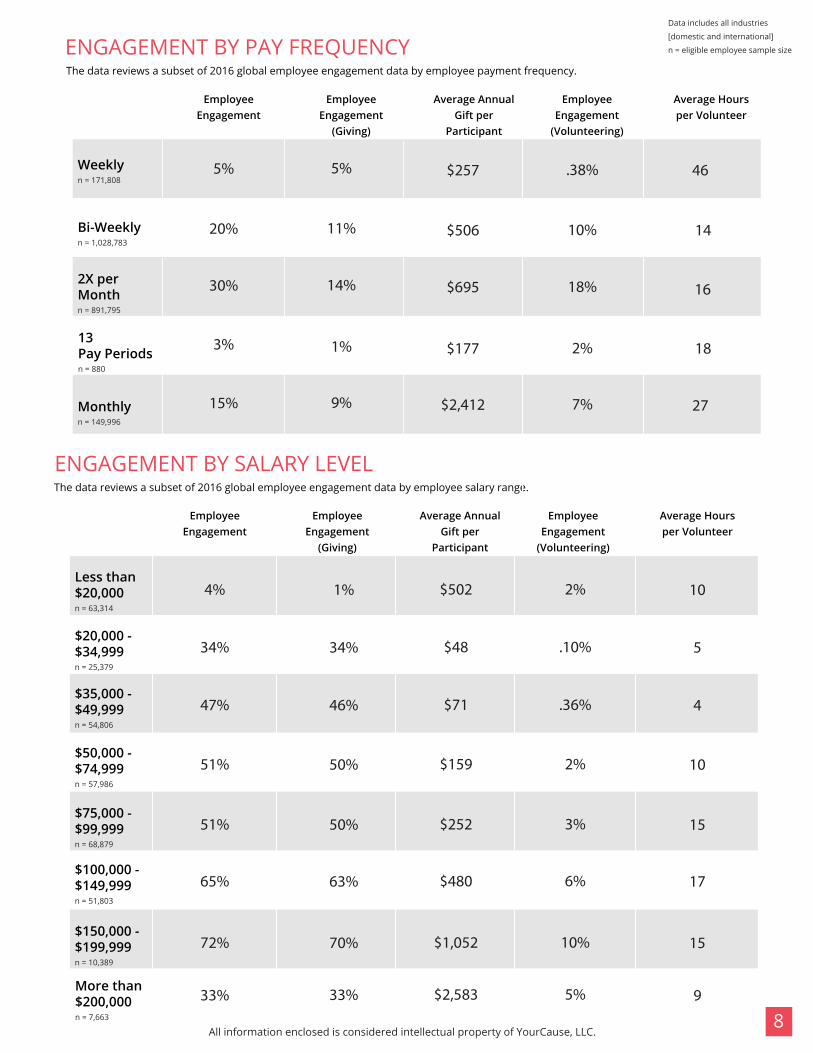
ENGAGEMENT BY SALARY LEVEL
8
Employee Engagement All Programs
1111
All information enclosed is considered intellectual property of YourCause, LLC.
Data includes all industries
[domestic and international]
n = eligible employee sample size
The data reviews a subset of 2016 global employee engagement data by employee payment frequency.
The data reviews a subset of 2016 global employee engagement data by employee salary range.
5%
14
30%
18
3%
SALARY INSIGHTS SALARY INSIGHTSWeeklyn = 171,808
Bi-Weeklyn = 1,028,783
2X per Monthn = 891,795
Monthlyn = 149,996
13 Pay Periodsn = 880
5%
20%
30%
3%
15%
5%
11%
14%
1%
9%
$257
$506
$695
$177
$2,412
.38%
10%
18%
2%
7%
46
16
27
EmployeeEngagement
Average Annual Gift per
Participant
Average Hours per Volunteer
EmployeeEngagement
(Volunteering)
EmployeeEngagement
(Giving)
EmployeeEngagement
Average Annual Gift per
Participant
Average Hours per Volunteer
Less than $20,000n = 63,314
$20,000 - $34,999n = 25,379
$35,000 - $49,999n = 54,806
$50,000 - $74,999n = 57,986
$75,000 - $99,999n = 68,879
$100,000 - $149,999n = 51,803
$150,000 - $199,999n = 10,389
More than$200,000n = 7,663
EmployeeEngagement
(Volunteering)
EmployeeEngagement
(Giving)
4%
34%
47%
51%
51%
65%
72%
33%
1%
34%
46%
50%
50%
63%
70%
33%
$502
$48
$71
$159
$252
$480
$1,052
$2,583
2%
.10%
.36%
2%
3%
6%
10%
5%
10
5
4
10
15
17
15
9
ENGAGEMENT BY PAY FREQUENCY
SouthN = 367,189
20% / 15%(giving / volunteering)
1,04717 HRS
9 Issue 5 - Review overall methodology and glossary of terms found on pages 35 / 38.
18% / 18%(giving / volunteering)
1,41119 HRS
$
R
17% / 12%(giving / volunteering)
1,01115 HRS
18% / 13%(giving / volunteering)
1,30523 HRS
24% / 15%(giving / volunteering)
69519 HRS
$R
$R
$R
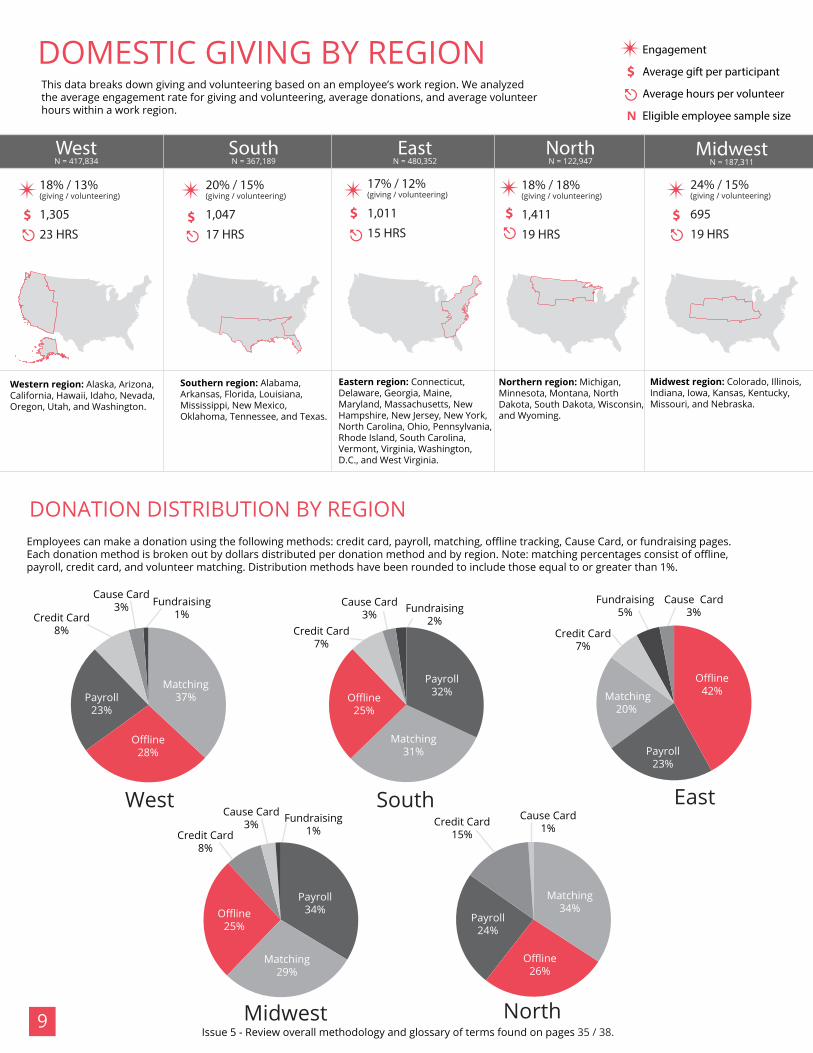
Western region: Alaska, Arizona, California, Hawaii, Idaho, Nevada, Oregon, Utah, and Washington.
Southern region: Alabama, Arkansas, Florida, Louisiana, Mississippi, New Mexico, Oklahoma, Tennessee, and Texas.
Eastern region: Connecticut, Delaware, Georgia, Maine, Maryland, Massachusetts, New Hampshire, New Jersey, New York,North Carolina, Ohio, Pennsylvania, Rhode Island, South Carolina, Vermont, Virginia, Washington, D.C., and West Virginia.
Northern region: Michigan,Minnesota, Montana, North Dakota, South Dakota, Wisconsin,and Wyoming.
Midwest region: Colorado, Illinois,Indiana, Iowa, Kansas, Kentucky, Missouri, and Nebraska.
$R
DOMESTIC GIVING BY REGION
EastN = 480,352
NorthN = 122,947
WestN = 417,834
MidwestN = 187,311
$
RN
9
DONATION DISTRIBUTION BY REGION
This data breaks down giving and volunteering based on an employee’s work region. We analyzed the average engagement rate for giving and volunteering, average donations, and average volunteer hours within a work region.
Engagement
Average gift per participant
Average hours per volunteer
Eligible employee sample size
Fundraising5%
Matching20%
Payroll23%
Offline42%
Credit Card7%
Cause Card3%
North
East
Midwest
Employees can make a donation using the following methods: credit card, payroll, matching, offline tracking, Cause Card, or fundraising pages. Each donation method is broken out by dollars distributed per donation method and by region. Note: matching percentages consist of offline, payroll, credit card, and volunteer matching. Distribution methods have been rounded to include those equal to or greater than 1%.
Credit Card8%
Cause Card3%
Payroll34%Offline
25%
Matching29%
Fundraising1%
Cause Card1%
Payroll24%
Offline26%
Credit Card15%
Matching34%
SouthWest
Fundraising1%
Cause Card3%
Payroll23%
Offline28%
Credit Card8%
Matching37%
Matching31%
Fundraising2%
Payroll32%Offline
25%
Credit Card7%
Cause Card3%
All information enclosed is considered intellectual property of YourCause, LLC. 10
YourCause Sales and Marketing Team
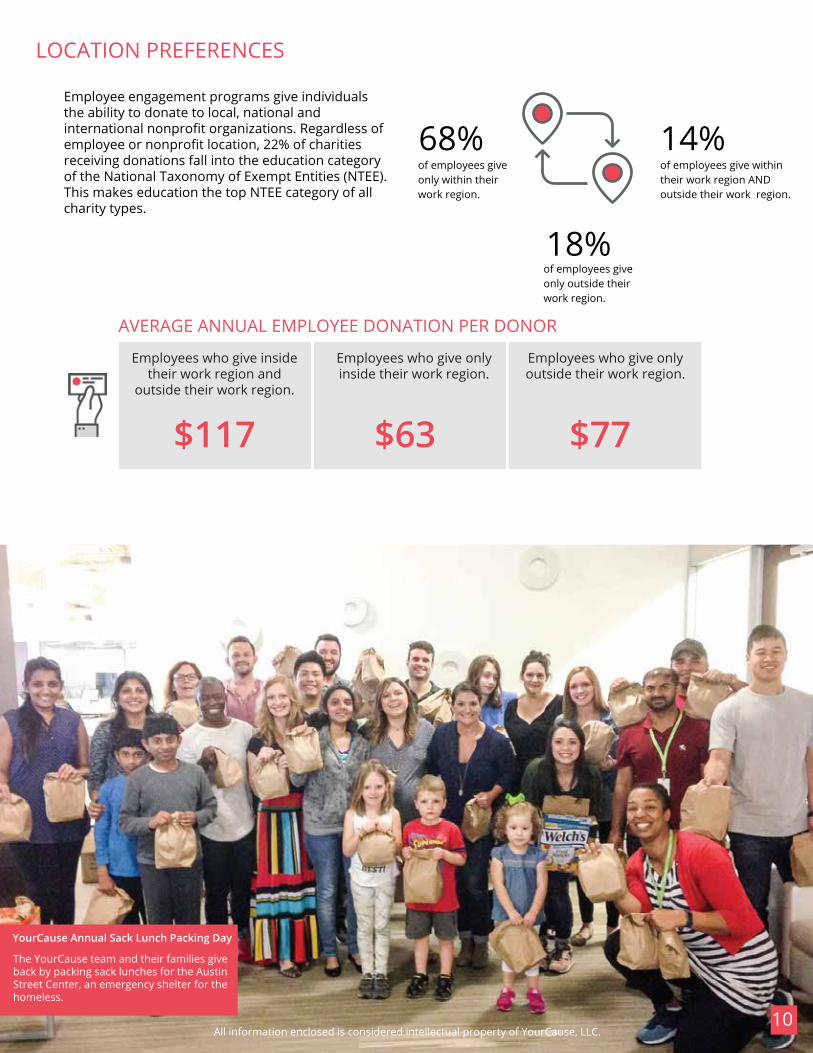
YourCause Annual Sack Lunch Packing Day
The YourCause team and their families give back by packing sack lunches for the AustinStreet Center, an emergency shelter for the homeless.
Employees who give inside their work region and
outside their work region.
Employees who give only inside their work region.
Employees who give only outside their work region.
LOCATION PREFERENCES
68%of employees give only within their work region.
14%of employees give within their work region AND outside their work region.
18%of employees give only outside their work region.
Employee engagement programs give individuals the ability to donate to local, national and international nonprofit organizations. Regardless of employee or nonprofit location, 22% of charities receiving donations fall into the education category of the National Taxonomy of Exempt Entities (NTEE). This makes education the top NTEE category of all charity types.
$117 $63 $77
AVERAGE ANNUAL EMPLOYEE DONATION PER DONOR
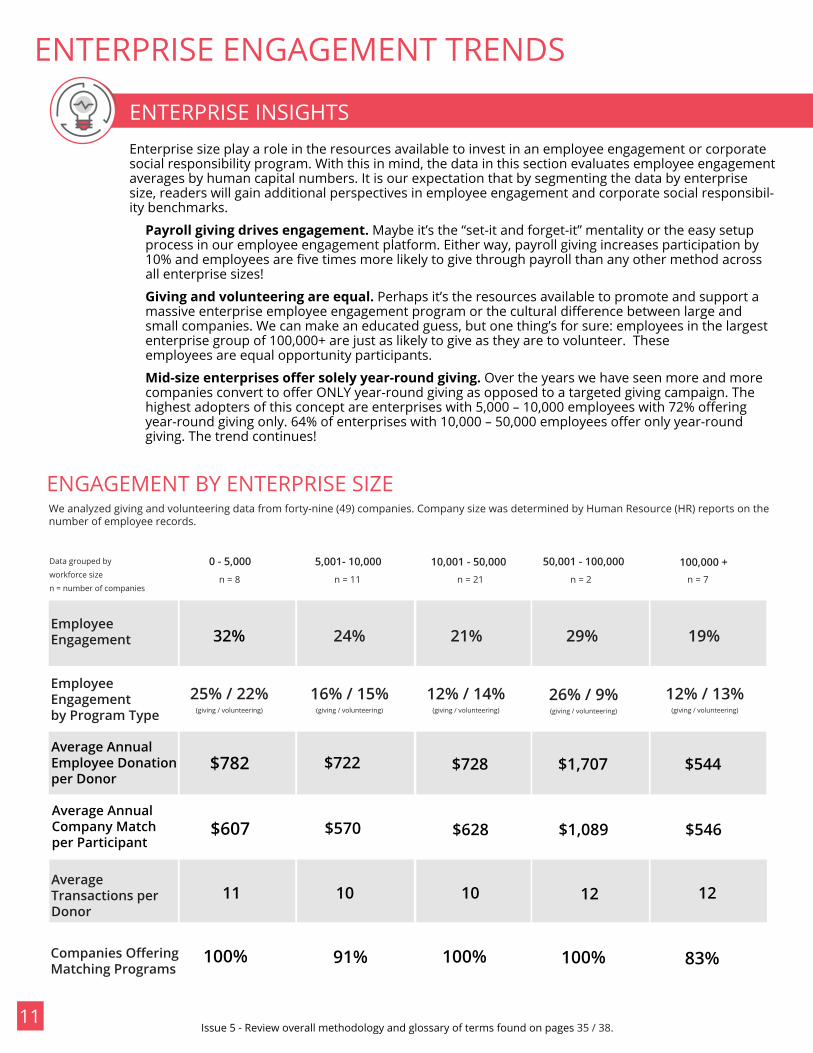
ENTERPRISE ENGAGEMENT TRENDS
11Issue 5 - Review overall methodology and glossary of terms found on pages 35 / 38.
Ryan DouvilleSales Executive
Odessa JenkinsVP, Client Solutions
ENTERPRISE INSIGHTS
0 - 5,000 5,001- 10,000 10,001 - 50,000 50,001 - 100,000 100,000 +
$722 $728 $1,707 $544
11 10 10 12 12
Data grouped by
workforce size
n = number of companiesn = 8 n = 11 n = 21 n = 2 n = 7
$782
100% 91% 100% 100% 83%
32%EmployeeEngagement 24% 21% 29% 19%
25% / 22%(giving / volunteering)
Employee Engagement by Program Type
16% / 15%(giving / volunteering)
12% / 14%(giving / volunteering)
26% / 9%(giving / volunteering)
12% / 13%(giving / volunteering)
Companies OfferingMatching Programs
Average Transactions perDonor
We analyzed giving and volunteering data from forty-nine (49) companies. Company size was determined by Human Resource (HR) reports on the number of employee records.
ENGAGEMENT BY ENTERPRISE SIZE
$570 $628 $1,089 $546$607
Enterprise size play a role in the resources available to invest in an employee engagement or corporate social responsibility program. With this in mind, the data in this section evaluates employee engagement averages by human capital numbers. It is our expectation that by segmenting the data by enterprise size, readers will gain additional perspectives in employee engagement and corporate social responsibil-ity benchmarks.
Payroll giving drives engagement. Maybe it’s the “set-it and forget-it” mentality or the easy setup process in our employee engagement platform. Either way, payroll giving increases participation by 10% and employees are five times more likely to give through payroll than any other method across all enterprise sizes!
Giving and volunteering are equal. Perhaps it’s the resources available to promote and support a massive enterprise employee engagement program or the cultural difference between large and small companies. We can make an educated guess, but one thing’s for sure: employees in the largest enterprise group of 100,000+ are just as likely to give as they are to volunteer. These employees are equal opportunity participants.
Mid-size enterprises offer solely year-round giving. Over the years we have seen more and more companies convert to offer ONLY year-round giving as opposed to a targeted giving campaign. The highest adopters of this concept are enterprises with 5,000 – 10,000 employees with 72% offering year-round giving only. 64% of enterprises with 10,000 – 50,000 employees offer only year-round giving. The trend continues!
Average Annual Employee Donation per Donor
Average Annual Company Match per Participant
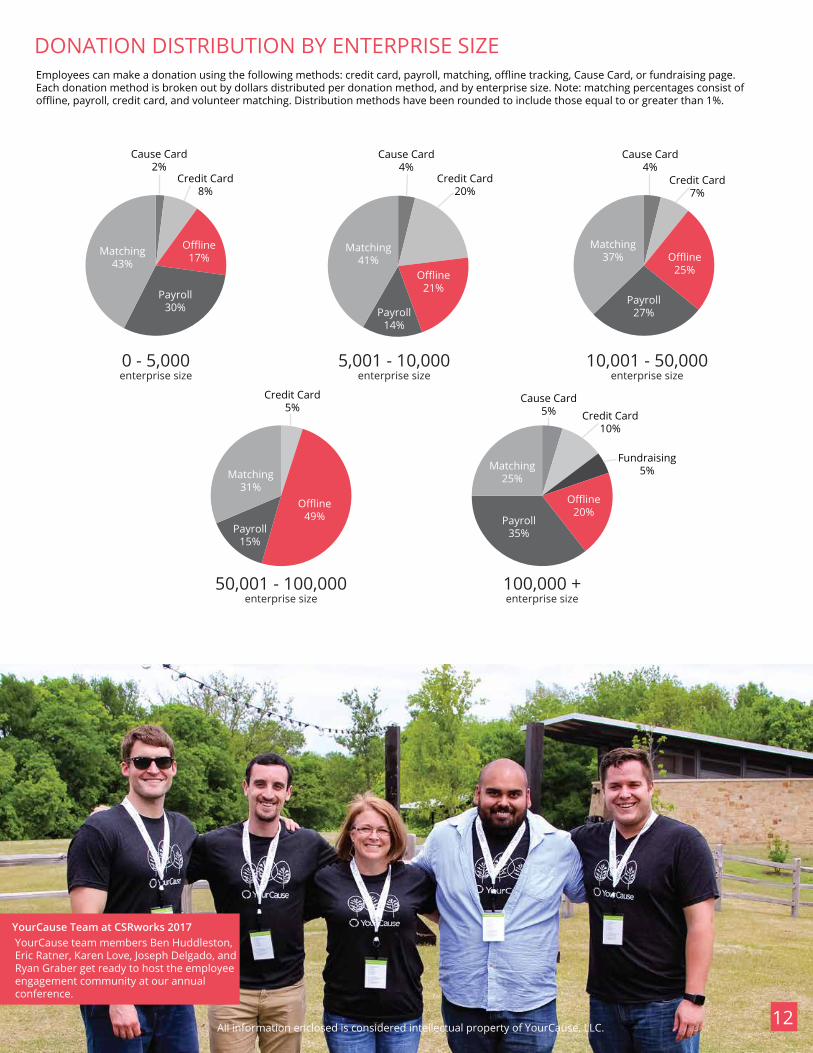
YourCause team members Ben Huddleston, Eric Ratner, Karen Love, Joseph Delgado, and Ryan Graber get ready to host the employee engagement community at our annual conference.
YourCause Team at CSRworks 2017
12
0 - 5,000enterprise size
5,001 - 10,000enterprise size
10,001 - 50,000enterprise size
50,001 - 100,000enterprise size
100,000 +enterprise size
Matching43%
Payroll30%
Offline17%
Credit Card8%
Cause Card2%
Matching31%
Payroll15%
Offline49%
Credit Card5%
Matching41%
Payroll14%
Offline21%
Credit Card20%
Cause Card4%
Matching37%
Payroll27%
Offline25%
Credit Card7%
Cause Card4%
Matching25%
Payroll35%
Offline20%
Fundraising5%
Credit Card10%
Cause Card5%
All information enclosed is considered intellectual property of YourCause, LLC.
Employees can make a donation using the following methods: credit card, payroll, matching, offline tracking, Cause Card, or fundraising page. Each donation method is broken out by dollars distributed per donation method, and by enterprise size. Note: matching percentages consist of offline, payroll, credit card, and volunteer matching. Distribution methods have been rounded to include those equal to or greater than 1%.
DONATION DISTRIBUTION BY ENTERPRISE SIZE
Employee Engagement
Average Donation per Transaction
Credit Card Givingn = 1,839,327
Fundraisingn = 308,110
Offline Givingn = 1,470,792
Payroll Givingn = 1,726,766
Cause Card Givingn = 1,108,297
Credit Card Matchn = 1,519,979
Offline Matchn = 1,431,158
Payroll Matchn = 1,139,331
Dollars-for-Doersn = 344,770
Average Number of Transactions per Donor
Cred
it Ca
rd G
ivin
g - 9
5%
WHAT GIVING METHODS ARE OFFERED
0
20
40
60
80
100
Cred
it Ca
rd G
ivin
g - 9
5%
Offl
ine
Giv
ing
- 91%
Cred
it Ca
rd M
atch
- 86
%
Offl
ine
Mat
ch -
86%
Payr
oll -
75%
Caus
e Ca
rd -
64%
Payr
oll M
atch
- 61
%
Dol
lars
-for
-Doe
rs -
25%
Fund
rais
ing
- 5%
2%
4%
10%
3%
0.5%
2%
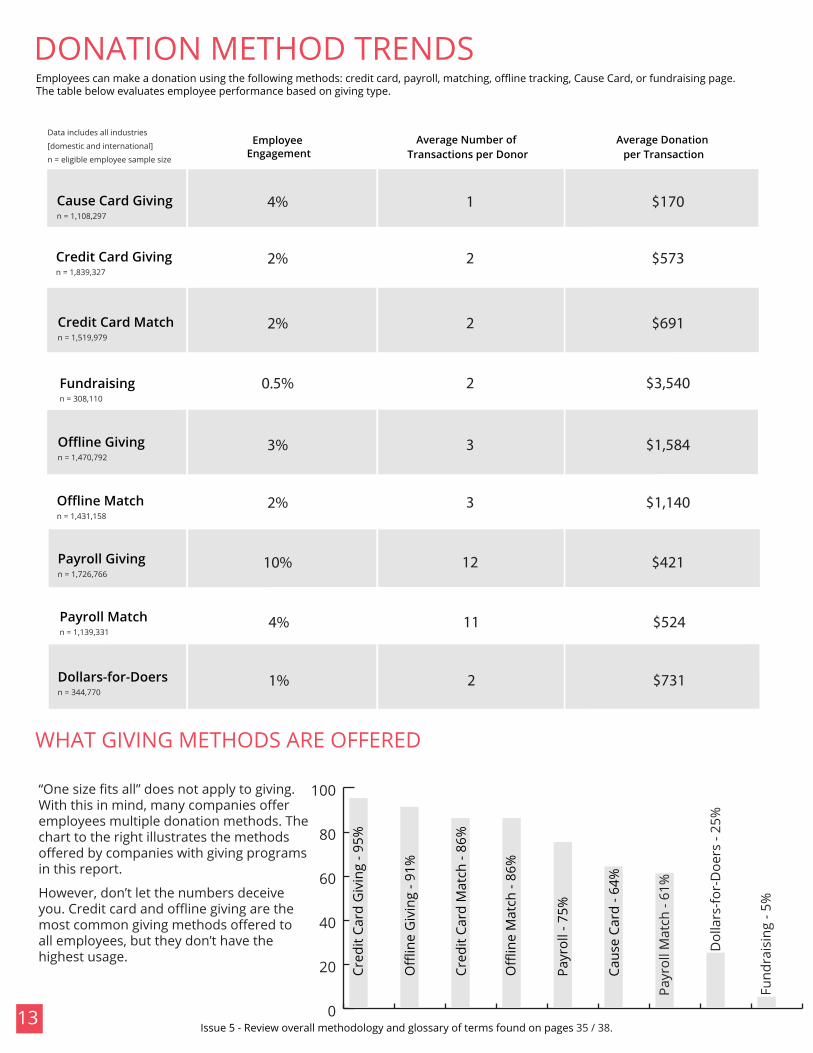
Employees can make a donation using the following methods: credit card, payroll, matching, offline tracking, Cause Card, or fundraising page. The table below evaluates employee performance based on giving type.
“One size fits all” does not apply to giving. With this in mind, many companies offer employees multiple donation methods. The chart to the right illustrates the methods offered by companies with giving programs in this report.
However, don’t let the numbers deceive you. Credit card and offline giving are the most common giving methods offered to all employees, but they don’t have the highest usage.
Data includes all industries
[domestic and international]
n = eligible employee sample size
Issue 5 - Review overall methodology and glossary of terms found on pages 35 / 38.13
DONATION METHOD TRENDS
1%
4%
2%
2
1
12
3
2
2
2
11
3
$691
$170
$421
$1,584
$3,540
$573
$731
$524
$1,140
All information enclosed is considered intellectual property of YourCause, LLC. 14
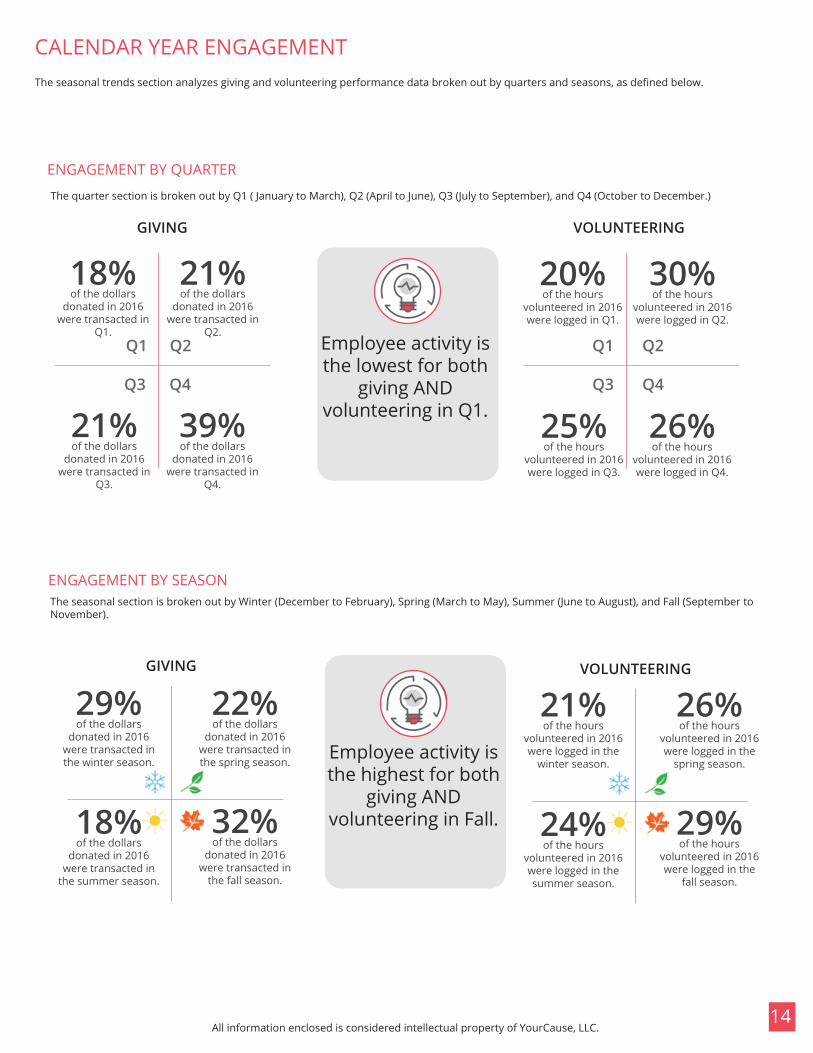
CALENDAR YEAR ENGAGEMENT The seasonal trends section analyzes giving and volunteering performance data broken out by quarters and seasons, as defined below.
ENGAGEMENT BY QUARTER
ENGAGEMENT BY SEASON
26%of the hours
volunteered in 2016 were logged in the
spring season.
21%of the hours
volunteered in 2016 were logged in the
winter season.
24%of the hours
volunteered in 2016 were logged in the summer season.
29%of the hours
volunteered in 2016 were logged in the
fall season.
22%of the dollars
donated in 2016 were transacted in the spring season.
29%of the dollars
donated in 2016 were transacted in the winter season.
18%of the dollars
donated in 2016 were transacted in
the summer season.
32%of the dollars
donated in 2016 were transacted in
the fall season.
GIVING VOLUNTEERING
Employee activity is the highest for both
giving AND volunteering in Fall.
The seasonal section is broken out by Winter (December to February), Spring (March to May), Summer (June to August), and Fall (September to November).
GIVING VOLUNTEERING
Q1
Q3 Q4
Q1
Q3
Q2
Q4
21%of the dollars
donated in 2016 were transacted in
Q2.
18%of the dollars
donated in 2016 were transacted in
Q1.
39%of the dollars
donated in 2016 were transacted in
Q4.
21%of the dollars
donated in 2016 were transacted in
Q3.
30%of the hours
volunteered in 2016 were logged in Q2.
20%of the hours
volunteered in 2016 were logged in Q1.
26%of the hours
volunteered in 2016 were logged in Q4.
25%of the hours
volunteered in 2016 were logged in Q3.
Employee activity is the lowest for both
giving AND volunteering in Q1.
The quarter section is broken out by Q1 ( January to March), Q2 (April to June), Q3 (July to September), and Q4 (October to December.)
Q2
Issue 5 - Review overall methodology and glossary of terms found on pages 35 / 38.15
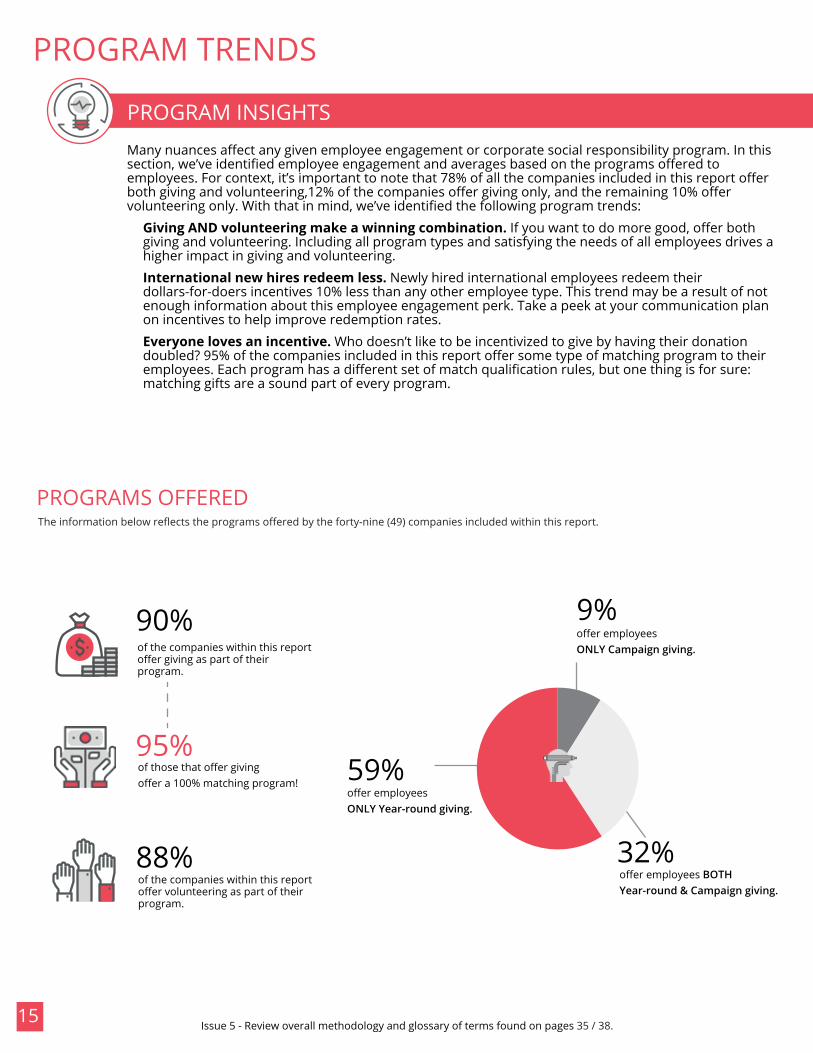
PROGRAMS OFFERED
59%offer employees ONLY Year-round giving.
PROGRAM TRENDS
The information below reflects the programs offered by the forty-nine (49) companies included within this report.
PROGRAM INSIGHTS
9%offer employees ONLY Campaign giving.
32%offer employees BOTH Year-round & Campaign giving.
Many nuances affect any given employee engagement or corporate social responsibility program. In this section, we’ve identified employee engagement and averages based on the programs offered to employees. For context, it’s important to note that 78% of all the companies included in this report offer both giving and volunteering,12% of the companies offer giving only, and the remaining 10% offer volunteering only. With that in mind, we’ve identified the following program trends:
Giving AND volunteering make a winning combination. If you want to do more good, offer both giving and volunteering. Including all program types and satisfying the needs of all employees drives a higher impact in giving and volunteering.
International new hires redeem less. Newly hired international employees redeem their dollars-for-doers incentives 10% less than any other employee type. This trend may be a result of not enough information about this employee engagement perk. Take a peek at your communication plan on incentives to help improve redemption rates.
Everyone loves an incentive. Who doesn’t like to be incentivized to give by having their donation doubled? 95% of the companies included in this report offer some type of matching program to their employees. Each program has a different set of match qualification rules, but one thing is for sure: matching gifts are a sound part of every program.
90%of the companies within this report offer giving as part of their program.
88%of the companies within this report offer volunteering as part of their program.
95%of those that offer giving offer a 100% matching program!
All information enclosed is considered intellectual property of YourCause, LLC. 16
53%
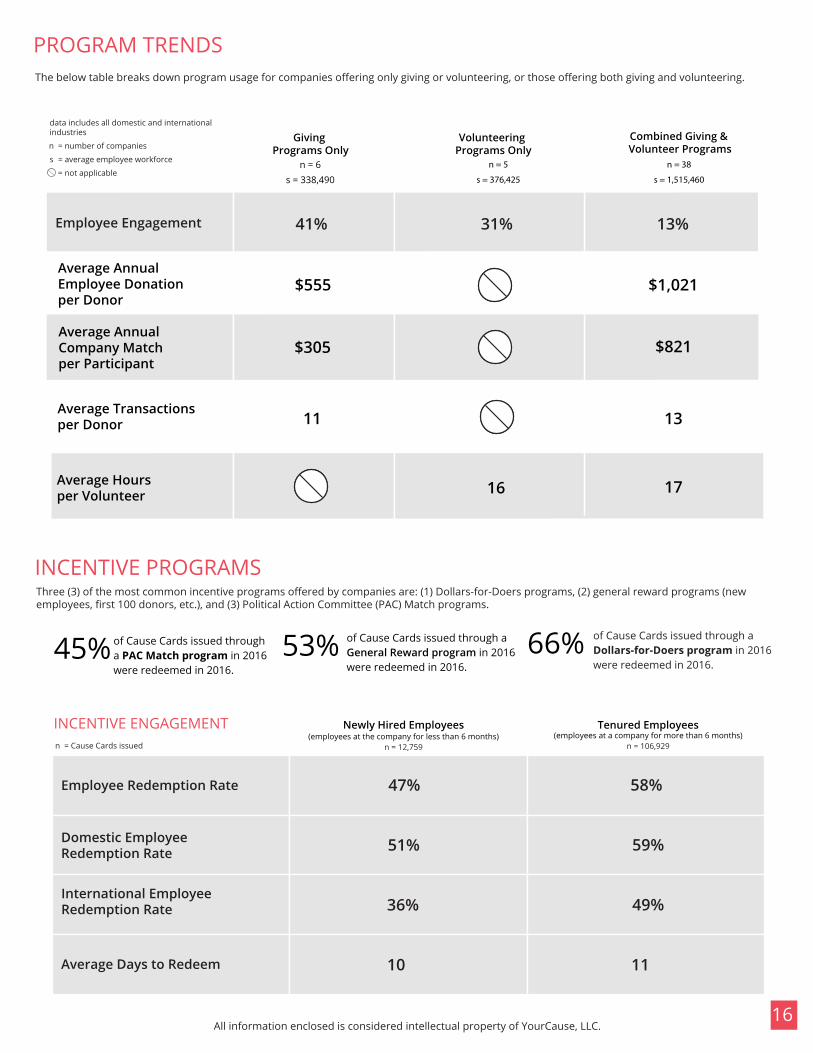
The below table breaks down program usage for companies offering only giving or volunteering, or those offering both giving and volunteering.
n = 6s = 338,490
n = 5
s = 376,425
n = 38
s = 1,515,460
$555 $1,021
11 13
data includes all domestic and international industries
n = number of companies
s = average employee workforce
= not applicable
Giving Programs Only
Volunteering Programs Only
Combined Giving & Volunteer Programs
16 17Average Hoursper Volunteer
Average Transactions per Donor
Employee Engagement 41% 31% 13%
INCENTIVE PROGRAMS
45%of Cause Cards issued through a PAC Match program in 2016 were redeemed in 2016.
of Cause Cards issued through a General Reward program in 2016 were redeemed in 2016.
66%
PROGRAM TRENDS
$305 $821
of Cause Cards issued through a Dollars-for-Doers program in 2016were redeemed in 2016.
Newly Hired Employees(employees at the company for less than 6 months)
n = 12,759
Tenured Employees(employees at a company for more than 6 months)
n = 106,929
Employee Redemption Rate
Domestic EmployeeRedemption Rate
International EmployeeRedemption Rate
Average Days to Redeem
47% 58%
51% 59%
36% 49%
10 11
INCENTIVE ENGAGEMENT
Three (3) of the most common incentive programs offered by companies are: (1) Dollars-for-Doers programs, (2) general reward programs (new employees, first 100 donors, etc.), and (3) Political Action Committee (PAC) Match programs.
n = Cause Cards issued
Average Annual Employee Donation per Donor
Average Annual Company Match per Participant
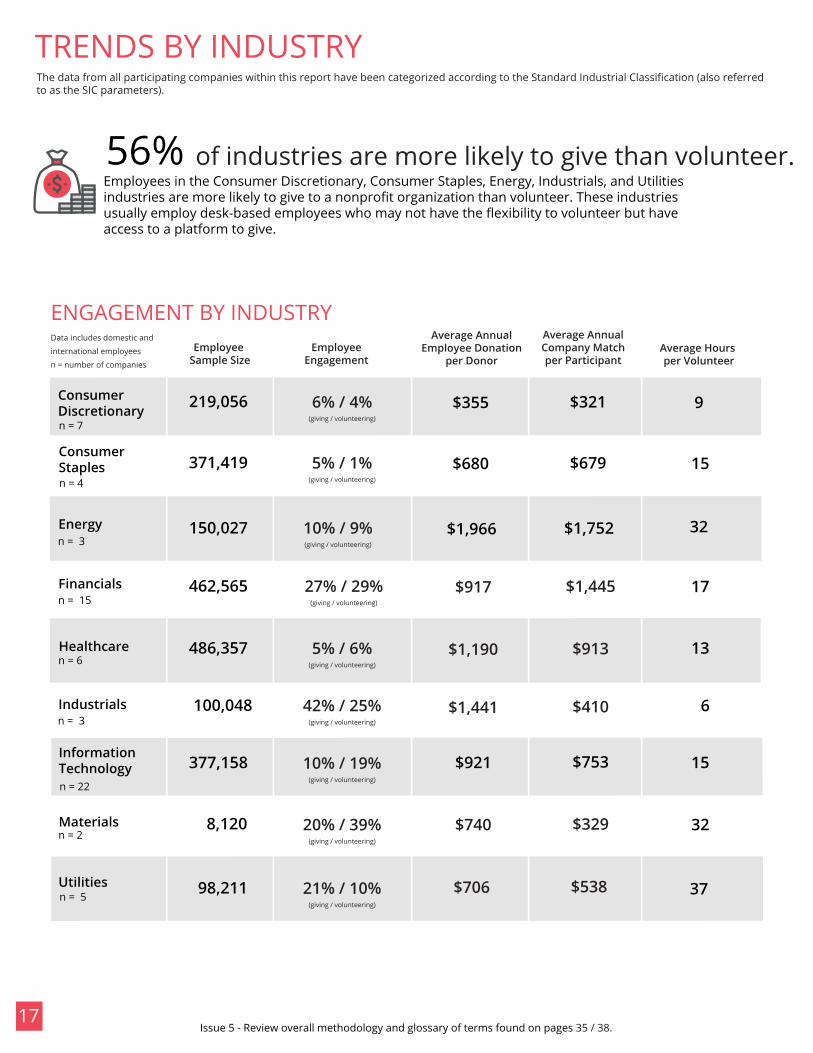
TRENDS BY INDUSTRY
Issue 5 - Review overall methodology and glossary of terms found on pages 35 / 38.17
Energy
Financials
$680
150,027
462,565
486,357
219,056
371,419
$1,190
Data includes domestic and
international employees
n = number of companies
100,048
Employee Sample Size
EmployeeEngagement
Average Hours per Volunteer
$355
$917
$1,966
$1,441
32
15
9
13
17
6
n = 7
n = 4
n = 3
Consumer Discretionary
Consumer Staples
n = 15
n = 6Healthcare
Industrialsn = 3
Utilities
$740
98,211
377,158
8,120
$921
$706 37
32
15 n = 22
n = 2
n = 5
Information Technology
Materials
$679
$913
$321
$1,445
$1,752
$410
$329
$753
$538
6% / 4%(giving / volunteering)
5% / 1%(giving / volunteering)
10% / 9%(giving / volunteering)
27% / 29%(giving / volunteering)
5% / 6%(giving / volunteering)
42% / 25%(giving / volunteering)
10% / 19%(giving / volunteering)
20% / 39%(giving / volunteering)
21% / 10%(giving / volunteering)
The data from all participating companies within this report have been categorized according to the Standard Industrial Classification (also referred to as the SIC parameters).
ENGAGEMENT BY INDUSTRY
56% of industries are more likely to give than volunteer.Employees in the Consumer Discretionary, Consumer Staples, Energy, Industrials, and Utilities industries are more likely to give to a nonprofit organization than volunteer. These industries usually employ desk-based employees who may not have the flexibility to volunteer but have access to a platform to give.
Average Annual Employee Donation
per Donor
Average Annual Company Match per Participant
All information enclosed is considered intellectual property of YourCause, LLC. 18
EnergyConsumer Discretionary Consumer Staples
HealthcareFinancials Industrials
Matching37%
Payroll29%
Offline25%
Fundraising1%
Credit Card7%
Cause Card1%
Matching39%
Payroll30%
Offline23%
Credit Card8%
Matching47%
Payroll13%
Offline38%
Credit Card1%
Cause Card1%
Matching46%
Payroll20%
Offline29%
Credit Card4%
Cause Card1%
Matching37%
Payroll12%
Offline39%
Credit Card12%
Matching14%
Payroll16%
Offline59%
Credit Card10%
Cause Card1%
MaterialsInformation Technology Utilities
Matching40%
Payroll16%
Offline22%
Credit Card16%
Cause Card6% Matching
13%
Payroll31%
Offline27%
Credit Card7%
Cause Card22%
Matching31%
Payroll49%
Offline11%
Fundraising1%
Credit Card5%
Cause Card3%
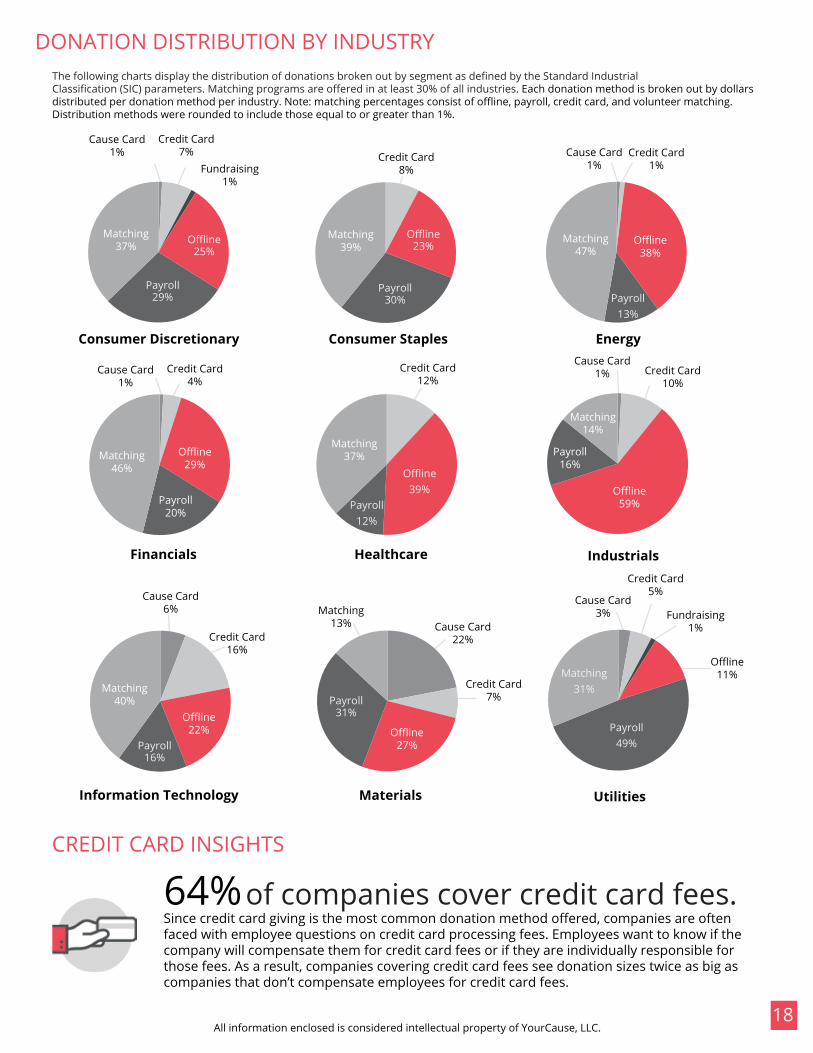
The following charts display the distribution of donations broken out by segment as defined by the Standard Industrial Classification (SIC) parameters. Matching programs are offered in at least 30% of all industries. Each donation method is broken out by dollars distributed per donation method per industry. Note: matching percentages consist of offline, payroll, credit card, and volunteer matching. Distribution methods were rounded to include those equal to or greater than 1%.
CREDIT CARD INSIGHTS
DONATION DISTRIBUTION BY INDUSTRY
Since credit card giving is the most common donation method offered, companies are often faced with employee questions on credit card processing fees. Employees want to know if the company will compensate them for credit card fees or if they are individually responsible for those fees. As a result, companies covering credit card fees see donation sizes twice as big as companies that don’t compensate employees for credit card fees.
64%of companies cover credit card fees.
GEOGRAPHIC TRENDS
Issue 5 - Review overall methodology and glossary of terms found on pages 35 / 38.19
Domestic
Data includes all industries
[domestic and international]
n = eligible employee sample size International
$768n = 1,288,793
$458n = 565,157
22n = 1,301,854
12 7
Average Hoursper Volunteer
Average Transactionsper Donor
Employee Engagement
Employee Engagement Giving Only
24%
19% (giving)
11%
Employee Engagement Volunteering Only
2% (giving)
14% (volunteering)
11% (vounteering)
$690 $368
19n = 578,127
Average Annual Employee Donation per Donor
Average Annual Company Match per Participant
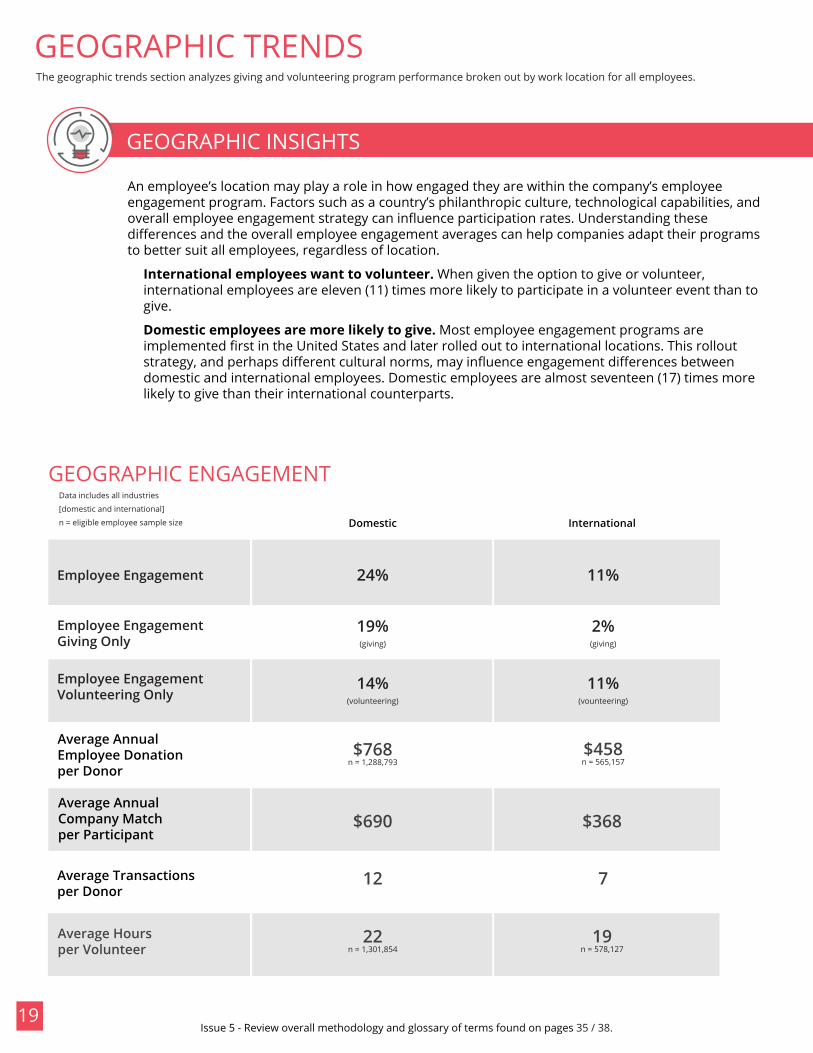
GEOGRAPHIC INSIGHTS
The geographic trends section analyzes giving and volunteering program performance broken out by work location for all employees.
GEOGRAPHIC ENGAGEMENT
An employee’s location may play a role in how engaged they are within the company’s employee engagement program. Factors such as a country’s philanthropic culture, technological capabilities, and overall employee engagement strategy can influence participation rates. Understanding these differences and the overall employee engagement averages can help companies adapt their programs to better suit all employees, regardless of location.
International employees want to volunteer. When given the option to give or volunteer, international employees are eleven (11) times more likely to participate in a volunteer event than to give.
Domestic employees are more likely to give. Most employee engagement programs are implemented first in the United States and later rolled out to international locations. This rollout strategy, and perhaps different cultural norms, may influence engagement differences between domestic and international employees. Domestic employees are almost seventeen (17) times more likely to give than their international counterparts.
20All information enclosed is considered intellectual property of YourCause, LLC.
Average Annual Employee Donation
per Donor
Average Annual Company Match per Participant
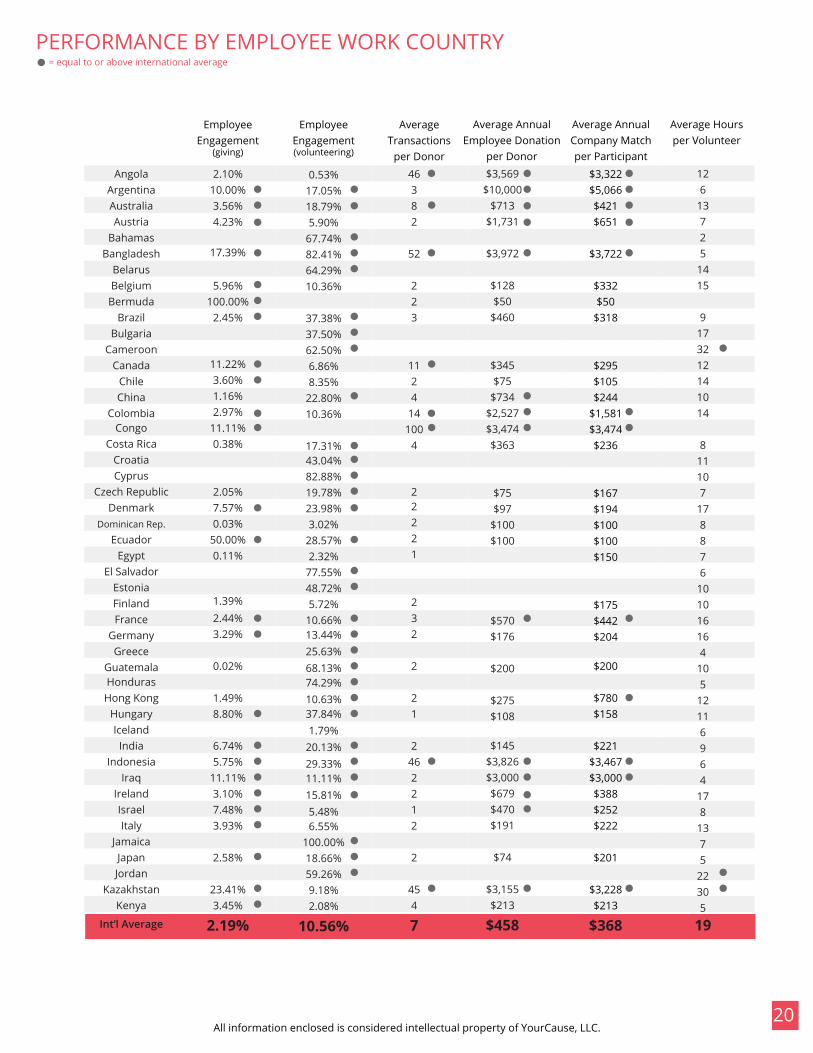
PERFORMANCE BY EMPLOYEE WORK COUNTRY= equal to or above international average
EmployeeEngagement
(giving)
EmployeeEngagement(volunteering)
Average Transactions
per Donor
Average Hours per Volunteer
AngolaArgentinaAustraliaAustria
BahamasBangladesh
BelarusBelgium
BermudaBrazil
BulgariaCameroon
CanadaChileChina
ColombiaCongo
Costa RicaCroatiaCyprus
Czech RepublicDenmark
Dominican Rep.
EcuadorEgypt
El SalvadorEstoniaFinlandFrance
GermanyGreece
GuatemalaHonduras
Hong KongHungaryIcelandIndia
IndonesiaIraq
IrelandIsraelItaly
JamaicaJapanJordan
KazakhstanKenya
Int’l Average
0.53%17.05%18.79%5.90%
67.74%82.41%64.29%10.36%
37.38%37.50%62.50%6.86%8.35%
22.80%10.36%
17.31%43.04%82.88%19.78%23.98%3.02%
28.57%2.32%
77.55%48.72%5.72%
10.66%13.44%25.63%68.13%74.29%10.63%37.84%1.79%
20.13%29.33%11.11%15.81%5.48%6.55%
100.00%18.66%59.26%9.18%2.08%
10.56%
$3,569$10,000
$713$1,731
$3,972
$128$50
$460
$345$75
$734$2,527$3,474$363
$75$97
$100$100
$570$176
$200
$275$108
$145$3,826$3,000$679$470$191
$74
$3,155$213
$458
126
13725
1415
9173212141014
811107
178876
101016164
105
12116964
178
1375
22305
19
46382
52
223
1124
14100
4
22221
232
2
21
2462212
2
454
7
$3,322$5,066$421$651
$3,722
$332$50
$318
$295$105$244
$1,581$3,474$236
$167$194$100$100$150
$175$442$204
$200
$780$158
$221$3,467$3,000$388$252$222
$201
$3,228$213
$368
2.10%10.00%3.56%4.23%
17.39%
5.96%100.00%
2.45%
11.22%3.60%1.16%2.97%
11.11%0.38%
2.05%7.57%0.03%
50.00%0.11%
1.39%2.44%3.29%
0.02%
1.49%8.80%
6.74%5.75%
11.11%3.10%7.48%3.93%
2.58%
23.41%3.45%
2.19%
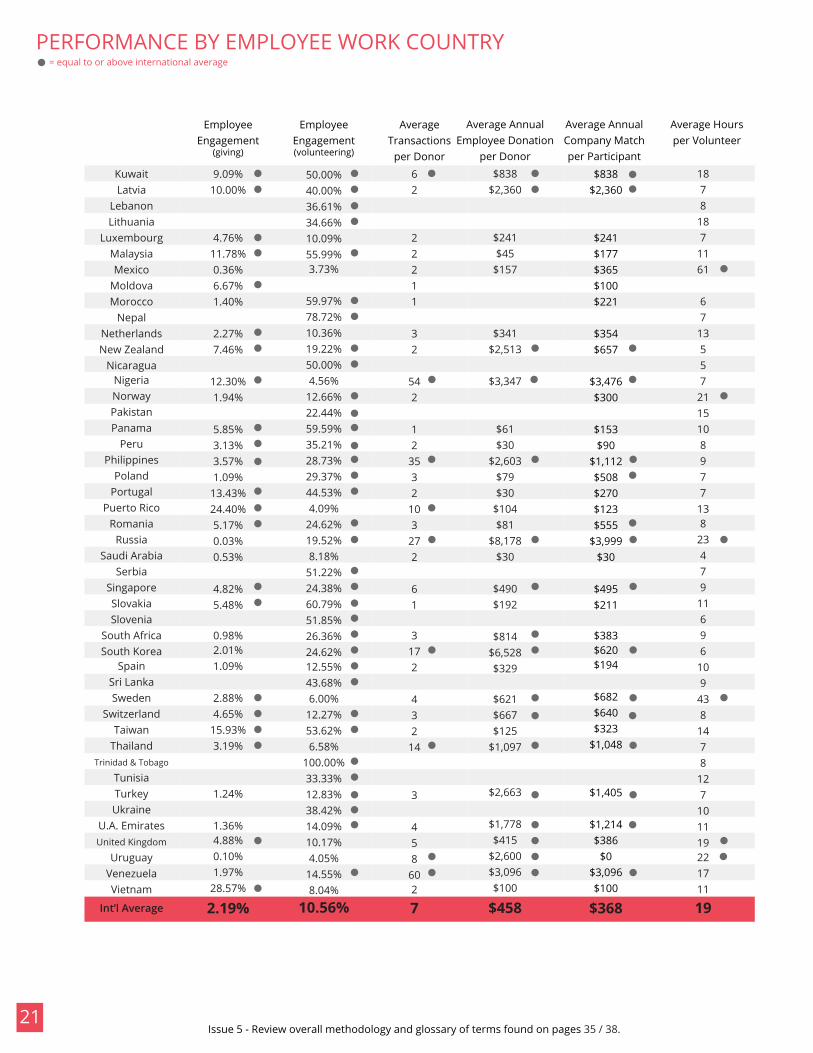
21Issue 5 - Review overall methodology and glossary of terms found on pages 35 / 38.
PERFORMANCE BY EMPLOYEE WORK COUNTRY= equal to or above international average
EmployeeEngagement
(giving)
EmployeeEngagement(volunteering)
Average Transactions
per Donor
Average Hours per Volunteer
KuwaitLatvia
LebanonLithuania
LuxembourgMalaysiaMexico
MoldovaMorocco
NepalNetherlandsNew Zealand
NicaraguaNigeriaNorwayPakistanPanama
PeruPhilippines
PolandPortugal
Puerto RicoRomania
RussiaSaudi Arabia
SerbiaSingaporeSlovakiaSlovenia
South AfricaSouth Korea
SpainSri LankaSweden
SwitzerlandTaiwan
ThailandTrinidad & Tobago
TunisiaTurkeyUkraine
U.A. EmiratesUnited Kingdom
UruguayVenezuelaVietnam
Int’l Average
50.00%40.00%36.61%34.66%10.09%55.99%3.73%
59.97%78.72%10.36%19.22%50.00%4.56%
12.66%22.44%59.59%35.21%28.73%29.37%44.53%4.09%
24.62%19.52%8.18%
51.22%24.38%60.79%51.85%26.36%24.62%12.55%43.68%6.00%
12.27%53.62%6.58%
100.00%33.33%12.83%38.42%14.09%10.17%4.05%
14.55%8.04%
10.56%
$838$2,360
$241$45
$157
$341$2,513
$3,347
$61$30
$2,603$79$30
$104$81
$8,178$30
$490$192
$814$6,528$329
$621$667$125
$1,097
$2,663
$1,778$415
$2,600$3,096$100
$458
1878
187
1161
67
13557
2115108977
138
23479
11696
109
438
1478
127
101119221711
19
62
22211
32
542
12
3532
103
272
61
3172
432
14
3
458
602
7
$838$2,360
$241$177$365$100$221
$354$657
$3,476$300
$153$90
$1,112$508$270$123$555
$3,999$30
$495$211
$383$620$194
$682$640$323
$1,048
$1,405
$1,214$386
$0$3,096$100
$368
9.09%10.00%
4.76%11.78%0.36%6.67%1.40%
2.27%7.46%
12.30%1.94%
5.85%3.13%3.57%1.09%
13.43%24.40%5.17%0.03%0.53%
4.82%5.48%
0.98%2.01%1.09%
2.88%4.65%
15.93%3.19%
1.24%
1.36%4.88%0.10%1.97%
28.57%
2.19%
Average Annual Employee Donation
per Donor
Average Annual Company Match per Participant
22All information enclosed is considered intellectual property of YourCause, LLC.
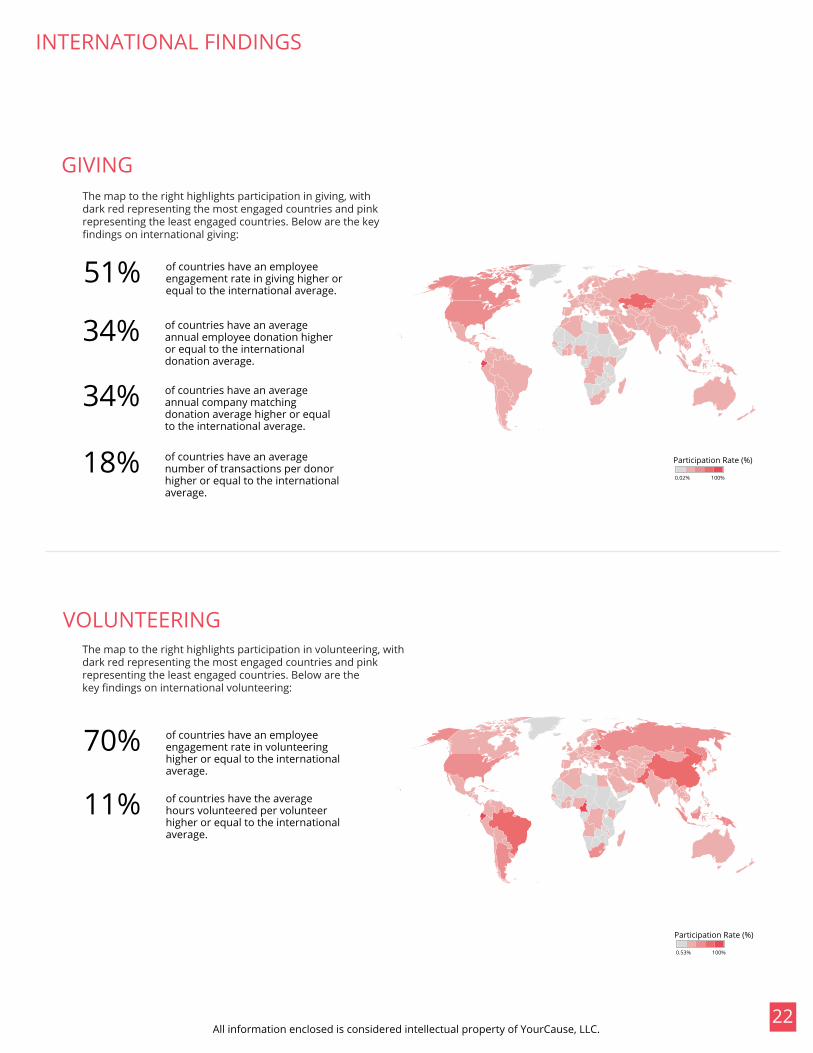
INTERNATIONAL FINDINGS
GIVING
VOLUNTEERING
51% of countries have an employee engagement rate in giving higher or equal to the international average.
34% of countries have an average annual employee donation higher or equal to the international donation average.
34% of countries have an average annual company matching donation average higher or equal to the international average.
18% of countries have an average number of transactions per donor higher or equal to the international average.
70% of countries have an employee engagement rate in volunteering higher or equal to the international average.
11% of countries have the average hours volunteered per volunteer higher or equal to the international average.
The map to the right highlights participation in giving, with dark red representing the most engaged countries and pink representing the least engaged countries. Below are the key findings on international giving:
The map to the right highlights participation in volunteering, with dark red representing the most engaged countries and pink representing the least engaged countries. Below are the key findings on international volunteering:
Participation Rate (%)
0.02% 100%
Participation Rate (%)
0.53% 100%
23Issue 5 - Review overall methodology and glossary of terms found on pages 35 / 38.
EmployeeEngagement
(giving)
EmployeeEngagement(volunteering)
Average Transactions
per Donor
Average Hours per Volunteer
AKALARAZCACOCTDEFLGAHIIAIDILINKSKYLAMAMDMEMIMNMOMSMTNCNDNENHNJ
NMNVNYOHOKORPARISCSDTNTXUTVAVTWAWIWVWY
Domestic Average
20.97%9.59%4.15%
19.16%11.34%14.15%7.35%
17.39%13.36%10.88%4.64%
36.71%25.34%11.98%7.17%3.83%5.56%4.80%
15.75%9.09%
22.74%4.54%
21.04%18.68%5.14%
29.79%20.97%11.71%16.01%29.67%7.25%
18.12%13.31%8.67%5.91%
15.30%20.96%10.46%11.97%12.02%41.89%11.54%17.08%17.28%10.95%21.36%18.12%14.14%1.53%
14.13%13.86%
$541$418$403$772$858$889$552$292$446$740$563$583$596$549$316$369$235$478$794$595$616$576
$1,206$375$529$752$553$803$524$981$623$725$503
$2,118$514$313$692$940$598$553$382$616$884
$1,169$702
$1,510$649$462$174
$1,021
$768
421621212718253718141123251620302726113132182022442419303310162330161817271720222415213324202220263322
1212111013989
101211109
101213101489
11118
11261112118
11119
1269
12138
1410111015109
1211119
1112
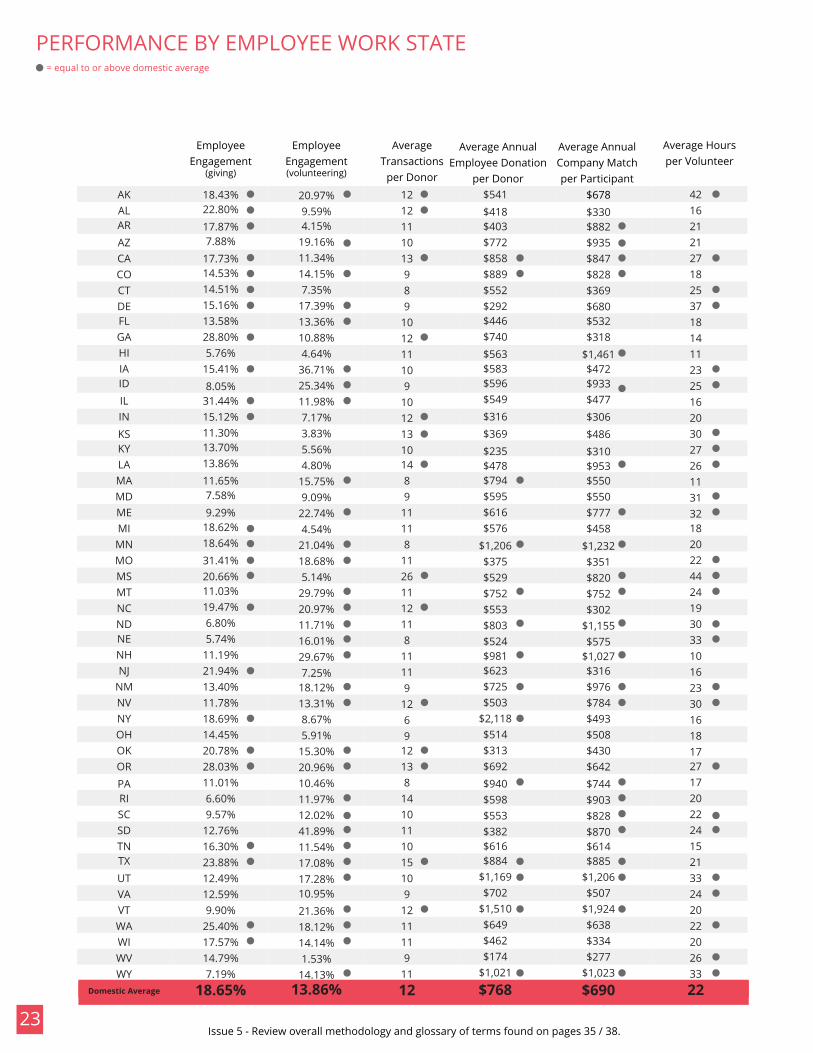
PERFORMANCE BY EMPLOYEE WORK STATE= equal to or above domestic average
$678$330$882$935$847$828$369$680$532$318
$1,461$472$933$477$306$486$310$953$550$550$777$458
$1,232$351$820$752$302
$1,155$575
$1,027$316$976$784$493$508$430$642$744$903$828$870$614$885
$1,206$507
$1,924$638$334$277
$1,023
$690
18.43%22.80%17.87%7.88%
17.73%14.53%14.51%15.16%13.58%28.80%5.76%
15.41%8.05%
31.44%15.12%11.30%13.70%13.86%11.65%7.58%9.29%
18.62%18.64%31.41%20.66%11.03%19.47%6.80%5.74%
11.19%21.94%13.40%11.78%18.69%14.45%20.78%28.03%11.01%6.60%9.57%
12.76%16.30%23.88%12.49%12.59%9.90%
25.40%17.57%14.79%7.19%
18.65%
Average Annual Employee Donation
per Donor
Average Annual Company Match per Participant
All information enclosed is considered intellectual property of YourCause, LLC.
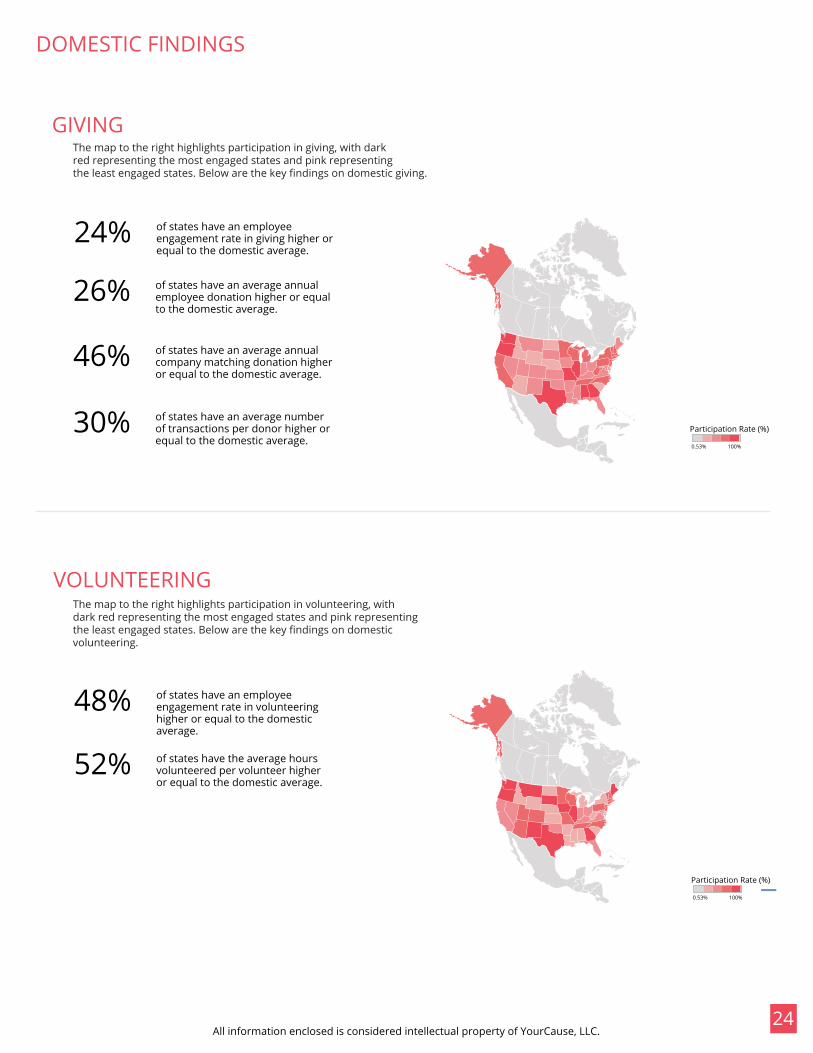
DOMESTIC FINDINGS
GIVING
VOLUNTEERING
24% of states have an employee engagement rate in giving higher or equal to the domestic average.
26% of states have an average annual employee donation higher or equal to the domestic average.
46% of states have an average annual company matching donation higher or equal to the domestic average.
30% of states have an average number of transactions per donor higher or equal to the domestic average.
48% of states have an employee engagement rate in volunteering higher or equal to the domestic average.
52% of states have the average hours volunteered per volunteer higher or equal to the domestic average.
The map to the right highlights participation in giving, with dark red representing the most engaged states and pink representing the least engaged states. Below are the key findings on domestic giving.
The map to the right highlights participation in volunteering, with dark red representing the most engaged states and pink representing the least engaged states. Below are the key findings on domestic volunteering.
24
Participation Rate (%)
0.53% 100%
Participation Rate (%)
0.53% 100%
25Issue 5 - Review overall methodology and glossary of terms found on pages 35 / 38.
25
$40
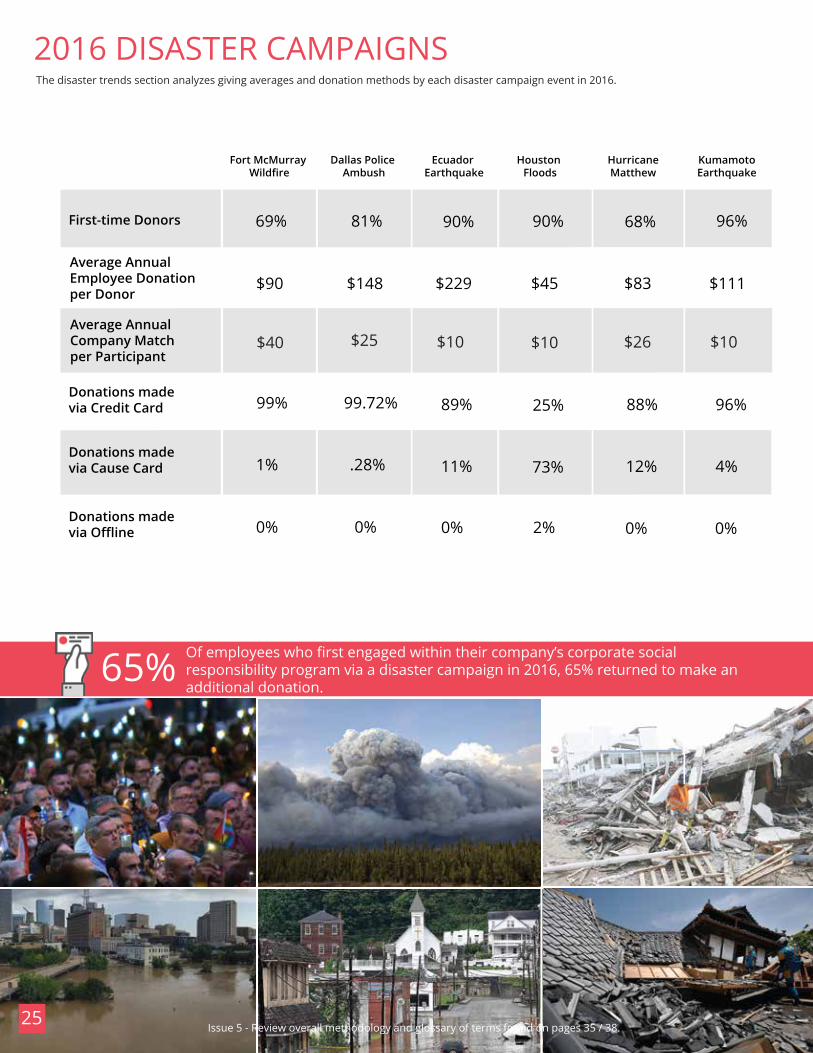
99%
1%
69%
0%
Dallas Police Ambush
Ecuador Earthquake
Houston Floods
First-time Donors
Donations made via Credit Card
Donations made via Cause Card
Donations made via Offline
HurricaneMatthew
KumamotoEarthquake
$25
99.72%
.28%
81%
0%
$10
89%
11%
90%
0%
Fort McMurray Wildfire
$10
25%
73%
90%
2%
$26
88%
12%
68%
0%
$10
96%
4%
96%
0%
Of employees who first engaged within their company’s corporate social responsibility program via a disaster campaign in 2016, 65% returned to make an additional donation.
65%
2016 DISASTER CAMPAIGNS
$90 $148 $229 $45 $83 $111
The disaster trends section analyzes giving averages and donation methods by each disaster campaign event in 2016.
Average Annual Employee Donation per Donor
Average Annual Company Match per Participant
All information enclosed is considered intellectual property of YourCause, LLC. 26
$18
99.53%
.26%
57%
.21%
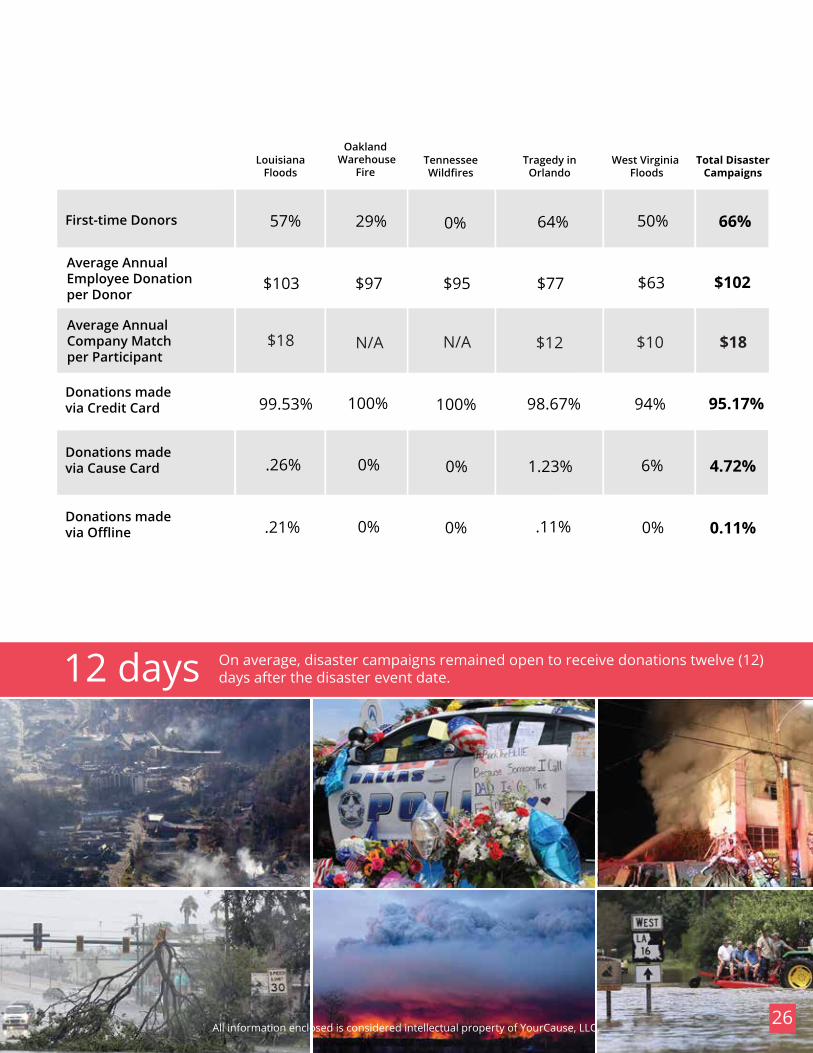
Oakland Warehouse
Fire TennesseeWildfires
Tragedy inOrlando
First-time Donors
Donations made via Credit Card
Donations made via Cause Card
Donations made via Offline
West Virginia Floods
Total DisasterCampaigns
100%
0%
29%
N/A
100%
0%
0%
0%
LouisianaFloods
$12
98.67%
1.23%
64%
.11%
$10
94%
50%
0%
$18
95.17%
4.72%
66%
0.11%0%
6%
$103 $97 $95 $77 $63 $102
N/A
On average, disaster campaigns remained open to receive donations twelve (12) days after the disaster event date.12 days
Average Annual Employee Donation per Donor
Average Annual Company Match per Participant
29
27Issue 5 - Review overall methodology and glossary of terms found on pages 35 / 38.
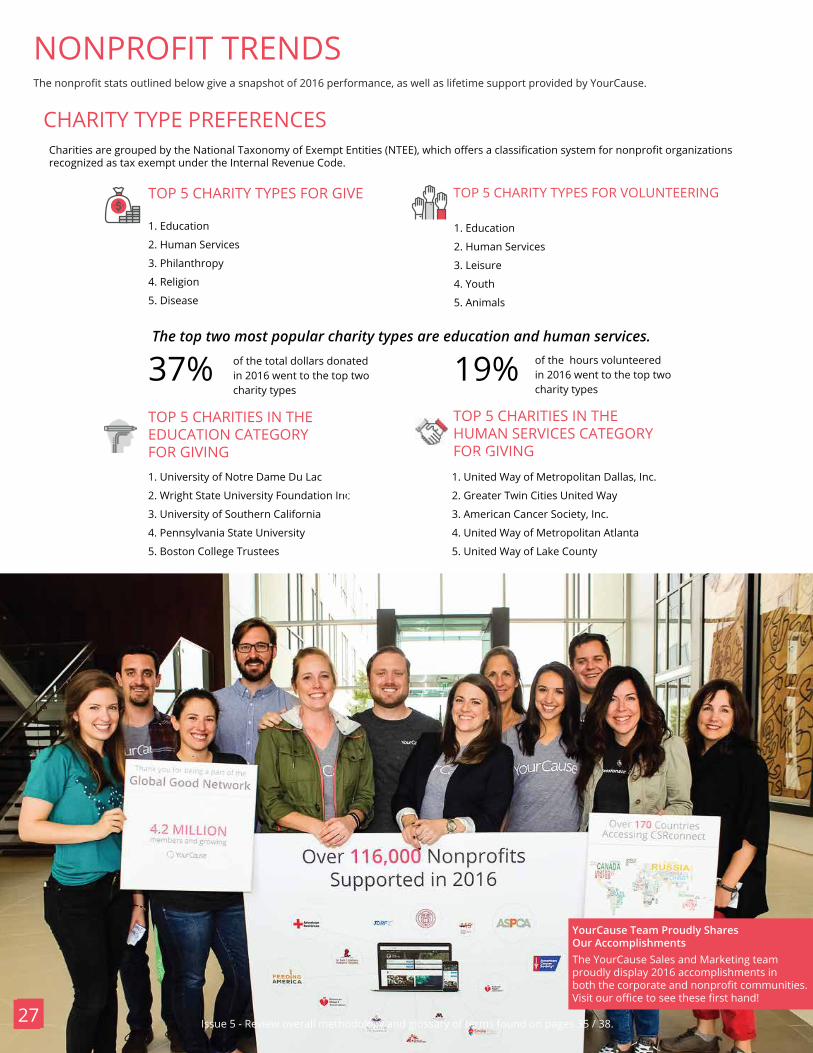
NONPROFIT TRENDS
The YourCause Sales and Marketing team proudly display 2016 accomplishments in both the corporate and nonprofit communities. Visit our office to see these first hand!
YourCause Team Proudly Shares Our Accomplishments
The nonprofit stats outlined below give a snapshot of 2016 performance, as well as lifetime support provided by YourCause.
CHARITY TYPE PREFERENCESCharities are grouped by the National Taxonomy of Exempt Entities (NTEE), which offers a classification system for nonprofit organizations recognized as tax exempt under the Internal Revenue Code.
TOP 5 CHARITY TYPES FOR GIVE TOP 5 CHARITY TYPES FOR VOLUNTEERING
1. Education
2. Human Services
3. Leisure
4. Youth
5. Animals
1. Education
2. Human Services
3. Philanthropy
4. Religion
5. Disease
19% of the hours volunteeredin 2016 went to the top two charity types
37%TOP 5 CHARITIES IN THE EDUCATION CATEGORY FOR GIVING
TOP 5 CHARITIES IN THE HUMAN SERVICES CATEGORY FOR GIVING
1. University of Notre Dame Du Lac
2. Wright State University Foundation Inc
3. University of Southern California
4. Pennsylvania State University
5. Boston College Trustees
1. United Way of Metropolitan Dallas, Inc.
2. Greater Twin Cities United Way
3. American Cancer Society, Inc.
4. United Way of Metropolitan Atlanta
5. United Way of Lake County
The top two most popular charity types are education and human services.of the total dollars donated in 2016 went to the top two charity types
29
29
27
All information enclosed is considered intellectual property of YourCause, LLC. 28
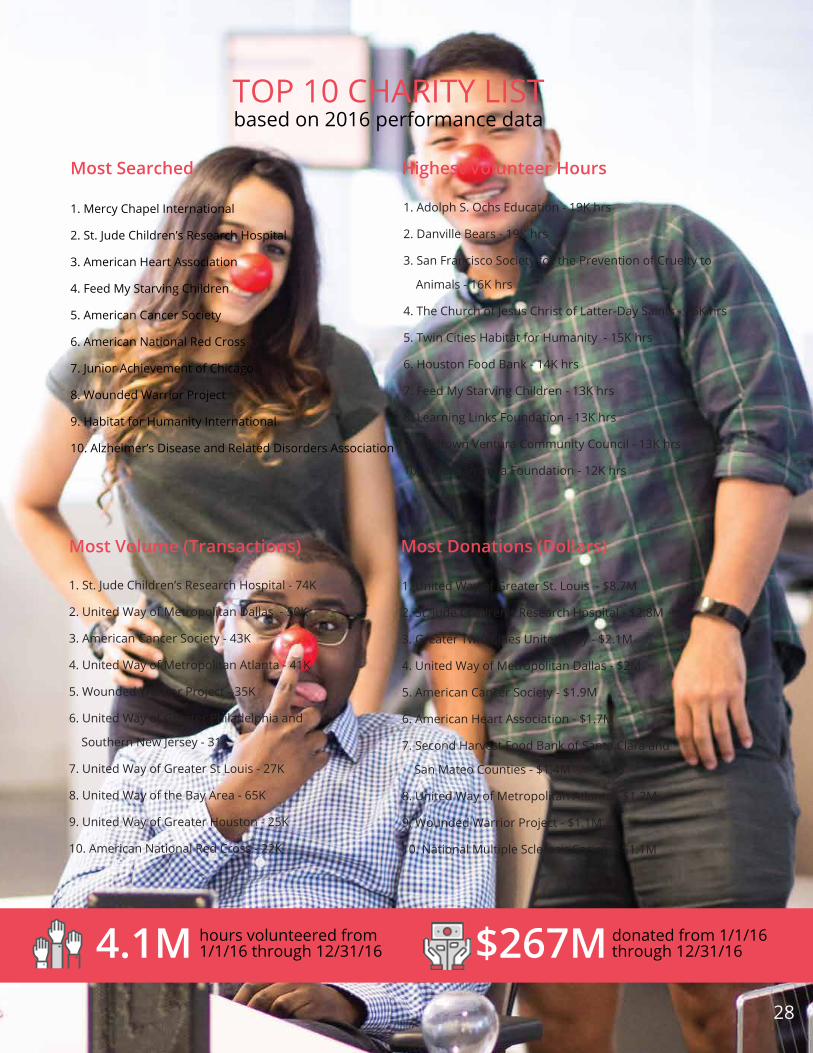
$267M donated from 1/1/16 through 12/31/164.1M hours volunteered from
1/1/16 through 12/31/16
1. St. Jude Children’s Research Hospital - 74K
2. United Way of Metropolitan Dallas - 50K
3. American Cancer Society - 43K
4. United Way of Metropolitan Atlanta - 41K
5. Wounded Warrior Project - 35K
6. United Way of Greater Philadelphia and
Southern New Jersey - 31K
7. United Way of Greater St Louis - 27K
8. United Way of the Bay Area - 65K
9. United Way of Greater Houston - 25K
10. American National Red Cross - 22K
1. Mercy Chapel International
2. St. Jude Children’s Research Hospital
3. American Heart Association
4. Feed My Starving Children
5. American Cancer Society
6. American National Red Cross
7. Junior Achievement of Chicago
8. Wounded Warrior Project
9. Habitat for Humanity International
10. Alzheimer’s Disease and Related Disorders Association
Most Volume (Transactions) Most Donations (Dollars)
Most Searched Highest Volunteer Hours
1. United Way of Greater St. Louis - $8.7M
2. St. Jude Children's Research Hospital - $2.8M
3. Greater Twin Cities United Way - $2.1M
4. United Way of Metropolitan Dallas - $2M
5. American Cancer Society - $1.9M
6. American Heart Association - $1.7M
7. Second Harvest Food Bank of Santa Clara and
San Mateo Counties - $1.4M
8. United Way of Metropolitan Atlanta - $1.2M
9. Wounded Warrior Project - $1.1M
10. National Multiple Sclerosis Society - $1.1M
TOP 10 CHARITY LISTbased on 2016 performance data
1. Adolph S. Ochs Education - 19K hrs
2. Danville Bears - 19K hrs
3. San Francisco Society for the Prevention of Cruelty to
Animals - 16K hrs
4. The Church of Jesus Christ of Latter-Day Saints - 16K hrs
5. Twin Cities Habitat for Humanity - 15K hrs
6. Houston Food Bank - 14K hrs
7. Feed My Starving Children - 13K hrs
8. Learning Links Foundation - 13K hrs
9. Midtown Ventura Community Council - 13K hrs
10. American India Foundation - 12K hrs
28
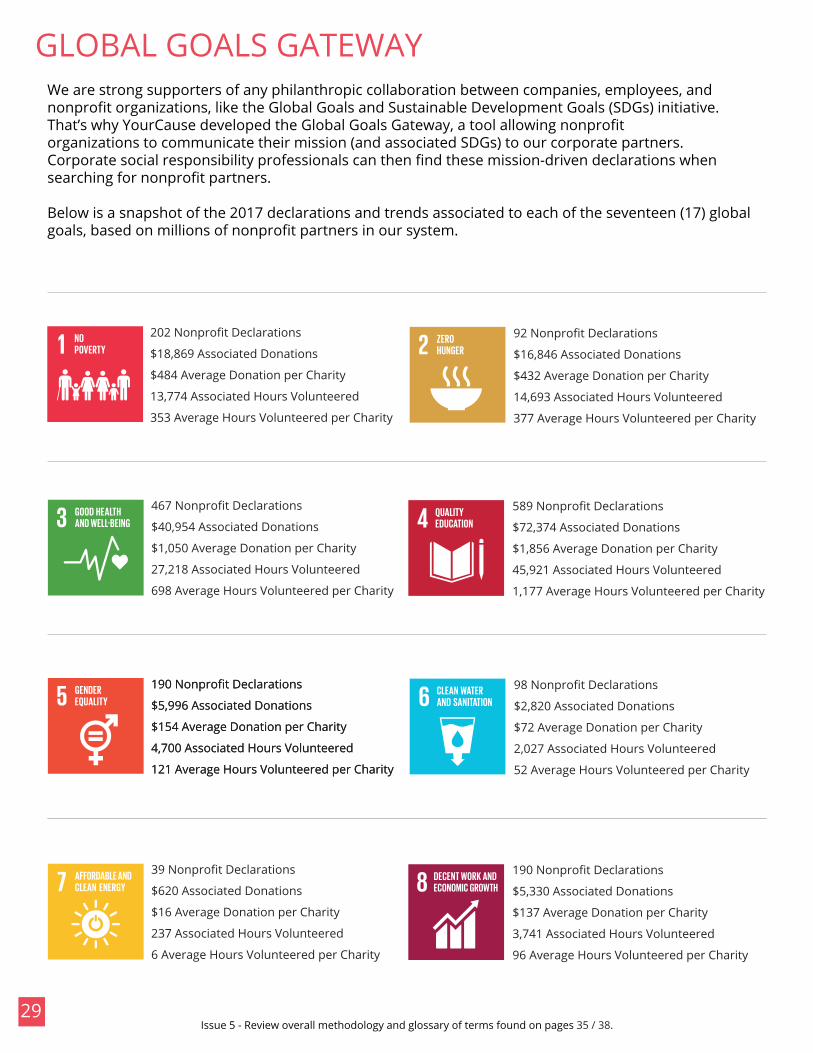
202 Nonprofit Declarations
$18,869 Associated Donations
$484 Average Donation per Charity
13,774 Associated Hours Volunteered
353 Average Hours Volunteered per Charity
92 Nonprofit Declarations
$16,846 Associated Donations
$432 Average Donation per Charity
14,693 Associated Hours Volunteered
377 Average Hours Volunteered per Charity
467 Nonprofit Declarations
$40,954 Associated Donations
$1,050 Average Donation per Charity
27,218 Associated Hours Volunteered
698 Average Hours Volunteered per Charity
589 Nonprofit Declarations
$72,374 Associated Donations
$1,856 Average Donation per Charity
45,921 Associated Hours Volunteered
1,177 Average Hours Volunteered per Charity
190 Nonprofit Declarations
$5,996 Associated Donations
$154 Average Donation per Charity
4,700 Associated Hours Volunteered
121 Average Hours Volunteered per Charity
190 Nonprofit Declarations
$5,996 Associated Donations
$154 Average Donation per Charity
4,700 Associated Hours Volunteered
121 Average Hours Volunteered per Charity
98 Nonprofit Declarations
$2,820 Associated Donations
$72 Average Donation per Charity
2,027 Associated Hours Volunteered
52 Average Hours Volunteered per Charity
39 Nonprofit Declarations
$620 Associated Donations
$16 Average Donation per Charity
237 Associated Hours Volunteered
6 Average Hours Volunteered per Charity
190 Nonprofit Declarations
$5,330 Associated Donations
$137 Average Donation per Charity
3,741 Associated Hours Volunteered
96 Average Hours Volunteered per Charity
Issue 5 - Review overall methodology and glossary of terms found on pages 35 / 38.29
GLOBAL GOALS GATEWAYWe are strong supporters of any philanthropic collaboration between companies, employees, and nonprofit organizations, like the Global Goals and Sustainable Development Goals (SDGs) initiative. That’s why YourCause developed the Global Goals Gateway, a tool allowing nonprofit organizations to communicate their mission (and associated SDGs) to our corporate partners. Corporate social responsibility professionals can then find these mission-driven declarations when searching for nonprofit partners.
Below is a snapshot of the 2017 declarations and trends associated to each of the seventeen (17) global goals, based on millions of nonprofit partners in our system.
donated from 1/1/16 through 12/31/16
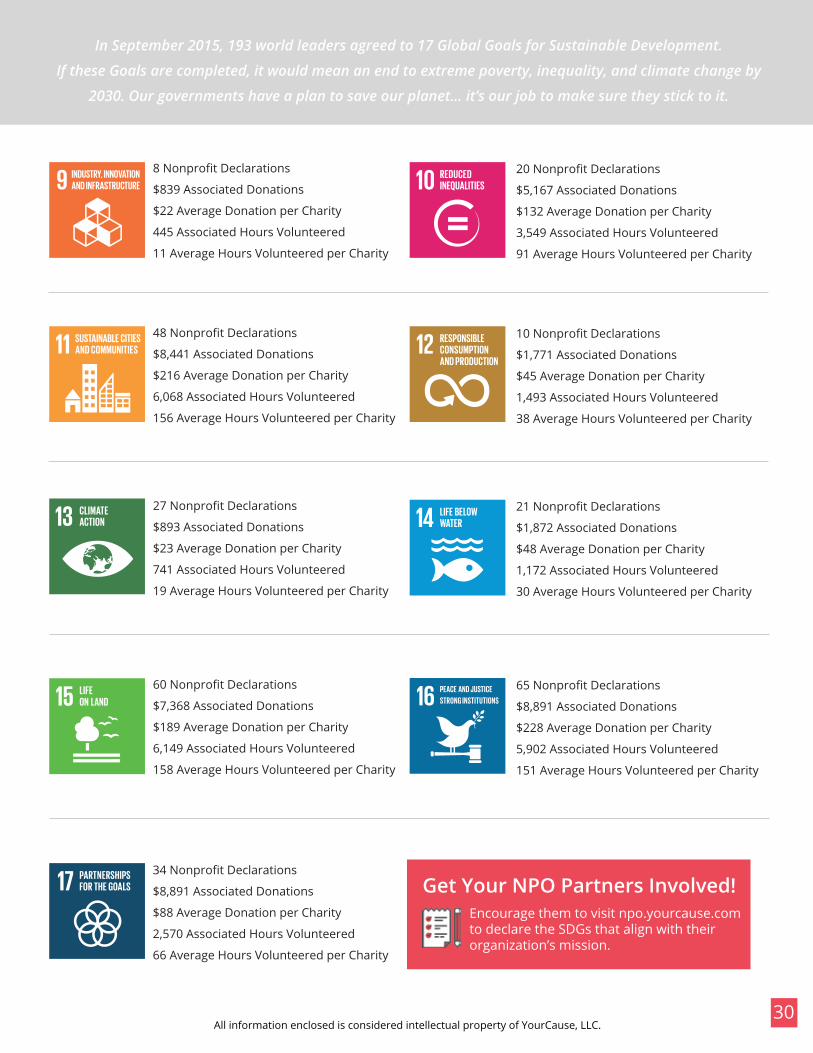
8 Nonprofit Declarations
$839 Associated Donations
$22 Average Donation per Charity
445 Associated Hours Volunteered
11 Average Hours Volunteered per Charity
20 Nonprofit Declarations
$5,167 Associated Donations
$132 Average Donation per Charity
3,549 Associated Hours Volunteered
91 Average Hours Volunteered per Charity
48 Nonprofit Declarations
$8,441 Associated Donations
$216 Average Donation per Charity
6,068 Associated Hours Volunteered
156 Average Hours Volunteered per Charity
10 Nonprofit Declarations
$1,771 Associated Donations
$45 Average Donation per Charity
1,493 Associated Hours Volunteered
38 Average Hours Volunteered per Charity
27 Nonprofit Declarations
$893 Associated Donations
$23 Average Donation per Charity
741 Associated Hours Volunteered
19 Average Hours Volunteered per Charity
21 Nonprofit Declarations
$1,872 Associated Donations
$48 Average Donation per Charity
1,172 Associated Hours Volunteered
30 Average Hours Volunteered per Charity
60 Nonprofit Declarations
$7,368 Associated Donations
$189 Average Donation per Charity
6,149 Associated Hours Volunteered
158 Average Hours Volunteered per Charity
65 Nonprofit Declarations
$8,891 Associated Donations
$228 Average Donation per Charity
5,902 Associated Hours Volunteered
151 Average Hours Volunteered per Charity
34 Nonprofit Declarations
$8,891 Associated Donations
$88 Average Donation per Charity
2,570 Associated Hours Volunteered
66 Average Hours Volunteered per Charity
All information enclosed is considered intellectual property of YourCause, LLC. 30
Get Your NPO Partners Involved!Encourage them to visit npo.yourcause.com to declare the SDGs that align with their organization’s mission.
In September 2015, 193 world leaders agreed to 17 Global Goals for Sustainable Development.
If these Goals are completed, it would mean an end to extreme poverty, inequality, and climate change by
2030. Our governments have a plan to save our planet... it’s our job to make sure they stick to it.
Issue 3 - Review overall methodology and glossary of terms found on pages 27 / 30.31
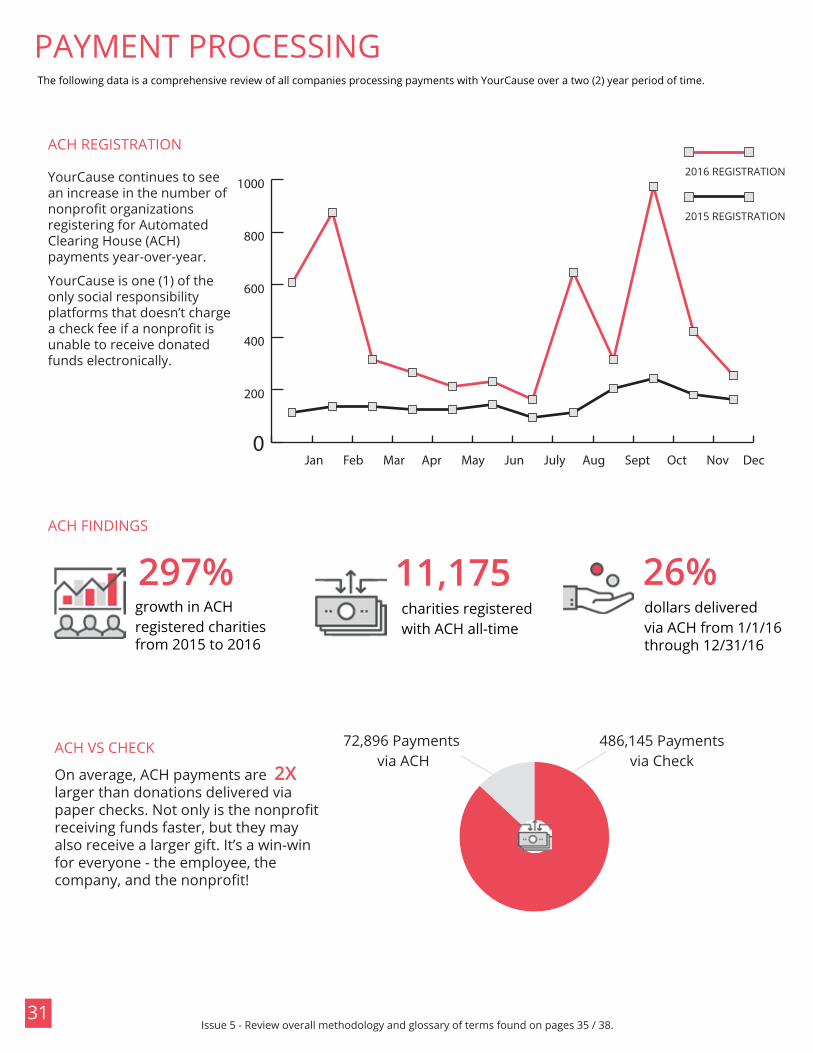
PAYMENT PROCESSING
11,175297% 26%charities registered with ACH all-time
0
200
400
600
800
1000YourCause continues to see an increase in the number of nonprofit organizations registering for Automated Clearing House (ACH) payments year-over-year.
YourCause is one (1) of the only social responsibility platforms that doesn’t charge a check fee if a nonprofit is unable to receive donated funds electronically.
ACH REGISTRATION
2015 REGISTRATION
2016 REGISTRATION
ACH FINDINGS
growth in ACH registered charities from 2015 to 2016
dollars delivered via ACH from 1/1/16 through 12/31/16
ACH VS CHECK 72,896 Payments via ACH
486,145 Paymentsvia Check
On average, ACH payments are 2X larger than donations delivered via paper checks. Not only is the nonprofit receiving funds faster, but they may also receive a larger gift. It’s a win-win for everyone - the employee, the company, and the nonprofit!
Jan Feb Mar Apr May Jun July Aug Sept Oct Nov Dec
Issue 5 - Review overall methodology and glossary of terms found on pages 35 / 38.
The following data is a comprehensive review of all companies processing payments with YourCause over a two (2) year period of time.
28
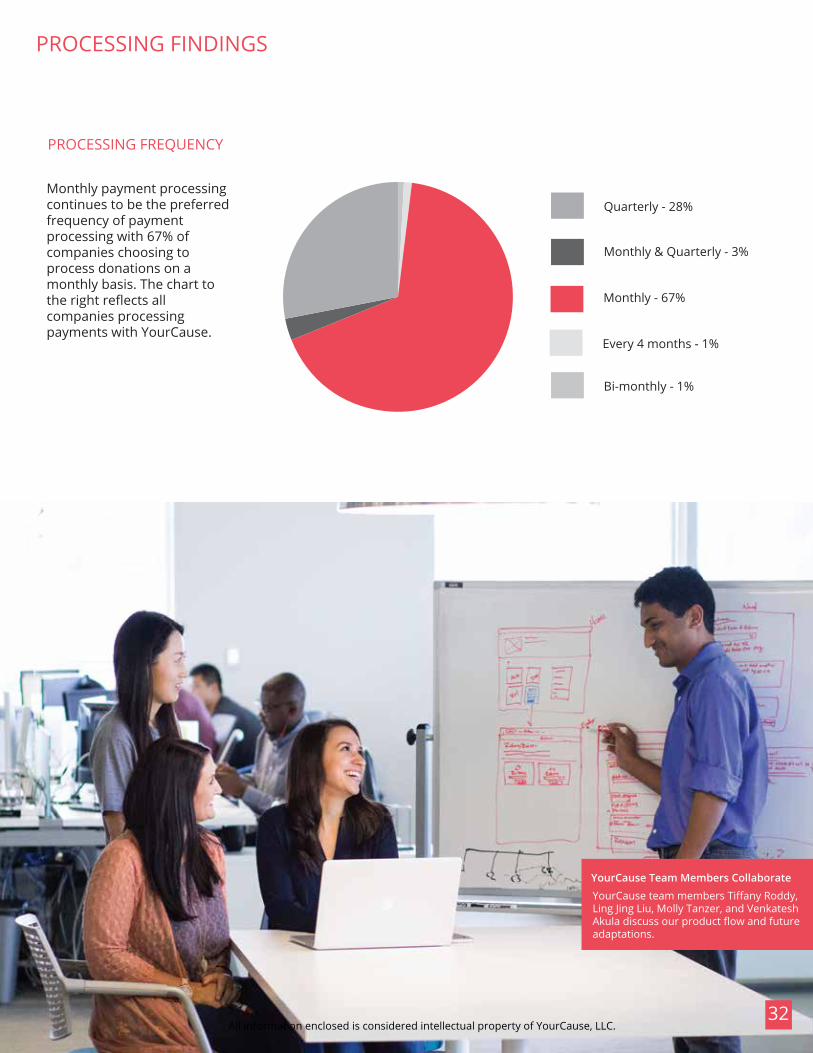
YourCause team members Tiffany Roddy, Ling Jing Liu, Molly Tanzer, and Venkatesh Akula discuss our product flow and future adaptations.
YourCause Team Members Collaborate
32
PROCESSING FREQUENCY
Quarterly - 28%
Monthly & Quarterly - 3%
Monthly - 67%
Every 4 months - 1%
Bi-monthly - 1%
Monthly payment processing continues to be the preferred frequency of payment processing with 67% of companies choosing to process donations on a monthly basis. The chart to the right reflects all companies processing payments with YourCause.
All information enclosed is considered intellectual property of YourCause, LLC.
PROCESSING FINDINGS
NONPROFIT SHOWCASE
$1,146,841 in donations to provide 76,456 children with
lifesaving care.
$7,493,392 in donations to provide crutches to 74,933
sick children.
$1,010,715 donated to buy phone cards for 40,428 separated siblings
to help them stay in touch.
YourCause Team Members Collaborate
33Issue 5 - Review overall methodology and glossary of terms found on pages 35 / 38.
$1,360,348 in donations to provide 13,603 families with
the gift of goats.
$1,288,005 in donations to feed 3,446 families for an
entire year.
$988,750 donations made to provide 19,775 interns a day’s
stipend to learn hands-on resource land management.
All information enclosed is considered intellectual property of YourCause, LLC. 34
OVERALL METHODOLOGY
OverviewTo construct the fifth edition of the Industry Review, data was
collected from companies with at least two (2) years of usage with
the system, consequently excluding any organization joining the
CSRconnect community after December 31, 2015. The data
analysis only looked at data from January 1, 2016 to December
31, 2016, except where otherwise noted. The data is not a
reflection of any one (1) specific organization, but rather a broad
overview of all data collected from users over the period of 12
months.
DataThe complete data analysis only looked at data captured within
the CSRconnect system and is currently stored within the active
database. Additional data points referenced within the
Bloomberg Industry Classification Standard (BICS) were used to
identify each organization’s industry. At no time was external data
used to support the analysis.
One might note there are some pretty drastic differences
between previous industry reports and this edition – specifically
as it relates to international employees and the donation
distribution as it relates to region. Because the data being used is
from active YourCause clients, the underlying client sample has
changed pretty significantly between 7/1/14 and 12/31/16.
Furthermore, the YourCause data collection efforts are far more
robust than they have been in previous editions.
Guiding PrinciplesTransparency: The topics covered within this Industry Review
were influenced by questions most frequently asked of
YourCause by clients, prospects or industry peers. It is our goal
to transparently display this data (and consequently, the
responses to such questions) within a common document for the
industry to observe – without bias, prejudice and with as little
opinion from YourCause as possible.
Design: A great design is oftentimes able to make plain old data…
exciting! The creation and purpose of this Industry Review is to
bring excitement and enthusiasm to this space by way of the data
we uncover. Therefore, the team responsible for the production
2535
of this Industry Review has placed a considerable amount of
time ensuring an ongoing visual appeal while maintaining
overall data integrity.
Foundation Building: With this edition completed, a foundation
of data is now in place to serve as a baseline for future
publications and enable our team to determine trends for the
prior six (6) and twelve (12) months. Moving forward, subse-
quent publications will reference previous Industry Reviews and
seek to analyze possible short - and long - term trends.
Limitations and AssumptionsAll conclusions are extracted from direct historical data
managed internally during the January 1, 2016 to December 31,
2016 timeframes. By way of the total volume of records being
analyzed, we are able to determine, with a 95% confidence level,
the conclusions stated within this review are accurate.
• For industry-wide averages, it is important to note that all
‘zero (0) value data’ were excluded within the
calculations, eliminating unintentional adverse impacts on
averages.
• Individual users entering large volumes of hours for a
single day’s event may skew average volunteer hours.
• Average volunteer hours represent the average number
of hours logged on an annual basis (calendar year).
All information enclosed is considered intellectual property of YourCause, LLC. 36
Domestic Regional BreakoutN - Northern Region: Minnesota, Michigan, North Dakota,
South Dakota, Montana, Wisconsin, and Wyoming.
E - Eastern Region: Connecticut, Pennsylvania, Ohio,
Delaware, New Jersey, New York, Georgia, Massachusetts,
North Carolina, South Carolina, Vermont, Rhode Island,
Maine, New Hampshire, West Virginia, Virginia, Maryland, and
Washington, D.C.
W - Western Region: Idaho, California, Washington, Arizona,
Utah, Oregon, Nevada, Alaska, and Hawaii.
MW - Midwest Region: Nebraska, Iowa, Illinois, Kentucky,
Kansas, Missouri, Indiana, and Colorado.
S - Southern Region: Texas, New Mexico, Oklahoma, Tennes-
see, Louisiana, Arkansas, Florida, Alabama, and Mississippi.
Industry CategorizationCommunications: Cable & Satellite, Entertainment, Media
Non-Cable, Wireless Telecom Services, Wireline Telecom
Services
Consumer Discretionary: Airlines, Apparel & Textile Products,
Automotive, Casinos & Gaming, Consumer Services, Distribu-
tors, Educational Services, Entertainment Resources, Home &
Office Products, Home Builders, Home Improvements, Leisure
Products, Restaurants, Travel & Lodging
Consumer Staples: Consumer Products, Food & Beverage,
Retail Staples Supermarkets, Tobacco
Energy: Exploration & Production, Integrated Oils, Oil & Gas
Services, Pipeline, Refining, Renewable Energy
Financials: Banking, Commercial Finance, Consumer Finance,
Financial Services, Life Insurance, Property & Casualty, Real
Estate
Health Care: Health Care Facilities & Services, Managed Care,
Medical Equipment & Devices, Pharmaceuticals
Industrials: Aerospace & Defense, Electronic Equipment,
Industrial Other, Machinery, Manufactured Goods, Railroad,
Transportation & Logistics, Waste & Environment Service,
Equipment & Facilities
Materials: Chemicals, Construction Materials, Construction &
Packaging, Forest & Paper Products, Metals & Mining
Technology: Communications Equipment, Hardware, Software
& Services
Utilities: Electric & Gas Utilities and Energy Providers
Government: Sovereign, Government Agency, Government
Regional/Local, Supranational, Development Bank, Winding Up
Agency
37
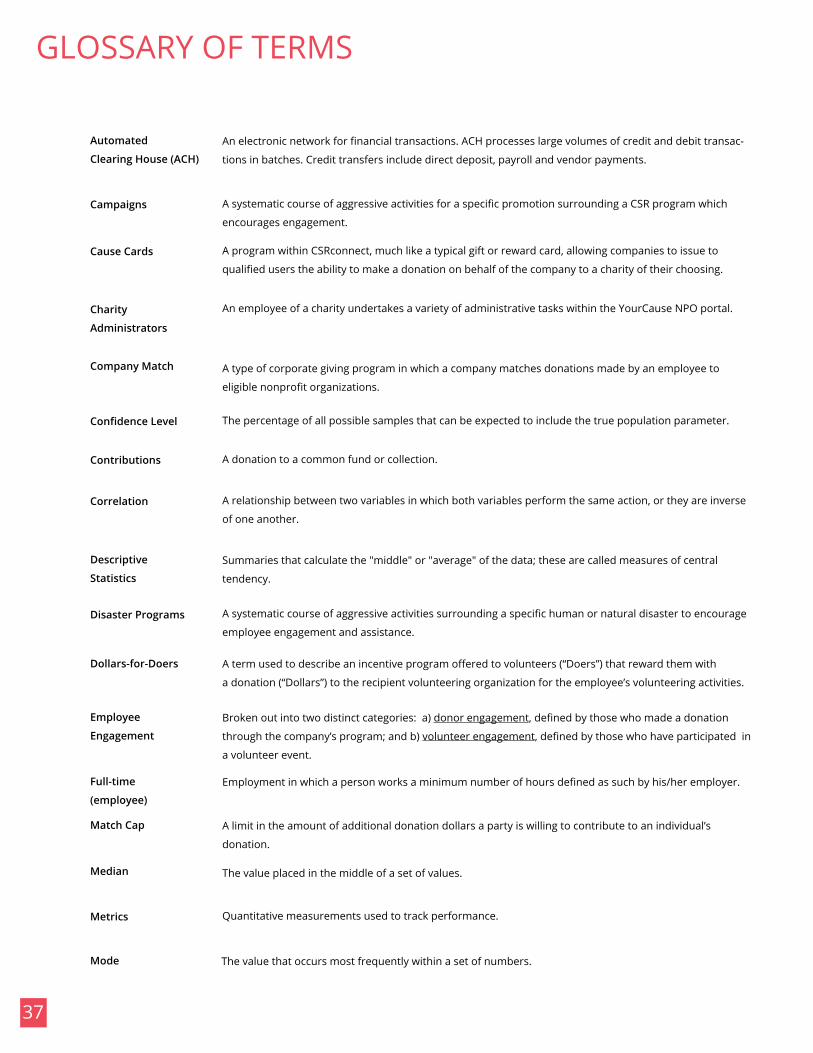
GLOSSARY OF TERMS
The percentage of all possible samples that can be expected to include the true population parameter.
Quantitative measurements used to track performance.
The value placed in the middle of a set of values.
Summaries that calculate the "middle" or "average" of the data; these are called measures of central
tendency.
A relationship between two variables in which both variables perform the same action, or they are inverse
of one another.
The value that occurs most frequently within a set of numbers.
Confidence Level
Mode
Metrics
Median
Descriptive
Statistics
Correlation
Employment in which a person works a minimum number of hours defined as such by his/her employer.
A program within CSRconnect, much like a typical gift or reward card, allowing companies to issue to
qualified users the ability to make a donation on behalf of the company to a charity of their choosing.
A term used to describe an incentive program offered to volunteers (“Doers”) that reward them with
a donation (“Dollars”) to the recipient volunteering organization for the employee’s volunteering activities.
Broken out into two distinct categories: a) donor engagement, defined by those who made a donation
through the company’s program; and b) volunteer engagement, defined by those who have participated in
a volunteer event.
Dollars-for-Doers
Employee
Engagement
Full-time
(employee)
Cause Cards
A donation to a common fund or collection.
A limit in the amount of additional donation dollars a party is willing to contribute to an individual’s
donation.
An electronic network for financial transactions. ACH processes large volumes of credit and debit transac-
tions in batches. Credit transfers include direct deposit, payroll and vendor payments.
A systematic course of aggressive activities surrounding a specific human or natural disaster to encourage
employee engagement and assistance.
A systematic course of aggressive activities for a specific promotion surrounding a CSR program which
encourages engagement.
Contributions
Automated
Clearing House (ACH)
Disaster Programs
Campaigns
Match Cap
An employee of a charity undertakes a variety of administrative tasks within the YourCause NPO portal.Charity
Administrators
Company Match A type of corporate giving program in which a company matches donations made by an employee to
eligible nonprofit organizations.
34All information enclosed is considered intellectual property of YourCause, LLC.
38
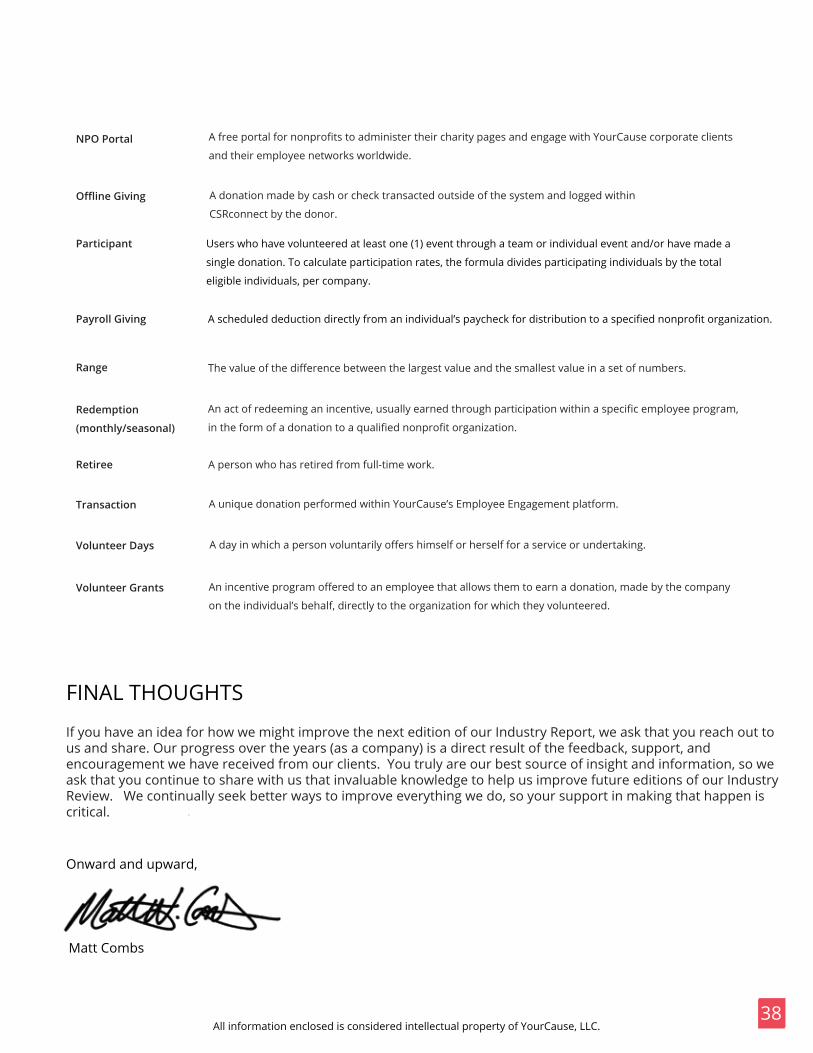
Onward and upward,
Matt Combs
FINAL THOUGHTS
The value of the difference between the largest value and the smallest value in a set of numbers.Range
Participant
An incentive program offered to an employee that allows them to earn a donation, made by the company
on the individual’s behalf, directly to the organization for which they volunteered.
A unique donation performed within YourCause’s Employee Engagement platform.
A person who has retired from full-time work.
An act of redeeming an incentive, usually earned through participation within a specific employee program,
in the form of a donation to a qualified nonprofit organization.
Volunteer Grants
Redemption
(monthly/seasonal)
Transaction
Retiree
A day in which a person voluntarily offers himself or herself for a service or undertaking.
A donation made by cash or check transacted outside of the system and logged within
CSRconnect by the donor.
Volunteer Days
Payroll Giving
Offline Giving
A free portal for nonprofits to administer their charity pages and engage with YourCause corporate clients
and their employee networks worldwide.NPO Portal
Users who have volunteered at least one (1) event through a team or individual event and/or have made a
single donation. To calculate participation rates, the formula divides participating individuals by the total
eligible individuals, per company.
A scheduled deduction directly from an individual’s paycheck for distribution to a specified nonprofit organization.
If you have an idea for how we might improve the next edition of our Industry Report, we ask that you reach out to us and share. Our progress over the years (as a company) is a direct result of the feedback, support, and encouragement we have received from our clients. You truly are our best source of insight and information, so we ask that you continue to share with us that invaluable knowledge to help us improve future editions of our Industry Review. We continually seek better ways to improve everything we do, so your support in making that happen is critical.
ABOUT YOURCAUSE
To learn more about us, visit YourCause.com
YourCause delivers the CSRconnect Employee Engagement Platform to enterprise clients of all sizes, providing a fully hosted solution for a broad array of corporate community involvement programs. CSRconnect is a robust and highly configurable software platform catering to each client’s CSR program with giving, volunteering, sustainability, grants, nonprofit partnerships, and other related engagement tools and philanthropy processing services. Through the CSRconnect Employee Engagement Platform, clients are able to fully manage and report the depth of their social impact and overall employee engagement.