Embed Size (px)
Citation preview
Employee compensation and new venture performance:does benefit type matter?
Christopher J. Boudreaux
Accepted: 16 April 2020# Springer Science+Business Media, LLC, part of Springer Nature 2020
Abstract Using insights from strategic human resourcemanagement, we examine how employee benefits affectnew venture performance. We hypothesize that twocategories of benefits affect new venture performanceand might do so differently: benefits that promote sta-bility and flexibility. Using employee benefits data fromthe Kauffman Firm Survey, we find that new venturesthat provide stability benefits—healthcare plans, tuitionreimbursement, and retirement plans—have lower ratesof exit and higher odds of earning a profit. Conversely,we find that firms that provide flexibility benefits—financial packages, stock ownership, bonus pay, andpaid sick and vacation leave—do not affect firm exitrates but, with the exception of stock options, also havehigher profits. We use IV methods to control for thepossibility of reverse causality—firms that can afford toprovide better employee benefits probably have betterperformance. Our IV results support our findings andsuggest that firms that provide better employee benefitshave lower exit rates and higher odds of earning a profit.
Keywords Employee benefits . New ventureperformance . Stability . Flexibility . Kauffman FirmSurvey
JEL codes L25 . L26 .M21 .M52
1 Introduction
It is now widely acknowledged that human capital is aviable source of sustainable competitive advantage forthe firm (Pfeffer 1994; Prahalad 1983; Wright et al.1994; Youndt et al. 1996). Organizations invest in hu-man capital through high-involvement work practices(Guthrie 2001) and invest in high-performance humanresource (HR) practices to motivate organizational citi-zenship (Kehoe and Wright 2013), and ultimately im-prove corporate financial performance (Huselid 1995).The extant literature strongly supports the notion thatHR practices are linked to employee participation andfirm performance (Jackson et al. 2014; Kehoe andWright 2013; Wright et al. 2003)1 as well asemployee-based innovations (Pandher et al. 2017).
Strategic human resource management (HRM) con-tends that effective HRM contributes to superior firmperformance (Jackson et al. 2014). Yet, most studies linkconstructs like employee motivation (Kehoe and Wright2013) and formal human resource practices (Sheehan2014) to firm performance. A notable exception is recentwork that links employee motivations as an antecedent offirm performance and finds that start-up employees placelower importance on job security and salary but greater
Small Bus Econhttps://doi.org/10.1007/s11187-020-00357-5
1 Recent work also suggests that although some employer policies areintended to prevent employees from leaving to join competitor com-panies, they may actually encourage employees to become entrepre-neurs (Campbell et al. 2017).
Electronic supplementary material The online version of thisarticle (https://doi.org/10.1007/s11187-020-00357-5) containssupplementary material, which is available to authorized users.
C. J. Boudreaux (*)Department of Economics, College of Business, Florida AtlanticUniversity, 777 Glades Road, Kaye Hall 145, Boca Raton, FL33431, USAe-mail: [email protected]
importance on independence and responsibility(Sauermann 2018). Despite these advances, little is knownabout how specific forms of compensation and recruitmentsuch as HR benefits packages affect new venture perfor-mance. Strategically, employers might offer attractive ben-efits to recruit and retain top employee talent with theanticipation that good talent will contribute towards thenew venture’s performance. Do new ventures that provideemployee benefits exhibit superior performance?
The purpose of this paper is to address this questionby examining the effect that the provision of employeebenefits has on new venture performance. This is espe-cially important because, according to recent Bureau ofLabor Statistics (BLS) estimates (BLS 2018), averageprivate-sector spending on employee benefits is roughlya third of total employee costs (30.4%).2 This is a non-trivial sum that can severely constrain the resourceallocation of small start-up firms. Consequently, man-agement practitioners might desire to assess the efficien-cy of this spending.Moreover, management can provideseveral different types of benefits from which we delin-eate two categories: benefits that promote stability andbenefits that promote flexibility. We hypothesize that,while employees will value both benefit types, they willprioritize benefits that promote stability over flexibility.
In carrying out this research, we make several con-tributions to the literature on strategic HRM and entre-preneurship. First, we examine how the provision ofbenefit type affects new venture performance. Benefitsthat promote stability include healthcare plans, educa-tion tuition reimbursements, and retirement planswhereas benefits that promote flexibility include bonuspay plans, sick pay leave, vacation pay leave, and in-vestment plans. Recent work illustrates substantial dif-ferences in innovation performance between environ-ments that promote stability and those that promoteflexibility (Young et al. 2018). Although Young et al.(2018) discuss stability and flexibility at the countrylevel, we believe this distinction has important implica-tions at the founder level for organizational environ-ments and the recruitment and retaining of employeetalent. By delving closer into the type of benefits offeredto employees, we uncover how new ventures can opti-mize their human resources to enhance firmperformance.
Second, our analysis focuses on newly created start-upfirms. Using a unique dataset—the Kauffman Firm
Survey (KFS)—we examine how the provision of em-ployee benefits affects new venture performance in twoways: (1) risk of business failure and (2) firm profits. It isimportant to consider multiple performance metrics be-cause relying on one performancemeasure alone does notadequately capture start-up firm performance. In the con-text of start-up firms, some can survive without havingprofits for a long time, and this does not necessarily implythe company is not performing well. After some time,such start-up firms can survive and grow thanks to hugefinancing rounds.3 Thus, we focus our analysis on bothprofit and business failure outcomes to avoid relying tooheavily on one performance measure alone. The KFSprovides a unique opportunity to examine nascent enter-prises that began in 2004 and either exited or surviveduntil the culmination of the study in 2011. This is espe-cially important because the competitive landscape ischallenging and difficult to navigate, particularly forsmall businesses in their formative years (Hannan andFreeman 1988). This has led researchers to coin termslike “liability of newness” (Stinchcombe 1965), “liabilityof adolescence” (Fichman and Levinthal 1991), and “li-ability of smallness” (Freeman et al. 1983), which allexplain how fledgling, small businesses face substantialobstacles to business generation—one of which is theconstraint that comes with hiring employees during afirm’s formative years (Deshpande and Golhar 1994;Hornsby and Kuratko 1990; Mathis and Jackson 1991).Importantly, the KFS dataset allows us to distinguishbetween exit types, which is important because not allexit reasons should be treated the same. Consistent withprior KFS studies (Bates and Robb 2014; Cole andSokolyk 2018a, 2018b, 2019; Coleman et al. 2013), weexamine start-up firm exit. Yet, we distinguish betweendifferent reasons for exit and focus on those start-ups thatexit due to going out of business.4
Finally, our results have the potential to influencemanagement practice and small business policy. Usingtheoretical insights from strategic HRM and data fromthe KFS, our findings speak to the relationship betweenHR practices and new venture performance. Previousstudies illustrate how HR practices can encourage em-ployee effort and financial performance (McClean andCollins 2011; Subramony 2009). Our study builds on
2 https://www.bls.gov/news.release/ecec.nr0.htm
3 We thank an anonymous reviewer for pointing this out.4 Other reasons for exit include (1) temporary closure, (2) sale, and (3)merger or acquisition. Our analysis estimates the odds of failure due togoing out of business only, which helps ensure an equal comparison.Refer to the data analysis section for more detail.
C. J. Boudreaux
this research stream and highlights how employee ben-efits encourage greater new venture performance. Froma practical perspective, HRmanagers will find our studyuseful because we identify the benefits offered that havethe most potential to optimize start-up firm perfor-mance. Policy analysts will also find our results usefulbecause we identify HRM as a viable mechanism forimproving start-up firm performance. This is especiallyimportant considering that recent evidence suggests thattalent development is a better solution for businesspolicy when compared with a policy of choosing win-ners (Acs et al. 2016). If the provision of benefitspackages reduces business failure risks for start-upfirms, then policy makers might want to consider howstart-up firms canmore readily provide valuable benefitsto recruit productive employees.
Our findings reveal that new ventures that offer moreemployee benefits packages experience lower rates ofbusiness failure and higher odds of earning a profit. Theresults also indicate that the type of benefit offered matters.New ventures have a lower rate of business failure whenthey provide benefits that promote stability like healthcareplans, retirement plans, and education tuition reimburse-ments to employees. In contrast, we find no effect onbusiness failure rates for start-up firms that provide flexi-bility benefits such as bonus pay, investment plans, paidsick leave, and paid vacation leave. Our results also indi-cate that both benefit categories are associated with higherodds of earning a profit with the largest effect from pro-viding retirement benefits. Interestingly, however, we findthat start-up firms that provide stock options actually ex-perience lower odds of earning a profit. We discuss poten-tial explanations for these findings.
2 Theoretical development
2.1 Strategic human resource management
The belief that effective HR practices contributes toincreased financial performance is known as strategicHRM (Jackson et al. 2014).5 Strategic HRM places
human capital at the center of the production process,and because investments in human capital are vital toimproving firm performance (Barro 1991; Becker et al.1990; Cooper et al. 1994;Martin et al. 2013), employeesare key resources for management (Bakke 1961;Drucker 2012). “Strategic HRM involves addressinglong term business needs by achieving a fit betweenthe organization’s future human resources, external con-ditions, and the organization’s strategy (Jackson et al.2014, p. 8).” Consequently, recruiting and talent devel-opment becomes a vital concern for aspiring enterprises,and successful strategic HRM will help acquire a sus-tainable competitive advantage.
For start-up firms to obtain a sustainable competitiveadvantage, they must acquire resources that are rare,valuable, and difficult to imitate (Barney 1991). Theresource-based view (RBV) emphasizes the internalcharacteristics of the firm—especially the ability to de-velop distinct resources and capabilities that are difficultto imitate and substitute (Sheehan 2014). From aresource-based perspective, HR practices provide inter-nal or external benefits, or both. Internal benefits theoryargues that start-up firms might provide better benefitspackages to recruit, invest in human capital, and main-tain high performing employees thereby improving fi-nancial performance (Branco and Rodrigues 2006). Thistheory contends that the start-up firms with the bestcompensation will attract the best employees, and thebest employees, in turn, contribute to superior financialperformance (Youndt et al. 1996). This occurs becausehuman resource activities can acquire a competitiveadvantage by developing a skilled workforce to effec-tively carry out the firm’s business strategy (Branco andRodrigues 2006).
2.2 Benefits as employee recruitment
Start-up firms must be willing to increase their compen-sation (pecuniary and non-pecuniary) in order to attracttalent—especially talent with high human capital en-dowments (Ang et al. 2002). Microeconomic theoryexplains the supply and demand for labor where start-up firms demand labor and labor is supplied to themarket by workers. Increases in the demand for laborand reductions in the supply of labor both act to increasethe prevailing wage. It is in this market that start-upfirms must offer the most competitive packages to re-cruit and retain employees with their desired skillset.This is crucial to the long-run success of the firm
5 Strategic HRM is defined as “the study of HRM systems (and/orsubsystems) and their interrelationships with other elements compris-ing an organizational system, including the organization’s external andinternal environments, the multiple players who enact HRM systems,and the multiple stakeholders who evaluate the organization’s effec-tiveness and determine its long-term survival.” (Jackson et al. 2014, p.2).
Employee compensation and new venture performance: does benefit type matter?
(Pandher et al. 2017). Start-up firms that are not able torecruit highly productive employees might develop in-ferior structures, internal processes, and human re-sources relative to their competitors (Shane and Stuart2002). While salaries and wages are often the drivingforce behind hiring decisions (Ang et al. 2002), there is amore recent phenomenon that start-up firms are using toattract talent.
An alternative to monetary (i.e., pecuniary) compen-sation is to provide incentives and benefits packages(Bryant and Allen 2013). Now more than ever, em-ployees are increasingly interested in the benefits of-fered by prospective employers. According to the 2013Aflac Work Forces Report, “nearly 1-in-2 U.S. em-ployees say that improving their benefits options isone thing their employer can do to keep them in theirjob” (Aflac 2013, p. 1). So-called talent attractors (i.e.,start-up firms that offer benefits packages above the USnational average) observe a significant correlation be-tween benefits and other important human resourcesoutcomes like job satisfaction, loyalty to employer,willingness to refer a friend, and workforce productivity(Aflac 2013). The report goes further and finds thatemployees who work for talent attractors are “more thantwice as likely to agree strongly or very strongly thattheir organization’s profitability is due in part to offeringa robust benefit package. It’s clear that these companiesbenefits as part of their overall business strategy toachieve bottom line results” (Aflac 2013, p. 3). Echoingthis sentiment, a survey conducted by the Society ofHuman Resource Management found that 35% of em-ployers cited bigger benefits packages compared with28% in the previous year, and job seekers frequentlyplace greater importance on benefits such as health carecoverage, flexible work schedules, and other benefitsbeyond their base salary (Bloomberg 2015). While ben-efits often come at the expense of salary increases, manyemployees place greater emphasis on benefits due toconcerns such as rising healthcare costs (Bloomberg2015).
Despite the favorable light of these surveys, manyemployers opt not to provide certain benefits to em-ployees. Under US law, employers must provide em-ployees with benefits like time off to vote, FICA taxwithholding, paying state and federal unemploymenttaxes, contributing to state short-term disability pro-grams, and complying with the Federal Family andMedical Leave (FMLA) act. Employers are not, how-ever, required to provide paid leave (e.g., holidays and
sick days), retirement plans, health plans,6 dental orvision plans, or life insurance plans (Entrepreneur2005). In practice, many US employers provide benefitsto employees, though this varies greatly by establish-ment size. For example, although 88% of workers inlarge establishments7 and 83% of workers in medium-sized establishments8 receive medical care benefits, on-ly 55% receive medical care benefits in small establish-ments9 (BLS 2018).
Empirical evidence supports these surveys. Researchsuggests that stock options (Dunford et al. 2008) andinsurance and retirement benefits (Sutton 1985) reduceemployee turnover. Employees are increasingly placingvalues such as independence and flexibility above otherbenefits (Sauermann 2018), and moreover, flexible ben-efit arrangements have been linked to higher employeeand job satisfaction (Barber et al. 1992). Job satisfaction,in turn, corresponds to higher rates of employee reten-tion (Hausknecht et al. 2009) and has a positive influ-ence on business outcomes (Koys 2001).
2.3 Benefits that promote stability vs. flexibility
Recent work illustrates substantial differences in inno-vation performance between institutional environmentsthat promote stability and those that promote flexibility(Young et al. 2018). This work uses the crucial distinc-tion between risk and uncertainty (Knight 1921) totheorize how certain institutional arrangements facilitatean entrepreneur’s ability to assess risk whereas otherarrangements support an entrepreneur’s ability to re-spond to uncertainty (Young et al. 2018). Although thisframework is developed at the country level of analysis,we believe this distinction has several important impli-cations for start-up firms as well. There are severalreasons for this belief. For starters, several academicstudies indicate that employee benefits can be an inno-vative strategic practice for start-ups10 (Balkin andLogan 1988; Carraher and Whitely 1998; Wells et al.2003). Start-up firms might desire to offer employee
6 Except in Hawaii7 500 employees or more8 Between 100 and 499 employees9 Fewer than 100 employees10 Wells et al. (2003) found that growth-oriented business owners weremore likely than the maintenance-oriented to offer 13 of the 14 benefitslisted. The maintenance-oriented owners were nearly twice as likely tooffer no benefits at all. Balkin and Logan (1988) reinforce that specificbenefits, like lump-sum pay structures, encourage a greater entrepre-neurship mentality among employees.
C. J. Boudreaux
benefits to recruit and retain top employee talent; how-ever, there is no reason to believe that employees valueall benefits equally. Employee benefit surveys oftenidentify a preference of some benefits over others. TheAflac Work Forces Report, for example, identifieshealth care as a priority for employees and businesseslooking to seek and attract top talent. It also identifiesEmployee Assistance Programs (EAP) and flextimebenefits that many employees find attractive. Otherreports, such as the Corporate Voices for Working Fam-ilies, find that employees greatly value flexibility, whichalso has benefits for employers to retain and rewardemployees (Tarkan 2011). Based on these surveys andthe academic literature (Barber et al. 1992; Sauermann2018), it is clear that employees find benefits attractiveand employers might benefit from these employee ben-efits too. Moreover, employee benefits provide greaterstability and/or flexibility, which we further explain inthe following paragraphs.
Employers can choose to provide many differenttypes of benefits to their employees. Employees willthen decide howmuch they value these benefits, and ifthey are willing to accept the terms of employment.Some benefits are valuable to employees because theypromote stability in the employees’ personal life. Forinstance, healthcare benefits promote stability by re-ducing the financial and economic risks an employeefaces when becoming ill or injured. In the event ofsuch illness or injury, the employee has better assur-ance that life will continue as normal as possible. Thisprotection promotes stability. In a similar vein, retire-ment benefits also promote stability. The life cycletheory of consumption (Fisher 1930; Friedman 1957;Ramsey 1928) explains how individuals prefer tosmooth their consumption throughout the life cycle.This means individuals would prefer to not have sig-nificant disruptions to their lifestyles if they can avoidit. Retirement benefits promote the stability oflifecycle consumption by ensuring that the employeehas savings to continue to consume in the future.Lastly, employer-provided education benefits alsopromote stability. Tuition reimbursements for educa-tion, for instance, allow for employees to increasetheir education at a lower cost than they would faceif they were completely responsible for their entireeducation expenses. Since education has been shownto promote social mobility (Haveman and Smeeding2006), which ensures enhanced financial stability andgreater pathways to life success (Shim et al. 2009),
better access to education should promote stability.For these reasons, we propose our first hypothesis:
H1a: By attracting employee talent, start-up firmsthat provide benefits that promote stability have alower risk of business failure.H1b: By attracting employee talent, start-up firmsthat provide benefits that promote stability aremore likely to earn a profit.
In contrast, some benefits promote flexibility. Flexi-bility is important to provide options or provide a greaterwork-life balance (Eaton 2003; Peters et al. 2009). Thisis consistent with a vast research stream on flexible workoptions, which highlights how employees value flexi-bility in the workplace and often improves firm perfor-mance (Eaton 2003; Peters et al. 2009; Sheridan andConway 2001; Valverde et al. 2000). Moreover, theentrepreneurship literature explains the importance offlexibility to entrepreneurs—it is a desirable trait thatpulls people into self-employment and entrepreneurship(Carraher and Buckley 2005; Shane 2008; Wooden andWarren 2004).
These options could, for instance, provide additionalincome or time off from work. For instance, additionalincome is a valuable benefit to employees because itprovides options. The extra income could allow for anindividual to have more purchasing power—like abonus—during the holidays (which is often a stressfultime for many). Another possibility is that the incomecould be used to pay down debts, and yet anotherpossibility is that the income could be saved for thefuture. The point here is that additional income providesflexibility because it provides many options for theemployee.
Another benefit that promotes flexibility is the optionto take time off from work. Paid sick leave and paidvacation leave fall into this category. Paid sick leave, forinstance, provides for additional flexibility in the em-ployee’s personal life. The ability to be paid whiletaking time off from work is a valuable option to em-ployees. In a similar vein, paid vacation leave alsoprovides an employee the benefit of taking a vacationand not having to worry about losing income from thetime off.
Start-up firms might find several advantages to pro-viding flexible benefits to employees. For one, surveysindicate that employees are more satisfied with their jobwhen their company offers flexible work options
Employee compensation and new venture performance: does benefit type matter?
(Tarkan 2011). When workers are more satisfied withtheir job, they are more likely to stay put and not look foranother job. This lowers hiring and search costs, whichallows for start-up firms to improve performance. Anadditional reason is that flexibility allows employees tofind their most suitable work hours in a flexible workoptions arrangement. This flexibility has been linked toan improvement in firm performance (Eaton 2003;Peters et al. 2009; Sheridan and Conway 2001;Valverde et al. 2000). Lastly, the flexible benefit typesmentioned in this study—paid sick leave, paid vacationleave, bonuses, and investments—enhance overall pro-ductivity. Failing to provide vacation leave leads toemployee burnout (Etzion 2003; Etzion et al. 1998;Westman and Eden 1997). Not providing sick leaveexposes other employees to unnecessary illnesses dueto the opportunity cost of calling in sick and foregoingwages or salary. Providing bonuses and stock optionswhen tied to performance metrics can enhance overallproductivity (Clinch 1991; Hall 2000; Morgan andPoulsen 2001; Sesil and Lin 2011). Thus, providingthese benefits is likely to be appreciated by employeesand lead to overall increases in productivity and start-upfirm performance. For these reasons, we propose oursecond hypothesis:
H2a: By attracting employee talent, start-up firmsthat provide benefits that promote flexibility have alower risk of business failure.H2b: By attracting employee talent, start-up firmsthat provide benefits that promote flexibility aremore likely to earn a profit.
While we expect benefits that promote stability andflexibility to be important antecedents of start-up firmperformance, we also argue that they might not affectperformance equally. Maslow’s hierarchy of needswould place benefits that promote stability at a higherneed than benefits that promote flexibility (Maslow1943). According to Maslow (1943), human motivationcan be described by a pattern of moving through fivelevels or stages in order to attain a final sixth level orstage: self-transcendent needs. Humans move throughthe following stages (in descending order of importance):physiological (tier 1), safety (tier 2), love/belonging (tier3), esteem (tier 4), and self-actualization (tier 5).Maslow’s hierarchy of needs would place benefits thatpromote stability in the safety category (level 2 from thebottom) whereas benefits that promote flexibility would
be placed in the social belonging category (level 3 fromthe bottom) (Maslow 1943).
We argue that benefits that promote stability shouldbe placed in the safety category (level 2). Safety needsarise after physiological needs have been relatively sat-isfied. The safety category includes the need for physi-cal security, health and well-being, and financial secu-rity. Financial security provides job security whereashealth and well-being provide protection against theadverse impacts from accidents and illness (Maslow1943). Benefits that promote flexibility, on the otherhand, should be placed in a lower tier (in terms ofimportance) when compared with the benefits that pro-mote flexibility.
Benefits that promote flexibility should be placed inthe category above the safety category, which is knownas love and belonging. Flexible benefits should beplaced in this category because of their ability to pro-mote healthy relationships. Employees will likely findbenefits like paid vacation and paid sick leave to beimportant for the ability to cultivate relationships withfriends and family. Paid vacation allows for an employ-ee to spend more time with family and friends, whichreinforces human needs to be loved. Similarly, paid sickleave allows for an individual to take time off fromworkand possibly be cared for by others. Because Maslowplaces the most fundamental tiers at the bottom, howev-er, we argue that employees will value benefits thatpromote stability over benefits that promote flexibility.
Survey evidence supports this preference among ben-efit types. In an IBM survey of 42,000 employees in 79countries, employees rated benefits and compensationas the leading reason for potentially leaving IBM. Theyplaced work-life balance—of which flexibility is a sig-nificant component—as the second leading reason(Tarkan 2011). Moreover, if employees prefer tradition-al benefits that promote stability to those that enhanceflexibility, than we might expect a stronger effect onnew venture performance. That is, while employees findboth benefit types attractive for recruitment, job satis-faction, and job performance, we expect the most pre-ferred benefits to exert the largest effects on job and newventure performance. Based on these reasons, we pro-pose our third and final hypothesis:
H3a: By attracting employee talent, benefits thatpromote stability will be associated with largerreductions in start-up business failure rates whencompared with benefits that promote flexibility.
C. J. Boudreaux
H3b: By attracting employee talent, benefits thatpromote stability will be associated with largerincreases in start-up profits when compared withbenefits that promote flexibility.
3 Data and methods
3.1 Sample and data description
Our study uses data from several different sources to testour hypotheses. The KFS provides individual and orga-nization level data (Ballou et al. 2008). The survey useda multi-mode design, including a web survey andcomputer-assisted telephone-interviewing follow-up.Our sample consists of 2368 new businesses (i.e.,start-ups) starting in 2004 with annual follow-upthrough 2011 (i.e., 6421 firm-year observations). Theinitial survey response rate was 43% with a follow-upresponse rate of over 80%. These data provide a perfectopportunity to observe start-up survival, since re-searchers can easily ascertain when respondents go outof business. Not only does the KFS track when start-upsgo out of business, but it also tracks the reasonwhy start-ups close their doors.
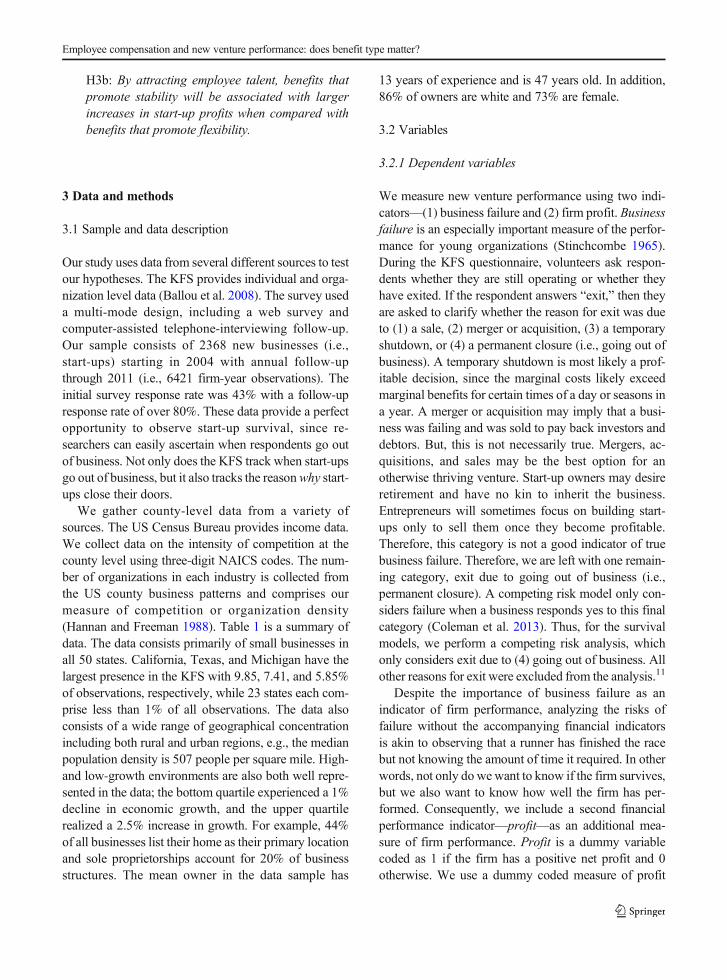
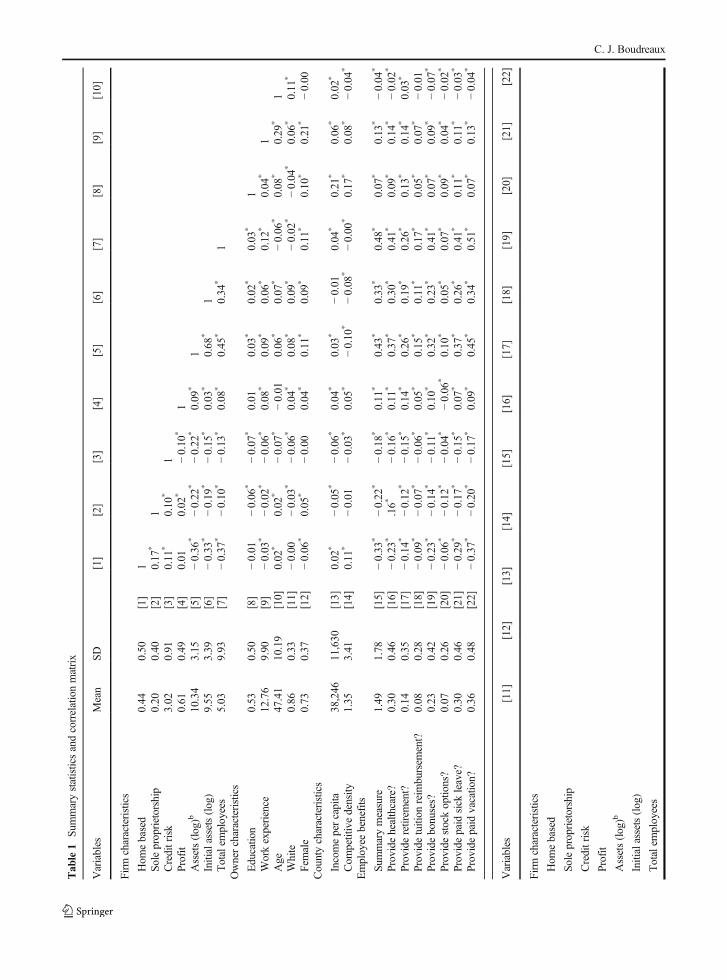
We gather county-level data from a variety ofsources. The US Census Bureau provides income data.We collect data on the intensity of competition at thecounty level using three-digit NAICS codes. The num-ber of organizations in each industry is collected fromthe US county business patterns and comprises ourmeasure of competition or organization density(Hannan and Freeman 1988). Table 1 is a summary ofdata. The data consists primarily of small businesses inall 50 states. California, Texas, and Michigan have thelargest presence in the KFS with 9.85, 7.41, and 5.85%of observations, respectively, while 23 states each com-prise less than 1% of all observations. The data alsoconsists of a wide range of geographical concentrationincluding both rural and urban regions, e.g., the medianpopulation density is 507 people per square mile. High-and low-growth environments are also both well repre-sented in the data; the bottom quartile experienced a 1%decline in economic growth, and the upper quartilerealized a 2.5% increase in growth. For example, 44%of all businesses list their home as their primary locationand sole proprietorships account for 20% of businessstructures. The mean owner in the data sample has
13 years of experience and is 47 years old. In addition,86% of owners are white and 73% are female.
3.2 Variables
3.2.1 Dependent variables
We measure new venture performance using two indi-cators—(1) business failure and (2) firm profit. Businessfailure is an especially important measure of the perfor-mance for young organizations (Stinchcombe 1965).During the KFS questionnaire, volunteers ask respon-dents whether they are still operating or whether theyhave exited. If the respondent answers “exit,” then theyare asked to clarify whether the reason for exit was dueto (1) a sale, (2) merger or acquisition, (3) a temporaryshutdown, or (4) a permanent closure (i.e., going out ofbusiness). A temporary shutdown is most likely a prof-itable decision, since the marginal costs likely exceedmarginal benefits for certain times of a day or seasons ina year. A merger or acquisition may imply that a busi-ness was failing and was sold to pay back investors anddebtors. But, this is not necessarily true. Mergers, ac-quisitions, and sales may be the best option for anotherwise thriving venture. Start-up owners may desireretirement and have no kin to inherit the business.Entrepreneurs will sometimes focus on building start-ups only to sell them once they become profitable.Therefore, this category is not a good indicator of truebusiness failure. Therefore, we are left with one remain-ing category, exit due to going out of business (i.e.,permanent closure). A competing risk model only con-siders failure when a business responds yes to this finalcategory (Coleman et al. 2013). Thus, for the survivalmodels, we perform a competing risk analysis, whichonly considers exit due to (4) going out of business. Allother reasons for exit were excluded from the analysis.11
Despite the importance of business failure as anindicator of firm performance, analyzing the risks offailure without the accompanying financial indicatorsis akin to observing that a runner has finished the racebut not knowing the amount of time it required. In otherwords, not only do wewant to know if the firm survives,but we also want to know how well the firm has per-formed. Consequently, we include a second financialperformance indicator—profit—as an additional mea-sure of firm performance. Profit is a dummy variablecoded as 1 if the firm has a positive net profit and 0otherwise. We use a dummy coded measure of profit
Employee compensation and new venture performance: does benefit type matter?
Tab
le1
Sum
marystatisticsandcorrelationmatrix
Variables
Mean
SD
[1]
[2]
[3]
[4]
[5]
[6]
[7]
[8]
[9]
[10]
Firm
characteristics
Hom
ebased
0.44
0.50
[1]
1So
leproprietorship
0.20
0.40
[2]
0.17
*1
Creditrisk
3.02
0.91
[3]
0.11
*0.10
*1
Profit
0.61
0.49
[4]
0.01
0.02
*−0.10
*1
Assets(log)b
10.34
3.15
[5]
−0.36
*−0.22
*−0.22
*0.09
*1
Initialassets(log)
9.55
3.39
[6]
−0.33
*−0.19
*−0.15
*0.03
*0.68
*1
Totalem
ployees
5.03
9.93
[7]
−0.37
*−0.10
*−0.13
*0.08
*0.45
*0.34
*1
Ownercharacteristics
Educatio
n0.53
0.50
[8]
−0.01
−0.06
*−0.07
*0.01
0.03
*0.02
*0.03
*1
Workexperience
12.76
9.90
[9]
−0.03
*−0.02
*−0.06
*0.08
*0.09
*0.06
*0.12
*0.04
*1
Age
47.41
10.19
[10]
0.02
*0.02
*−0.07
*−0.01
0.06
*0.07
*−0.06
*0.08
*0.29
*1
White
0.86
0.33
[11]
−0.00
−0.03
*−0.06
*0.04
*0.08
*0.09
*−0.02
*−0.04
*0.06
*0.11
*
Female
0.73
0.37
[12]
−0.06
*0.05
*−0.00
0.04
*0.11
*0.09
*0.11
*0.10
*0.21
*−0.00
Countycharacteristics
Incomepercapita
38,246
11,630
[13]
0.02
*−0.05
*−0.06
*0.04
*0.03
*−0.01
0.04
*0.21
*0.06
*0.02
*
Com
petitivedensity
1.35
3.41
[14]
0.11
*−0.01
−0.03
*0.05
*−0.10
*−0.08
*−0.00
*0.17
*0.08
*−0.04
*
Employee
benefits
Summarymeasure
1.49
1.78
[15]
−0.33
*−0.22
*−0.18
*0.11
*0.43
*0.33
*0.48
*0.07
*0.13
*−0.04
*
Providehealthcare?
0.30
0.46
[16]
−0.23
*.16*
−0.16
*0.11
*0.37
*0.30
*0.41
*0.09
*0.14
*−0.02
*
Provideretirem
ent?
0.14
0.35
[17]
−0.14
*−0.12
*−0.15
*0.14
*0.26
*0.19
*0.26
*0.13
*0.14
*0.03
*
Providetuition
reim
bursem
ent?
0.08
0.28
[18]
−0.09
*−0.07
*−0.06
*0.05
*0.15
*0.11
*0.17
*0.05
*0.07
*−0.01
Providebonuses?
0.23
0.42
[19]
−0.23
*−0.14
*−0.11
*0.10
*0.32
*0.23
*0.41
*0.07
*0.09
*−0.07
*
Providestockoptio
ns?
0.07
0.26
[20]
−0.06
*−0.12
*−0.04
*−0.06
*0.10
*0.05
*0.07
*0.09
*0.04
*−0.02
*
Providepaid
sick
leave?
0.30
0.46
[21]
−0.29
*−0.17
*−0.15
*0.07
*0.37
*0.26
*0.41
*0.11
*0.11
*−0.03
*
Providepaid
vacatio
n?0.36
0.48
[22]
−0.37
*−0.20
*−0.17
*0.09
*0.45
*0.34
*0.51
*0.07
*0.13
*−0.04
*
Variables
[11]
[12]
[13]
[14]
[15]
[16]
[17]
[18]
[19]
[20]
[21]
[22]
Firm
characteristics
Hom
ebased
Soleproprietorship
Creditrisk
Profit
Assets(log)b
Initialassets(log)
Totalem
ployees
C. J. Boudreaux
Tab
le1
(contin
ued)
Variables
[11]
[12]
[13]
[14]
[15]
[16]
[17]
[18]
[19]
[20]
[21]
[22]
Ownercharacteristics
Educatio
n
Workexperience
Age
White
1
Female
0.05
*1
Countycharacteristics
Incomepercapita
−0.08
*0.05
*1
Com
petitivedensity
−0.14
*0.05
*0.49
*1
Employee
benefits
Summarymeasure
0.05
*0.12
*0.02
*−0.02
*1
Providehealthcare?
0.02
*0.10
*0.12
*0.06
*0.63
*1
Provideretirem
ent?
−0.00
0.08
*0.10
*0.09
*0.45
*0.37
*1
Providetuition
reim
bursem
ent?
−0.02
*0.05
*0.03
*0.05
*0.36
*0.21
*0.21
*1
Providebonuses?
−0.00
0.11
*0.05
*0.04
*0.57
*0.34
*0.26
*0.26
*1
Providestockoptio
ns?
−0.05
*0.03
*0.09
*0.02
*0.25
*0.13
*0.12
*0.10
*0.12
*1
Providepaid
sick
leave?
0.00
0.11
*0.11
*0.05
*0.70
*0.44
*0.29
*0.24
*0.40
*0.14
*1
Providepaid
vacatio
n?0.02
*0.13
*0.07
*−0.00
*0.76
*0.50
*0.32
*0.24
*0.46
*0.11
*0.77
*1
N=6421
*p<0.05
Employee compensation and new venture performance: does benefit type matter?
rather than the actual profit amounts because start-upfirms’ bookkeeping records are often very opaque. Ac-counting information from these start-up firms is oftenvery unreliable because they are not subject to thescrutiny of public markets like larger, more establishedfirms. Therefore, we rely on a simpler measure of firmprofitability, which captures whether the firm has earneda profit or not.
3.2.2 Independent variables
We utilize several different measures of employee ben-efits to examine whether providing benefits is associatedwith greater firm performance. These measures are sep-arated into two broad categories to better gauge whetherbenefits that promote stability or flexibility are moreimportant for firm performance. In other words, doesthe benefit type matter? Benefits that promote stabilityinclude employer-provided healthcare, retirement plans,and tuition reimbursement. On the other hand, benefitsthat promote flexibility include employer-providedstock and bonus plans as well as paid sick leave andpaid vacation. Each benefit is dummy coded as 1 if thefirm provides the benefit and 0 otherwise. In the 2SLSanalysis, we also include a measure of employee bene-fits calculated as the number of benefits—by type—thata firm provides. There is considerable variation betweenemployers for these benefit provisions in our data. Forinstance, while 30% of employers provide healthcareplans and 36% provide paid vacation, only 7% of em-ployers offer stocks to employees and only 8% providetuition reimbursement programs.
3.2.3 Controls
Based on a review of recent findings utilizing the KFSdatabase (see Farhat et al. (2018) for a review), weinclude several controls that might affect the perfor-mance of new ventures. At the owner level, we includemeasures for education, work experience, age, gender,and race. Recent research using the KFS data highlightshow highly educated entrepreneurs are more likely tooperate in an urban setting with a more educated work-force and high education regions have more entrepre-neurship (Doms et al. 2010). Thus, we include a mea-sure for the entrepreneur’s education. Education is thenumber of years of formal higher education of theowner. Research findings with the KFS database iden-tify prior entrepreneurial experience as an antecedent of
early entrepreneurial internalization (Amin Zargarzadehet al. 2014) and as a predictor of entrepreneurial forecastperformance (Cassar 2014). Accordingly, we includework experience as an important control variable.Workexperience is the number of years in the labor force ofthe owner. Age of the owner is also included. Thesecontinuous variables are included to capture the degreeof experience, and to some extent, the tacit knowledgeof the organization owner. When owners are experi-enced, older, and more educated, they may be able toleverage their skills and experience and access socialnetworks to increase the likelihood of organizationalsurvival (Shane 2003). We also include characteristicsof gender and race. Female is a dummy coded 1 iffemale and 0 if male. Studies have found that female-owned businesses have lower survival rates than male-owned businesses due to less start-up capital, socialnetworks and work experience (e.g., Fairlie and Robb2009). Similarly, other studies (Fairlie and Robb 2007;Robb and Robinson 2014) find differences in fundingsources and organization outcomes based on race andethnicity.White is a dummy coded 1 if Caucasian and 0otherwise. Research finds that minority owned busi-nesses, particularly African Americans and Hispanics,face worse business outcomes than their Caucasiancounterparts (Robb 2002).
We also include controls at the organization level.Home based is a dummy coded 1 for owners who basetheir business at home and 0 otherwise. Sole proprietor-ship is a dummy with a value of 1 for businesses that areorganized as a sole proprietorship and 0 otherwise. Forinstance, (Robb and Robinson 2014) find that home-based businesses are more likely to rely on owner fi-nancing rather than from outside lending sources morecommonly used by partnerships, corporations, andLLCs. These organizations may also differ in their so-cial networks leading to a variance in the liability ofnewness (Stinchcombe 1965).
Credit risk is a discrete variable measured on a scalefrom 1 to 5 where 1 indicates the organization has verylittle credit risk and five indicates the organization is at avery high risk based on its credit. The KFS extracted thesedata from credit reports provided by Dun and Bradstreet.Assets(log) is the natural logarithm of an organization’stotal assets, and Initial assets (log) is the natural logarithmof an organization’s total assets in the year of firm birth(i.e., 2004). These organization variables are included tocapture the risk and financial positions of the organization,which have been shown to be important antecedents of
C. J. Boudreaux
entrepreneurship (Black et al. 1996; Boudreaux andNikolaev 2018; Holtz-Eakin et al. 1994; Lindh andOhlsson 1996; Robb and Robinson 2014). Importantly,we use a firm’s initial total assets to capture the initialresource endowment of the firm, which has been shown tobe an important antecedent of firm growth (Cooper et al.1994). Our a priori expectations are that organizations witha high credit risk, low profits, and fewer assets are in worsepositions to survive the competitive business environmentand face higher odds of failure and lower abilities to earn aprofit.
In addition to owner and organization characteristics,there is substantial geographical variation across theUSA that may influence rates of organizational exit(Acs et al. 2007). We include several county-level con-trols for these differences. Income per capita is thecounty-level per capita personal income provided bythe US Census Bureau. This variable is included tocapture the effect that income may have on the businessclimate. Higher disposable income and the demand forgoods and services are positively correlated whichshould lead to more profitable opportunities. We mea-sure competitive density as the number of organizationsin a 3-digit industry divided by 1000. This variableserves as our measure of the amount of competition thata business owner faces, which has been shown to harmstart-up survival rates (Pe’er and Keil 2013) and nega-tively moderate the ability of entrepreneurs to utilizenew knowledge (Plummer and Acs 2014). We alsoinclude year and industry dummies to account for im-portant time and industry differences (Boudreaux 2019).
3.3 Analysis
3.3.1 Cox proportional hazard model
To examine the effect of employee benefits on the risk offirm exit, we use Cox proportional hazard models. Coxproportional hazard models take the following form:
h tð Þ ¼ h0 tð Þ e βXð Þ ð1Þwhere h(t) is the hazard rate for business failure,12 h0(t) isan unspecified baseline hazard function, X is a vector of
predictors, and β is the estimated coefficient for thesepredictors. An advantage of the Cox proportional hazardmodel is that it requires no parametric assumptions for thehazard function. This is useful in new organizations wherethe shape of hazard curve may not be monotonic in shape(e.g., Fichman and Levinthal 1991). This is particularlyapplicable to our data as the dependent variable is adichotomous variable with a large percentage of non-events. Additionally, the Cox proportional hazard modelcan account for the lack of independence in the multiple-year organizational observations. We used robust standarderrors clustered by organization. Finally, the Cox modelsaccount for right-censoring issues in the data; some orga-nizations have not failed by the end of the study (Cleveset al. 2010). Estimates are reported as hazard ratios (eβ)with numbers above 1 indicating an increased likelihood offailure and numbers below one a reduced likelihood offailure.
Typical survival analysis relies on the assumptionthat each subject has the same chance of selection intothe sample. However, as is the case with the KFS data,the probably of any given subject selected into thesample is based on a complex survey design. The targetpopulation in the study is all new businesses started asan independent business in 2004 in the USA. If the firmexisted before the initial interview, the start-up firmswere dropped from the survey. While the KFS mightoriginally include franchises or subsidiaries of anexisting business, they were removed from the study.The KFS also does not include non-profit organizationsin its study. The Kauffman Foundation had an interest inhigh technology, medium technology, and woman-owned businesses and thus created the KFS to examinetheir research questions. Thus, the KFS is a stratifiedsample based on industrial technology and gender. TheKFS oversampled high-technology and medium-technology businesses in order to improve the precisionof cross sectional and longitudinal analyses of these sub-groups. The KFS employed sampling weights due tothis disproportionate stratified sampling procedure tak-ing into consideration the survey design procedure de-scribed in the KFS.13 In addition, for any missing data,we used Rubin’s (2004) multiple imputation simulation-based procedure as suggested by the Kauffman FirmSurvey design guide.
12 Interpretation of hazard rates is often counterintuitive to those whoare unfamiliar with these estimation methods. A hazard rate h(t) < 1indicates that increases in the variable are associated with a reducedhazard of failure while hazard rates h(t) > 1 indicate an increasedhazard of failure.
13 For more information, see (Cleves et al. 2010; Cochran 2007; Kornand Graubard 2011; Levy and Lemeshow 2013). The first is a usefulguide for researchers using Stata.
Employee compensation and new venture performance: does benefit type matter?
Moreover, the data are coded such that researchersassign an id to each business and complete an annualsurvey to follow-up on the status of the enterprise. Thekey indicator for start-up firm exit is whether the busi-ness is still operating or not. The KFS codes a businessas 0 if it is still in operation. On the other hand, the KFScodes four reasons for start-up firm exit including (1) arespondent has sold the business, (2) a business merger,(3) a temporary shutdown, and (4) exit due to going outof business. In our analysis, we only include the fourthreason for failure—going out of business—as the reasonfor organizational exit. All other reasons are ignored forthe purposes of the examination. This is important be-cause all reasons for exit are not necessarily failure. Forinstance, a temporary shutdown, merger, or sale can allindicate a successful start-up, especially if the purposeof starting the venture was to sell it at a later time for ahigher value. Thus, we only code a value of 1 if the firmexits due to going out of business.
3.3.2 Logistic regression with random effects
As an alternative measure of financial performance, wealso examine the relationship between employee bene-fits and firm profitability. To examine this relationship,we use a random effects logistic regression model of theform:
Prob Profit ¼ 1ð Þ ¼ lnp
1−p
� �
¼ ϕ αþ βitX it þ εitð Þ ð2Þwhere ϕ is the cumulative distribution function of thestandard normal distribution, X is a vector of predictors,β is the estimated coefficient for these predictors, and ε~ N(0,1). This logit model examines the effect of em-ployee benefits on the likelihood (or odds) of obtaininga profit (i.e., Prob (Profit = 1)). Furthermore, the randomeffects design allows us to estimate this relationship foreach start-up firm over time, which captures the longi-tudinal design of the KFS study better than cross-sectional logit models. We considered using a fixed-effect logistic regression design, but using firm fixedeffects in a non-linear model such as logit introduces theincidental parameters problem (Lancaster 2000;Neyman and Scott 1948). Thus, to avoid this biasedestimation (Greene 2004), we estimate the model usinga random effect logistic regression. We used theHausman test (Greene 2003, Chapter 9) to check
whether random effects are appropriate for our model,and the results support the choice of random effects overfixed effects (χ2 = 13.36; p = 0.861).14 Lastly, estimatesare reported as odds ratios (eβ) with numbers above 1indicating increased odds of earning a profit and num-bers below 1 indicate reduced odds of earning a profit.
3.3.3 Instrumental variables
One potential criticism of our study is that providingbenefits to employees is expensive, and therefore, anyrelationship between employee benefits and firm perfor-mance might be picking up a firm’s resource endow-ment. In other words, start-up firms that survive longerand are more likely to earn a profit are also in a betterposition to afford to provide benefits to their employees.While we have attempted to control for this concern byincluding initial resource endowments and profits asexplanatory variables in our models, which have beenshown to be important for subsequent firm growth(Cooper et al. 1994), our analysis might not control forthe possibility of reverse causality leading to anendogeneity bias in our parameter estimates. To exam-ine this possibility, we allow the relationship betweenemployee benefits and firm performance to be endoge-nously determined, and we adopt an identification strat-egy that uses instrumental variables regressionestimation.
Our identification strategy is to use instrumental var-iables estimation in a two-stage least squares (2SLS)regression model. For this method, we need to find aninstrumental variable that is correlated with our endog-enous regressor (i.e., employee benefits), is uncorrelatedwith the error term, and only affects the dependentvariable through its effect on the endogenous regressor(Wooldridge 2010). Our instrument takes advantage ofthe region’s provision of employee benefits, rather thanthose offered by the firm. For a given firm, we take theaverage level of employee benefits offered within themetropolitan statistical area (MSA), and then we sub-tract the firm’s measure of employee benefits from thisMSA average. We then repeated this step for every year
14 The Hausman test checks whether the idiosyncratic errors (in ourcase firm-specific errors) are correlated with the model’s predictors.The null hypothesis is that they are not correlated, which supports thechoice of random-effect regression. A rejection of the null hypothesis(i.e., p < 0.05) would instead support fixed-effect logistic regression.We do not reject the null hypothesis so we can be confident that therandom-effect model is appropriate (and in fact more efficient).
C. J. Boudreaux

and region in the sample. This instrument is highlycorrelated with the firm’s measure of employee benefitsand should only affect firm performance through ourendogenous employee benefits measure. We utilize thisidentification strategy for both benefit types (i.e., stabil-ity and flexibility) and for both new venture perfor-mance measures (i.e., profit and business failure).
The first-stage regression equation is estimated asfollows:
Benefitsit ¼ α0 þ α1Bijt þ βitX it þ θt þ εit ð3Þ
wh e r e Bijt ¼ 1n∑
ni¼1Benefitsijt
� �−Benefitsijt f o r
start-up i in region j and year t. This measure followsrecent studies (Jha and Cox 2015; Boudreaux 2018) toadopt an identification strategy that captures the averageamount of employee benefits offered within the regionand subtract the firm’s amount of employee benefitsfrom this measure. The estimates from the first-stageregression equation are then placed into the second-stage regression equation as follows:
New Venture Performanceit
¼ α0 þ α1dBenefitsit þ βitX it þ θt þ εit ð4Þ
For our profit regressions, we estimate the modelsusing IV Probit (Table 2). For the business failure (i.e.,survival) regressions, we estimate the models using IVPoisson. The reason we choose IV Poisson regression istwofold: (1) there is no well-known adjustment forendogeneity using Cox proportional hazard modelsand (2) there is a well-known equivalence betweenCox proportional hazard models and Poisson modelsthat allows one to transform the Cox proportional hazardmodel into a Poisson model (Royston and Lambert2011, p. 61; Whitehead 1980, pp. 269–270). Aftertransforming our Cox proportional hazard model into aPoisson regression model, we use the well-developedIV Poisson methods available in Stata 14.15
4 Results
4.1 Business failure rates
Model 1 of Table 3 presents our baseline results, whichwe estimated using Cox proportional hazard models.The baseline model includes all controls but excludesthe measures of employee benefits. We note that manyof our control variables conform to our a priori expec-tations. Start-up firms that earn a profit, for example,have a 39.4% (1.000–0.606; p < 0.001) lower rate ofexit than their peers who do not earn a profit, andstart-up firms with a higher credit risk, more density ofcompetition, and smaller assets have higher exit rates.Additionally, we find that, while home based businessesdo not face different rates of exit than other businesses,sole proprietorships have lower exit rates than partner-ships and other forms of ownership.
Models 2–5 of Table 3 augment the baseline modelto include our measures of benefits that providestability—healthcare benefits, retirement plans, and tu-ition reimbursement benefits.16 Model 2 reports theestimates using a summary measure of stability benefitsand Models 3–5 report the estimates for each benefittype. Overall, the evidence suggests that start-up firmsthat offer stability benefits have 67% lower odds of exit(1.00–0.33; p < 0.001). More specifically, our resultsindicate that start-up firms that provide healthcare ben-efits have a 44% (1.00–0.56; p < 0.001) lower rate ofexit, start-up firms that provide retirement benefits havea 31% (1.00–0.69; p < 0.10) lower rate of exit, and start-up firms that provide tuition reimbursement benefitshave a 38% (1.00–0.62; p < 0.10) lower rate of exit. Inother words, benefits that promote stability are associ-ated with lower rates of exit. These results providesupport for hypothesis 1a.
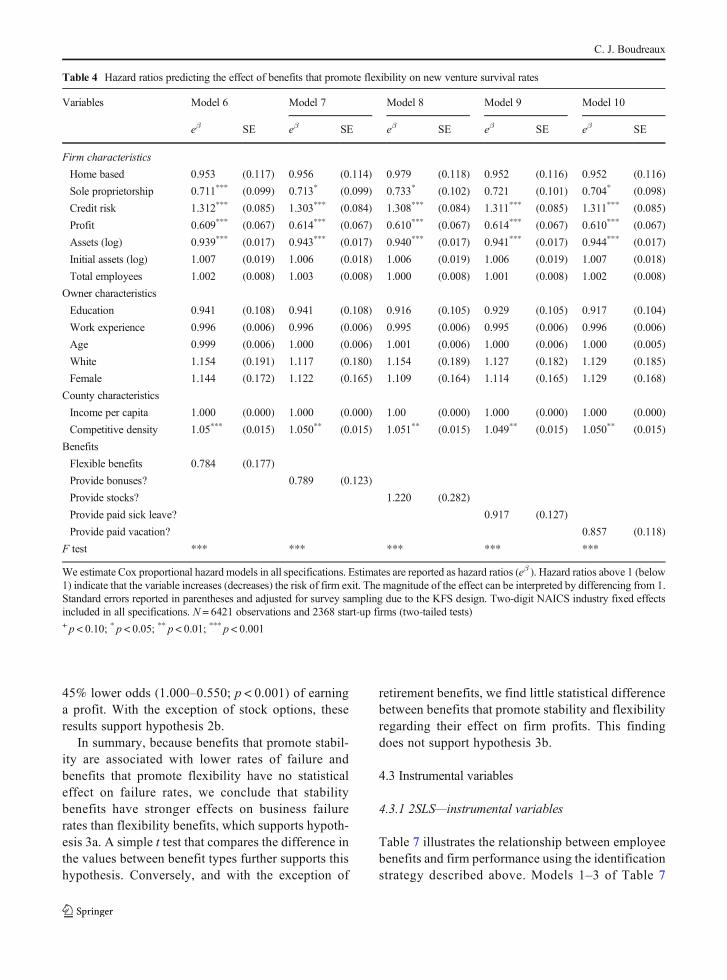
We also examine the effect of benefits that promoteflexibility on firm exit rates. Models 6–10 of Table 4augment the baseline model (model 1 of Table 3) toinclude our measures of benefits that provide flexibili-ty—bonuses, stock options, paid sick leave, and paidvacation. Our results indicate that there is no substantialrelationship between the benefits that promote
15 The transformation follows three steps: (1) estimate a Poissonregression with the failure indicator as the response variable, (2) addtime dummies, and (3) create an exposure variable that records thelength of each time span.
16 In additional robustness tests, we also included all employee bene-fits in one regression model. This adjusts for the fact that some start-upfirms provide multiple benefits to employees. The results are verysimilar to those reported here and are available upon request.
Employee compensation and new venture performance: does benefit type matter?
flexibility and firm exit rates. Our evidence, thus, doesnot support hypothesis 2a.
4.2 Firm profits
We also examine the effects of employee benefits on theprofits of start-up firms. Model 1 of Table 5 reports thebaseline model, which was estimated using a Logitmodel with random effects to account for the longitudi-nal nature of the data.17 The baseline model includes all
control variables and excludes our measures of employ-ee benefits. All model estimates are reported as oddsratios (eβ) where numbers above 1 indicate an increasein the odds of earning a profit and numbers below 1indicate a decrease in the odds of earning a profit. Wefind that several controls have important relationshipswith firm profits. Sole proprietors, firm assets (log), andentrepreneurs’ work experience are all associated withincreased odds of earning a profit. Conversely, highercredit risk is associated with lower odds of earning aprofit. These controls are consistent with our a prioripredictions.
Models 2–5 of Table 5 augment the baselinemodel to include our measures of benefits that pro-mote stability—health care plans, retirement plans,
17 Non-linear fixed effects models (e.g., logit with firm fixed effects)suffer from the incidental parameters problem. Thus, we rely onrandom effects panel data models for estimation. The Hausman testsupports the choice of random effects over fixed effects (χ2 = 13.36;p = 0.861).
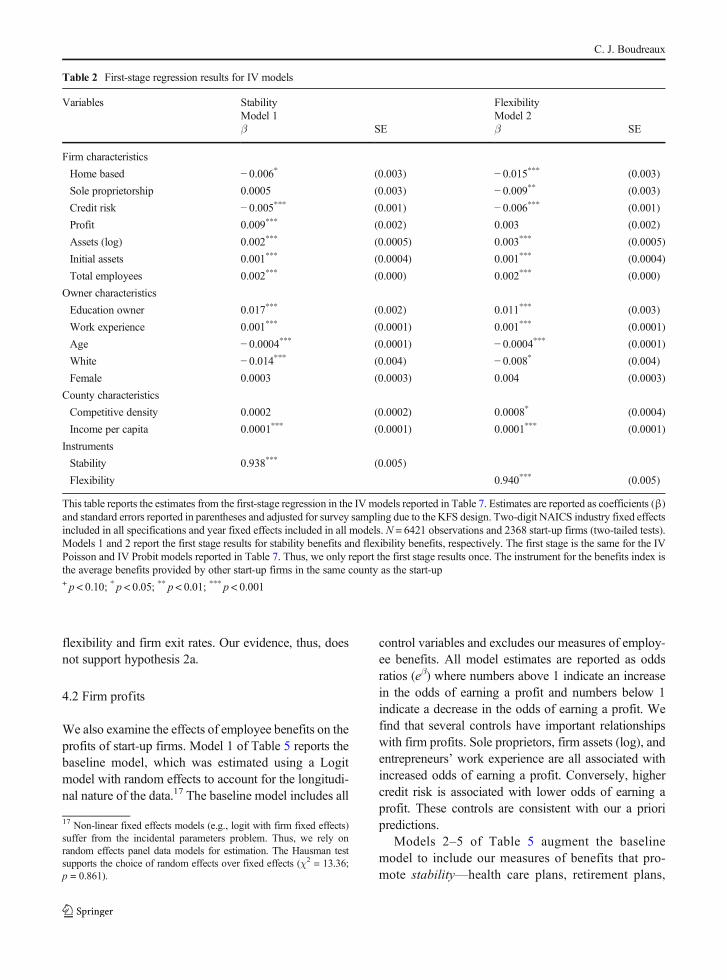
Table 2 First-stage regression results for IV models
Variables Stability FlexibilityModel 1 Model 2β SE β SE
Firm characteristics
Home based − 0.006* (0.003) − 0.015*** (0.003)
Sole proprietorship 0.0005 (0.003) − 0.009** (0.003)
Credit risk − 0.005*** (0.001) − 0.006*** (0.001)
Profit 0.009*** (0.002) 0.003 (0.002)
Assets (log) 0.002*** (0.0005) 0.003*** (0.0005)
Initial assets 0.001*** (0.0004) 0.001*** (0.0004)
Total employees 0.002*** (0.000) 0.002*** (0.000)
Owner characteristics
Education owner 0.017*** (0.002) 0.011*** (0.003)
Work experience 0.001*** (0.0001) 0.001*** (0.0001)
Age − 0.0004*** (0.0001) − 0.0004*** (0.0001)
White − 0.014*** (0.004) − 0.008* (0.004)
Female 0.0003 (0.0003) 0.004 (0.0003)
County characteristics
Competitive density 0.0002 (0.0002) 0.0008* (0.0004)
Income per capita 0.0001*** (0.0001) 0.0001*** (0.0001)
Instruments
Stability 0.938*** (0.005)
Flexibility 0.940*** (0.005)
This table reports the estimates from the first-stage regression in the IV models reported in Table 7. Estimates are reported as coefficients (β)and standard errors reported in parentheses and adjusted for survey sampling due to the KFS design. Two-digit NAICS industry fixed effectsincluded in all specifications and year fixed effects included in all models. N = 6421 observations and 2368 start-up firms (two-tailed tests).Models 1 and 2 report the first stage results for stability benefits and flexibility benefits, respectively. The first stage is the same for the IVPoisson and IV Probit models reported in Table 7. Thus, we only report the first stage results once. The instrument for the benefits index isthe average benefits provided by other start-up firms in the same county as the start-up+ p < 0.10; * p < 0.05; ** p < 0.01; *** p < 0.001
C. J. Boudreaux

and tuition reimbursement benefits. Overall, our ev-idence suggests that start-up firms that provide sta-bility benefits to employees have higher odds ofearning a profit (3.763–1.000; p < 0.001), and wefind that all three benefits are associated with anincrease in the odds of earning a profit. More spe-cifically, start-up firms that offer healthcare planshave a 59 .9% highe r odds (1 .599–1 .000 ;p < 0.001), start-up firms that offer a retirement planhave a 159.9% higher odds (2.599–1.000;p < 0.001), and start-up firms that offer tuition reim-bursement plans have a 46.8% higher odds (1.468–1.000; p < 0.001). These findings support hypothesis1b.
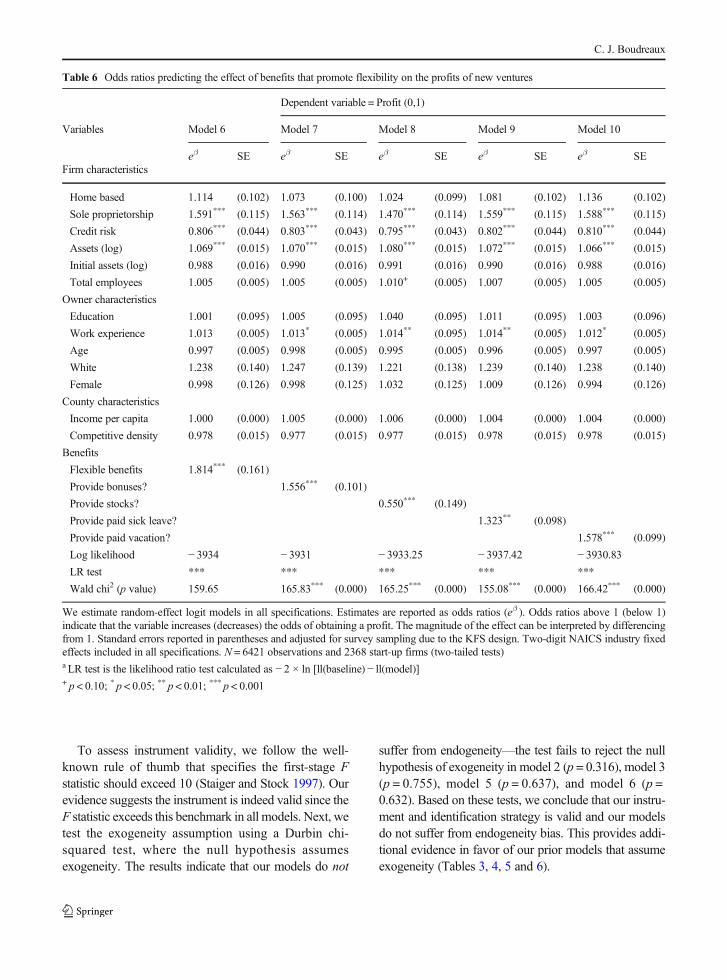
Models 6–10 of Table 6 augment the baselinemodel (model 1 of Table 5) to include our measuresof benefits that promote flexibility—bonuses, stockoptions, paid sick leave, and paid vacation. Overall,the evidence suggests that start-up firms that offerbenefits that promote flexibility have higher odds ofearning a profit (1.814–1.000; p < 0.001). Start-upfirms that offer bonuses have a 55.6% higher odds(1.556–1.000; p < 0.001) of earning a profit, start-upfirms that offer paid sick leave have a 32.3% higherodds (1.323–1.000; p < 0.001) of earning a profit,and start-up firms that offer paid vacation leave havea 57.8% higher odds (1.578–1.000; p < 0.001) ofearning a profit. Conversely, stock options have a
Table 3 Hazard ratios predicting the effect of benefits that promote stability on new venture survival rates
Variables Model 1 (baseline) Model 2 Model 3 Model 4 Model 5
eβ SE eβ SE eβ SE eβ SE eβ SE
Firm characteristics
Home based 0.978 (0.12) 0.938 (0.11) 0.91 (0.11) 0.96 (0.11) 0.96 (0.11)
Sole proprietorship 0.721* (0.10) 0.694*** (0.09) 0.70* (0.10) 0.71* (0.10) 0.72* (0.10)
Credit risk 1.318*** (0.09) 1.301*** (0.09) 1.30*** (0.09) 1.31*** (0.08) 1.31*** (0.09)
Profit 0.606*** (0.07) 0.63*** (0.07) 0.63*** (0.07) 0.62*** (0.07) 0.61*** (0.07)
Assets (log) 0.936*** (0.02) 0.941*** (0.02) 0.95*** (0.01) 0.94*** (0.01) 0.94*** (0.01)
Initial assets (log) 1.006 (0.02) 1.007 (0.02) 1.012 (0.019) 1.007 (0.019) 1.007 (0.019)
Total employees 1.000 (0.01) 1.01 (0.01) 1.01 (0.01) 1.00 (0.01) 1.00 (0.01)
Owner characteristics
Education 0.933 (0.11) 0.941 (0.11) 0.95 (0.11) 0.94 (0.11) 0.94 (0.11)
Work experience 0.996 (0.01) 0.996 (0.01) 1.00 (0.01) 1.00 (0.01) 1.00 (0.01)
Age 0.999 (0.01) 0.999 (0.01) 1.00 (0.01) 1.00 (0.01) 1.00 (0.01)
White 1.154 (0.19) 1.154 (0.19) 1.14 (0.18) 1.13 (0.18) 1.14 (0.19)
Female 1.131 (0.17) 1.144 (0.17) 1.11 (0.16) 1.11 (0.16) 1.10 (0.16)
County characteristics
Income per capita 0.999 (0.01) 0.999 (0.00) 1.00 (0.00) 1.00 (0.00) 1.00 (0.00)
Competitive density 1.051*** (0.02) 1.05*** (0.02) 1.05** (0.01) 1.05** (0.02) 1.05** (0.01)
Benefits
Stability benefits 0.33*** (0.10)
Provide healthcare? 0.56*** (0.08)
Provide retirement? 0.69+ (0.14)
Provide tuition reimbursement? 0.62+ (0.16)
F test *** *** *** *** ***
We estimate Cox proportional hazard models in all specifications. Estimates are reported as hazard ratios (eβ ). Hazard ratios above 1 (below1) indicate that the variable increases (decreases) the risk of firm exit. The magnitude of the effect can be interpreted by differencing from 1.Standard errors reported in parentheses and adjusted for survey sampling due to the KFS design. Two-digit NAICS industry fixed effectsincluded in all specifications. N = 6421 observations and 2368 start-up firms (two-tailed tests)+ p < 0.10; * p < 0.05; ** p < 0.01; *** p < 0.001
Employee compensation and new venture performance: does benefit type matter?
45% lower odds (1.000–0.550; p < 0.001) of earninga profit. With the exception of stock options, theseresults support hypothesis 2b.
In summary, because benefits that promote stabil-ity are associated with lower rates of failure andbenefits that promote flexibility have no statisticaleffect on failure rates, we conclude that stabilitybenefits have stronger effects on business failurerates than flexibility benefits, which supports hypoth-esis 3a. A simple t test that compares the difference inthe values between benefit types further supports thishypothesis. Conversely, and with the exception of
retirement benefits, we find little statistical differencebetween benefits that promote stability and flexibilityregarding their effect on firm profits. This findingdoes not support hypothesis 3b.
4.3 Instrumental variables
4.3.1 2SLS—instrumental variables
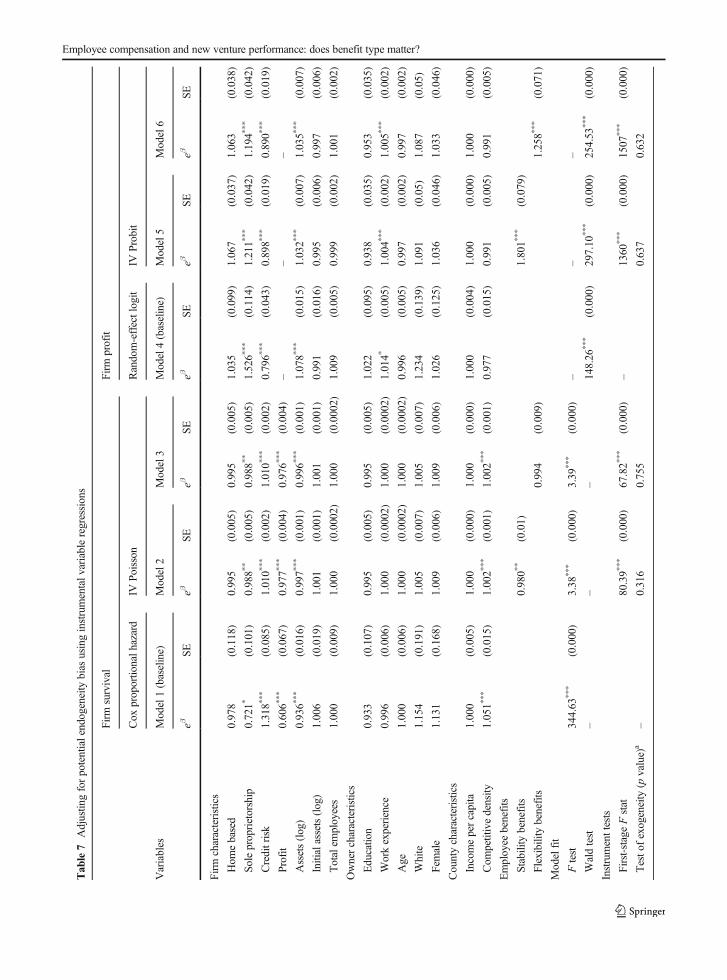
Table 7 illustrates the relationship between employeebenefits and firm performance using the identificationstrategy described above. Models 1–3 of Table 7
Table 4 Hazard ratios predicting the effect of benefits that promote flexibility on new venture survival rates
Variables Model 6 Model 7 Model 8 Model 9 Model 10
eβ SE eβ SE eβ SE eβ SE eβ SE
Firm characteristics
Home based 0.953 (0.117) 0.956 (0.114) 0.979 (0.118) 0.952 (0.116) 0.952 (0.116)
Sole proprietorship 0.711*** (0.099) 0.713* (0.099) 0.733* (0.102) 0.721 (0.101) 0.704* (0.098)
Credit risk 1.312*** (0.085) 1.303*** (0.084) 1.308*** (0.084) 1.311*** (0.085) 1.311*** (0.085)
Profit 0.609*** (0.067) 0.614*** (0.067) 0.610*** (0.067) 0.614*** (0.067) 0.610*** (0.067)
Assets (log) 0.939*** (0.017) 0.943*** (0.017) 0.940*** (0.017) 0.941*** (0.017) 0.944*** (0.017)
Initial assets (log) 1.007 (0.019) 1.006 (0.018) 1.006 (0.019) 1.006 (0.019) 1.007 (0.018)
Total employees 1.002 (0.008) 1.003 (0.008) 1.000 (0.008) 1.001 (0.008) 1.002 (0.008)
Owner characteristics
Education 0.941 (0.108) 0.941 (0.108) 0.916 (0.105) 0.929 (0.105) 0.917 (0.104)
Work experience 0.996 (0.006) 0.996 (0.006) 0.995 (0.006) 0.995 (0.006) 0.996 (0.006)
Age 0.999 (0.006) 1.000 (0.006) 1.001 (0.006) 1.000 (0.006) 1.000 (0.005)
White 1.154 (0.191) 1.117 (0.180) 1.154 (0.189) 1.127 (0.182) 1.129 (0.185)
Female 1.144 (0.172) 1.122 (0.165) 1.109 (0.164) 1.114 (0.165) 1.129 (0.168)
County characteristics
Income per capita 1.000 (0.000) 1.000 (0.000) 1.00 (0.000) 1.000 (0.000) 1.000 (0.000)
Competitive density 1.05*** (0.015) 1.050** (0.015) 1.051** (0.015) 1.049** (0.015) 1.050** (0.015)
Benefits
Flexible benefits 0.784 (0.177)
Provide bonuses? 0.789 (0.123)
Provide stocks? 1.220 (0.282)
Provide paid sick leave? 0.917 (0.127)
Provide paid vacation? 0.857 (0.118)
F test *** *** *** *** ***
We estimate Cox proportional hazard models in all specifications. Estimates are reported as hazard ratios (eβ ). Hazard ratios above 1 (below1) indicate that the variable increases (decreases) the risk of firm exit. The magnitude of the effect can be interpreted by differencing from 1.Standard errors reported in parentheses and adjusted for survey sampling due to the KFS design. Two-digit NAICS industry fixed effectsincluded in all specifications. N = 6421 observations and 2368 start-up firms (two-tailed tests)+ p < 0.10; * p < 0.05; ** p < 0.01; *** p < 0.001
C. J. Boudreaux
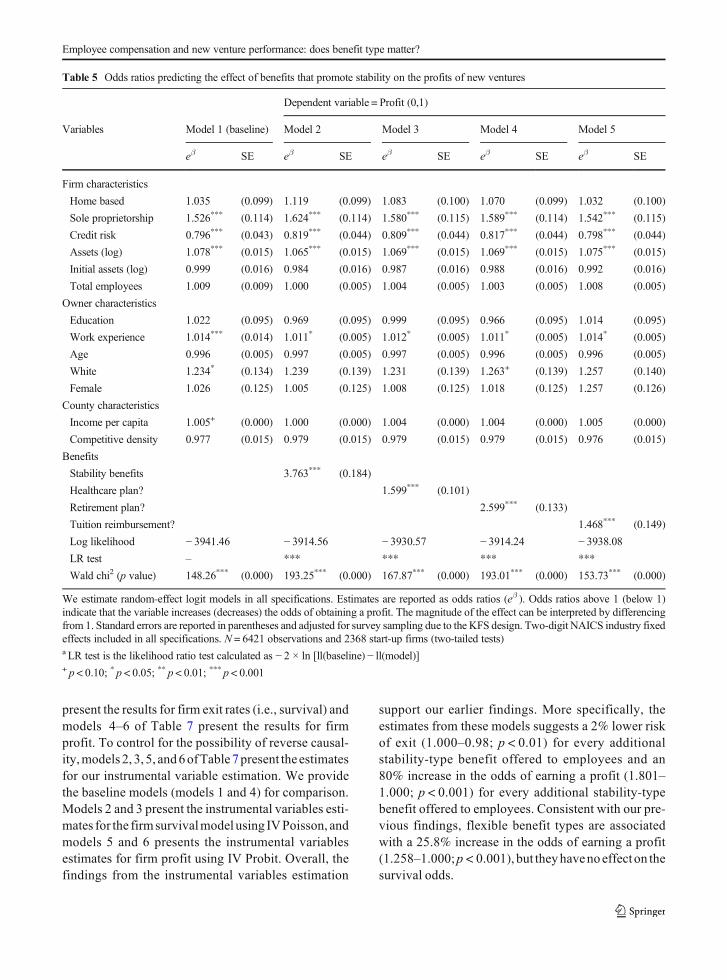
present the results for firm exit rates (i.e., survival) andmodels 4–6 of Table 7 present the results for firmprofit. To control for the possibility of reverse causal-ity,models 2, 3, 5, and6ofTable 7present the estimatesfor our instrumental variable estimation. We providethe baseline models (models 1 and 4) for comparison.Models 2 and 3 present the instrumental variables esti-mates for the firm survivalmodel using IVPoisson, andmodels 5 and 6 presents the instrumental variablesestimates for firm profit using IV Probit. Overall, thefindings from the instrumental variables estimation
support our earlier findings. More specifically, theestimates from these models suggests a 2% lower riskof exit (1.000–0.98; p < 0.01) for every additionalstability-type benefit offered to employees and an80% increase in the odds of earning a profit (1.801–1.000; p < 0.001) for every additional stability-typebenefit offered to employees. Consistent with our pre-vious findings, flexible benefit types are associatedwith a 25.8% increase in the odds of earning a profit(1.258–1.000;p < 0.001), but theyhavenoeffect on thesurvival odds.
Table 5 Odds ratios predicting the effect of benefits that promote stability on the profits of new ventures
Dependent variable = Profit (0,1)
Variables Model 1 (baseline) Model 2 Model 3 Model 4 Model 5
eβ SE eβ SE eβ SE eβ SE eβ SE
Firm characteristics
Home based 1.035 (0.099) 1.119 (0.099) 1.083 (0.100) 1.070 (0.099) 1.032 (0.100)
Sole proprietorship 1.526*** (0.114) 1.624*** (0.114) 1.580*** (0.115) 1.589*** (0.114) 1.542*** (0.115)
Credit risk 0.796*** (0.043) 0.819*** (0.044) 0.809*** (0.044) 0.817*** (0.044) 0.798*** (0.044)
Assets (log) 1.078*** (0.015) 1.065*** (0.015) 1.069*** (0.015) 1.069*** (0.015) 1.075*** (0.015)
Initial assets (log) 0.999 (0.016) 0.984 (0.016) 0.987 (0.016) 0.988 (0.016) 0.992 (0.016)
Total employees 1.009 (0.009) 1.000 (0.005) 1.004 (0.005) 1.003 (0.005) 1.008 (0.005)
Owner characteristics
Education 1.022 (0.095) 0.969 (0.095) 0.999 (0.095) 0.966 (0.095) 1.014 (0.095)
Work experience 1.014*** (0.014) 1.011* (0.005) 1.012* (0.005) 1.011* (0.005) 1.014* (0.005)
Age 0.996 (0.005) 0.997 (0.005) 0.997 (0.005) 0.996 (0.005) 0.996 (0.005)
White 1.234* (0.134) 1.239 (0.139) 1.231 (0.139) 1.263+ (0.139) 1.257 (0.140)
Female 1.026 (0.125) 1.005 (0.125) 1.008 (0.125) 1.018 (0.125) 1.257 (0.126)
County characteristics
Income per capita 1.005+ (0.000) 1.000 (0.000) 1.004 (0.000) 1.004 (0.000) 1.005 (0.000)
Competitive density 0.977 (0.015) 0.979 (0.015) 0.979 (0.015) 0.979 (0.015) 0.976 (0.015)
Benefits
Stability benefits 3.763*** (0.184)
Healthcare plan? 1.599*** (0.101)
Retirement plan? 2.599*** (0.133)
Tuition reimbursement? 1.468*** (0.149)
Log likelihood − 3941.46 − 3914.56 − 3930.57 − 3914.24 − 3938.08LR test – *** *** *** ***
Wald chi2 (p value) 148.26*** (0.000) 193.25*** (0.000) 167.87*** (0.000) 193.01*** (0.000) 153.73*** (0.000)
We estimate random-effect logit models in all specifications. Estimates are reported as odds ratios (eβ ). Odds ratios above 1 (below 1)indicate that the variable increases (decreases) the odds of obtaining a profit. The magnitude of the effect can be interpreted by differencingfrom 1. Standard errors are reported in parentheses and adjusted for survey sampling due to the KFS design. Two-digit NAICS industry fixedeffects included in all specifications. N = 6421 observations and 2368 start-up firms (two-tailed tests)a LR test is the likelihood ratio test calculated as − 2 × ln [ll(baseline) − ll(model)]+ p < 0.10; * p < 0.05; ** p < 0.01; *** p < 0.001
Employee compensation and new venture performance: does benefit type matter?
To assess instrument validity, we follow the well-known rule of thumb that specifies the first-stage Fstatistic should exceed 10 (Staiger and Stock 1997). Ourevidence suggests the instrument is indeed valid since theF statistic exceeds this benchmark in all models. Next, wetest the exogeneity assumption using a Durbin chi-squared test, where the null hypothesis assumesexogeneity. The results indicate that our models do not
suffer from endogeneity—the test fails to reject the nullhypothesis of exogeneity in model 2 (p = 0.316), model 3(p = 0.755), model 5 (p = 0.637), and model 6 (p =0.632). Based on these tests, we conclude that our instru-ment and identification strategy is valid and our modelsdo not suffer from endogeneity bias. This provides addi-tional evidence in favor of our prior models that assumeexogeneity (Tables 3, 4, 5 and 6).
Table 6 Odds ratios predicting the effect of benefits that promote flexibility on the profits of new ventures
Dependent variable = Profit (0,1)
Variables Model 6 Model 7 Model 8 Model 9 Model 10
eβ SE eβ SE eβ SE eβ SE eβ SEFirm characteristics
Home based 1.114 (0.102) 1.073 (0.100) 1.024 (0.099) 1.081 (0.102) 1.136 (0.102)
Sole proprietorship 1.591*** (0.115) 1.563*** (0.114) 1.470*** (0.114) 1.559*** (0.115) 1.588*** (0.115)
Credit risk 0.806*** (0.044) 0.803*** (0.043) 0.795*** (0.043) 0.802*** (0.044) 0.810*** (0.044)
Assets (log) 1.069*** (0.015) 1.070*** (0.015) 1.080*** (0.015) 1.072*** (0.015) 1.066*** (0.015)
Initial assets (log) 0.988 (0.016) 0.990 (0.016) 0.991 (0.016) 0.990 (0.016) 0.988 (0.016)
Total employees 1.005 (0.005) 1.005 (0.005) 1.010+ (0.005) 1.007 (0.005) 1.005 (0.005)
Owner characteristics
Education 1.001 (0.095) 1.005 (0.095) 1.040 (0.095) 1.011 (0.095) 1.003 (0.096)
Work experience 1.013 (0.005) 1.013* (0.005) 1.014** (0.095) 1.014** (0.005) 1.012* (0.005)
Age 0.997 (0.005) 0.998 (0.005) 0.995 (0.005) 0.996 (0.005) 0.997 (0.005)
White 1.238 (0.140) 1.247 (0.139) 1.221 (0.138) 1.239 (0.140) 1.238 (0.140)
Female 0.998 (0.126) 0.998 (0.125) 1.032 (0.125) 1.009 (0.126) 0.994 (0.126)
County characteristics
Income per capita 1.000 (0.000) 1.005 (0.000) 1.006 (0.000) 1.004 (0.000) 1.004 (0.000)
Competitive density 0.978 (0.015) 0.977 (0.015) 0.977 (0.015) 0.978 (0.015) 0.978 (0.015)
Benefits
Flexible benefits 1.814*** (0.161)
Provide bonuses? 1.556*** (0.101)
Provide stocks? 0.550*** (0.149)
Provide paid sick leave? 1.323** (0.098)
Provide paid vacation? 1.578*** (0.099)
Log likelihood − 3934 − 3931 − 3933.25 − 3937.42 − 3930.83LR test *** *** *** *** ***
Wald chi2 (p value) 159.65 165.83*** (0.000) 165.25*** (0.000) 155.08*** (0.000) 166.42*** (0.000)
We estimate random-effect logit models in all specifications. Estimates are reported as odds ratios (eβ ). Odds ratios above 1 (below 1)indicate that the variable increases (decreases) the odds of obtaining a profit. The magnitude of the effect can be interpreted by differencingfrom 1. Standard errors reported in parentheses and adjusted for survey sampling due to the KFS design. Two-digit NAICS industry fixedeffects included in all specifications. N = 6421 observations and 2368 start-up firms (two-tailed tests)a LR test is the likelihood ratio test calculated as − 2 × ln [ll(baseline) − ll(model)]+ p < 0.10; * p < 0.05; ** p < 0.01; *** p < 0.001
C. J. Boudreaux
Tab
le7
Adjustin
gforpotentialendogeneity
bias
usinginstrumentalv
ariableregressions
Firm
survival
Firm
profit
Cox
proportio
nalh
azard
IVPoisson
Random-effectlogit
IVProbit
Variables
Model1(baseline)
Model2
Model3
Model4(baseline)
Model5
Model6
eβSE
eβSE
eβSE
eβSE
eβSE
eβSE
Firm
characteristics
Hom
ebased
0.978
(0.118)
0.995
(0.005)
0.995
(0.005)
1.035
(0.099)
1.067
(0.037)
1.063
(0.038)
Soleproprietorship
0.721*
(0.101)
0.988*
*(0.005)
0.988*
*(0.005)
1.526*
**
(0.114)
1.211*
**
(0.042)
1.194*
**
(0.042)
Creditrisk
1.318*
**
(0.085)
1.010*
**
(0.002)
1.010*
**
(0.002)
0.796*
**
(0.043)
0.898*
**
(0.019)
0.890*
**
(0.019)
Profit
0.606*
**
(0.067)
0.977*
**
(0.004)
0.976*
**
(0.004)
––
–
Assets(log)
0.936*
**
(0.016)
0.997*
**
(0.001)
0.996*
**
(0.001)
1.078*
**
(0.015)
1.032*
**
(0.007)
1.035*
**
(0.007)
Initialassets(log)
1.006
(0.019)
1.001
(0.001)
1.001
(0.001)
0.991
(0.016)
0.995
(0.006)
0.997
(0.006)
Totalem
ployees
1.000
(0.009)
1.000
(0.0002)
1.000
(0.0002)
1.009
(0.005)
0.999
(0.002)
1.001
(0.002)
Ownercharacteristics
Educatio
n0.933
(0.107)
0.995
(0.005)
0.995
(0.005)
1.022
(0.095)
0.938
(0.035)
0.953
(0.035)
Workexperience
0.996
(0.006)
1.000
(0.0002)
1.000
(0.0002)
1.014*
(0.005)
1.004*
**
(0.002)
1.005*
**
(0.002)
Age
1.000
(0.006)
1.000
(0.0002)
1.000
(0.0002)
0.996
(0.005)
0.997
(0.002)
0.997
(0.002)
White
1.154
(0.191)
1.005
(0.007)
1.005
(0.007)
1.234
(0.139)
1.091
(0.05)
1.087
(0.05)
Female
1.131
(0.168)
1.009
(0.006)
1.009
(0.006)
1.026
(0.125)
1.036
(0.046)
1.033
(0.046)
Countycharacteristics
Incomepercapita
1.000
(0.005)
1.000
(0.000)
1.000
(0.000)
1.000
(0.004)
1.000
(0.000)
1.000
(0.000)
Com
petitivedensity
1.051*
**
(0.015)
1.002*
**
(0.001)
1.002*
**
(0.001)
0.977
(0.015)
0.991
(0.005)
0.991
(0.005)
Employee
benefits
Stability
benefits
0.980*
*(0.01)
1.801*
**
(0.079)
Flexibility
benefits
0.994
(0.009)
1.258*
**
(0.071)
Modelfit
Ftest
344.63
***
(0.000)
3.38
***
(0.000)
3.39
***
(0.000)
––
–
Waldtest
––
–148.26
***
(0.000)
297.10
***
(0.000)
254.53
***
(0.000)
Instrumenttests
First-stageFstat
80.39*
**
(0.000)
67.82*
**
(0.000)
–1360
***
(0.000)
1507
***
(0.000)
Testo
fexogeneity
(pvalue)a
–0.316
0.755
0.637
0.632
Employee compensation and new venture performance: does benefit type matter?

In sum, these findings suggest that start-up firms thatprovide more employee benefits have lower rates of exitand higher odds of earning a profit. We use instrumentalvariables regression techniques to control for the possi-bility that more profitable and successful start-up firmsmight be more likely to provide employee benefitscompared with less successful start-up firms. By con-trolling for initial resource endowments, profits, andpotential reverse causality concerns, the analysis in Ta-ble 7 provides more robust evidence that start-up firmsexperience greater performance due to the benefits theyprovide and not for reasons attributed to alternativeomitted factors. Additionally, the instrument andexogeneity tests indicate that our instrument is validand that the models do not suffer from an endogeneityconcern. Overall, these robustness tests support ourfindings that new ventures that provide benefits toemployees—especially those that promote stability—exhibit superior performance through lower rates of exitand higher odds of earning a profit.
5 Discussion
5.1 Summary
Studies often assume that employee benefits are alwaysbeneficial for firm performance (Wells et al. 2003).Though this may seem obvious at first glance, it mightnot always be the case. Providing benefits is not costlessto the start-up firm. Benefits can quickly become expen-sive and although providing benefits beyond what isrequired is a nice gesture, there is no guarantee thebenefits will incentivize performance. Our results showthat there is indeed heterogeneity in benefits’ effects onnew venture performance. We find that some benefits—namely stability benefits—lead to lower rates of busi-ness failure and higher odds of earning a profit. Benefitsthat provide flexibility, however, only lead to higherodds of earning a profit.
We theorize that this effect arises from the ability torecruit and retain high performing employees. Thesefindings support the linkage between investments inhuman capital and a new venture’s financial perfor-mance, and more importantly, the findings suggest thatemployee benefits and employee compensation shouldbe important considerations for firm performance andnew venture survival, though all benefits are not createdequal. Start-up firms that offer benefits that promoteW
eestim
ateaCox
proportio
nalhazardmodelinmodel1andrandom
-effectlogitmodelinmodel4.Estim
atesarereported
ashazard
ratio
s(eβ)inmodels1–3andodds
ratio
s(eβ)inmodels
4–6.Oddsratio
sandhazardratio
sabove1(below
1)indicatethatthevariableincreases(decreases)the
risk
ofexitorodds
ofobtainingaprofit.The
magnitude
oftheeffectcanbe
interpreted
bydifferencing
from
1.Standard
errors
reported
inparenthesesandadjusted
forsurvey
samplingdueto
theKFS
design.Two-digitNAICSindustry
fixedeffectsincluded
inall
specifications.N
=6421
observations
and2368
start-up
firm
s(two-tailedtests).M
odels2and3areestim
ated
usingan
instrumentalvariablepanelP
oisson
with
firm
-levelfixedeffects.This
isequivalenttoaCox
proportio
nalhazardmodelandperm
itsestim
ationbasedon
instrumentalvariables.T
heinstrumentforthebenefitsindexistheaveragebenefitsprovided
byotherstart-
upfirm
sin
thesamecounty
asthestart-up.M
odels5and6areestim
ated
usinginstrumentalv
ariables
Probitu
sing
thesameinstrumentasin
models2and3
aDurbinchi-squaredteststatistic
isused
asthetestforendogeneity
usingStatapostestim
ationcommand,estatendogenous
+p<0.10;*
p<0.05;*
*p<0.01;*
**p<0.001
C. J. Boudreaux
stability such as retirement, healthcare, and educationbenefits packages have the highest rates of survival (i.e.,lowest rates of failure). This finding is consistent withour intuition because advice for job seekers often sug-gests that some superior jobs offer not just highly com-petitive salaries, but also highly competitive healthcarebenefits. Private surveys support this argument sincethey find that workers are more likely to be satisfied intheir job if it has a competitive benefits package (Aflac2013) and much of the increased spending on benefitspackages are employee-driven (Bloomberg 2015). Incontrast, we find little evidence in favor of our hypoth-esis that flexible benefits affect the rate of exit, but thesebenefits, with the exception of stock option plans, do infact increase the odds of earning a profit.
5.2 Implications and limitations
Our findings have important implications for manage-ment practice and small business policy. HR managerswill find our study useful because we identify howemployer-provided benefits are associated with greaterfirm performance. Moreover, benefits that promote sta-bility have the most potential to help reduce new venturefailure rates. In contrast, benefits that promote flexibilityhave little effect on the failure rates of new ventures.Because small start-up firms generally have more strin-gent financial constraints, our findings suggest that man-agers should prioritize healthcare, retirement, and tuitionreimbursement benefits. However, with the exception ofstock options, all benefit provisions are associated withhigher odds of firm profits. Therefore, managers canexperience greater financial performance by offeringmore benefits to their employees.
Our findings also have important implications forbusiness policy. Our results identify HRM as a via-ble mechanism for improving start-up firm perfor-mance. This is especially important considering thatrecent evidence suggests that talent development is abetter solution for business policy when comparedwith a policy of choosing winners (Acs et al. 2016).If the provision of benefit packages reduces thefailure rates of start-up firms and increases the oddsof profit, then policy makers might want to considerhow start-ups can more readily provide valuablebenefits to recruit productive employees.
Inevitably, our study does have some limitations. TheKFS provides firm-level and founder-level data to re-searchers. While this is a rich source of data, it does not
include employee-level data, whichmight help enrich ourunderstanding of how employee benefits affectemployee-level motivation directly. Based on extant re-search (Jackson et al. 2014; Kehoe and Wright 2013;Wright et al. 2003), we know that HR practices cansuccessfully motivate organizational culture, employeemotivation, and firm performance. Nevertheless,employee-level data would provide richer detail into ouranalysis. Moreover, data on employees’ human capitaland business experience would enrichen our study. Ourstudy posits that providing benefits to employees is oneway to attract and maintain productive employees, whichcan ultimately improve the performance of the start-upfirm. Unfortunately, although the KFS has informationon the founder’s business experience and human capital,data on employees’ human capital and business experi-ence is absent. Future research might consider investigat-ing the relationship between employee benefits and start-up performance while considering the heterogenous ef-fects of employees’ human capital.
In addition, our study focuses on two performancemetrics—business failure and firm profit. We believe wecan acquire a better understanding of how employee ben-efits affect new venture performance when investigating amultitude of outcomes. Nevertheless, it is possible to ex-amine other outcomes such as sales growth, innovation,and local economic impact. Future researchmight considerhow employee compensation and benefits affects theseother measures of new venture performance.
6 Conclusion
We use the KFS to examine how the provision ofemployee benefits affects profits and business failurerates of exit for new ventures. Using insights fromstrategic HRM, we argue that start-up firms that providehighly sought after benefits to their employees willexperience greater performance. Start-up firms that dooffer valuable benefits to employees—especially thosethat offer benefits above and beyond their competi-tors18—are able to reap the benefits of superior firmperformance.
Our findings reveal that the provision of employeebenefits is associated with lower failure rates for start-upfirms and higher odds of earning a profit. The results,
18 This can be seen from the instrumental variable regressions reportedin Table 6.
Employee compensation and new venture performance: does benefit type matter?
however, indicate that the type of benefit provided mat-ters. We find that start-up firms that provide benefits thatpromote stability—healthcare plans, retirement plans,and education tuition reimbursement benefits—are as-sociated with lower rates of firm exit. Specifically, wefind that new ventures have a 44% lower rate of exit,start-up firms that provide retirement benefits have a31% lower rate of exit, and start-up firms that providetuition reimbursement benefits have a 38% lower rate ofexit. On the other hand, we find little evidence to sup-port our hypothesis that benefits that promote flexibilityare associated with lower firm exit rates. In other words,we find no effect on the rate of new venture survival forbenefits like bonus pay, stock options, paid sick leave,and paid vacation leave. We also find that both benefittypes—stability and flexibility—are associated withhigher odds of obtaining profits. However, stock optionsare associated with lower odds of obtaining a profit.While surprising, one potential explanation is that stockoptions are quite expensive. Consequently, offeringstock option plans might reduce the profitability ofstart-up firms. We do not have enough detailed infor-mation on the costs of these plans, but we encouragefuture research to examine this issue in more detail.Lastly, we also find that all benefit plans are associatedwith higher odds of earning a profit, and there is littledifference between benefits that promote stability andflexibility.
While our study examines the failure rates ofstart-ups due to going out of business, it might alsobe interesting to examine the positive aspects of exit,such as a sale or acquisition. In this case, start-upfirms that exit due to a sale or acquisition mightactually be successful. Better benefits packagesmight affect acquisition rates if a firm hires betteremployees. By actively attracting and retaining tal-ented employees through the provision of employeebenefits, a start-up firm might increase its value forpurchase by larger firms in the industry. Thoughbeyond the scope of this paper, we believe it is aworthy extension of our study.
Acknowledgments Certain data included herein are derivedfrom the Ewing Marion Kauffman Foundation, Kansas City,MO. Any opinions, findings, and conclusions or recommendationsexpressed in the material are those of the authors and do notnecessarily reflect the views of the Ewing Marion KauffmanFoundation. We thank Rebel Cole, two anonymous referees, andAssociate Editor David Urbano for helpful discussions and com-ments. All results have been reviewed to ensure that no
confidential information on individual firms is disclosed. Anyremaining errors are our own.
Funding information Funding and support were received fromthe Ewing Marion Kauffman Foundation and the NORC enclaveat the University of Chicago.
References
Acs, Z., Armington, C., & Zhang, T. (2007). The determinants ofnew-firm survival across regional economies: the role ofhuman capital stock and knowledge spillover*. Papers inRegional Science, 86(3), 367–391. https://doi.org/10.1111/j.1435-5957.2007.00129.x.
Acs, Z., Åstebro, T., Audretsch, D., & Robinson, D. T. (2016).Public policy to promote entrepreneurship: a call to arms.Small Business Economics, 47(1), 35–51. https://doi.org/10.1007/s11187-016-9712-2.
Aflac. (2013). Findings from the 2013 Aflac WorkForces Reportreveal distinct differences between companies leveraging keyHR and benefits practices and workforce engagement andsatis fact ion . Retrieved from https: / /www.aflac.c om / d o c s / aw r / p d f / a r c h i v e / a f l a c _ v i ewpo i n t _thecompetitiveedge_2013.pdf. Accessed 18 May 2018.
Amin Zargarzadeh, M., Verbeke, A., & Osiyevskyy, O. (2014).Internalization theory, entrepreneurship and internationalnew ventures. Multinational Business Review, 22(3), 246–269. https://doi.org/10.1108/MBR-06-2014-0023.
Ang, S., Slaughter, S., & Yee Ng, K. (2002). Human capital andinstitutional determinants of information technology com-pensation: modeling multilevel and cross-level interactions.Management Science, 48(11), 1427–1445. https://doi.org/10.1287/mnsc.48.11.1427.264.
Bakke, E.W. (1961). The human resources function.ManagementInternational, 1(2), 16–24.
Balkin, D. B., & Logan, J.W. (1988). Reward policies that supportentrepreneurship. Compensation and Benefits Review, 20(1),18–25. https://doi.org/10.1177/088636878802000103.
Ballou, J., Barton, T., DesRoches, D., Potter, F., Reedy, E. J.,Robb, A., … Zhao, Z. (2008). The Kauffman Firm Survey:results from the baseline and first follow-up surveys (SSRNscholarly paper no. ID 1098173). Retrieved from social sci-ence research network website: https://papers.ssrn.com/abstract=1098173. Accessed 2 Feb 2017.
Barber, A. E., Dunham, R. B., & Formisano, R. A. (1992). Theimpact of flexible benefits on employee satisfaction: a fieldstudy. Personnel Psychology, 45(1), 55–74.
Barney, J. (1991). Firm resources and sustained competitive ad-vantage. Journal of Management, 17(1), 99–120. https://doi.org/10.1177/014920639101700108.
Barro, R. J. (1991). Economic growth in a cross section of coun-tries. The Quarterly Journal of Economics, 106(2), 407–443.https://doi.org/10.2307/2937943.
Bates, T., & Robb, A. (2014). Small-business viability inAmerica’s urban minority communities. Urban Studies,5 1 ( 1 3 ) , 2844–2862 . h t t p s : / / d o i . o r g / 1 0 . 1177/0042098013514462.
C. J. Boudreaux
Becker, G. S., Murphy, K. M., & Tamura, R. (1990). Humancapital, fertility, and economic growth. Journal of PoliticalEconomy, 98(5, Part 2), S12–S37. https://doi.org/10.1086/261723.
Black, J., de Meza, D., & Jeffreys, D. (1996). House Price, thesupply of collateral and the Enterprise economy. EconomicJournal, 106(434), 60–75. https://doi.org/10.2307/2234931.
Bloomberg. (2015). Benefits Are the New Salary. Retrieved fromhttps://www.bloomberg.com/news/articles/2015-06-30/benefits-are-the-new-salary. Accessed 18 May 2018.
BLS. (2018). Employee Benefits in the United States. Retrievedfrom http://bls.gov/news.release/pdf/ebs2.pdf. Accessed 18May 2018.
Boudreaux, C. J. (2018). Ethnic diversity and small businessventuring. Small Business Economics. https://doi.org/10.1007/s11187-018-0087-4.
Boudreaux, C. J. (2019). The importance of industry to strategicentrepreneurship: evidence from the Kauffman Firm Survey.Journal of Industry, Competition and Trade. https://doi.org/10.1007/s10842-019-00310-7.
Boudreaux, C. J., & Nikolaev, B. (2018). Capital is not enough:opportunity entrepreneurship and formal institutions. SmallBusiness Economics, 1–30. https://doi.org/10.1007/s11187-018-0068-7.
Branco, M. C., & Rodrigues, L. L. (2006). Corporate socialresponsibility and resource-based perspectives. Journal ofBusiness Ethics, 69(2), 111–132. https://doi.org/10.1007/s10551-006-9071-z.
Bryant, P. C., & Allen, D. G. (2013). Compensation, benefits andemployee turnover: HR strategies for retaining top talent.Compensation and Benefits Review, 45(3), 171–175.https://doi.org/10.1177/0886368713494342.
Campbell, B. A., Kryscynski, D., &Olson, D.M. (2017). Bridgingstrategic human capital and employee entrepreneurship re-search: a labor market frictions approach. StrategicEntrepreneurship Journal, 11(3), 344–356. https://doi.org/10.1002/sej.1264.
Carraher, S. M., & Buckley, M. R. (2005). Attitudes towardsbenefits among SME owners in Western Europe: an 18-month study. Journal of Applied Management andEntrepreneurship; Sheffield, 10(4), 45–57.
Carraher, S. M., & Whitely, W. T. (1998). Motivations for workand their influence on pay across six countries. GlobalBusiness and Finance Review, 3, 49–56.
Cassar, G. (2014). Industry and startup experience on entrepreneurforecast performance in new firms. Journal of BusinessVenturing, 29(1), 137–151. https://doi.org/10.1016/j.jbusvent.2012.10.002.
Cleves,M., Gould,W., Gutierrez, R. G., &Marchenko, Y. (2010).An Introduction to Survival Analysis Using Stata [Stata pressbooks] . Retr ieved from StataCorp LP websi te :http://econpapers.repec.org/bookchap/tsjspbook/saus3.htm.Accessed 2 Feb 2017.
Clinch, G. (1991). Employee compensation and firms’ Researchand Development activity. Journal of Accounting Research,29(1), 59–78. https://doi.org/10.2307/2491028.
Cochran,W. G. (2007). Sampling techniques. JohnWiley & Sons.Cole, R. A., & Sokolyk, T. (2018a). Debt financing, survival, and
growth of start-up firms. Journal of Corporate Finance, 50,609–625. https://doi.org/10.1016/j.jcorpfin.2017.10.013.
Cole, R. A., & Sokolyk, T. (2018b).How Do Firms Choose LegalForm of Organization? (SSRN scholarly paper no. ID2028176). Retrieved from social science research networkwebsite: https://papers.ssrn.com/abstract=2028176.Accessed 10 Sep 2019.
Cole, R. A., & Sokolyk, T. (2019). Financing Patterns andPerformance Outcomes of Women-versus Men-OwnedYoung Entrepreneurial Firms (SSRN scholarly paper no.ID 3044957). Retrieved from social science research networkwebsite: https://papers.ssrn.com/abstract=3044957.Accessed 10 Sep 2019.
Coleman, S., Cotei, C., & Farhat, J. (2013). A resource-based viewof new firm survival: new perspectives on the role of industryand exit route. Journal of Developmental Entrepreneurship,1 8 ( 0 1 ) , 1 3 5 0 0 0 2 . h t t p s : / / d o i . o r g / 1 0 . 1 1 4 2/S1084946713500027.
Cooper, A. C., Gimeno-Gascon, F. J., &Woo, C. Y. (1994). Initialhuman and financial capital as predictors of new ventureperformance. Journal of Business Venturing, 9(5), 371–395. https://doi.org/10.1016/0883-9026(94)90013-2.
Deshpande, S. P., & Golhar, D. Y. (1994). HRM practices in largeand small manufacturing firms: a comparative study. Journalof Small Business Management, 32(2), 49.
Doms, M., Lewis, E., & Robb, A. (2010). Local labor forceeducation, new business characteristics, and firm perfor-mance. Journal of Urban Economics, 67(1), 61–77.https://doi.org/10.1016/j.jue.2009.10.002.
Drucker, P. (2012). The practice of management. Routledge.Dunford, B. B., Oler, D. K., & Boudreau, J. W. (2008).
Underwater Stock options and voluntary executive turnover:a multidisciplinary perspective integrating behavioral andeconomic theories. Personnel Psychology, 61(4), 687–726.https://doi.org/10.1111/j.1744-6570.2008.00128.x.
Eaton, S. C. (2003). If you can use them: flexibility policies,organizational commitment, and perceived performance.Industrial Relations: A Journal of Economy and Society,42(2), 145–167. https://doi.org/10.1111/1468-232X.00285.
Entrepreneur. (2005). The Basics of Employee Benefits. RetrievedAugust 29, 2019, from Entrepreneur website: https://www.entrepreneur.com/article/80158
Etzion, D. (2003). Annual vacation: duration of relief from jobstressors and burnout. Anxiety, Stress, and Coping, 16(2),213–226. https://doi.org/10.1080/10615806.2003.10382974.
Etzion, D., Eden, D., & Lapidot, Y. (1998). Relief from jobstressors and burnout: reserve service as a respite. Journalof Applied Psychology, 83(4), 577.
Fairlie, R. W., & Robb, A. M. (2007). Why are Black-ownedbusinesses less successful than white-owned businesses? Therole of families, inheritances, and business human capital.Journal of Labor Economics, 25(2), 289–323. https://doi.org/10.1086/510763.
Fairlie, R. W., & Robb, A. M. (2009). Gender differences inbusiness performance: evidence from the characteristics ofbusiness owners survey. Small Business Economics, 33(4),375. https://doi.org/10.1007/s11187-009-9207-5.
Farhat, J., Matusik, S., Robb, A., & Robinson, D. T. (2018). Newdirections in entrepreneurship research with the Kauffmanfirm survey. Small Business Economics, 50(3), 521–532.https://doi.org/10.1007/s11187-017-9905-3.
Fichman, M., & Levinthal, D. A. (1991). Honeymoons and theliability of adolescence: a new perspective on duration
Employee compensation and new venture performance: does benefit type matter?
dependence in social and organizational relationships.Academy of Management Review, 16(2), 442–468.https://doi.org/10.5465/AMR.1991.4278962.
Fisher, I. (1930). The theory of interest. New York, 43.Freeman, J., Carroll, G. R., & Hannan, M. T. (1983). The liability
of newness: age dependence in organizational death rates.American Sociological Review, 48(5), 692–710. https://doi.org/10.2307/2094928.
Friedman, M. (1957). Theory of the consumption function.Princeton university press.
Greene, W. (2004). Fixed effects and Bias due to the incidentalparameters problem in the Tobit model. EconometricReviews, 23(2), 125–147. https://doi.org/10.1081/ETC-120039606.
Greene, W. H. (2003). Econometric analysis. Pearson EducationIndia.
Guthrie, J. P. (2001). High-involvement work practices, turnover,and productivity: evidence from New Zealand. Academy ofManagement Journal, 44(1), 180–190. https://doi.org/10.5465/3069345.
Hall, B. J. (2000). What you need to know about Stock options.Retrieved September 10, 2019, from Harvard business re-v i e w w e b s i t e : h t t p s : / / l i n k . g a l e g r o u p .com/apps/doc/A60471889/AONE?sid=lms
Hannan, M. T., & Freeman, J. (1988). Density dependence in thegrowth of organizational populations. Cambridge,Massachusetts: Ballinger Books.
Hausknecht, J. P., Rodda, J., & Howard, M. J. (2009). Targetedemployee retention: performance-based and job-related dif-ferences in reported reasons for staying. Human ResourceManagement, 48(2), 269–288.
Haveman, R., & Smeeding, T. (2006). The role of higher educa-tion in social mobility. The Future of Children, 16(2), 125–150.
Holtz-Eakin, D., Joulfaian, D., & Rosen, H. (1994).Entrepreneurial decisions and liquidity constraints. RANDJournal of Economics, 25, 334–347.
Hornsby, J. S., & Kuratko, D. F. (1990). Human resource man-agement in small business: critical issues for the 1990’s.Journal of Small Business Management, 28(3), 9.
Huselid, M. A. (1995). The impact of human resource manage-ment practices on turnover, productivity, and corporate fi-nancial performance. Academy of Management Journal,38(3), 635–672. https://doi.org/10.2307/256741.
Jackson, S. E., Schuler, R. S., & Jiang, K. (2014). An aspirationalframework for strategic human resource management. TheAcademy of Management Annals, 8(1), 1–56. https://doi.org/10.1080/19416520.2014.872335.
Jha, A., & Cox, J. (2015). Corporate social responsibility andsocial capital. Journal of Banking & Finance, 60, 252–270.https://doi.org/10.1016/j.jbankfin.2015.08.003.
Kehoe, R. R., & Wright, P. M. (2013). The impact of high-performance human resource practices on employees’ atti-tudes and behaviors. Journal of Management, 39(2), 366–391. https://doi.org/10.1177/0149206310365901.
Knight, F. (1921). Risk, uncertainty and profit. New York: Hart,Schaffner and Marx.
Korn, E. L., & Graubard, B. I. (2011). Analysis of health surveys(Vol. 323). John Wiley & Sons.
Koys, D. J. (2001). The effects of employee satisfaction, organi-zational citizenship behavior, and turnover on organizational
effectiveness: a unit-level, longitudinal study. PersonnelPsychology, 54(1), 101–114. https://doi.org/10.1111/j.1744-6570.2001.tb00087.x.
Lancaster, T. (2000). The incidental parameter problem since1948. Journal of Econometrics, 95(2), 391–413. https://doi.org/10.1016/S0304-4076(99)00044-5.
Levy, P. S., & Lemeshow, S. (2013). Sampling of populations:methods and applications. John Wiley & Sons.
Lindh, T., & Ohlsson, H. (1996). Self-employment and windfallgains: evidence from the Swedish lottery. Economic Journal,106(439), 1515–1526. https://doi.org/10.2307/2235198.
Martin, B. C., McNally, J. J., & Kay, M. J. (2013). Examining theformation of human capital in entrepreneurship: a meta-analysis of entrepreneurship education outcomes. Journal ofBusiness Venturing, 28(2), 211–224. https://doi.org/10.1016/j.jbusvent.2012.03.002.
Maslow, A. H. (1943). A theory of human motivation.Psychological Review, 50(4), 370–396. https://doi.org/10.1037/h0054346.
Mathis, R. L., & Jackson, J. H. (1991). Personnel/human resourcemanagement. West Publishing Company.
McClean, E., & Collins, C. J. (2011). High-commitment HRpractices, employee effort, and firm performance: investigat-ing the effects of HR practices across employee groupswithin professional services firms. Human ResourceManagement, 50(3), 341–363. https://doi.org/10.1002/hrm.20429.
Morgan, A. G., & Poulsen, A. B. (2001). Linking pay toperformance—Compensation proposals in the S&P 500.Journal of Financial Economics, 62(3), 489–523.https://doi.org/10.1016/S0304-405X(01)00084-8.
Neyman, J., & Scott, E. L. (1948). Consistent estimates based onpartially consistent observations. Econometrica, 16(1), 1–32.https://doi.org/10.2307/1914288.
Pandher, G. S., Mutlu, G., & Samnani, A.-K. (2017). Employee-based innovation in organizations: overcoming strategic risksf rom oppor tun i sm and gove rnance . S t ra t eg i cEntrepreneurship Journal, 11(4), 464–482. https://doi.org/10.1002/sej.1252.
Pe’er, A., & Keil, T. (2013). Are all startups affected similarly byclusters? Agglomeration, competition, firm heterogeneity,and survival. Journal of Business Venturing, 28(3), 354–372. https://doi.org/10.1016/j.jbusvent.2012.03.004.
Peters, P., den Dulk, L., & van der Lippe, T. (2009). The effects oftime-spatial flexibility and new working conditions on em-ployees’ work–life balance: the Dutch case. Community,Work & Family, 12(3), 279–297. https://doi.org/10.1080/13668800902968907.
Pfeffer, J. (1994). Competitive advantage through people.California Management Review; Berkeley, 36(2), 9.
Plummer, L. A., & Acs, Z. J. (2014). Localized competition in theknowledge spillover theory of entrepreneurship. Journal ofBusiness Venturing, 29(1), 121–136. https://doi.org/10.1016/j.jbusvent.2012.10.003.
Prahalad, C. K. (1983). Developing strategic capability: an agendafor top management. Human Resource Management, 22(3),237–254. https://doi.org/10.1002/hrm.3930220304.
Ramsey, F. P. (1928). A mathematical theory of saving. TheEconomic Journal, 38(152), 543–559.
C. J. Boudreaux
Robb, A. M. (2002). Entrepreneurial performance by women andminorities: the case of new firms. Journal of DevelopmentalEntrepreneurship, 7(4), 383.
Robb, A. M., & Robinson, D. T. (2014). The capital structuredecisions of new firms. The Review of Financial Studies,27(1), 153–179. https://doi.org/10.1093/rfs/hhs072.
Royston, P., & Lambert, P. C. (2011). Flexible parametric survivalanalysis using Stata: beyond the Cox model.
Rubin, D. B. (2004). Multiple imputation for nonresponse insurveys (Vol. 81). John Wiley & Sons.
Sauermann, H. (2018). Fire in the belly? Employee motives andinnovative performance in start-ups versus established firms.Strategic Entrepreneurship Journal. https://doi.org/10.1002/sej.1267.
Sesil, J. C., & Lin, Y. P. (2011). The impact of employee Stockoption adoption and incidence on productivity: evidencefrom U.S. panel data. Industrial Relations: A Journal ofEconomy and Society, 50(3), 514–534. https://doi.org/10.1111/j.1468-232X.2011.00648.x.
Shane, S. (2003). A general theory of entrepreneurship: theindividual-opportunity nexus. Edward Elgar Publishing.
Shane, S. (2008). The illusions of entrepreneurship: the costlymyths that entrepreneurs, investors, and policy makers liveby. Yale University Press.
Shane, S., & Stuart, T. (2002). Organizational endowments andthe performance of university start-ups. ManagementScience, 48(1), 154–170. https://doi.org/10.1287/mnsc.48.1.154.14280.
Sheehan, M. (2014). Human resource management and perfor-mance: evidence from small and medium-sized firms.International Small Business Journal, 32(5), 545–570.https://doi.org/10.1177/0266242612465454.
Sheridan, A., & Conway, L. (2001). Workplace flexibility: recon-ciling the needs of employers and employees. Women inManagemen t Rev i ew . h t t p s : / / do i . o rg / 10 .1108/09649420110380238.
Shim, S., Xiao, J. J., Barber, B. L., & Lyons, A. C. (2009).Pathways to life success: a conceptual model of financialwell-being for young adults. Journal of AppliedDevelopmental Psychology, 30(6), 708–723. https://doi.org/10.1016/j.appdev.2009.02.003.
Staiger, D., & Stock, J. H. (1997). Instrumental variables regres-sion with weak instruments. Econometrica; Evanston, 65(3),557–586.
Stinchcombe, A. L. (1965). Social structure and organizations. InMarch, J. (Ed.), Handbook of organizations (pp. 153–193).Rand McNally.
Subramony, M. (2009). A meta-analytic investigation of the rela-tionship between HRM bundles and firm performance.
Human Resource Management, 48(5), 745–768. https://doi.org/10.1002/hrm.20315.
Sutton, N. A. (1985). Do employee benefits reduce labor turnover?Benefits Quarterly, 1(2), 16–22.
Tarkan, L. (2011). The Benefits of Flextime (to Employers).Retrieved September 10, 2019, from https://www.cbsnews.com/news/the-benefits-of-flextime-to-employers/
Valverde, M., Tregaskis, O., & Brewster, C. (2000). Labor flexi-bility and firm performance. International Advances inEconomic Research, 6(4), 649–661. https://doi.org/10.1007/BF02295375.
Wells, B. L., Pfantz, T. J., & Bryne, J. L. (2003). Russian womenbusiness owners: evidence of entrepreneurship in a transitioneconomy. Journal of Developmental Entrepreneurship;Norfolk, 8(1), 59–71.
Westman, M., & Eden, D. (1997). Effects of a respite from workon burnout: vacation relief and fade-out. Journal of AppliedPsychology, 82(4), 516.
Whitehead, J. (1980). Fitting Cox’s regression model to survivaldata using glim. Journal of the Royal Statistical Society:Series C: Applied Statistics, 29(3), 268–275. https://doi.org/10.2307/2346901.
Wooden, M., & Warren, D. (2004). Non-standard employmentand job satisfaction: evidence from the HILDA survey. TheJournal of Industrial Relations, 46(3), 275–297. https://doi.org/10.1111/j.0022-1856.2004.00142.x.
Wooldridge, J. M. (2010). Econometric analysis of cross sectionand panel data. MIT press.
Wright, P. M., Gardner, T. M., & Moynihan, L. M. (2003). Theimpact of HR practices on the performance of business units.Human Resource Management Journal, 13(3), 21–36.https://doi.org/10.1111/j.1748-8583.2003.tb00096.x.
Wright, P. M., McMahan, G. C., & McWilliams, A. (1994).Human resources and sustained competitive advantage: aresource-based perspective. The International Journal ofHuman Resource Management, 5(2), 301–326. https://doi.org/10.1080/09585199400000020.
Youndt, M. A., Snell, S. A., Dean, J. W., & Lepak, D. P. (1996).Human resource management, manufacturing strategy, andfirm performance. Academy of Management Journal, 39(4),836–866. https://doi.org/10.5465/256714.
Young, S. L., Welter, C., & Conger, M. (2018). Stability vs.flexibility: the effect of regulatory institutions on opportunitytype. Journal of International Business Studies, 49(4), 407–441. https://doi.org/10.1057/s41267-017-0095-7.
Publisher’s note Springer Nature remains neutral with regard tojurisdictional claims in published maps and institutionalaffiliations.
Employee compensation and new venture performance: does benefit type matter?