Embed Size (px)
Citation preview
EMPIRICAL FRAGILITY AND VULNERABILITY OF REGIONAL BUILDING STOCKS IN EUROPE
Sergio Lagomarsino [email protected]
DICCA – Department of Civil, Chemical and Environmental Engineering
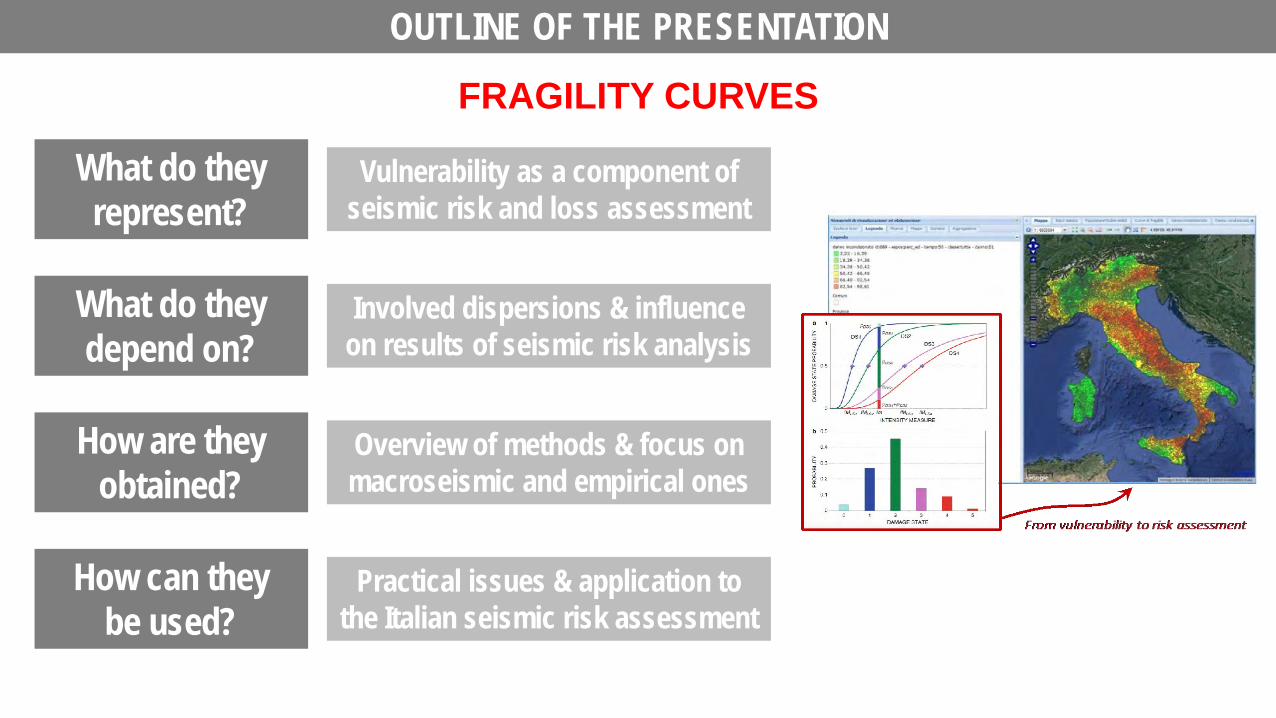
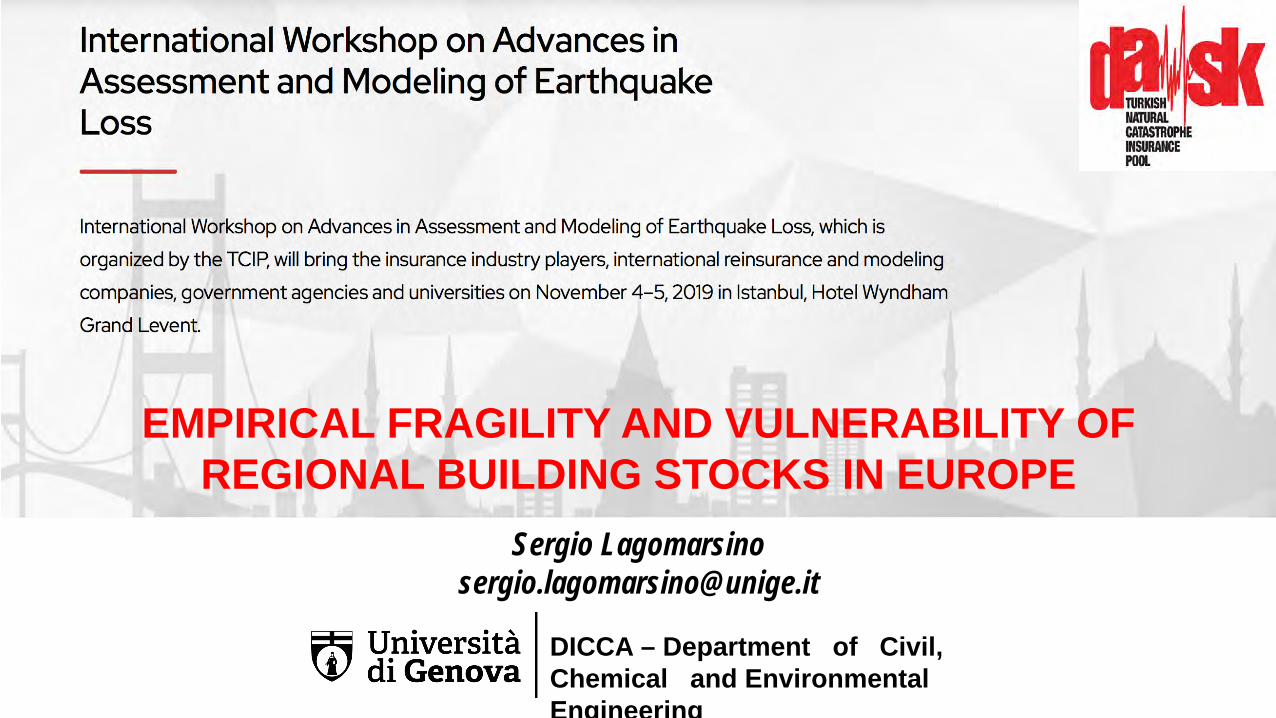
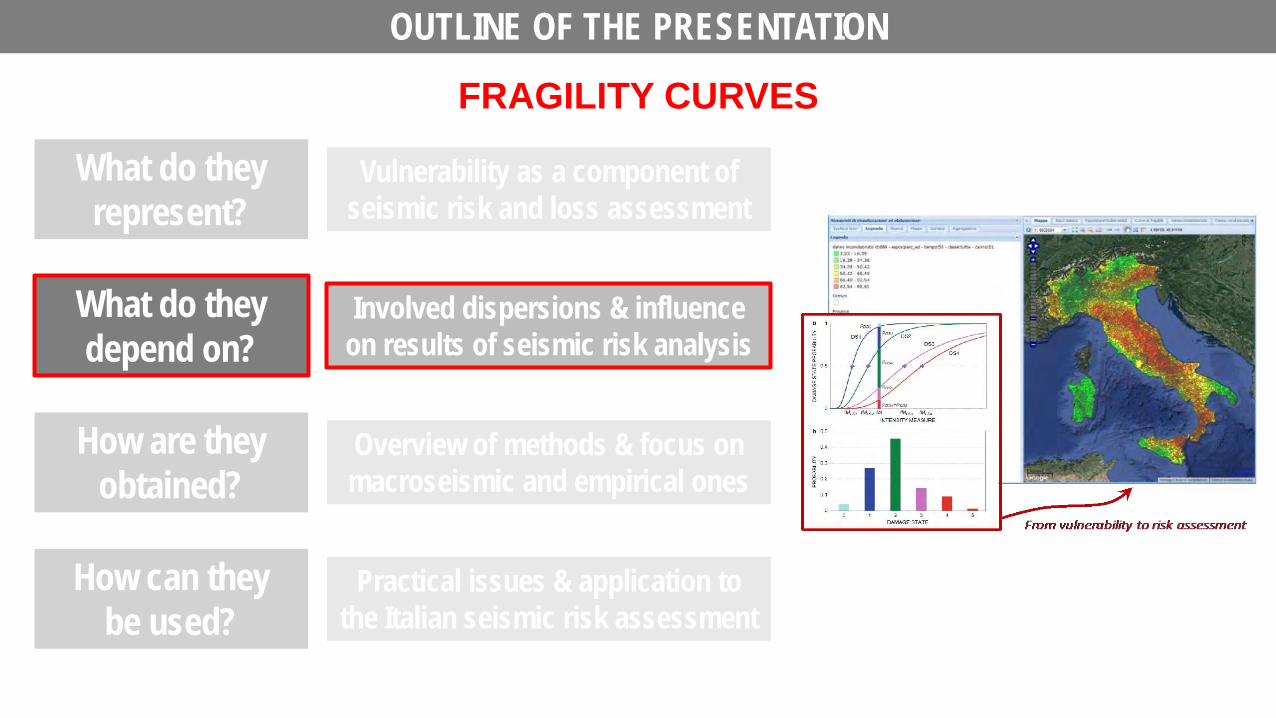
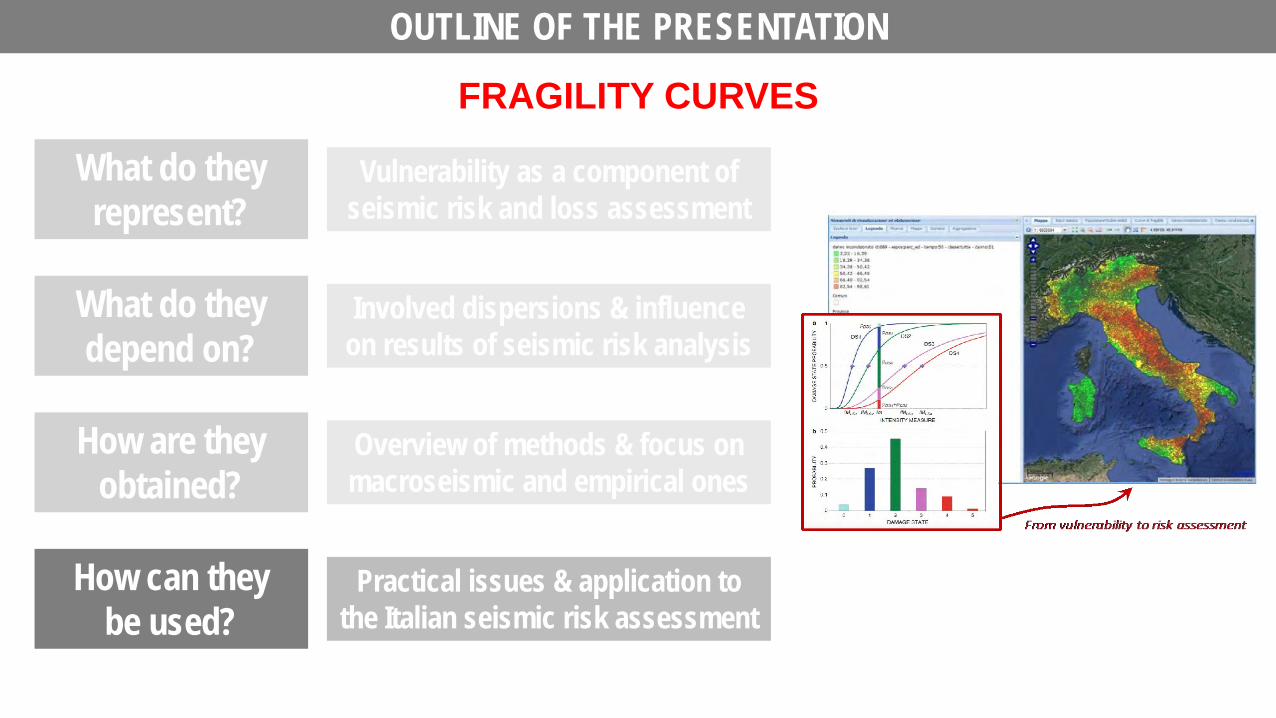
OUTLINE OF THE PRESENTATION
What do they depend on?
How are they obtained?
What do they represent?
How can they be used?
Practical issues & application to the Italian seismic risk assessment
Overview of methods & focus on macroseismic and empirical ones
Involved dispersions & influence on results of seismic risk analysis
Vulnerability as a component of seismic risk and loss assessment
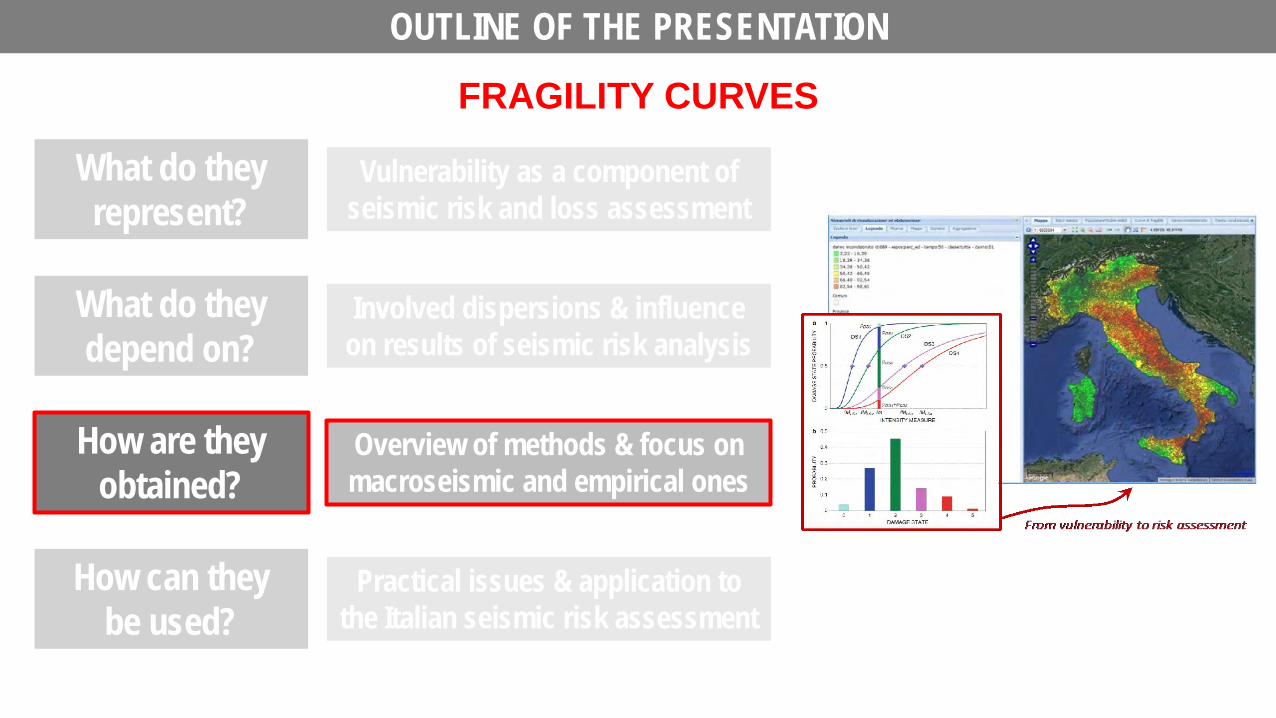
FRAGILITY CURVES
OUTLINE OF THE PRESENTATION
What do they depend on?
How are they obtained?
What do they represent?
How can they be used?
Practical issues & application to the Italian seismic risk assessment
Overview of methods & focus on macroseismic and empirical ones
Involved dispersions & influence on results of seismic risk analysis
Vulnerability as a component of seismic risk and loss assessment
FRAGILITY CURVES
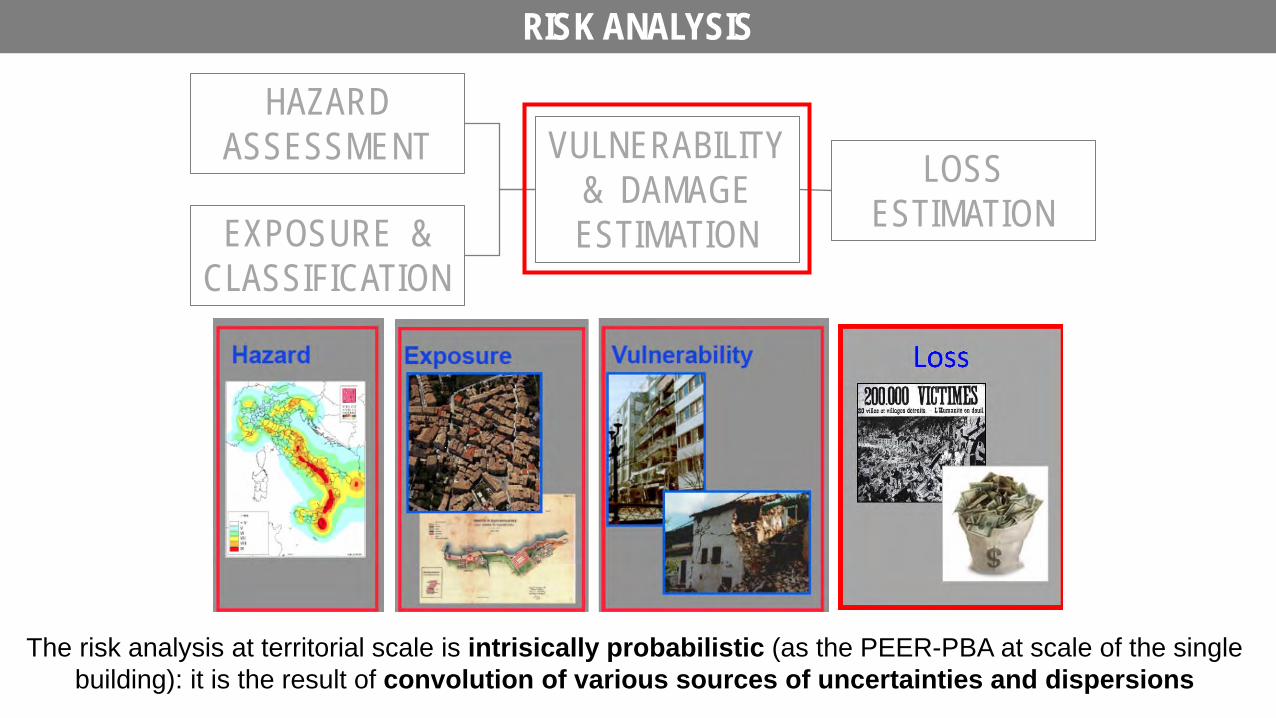
RISK ANALYSIS
HAZARD ASSESSMENT VULNERABILITY
& DAMAGE ESTIMATION EXPOSURE &
CLASSIFICATION
LOSS ESTIMATION
The risk analysis at territorial scale is intrisically probabilistic (as the PEER-PBA at scale of the single building): it is the result of convolution of various sources of uncertainties and dispersions
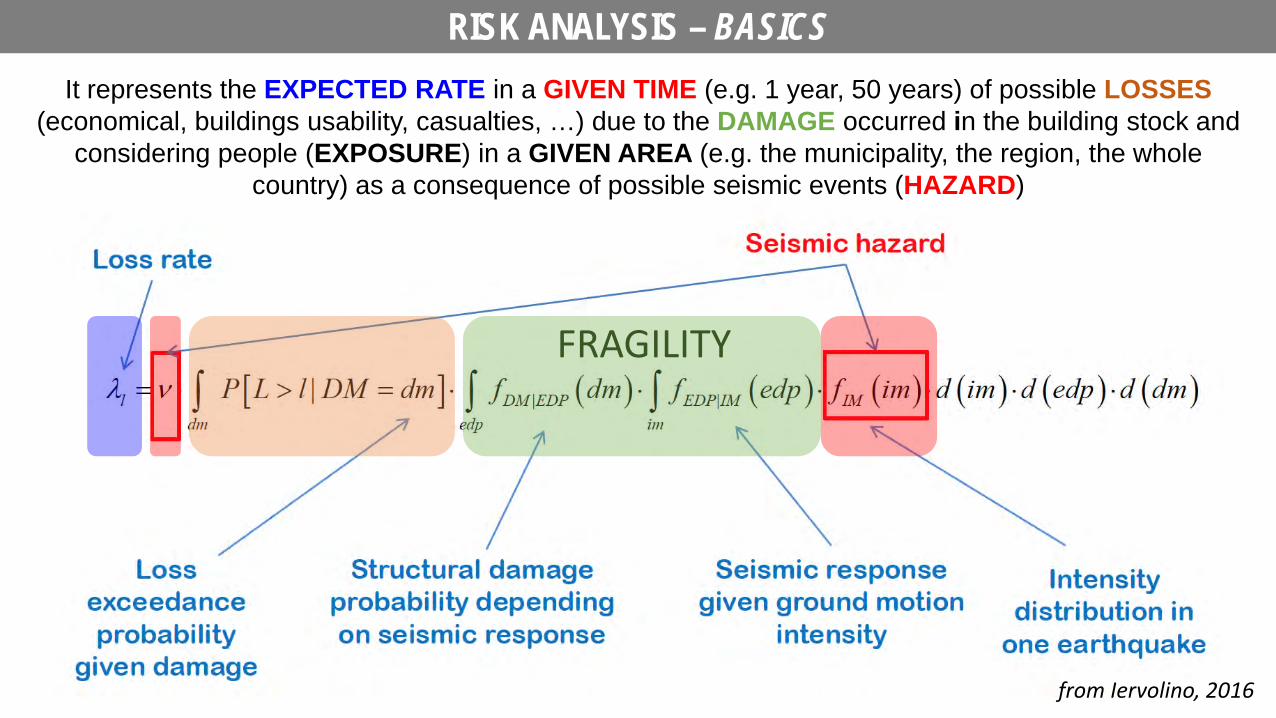
RISK ANALYSIS – BASICS It represents the EXPECTED RATE in a GIVEN TIME (e.g. 1 year, 50 years) of possible LOSSES
(economical, buildings usability, casualties, …) due to the DAMAGE occurred in the building stock and considering people (EXPOSURE) in a GIVEN AREA (e.g. the municipality, the region, the whole
country) as a consequence of possible seismic events (HAZARD)
FRAGILITY
from Iervolino, 2016
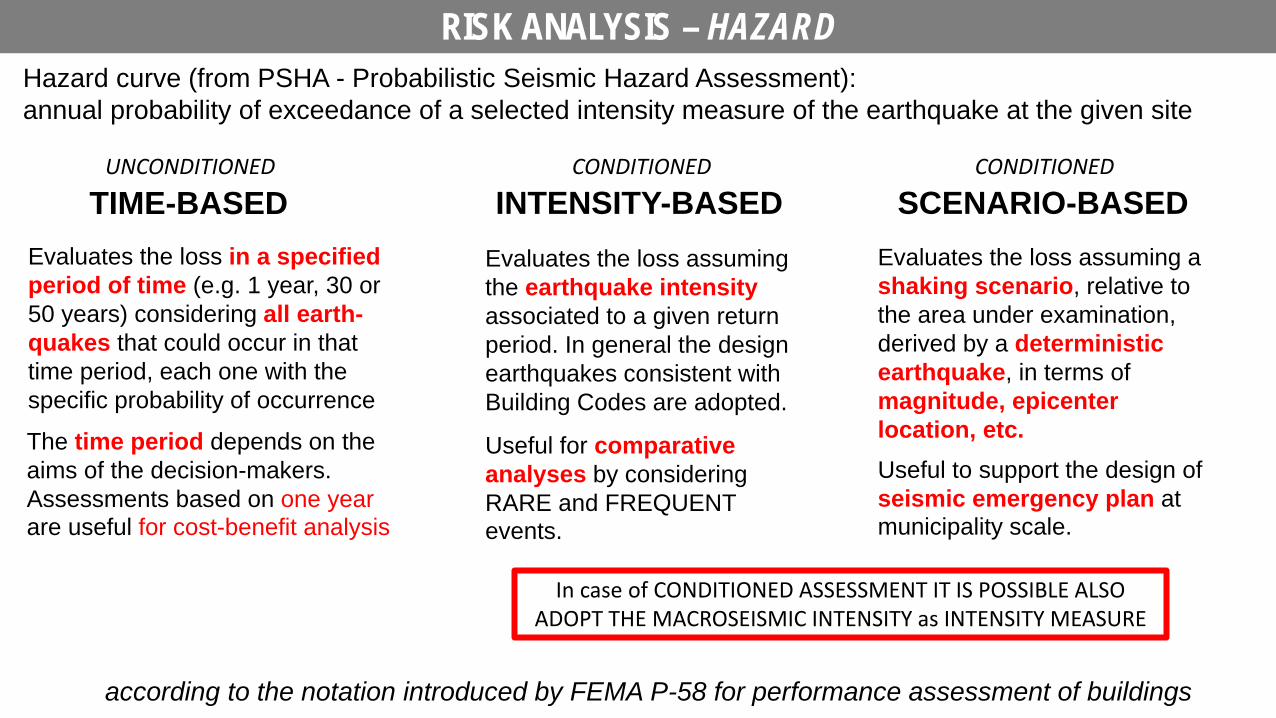
RISK ANALYSIS – HAZARD
according to the notation introduced by FEMA P-58 for performance assessment of buildings
Evaluates the loss in a specified period of time (e.g. 1 year, 30 or 50 years) considering all earth-quakes that could occur in that time period, each one with the specific probability of occurrence
TIME-BASED
The time period depends on the aims of the decision-makers. Assessments based on one year are useful for cost-benefit analysis
UNCONDITIONED
SCENARIO-BASED Evaluates the loss assuming a shaking scenario, relative to the area under examination, derived by a deterministic earthquake, in terms of magnitude, epicenter location, etc.
CONDITIONED
Useful to support the design of seismic emergency plan at municipality scale.
INTENSITY-BASED Evaluates the loss assuming the earthquake intensity associated to a given return period. In general the design earthquakes consistent with Building Codes are adopted.
CONDITIONED
Useful for comparative analyses by considering RARE and FREQUENT events.
In case of CONDITIONED ASSESSMENT IT IS POSSIBLE ALSO ADOPT THE MACROSEISMIC INTENSITY as INTENSITY MEASURE
Hazard curve (from PSHA - Probabilistic Seismic Hazard Assessment): annual probability of exceedance of a selected intensity measure of the earthquake at the given site
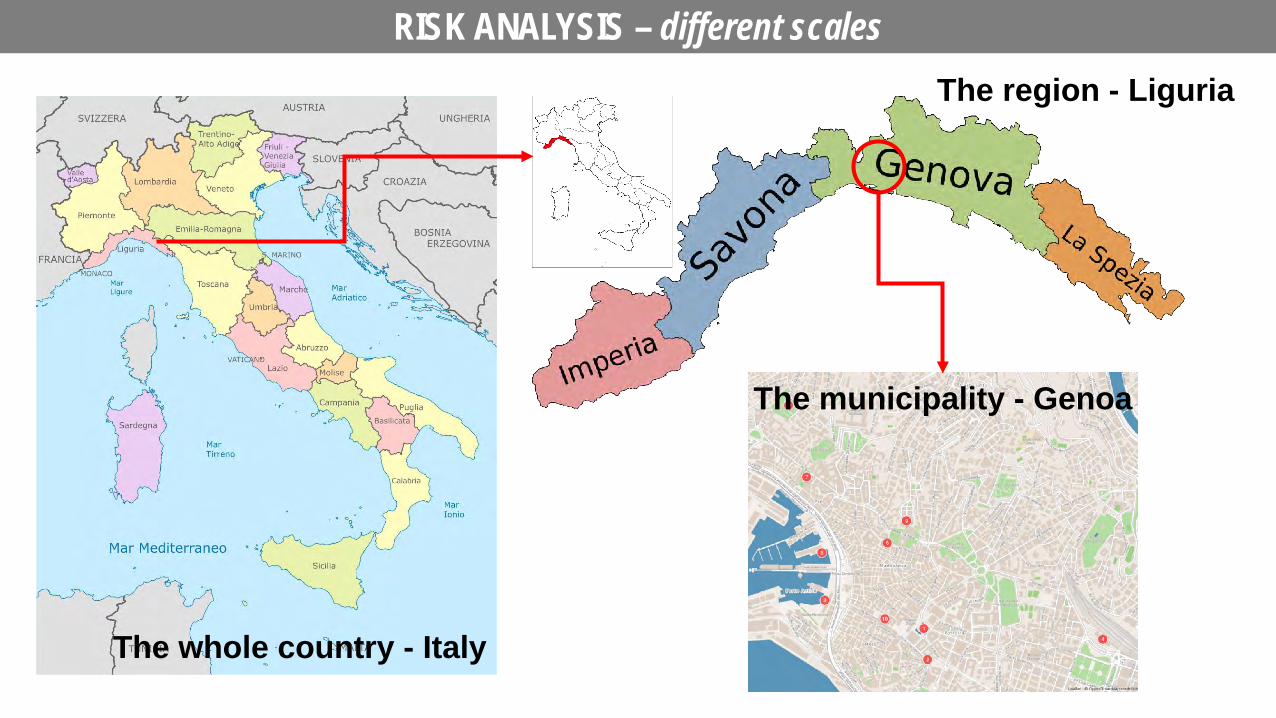
RISK ANALYSIS – different scales
The whole country - Italy
The region - Liguria
The municipality - Genoa
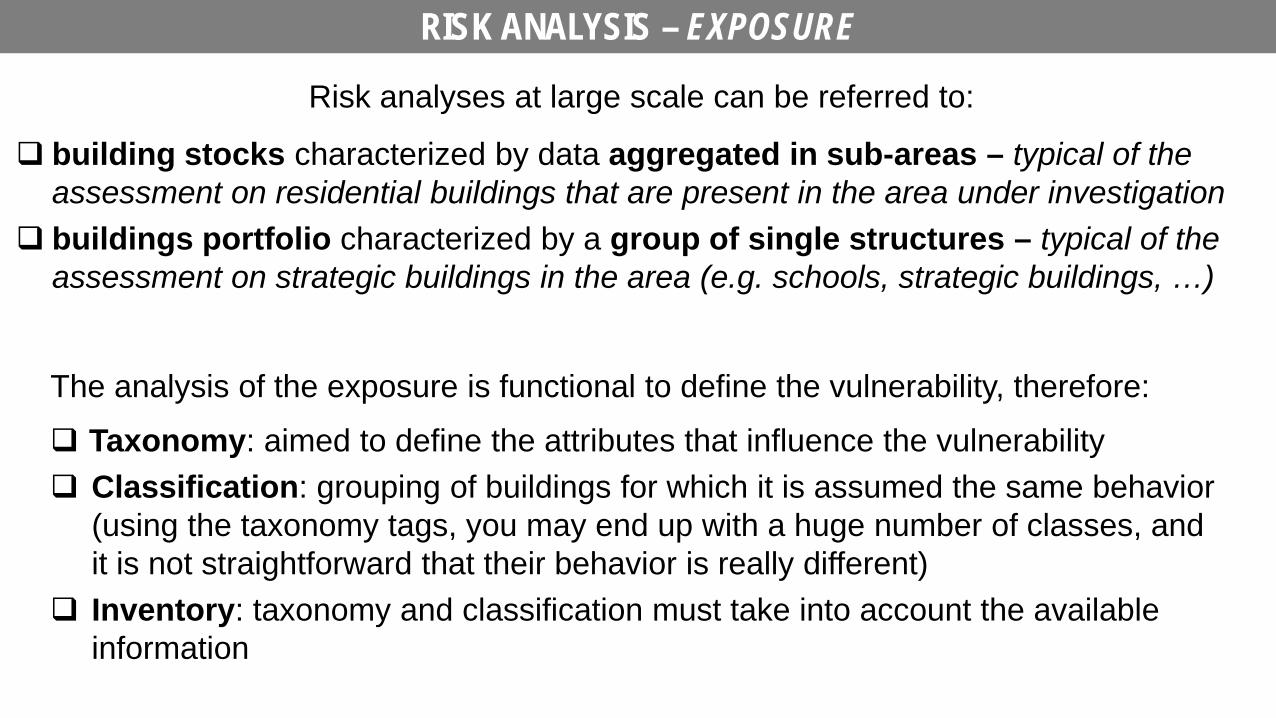
Risk analyses at large scale can be referred to:
building stocks characterized by data aggregated in sub-areas – typical of the assessment on residential buildings that are present in the area under investigation
buildings portfolio characterized by a group of single structures – typical of the assessment on strategic buildings in the area (e.g. schools, strategic buildings, …)
The analysis of the exposure is functional to define the vulnerability, therefore: Taxonomy: aimed to define the attributes that influence the vulnerability Classification: grouping of buildings for which it is assumed the same behavior
(using the taxonomy tags, you may end up with a huge number of classes, and it is not straightforward that their behavior is really different)
Inventory: taxonomy and classification must take into account the available information
RISK ANALYSIS – EXPOSURE
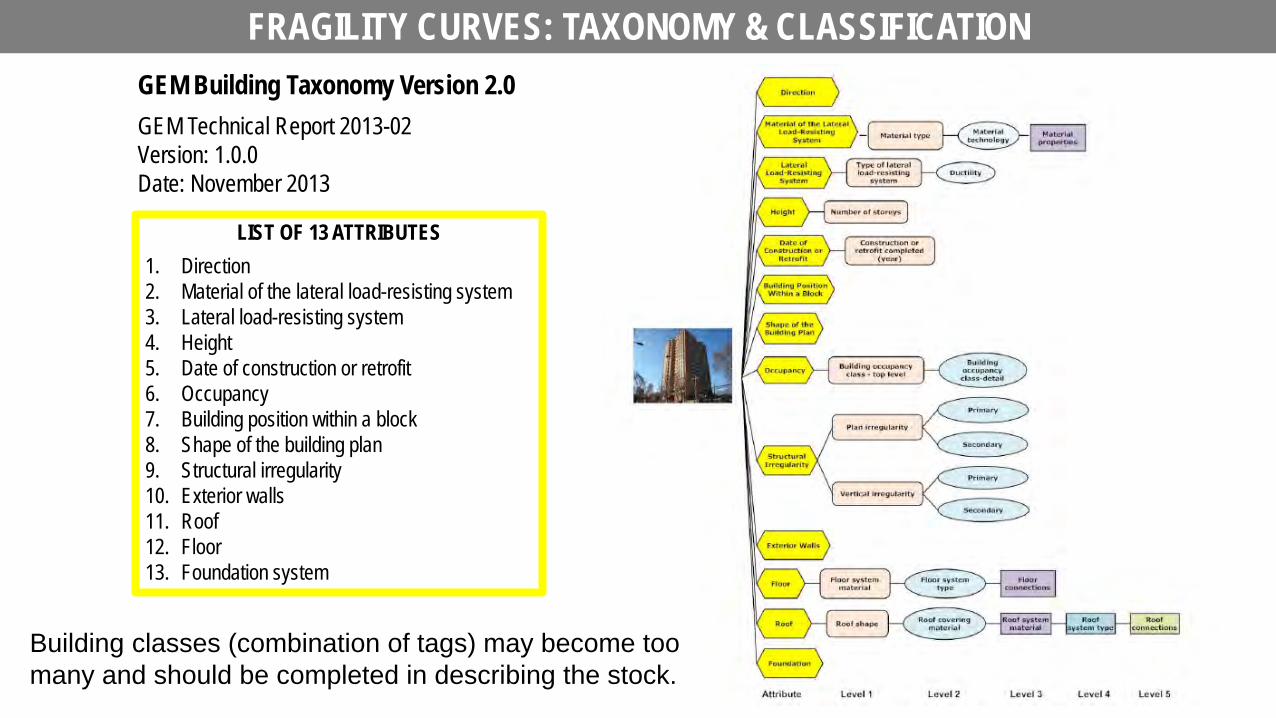
LIST OF 13 ATTRIBUTES 1. Direction 2. Material of the lateral load-resisting system 3. Lateral load-resisting system 4. Height 5. Date of construction or retrofit 6. Occupancy 7. Building position within a block 8. Shape of the building plan 9. Structural irregularity 10. Exterior walls 11. Roof 12. Floor 13. Foundation system
GEM Building Taxonomy Version 2.0 GEM Technical Report 2013-02 Version: 1.0.0 Date: November 2013
FRAGILITY CURVES: TAXONOMY & CLASSIFICATION
Building classes (combination of tags) may become too many and should be completed in describing the stock.

CLASSIFICATION OF RESIDENTIAL BUILDING STOCK IN ITALY FROM CENSUS DATA
Italian seismic risk maps by IRMA Platform
ISTAT - Census of the population Information available at municipality level, disaggregated in terms of: Exposure: • Population • # of buildings, # flats and size Vulnerability: • Type (material):
• Masonry, Reinforced concrete, other • Building height:
• Low 1-3, Medium 3-5, High >5 • Age of constrcution:
• < 1919, 1919-1945, 1946-1961, 1962-1981, 1982-1991, >1991
CLASSIFICATION OF RESIDENTIAL BUILDING STOCK IN ITALY FROM CENSUS DATA
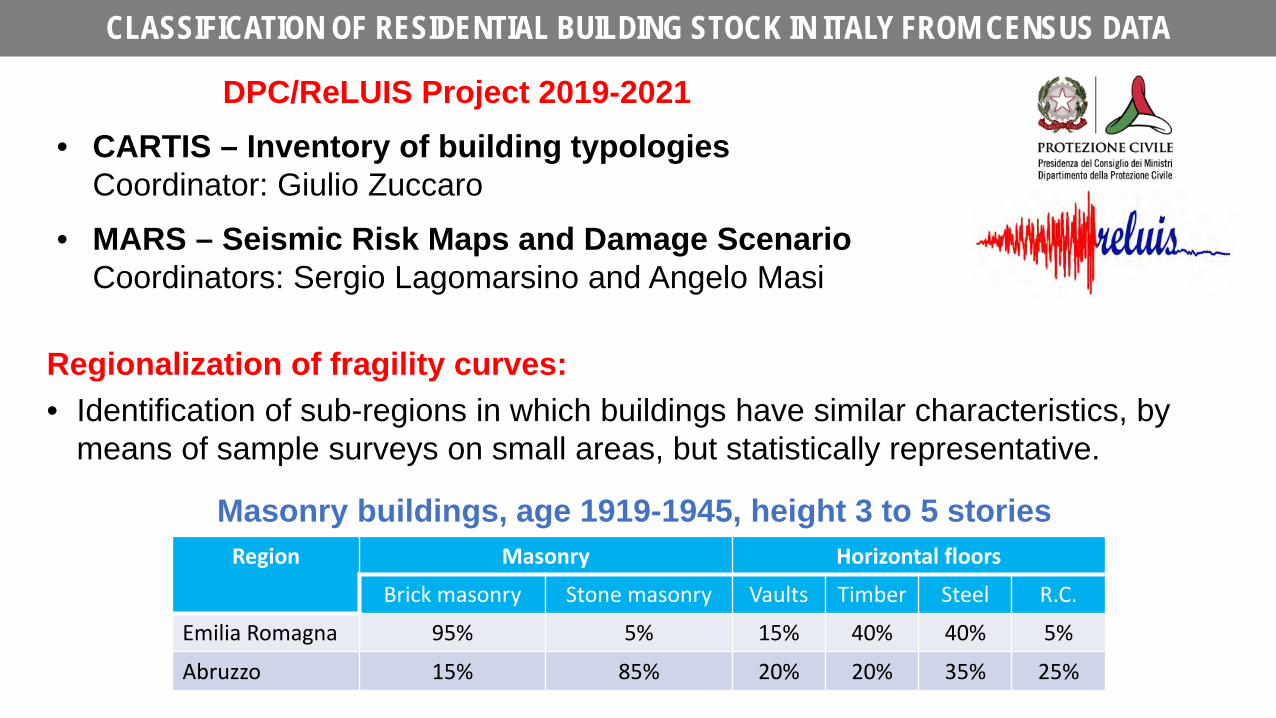
Regionalization of fragility curves: • Identification of sub-regions in which buildings have similar characteristics, by
means of sample surveys on small areas, but statistically representative.
Masonry buildings, age 1919-1945, height 3 to 5 stories
DPC/ReLUIS Project 2019-2021 • CARTIS – Inventory of building typologies
Coordinator: Giulio Zuccaro • MARS – Seismic Risk Maps and Damage Scenario
Coordinators: Sergio Lagomarsino and Angelo Masi
Region Masonry Horizontal floors
Brick masonry Stone masonry Vaults Timber Steel R.C.
Emilia Romagna 95% 5% 15% 40% 40% 5%
Abruzzo 15% 85% 20% 20% 35% 25%
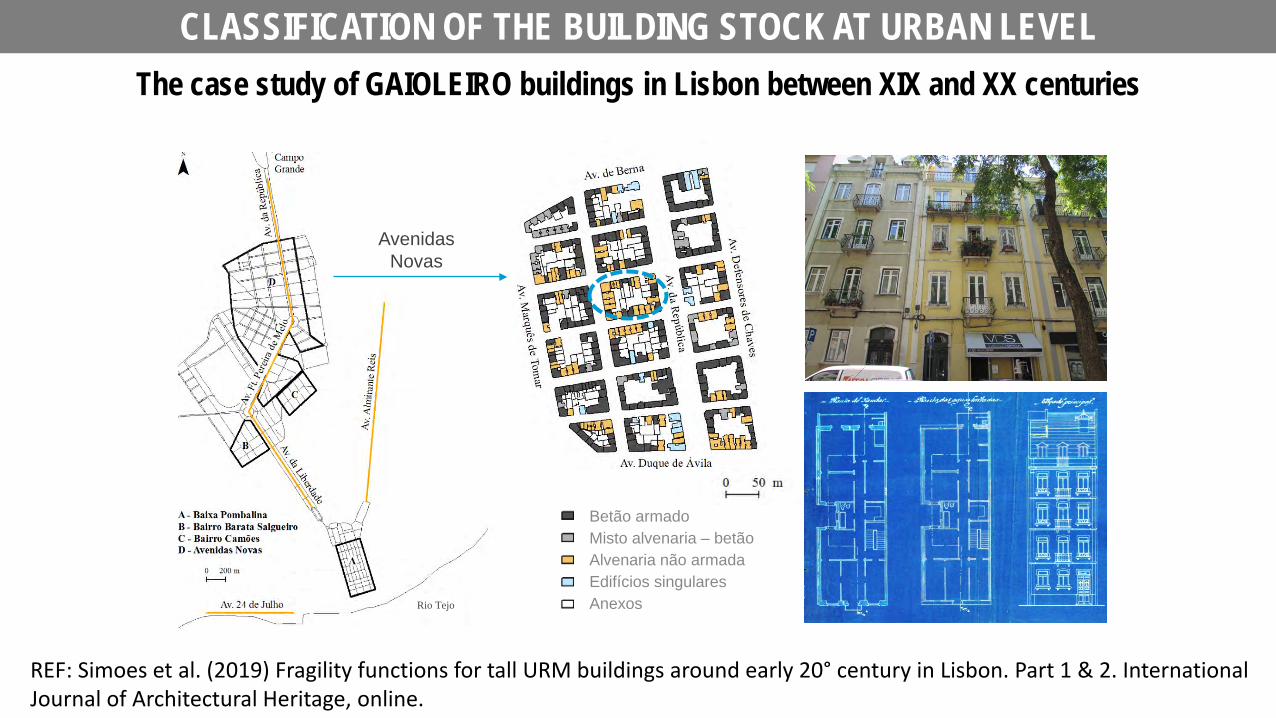
The case study of GAIOLEIRO buildings in Lisbon between XIX and XX centuries
Rio Tejo
Betão armado Misto alvenaria – betão Alvenaria não armada Edifícios singulares Anexos
Avenidas Novas
CLASSIFICATION OF THE BUILDING STOCK AT URBAN LEVEL
REF: Simoes et al. (2019) Fragility functions for tall URM buildings around early 20° century in Lisbon. Part 1 & 2. International Journal of Architectural Heritage, online.
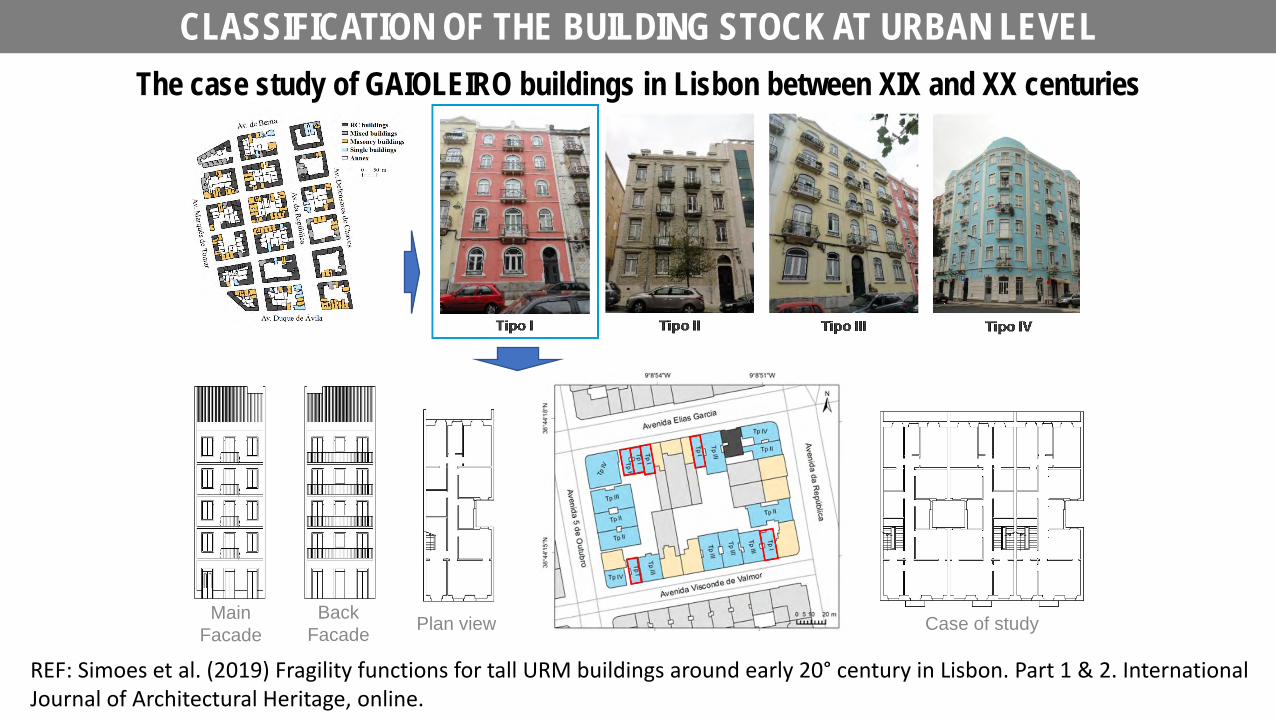
Main Facade
Back Facade Plan view Case of study
REF: Simoes et al. (2019) Fragility functions for tall URM buildings around early 20° century in Lisbon. Part 1 & 2. International Journal of Architectural Heritage, online.
The case study of GAIOLEIRO buildings in Lisbon between XIX and XX centuries CLASSIFICATION OF THE BUILDING STOCK AT URBAN LEVEL
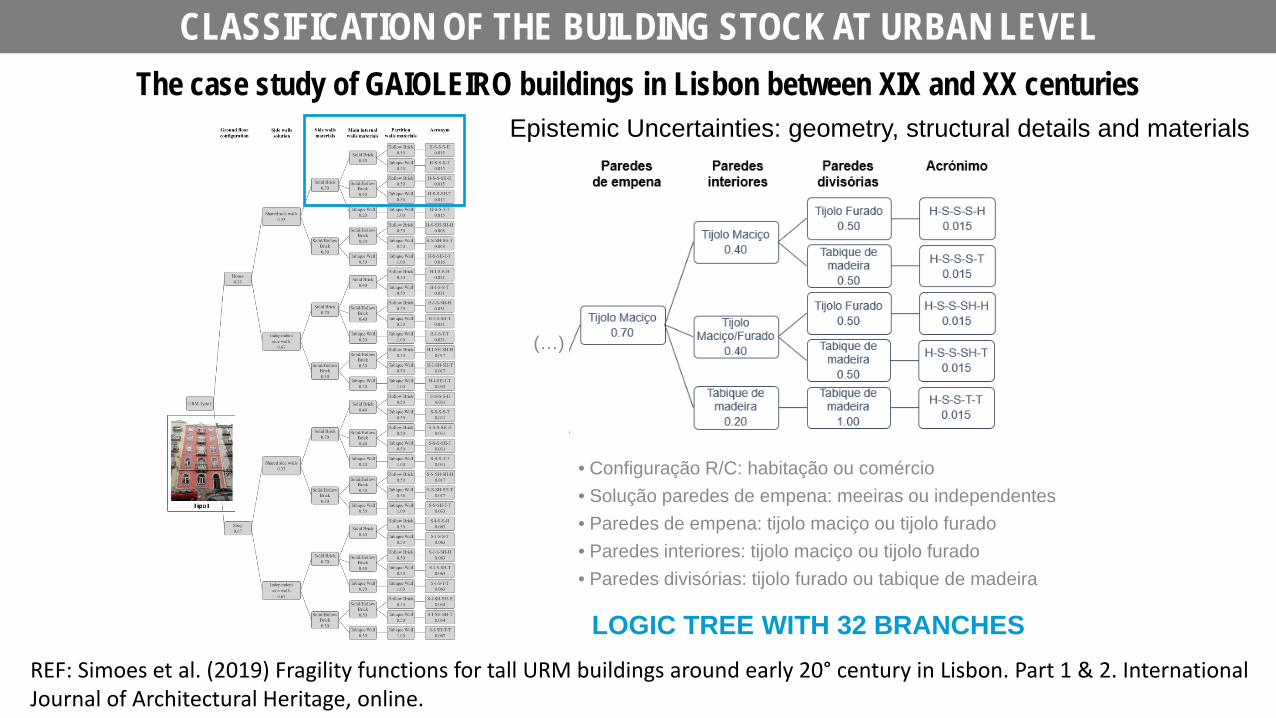
Epistemic Uncertainties: geometry, structural details and materials
(…)
• Configuração R/C: habitação ou comércio • Solução paredes de empena: meeiras ou independentes • Paredes de empena: tijolo maciço ou tijolo furado • Paredes interiores: tijolo maciço ou tijolo furado • Paredes divisórias: tijolo furado ou tabique de madeira
LOGIC TREE WITH 32 BRANCHES REF: Simoes et al. (2019) Fragility functions for tall URM buildings around early 20° century in Lisbon. Part 1 & 2. International Journal of Architectural Heritage, online.
The case study of GAIOLEIRO buildings in Lisbon between XIX and XX centuries CLASSIFICATION OF THE BUILDING STOCK AT URBAN LEVEL
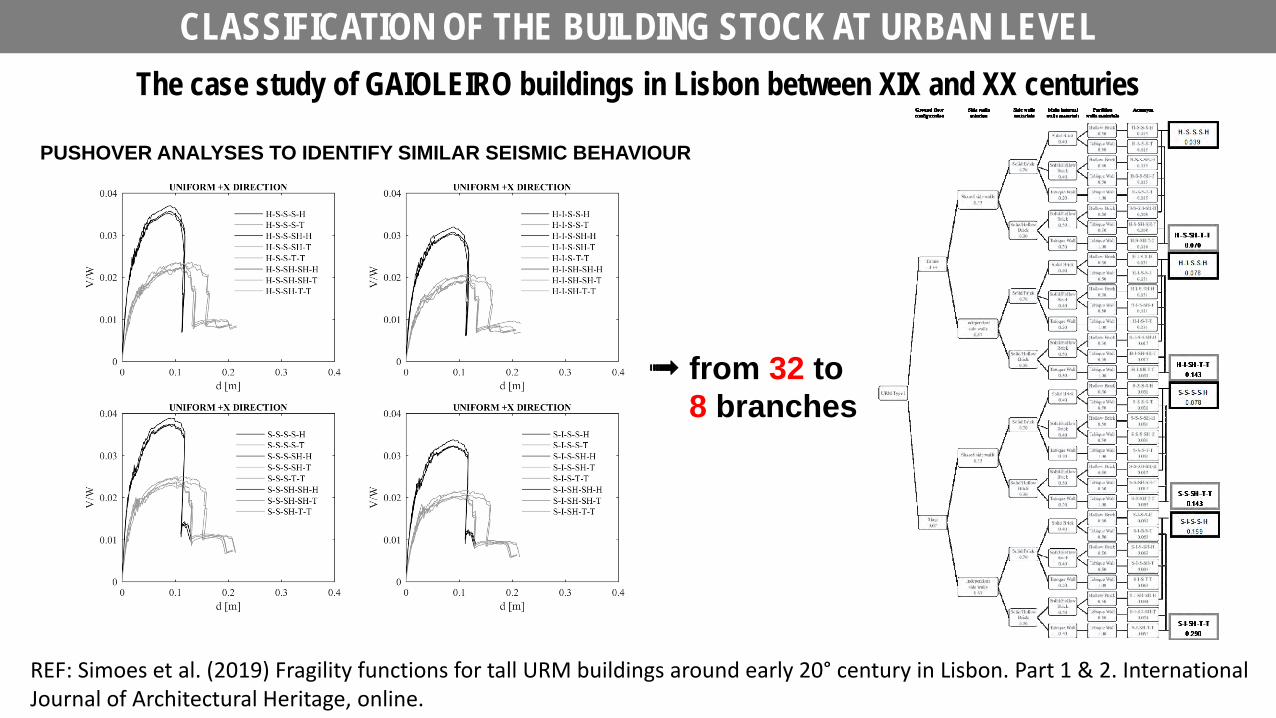
➟ from 32 to d 8 branches
REF: Simoes et al. (2019) Fragility functions for tall URM buildings around early 20° century in Lisbon. Part 1 & 2. International Journal of Architectural Heritage, online.
PUSHOVER ANALYSES TO IDENTIFY SIMILAR SEISMIC BEHAVIOUR
The case study of GAIOLEIRO buildings in Lisbon between XIX and XX centuries CLASSIFICATION OF THE BUILDING STOCK AT URBAN LEVEL
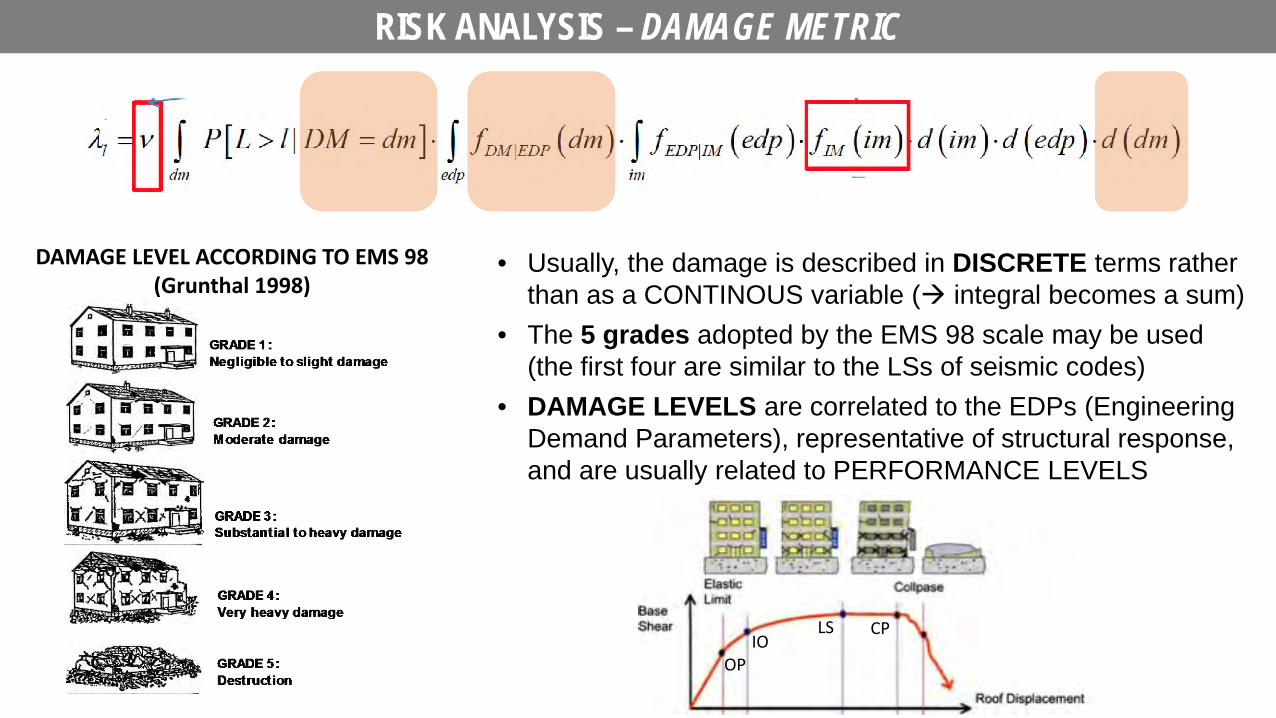
RISK ANALYSIS – DAMAGE METRIC
DAMAGE LEVEL ACCORDING TO EMS 98 (Grunthal 1998)
• Usually, the damage is described in DISCRETE terms rather than as a CONTINOUS variable ( integral becomes a sum)
• The 5 grades adopted by the EMS 98 scale may be used (the first four are similar to the LSs of seismic codes)
• DAMAGE LEVELS are correlated to the EDPs (Engineering Demand Parameters), representative of structural response, and are usually related to PERFORMANCE LEVELS
CP LS IO
OP
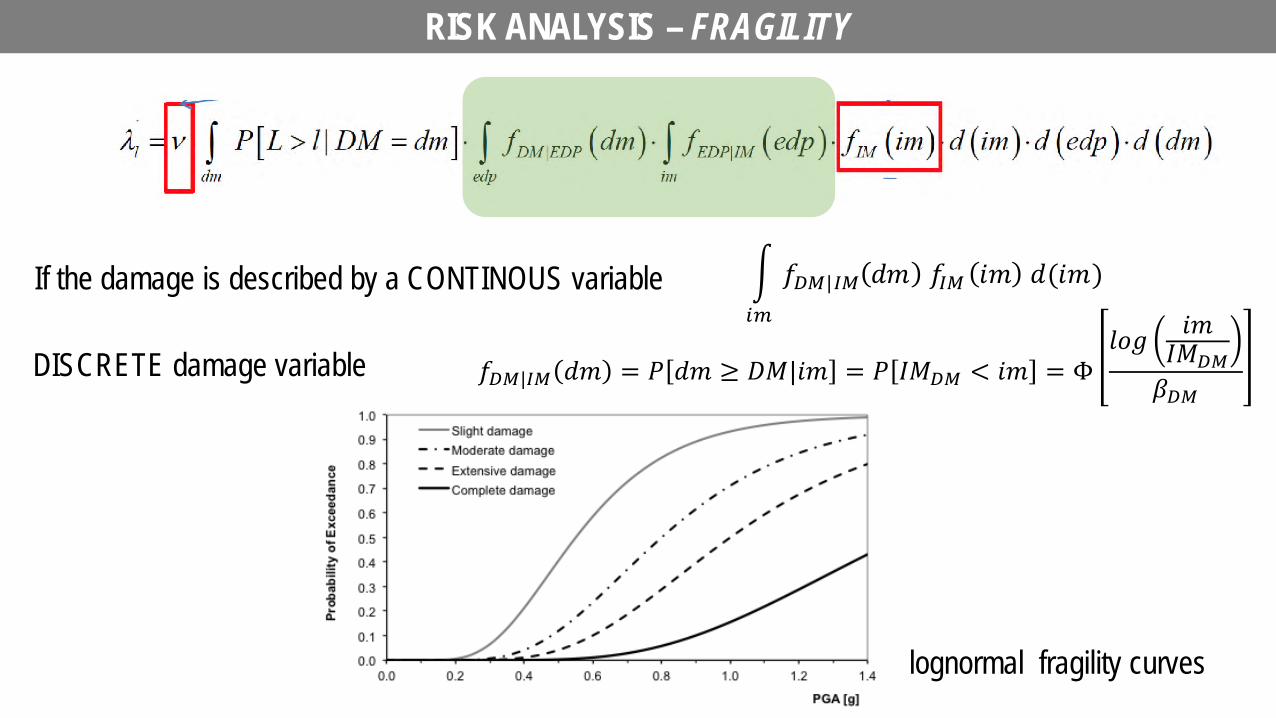
𝑓𝑓𝐷𝐷𝐷𝐷|𝐼𝐼𝐷𝐷 𝑑𝑑𝑚𝑚 = 𝑃𝑃 𝑑𝑑𝑚𝑚 ≥ 𝐷𝐷𝐷𝐷|𝑖𝑖𝑚𝑚 = 𝑃𝑃 𝐼𝐼𝐷𝐷𝐷𝐷𝐷𝐷 < 𝑖𝑖𝑚𝑚 = Φ𝑙𝑙𝑙𝑙𝑙𝑙 𝑖𝑖𝑚𝑚
𝐼𝐼𝐷𝐷𝐷𝐷𝐷𝐷𝛽𝛽𝐷𝐷𝐷𝐷
RISK ANALYSIS – FRAGILITY
If the damage is described by a CONTINOUS variable
DISCRETE damage variable
lognormal fragility curves
OUTLINE OF THE PRESENTATION
What do they depend on?
How are they obtained?
What do they represent?
How can they be used?
Practical issues & application to the Italian seismic risk assessment
Overview of methods & focus on macroseismic and empirical ones
Involved dispersions & influence on results of seismic risk analysis
Vulnerability as a component of seismic risk and loss assessment
FRAGILITY CURVES
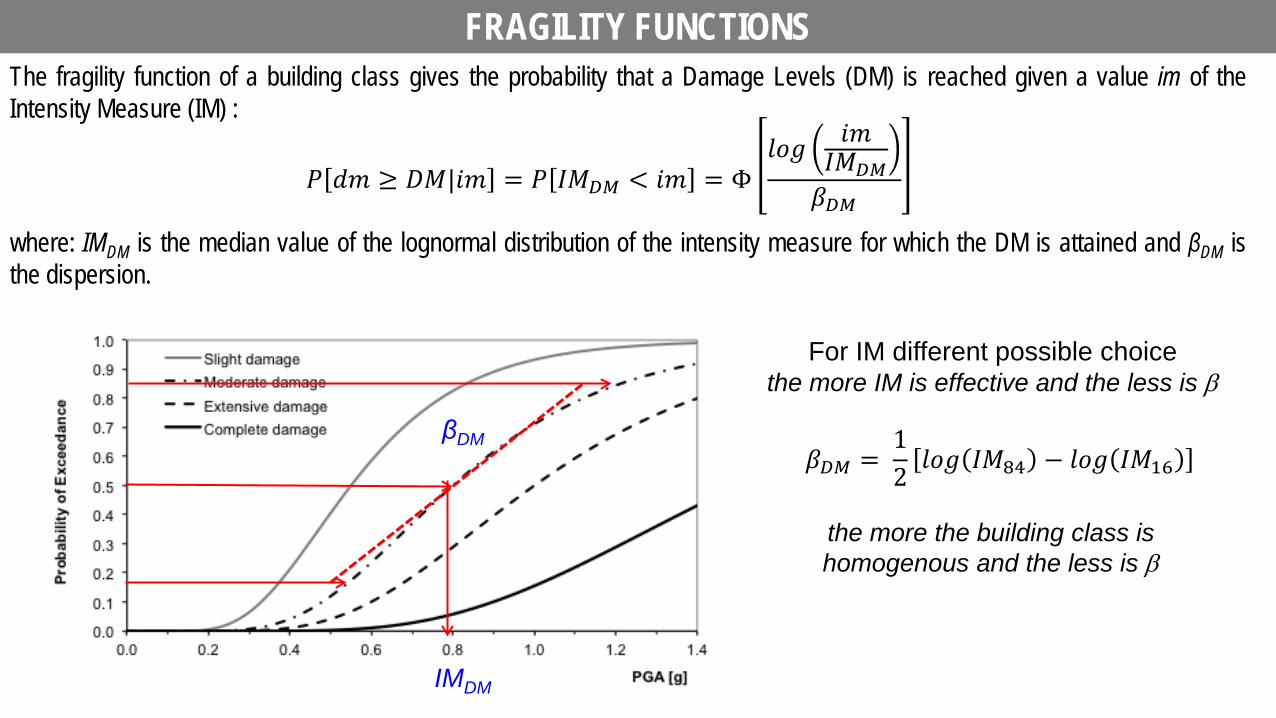
FRAGILITY FUNCTIONS
The fragility function of a building class gives the probability that a Damage Levels (DM) is reached given a value im of the Intensity Measure (IM) : where: IMDM is the median value of the lognormal distribution of the intensity measure for which the DM is attained and βDM is the dispersion.
βDM
IMDM
𝛽𝛽𝐷𝐷𝐷𝐷 = 12𝑙𝑙𝑙𝑙𝑙𝑙 𝐼𝐼𝐷𝐷84 − 𝑙𝑙𝑙𝑙𝑙𝑙 𝐼𝐼𝐷𝐷16
the more the building class is homogenous and the less is β
For IM different possible choice the more IM is effective and the less is β
𝑃𝑃 𝑑𝑑𝑚𝑚 ≥ 𝐷𝐷𝐷𝐷|𝑖𝑖𝑚𝑚 = 𝑃𝑃 𝐼𝐼𝐷𝐷𝐷𝐷𝐷𝐷 < 𝑖𝑖𝑚𝑚 = Φ𝑙𝑙𝑙𝑙𝑙𝑙 𝑖𝑖𝑚𝑚
𝐼𝐼𝐷𝐷𝐷𝐷𝐷𝐷𝛽𝛽𝐷𝐷𝐷𝐷
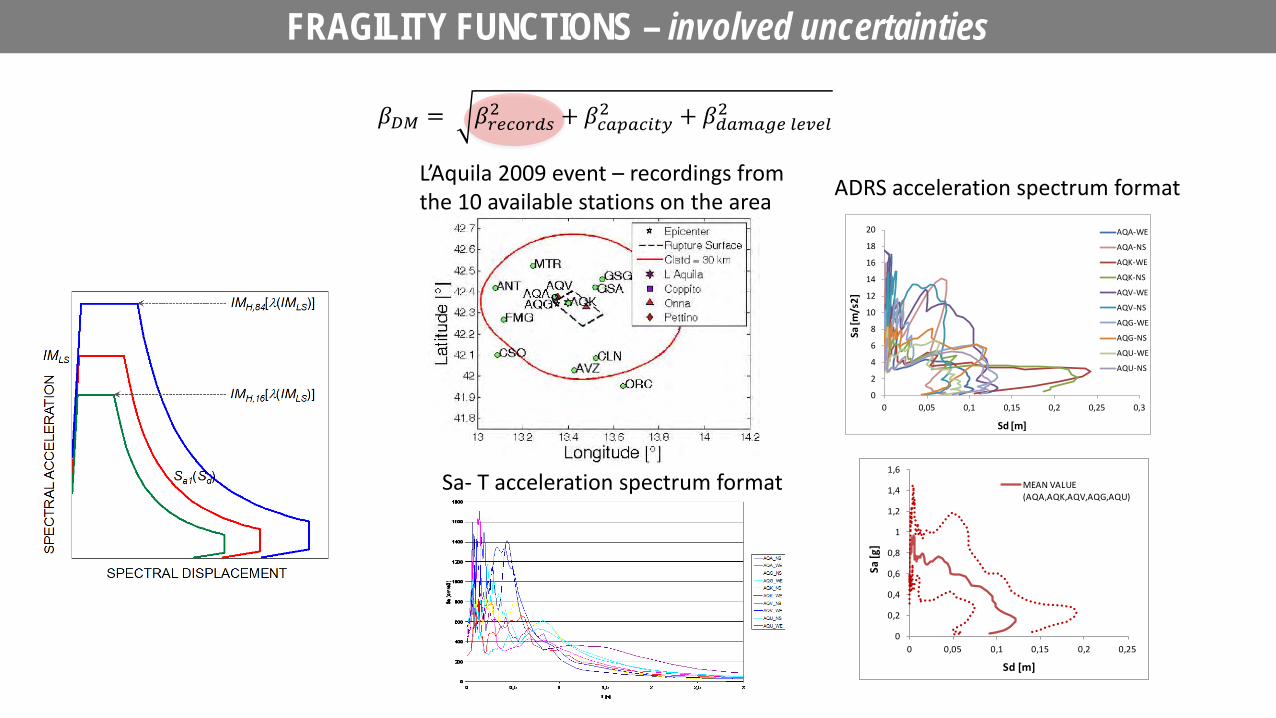
𝛽𝛽𝐷𝐷𝐷𝐷 = 𝛽𝛽𝑟𝑟𝑟𝑟𝑟𝑟𝑜𝑜𝑟𝑟𝑜𝑜𝑜𝑜2 + 𝛽𝛽𝑟𝑟𝑐𝑐𝑐𝑐𝑐𝑐𝑟𝑟𝑐𝑐𝑐𝑐𝑐𝑐2 + 𝛽𝛽𝑜𝑜𝑐𝑐𝑑𝑑𝑐𝑐𝑑𝑑𝑟𝑟 𝑙𝑙𝑟𝑟𝑙𝑙𝑟𝑟𝑙𝑙2
0
2
4
6
8
10
12
14
16
18
20
0 0,05 0,1 0,15 0,2 0,25 0,3
Sa [m
/s2]
Sd [m]
AQA-WE
AQA-NS
AQK-WE
AQK-NS
AQV-WE
AQV-NS
AQG-WE
AQG-NS
AQU-WE
AQU-NS
0
0,2
0,4
0,6
0,8
1
1,2
1,4
1,6
0 0,05 0,1 0,15 0,2 0,25
Sa [g
]
Sd [m]
MEAN VALUE (AQA,AQK,AQV,AQG,AQU)
Sa- T acceleration spectrum format
ADRS acceleration spectrum format L’Aquila 2009 event – recordings from the 10 available stations on the area
FRAGILITY FUNCTIONS – involved uncertainties

Sd [m]
Variability of parameters (mechanical, geometric, …) characteristic of the WHOLE CLASS OF BUILDINGS
fm [Mpa] E [Mpa]
Single structure at a given site
Classes of buildings with a similar seismic behavior
REGI
ONAL
SCA
LE
SING
LE B
UILD
ING
FRAGILITY FUNCTIONS – involved uncertainties
𝛽𝛽𝐷𝐷𝐷𝐷 = 𝛽𝛽𝑟𝑟𝑟𝑟𝑟𝑟𝑜𝑜𝑟𝑟𝑜𝑜𝑜𝑜2 + 𝛽𝛽𝑟𝑟𝑐𝑐𝑐𝑐𝑐𝑐𝑟𝑟𝑐𝑐𝑐𝑐𝑐𝑐2 + 𝛽𝛽𝑜𝑜𝑐𝑐𝑑𝑑𝑐𝑐𝑑𝑑𝑟𝑟 𝑙𝑙𝑟𝑟𝑙𝑙𝑟𝑟𝑙𝑙2
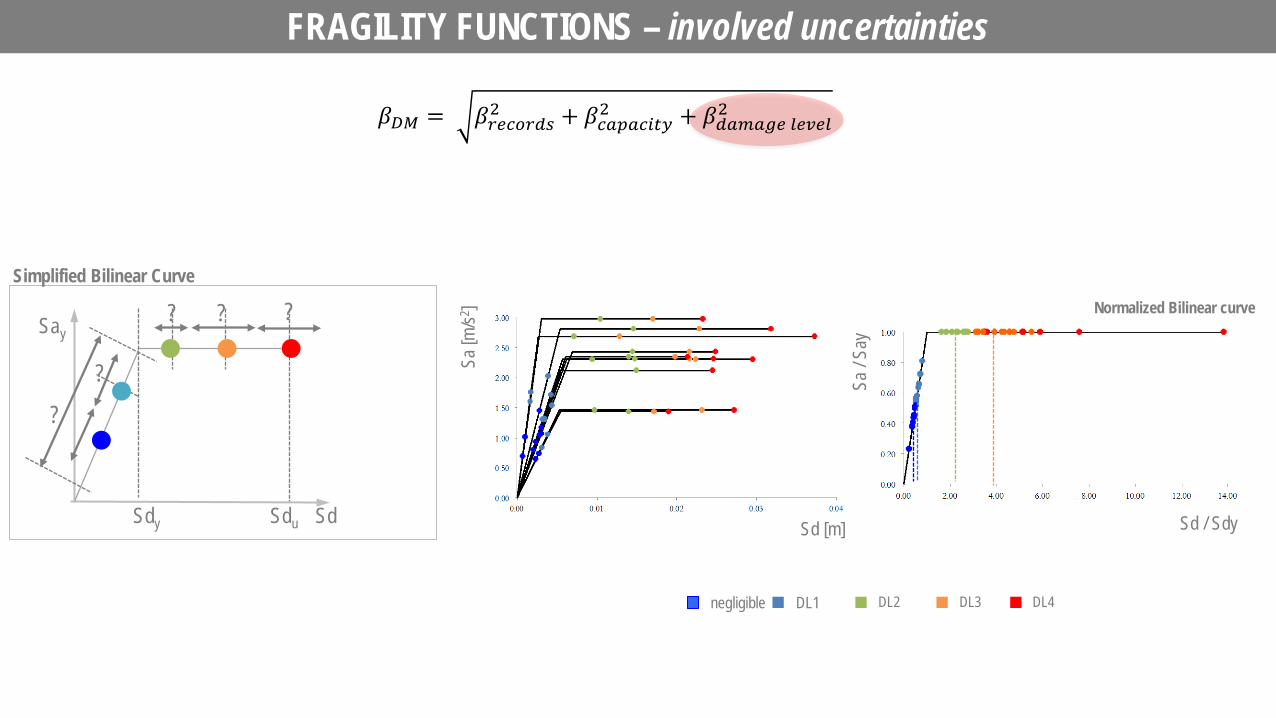
Sd
Simplified Bilinear Curve
Say
Sdu Sdy
?
?
? ?
Sd [m]
Sa [m
/s2 ]
Sd / Sdy
Sa /
Say
Normalized Bilinear curve
negligible DL3 DL1 DL2 DL4
FRAGILITY FUNCTIONS – involved uncertainties
?
𝛽𝛽𝐷𝐷𝐷𝐷 = 𝛽𝛽𝑟𝑟𝑟𝑟𝑟𝑟𝑜𝑜𝑟𝑟𝑜𝑜𝑜𝑜2 + 𝛽𝛽𝑟𝑟𝑐𝑐𝑐𝑐𝑐𝑐𝑟𝑟𝑐𝑐𝑐𝑐𝑐𝑐2 + 𝛽𝛽𝑜𝑜𝑐𝑐𝑑𝑑𝑐𝑐𝑑𝑑𝑟𝑟 𝑙𝑙𝑟𝑟𝑙𝑙𝑟𝑟𝑙𝑙2
im
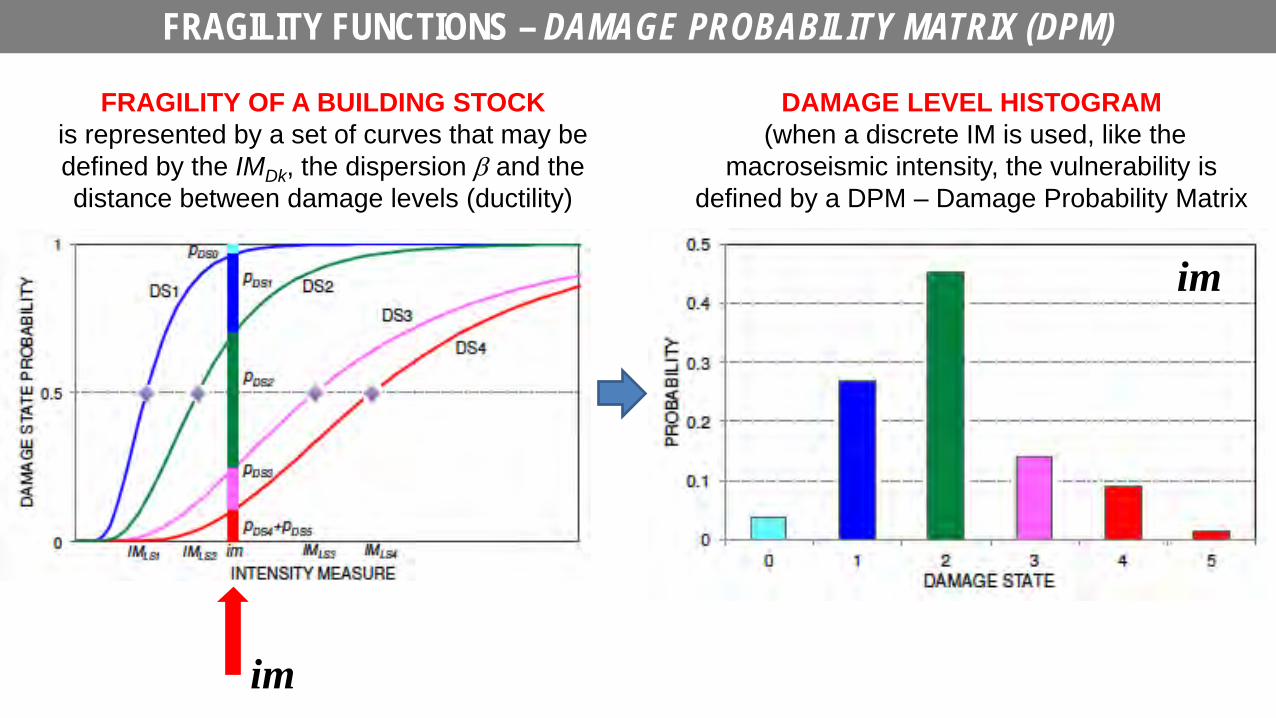
FRAGILITY FUNCTIONS – DAMAGE PROBABILITY MATRIX (DPM)
DAMAGE LEVEL HISTOGRAM (when a discrete IM is used, like the
macroseismic intensity, the vulnerability is defined by a DPM – Damage Probability Matrix
FRAGILITY OF A BUILDING STOCK is represented by a set of curves that may be defined by the IMDk, the dispersion β and the distance between damage levels (ductility)
im
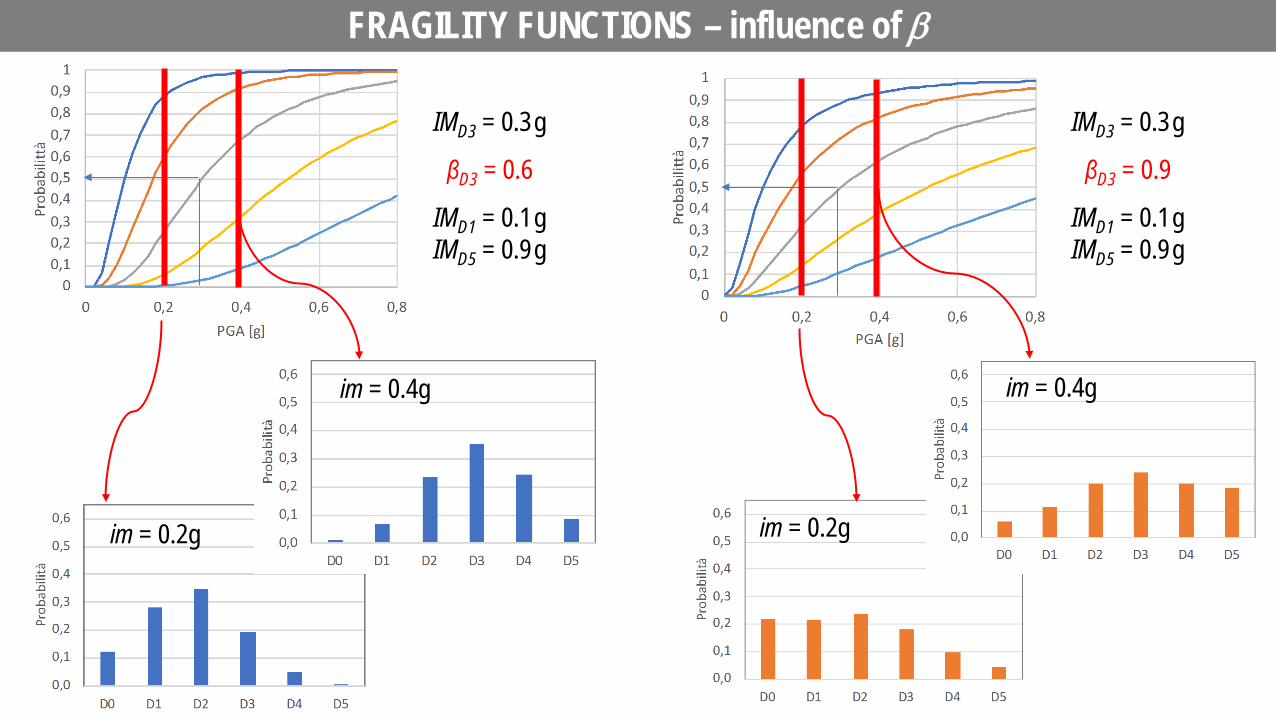
IMD3 = 0.3 g
βD3 = 0.6
IMD1 = 0.1 g IMD5 = 0.9 g
im = 0.2g
im = 0.4g
FRAGILITY FUNCTIONS – influence of β
IMD3 = 0.3 g
βD3 = 0.9
IMD1 = 0.1 g IMD5 = 0.9 g
im = 0.2g
im = 0.4g
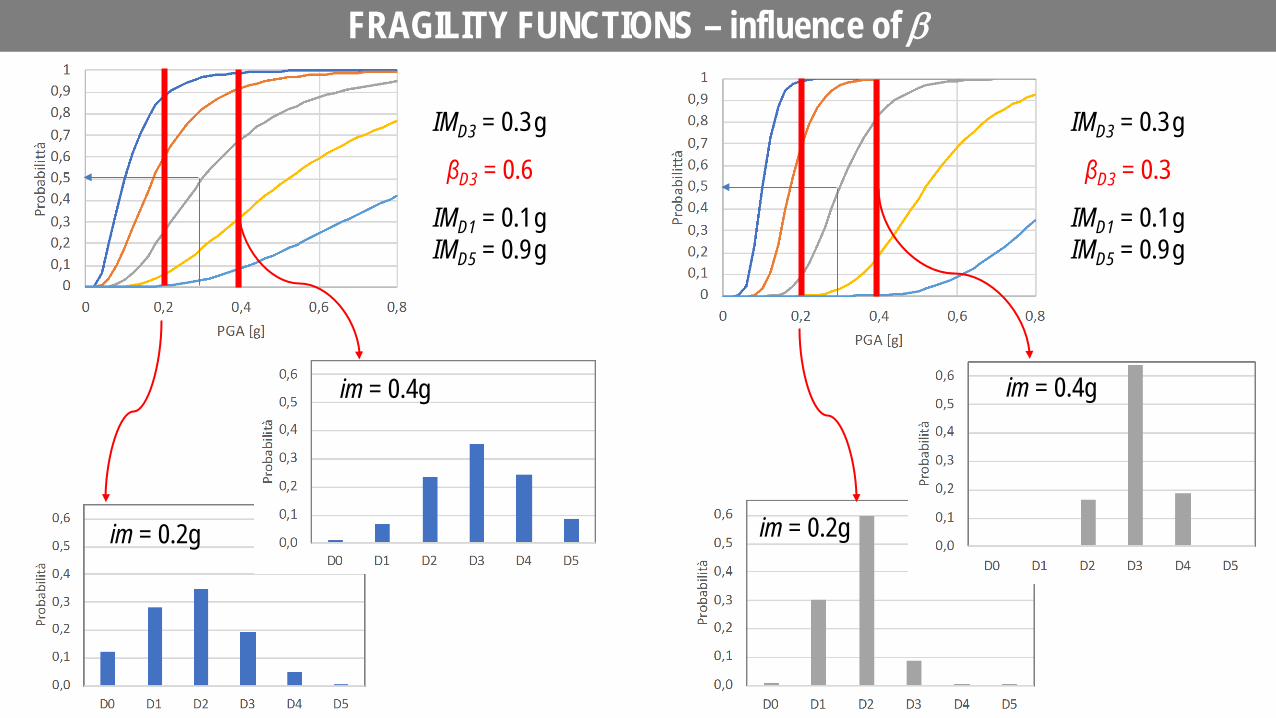
IMD3 = 0.3 g
βD3 = 0.6
IMD1 = 0.1 g IMD5 = 0.9 g
im = 0.2g
im = 0.4g
IMD3 = 0.3 g
βD3 = 0.3
IMD1 = 0.1 g IMD5 = 0.9 g
im = 0.2g
im = 0.4g
FRAGILITY FUNCTIONS – influence of β
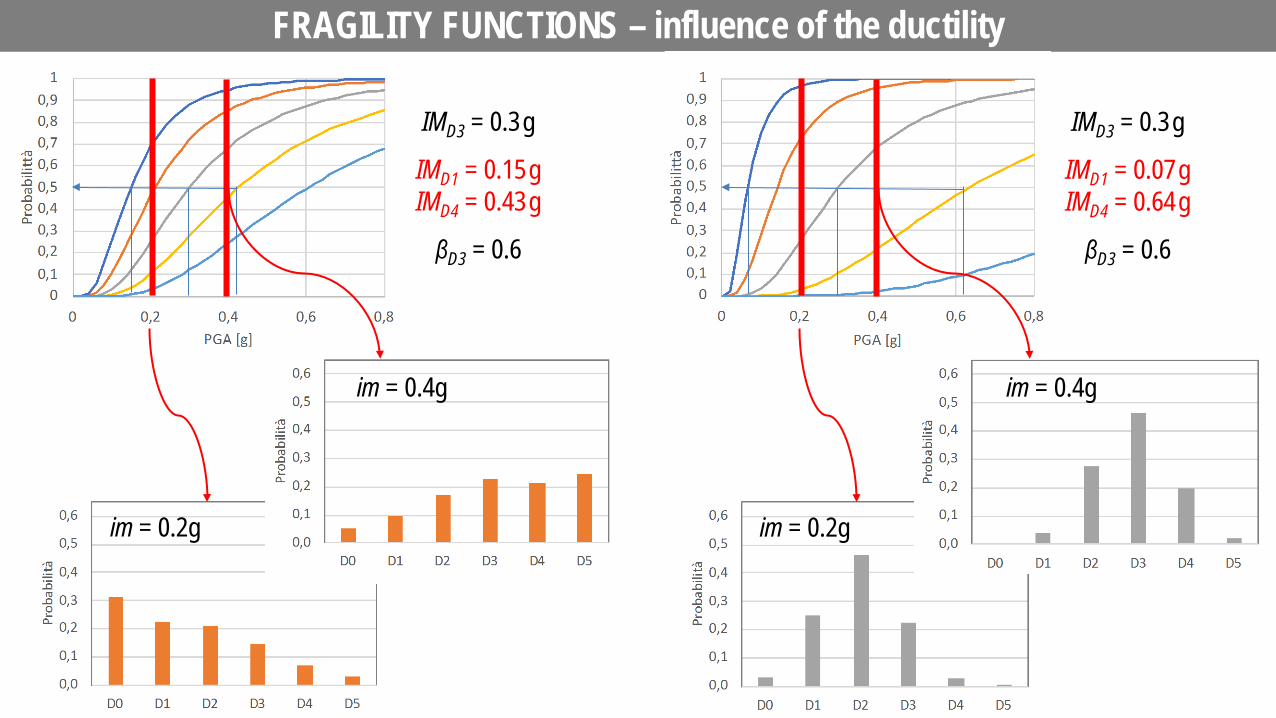
IMD3 = 0.3 g
IMD1 = 0.15 g IMD4 = 0.43 g
βD3 = 0.6
im = 0.2g
im = 0.4g
FRAGILITY FUNCTIONS – influence of the ductility
IMD3 = 0.3 g
IMD1 = 0.07 g IMD4 = 0.64 g
βD3 = 0.6
im = 0.2g
im = 0.4g
OUTLINE OF THE PRESENTATION
What do they depend on?
How are they obtained?
What do they represent?
How can they be used?
Practical issues & application to the Italian seismic risk assessment
Overview of methods & focus on macroseismic and empirical ones
Involved dispersions & influence on results of seismic risk analysis
Vulnerability as a component of seismic risk and loss assessment
FRAGILITY CURVES
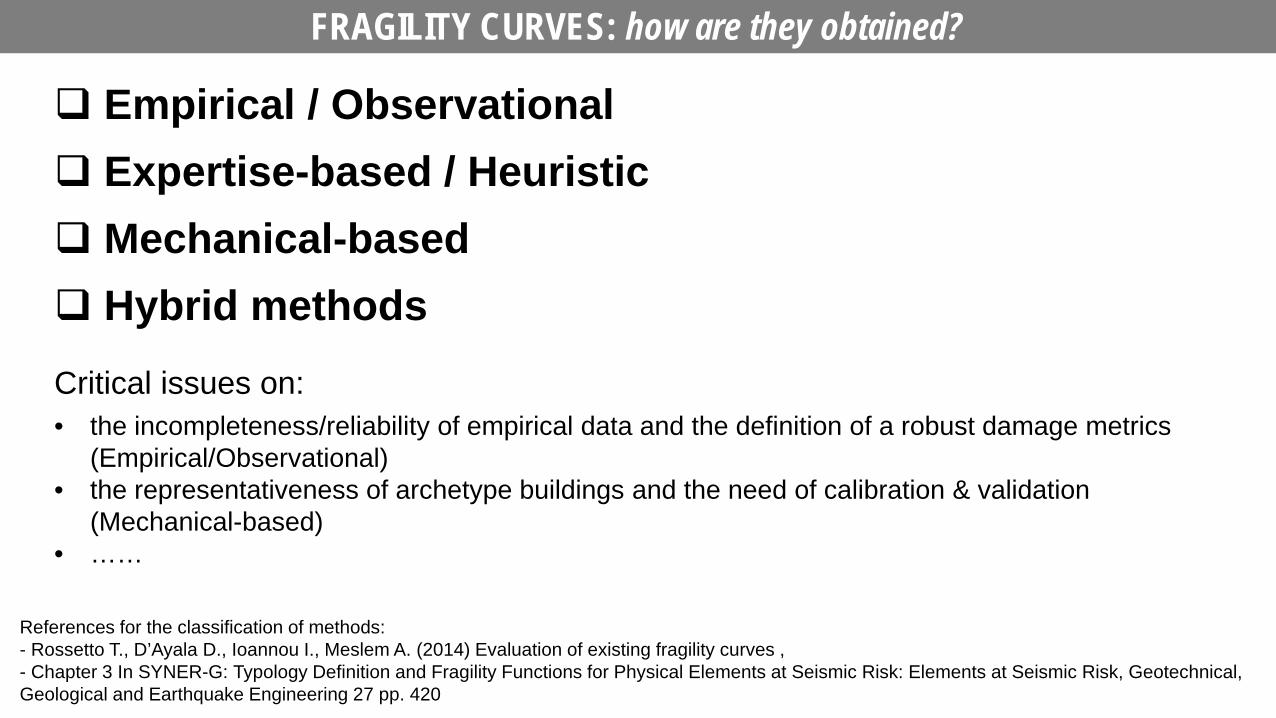
Empirical / Observational Expertise-based / Heuristic Mechanical-based Hybrid methods
FRAGILITY CURVES: how are they obtained?
Critical issues on: • the incompleteness/reliability of empirical data and the definition of a robust damage metrics
(Empirical/Observational) • the representativeness of archetype buildings and the need of calibration & validation
(Mechanical-based) • ……
References for the classification of methods: - Rossetto T., D’Ayala D., Ioannou I., Meslem A. (2014) Evaluation of existing fragility curves , - Chapter 3 In SYNER-G: Typology Definition and Fragility Functions for Physical Elements at Seismic Risk: Elements at Seismic Risk, Geotechnical, Geological and Earthquake Engineering 27 pp. 420
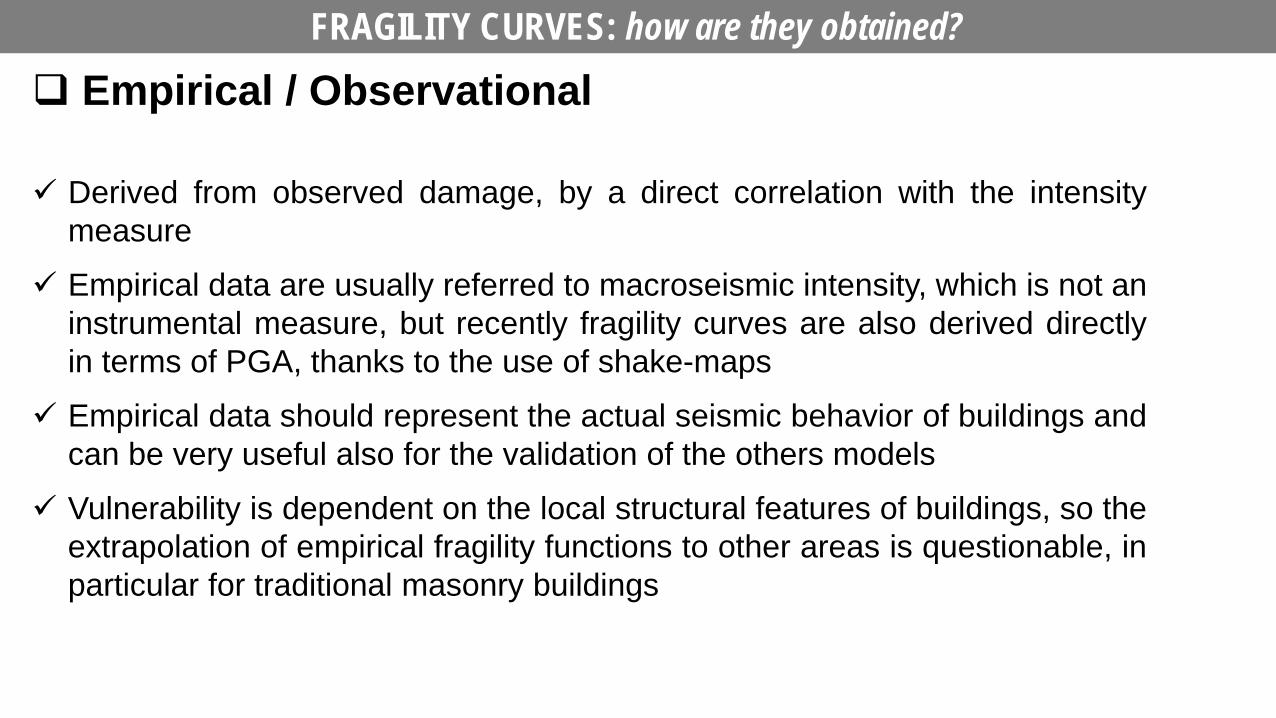
FRAGILITY CURVES: how are they obtained?
Empirical / Observational
Derived from observed damage, by a direct correlation with the intensity measure
Empirical data are usually referred to macroseismic intensity, which is not an instrumental measure, but recently fragility curves are also derived directly in terms of PGA, thanks to the use of shake-maps
Empirical data should represent the actual seismic behavior of buildings and can be very useful also for the validation of the others models
Vulnerability is dependent on the local structural features of buildings, so the extrapolation of empirical fragility functions to other areas is questionable, in particular for traditional masonry buildings
FRAGILITY CURVES: how are they obtained?
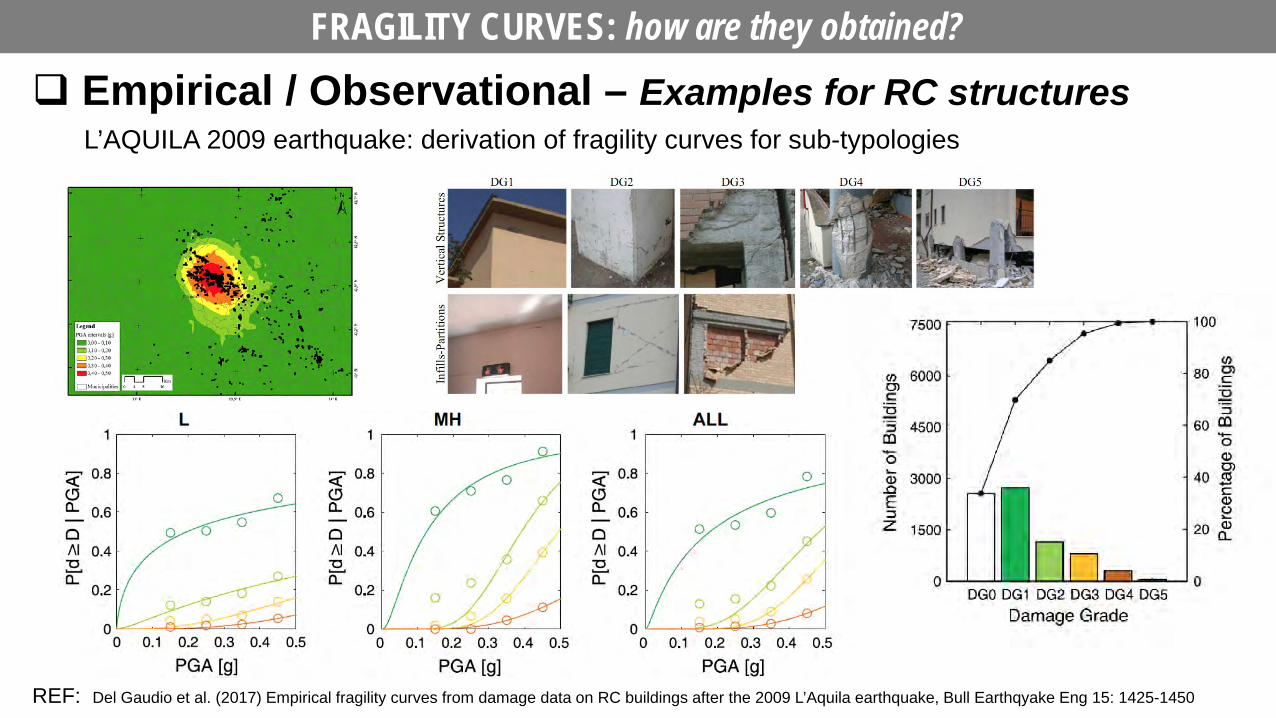
Empirical / Observational – Examples for RC structures
REF: Del Gaudio et al. (2017) Empirical fragility curves from damage data on RC buildings after the 2009 L’Aquila earthquake, Bull Earthqyake Eng 15: 1425-1450
L’AQUILA 2009 earthquake: derivation of fragility curves for sub-typologies
FRAGILITY CURVES: how are they obtained?
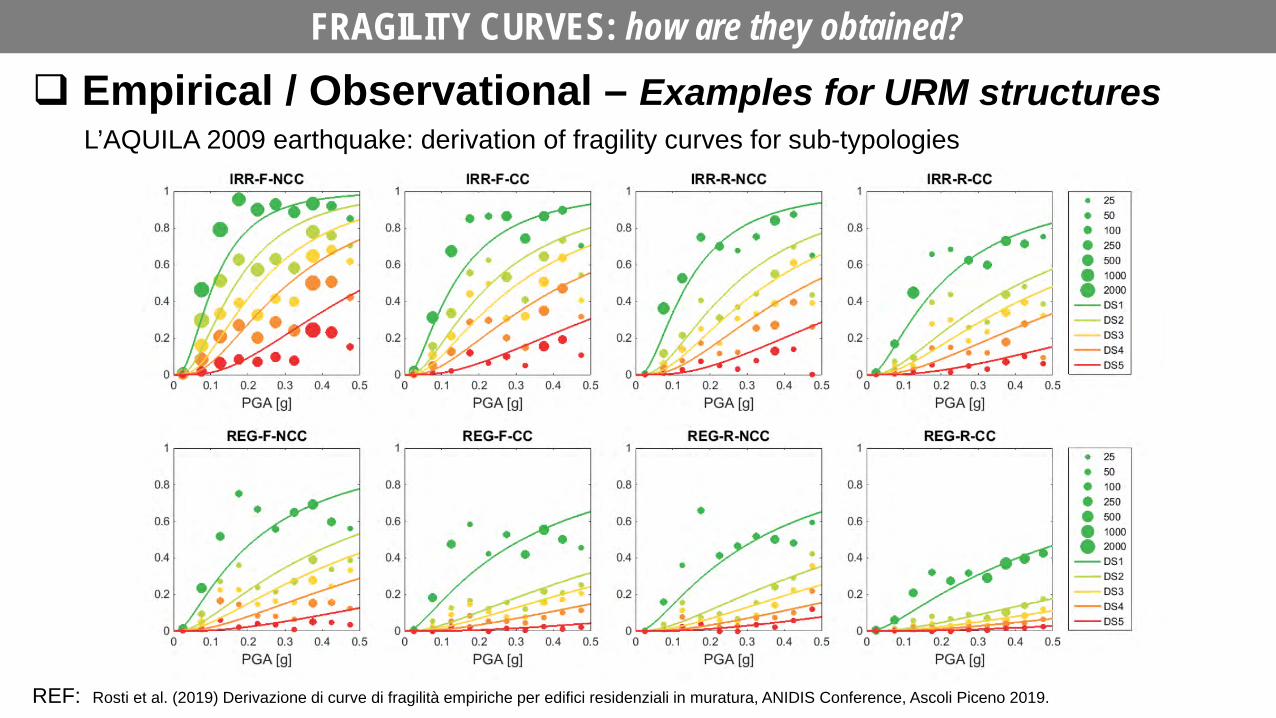
Empirical / Observational – Examples for URM structures
REF: Rosti et al. (2019) Derivazione di curve di fragilità empiriche per edifici residenziali in muratura, ANIDIS Conference, Ascoli Piceno 2019.
L’AQUILA 2009 earthquake: derivation of fragility curves for sub-typologies
FRAGILITY CURVES: how are they obtained?
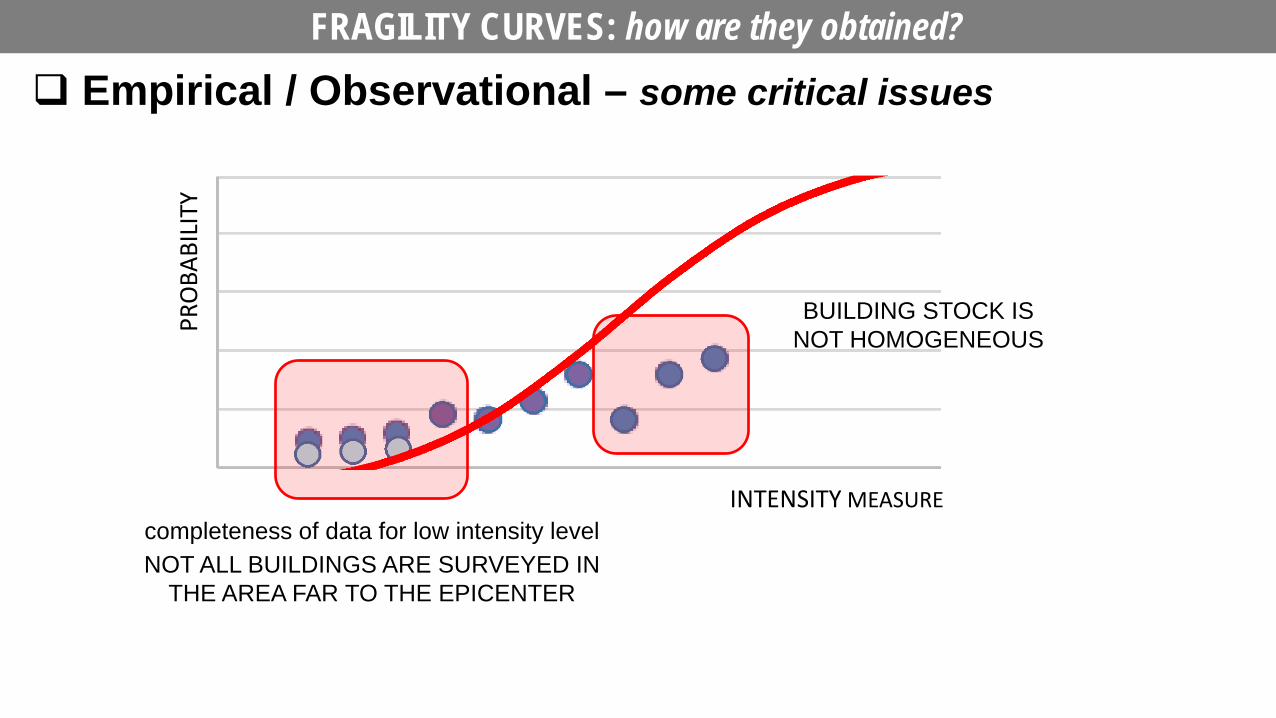
Empirical / Observational – some critical issues
INTENSITY MEASURE
PRO
BABI
LITY
completeness of data for low intensity level
NOT ALL BUILDINGS ARE SURVEYED IN THE AREA FAR TO THE EPICENTER
BUILDING STOCK IS NOT HOMOGENEOUS
FRAGILITY CURVES: how are they obtained?
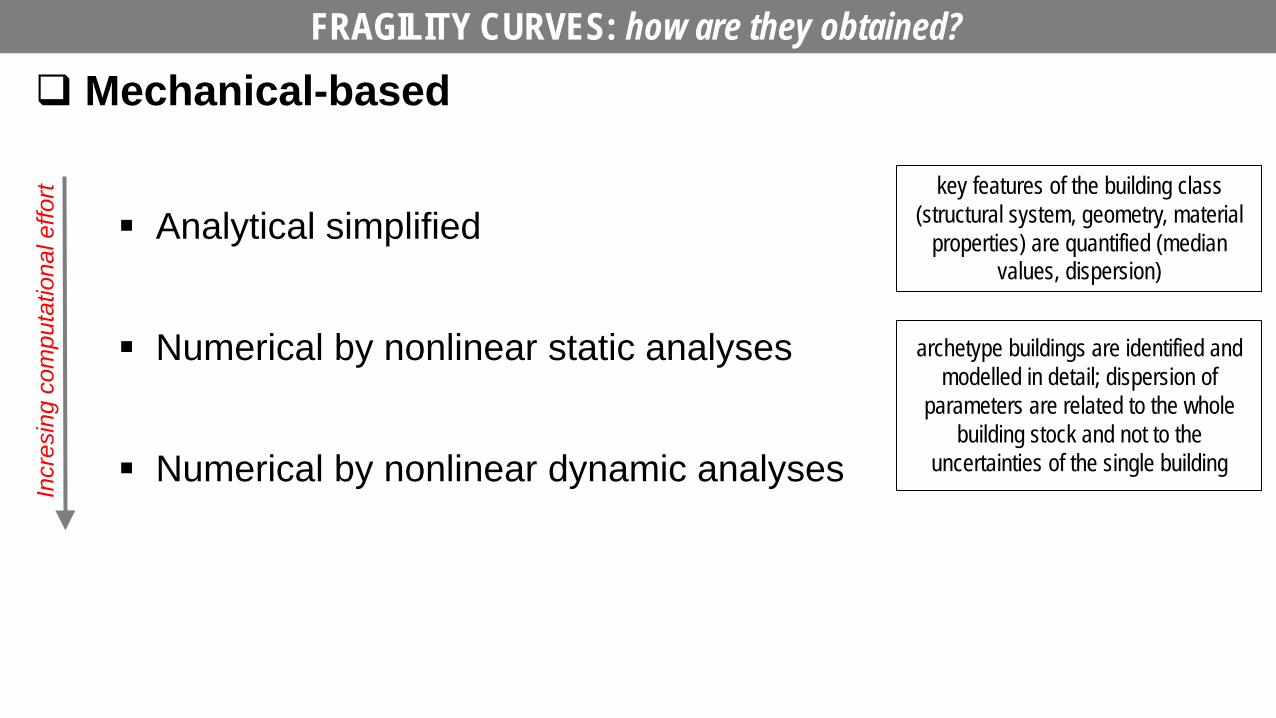
Mechanical-based
Analytical simplified
Numerical by nonlinear static analyses
Numerical by nonlinear dynamic analyses
archetype buildings are identified and modelled in detail; dispersion of
parameters are related to the whole building stock and not to the
uncertainties of the single building
key features of the building class (structural system, geometry, material
properties) are quantified (median values, dispersion)
Incr
esin
g co
mpu
tatio
nal e
ffort
FRAGILITY CURVES: how are they obtained?
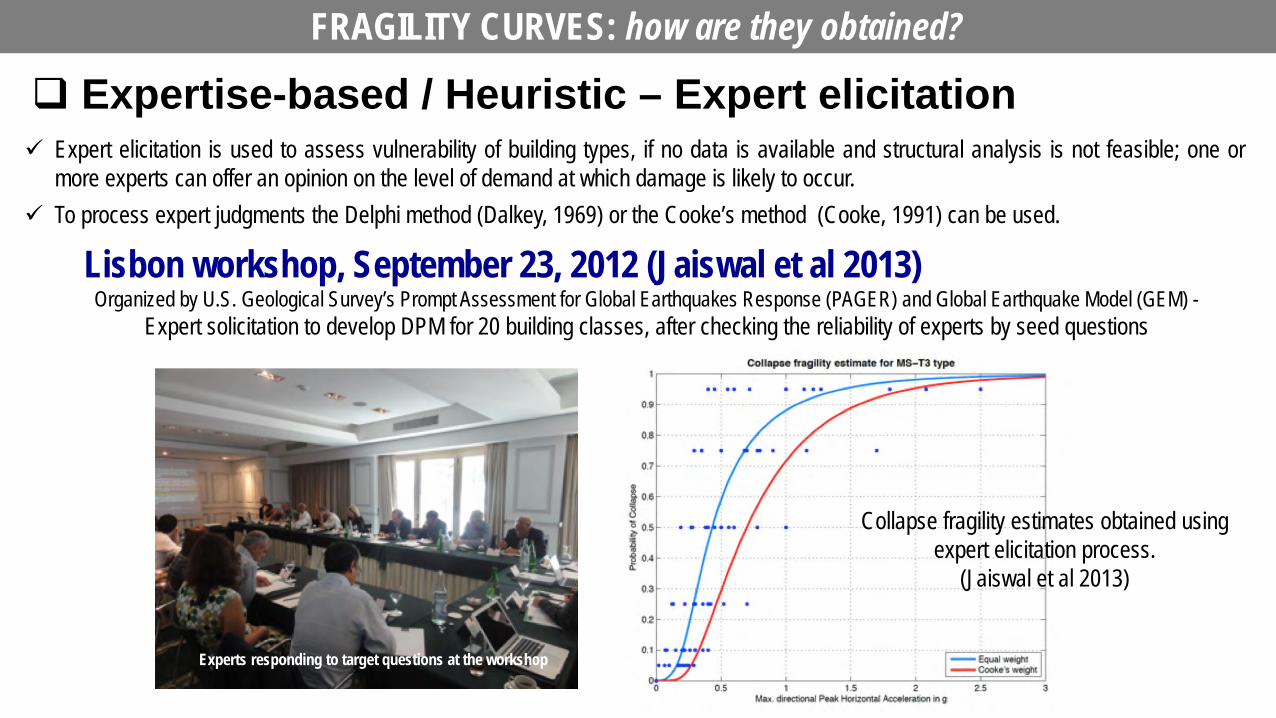
Expertise-based / Heuristic – Expert elicitation Expert elicitation is used to assess vulnerability of building types, if no data is available and structural analysis is not feasible; one or
more experts can offer an opinion on the level of demand at which damage is likely to occur. To process expert judgments the Delphi method (Dalkey, 1969) or the Cooke’s method (Cooke, 1991) can be used.
Collapse fragility estimates obtained using expert elicitation process.
(Jaiswal et al 2013)
Experts responding to target questions at the workshop
Lisbon workshop, September 23, 2012 (Jaiswal et al 2013) Organized by U.S. Geological Survey’s Prompt Assessment for Global Earthquakes Response (PAGER) and Global Earthquake Model (GEM) -
Expert solicitation to develop DPM for 20 building classes, after checking the reliability of experts by seed questions
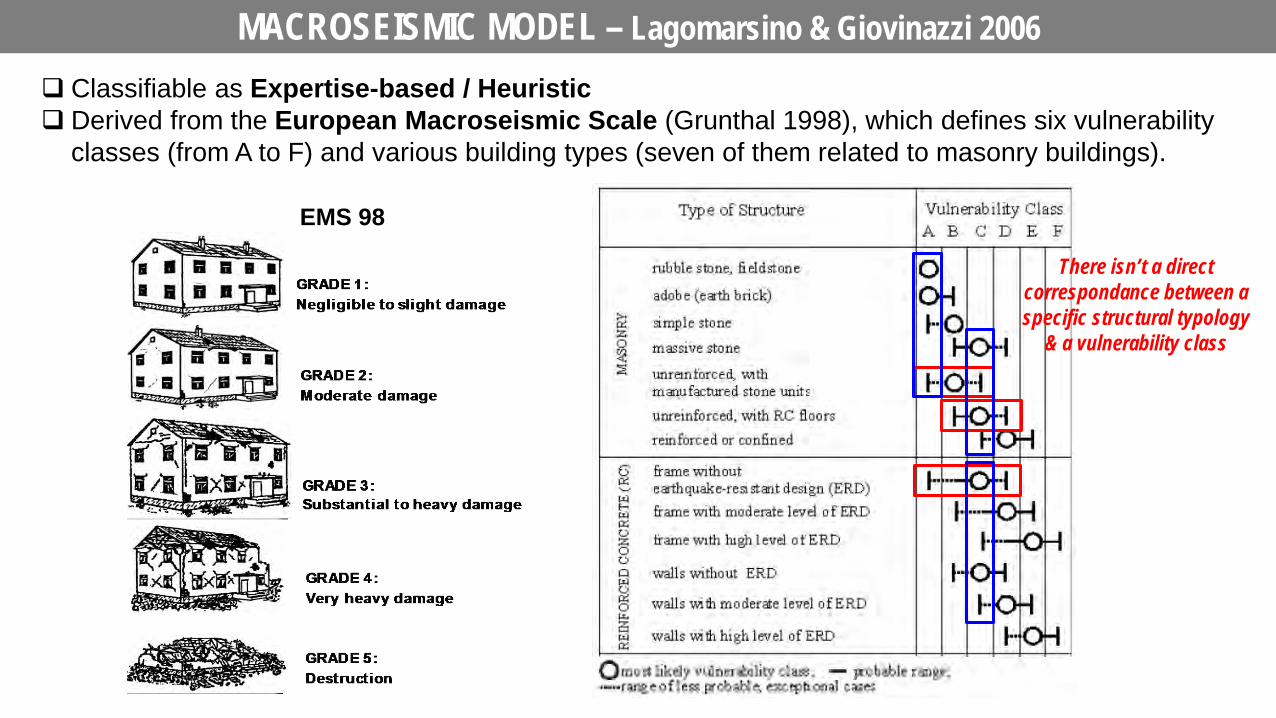
MACROSEISMIC MODEL – Lagomarsino & Giovinazzi 2006 Classifiable as Expertise-based / Heuristic Derived from the European Macroseismic Scale (Grunthal 1998), which defines six vulnerability
classes (from A to F) and various building types (seven of them related to masonry buildings).
EMS 98
There isn’t a direct correspondance between a specific structural typology
& a vulnerability class
MACROSEISMIC MODEL – Lagomarsino & Giovinazzi 2006
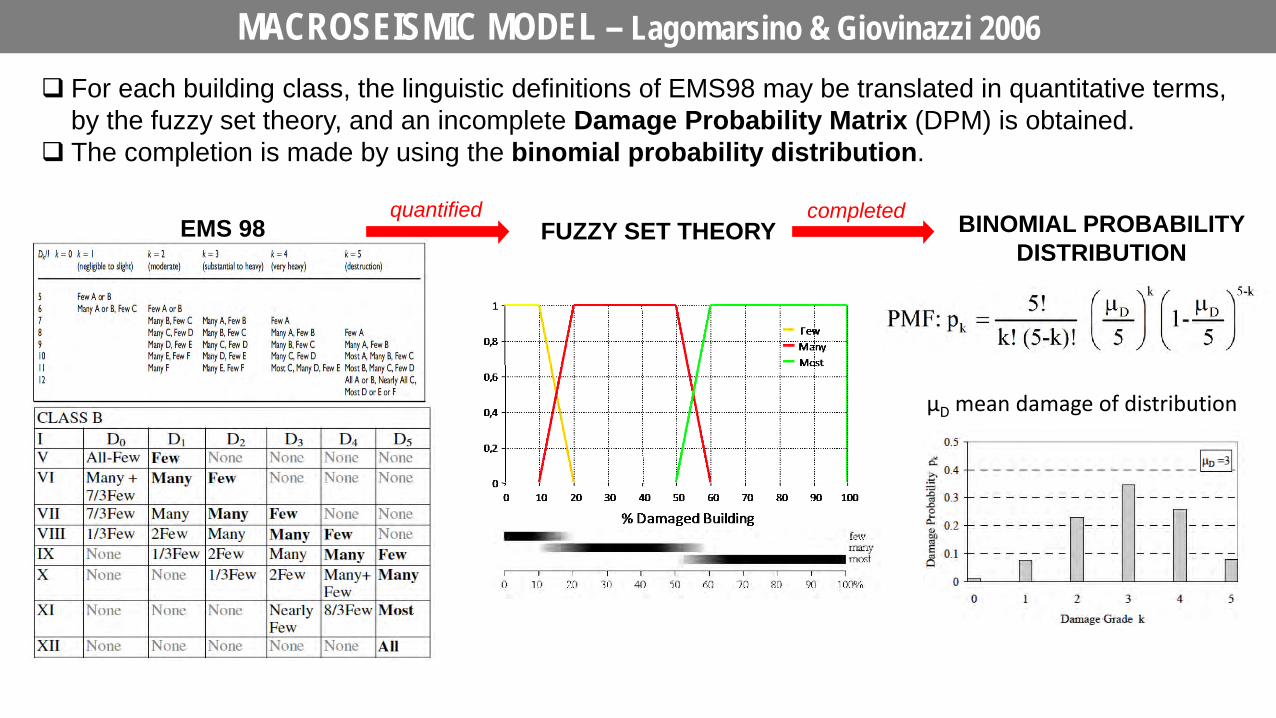
EMS 98
μD mean damage of distribution
FUZZY SET THEORY BINOMIAL PROBABILITY DISTRIBUTION
quantified completed
For each building class, the linguistic definitions of EMS98 may be translated in quantitative terms, by the fuzzy set theory, and an incomplete Damage Probability Matrix (DPM) is obtained.
The completion is made by using the binomial probability distribution.
MACROSEISMIC MODEL – Lagomarsino & Giovinazzi 2006
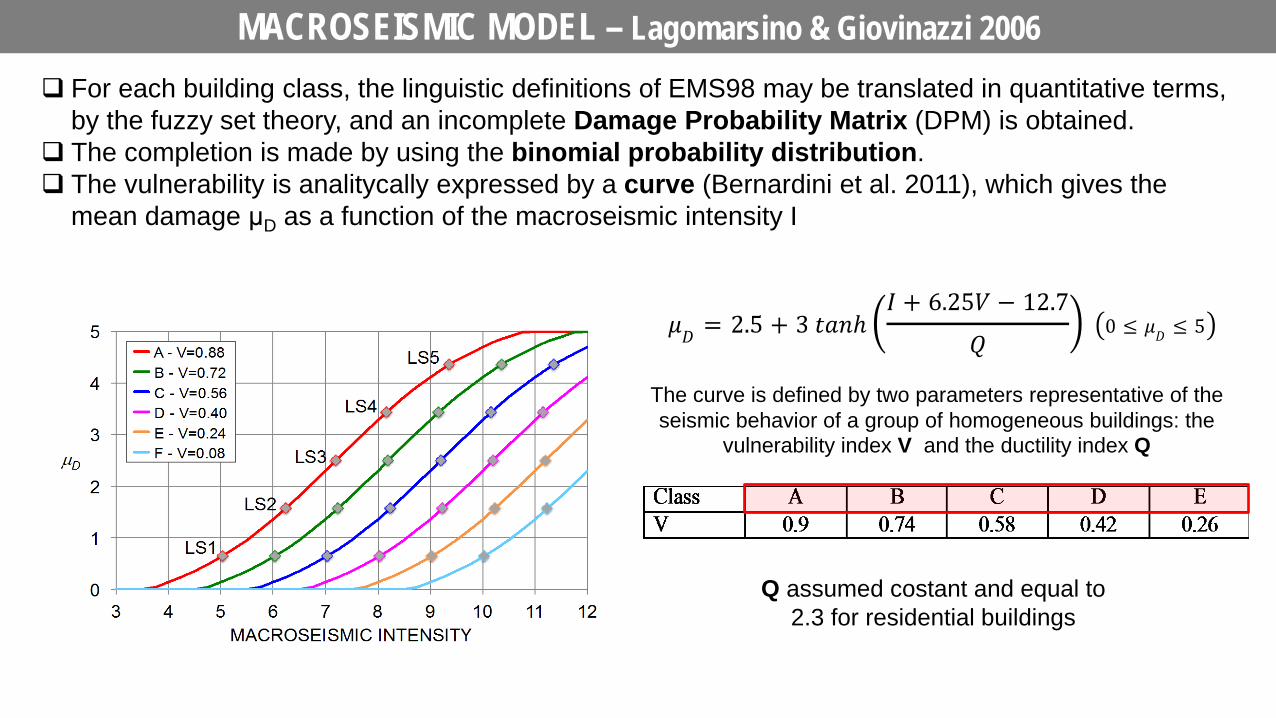
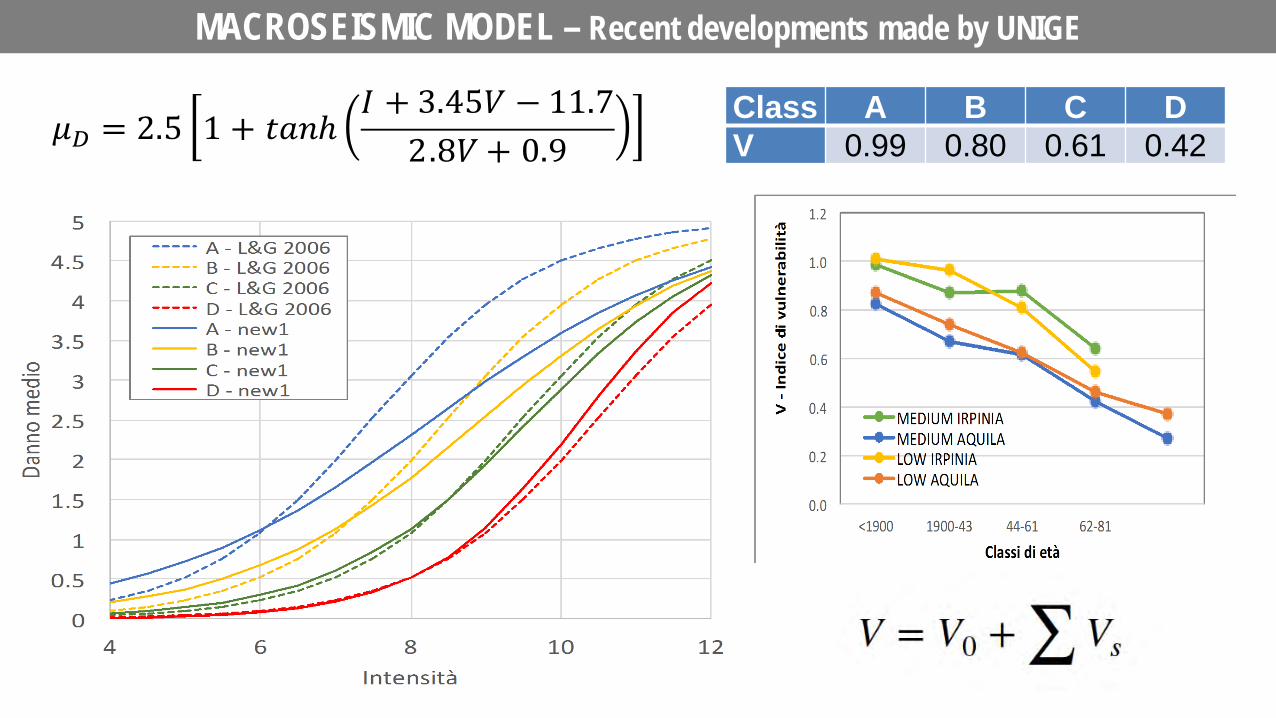
The curve is defined by two parameters representative of the seismic behavior of a group of homogeneous buildings: the
vulnerability index V and the ductility index Q
For each building class, the linguistic definitions of EMS98 may be translated in quantitative terms, by the fuzzy set theory, and an incomplete Damage Probability Matrix (DPM) is obtained.
The completion is made by using the binomial probability distribution. The vulnerability is analitycally expressed by a curve (Bernardini et al. 2011), which gives the
mean damage μD as a function of the macroseismic intensity I
Q assumed costant and equal to 2.3 for residential buildings
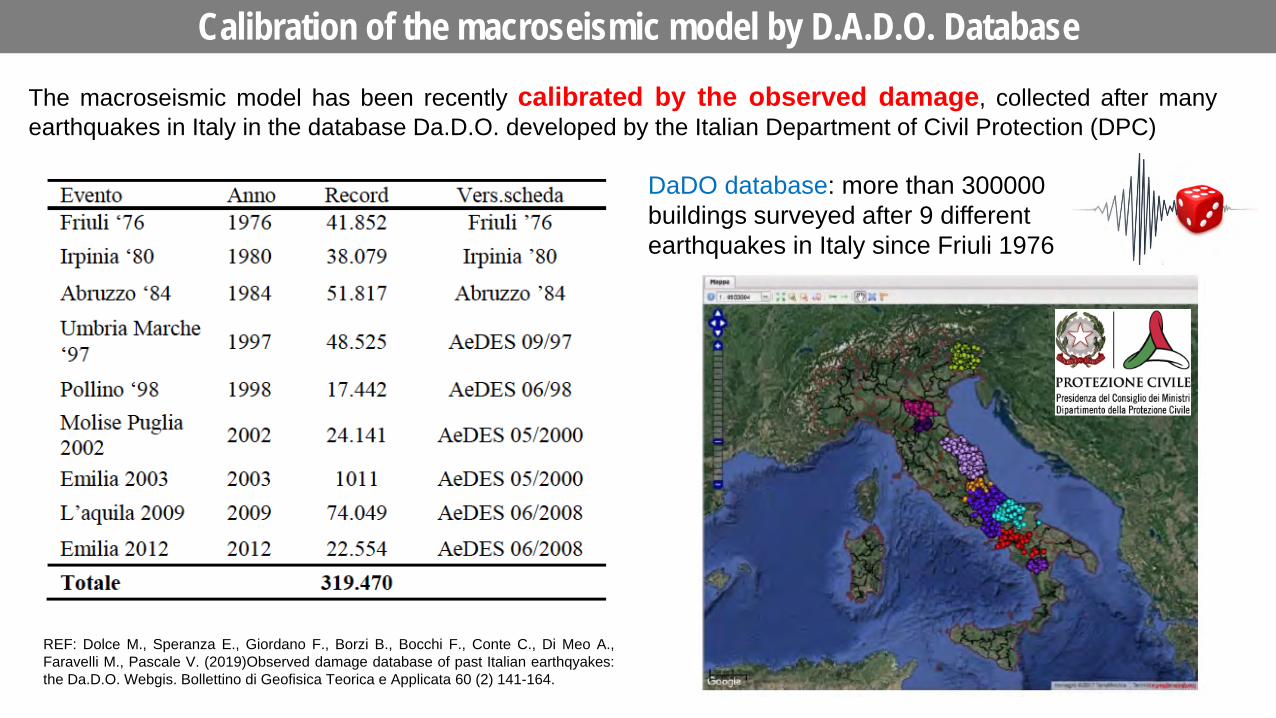
Calibration of the macroseismic model by D.A.D.O. Database
DaDO database: more than 300000 buildings surveyed after 9 different earthquakes in Italy since Friuli 1976
REF: Dolce M., Speranza E., Giordano F., Borzi B., Bocchi F., Conte C., Di Meo A., Faravelli M., Pascale V. (2019)Observed damage database of past Italian earthqyakes: the Da.D.O. Webgis. Bollettino di Geofisica Teorica e Applicata 60 (2) 141-164.
The macroseismic model has been recently calibrated by the observed damage, collected after many earthquakes in Italy in the database Da.D.O. developed by the Italian Department of Civil Protection (DPC)
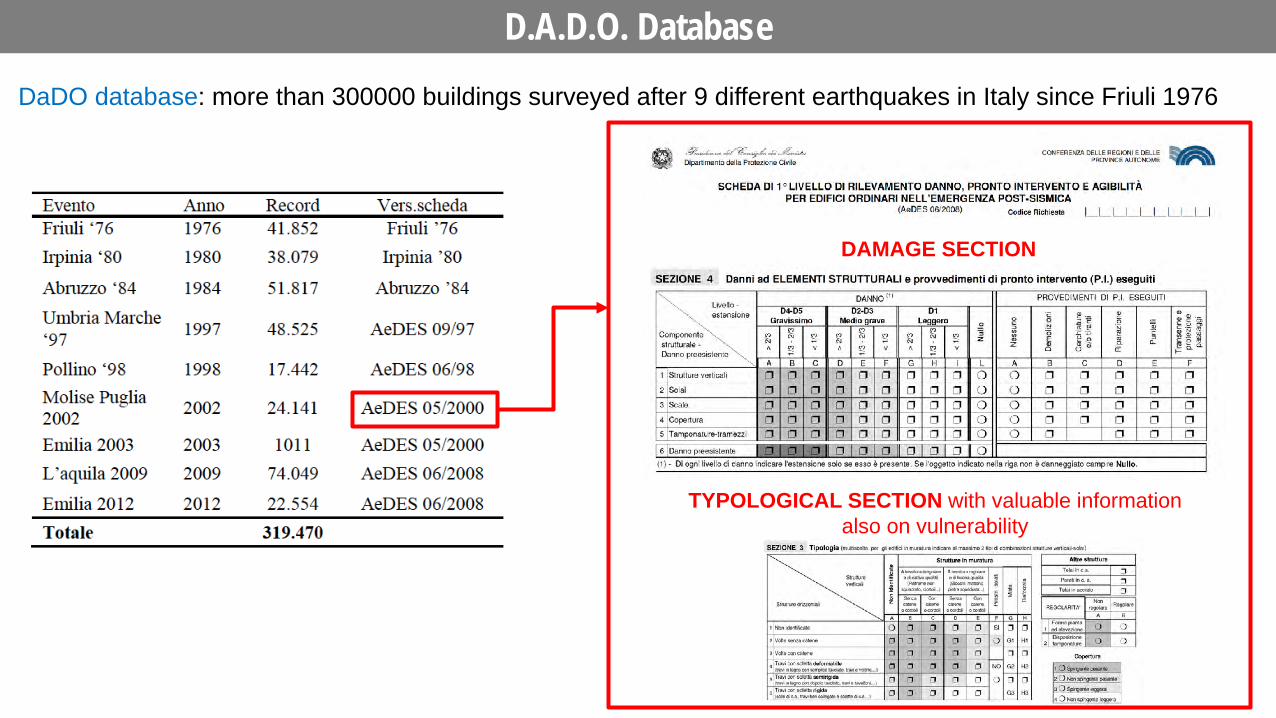
D.A.D.O. Database DaDO database: more than 300000 buildings surveyed after 9 different earthquakes in Italy since Friuli 1976
DAMAGE SECTION
TYPOLOGICAL SECTION with valuable information also on vulnerability
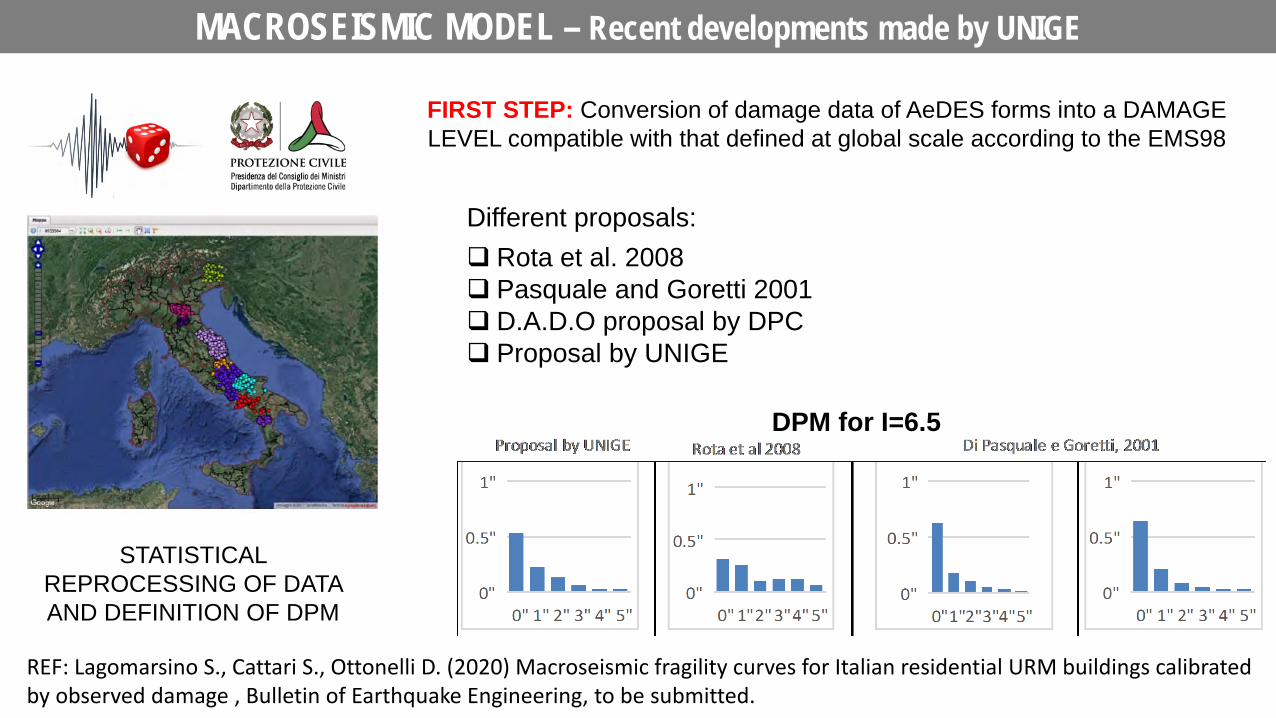
MACROSEISMIC MODEL – Recent developments made by UNIGE
STATISTICAL REPROCESSING OF DATA AND DEFINITION OF DPM
FIRST STEP: Conversion of damage data of AeDES forms into a DAMAGE LEVEL compatible with that defined at global scale according to the EMS98
Different proposals: Rota et al. 2008 Pasquale and Goretti 2001 D.A.D.O proposal by DPC Proposal by UNIGE
DPM for I=6.5
REF: Lagomarsino S., Cattari S., Ottonelli D. (2020) Macroseismic fragility curves for Italian residential URM buildings calibrated by observed damage , Bulletin of Earthquake Engineering, to be submitted.
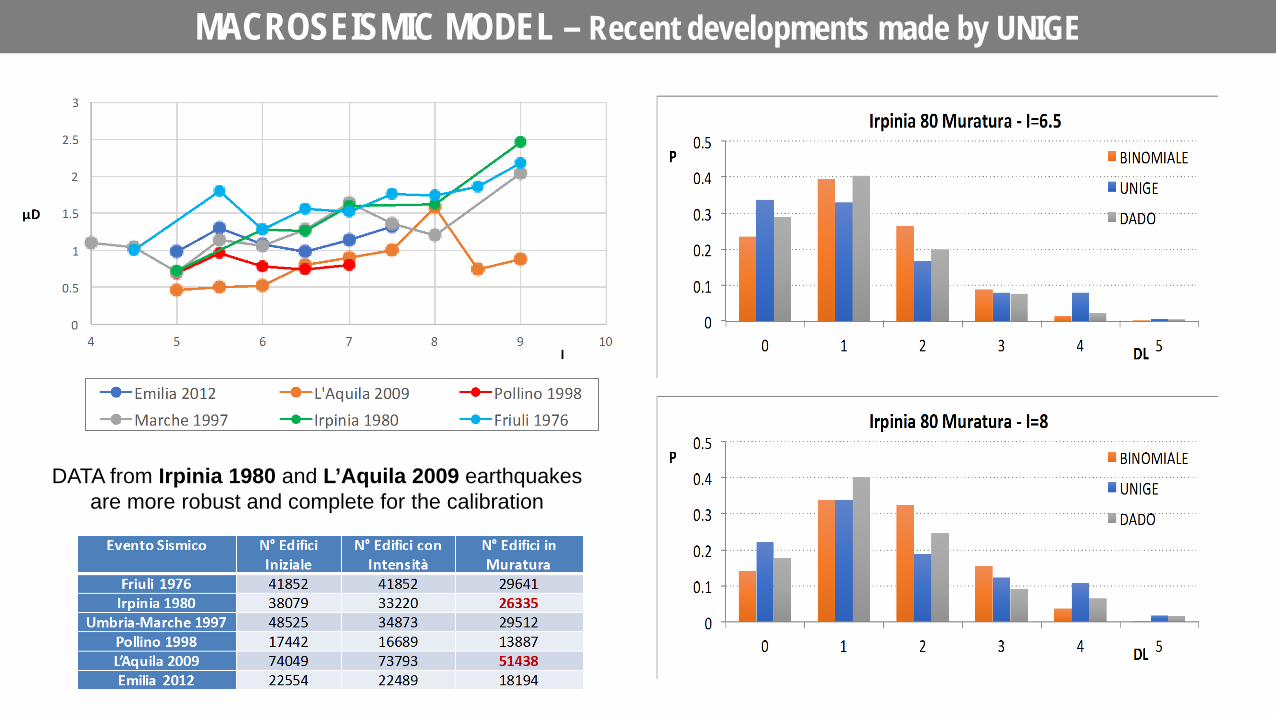
MACROSEISMIC MODEL – Recent developments made by UNIGE
DATA from Irpinia 1980 and L’Aquila 2009 earthquakes are more robust and complete for the calibration
MACROSEISMIC MODEL – Recent developments made by UNIGE
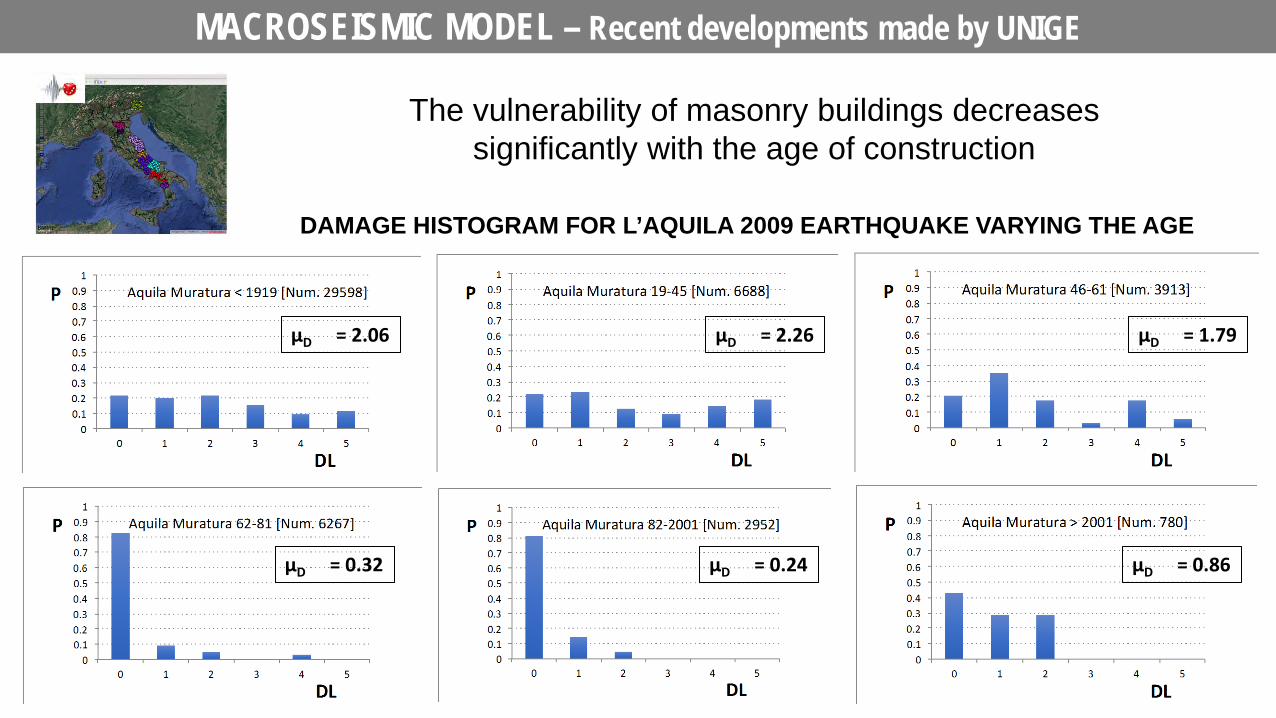
μD = 2.06 μD = 2.26 μD = 1.79
μD = 0.32 μD = 0.24 μD = 0.86
DAMAGE HISTOGRAM FOR L’AQUILA 2009 EARTHQUAKE VARYING THE AGE
The vulnerability of masonry buildings decreases significantly with the age of construction
MACROSEISMIC MODEL – Recent developments made by UNIGE
Class A B C D V 0.99 0.80 0.61 0.42
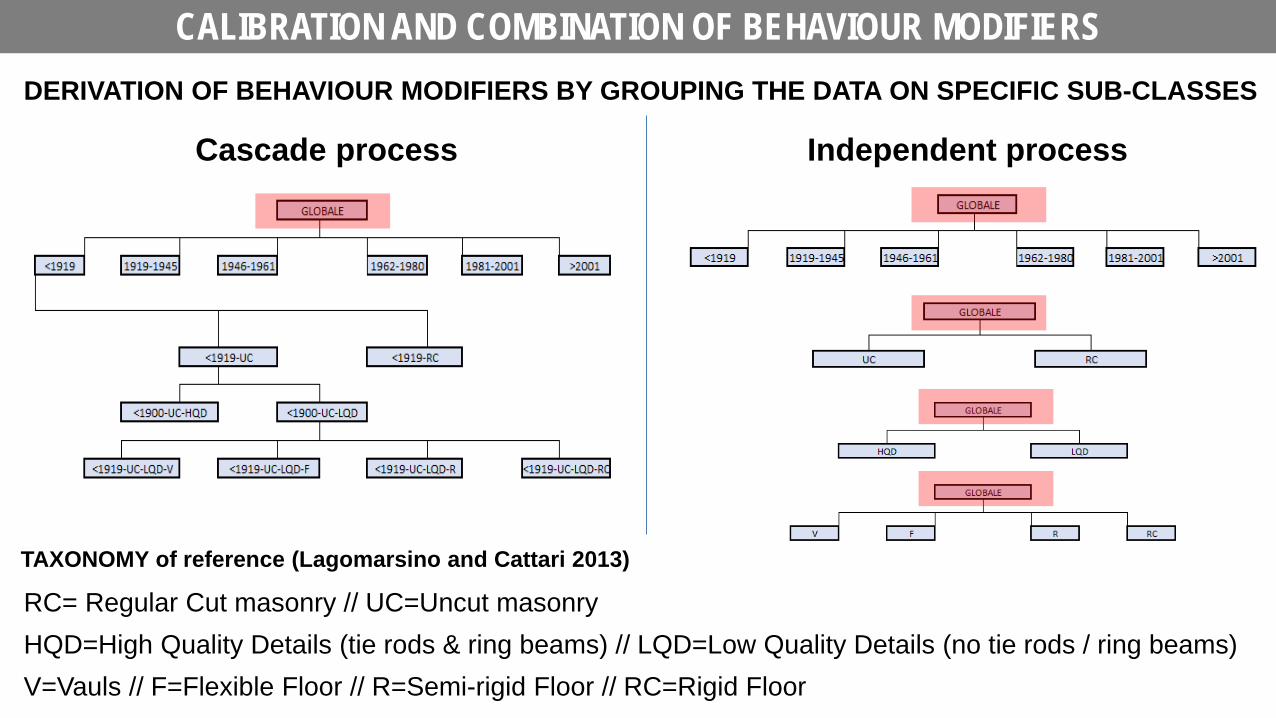
CALIBRATION AND COMBINATION OF BEHAVIOUR MODIFIERS
Independent process Cascade process
RC= Regular Cut masonry // UC=Uncut masonry HQD=High Quality Details (tie rods & ring beams) // LQD=Low Quality Details (no tie rods / ring beams) V=Vauls // F=Flexible Floor // R=Semi-rigid Floor // RC=Rigid Floor
TAXONOMY of reference (Lagomarsino and Cattari 2013)
DERIVATION OF BEHAVIOUR MODIFIERS BY GROUPING THE DATA ON SPECIFIC SUB-CLASSES
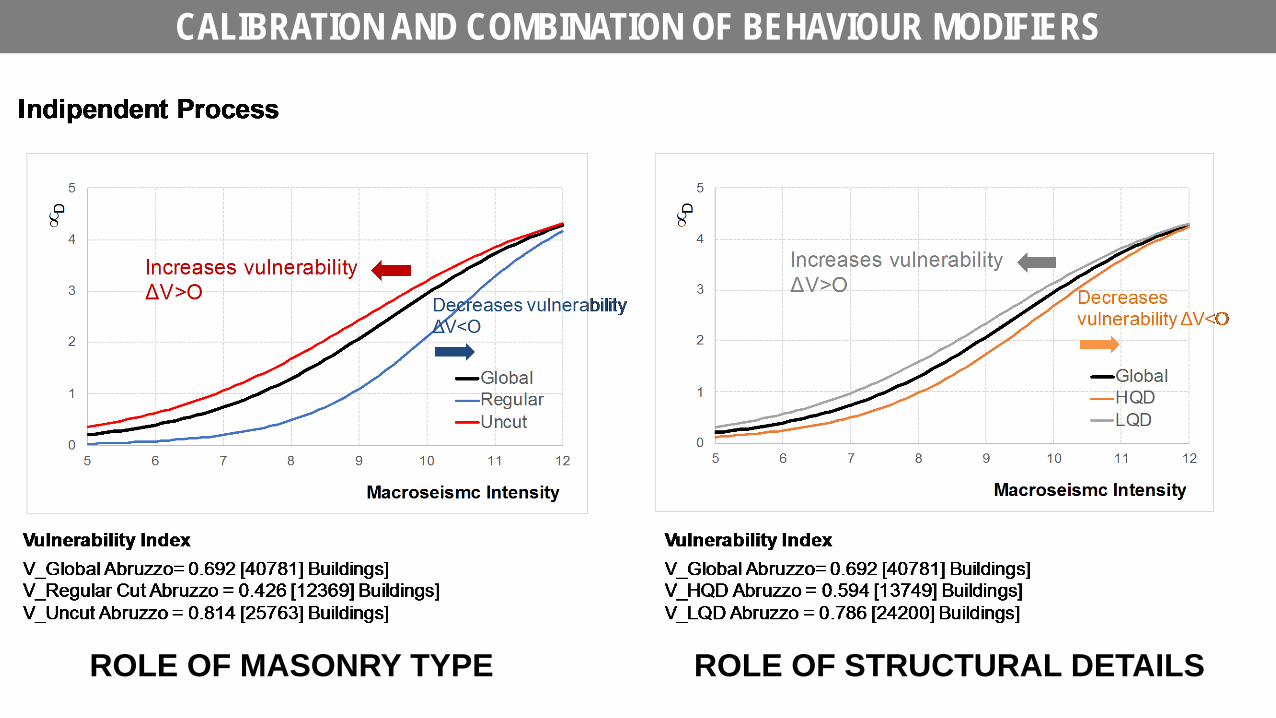
CALIBRATION AND COMBINATION OF BEHAVIOUR MODIFIERS
ROLE OF MASONRY TYPE ROLE OF STRUCTURAL DETAILS
CALIBRATION AND COMBINATION OF BEHAVIOUR MODIFIERS
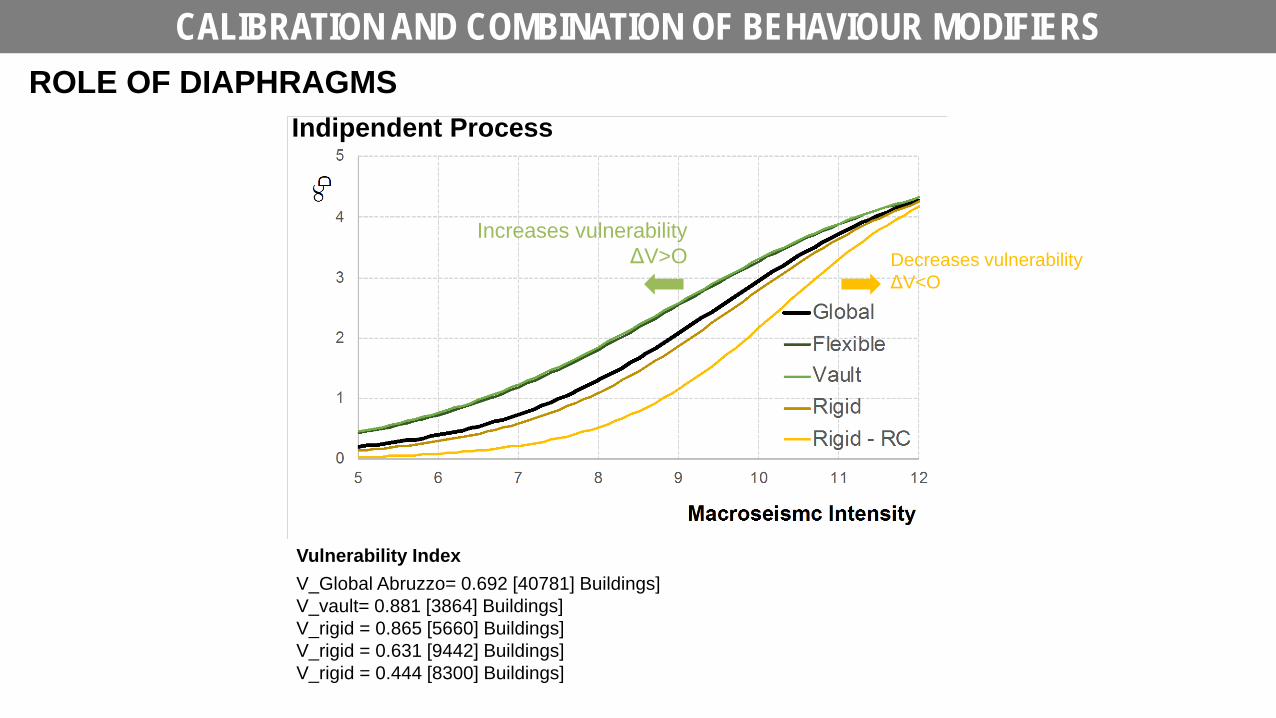
Indipendent Process
V_Global Abruzzo= 0.692 [40781] Buildings] V_vault= 0.881 [3864] Buildings] V_rigid = 0.865 [5660] Buildings] V_rigid = 0.631 [9442] Buildings] V_rigid = 0.444 [8300] Buildings]
Vulnerability Index
Decreases vulnerability ΔV<O
Increases vulnerability ΔV>O
ROLE OF DIAPHRAGMS
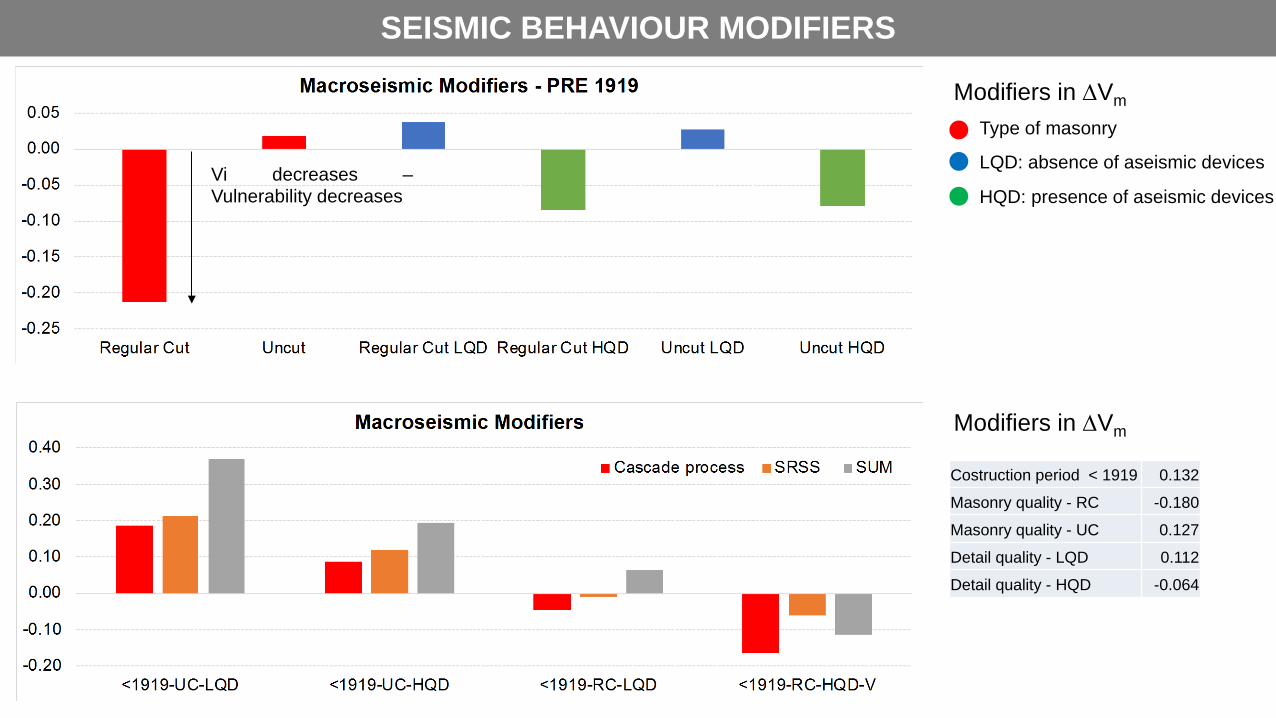
SEISMIC BEHAVIOUR MODIFIERS
Type of masonry
LQD: absence of aseismic devices
HQD: presence of aseismic devices
Modifiers in ∆Vm
Vi decreases – Vulnerability decreases
Modifiers in ∆Vm
Costruction period < 1919 0.132
Masonry quality - RC -0.180
Masonry quality - UC 0.127
Detail quality - LQD 0.112
Detail quality - HQD -0.064
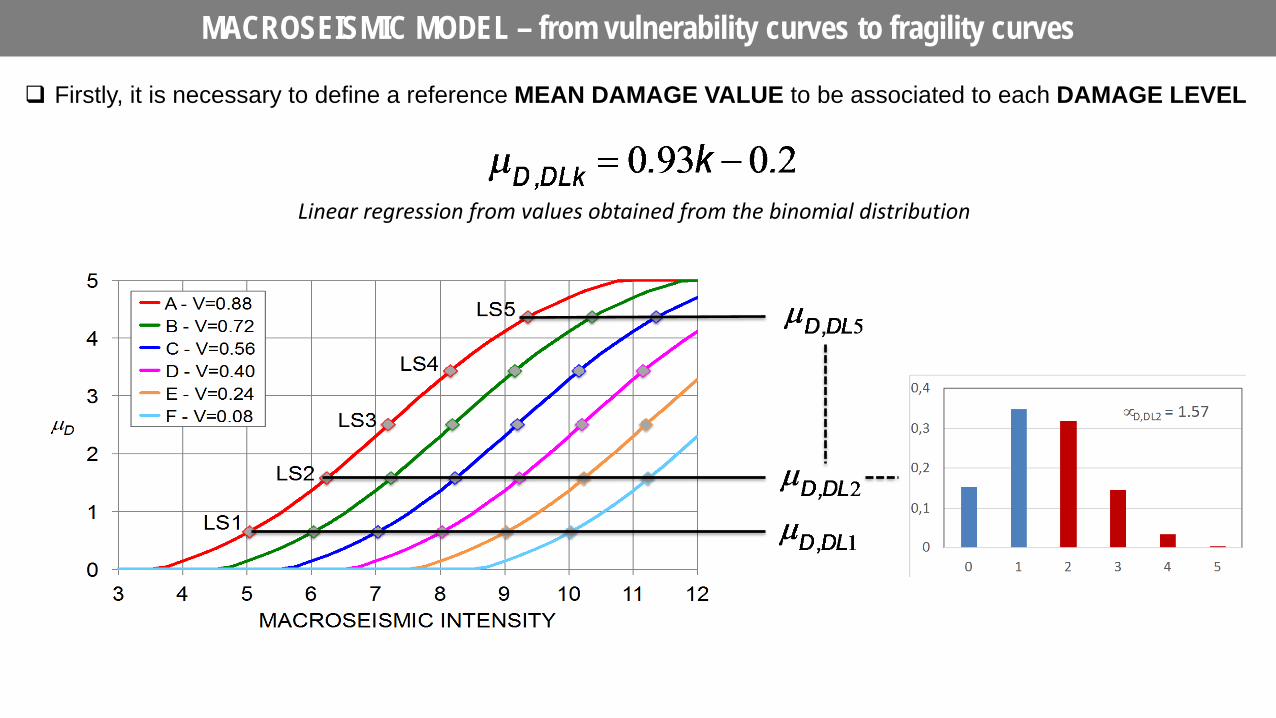
MACROSEISMIC MODEL – from vulnerability curves to fragility curves
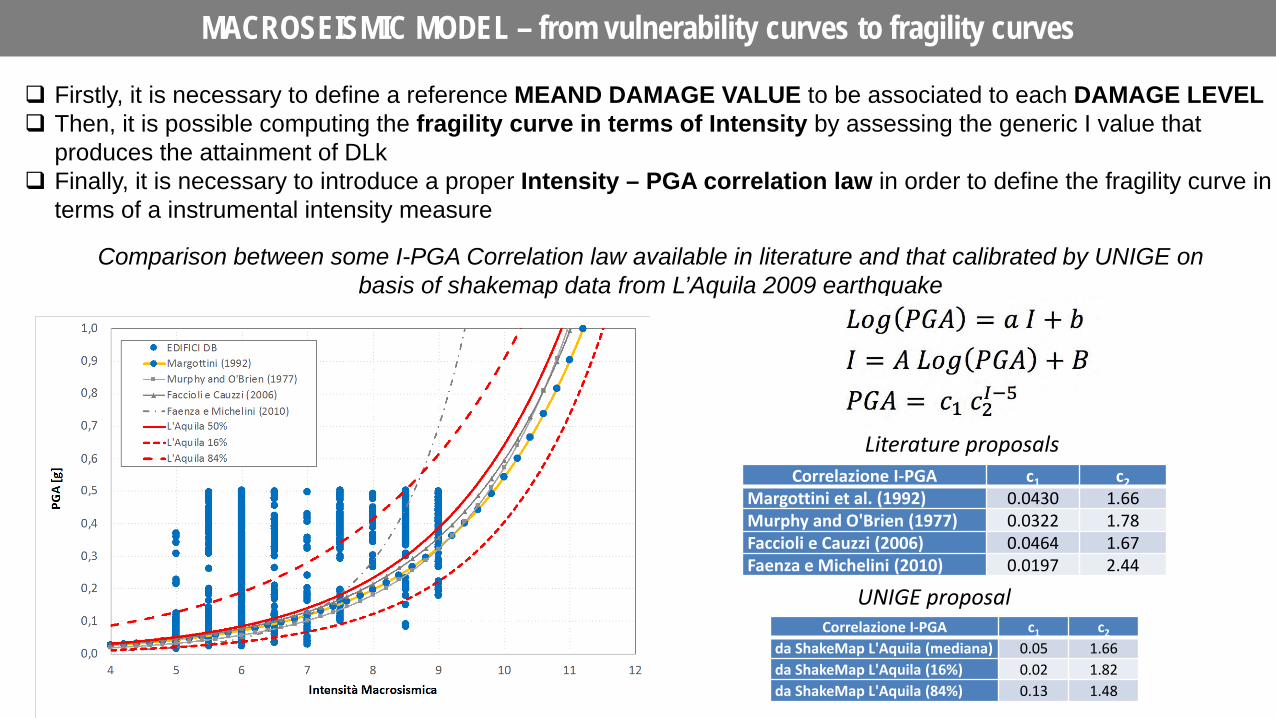
Firstly, it is necessary to define a reference MEAN DAMAGE VALUE to be associated to each DAMAGE LEVEL
Linear regression from values obtained from the binomial distribution
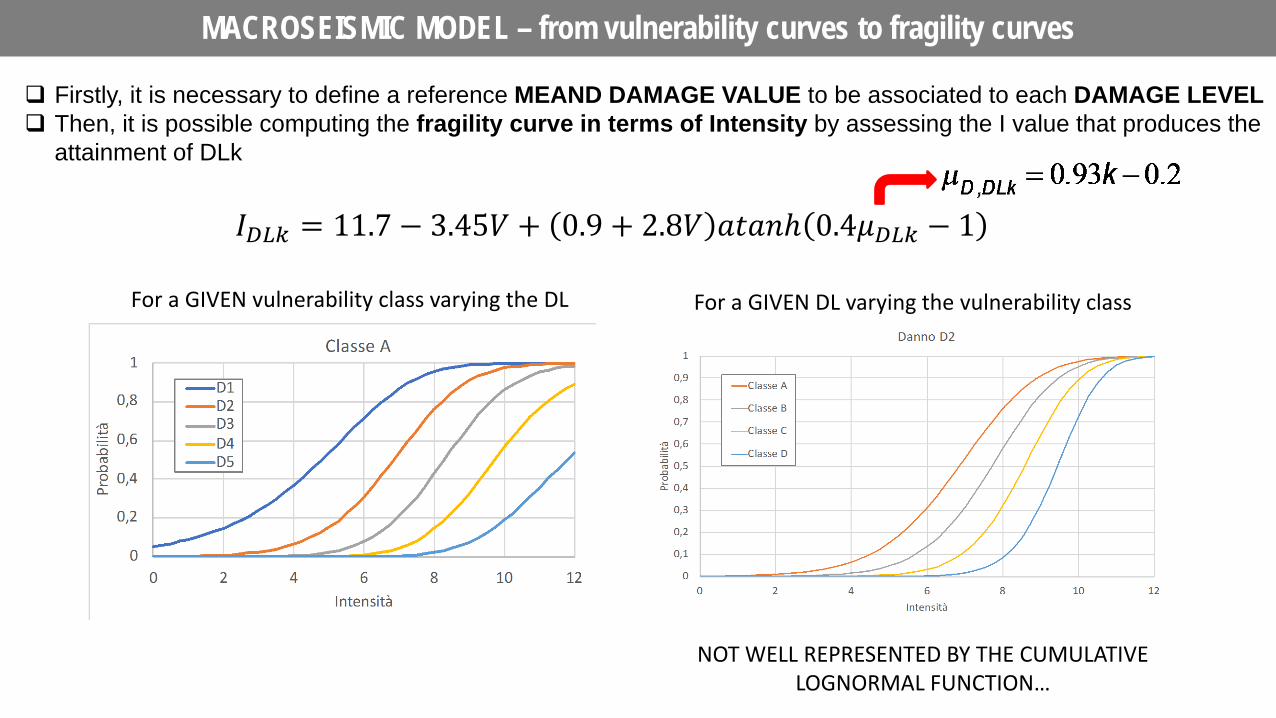
MACROSEISMIC MODEL – from vulnerability curves to fragility curves
Firstly, it is necessary to define a reference MEAND DAMAGE VALUE to be associated to each DAMAGE LEVEL Then, it is possible computing the fragility curve in terms of Intensity by assessing the I value that produces the
attainment of DLk
𝐼𝐼𝐷𝐷𝐿𝐿𝑘𝑘 = 11.7 − 3.45𝑉𝑉 + 0.9 + 2.8𝑉𝑉 𝑎𝑎𝑎𝑎𝑎𝑎𝑎𝑎𝑎 0.4𝜇𝜇𝐷𝐷𝐿𝐿𝑘𝑘 − 1
For a GIVEN vulnerability class varying the DL For a GIVEN DL varying the vulnerability class
NOT WELL REPRESENTED BY THE CUMULATIVE LOGNORMAL FUNCTION…
MACROSEISMIC MODEL – from vulnerability curves to fragility curves
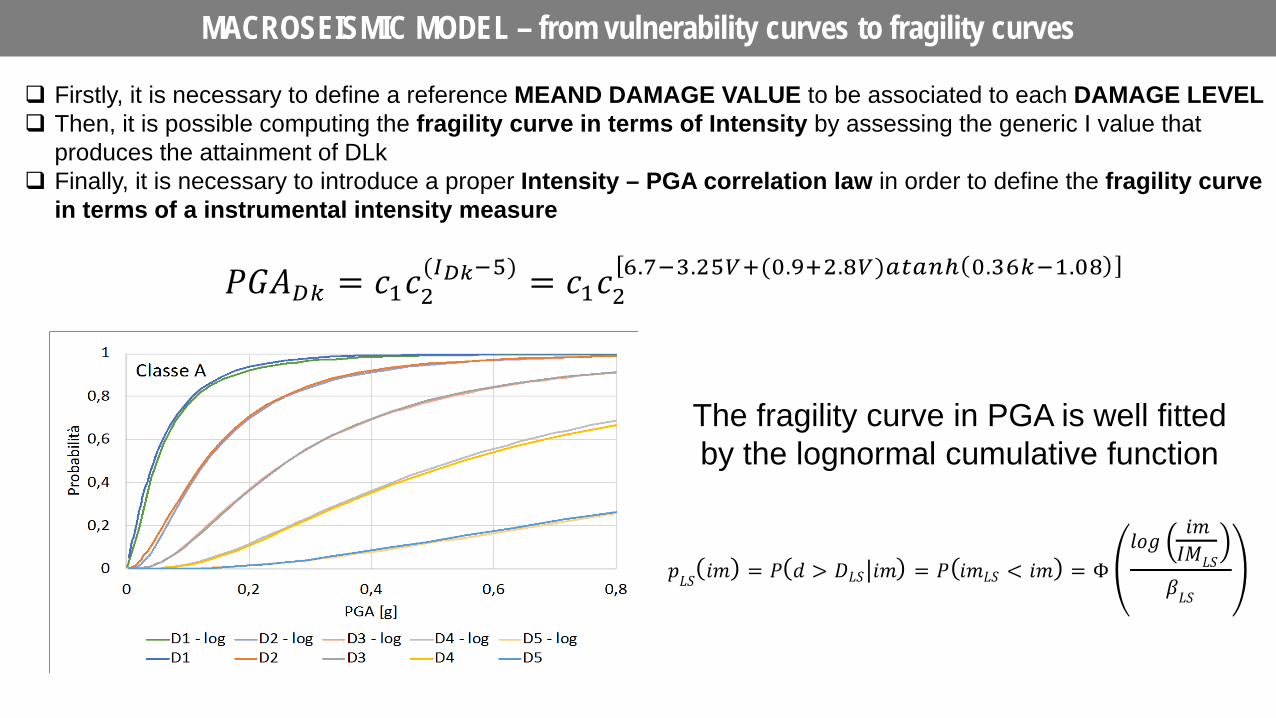
Firstly, it is necessary to define a reference MEAND DAMAGE VALUE to be associated to each DAMAGE LEVEL Then, it is possible computing the fragility curve in terms of Intensity by assessing the generic I value that
produces the attainment of DLk Finally, it is necessary to introduce a proper Intensity – PGA correlation law in order to define the fragility curve in
terms of a instrumental intensity measure
Comparison between some I-PGA Correlation law available in literature and that calibrated by UNIGE on basis of shakemap data from L’Aquila 2009 earthquake
Correlazione I-PGA c1 c2 Margottini et al. (1992) 0.0430 1.66 Murphy and O'Brien (1977) 0.0322 1.78 Faccioli e Cauzzi (2006) 0.0464 1.67 Faenza e Michelini (2010) 0.0197 2.44
Correlazione I-PGA c1 c2 da ShakeMap L'Aquila (mediana) 0.05 1.66 da ShakeMap L'Aquila (16%) 0.02 1.82 da ShakeMap L'Aquila (84%) 0.13 1.48
UNIGE proposal
Literature proposals
MACROSEISMIC MODEL – from vulnerability curves to fragility curves
Firstly, it is necessary to define a reference MEAND DAMAGE VALUE to be associated to each DAMAGE LEVEL Then, it is possible computing the fragility curve in terms of Intensity by assessing the generic I value that
produces the attainment of DLk Finally, it is necessary to introduce a proper Intensity – PGA correlation law in order to define the fragility curve
in terms of a instrumental intensity measure
The fragility curve in PGA is well fitted by the lognormal cumulative function
MACROSEISMIC MODEL – fragility curves developed by UNIGE
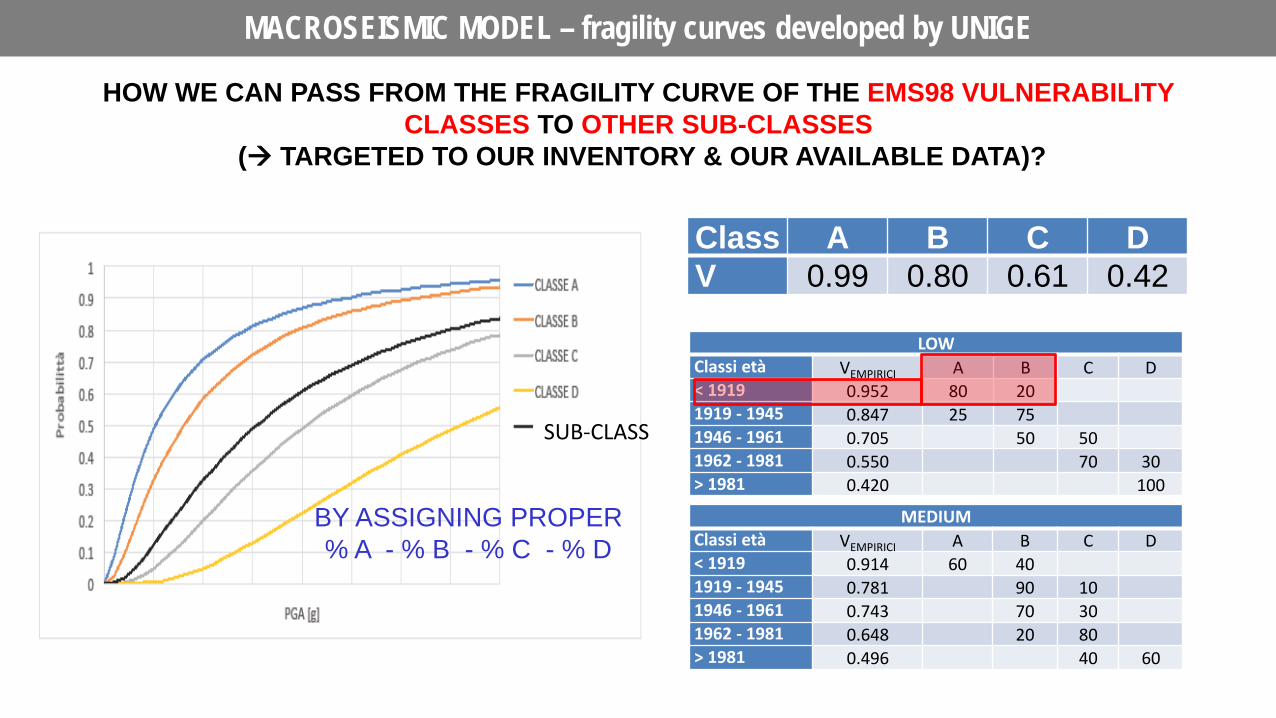
HOW WE CAN PASS FROM THE FRAGILITY CURVE OF THE EMS98 VULNERABILITY CLASSES TO OTHER SUB-CLASSES
( TARGETED TO OUR INVENTORY & OUR AVAILABLE DATA)?
LOW Classi età VEMPIRICI A B C D < 1919 0.952 80 20 1919 - 1945 0.847 25 75 1946 - 1961 0.705 50 50 1962 - 1981 0.550 70 30 > 1981 0.420 100
MEDIUM Classi età VEMPIRICI A B C D < 1919 0.914 60 40 1919 - 1945 0.781 90 10 1946 - 1961 0.743 70 30 1962 - 1981 0.648 20 80 > 1981 0.496 40 60
Class A B C D V 0.99 0.80 0.61 0.42
BY ASSIGNING PROPER % A - % B - % C - % D
SUB-CLASS
NEW MACROSEISMIC MODEL – VALIDATION
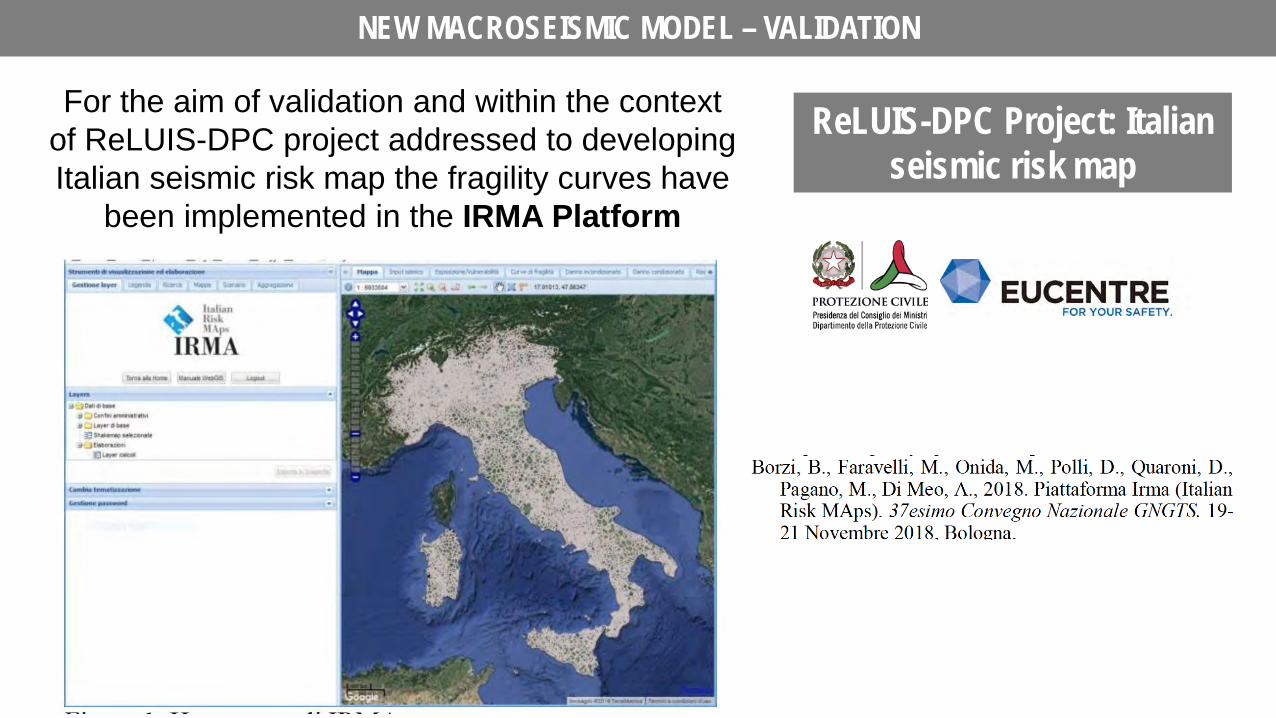
ReLUIS-DPC Project: Italian seismic risk map
For the aim of validation and within the context of ReLUIS-DPC project addressed to developing Italian seismic risk map the fragility curves have
been implemented in the IRMA Platform
Reference e figura di IRMA
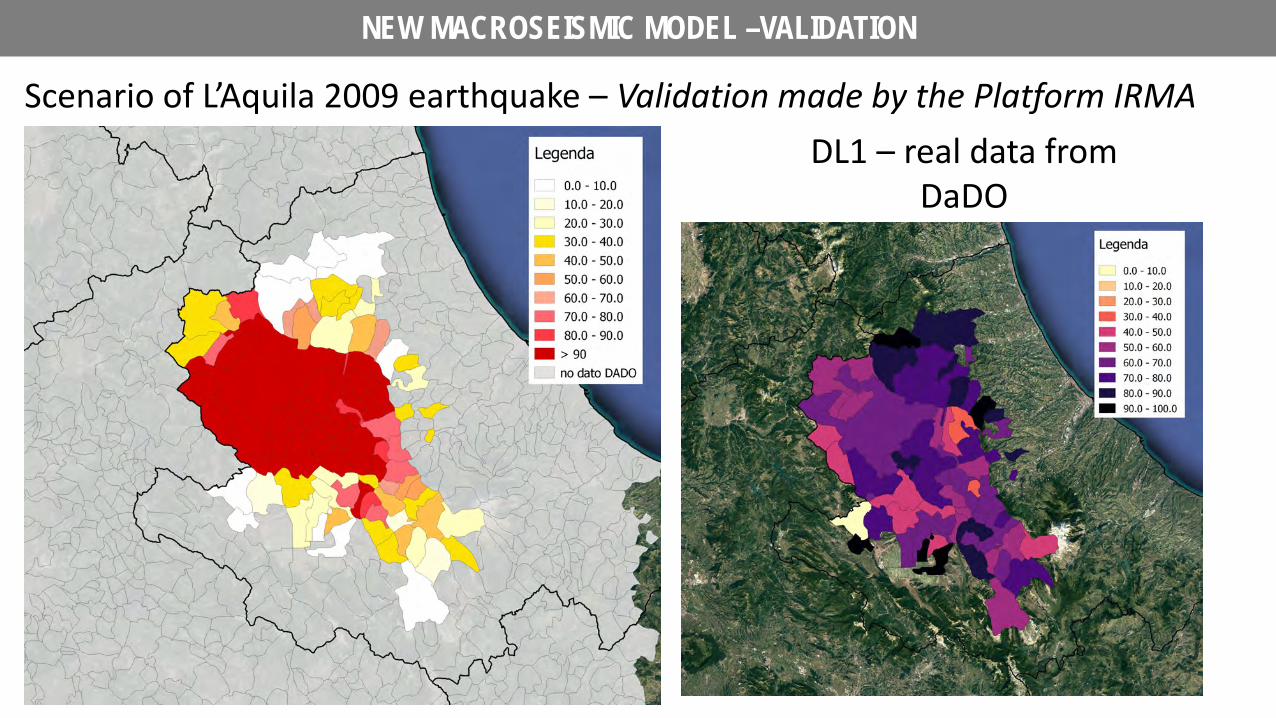
DL1 – Simulated by the macroseismic model
Scenario of L’Aquila 2009 earthquake – Validation made by the Platform IRMA DL1 – real data from
DaDO
NEW MACROSEISMIC MODEL –VALIDATION
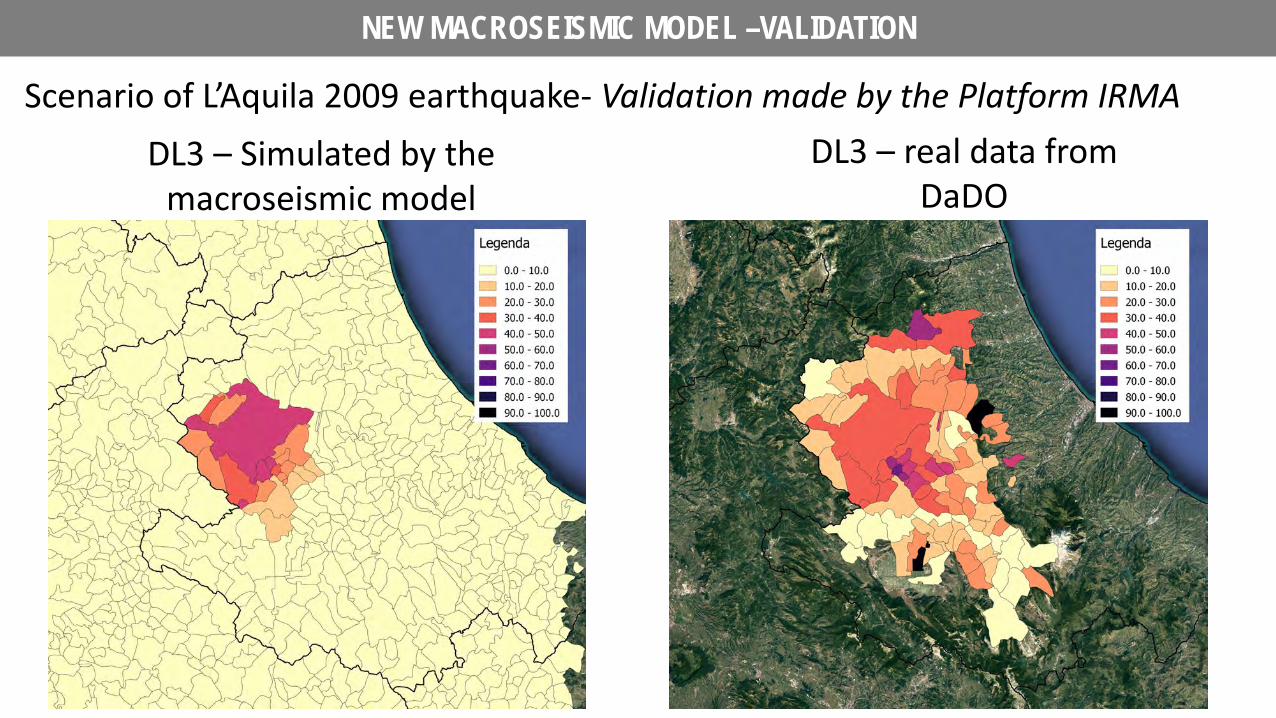
DL3 – Simulated by the macroseismic model
Scenario of L’Aquila 2009 earthquake- Validation made by the Platform IRMA DL3 – real data from
DaDO
NEW MACROSEISMIC MODEL –VALIDATION
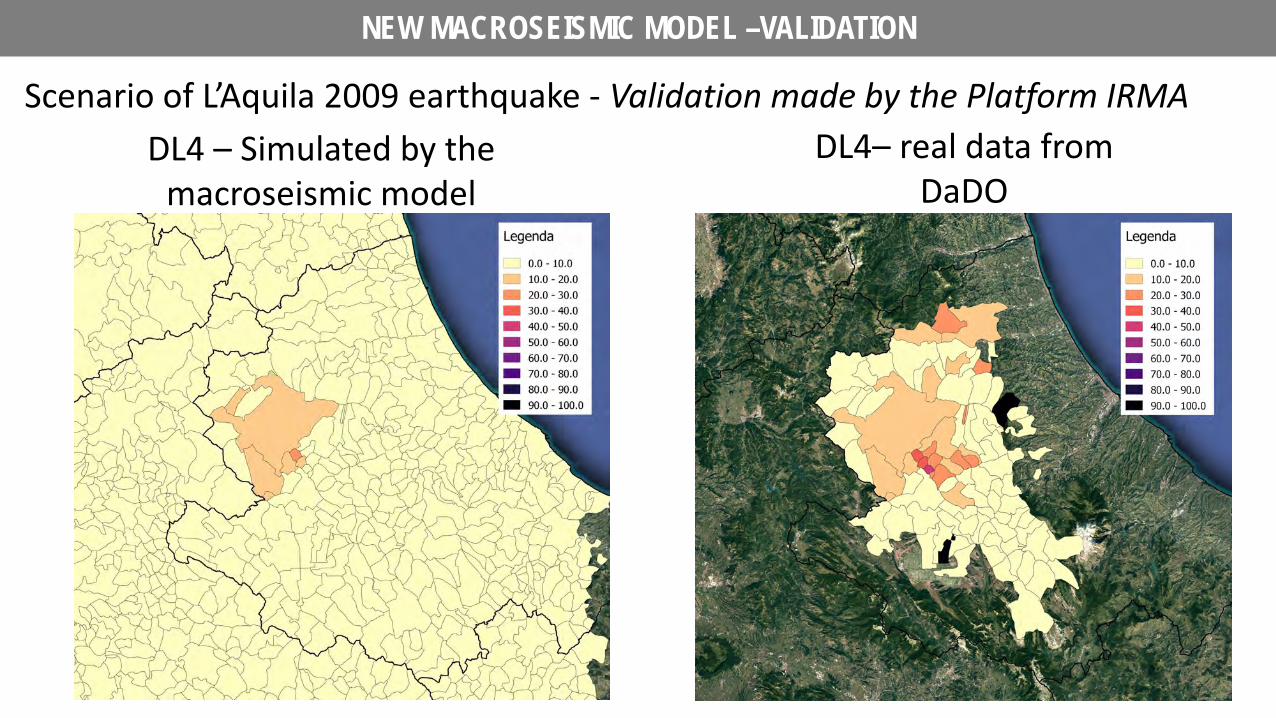
DL4 – Simulated by the macroseismic model
DL4– real data from DaDO
NEW MACROSEISMIC MODEL –VALIDATION
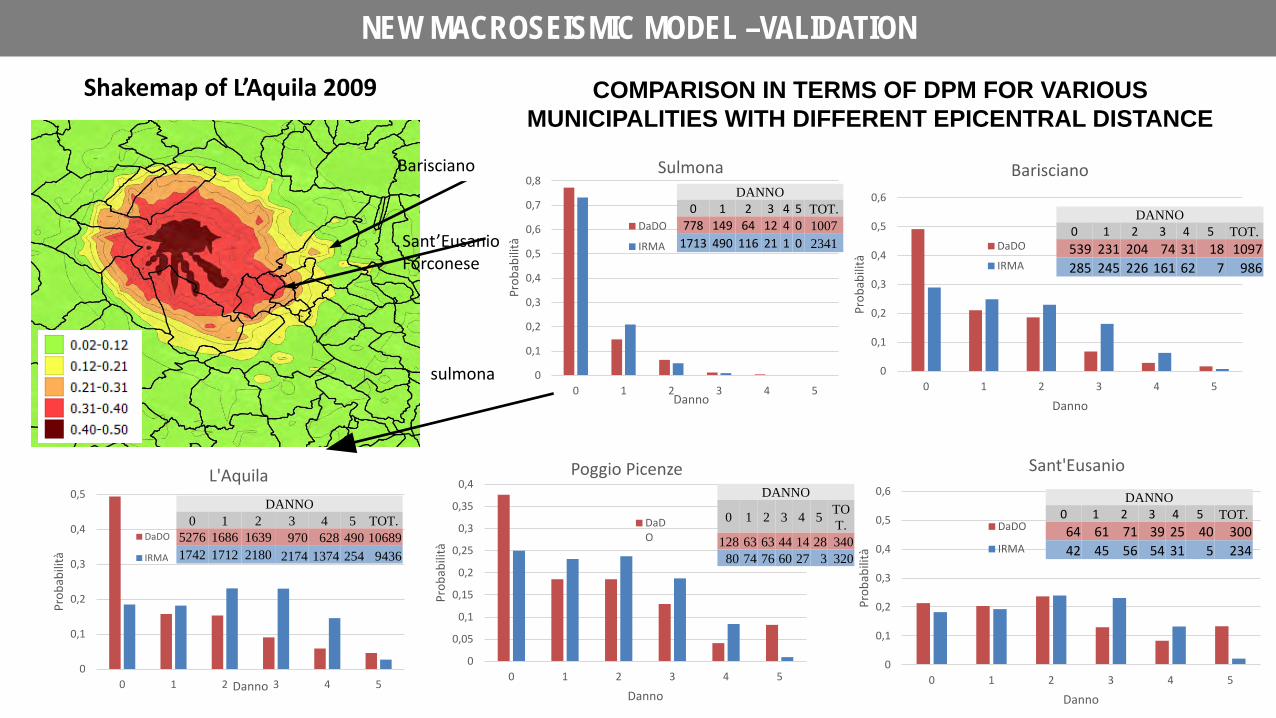
Scenario of L’Aquila 2009 earthquake - Validation made by the Platform IRMA
Barisciano
Sant’Eusanio Forconese
Shakemap of L’Aquila 2009
NEW MACROSEISMIC MODEL –VALIDATION
COMPARISON IN TERMS OF DPM FOR VARIOUS MUNICIPALITIES WITH DIFFERENT EPICENTRAL DISTANCE
0
0,1
0,2
0,3
0,4
0,5
0 1 2 3 4 5
Prob
abili
tà
Danno
L'Aquila
DaDO
IRMA
DANNO 0 1 2 3 4 5 TOT.
5276 1686 1639 970 628 490 10689 1742 1712 2180 2174 1374 254 9436
0
0,1
0,2
0,3
0,4
0,5
0,6
0 1 2 3 4 5
Prob
abili
tà
Danno
Barisciano
DaDO
IRMA
0
0,1
0,2
0,3
0,4
0,5
0,6
0 1 2 3 4 5
Prob
abili
tà
Danno
Sant'Eusanio
DaDO
IRMA
DANNO 0 1 2 3 4 5 TOT. 64 61 71 39 25 40 300 42 45 56 54 31 5 234
DANNO 0 1 2 3 4 5 TOT. 539 231 204 74 31 18 1097 285 245 226 161 62 7 986
0
0,05
0,1
0,15
0,2
0,25
0,3
0,35
0,4
0 1 2 3 4 5
Prob
abili
tà
Danno
Poggio Picenze
DaDO
DANNO
0 1 2 3 4 5 TOT.
128 63 63 44 14 28 340 80 74 76 60 27 3 320
0
0,1
0,2
0,3
0,4
0,5
0,6
0,7
0,8
0 1 2 3 4 5
Prob
abili
tà
Danno
Sulmona
DaDO
IRMA
DANNO 0 1 2 3 4 5 TOT.
778 149 64 12 4 0 1007 1713 490 116 21 1 0 2341
sulmona
OUTLINE OF THE PRESENTATION
What do they depend on?
How are they obtained?
What do they represent?
How can they be used?
Practical issues & application to the Italian seismic risk assessment
Overview of methods & focus on macroseismic and empirical ones
Involved dispersions & influence on results of seismic risk analysis
Vulnerability as a component of seismic risk and loss assessment
FRAGILITY CURVES
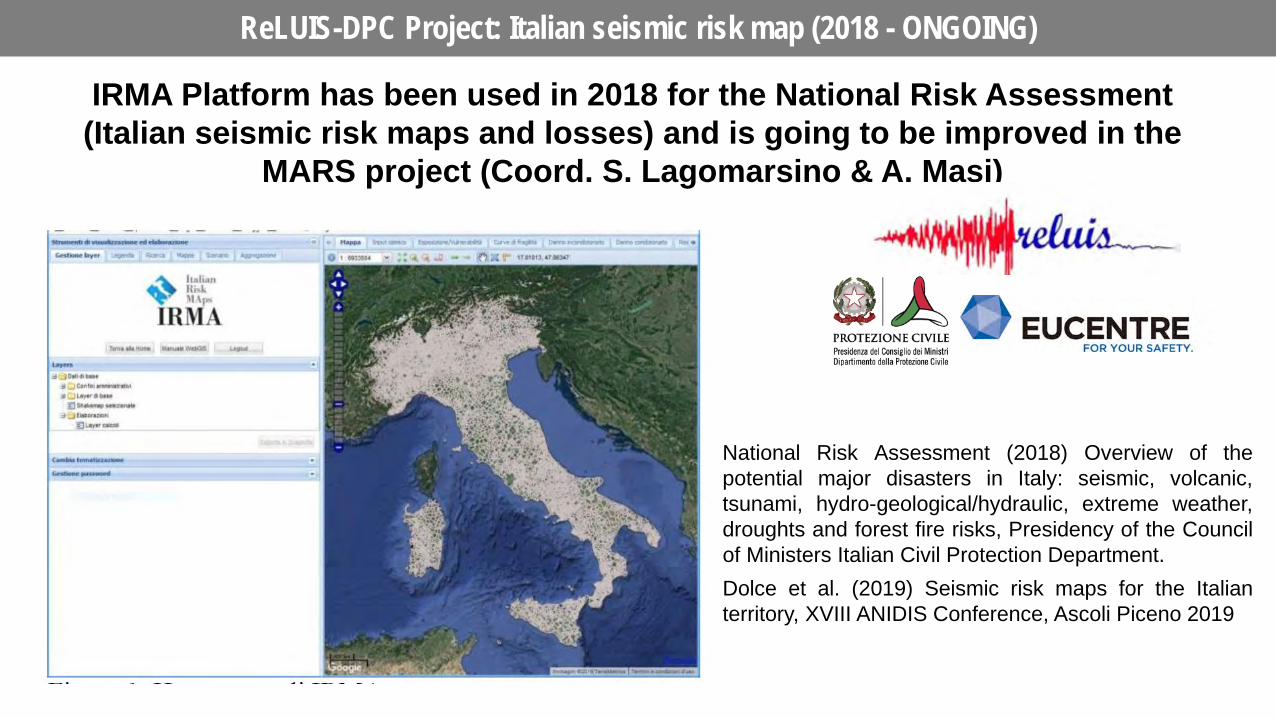
ReLUIS-DPC Project: Italian seismic risk map (2018 - ONGOING)
IRMA Platform has been used in 2018 for the National Risk Assessment (Italian seismic risk maps and losses) and is going to be improved in the
MARS project (Coord. S. Lagomarsino & A. Masi)
Reference e figura di IRMA
National Risk Assessment (2018) Overview of the potential major disasters in Italy: seismic, volcanic, tsunami, hydro-geological/hydraulic, extreme weather, droughts and forest fire risks, Presidency of the Council of Ministers Italian Civil Protection Department. Dolce et al. (2019) Seismic risk maps for the Italian territory, XVIII ANIDIS Conference, Ascoli Piceno 2019
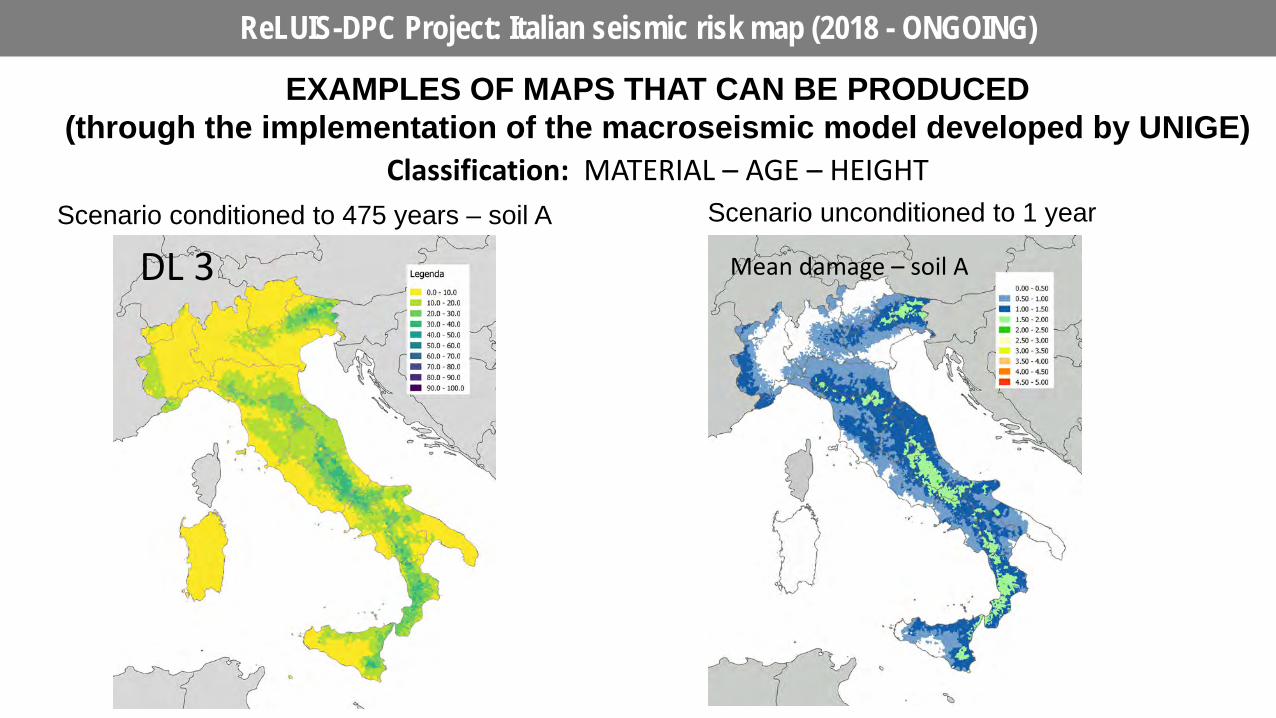
ReLUIS-DPC Project: Italian seismic risk map (2018 - ONGOING)
EXAMPLES OF MAPS THAT CAN BE PRODUCED (through the implementation of the macroseismic model developed by UNIGE)
Scenario conditioned to 475 years – soil A
DL 3 Mean damage – soil A
Scenario unconditioned to 1 year Classification: MATERIAL – AGE – HEIGHT
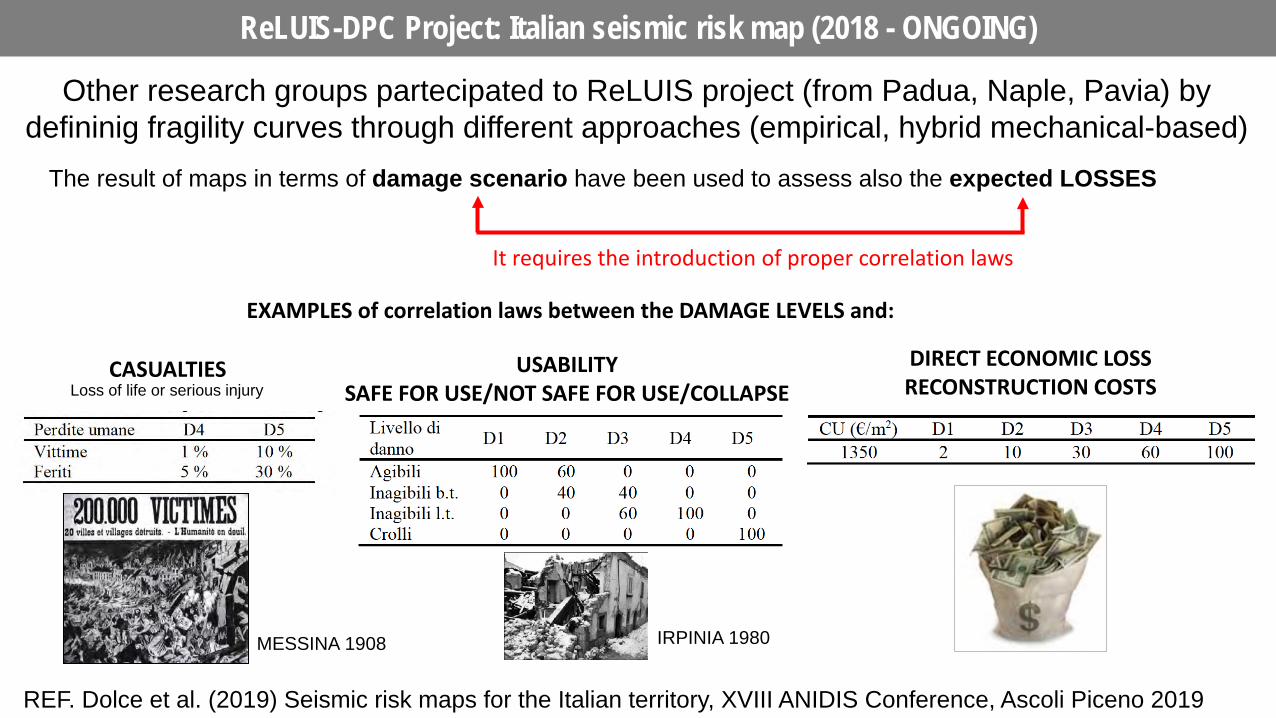
ReLUIS-DPC Project: Italian seismic risk map (2018 - ONGOING)
Other research groups partecipated to ReLUIS project (from Padua, Naple, Pavia) by defininig fragility curves through different approaches (empirical, hybrid mechanical-based)
REF. Dolce et al. (2019) Seismic risk maps for the Italian territory, XVIII ANIDIS Conference, Ascoli Piceno 2019
The result of maps in terms of damage scenario have been used to assess also the expected LOSSES
It requires the introduction of proper correlation laws
EXAMPLES of correlation laws between the DAMAGE LEVELS and:
CASUALTIES USABILITY SAFE FOR USE/NOT SAFE FOR USE/COLLAPSE
DIRECT ECONOMIC LOSS RECONSTRUCTION COSTS
IRPINIA 1980 MESSINA 1908
Loss of life or serious injury
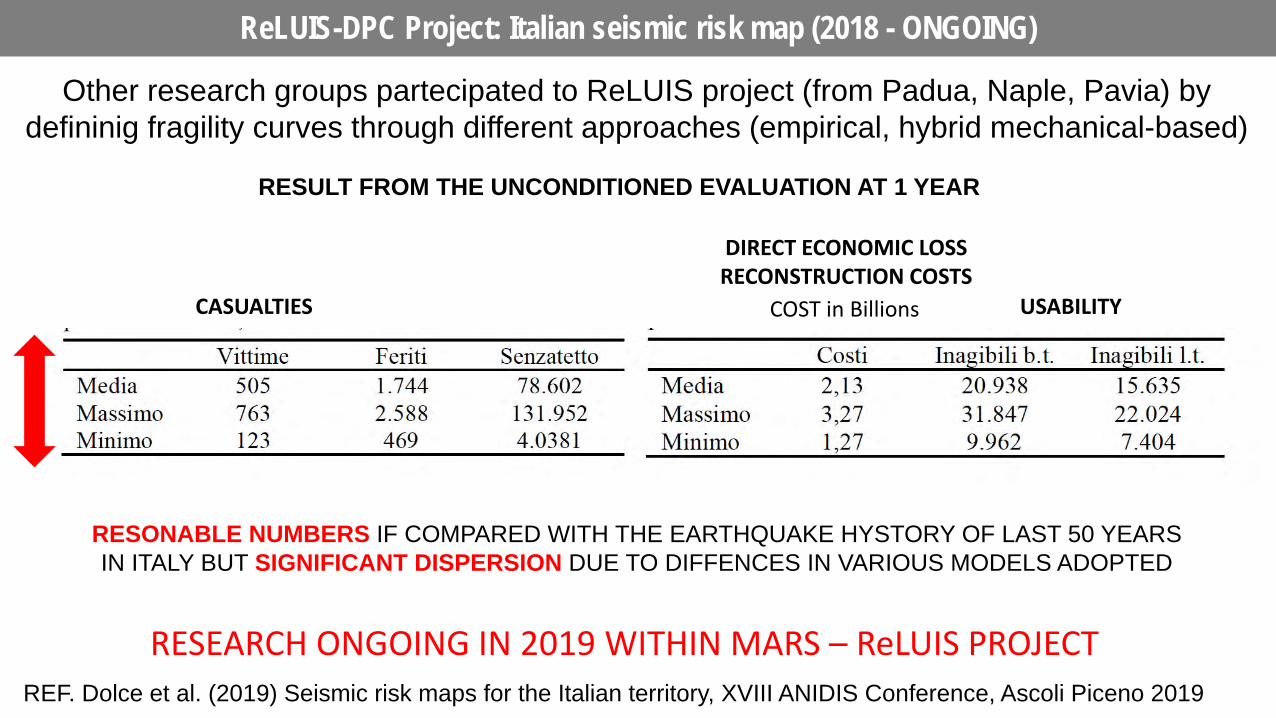
ReLUIS-DPC Project: Italian seismic risk map (2018 - ONGOING)
Other research groups partecipated to ReLUIS project (from Padua, Naple, Pavia) by defininig fragility curves through different approaches (empirical, hybrid mechanical-based)
REF. Dolce et al. (2019) Seismic risk maps for the Italian territory, XVIII ANIDIS Conference, Ascoli Piceno 2019
USABILITY
DIRECT ECONOMIC LOSS RECONSTRUCTION COSTS
RESULT FROM THE UNCONDITIONED EVALUATION AT 1 YEAR
COST in Billions
RESONABLE NUMBERS IF COMPARED WITH THE EARTHQUAKE HYSTORY OF LAST 50 YEARS IN ITALY BUT SIGNIFICANT DISPERSION DUE TO DIFFENCES IN VARIOUS MODELS ADOPTED
RESEARCH ONGOING IN 2019 WITHIN MARS – ReLUIS PROJECT
CASUALTIES

THANK YOU FOR YOUR KIND ATTENTION
Sergio Lagomarsino [email protected]
DICCA – Department of Civil, Chemical and Environmental Engineering