Embed Size (px)
Citation preview

_______________________________________________________
Jari Hyvärinen
EMPIRICAL EVIDENCE ON INTERNATIONAL OUTSOURCING IN PRODUCTION
______________________________________________________
Sarja / Series Ae-9:2004 (pdf) A-9:2004 (nid.) ISBN: 951-564-189-6 (pdf) 951-564-188-8 (nid.) ISSN: 1459-4870 (pdf) 0357-4652 (nid.)

3
PREFACE
I became interested in industrial economics already in the beginning of my undergraduate studies. I continued in this field when I was visiting at the University of Vienna during 1994-1995. During that time, my supervisor Dennis C. Mueller gave an extensive overview, also with some philosophical insights, of the topic in his lectures. At that time, I was working on my licentiate thesis, which focused on the approach of corporate governance. It also included insights on how to build a workable financial and industrial structure in the CEE transition countries. I became familiar with this topic when I was working in two research programs on transition economies at ETLA and during my visit to IIASA, Austria. I got encouraging comments from Janos Gacs, Dennis C. Mueller and Joe Peck in Vienna. Also my stay at the Institute for European Studies, Turku in 1996-1998 gave me a valuable background in several issues regarding European Integration. I finished my licentiate thesis in 2000 and I am grateful for Kalevi Kyläheiko and Paavo Okko who gave fine support and clarifying comments to finish the study. I am indebted to the Academy of Finland, CIMO, and the OKO-Bank Group’s Research Foundation, which financed my stay in Austria and made it possible to finish this study.
This thesis has been carried out during my visit at the Graduate Institute of International Studies, Geneva in 2000-2003. During that time, I was acquainted with a wide range of topics in international economics. I would like to express my gratitude to Damien Neven for his suggestions and very valuable comments concerning the theory and empirical methods of industrial organizations and competition. I am also grateful to Reijo Mankinen, Antti Piispanen and Petri Rouvinen for their cooperation and to ETLA for many kinds of help. I am also indebted to the both pre-examiners: Pertti Haaparanta for his comments on empirical testing, globalization and transition economics; and Richard Baldwin for his thoughtful comments and suggestions in the fields of European integration and international trade. I would also like to extend my thanks to Paavo Okko, who gave valuable comments and advice to finish this thesis. This study was funded by the Foundation for Economic Education, the Academy of Finland and the Yrjö Jahnsson Foundation and I

4
would like to extend my gratitude to their financial support. In addition, I am indebted to John Rogers for his valuable comments to polish my English and Jånna Peltola, who edited the final report.
Finally, my sincerest appreciation goes to Soili, who gave her whole-hearted support all the time during this project.
May 2004
Jari Hyvärinen

5
CONTENTS
1 INTRODUCTION TO CONTRACTING THEORY AND INTERNATIONAL OUTSOURCING IN PRODUCTION .................... 9
1.1 Background ...................................................................................... 91.2 Literature Review – Theory and Empirics ..................................... 11
1.2.1 Contracting Theory ..................................................................................111.2.1.1 Agency Costs and Principal-Agent Model................................111.2.1.2 Transaction Costs and Incomplete Contracts...........................13
1.2.2 Theory of Integration vs. Outsourcing - How to Govern Make-or-Buy Decisions? ................................................................................................16
1.2.3 Multinationals, International Trade and Outsourcing ..............................201.2.4 Globalization: Integration of Trade and Disintegration of Production?...221.2.5 EU Outsourcing to East and Innovation Systems ....................................231.2.6 Empirical Background .............................................................................241.2.7 Statistical Review.....................................................................................28
PART I ............................................................................................................. 35
GLOBAL OUTSOURCING, COMPETITION, HUMAN CAPITAL AND R&D
2 EFFECTS OF COMPETITION TO OUTSOURCING IN INDUSTRIAL RECONSTRUCTION.................................................... 37
2.1 Introduction .................................................................................... 372.2 Theoretical and Empirical Background.......................................... 382.3 The Model ...................................................................................... 39
2.3.1 The Main Equations .................................................................................402.4 Empirical Testing of Outsourcing .................................................. 43
2.4.1 Data Definition and Variables..................................................................442.4.2 Econometric Results.................................................................................45
2.5 Summary ........................................................................................ 53
3 OUTSOURCING IN GLOBAL ECONOMY - CHOICE OF HUMAN CAPITAL AND R&D ............................................................................ 55
3.1 Introduction .................................................................................... 553.2 Theoretical Framework for the Global Outsourcing Model .......... 56

6
3.3 Main Contracting Equations between Final and Intermediate Firms............................................................................................... 573.3.1 Investment Contract for Prototypes......................................................... 583.3.2 Searching Partners ................................................................................... 593.3.3 Free-Entry Conditions ............................................................................. 60
3.4 Contracting Environment ............................................................... 613.4.1 Intensity to Search ................................................................................... 613.4.2 Choice of Human Capital and R&D........................................................ 623.4.3 Customization Costs and Human Capital ................................................ 643.4.4 Customization Costs and R&D................................................................ 65
3.5 Empirical Testing ........................................................................... 663.5.1 Hypothesis for Empirical Testing............................................................ 663.5.2 Data Definition and Variables ................................................................. 673.5.3 Econometric Results ................................................................................ 70
3.6 Summary......................................................................................... 76
PART II............................................................................................................ 79
OUTSOURCING, FDI AND INNOVATION SYSTEMS IN EUROPEAN INTEGRATION
4 INDUSTRIAL OUTSOURCING, FDI AND ORGANIZATION OF PRODUCTION IN THE CONTEXT OF EUROPEAN INTEGRATION...................................................................................... 81
4.1 Introduction .................................................................................... 814.2 The model....................................................................................... 824.3 Empirical implications ................................................................... 86
4.3.1 Hypotheses for testing FDI versus Outsourcing...................................... 864.3.2 Data Definition and Variables ................................................................. 874.3.3 Econometric Results ................................................................................ 88
4.4 Summary....................................................................................... 103
5 EU OUTSOURCING TO THE EAST, GOVERNANCE AND INNOVATION SYSTEMS IN THE BALTIC COUNTRIES – A THREE-STAGE APPROACH ............................................................. 105
5.1 Introduction .................................................................................. 1055.2 Overview of Baltic Industrial Base and Analysis of Outsourcing
and FDI in 1990-2000 .................................................................. 1065.2.1 Industrial Integration, EU-Baltic Outsourcing and FDI ........................ 106
5.3 Industrial Reorganization and institutional evaluation in Baltic Countries – A Three-Stage Approach .......................................... 112
5.4 Stage I: Macroeconomic Stabilization, Privatization and Financial Governance................................................................... 112
7
5.4.1 Macroeconomic Stabilization during Transition Period ........................1125.4.2 Privatization and Incentives for Innovation ...........................................1145.4.3 Financial Governance, Innovation and Ownership Modes ....................1225.4.4 Specific Features about Financial Governance and Contracting
Environment after Stage I ......................................................................1305.5 Stage II: Institutional Framework and Governance in Production132
5.5.1 Spontaneous Step-by-step Institutional Reconstruction and Transaction Costs Approach ..................................................................133
5.5.2 Institutional Framework and Quality of Legal System as Signaling Procedure ...............................................................................................134
5.5.3 Institutional Framework, Searching Costs, Customization Costs and Distance in Expertise..............................................................................137
5.5.4 Specific Features about Institutional Framework, Governance in Production and Contracting Environment after Stage II ........................141
5.6 Stage III: Governance in Innovation and EU Industrial Integration to the East .................................................................. 1435.6.1 Resource Capability Framework and Human Capital............................1445.6.2 Resource Capability Framework and R&D ...........................................1465.6.3 Organizational Structure for Human Capital and R&D .........................1505.6.4 Specific Features about Governance for Innovation, Managerial
Incentives and Contracting Environment after Stage III........................1525.7 Summation of the EU-Baltic Innovation System......................... 153
6 CONCLUSIONS................................................................................... 163
ABSTRACT................................................................................................... 165
TIIVISTELMÄ .............................................................................................. 167
REFERENCES .............................................................................................. 169
APPENDIX.................................................................................................... 181
Appendix for Chapter 1......................................................................... 181Appendix for Chapter 2......................................................................... 186Appendix for Chapter 3......................................................................... 188Appendix for Chapter 4......................................................................... 195Appendix for Chapter 5......................................................................... 199


9
1 INTRODUCTION TO CONTRACTING THEORY AND INTERNATIONAL OUTSOURCING IN PRODUCTION
1.1 Background
The common opinion among industrial economists is that in recent decades, industrial corporations have increasingly integrated into the new markets and these operations have mainly been accomplished by mergers, foreign direct investments or by some other deals like licensing and franchising aimed at bolstering the horizontal or vertical production structure of the firm. As a result, such integration has substantially shaped the industrial restructuring between countries and across industries. One of the causes for this development can be found from the larger scale of the world-wide liberalization of economic barriers. In other words, countries have taken part on a larger scale in the recent integration stages and the free movement of production factors with lowering costs in transportation and communication technology has acted as the main explanation for the diminishing costs in the world-wide industrial integration.
The development of the industrial structure seems, however, to be less straightforward. Recent research stresses that the restructuring of the industrial sector has merely focused on their “core” operations. This indicates that many manufacturing corporations have begun attempts to move their “Fordist” mass-production pattern to “modern manufacturing”, introducing high commitment to human resources and supplier relations policies, flexible manufacturing methods, and increased quality (Milgrom – Roberts, 1996). The most recent wave of such a fundamental change began in the United States, Canada and the United Kingdom during the 1980s in response to increased international competition. Also the European integration stage, in the 1990s, bulldozed the European firms more intensely into entering a world-wide competition and into major shifts in their restructuring strategies. Therefore, at the last decade’s economic integration stage, the industrial sector has - along with vertical and horizontal integration - attempted to distinguish its production by leaving only core operations in-house and outsourcing others, especially intermediate inputs and services.
Moreover, such a tendency increasingly supports the use of high-skilled employees and R&D for industrial innovations, quality requirements and

10
technological change. Several studies also claim that technological and know-how transfer foster accumulation of human and knowledge capital in low-wage countries and facilitate its survival in international production sharing. However, firms in developed countries prefer high-skilled employees especially in R&D even if wage costs are high. R&D has a positive impact on performance and product quality and it relates positively with outsourcing.
The final producers have to decide whether they produce their intermediate products by FDI or outsourcing. The decision depends on how the productivity level and the factor prices differ across countries. They should also notice the peculiarities of both of these integration modes. Outsourcing is more efficient in producing the inputs, but the bilateral relationships between the parties create customization costs and the relation-specific investments are sunk if the partnership fails. Alternatively, the foreign subsidiary is more secure but the transaction costs are higher and it is therefore less productive than outsourcing.
The efficient partnership between final and intermediate producers requires the sufficient infrastructure. This is an urgent topic when the Baltic countries are joining the EU. These countries need a new national innovation regime that combines financial governance with governance in production and governance in innovation. The Baltic countries will be able to survive in the future enlarged EU market competition when the contracting environment with the EU firms and foreign direct investments are assured.
This introduction discusses the theoretical and empirical background of the study. First, this section examines the main theoretical foundations of the traditional contracting theory based on the research fields such as agency costs and principal-agent model in order to analyze the incentives of each economic actor. Second, the main foundations of the transaction costs theory is shortly reviewed; a general outline of an incomplete contracting theory as well as recent research and new developments of these topics are examined. Third, the main core, integration versus outsourcing theory, is briefly discussed and recently investigated foundations are reported from Grossman and Helpman (2002a,b,c). Next, the theory of multinationals and international trade is discussed from the perspective of several papers such as Markusen (1995, 1997, 1998), Markusen and Venables (1998, 2000). Then the approach of the EU outsourcing to East and EU-Baltic innovation system are presented. The end of this introductory chapter presents a survey of empirical foundations and statistical review of this research field.

11
1.2 Literature Review – Theory and Empirics
1.2.1 Contracting Theory
Over the past several years, the theory of the firm has experienced revolutionary development. The theoretical foundation for the organization of the firm structure was laid by the classic article by Coase (1937), which demonstrated that the incentive for the firm to procure in the market or to produce for their own requirements is premised on the comparative transaction cost differences. Despite the fact that this article is almost 60 years old, the main theoretical and empirical achievements have been established in the last 20 years. One key foundation was the establishment of contracting theory. A so-called “new theory of the firm”, and more specifically, the literature on contracts have largely improved the understanding of firm and fleshed out the shortcomings of neo-classical theory. When the traditional neo-classical model explained the firm as a production function just maximizing its profits and adjusting its production to the market circumstances (March – Simon, 1958; Mariss, 1964), “the new theory of the firm” approach took one step forward and expressed firms as a bunch of contracts. That is, when firms created new product solutions, production processes and organization modes to foster their competitiveness in the market, they should establish and maintain these contracts by renegotiating continuously with their participants. The following fields of research on contracts in organizations have dispersed into the topics such as agency costs and principal-agent (Jensen – Meckling, 1976; Holmström, 1982; Hart – Holmström, 1987), incomplete contracts (Alchian – Demsetz, 1972; Grossman – Hart, 1986; Hart, 1995b) and transaction costs(Williamson 1975, 1985).
1.2.1.1 Agency Costs and Principal-Agent Model
Jensen and Meckling (1976) formed a model by describing how the organization of the firm created agency costs, and how an optimal capital structure was a crucial factor in minimizing these costs. The model predicted that after the contract was signed there should be a monitoring “set-up” in order to control each other’s behavior. The central way of monitoring such a contract was to maintain principal-agent relationships. This theoretical approach was developed by, for example, Holmström (1982) and Hart – Holmström (1987). The traditional principal-agent relation was investigated as follows. The principal has the property right to control the investing of the firm’s assets. Therefore the principal (final producer) makes a contract with an

12
agent (intermediate input producer) and assumes that the intermediate producer will fulfill his incentives. This theory of a two-tier organization design, however, highlighted the fact that there is asymmetric information in contract and deviating incentives in objectives between the principal and agent. The principal-agent theory explained the incentives between actors but it exhibited inadequacies in defining the boundaries of the firm.
According to Hart (1995a), the principal-agent theory is essential for establishing the importance of ”hidden” information. While the neo-classical theory assumes that all efforts and costs are observable, the principal-agent approach instead shows that some of the costs are created because of the private information. In the public-owned firm, principals (shareholders and creditors) have various risk-return demands to be fulfilled by the hired manager who has to put their funds to productive use and generate returns with suitable risk on their funds. The problem, which is absent from the neo-classical framework, is that the manager’s effort is defined and known only by him. Therefore, the compensation cannot be measured from the effort because all the other parties, such as principals, do not observe it, and this is the reason why it must be formed from the realized profit.
When the manager’s compensation can be measured from the realized profit, the principals and agent will sign a contract, which specifies his responsibilities and claims according to the financiers’ funds. There are two fascinating phenomena regarding such contracts. The first is that the contract can be used to specify how to adjust incentives to risk. If the manager’s compensation is highly sensitive to profit, then the risk is assumed higher, and if compensation is insensitive to profit, then the purpose is to reach “lower” incentives. The second phenomenon is that such a contract can be used to determine performance-related compensation as stock options or extra shares. The principals can earn an extra bonus if the ex-ante measured profit level is reached (Hart 1995a).
To quote Hart (1995a,b), the principal-agent model relates to the incentives between owners and manager but there are two shortcomings in this model called comprehensive contracts and boundaries of the firm. Firstly, the contract is called comprehensive in circumstances when “it specifies all parties’ obligations in all future states of the world.” In such circumstances the question “how to govern” assets is unnecessary because, as determined in the multi-period principal-agent model, the initial contract specifies all conditions in advance. Thus the governing question matters only if some decisions in the future are poorly determined in the initial contract, and a governance structure is needed to make these decisions. Secondly, the principal-agent model has turned out to explain the internal organization of firms but is incapable of outlining the boundaries of the firm. The problem here is that the incentive

13
schemes formed in the principal-agent contract do not distinguish whether firms are operating individually or when the balance shifts in favor of an integrated organization. The principal-agent approach offers the same incentive schemes even if firms are operating with an arm’s length contract or their operations are merged to one single firm.
1.2.1.2 Transaction Costs and Incomplete Contracts
After papers of Coase (1937) and especially Williamson (1975, 1985), much attention has been directed to how the transaction costs could pin down the boundaries of the firm. The cornerstone of Coase’s intuition is that the optimal firm size is reached when it is equally costly to expand firm size (production) by using the market transactions as it is to produce inside the firm. If transaction costs are higher using the market than internal production, then the firm should produce this process inside the firm, as long as there is no difference in the production costs between the market and the internal alternative. Therefore, based on the theory of transaction costs and incomplete contracting, it is fascinating to discuss the main foundations regarding why make-or-buy decisions are endogenous and the how-to-govern approach seems crucial.
As discussed in the previous chapter, the main foundation concerning the principal-agent contracting approach is that such contracting is costly and parties try to find as complete contracts as possible to govern in order to minimize costs. As Holmström and Tirole (1989) denoted in their survey: “The main hypothesis is that contractual designs, both implicit and explicit, are created to minimize transaction costs between specialized factors of production”. Even if this hypothesis investigates the relationships between contracts and costs there are compelling reasons to reconsider also this finding. One reason is that the significance of contractual design to minimize costs is noticed, but still there remains an unsolved question of how firms can solve contractual incompleteness by organizing their actions to minimize these costs. As noted in Hart (1995b) the principal-agent approach misses this recognition that the contract itself is costly, and agency theory itself causes some costs because of its lack of “the comprehensive contracts”.
To begin the discussion of comprehensive contracts one should notice that the main definition of the incomplete contract approach is that “they leave something out or are ambiguous.”1 Thus, the incomplete contract approach is 1 See Hart – Moore (1999)

14
introduced as misbehavior between the firms and their interest groups. Such a contractual relationship is composed of expectations of each other’s roles and behavior, and some unexpected behavior after the contract is signed can exist, i.e., ex ante contracts are unable to predict stochastic or unpredictable transactions ex post (Foss 1997). In other words, the main framework on why transaction costs exist is the same as reasons for incomplete contracts. According to the study by Foss, in the complex and highly unpredictable world, misapprehensions occur because the plans might contain a set of contingencies, which are impossible to forecast. Even if they can form these plans, they fail in contracting due to difficulties in finding a common language to negotiate the states in the future. Finally, the insufficient and asymmetric information leads to the bounded rationality and non-verifiable issues, which cause conflicts when the relevant information remains private ex post.
Moreover, it should perhaps be added that O. Williamson has exclusively developed transaction cost economics. He presented a central approach to understand the common relationships between transactions and costs: “economic activity will be organised so as to economise on production costs plus transaction costs…and has concentrated on the identification of transaction attributes that generally effect the comparative performance of alternative governance structures in a world of selfish, bound rational actors, asymmetric information and incomplete contracts.”2 Concerning this citation, Holmström and Tirole (1989) summarized that as firms organize their production, they should first, tend to enhance favorable incentives and avoid conflicts between interest groups and, second, decrease asymmetric and imperfect information.
According to Williamson (1975, 1985), the main sources for transaction costs are frequency, uncertainty and asset specificity. Firstly, when frequency is high, it is less costly to produce it inside the firm or make a long-term arm’s length contract with some individual firm. Secondly, external circumstances mainly increase uncertainty more than internal circumstances and if a transaction is specific and needs to be continuous, the firm is then in favor of contracting internally due to possible high transaction costs in the market. Finally, when assets are characterized as specific, these circumstances would lead to a potential hold-up and, therefore, as the asset specificity increases, it would be less costly to govern internally. Moreover, the hold-up problem has also been investigated when there is a case of irreversible investment of assets. The basic explanation of such investment is that contracting parties are committed to interact ex post because the investment has a higher value in this 2 See further discussion in Schmalensee (1988)

15
case than if used for some other purpose. Therefore, if ex ante contract is incomplete, the ex post profits are dependent on the bargaining positions3. As contracts are incomplete and transaction costs occur, depending on both the internal and external circumstances of the firm, then the how-to-govern approach is justifiable for follow up and makes decisions based on each change of the determinants - as described above – for generating these costs.
From the shortcomings in contracts considered above, it is clear that the parties are unable to write comprehensive contracts. Naturally, when contracts cover many “wild cards” of future actions, these are incomplete. Therefore, the basis of these incomplete contracts comes from the assumptions and hunches that the parties decide on each other’s behavior. If parties aspire to implement the improvements of contracts to push them as workable as ‘necessary’, they have to renegotiate these contracts immediately when new information arises. In such a context, the how-to-govern approach is reasonable because otherwise it is unclear as to who will occasionally renege and improve such incompleteness. As Hart (1995a) puts it more precisely, the governance structure allocates “residual rights of control over the firm’s nonhuman assets”. The above citation argues that the residual claimant has the right to decide how to use the assets which are incomplete and specified in the initial contract (see Grossman – Hart, 1986; Hart – Moore, 1990; Hart 1995b). For example, the ownership of the firm presumes that owners have incentives to control the use of these assets in order to avoid opportunistic behavior by the management.
The recent literature has presented some critical aspects against incomplete contracting due to its lack of rigorous foundations. A recent study by Maskin and Tirole (1999) critically discusses the postulation of significant transaction costs and the use of dynamic programming. They argue, “the rationality needed to perform dynamic programming is in standard models strong enough to ensure that transaction costs are irrelevant”. This proposition indicates that they reject the argument of bounded rationality. They further imply that even if transaction costs are significant in reality there are clear shortages in theoretical contracting models. This argument is based on the evidence, as Maskin and Tirole (1999) argue that agents could probabilistically forecast their payoffs in advance because agents are able to perform dynamic programming. Moreover, they established shortcomings in the theory of renegotiating to show that optimal contracting solves such a problem when parties can commit not to renegotiate. Hart and Moore (1999) responded that optimal contracts are partially incomplete. In their model, it is costless to 3 See further discussion: Holmström – Tirole (1989)
16
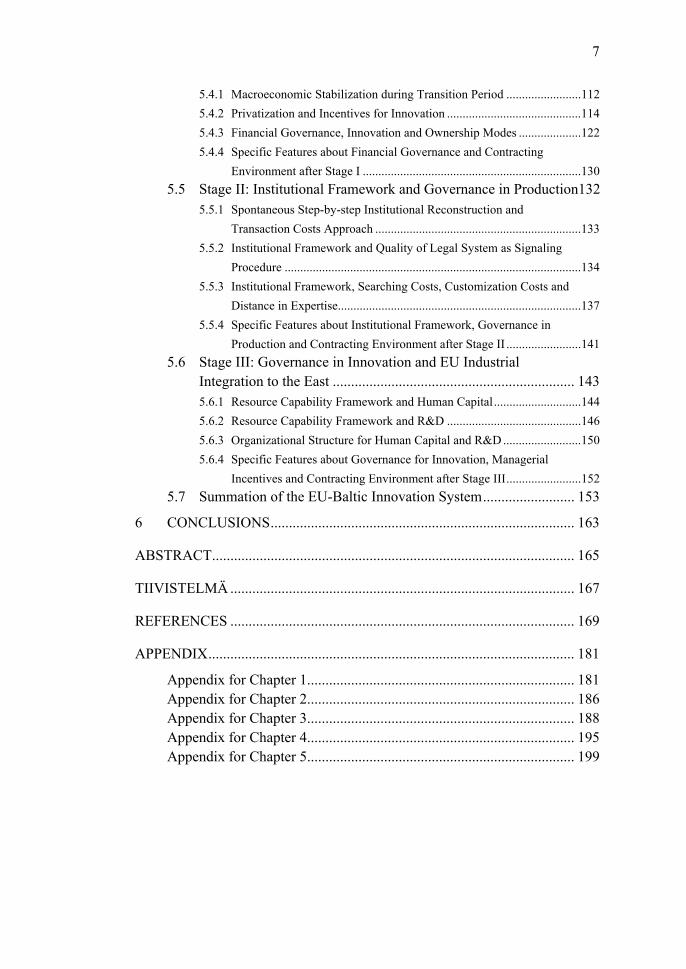
delineate the set of possible trades in advance, signifying that trades are describable. In contrast to the Maskin-Tirole framework, Hart and Moore (1999) presumed that “parties to a contract are unable to commit not to renegotiate their contract”. Finally, they answered the question what should be an “optimal” degree of commitment. From their point of view “it is something about which reasonable people can disagree”.
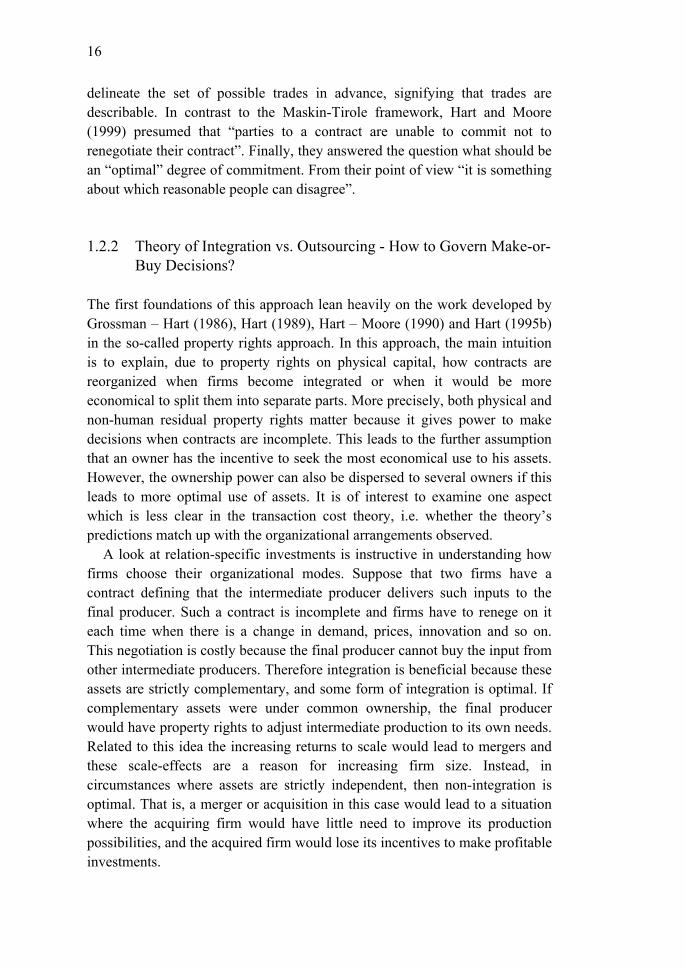
1.2.2 Theory of Integration vs. Outsourcing - How to Govern Make-or-Buy Decisions?
The first foundations of this approach lean heavily on the work developed by Grossman – Hart (1986), Hart (1989), Hart – Moore (1990) and Hart (1995b) in the so-called property rights approach. In this approach, the main intuition is to explain, due to property rights on physical capital, how contracts are reorganized when firms become integrated or when it would be more economical to split them into separate parts. More precisely, both physical and non-human residual property rights matter because it gives power to make decisions when contracts are incomplete. This leads to the further assumption that an owner has the incentive to seek the most economical use to his assets. However, the ownership power can also be dispersed to several owners if this leads to more optimal use of assets. It is of interest to examine one aspect which is less clear in the transaction cost theory, i.e. whether the theory’s predictions match up with the organizational arrangements observed.
A look at relation-specific investments is instructive in understanding how firms choose their organizational modes. Suppose that two firms have a contract defining that the intermediate producer delivers such inputs to the final producer. Such a contract is incomplete and firms have to renege on it each time when there is a change in demand, prices, innovation and so on. This negotiation is costly because the final producer cannot buy the input from other intermediate producers. Therefore integration is beneficial because these assets are strictly complementary, and some form of integration is optimal. If complementary assets were under common ownership, the final producer would have property rights to adjust intermediate production to its own needs. Related to this idea the increasing returns to scale would lead to mergers and these scale-effects are a reason for increasing firm size. Instead, in circumstances where assets are strictly independent, then non-integration is optimal. That is, a merger or acquisition in this case would lead to a situation where the acquiring firm would have little need to improve its production possibilities, and the acquired firm would lose its incentives to make profitable investments.

17
If for example the final producer’s human capital is essential, then integration where it owns both assets (final and intermediate) is essential. This definition implies that the final producer’s human capital is essential if the intermediate producer’s marginal return from investment is not enhanced by the presence of both assets in the absence of the final producer’s human capital (Hart 1995b). Therefore, the final producer’s human capital is superior compared to an intermediate producer, and assets are in more efficient use if the final producer has property rights with respect to both assets.
As examined before, the firm’s aim to organize its actions is to minimize transaction costs, and the central question is how to govern when the firm is outsourcing or integrating its activities. The hypothesis that the governance structure is crucial for the profitability of the firm has broadened perspectives to outline boundaries how firms organize their production. A pioneering study by Grossman and Hart (1986) expanded these implications by evaluating the residual decision rights in contracting. In their study, integration can be vertical or lateral depending on the production decisions defined with ownership rights. A simple description of the Grossman-Hart analysis is as follows. When an owner controls two separate assets, then vertical integration dominates. If ownership is dispersed to two different owners, lateral integration (e.g. outsourcing) tends to prevail. As Grossman and Hart noted: “the parties can, in principle, contractually specify exactly who will have control over each dimension of each asset in each particular future contingency”. The key intuition is that contracting skills of owners are crucial when the contract is unable to specify the exact courses for action in prospective investment strategies.
Two variables appear to be chief candidates modeling the association between outsourcing and integration. A hold-up problem of assets would exist if production were organized by outsourcing; the asset specificity would exist if production were carried out through the vertical integration. If contracting theory indicates that the complexity of contracts generates asset specificity and a potential hold-up problem, the next question is how these events should be concerned. Several theoretical investigations have discussed how asset specificity or a hold-up problem could be composed4. Klein et al. (1978) found that if an investment fulfills a contract between a supplier and buyer then it binds relation-specific assets. The main specification is that there is asset specificity on such a contract emphasizing that the value of investment is lower in some other use than in this specific relationship. Because it is
4 Klein – Crawford – Alchian, 1978; Riordan – Williamson, 1985; Williamson, 1985; recently Foss, 1997; and Grossman – Helpman, 2002a, b & c.

18
impossible to write a contract that covers all transactions between actors, such a contract is incomplete and creates the possibility of a hold-up problem.
The game theoretic approach of international openness and vertical integration has been modeled by McLaren (2000). This study is build on the industrial organization theories by Williamson (1989), Klein et al. (1978) and Grossman-Hart (1986) and analyzes the relationship between the thickness of the market and globalization. The model implies how the upstream firms fine-tune their specialization in order to protect themselves from the hold-up and might reach that way the comparative or absolutely advantage in the market. The upstream firms live in environment where is uncertainty about costs, quality, or technology. The model shows by using reaction functions that globalization raises the incidence of independent supply and leads to a welfare improvement. In other words, the international openness thickens the market and facilitates leaner, less integrating firms and reduces the risk of negative externality in case of vertical integration.
The traditional trade models are also been investigated to model the international input trade. Jones (2000) base his foundations to the Ricardian and Heckscher-Ohlin model in order to investigate what transformations of these models can be done by admitting trade in inputs. The focal assumption is that capital is the mobile factor but labor is the immobile factor. This approach exploits the specific-factors production structure to explore the input trade in different dimensions. The first exploitation is a simple model of a foreign enclave in order to show how the capital flow to some enclave encourage the production of specific product and also boosts the demand of local labor. Jones continues to generalize this enclave structure to two final products. Next the specific-factor model is extended to the intermediate products as called middle-products model where the final goods are non-tradable. The input-tier produces intermediate products that are traded to the non-tradable output-tier. This approach can be used to analyze how the price of the final product is related to the price of the intermediate product. Moreover, it is a useful tool to explore the effect of intermediate trade on factor prices and income distribution because intermediate trade affects both the price of the mobile factor (capital) and also the price of immobile factor (labor).
The models by Grossman and Helpman (2002a,b,c) are recent studies on integration and outsourcing. The spirit of these studies adapts for empirical implications. The study by Grossman and Helpman (2002a) presents an equilibrium model of industrial structure where the organization of firms is demonstrated as endogenous, and consumer products are differentiated and produced either by vertically integrated firms facing monopolistic competition, as in Dixit and Stiglitz (1977), or by pairs of specialized firms. In the vertically integrated firm, the whole production process is organized inside

19
the firm but it faces high costs of governance. In the production by the specialized firms (outsourcing), the governance problem is lower but input suppliers face a potential hold-up problem. The model examines how the degree of competition in the market and other parameters affect the equilibrium choices, and how the equilibrium compares with the efficient allocation.
Grossman and Helpman (2002a) found that outsourcing in highly competitive markets requires a large per-unit cost advantage for specialized input producers compared to integrated firms. That is, with strong competition, outsourcing is unlikely, because it would take a huge cost disadvantage for an integrated firm - the pricing efficiency associated with disintegration is too important. Instead, with little competition, cost differences or pricing inefficiencies do not matter. Outsourcing is then unlikely because it would take huge governance costs associated with integration. Consequently, first, the advantage is relative, depending on the pricing disadvantage due to the hold-up problem in the specialized relationship, and second, the viability of outsourcing is highly related to the sensitivity of manufacturing costs because of the detailed characteristics of the intermediates.
Another study by Grossman and Helpman (2002b) examines an equilibrium model of production and trade when firms look at potential outsourcing partners at home and abroad in a global economy. Searching for partners is costly and firms make their matches by comparing costs and productivity differences in labor and technology between home and other countries. After matching, the final and input producers sign an investment contract and it binds both parties to make some relation-specific investment, that is, the investment is governed by an incomplete contract. Improvements in the contracting environment, such as labor cost differences or technology, raise the possibility for final producers to outsource their activities.
The third study of Grossman and Helpman (2002c) is based on the same ideology as previous studies (2002a) and (2002b). It investigates the trade-off between FDI and outsourcing. Each manufacturer produces differentiated products but specialized producers are more productive because of their specialized skills and more sensitive to the changes in labor costs than vertically integrated producers with FDI. In contrast, the incomplete contracting and hold-up problem overshadow such efficiency. To produce with FDI, there is no hold-up problem but the production processes are less efficient because of the transaction costs.

20
1.2.3 Multinationals, International Trade and Outsourcing
In the recent theory of multinational enterprises (MNE) and international trade, more attention is directed to specific topics such as FDI, scale economies, firm-specific assets, imperfect competition, and product differentiation5. A sound presentation of this approach is shown by Markusen (2002) that draws the survey of his own theoretical and empirical research. Even if the MNE and international trade approach is achieved by general-equilibrium trade models without transaction cost or incomplete contract contexts, there are various interfaces between MNE and trade, and the theory of integration vs. outsourcing by Grossman – Helpman (2002a,b,c). Next we discuss briefly each of these similarities based on Markusen (2002) and Grossman-Helpman models.
First, foreign direct investment and scale economies. Markusen (1995) puzzles: “even if functions of multinational are derived as foreign direct investment, why might the firm choose direct investment versus some type of alternative mode of entry?” Most integration versus outsourcing studies find that outsourcing is advantageous when transaction costs, in an upholding outsourcing relationship are lower than can be attained by intermediates themselves. To find such a solution, final producers search for possible intermediate suppliers from abroad by comparing country characteristics such as labor costs, productivity and availability of technology (Grossman – Helpman, 2002b). In the context of global outsourcing, firms import intermediate inputs and export final products back to the international market.
The theory of MNE and international trade has discovered several dimensions. Firstly, in the single firm context, a firm’s location decisions are based on the high trade costs, the relationships between domestic and foreign production costs and technology transfer costs (Markusen, 1984; Levinsohn, 1989). Secondly, in the monopolistic-competition context by Dixit-Stiglitz (1977) horizontal multinationals seem to be dominant when countries have relative endowments or one country is smaller with skilled labor, and with higher trade costs and higher firm-level scale economies (Markusen – Venables, 2000). Next, in the context of vertical multinationals and intermediates, a multinational’s eagerness to invest in developing countries is dependent on the advantageous availability of local skilled labor and the level of infrastructure such as telecommunications or transport utilities. The scarcity of skilled labor rapidly diminishes the advantages to produce abroad. Such an approach is also investigated in Grossman – Helpman (2002c) that the 5 e.g. Markusen 1995, 1997, 1998; Markusen – Venables 1998, 2000

21
differences in labor productivity drive firms to find a suitable partner abroad but labor productivity is more pivotal in outsourcing than in FDI. As well, with high transport costs, the country size of the intermediate producer matters because there is insignificant demand in the smaller country and a large part of the intermediates should be transported back to the host country. When transport costs are low, the significance of country size disappears (Zhang – Markusen, 1999).
Second, firm-specific assets and knowledge capital. From the intermediate suppliers perspective, the asset specificity is defined as follows: when the intermediate supplier has invested in machinery in order to produce some specific input, this investment has a lower value in some other use. This creates a hold-up problem for the intermediate supplier. From the final producer’s perspective, as Domberger (1998) puts it, they can concentrate on core know-how, outsource other production stages and increase flexibility and cost efficiency inside the organization. Thus, outsourcing would transform the cost structure at the whole industrial branch level because the share of fixed costs would be diminished in such a way. The MNE and international trade literature has found several similarities. To quote Markusen (1995), “multinationals tend to be important in industries and firms in which intangible, firm-specific assets are dominant. These assets are classified as knowledge capital, ranging from proprietary product or process know-how.” The knowledge capital is defined as the main advantage of the MNE, and it augments physical capital as a secondary asset. Moreover, Markusen (1995) classifies three other advantages of the MNE; ownership advantage, which could be products or processes to which other firms have no access; location advantage, which makes it more profitable to produce abroad than in the home country; internalization advantage, when it is more advantageous to produce abroad than export.
Third, imperfect competition and product differentiation. According to Grossman and Helpman (2002a), outsourcing exists if the degree of competition is far from perfect competition but the differentiated products are sufficiently substitutable, thus there is not excessive monopoly power. Moreover, vertical integration follows monopolistic competition by Dixit-Stiglitz (1977). In the MNE and international trade literature, multinationals dominate industries which produce technically complex products and have high levels of product differentiation. Multinationals are in a central position, for instance, when industries are classified by scale economies and imperfect competition (Markusen, 1995).

22
1.2.4 Globalization: Integration of Trade and Disintegration of Production?
Factors of production have become increasingly mobile during the ongoing global integration process. This has been contributed to, and has also been partly driven by, the multiplication of international trade, the deregulation of financial markets, or the liberalization of capital markets and the revolution of information technology. In the current world economy, labor, but especially capital and technology move more or less freely between countries. The literature of this approach is extensive and recent research includes for instance several foundations. A sound survey of trade liberalization and globalization as well as the opposition against globalization is discussed by Hillman (2003). This study, for example, points out that outsourcing and trade liberalization have raised the question of labor standards such as child labor and the environment issues in the poorer countries. In the field of open macroeconomics, Wyplosz (1999) presents the extensive survey of the financial restraints and liberalization after the Second World War in Europe. Wyplosz (2001) also observes that financial liberalization is more harmful and destabilizing in the developing countries when compared to the developed countries. Moreover, Blanchard and Giavazzi (2001) consider the effects of deregulation in goods and labor markets since 1970s in Europe. Even if these essential issues are worth considering when discussing about the effects of globalization as well as the roots of the outsourcing approach, this study skips these topics and focuses only on the effects of the factors that might improve the demand and trade of real intermediate products. These factors chosen in this study are input quality and production costs.
There are some specific features differentiating the current globalization stage from earlier economic integration stages. First, Baldwin – Martin (1998) observed that the ongoing global integration process influences a larger scale of countries than previous integration stages. Second, they determined that migration plays a less significant role but the growth of information and capital movements seems to expand rapidly. The increase of information and communication technology has radically diminished transportation and communication costs. Such a development has several advantages concerning the behavior of MNE when advanced information and communication technologies make it possible to more efficiently control and decentralize the MNE operations (Pajarinen et al. 1998). Third, when international trade has been liberalized and integrated expeditiously, the main foundation is that the structure of trade implies more specialization in production between countries. According to recent research, trade on developing countries shifts away from agriculture and raw materials and towards manufactured goods, and more
23
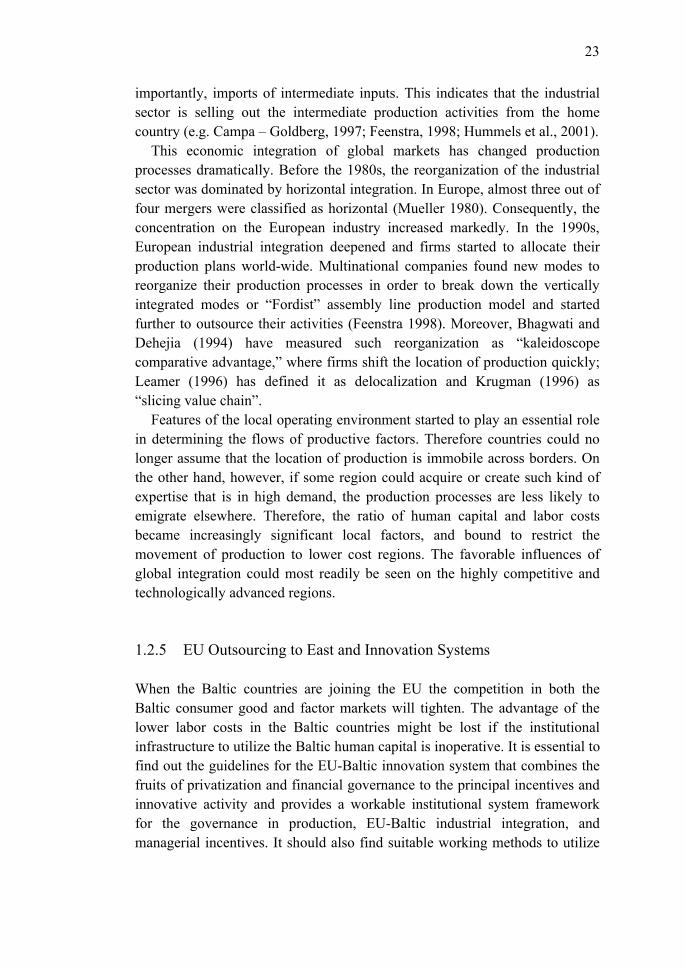
importantly, imports of intermediate inputs. This indicates that the industrial sector is selling out the intermediate production activities from the home country (e.g. Campa – Goldberg, 1997; Feenstra, 1998; Hummels et al., 2001).
This economic integration of global markets has changed production processes dramatically. Before the 1980s, the reorganization of the industrial sector was dominated by horizontal integration. In Europe, almost three out of four mergers were classified as horizontal (Mueller 1980). Consequently, the concentration on the European industry increased markedly. In the 1990s, European industrial integration deepened and firms started to allocate their production plans world-wide. Multinational companies found new modes to reorganize their production processes in order to break down the vertically integrated modes or “Fordist” assembly line production model and started further to outsource their activities (Feenstra 1998). Moreover, Bhagwati and Dehejia (1994) have measured such reorganization as “kaleidoscope comparative advantage,” where firms shift the location of production quickly; Leamer (1996) has defined it as delocalization and Krugman (1996) as “slicing value chain”.
Features of the local operating environment started to play an essential role in determining the flows of productive factors. Therefore countries could no longer assume that the location of production is immobile across borders. On the other hand, however, if some region could acquire or create such kind of expertise that is in high demand, the production processes are less likely to emigrate elsewhere. Therefore, the ratio of human capital and labor costs became increasingly significant local factors, and bound to restrict the movement of production to lower cost regions. The favorable influences of global integration could most readily be seen on the highly competitive and technologically advanced regions.
1.2.5 EU Outsourcing to East and Innovation Systems
When the Baltic countries are joining the EU the competition in both the Baltic consumer good and factor markets will tighten. The advantage of the lower labor costs in the Baltic countries might be lost if the institutional infrastructure to utilize the Baltic human capital is inoperative. It is essential to find out the guidelines for the EU-Baltic innovation system that combines the fruits of privatization and financial governance to the principal incentives and innovative activity and provides a workable institutional system framework for the governance in production, EU-Baltic industrial integration, and managerial incentives. It should also find suitable working methods to utilize

24
the Baltic resource capabilities and form the organizational structure for the suitable governance of innovation and managerial incentives.
After stabilizing the macroeconomic environment, a sound structure for financial institutions is a cornerstone for the Baltic innovation activity. The functioning national banking sector and foreign investors are the main sources of funding for the Baltic firms. Finding the core investors abroad helps the Baltic firms to install the new methods of corporate governance and managerial incentives as well as EU market-based information, know-how and innovation networks.
Quality of legal system guarantees each other’s legal obligations, and therefore it has a signaling effect to the integrating EU-Baltic firms. Moreover, a functional institutional framework decreases outsourcing costs and distance in expertise. The Baltic governments should be active in building the serviceable communication infrastructure that reduces the searching costs in contracting between parties. Finally, the success for reducing customization costs and distance in expertise rests on the workable education and R&D policy.
Skilled human capital acts as a key factor in the EU outsourcing process and this generates the final producers’ incentives to search for their conceivable partners from the Baltic firms. This development should lead to the skill spillovers that need a critical mass and at least the Baltic capitals, Tallinn, Riga and Vilnius, fulfill such a purpose. Moreover, the technological regimes of the EU-Baltic innovation system might be fulfilled with the model that supports creative destruction with the technological regimes where cumulativeness and appropriability are low but the role of applied sciences and externalities from the EU is found to be remarkable. Externalities are required to maintain the rapid technological change in the Baltic countries where the innovations need interactive R&D co-operation with the EU firms and technological programs.
1.2.6 Empirical Background
An extensive amount of empirical work has been carried out to explain the determinants and effects of industrial integration. This testing, however, has been twofold. Before the 1980s, the main empirical interest was directed at horizontal mergers. The reason was that most mergers, around 75 per cent depending on industrial sectors and individual countries, were classified as

25
horizontal modes. In the pioneering cross-country6 study of mergers in the 1960s by Mueller (1980), the main effects of firm size and profitability were determined and were hypothesized that “acquiring companies tend to be large, fast growing and highly levered companies compared to acquired firms”. Concerning the determinants, this study demonstrated that the economies of scale motive was rejected: merging firms were as big or bigger than, on average, firms in each industrial sector and many of the acquired firms were small. This result also showed that aggregate concentration held steady in the 1960s. Andrade, Mitchell and Stafford (2001) found that US merger activity in the 1980-1990s has been strongly clustered by industry and deregulation has been a dominant factor in merger and acquisition activity in the US after the 1980s. In Europe, Lyons and Sembenelli (1996) found that “mergers may have been more to exploit sales opportunities than economies of scale”, and became more aware of deregulation motives as regulations and possibilities in the Single Market after the end of 1980s.
There has been also another empirical field to estimate the effectiveness of industrial integration. These empirical results based on the effects of mergers in recent decades seemed to be discouraging. Based on the study by Mueller (1980), profitability developments after mergers were in consistent in the 1960s. In some countries there was evidence that merging firms found slightly superior performance than their counterparts, or, as in the UK, these firms functioned relatively better after the merger, but in some countries, a decline in profitability was found. Consistent with Mueller’s results, Ravenscraft and Scherer (1988) reported that acquired companies in US in years 1950-1977 were more profitable than otherwise similar non-acquired firms, but their profitability declined steadily after the merger. Meeks (1977) found similar results with the UK data that mergers caused modest declines in profitability.
Much empirical research has been examined on the magnitude of integration as estimated by the increasing trade share of production. The survey of these results can be found from articles such as Feenstra (1998). Also the focal foundation was that international trade in R&D products and especially in R&D services has increased rapidly (e.g. Emmerij 1992). Moreover, the empirical evidence found a significant positive correlation between trade and R&D investment. For example, Fagerberg (1996) estimated the relationship between technology, competitiveness and trade, and reported that a higher R&D investment ratio as a percentage of GDP would lead to a higher market share in export markets. According to this paper, technology had an unchallenged effect on success in terms of market shares in 6 Belgium, Germany, France, Netherlands, Sweden, the United Kingdom, the United States

26
international trade. He found three explanations: i) the role of R&D and innovations had essential implications even if countries were not technology leaders; ii) the size of home markets had a significantly important role in the investments of extremely high R&D. The R&D and innovations upheld national competitiveness both in the big and small countries. However, the small country should invest for more bundles of technologies than concentrate on only one specific technology; iii) R&D spillovers to other firms and fields were vital for keeping up competitiveness. These results were close to studies such as Sutton (1991) and Davies – Lyons (1996). They investigated that the incentive to make R&D investments depends on the market and where the benefits can be spread. Therefore, the expenditures on R&D were a main source of the vertical differentiation, and these investments were sensitive to the degree of economic integration of the EU as well as world-wide.
The hypothesis of regional convergence of output per capita levels has been widely tested recently. The main result is that worldwide data establish absolute both - and -divergence (Barro – Sala-i-Martin, 1995; Sala-i-Martin, 1996). This indicates that even if an increasing number of countries is participating in the globalization process, it has not culminated in the equalization of output levels between poor and rich countries. However, in some regions such as in OECD countries, Europe and between regions inside each of these countries, these results were more encouraging. These results showed that regional income levels converge both absolutely and conditionally (Barro – Sala-i-Martin, 1995; Hyvärinen, 1997). Moreover, many papers showed that factors such as investment in machinery, technology, education and training were acting as the main phenomena explaining the increase of income per capita and employment (e.g. Fagerberg – Verspagen – Caniels, 1997; Hyvärinen, 1999).
In recent years, empirical implications have expanded to test outsourcing as an essential measure in disintegration of production. Even if, however, the implications of such a topic for factor prices, production and trade patterns have been widely discussed in the theoretical field, empirical testing on vertical specialization has been inconclusive. Recent studies by Audet (1996), Campa – Goldberg (1997), McMillan (1995), Hummels et al. (2001) and Yeats (2001) have focused on defining the impacts of vertical specialization, intra-product specialization and global production sharing by using more accurate classified intermediate input or parts and components data from the input-output tables. They have found rapid specialization in industries such as textiles, apparel, footwear, industrial machinery, electrical equipment, transportation equipment and chemicals & allied products. Furthermore, Abraham and Taylor (1996) have provided evidence of rising outsourcing of business services in thirteen U.S. industries and Helper (1991) in parts of the

27
U.S. automobile industry. Next we review the main foundations of these studies.
Campa and Goldberg (1997) defined outsourcing “as external orientation of its industries which involves measuring the extent to which manufacturers sell products to foreign markets, use foreign-made inputs, and, more indirectly, compete with foreign manufacturers in domestic markets throughout imports”. They presented three measures of external orientation for the manufacturing industry in four countries7: export revenue share, imports relative to consumption, and imported input share in production. They compressed their results as, first, in the UK, the US and Canada, the levels of these measures have increased considerably in the last two decades – especially in the UK and Canada; second, industries with the high export share in the 1970s remained export-oriented also in the 1990s, and industries with a high dependency with imported inputs remained imported input-oriented in the 1990s; third, by testing net external orientation it seems that, unlike in Japan, the US industries shifted drastically between the early 1980s and the early 1990s. To sum this up, the external orientation patterns of the UK and US industries have similarities and they are becoming alike, and – in their use of imported inputs - manufacturing industries in Japan are becoming dissimilar when compared to the UK, US and Canadian industries.
Hummels et al. (2001) stressed the vertical specialization as the imported input content of exports and estimated the results in 10 OECD countries8 and four emerging countries9. They reported that the share of vertically specialized exports within total merchandise exports have increased gradually in the OECD countries – particularly in France, the United Kingdom, the United States and in Mexico from 1970 to 1990. Moreover, they found that the vertical specialization share increased around 30 per cent during 1970-1990, and growth in vertical specialization exports accounted for a 30 per cent share of the growth of the overall export/GDP ratio.
Yeats (2001) called the recent industrial reconstruction as production sharing where several countries participate, at different stages, in the manufacturing of a specific good. Stage production is located in the countries where it can be produced most efficiently and at the lowest cost. The first stage of production sharing was in the 1960s between the developing and industrial countries. This stage included labor-intensive, vertically integrated and internationally oriented industries such as the electronics industry in East 7 Canada, Japan, the United Kingdom, the United States 8 Australia, Canada, Denmark, France, Germany, Italy, Japan, Netherlands, the United Kingdom, the United States 9 Ireland, Korea, Taiwan, Mexico

28
Asia and clothing industry in South America. In the 1970-80s, wage differentials were the main force to move European labor-intensive production and assembly operations to the lower-wage neighboring countries. In the 1990s, low labor costs, labor skills and education, technical training as well as adequate transportation and financial infrastructures were the main driving forces in finding new intermediate producers from the Central European Countries. Yeats reported that components’ imports as a share of apparent consumption and production are highest in the European Union. Also he found that the OECD trade in components of machinery and transport equipment comprised around 30 percent of total exports.10
Also empirical implications has been found in testing of multinational enterprise (MNE) theories. Markusen (2002) reports estimations concerning the knowledge-capital approach to the MNE theory and implies that country characteristics such as size, size differences, trade and investment costs, relative endowment differences are significant independent variables when explaining the multinational activity. Amiti and Wakelin (2002) continue to test the country characteristics based on the model of Markusen (1997, 2002) and observe that investment liberalization i.e. the reduction of FDI costs on exports are related on the country characteristics and trade costs, and the differences in the factor endowments between countries expand exports.
1.2.7 Statistical Review
The appendix provides an overview of our data used in estimations. Next we explain only the main features about the outsourcing and FDI data. The outsourcing data is collected from the COMTRADE database and the EU FDI data is from the Eurostat. Table 1 shows that trade in parts and components has increased especially since 1995. The OECD and APEC countries are the biggest traders and they export slightly more than import the intermediated goods, and as shown in appendix 1.3, the biggest exporters of intermediate goods are highly industrialized countries as the United States, Japan, Germany, the United Kingdom and France. When considering the biggest importers the top 20 group includes also the developing countries such as Mexico, China, Singapore, Korea Republic and Malaysia. An interesting case is to compare the trade of intermediate goods to value added. When trade in intermediate goods is divided by value added, the list is rather different. The countries whose manufacturing is highly dependent on the exports of the 10 (SITC 7) includes 50 per cent of world trade in all manufactures.

29
intermediate goods are now, for example, Singapore, Malaysia, Costa Rica, Estonia, Hungary, Ireland and Philippines. Appendix 3.2. displays that these countries have increased also their market share in exports from 1985 to 2000. Moreover, these countries (e.g. Singapore, Estonia, Hungary, Malaysia) with some African countries are highly dependent on the imports of intermediate goods (appendix 1.3).
Table 2 shows that non-electric machinery and motor vehicles achieved the biggest trade by value terms. An important point to observe, however, is that between 1995 and 2000 the exports of intermediate goods increased most significantly in radio, TV and communication equipments, and office machinery and computers. In these industries, the exports are fivefold larger in radio, TV and communication equipments and sixfold larger in office machinery and computers in 2000 than they were in 1985. The expansion has been less dramatic in machinery of textiles and wearing apparel, and in machinery of wood, printing and publishing.
Table 3 indicates that the FDI flows in the EU have increased dramatically in the period of 1996-1999 compared to the period of 1992-1995. It also shows that outflows are bigger than inflows in the EU, and the intra-EU outflows are slightly higher than extra-EU outflows. Table 4 shows that the radio, TV and communication equipment industry has been the largest winner in EU inflows and, vice versa, the motor vehicles industry has witnessed the highest extra-EU outflows.

30
Table 1: Trade of Parts and Components in Manufacturing
Exports of Parts and Components
0100200300400500600700
1985 1990 1995 2000
Bill
ion
EUR
ASEAN
NAFTA
EU15
APEC
OECD
Imports of Parts and Components
0
100
200
300
400
500
600
1985 1990 1995 2000B
illio
n EU
R
ASEAN
NAFTA
EU15
APEC
OECD
Exports of Parts and Components
00,5
11,5
22,5
33,5
44,5
5
1985 1990 1995 2000
Bill
ion
EUR
CARICOM
ANDEAN
MERCOSUR
Imports of Parts and Components
0
2
4
6
8
10
12
14
1985 1990 1995 2000
Billi
on E
UR
CARICOM
ANDEAN
MERCOSUR
Exports of Parts and Componentsin EU Countries
0
5
10
15
20
25
30
POR
FIN
DN
K
ESP
AU
T
SW
E
BEL
NLD ITA
FRA
GB
R
DEU
Bill
ion
EU
R
1985
1990
1995
2000
Imports of Parts and Componentsin EU Countries
0
24
6
810
12
14
1618
20
POR
FIN
DN
K
AU
T
SW
E
ESP
BEL
NLD ITA
FRA
GB
R
DEU
Bill
ion
EU
R
1985
1990
1995
2000

31
Table 2: Exports of Parts and Components by Industry
Motor Vehicles
0
20
40
60
80
100
120
140
160
1985 1990 1995 2000
Billi
on E
UR
ASEAN
NAFTA
APEC
EEC15
OECD
Non-Electrical Machinery
0
50
100
150
200
250
1985 1990 1995 2000
Billi
on E
UR
ASEAN
NAFTA
APEC
EEC15
OECD
Office Machinery and Computers
0
20
40
60
80
100
120
1985 1990 1995 2000
Billi
on E
UR
NAFTA
ASEAN
EEC15
OECD
APEC
Radio, TV and CommunicationEquipment
0
10
20
30
40
50
60
70
1985 1990 1995 2000
Billi
on E
URASEAN
NAFTA
EEC15
APEC
OECD
Other Transport
05
101520253035404550
1985 1990 1995 2000
Billi
on E
UR
ASEAN
APEC
NAFTA
EEC15
OECD
Wood, Publishing and Printing
0
1
2
3
4
5
6
1985 1990 1995 2000
Billi
on E
UR
ASEAN
APEC
NAFTA
EEC15
OECD

32
Textiles and Wearing Apparel
0
0,5
1
1,5
2
2,5
3
3,5
4
4,5
1985 1990 1995 2000
Billi
on E
UR
ASEAN
NAFTA
APEC
EEC15
OECD
Food Products
0
0,2
0,4
0,6
0,8
1
1,2
1,4
1,6
1985 1990 1995 2000
Billi
on E
UR
ASEAN
APEC
NAFTA
EEC15
OECD
Table 3: FDI Flows in the EU
FDI Inflows in the EU
0
50
100
150
200
250
300
350
Extra-EU FDIInflow s
Intra-EU FDIInflow s
EU FDI Inf low s
Bill
ion
EU
R
1992-1995
1996-1999
FDI Outflows in the EU
0
50
100
150
200
250
300
350
Extra-EU FDIOutf low s
Intra-EU FDIOutflow s
EU FDIOutf low s
Billi
on E
UR
1992-1995
1996-1999
FDI Inflows in EU Countries
0
5
10
15
20
25
AUT
BELPOR ITA DNK
FIN DEUESP
FRA
SWE
NLDGBR
Mill
ion
EU
R
1992-1995
1996-1999
FDI Outflows in EU Countries
0102030405060708090
ITA
PO
R
AU
T
ES
P
DN
K
BE
L
FR
A
SW
E
FIN
GB
R
NL
D
DE
U
Mill
ion
EU
R
1992-1995
1996-1999

33
Table 4: FDI Flows by EU Industry
EU FDI Inflows
02468
101214161820
Other Tran
sport
Textile
s
Metal P
rodOffic
eFoo
d
Motor Veh
icles
Wood,
Paper,
Machin
eryNon
-el
Radio
Bill
ion
EUR
1992-1995
1996-1999
Extra-EU FDI Inflows
02468
101214161820
Other Tran
sport
Textile
sFoo
d
Metal P
rod
Machin
eryNon
-el
Wood,
Paper,
Office
Motor Veh
icles
Radio
Bill
ion
EUR
1992-1995
1996-1999
Intra-EU FDI Inflows
02468
101214161820
Texti
les
Other Tra
nspo
rtOffic
e
Metal P
rod
Motor Veh
icles
Food
Radio
Woo
d,Pap
er,Prin
t
Machin
eryNon
-el
Bill
ion
EUR
1992-1995
1996-1999
EU FDI Outflows
0
10
20
30
40
50
60
Texti
les
Other Tra
nspo
rt
Office
Metal P
rodRad
io
Wood,
Pape
r, Prin
tFo
od
Machin
eryNon
-El
Motor Veh
icles
Billi
on E
UR
1992-1995
1996-1999
Intra-EU FDI Outflows
0
10
20
30
40
50
60
Motor Vehicles
Other Transport
Textiles
Office
Radio
Metal Prod
Wood, Paper, P
rint
Food
Machinery
Non-El
Billi
on E
UR
1992-1995
1996-1999
Extra-EU FDI Outflows
0
10
20
30
40
50
60
Office
Texti
les
Other Tra
nspo
rt
Metal P
rodRad
io
Wood,
Pape
r, Prin
t
Machin
eryNon
-elFo
od
Motor Veh
icles
Billio
n EU
R
1992-1995
1996-1999


35
PART I
GLOBAL OUTSOURCING, COMPETITION, HUMAN CAPITAL AND R&D


37
2 EFFECTS OF COMPETITION TO OUTSOURCING IN INDUSTRIAL RECONSTRUCTION
2.1 Introduction
The purpose of this chapter is to investigate empirically the decision between the vertical integration and outsourcing when the degree of competition varies.
Since the studies of Coase (1937) and Williamson (1975, 1985), it has been widely theoretically emphasized that the firms’ decisions either to carry out all production processes on their own or to acquire the inputs from the outside depend on the transaction costs. There is also widely discussed theoretical literature for the causes and consequences of vertical integration. These models point out how, depending on the product composition or production process, it is more beneficial to keep operations in firm or move them out to separate firms (see Klein et al. 1978, Grossman-Hart 1986, Hart – Moore 1990, Hart 1995). Also, a variety of theoretical models have been put forth to explain the linkages between the market power, product differentiation and competition. Such models stress that a greater degree of product differentiation would lead to a greater degree of market power and soften competition (Sutton 1991). Even if the literature of vertical integration and competition explains the implications as described above, they neglect to explain how, for example, product differentiation adapts to “make-or-buy” decisions. Thus, we are curious about mapping make-or-buy decisions and competition in order to provide more comprehensive support for the hypothesized industrial restructuring relationships.
In the empirical field, the increasing trade volume of intermediate inputs has been examined. These studies concentrate on specifying vertical trading chains or linkages from the trade data. However, the empirical research how the make-or-buy decisions depend on the competition circumstances has been incomplete and previous empirical literature has done very little to combine these two topics together. Hence, for the successful integration strategy, we will be interested in finding an empirical background for why a certain degree of competition would lead to a higher likelihood to outsource. In this paper, we explore the empirical linkages between these topics. The main intuition for the analysis is the theory of Grossman and Helpman (2002a) by linking the degree of competition and probabilities to choose between the vertical
38
integration and outsourcing. This paper may help in clarifying empirically how industrial sectors have responded to the degree of competition by specialization or vertically integrating their production structure.
This paper is organized as follows. Section 2.2 discusses briefly the theoretical and empirical background of the paper. Section 2.3 explains the theory for the empirical testing. Section 2.4 contains the empirical methodology, data definition and results, and section 2.5 presents the conclusions.
2.2 Theoretical and Empirical Background
In the transaction cost theory, two variables appear to be chief candidates for modeling the association between outsourcing and integration as found, for example, from the studies of Klein – Crawford – Alchian (1978), Riordan – Williamson (1985), Williamson (1985) and Foss (1997). These are a hold-up problem and governance costs. The hold-up problem of specialized firms would take place if production were organized by outsourcing because these assets have no value in some other use. The specialized firms face also the costs of searching partners. The governance costs exist if production were carried out through the vertically integrated firms because they handle all assets of their own and lose the know-how which is developed in the specialized intermediate firms. If contracting theory indicates that the complexity of contracts generates a potential hold-up problem or governance costs, the next question is how these factors reflect to the firms’ make-or-buy decisions. The Grossman-Helpman model (2002a) is a recent study on vertical integration and outsourcing. It presents an equilibrium model of industrial structure where the organization of firms is demonstrated as endogenous. In this model, the consumer products are differentiated and produced either by vertically integrated firms facing Dixit and Stiglitz (1977) monopolistic competition or by pairs of specialized firms. That is, either vertical integration or outsourcing is pervasive in which costs differ. The model examines how the degree of competition in the market and other parameters affect the equilibrium choices. Thus, with strong competition and therefore high substitution between the consumer products, outsourcing is unlikely, because it would take a high cost disadvantage for an integrated firm; a per-unit cost advantage for specialized input producer compared to the vertically integrated producer is not enough because of the pricing disadvantages created by the hold-up problem of the specialized firm due to incomplete contracting. Instead, with little competition, the cost differences or pricing disadvantages do not matter and this favors vertical integration. In this situation outsourcing

39
is unlikely compared to the vertical integration because specialized firms would incur high transaction costs when searching for partners. Therefore, outsourcing is viable somewhere between these extremities. Moreover, the model assumes that the outsourcing in thicker markets is more viable because specialized firms more easily find a partner.
In recent years, empirical implications have expanded to test outsourcing as an essential measure in the disintegration of production. Even if, however, the implications of such phenomena for factor prices, production and trade patterns have been widely discussed in the theoretical circles, empirical testing on vertical specialization has been inconclusive. Recent studies by Campa and Goldberg (1997), Feenstra (1998), Hummels et al. (2001) and Yeats (1998) have undertaken deeper analysis of the impacts of vertical specialization, intra-product specialization and global production sharing. They have used more accurate classified intermediate inputs or parts and components data from the input-output tables. Campa and Goldberg (1997) compared the external orientation of four countries, the United States, Canada, the United Kingdom, Japan, and they found that the manufacturing industries in Japan are becoming dissimilar in their use of imported inputs when compared to the U.K., U.S. and Canadian industries. Feenstra (1998) explore a rapid specialization in industries such as textiles, apparel, footwear, industrial machinery, electrical equipment, transportation equipment and chemicals & allied products. Hummels et al. (2001) stressed that a share of vertical specialized exports of total merchandise exports have increased gradually in the OECD countries – particularly in France, the United Kingdom, the United States and in Mexico from 1970 to 1990. Yeats (1998) reported that the imports of parts and components as a share of apparent consumption and production are highest in the European Union and the OECD trade in parts and components of machinery and transport equipment is high - comprising around 30 per cent of total exports. Furthermore, Abraham and Taylor (1996) have provided evidence of rising outsourcing of business services in thirteen U.S. industries and Helper (1991) in parts of the U.S. automobile industry.
2.3 The Model
In this section, we explain the Grossman-Helpman model (2002a) applied empirically in section 4, and simplify the model by assuming that there are only two types of industrial structures which are governed by incomplete contracts – outsourcing or vertical integration. We assume that intermediate inputs are fully specified for some final product and these products are worthless in some other use, that is, the hold-up problem occurs with full sunk

40
costs. Moreover, the economy produces a large number of products and thesegoods are differentiated for producers and consumers alike. Each final productrequires a special intermediate product and these final products are imperfect substitutes in the market.
2.3.1 The Main Equations
Consider that consumers have preferences over the N differentiated varieties produced in each j industries:
J
j
N
jj
jj j diiyu
1
/1
0,)(log 0 < < 1,
where yj(i) is consumption of product i, denotes the degree of productdifferentiation in each industry: the greater , the less differentiated the output of the industry is. The measures the share of consumers’ spending on industry j products and . The demand function is therefore measured
as:j j 1
11)()( iApiY , (1)
where p(i) is the price of product i, and industry demanddiipEA j jj
N
jj 0
)1()( , where E is spending. Aj becomes constant
because there is the unique supplier of variety i, and therefore, it defines aconstant elasticity of demand 1/(1- ).
Next, the intermediate producer will choose its production level and candeliver only high quality products because low-quality products have no use. The reward is p(i)x(i) , where is the share of the surplus going to theintermediate producer and it maximizes profits through the demand function(1) by setting 11)()()( Aixiy . When all prices are the same in the symmetric equilibrium, the price of the final product of the specialized producer is
/1sp . (2)
The demand function (2) is the same for the vertically integrated firm but it faces marginal production costs of in order to denote the units of laborneeded to produce a unit of the intermediate product for the verticallyintegrated firm. The vertically integrated firm uses mark-up pricing because of a constant elasticity of demand and it maximizes the profit by pricing as:
/vp (3)
The industry demand level from the (1), (2) and (3) may then be defined as:

41
)1/()1/( ))(()/( rsvLA , (4)
where v is a number of firms entering as the vertically integrated producer, s is the number of firms entering as the producer of specialized final goods, r = m/s is the ratio of specialized component producers m to specialized final producers, and therefore (r) n(1,r) is the probability that matching occurs.
Next we define which factors determine how the industry carries out its make-or-buy decisions. We find out the conditions when the expected profits11
s, m, v = 0. The specialized intermediate and final producers will break even if and only if
m
sO k
kr
1)1( (5)
when the demand level is:
)()1()(
0
0)1/(
rrk
A mO (6)
The vertically integrated firm breaks even when the demand level is:
)1()/( )1/(
IA , (7)
where k are the fixed costs of each industry. AO is the required demand level for the viability of outsourcing and AI is the required demand level for theviability of vertical integration. Both demand levels, AI and AO, are incompatible with one another and therefore either outsourcing or verticalintegration is pervasive. Finally, by using (6) and (7), the factors which determine the equilibrium mode of organization is presented in equation (8).
m
v
O
O
O
I
kk
rr
AA )(
)( )1/( (8)
and
m
sO k
kr
1)1(
11 After taking account of the fixed entry and search costs, the expected profits for the pair ofspecialized producers are ,ss kAr )1/()()1)((
mkm Arr)()1( )1/()(
as
, and, at the entry stage, for the vertically integrated firm
vk)1/(
v A)1(

42
The factors that favor outsourcing are those that increase the ratio AI/AO.Outsourcing is more viable when the marginal costs of the vertically integrated producer and the cost advantage of specialized component producers are higher relative to vertically integrated firms. Moreover, whenfixed costs k of v-firms are greater or fixed costs of s-firms and m-firms are lower, the probability of outsourcing is higher. Efficient search technology to find a partner and thus the increase of n( ) favors outsourcing by increasing AI
/AO.Next we explain how the changes of and affect the make-or-buy
decisions. Figure 1 describes the relationship between the degree of competition and the direction of the ratio AI /AO. If > 1, the increase in increases AI /AO and thus encourages firms to outsource. That is because
/1sp and /vp , and therefore pv/ps = . This is demonstrated in figure 1(a). If > 1, the specialized producer can sell its products for a cheaper price than the vertically integrated producer and its operating profitsare relatively higher. Also as increases and thus prompting moresubstitutability with respect to the final products, the amount of the specializedcomponent producers m decreases. Therefore the new entrants as intermediate producers find more easily a partner (ro decreases so that (ro)/ro as well as AI
/AO increase). In sum, the outsourcing is pervasive only if > 1 and otherwise vertical integration dominates.
When < 1 and increases, the vertical integrated producer has theadvantage of being able to sell for a lower price and collect higher operating profits than the specialized final producer. At the same time, the increase in pulls the probability to outsource in the opposite direction because the ratio ofthe number of m-firms to the number of s-firms decreases and specialized producers more easily find a partner. The central question is which factordominates? Figure 1(b) shows the circumstances under which the profitability effect dominates over the effect of changes in (r)/r. This encourages choosing vertical integrated production when the degree of competition increases, andoutsourcing is pervasive only when < 2, and otherwise only vertical integration is viable. In figure 1(c), first when < 3 the cost differences or pricing disadvantages do not matter and searching for partners by the specialized firms accumulates too high transaction costs. Hence, the vertical integration is pervasive, but when increases the matching effect starts to dominate and the only choice is outsourcing, that is between 2 and 3. When
> 4 the profitability effect dominates over the matching effect and theproducers will tend to be vertically integrated.

43
AI/AO AI/AOAI/AO
0 0 0 4321 1 1 1
(a) (b) (c)
Figure 1: Make-or-buy Decisions and the Degree of Competition: Industry organization for (a) >1; (b) and (c) < 1
There would be also other explanations for the inverted U-shape curve. This curve can be found if the regulations or other restrictions change the competition environment. For example, in the industrial sectors where R&D expenditures are high and is near 0, such as in the aerospace or militaryindustry, vertical integration could be the only choice to fulfill the national security requirements. Also in the industrial sectors such as pharmaceuticalswhere health regulations or patents place a pivotal role vertical integration could take place with high R&D expenditures. In contrast, in industries where the R&D expenditures are low and products tend to be near substitutes vertical integration is viable because of the high costs to enter and due to the hold-up problem. At the middle range of R&D expenditures and product differentiation, in industries such as textiles, motor vehicles, machinery and electrical machinery, the matching effect and the advantages of co-operation with respect to know-how between the specialized intermediate and finalproducers will lead to outsourcing.
2.4 Empirical Testing of Outsourcing
Our purpose is to estimate the unlinear relationship between the degree of competition and outsourcing in the various consumer product markets with the nonlinear OLS and probit models. The dependent variable (IMP) describes the ratio of imported intermediate inputs to the value of output. We include thevector of an independent variable to represent the competition characteristics

44
where each sector operates, that is RDOP (the R&D to the value of outputratio). The RDOP variable is included to explain vertical productdifferentiation and RDOP2 therefore the nonlinear relationship between thedegree of competition and outsourcing. Also the series of COUNTRY andINDUSTRY DUMMIES (DM) are included to estimate the country and industry differences. The country and industry values are reported only if these are statistically significant or near to it.
First, we estimate the equation by using an nonlinear OLS with log-normally distributed independent variables (R&D). The estimation equation is as follows:
IMP = DMRDOPRDOP n2
21 ,
where n is a number of industry and country dummies (DM).Second we use a probit model to explore the make-or-buy decisions and to
interpret the inverted U-shape of the probability and marginal effects of outsourcing in each industry. Third, the Grossman-Helpman model (2002a) assumes the thick consumer market that outsourcing is more likely in large economies. The thick market assumption was tested both with the OLS and the probit model.
2.4.1 Data Definition and Variables
The theory of Grossman-Helpman is based on the closed economy. Suchapproach is problematic to find the valid data. Firstly, the firm-level outsourcing data is absent. Secondly, more aggregate internal data such asinput-output data is unable to separate the outsourced inputs from those inputs,which are produced in their own subsidiaries. Because of those datalimitations we have used the OECD input-output data in order to test the foreign outsourcing because it can be assumed more likely that these inputsare not produced in their own subsidiary. Also by using such data we are unable to separate outsourced inputs from those that are produced in their ownsubsidiary in the foreign markets.
The value of outsourcing (IMP) is calculated as the value of importedintermediate input/value of output. Intermediate inputs and value of output are collected from the OECD SITC revision 2 input-output 1990 database.Intermediate inputs are restricted only to industrial intermediates, i.e. components and parts, therefore services and transport as well as storage areexcluded from the imported intermediate input data (table 5).
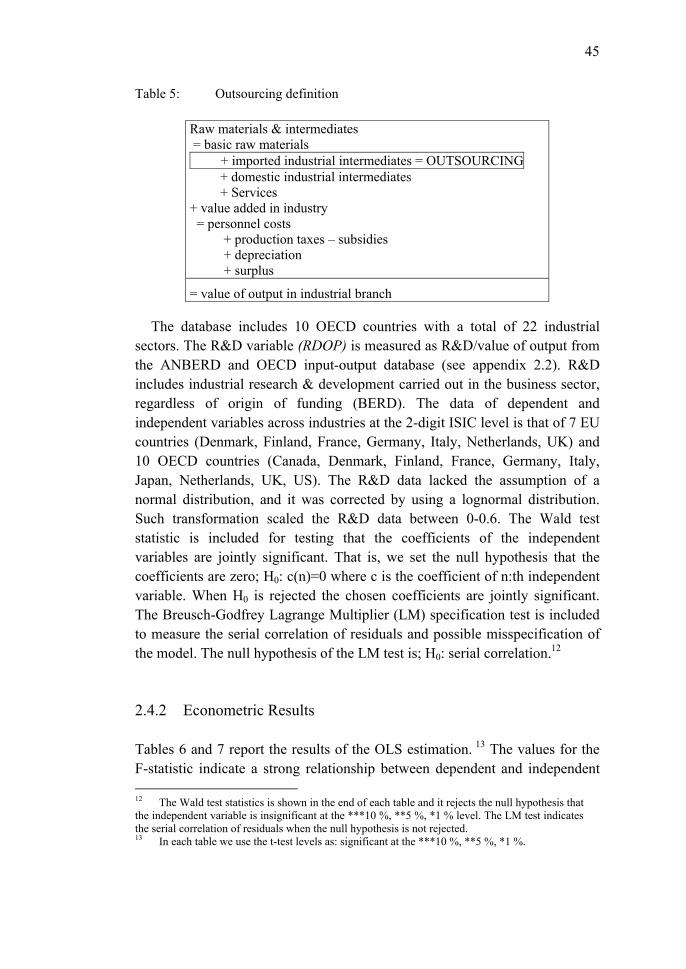
45
Table 5: Outsourcing definition
Raw materials & intermediates = basic raw materials + imported industrial intermediates = OUTSOURCING + domestic industrial intermediates + Services + value added in industry = personnel costs + production taxes – subsidies + depreciation + surplus
= value of output in industrial branch
The database includes 10 OECD countries with a total of 22 industrial sectors. The R&D variable (RDOP) is measured as R&D/value of output from the ANBERD and OECD input-output database (see appendix 2.2). R&D includes industrial research & development carried out in the business sector, regardless of origin of funding (BERD). The data of dependent and independent variables across industries at the 2-digit ISIC level is that of 7 EU countries (Denmark, Finland, France, Germany, Italy, Netherlands, UK) and 10 OECD countries (Canada, Denmark, Finland, France, Germany, Italy, Japan, Netherlands, UK, US). The R&D data lacked the assumption of a normal distribution, and it was corrected by using a lognormal distribution. Such transformation scaled the R&D data between 0-0.6. The Wald test statistic is included for testing that the coefficients of the independent variables are jointly significant. That is, we set the null hypothesis that the coefficients are zero; H0: c(n)=0 where c is the coefficient of n:th independent variable. When H0 is rejected the chosen coefficients are jointly significant. The Breusch-Godfrey Lagrange Multiplier (LM) specification test is included to measure the serial correlation of residuals and possible misspecification of the model. The null hypothesis of the LM test is; H0: serial correlation.12
2.4.2 Econometric Results
Tables 6 and 7 report the results of the OLS estimation. 13 The values for the F-statistic indicate a strong relationship between dependent and independent 12 The Wald test statistics is shown in the end of each table and it rejects the null hypothesis that the independent variable is insignificant at the ***10 %, **5 %, *1 % level. The LM test indicates the serial correlation of residuals when the null hypothesis is not rejected. 13 In each table we use the t-test levels as: significant at the ***10 %, **5 %, *1 %.

46
variables. The t-values indicate that the R&D variable is significant at least under a 5 % significance level. The Wald test statistic rejects the hypothesis that the R&D variables are insignificant. LM statistic shows no serial correlation and the model specification was accepted. According to the hypothesis that there is a nonlinear relationship between outsourcing and the degree of competition measured as product differentiation, the relationship is correctly signed with the R&D variable in both estimations. Thus, the positive signs of RDOP and EURDOP suggest a positive relationship: if an industry has the R&D expenditures it also has outsourcing activities. However, the negative signs for the RDOP2 and EURDOP2 indicate the negative nonlinear relationship between the degree of competition and outsourcing. Industries with high and low R&D expenditures are willing to outsource less than the industries with middle range R&D expenditures. When the transformation of the lognormal distribution scaled the R&D data between 0-0.6, we found the maximum from around 0.4.
The ‘thick market’ assumption was tested using the country dummies. These results showed some surprising and interesting findings, but also inconclusive. As expected, in the EU and OECD thick market such as in Japan, France, Italy, Germany or in the US, such a relationship was negative. Contrary to what might be expected, the industries have a positive probability to outsource their activities in the UK. Therefore, this result indicates that big countries are more likely to find their partners from the home market instead of abroad, except in the UK.
Next we considered ‘the consumer product market’ assumption of the Grossman-Helpman model. This assumption was constrained to the industries where the ratio of private consumption to the value of the output was highest and it was tested by industry dummies. These industries are as follows: food, beverages & tobacco; textiles, apparel & leather; wood products & furniture; paper, paper products & printing; drugs & medicines; electrical apparatus; radio, TV & communication equipment; rubber&plastics and motor vehicles. The findings in tables 6 and 7 only partially support our hypothesis that increasing R&D expenditures would increase the outsourcing more in the consumer product industries than in the overall industries. Our estimation gave positively signed and statistically significant results only for the textiles and rubber&plastics industries.

47
Table 6: OLS Estimation Results, 7 European Union Countries, 22 Industries
Variable Coefficient t-Statistics
Constant 0.124 4.599* Eurdop 0.670 3.893* Eurdop2 -0.781 -2.429** Finland -0.060 -2.209** UK 0.043 1.586 Italy -0.100 -3.750* France -0.110 -4.086* Netherlands 0.038 1.404 Germany -0.112 -4.195* Food -0.010 -2.826* Textiles 0.101 2.854* Petro -0.127 -3.661* Rubber&plastics 0.089 2.515** Non-mineral metallic prod -0.092 -2.620*Nonfmeta 0.082 2.333** Offcmach 0.118 3.341* RadioTV 0.043 1.214
Test statistics, n = 154R2 0.57D-W 1.93F-statisticWaldLM
11.25* 15.59* 1.17

48
Table 7: OLS Estimation Results, 10 OECD Countries, 22 Industries
Variable Coefficient t-Statistics
Constant 0.139 5.626* Rdop 0.572 3.672* Rdop2 -0.659 -2.247** Canada -0.053 -2.058** Finland -0.056 -2.173** Italy -0.010 -3.874* UK 0.046 1.784*** France -0.107 -4.113* Germany -0.111 -4.324* Japan -0.200 -7.626* Netherlands 0.037 1.439 US -0.194 -7.470* Food -0.082 -2.876* Textiles 0.079 2.770* Petro -0.113 -4.034* Rubber&plastics 0.063 2.209** Non-mineral metallic prod -0.080 -2.825*Nonfmeta 0.074 2.617* Offcmach 0.116 3.963* RadioTV 0.046 1.589
Test statistics, n = 220R2 0.59D-W 1.84F-statisticWaldLM
15.34* 14.81* 4.49
The next method used was a probit analysis in which we tested the likelihood of outsourcing. We chose the probit analysis to demonstrate that either outsourcing or vertical integration is pervasive. To establish the make-or-buy decisions in each sector the dependent variable (IMP) should be a discrete variable with a value of 1 if the industry is outsourcing and otherwise 0. In the absence of the exact data of make-or-buy decisions itself we assumed that outsourcing is pervasive after some threshold value. In this case, if the value of intermediate inputs/value of output is larger than 0.25, then the industry was outsourcing: the value is 1, and otherwise 0. The probit model is suitable because it explains the relationship between outsourcing and the degree of competition that achieves the objective of relating the choice

49
probability Pi to independent variables in such a way that the probability remains in the [0,1] interval. Since the value of the probability density function is always positive, the design of coefficients k indicates the direction of the relationship between the vertical product differentiation and country dummies (the independent variables) and the probability Pi. If k > 0, then an increase of the independent variable increases the probability that IMP = 1 (the industry is outsourcing), and if k < 0, an increase in the independent variable reduces the probability that IMP = 1. We also made some sensitivity estimation and used several threshold values (0.20, 0.23, 0.28). The EU data was not sensitive for these threshold values and estimations gave significant results but the testing with the OECD data was more sensitive to the changes of the threshold value.
Tables 8 and 9 report the results of the probit model with the threshold value of 0.25 for the 22 EU and OECD industries. Tables 8 and 9 show that both product differentiation coefficients are statistically significant. The LR stat value indicates a strong relationship between dependent and independent variables, and the z-values indicate that both variables (RDOP, EURDOP as well as RDOP2, EURDOP2) are significant at least under a 10 % significance level. Also the Wald test statistic rejects the hypothesis that the R&D variables are insignificant.
According to the hypothesis that there is an nonlinear relationship between outsourcing and the degree of competition measured as product differentiation, the relationship is correctly signed also in probit estimations. Thus, the positive sign of R&D (RDOP, EURDOP) suggests that if an industry is increasing its R&D expenditures, then there is an increasing probability to outsource. Instead, the variable R&D2 (RDOP2, EURDOP2) has a statistically significant negative sign in both equations. This suggests that such a relationship is nonlinear. Relatively low and high R&D expenditures would decrease the probability to outsource.
By comparing the country results in the EU market (table 8), the threshold value of 0.25 cumulates in the highest probability to outsource in the UK. However, contrary to what might be expected from the OLS results, the probability for outsourcing in less thick markets such as in Denmark and Netherlands is statistically significant, and the probability is as strong as in the thicker consumer product markets. The estimation results in the OECD market (table 9) do not change the findings that the probability for outsourcing in thicker consumer product markets (Canada, France, Germany, Italy, Japan, UK, US) would be higher than in less thick markets. Tables 8 and 9 also display the results of industry dummies in the European and OECD consumer products markets. Textiles and rubber&plastic industries were significantly related to outsourcing. Radio, TV and communications equipment turned out

50
to be statistically insignificant in the EU market but significant in the OECD market. Textiles and motor vehicles have a positive sign in the OECD market but seemed statistically insignificant.
Table 8: Probit analysis whether industry is outsourcing or not, European Union countries, 22 Industries
Variable Coefficient Std. Error z-Statistics
Constant -3.572 0.679 -5.257* EURDOP 10.846 3.903 2.779* EURDOP2 -13.496 6.804 -1.983** Textiles 1.253 0.651 1.925** Rubber&plastics 1.781 0.616 2.892* Office&comp mach 1.827 0.622 2.934* Radio&TV 1.028 0.648 1.585 Denmark 1.910 0.449 4.250* UK 1.494 0.427 3.502* Italy 0.089 0.532 0.167 France -0.326 0.585 -0.558Netherlands 1.942 0.464 4.183*
Test statistics, n = 154LR-stat 71.24 Obs with dep=0 111Prob 0.000 Obs with dep=1 43McFadden R2
Wald0.396.62*
Next we turn to explore the industries which are most willing to outsource. Tables 10 and 11 summarize the marginal effects on the EU and OECD industries, under the assumption that the threshold value is 0.25. The R&D expenditures in the TOP10 OECD industries are on average equal to 1.1 %, TOP20 equal to 1.6 % and TOP 30 equal to 2.7 % even if the variance between industries is sufficiently large. R&D expenditures in the EU industries are higher than in the OECD: the TOP10 industries are on average equal to 2.8 %, and the TOP20-30 average around 3 %. Finally, for the probit model above, we are interested in the effect of R&D expenditures on outsourcing. Figures 2 and 3 demonstrate the response curves of both EU and OECD markets by plotting the fitted probabilities as a function of R&D expenditures and by fixing the values of other variables at the sample medians. The curves show that the probability to outsource appears to peak when R&D expenditures increase up to around 0.25, then the probability to outsource

51
begins to fall, and the probability to outsource is lower in the EU industries (0.08) than in the OECD industries (0.17).
Table 9: Probit analysis whether industry is outsourcing or not, 10 OECD countries, 22 industries
Variable Coefficient Std. Error z-Statistics
Constant -2.146 0.460 -4.66*RDOP 6.571 3.233 2.03** RDOP2 -9.039 5.454 -1.65*** Textiles 0.716 0.494 1.44Rubber&plastics 1.127 0.451 2.49** Motor vehicles 0.502 0.442 1.13 Office&comp mach 1.418 0.466 3.09* Radio&TV 0.900 0.499 1.80*** Denmark 1.188 0.321 3.70* Italy -0.430 0.441 -0.98UK 0.941 0.318 2.95* France -0.667 0.474 -1.41Japan -0.959 0.502 -1.91***
Test Statistics, n = 220 LR-stat 56.52 Obs with dep=0 172Prob 0.000 Obs with dep=1 48McFadden R2
Wald0.242.63***
Table 10: Marginal Effects across EU Industries – TOP 10
Industry Country marge25
1 Other transport UK 0.043272 Drugs & medicines UK 0.043273 Shipbuilding & repairing UK 0.043274 Textiles, apparel & leather FIN 0.043275 Food, beverages & tobacco NED 0.043266 Metal products DEN 0.043267 Metal products NED 0.043268 Rubber & plastic products FRA 0.043269 Non-electrical machinery UK 0.04322
10 Food, beverages & tobacco DEN 0.04321

52
Table 11: Marginal Effects across OECD Industries – TOP 10
Industry Country marge25
1 Office & computing machinery ITA 0.0262162 Industrial chemicals UK 0.0262143 Petroleum & coal products UK 0.0262134 Metal products DEN 0.0262135 Electrical apparatus, nec UK 0.0262116 Professional goods UK 0.0262047 Food, beverages & tobacco DEN 0.0262048 Non-electrical machinery UK 0.0262029 Office & computing machinery US 0.026196
10 Radio, TV & communication equipment FIN 0.026180
0.00
0.02
0.04
0.06
0.08
0.10
0.0 0.1 0.2 0.3 0.4 0.5
EURDOP
EU
IMP
25F
Figure 2: Response Curve to EU Industries

53
0.00
0.05
0.10
0.15
0.20
0.0 0.1 0.2 0.3 0.4 0.5 0.6
RDOP
IMP
25F
Figure 3: Response Curve to OECD Industries
2.5 Summary
In this chapter, we have shown empirical evidence on how the parameters from the transaction cost theory would affect the firms’ decisions and how the degree of competition measured as the vertical product differentiation change the firms’ make-or-buy decisions. Our main purpose was to find some empirical results as to whether or not there is an inverted-U shape relationshipbetween the degree of competition and outsourcing.
The main result is that we found empirical support for the assumption thatthe degree of competition is nonlinearly related to outsourcing both in the OECD and European industries. The positive sign of RDOP and EURDOPsuggests a positive relationship: the higher R&D expenditures indicate the higher outsourcing activities. However, the negative sign in the RDOP2 and EURDOP2 indicates the negative nonlinear relationship between the degree of competition and outsourcing. Industries with high and low R&D expendituresare willing to outsource less than the industries in the middle range of R&D expenditures.
The results of the ‘thick market’ assumption established that the industrieshave a positively signed interest in outsourcing their input production only in the UK. In other thick markets in the EU or OECD, such as in Japan, France, Italy, Germany or in the US, such a relationship was negative. This resultindicates, as expected, that the industries from the big countries are morelikely to find their partners from the home market instead of abroad. Incontrast, the empirical findings to the ‘the consumer product market’assumption supported our hypothesis only partially. The estimation gave

54
positive signed and statistically significant results only to the textiles and rubber&plastics industries.
The results of the probit model indicated the same kind of foundations as OLS. According to the hypothesis that there is an nonlinear relationship between outsourcing and the degree of competition measured as vertical product differentiation, the relationship is correctly signed also in probit estimations. Thus, if an industry increases its R&D expenditures, then there is an increasing probability to outsource. However, such a relationship is nonlinear: relatively low and high R&D expenditures would decrease the probability to outsource.
Finally, as might be expected from the OLS results, the probability for outsourcing in less thick markets such as in Denmark and the Netherlands was statistically significant, and the probability was stronger than in the thicker product market. The results of the consumer product market were similar to those of the OLS estimation. The textiles and rubber&plastics industries in the EU were significantly related to outsourcing. In the OECD market, radio, TV and communications equipment turned out to be statistically significant. However, we expected that the consumer products such as motor vehicles and textiles should be among the outsourcing industries, but even if these industries had a positive sign in the OECD market, they seemed statistically insignificant.

55
3 OUTSOURCING IN GLOBAL ECONOMY - CHOICE OF HUMAN CAPITAL AND R&D
3.1 Introduction
As found from the recent industrial organization and international trade literature, the attention has recently focused on the fact that, especially during the 1990s, the production sector has overcome a new kind of reorganization stage in which firms have increasingly expanded to outsource their intermediate production. Such a tendency has expanded radically the international trade of parts and components. Several reasons can be found for such a tendency. First, one can notice that the ongoing global economic integration has accelerated the global competition as well and the local operational environment in the larger scale of industrial sectors has become a global environment. Second reason is that, during the economic integration and trade liberalization, the size of multinational firms has increased because of the increasing range of organizational modes. Such firms have more financial resources to realize their production plans abroad. Third reason is that a new information technology has lowered communication and other costs and facilitated organization of multinational production processes. Hence, the handling of international world-wide production processes has become more controllable and made it easier to find a suitable production environment abroad.
Several advantages are inspired from the recent reorganization stage. Firstly, by lowering the production costs due to increased global competition, the firms can increase the welfare of consumers by offering less-expensive final products. Secondly, this is parallel to the observation that outsourcing from high-wage to low-wage countries might stabilize the uneven development between countries. The outsourcing might increase income in the target country and therefore improve the standard of living at least at the regional level. The third advantage is based on the learning by doing and spill-over paradigms. The procedures such as technological and know-how transfer foster accumulation of human and knowledge capital in low-wage countries and facilitate its survival in international production sharing.
Several shortcomings regarding such a tendency can be found. The high-wage countries have raised the concern that their domestic production might find its place from the low-wage and well-educated country. According to this

56
claim, assembly-line production might move to the low-wage countries and only final assembly and R&D units stay in the high-wage countries. The second concern is connected to the relation-specific investment. That is, the multinational firms might control the cost structure at the regional level and spur uncertainty and shortsightedness in the national regional policy. By acting that way the multinationals might force the countries to take part in the location competition in order to signal that they can move their intermediate production only by comparing the production costs of intermediate goods. The last concern is connected to the recent growth theory that the ongoing process of production sharing might more deeply divide the countries to surviving and dying blocks.
The aim of this chapter is to carry out an empirical analysis about the outsourcing incentives in international production sharing. The empirical analysis is inspired by the theory of Grossman-Helpman (2002b). The model assumes that the emergence of customization costs is a black box and determined by the market. We further develop the concept of the customization costs by adding that these costs are made up by the country characteristics. Moreover, we suppose that the source of the customization costs are composed of the level of human capital and R&D and these choice variables are the main incitements in directing outsourcing decisions.
The structure of this paper is as follows. Section 3.2 presents the set up of the theoretical background of the chapter and explains the contracting environment of the production sector and the logic behind the choice of the endogenous variables included in the model. Section 3.3 focuses on the empirical methodology, data definition and results, and section 3.4 reviews the main foundations of the chapter.
3.2 Theoretical Framework for the Global Outsourcing Model
The Grossman-Helpman model (2002b) defines whether differences in wages and customization costs influence the outsourcing incentives of the final producers. In bargaining, we assume the incentive structure of the principal-agent model in each firm as shown in Holmström – Milgrom (1994). Bargaining between parties is presented in two bargaining rounds. In the first bargaining round, agents of the final firms start to search for partners and initially negotiate with some of the intermediate producers within.14 After this
14 An agent is assumed to search symmetrically around his location, see for details Grossman – Helpman (2002b).

57
first round, agents of each final production firm have a range of integration plans either for domestic or international outsourcing. Similarly, each agent of the intermediate firm has plans with whom to make a subcontract. Each agent knows the potential of human capital and R&D of his representative firm by making decisions based on this information and his own knowledge to put the outsourcing plans in order. This ordering comes from the skills of an agent and his future views of the competitive environment when a product will be released in the market. A principal in each firm has the privilege to accept or disallow the project and choose some other project than proposed. If a principal accepts the proposed project then an agent writes an investment contract with an agent of the intermediate firm. The contract is incomplete because an agent has ex-ante incomplete information about the costs of the investment contract before these costs are realized, that is, when they write the order contract and start production.
After signing the investment contract, an investment stage takes place in which both parties deal with the customization of the product. During this stage, firms face two significant problems regarding their customization costs: first, the distance in expertise between parties increases these costs and; second, the ability to match technologies between parties can generate extra customization costs. These two problems can rapidly make the project unprofitable. To solve these problems the agents have to decide how to choose the human capital to minimize the gap in expertise and how to manage with R&D to guarantee the appropriate success in innovations in the project. When the final and intermediate producers overcome these problems, they sign an order contract and the final producer outsources its input production to some lower-wage firm.
3.3 Main Contracting Equations between Final and Intermediate Firms
The Grossman-Helpman model (2002b) assumes that there are two countries: the high-wage (hw) country for the final producers and country i for the intermediate producers which can located either in the high-wage (hw) or low-wage (lw) country. Firms in both countries can produce a homogenous consumer good with one unit of local labor per unit of output but the firms in the high-wage country are more sophisticated to design the varieties to produce differentiated consumer good y.
The consumers face a product differentiation through the CES sub-utility function and a consumer maximizes:

58
,),(1
0
)(
0
1 lndjdlljyu 0 < , < 1 (1)
where is consumption of the homogenous final good and y(j,l) is consumption of the jth variety. Moreover, presents the spending share that consumers optimally devote to the homogenous good, and = 1/(1 - ) is the elasticity of substitution between any pair of varieties of good y.
The production process is described as steps where firms in the high-wage country are potential producers of a variety of good y. First, both producers enter the market and it involves the investment in expertise. The intermediateproducers in both countries invest where is the wage paid in country i and is the required labor. The final producers invest an amount w
im
i fw iwi
mf hwfn in the design of the final product in which whw is the wage paid in the high-wagecountry and fn is the amount of labor used in developing a product y. Then, suppose that each final product requires intermediate inputs and the final producers cannot produce all of their own because the increasing competition in the global market requires lower production costs or more innovativeproducts. Second, after the investment stage, the search takes place in which the final producers in the high-wage country start to seek intermediate producers from the lower-wage countries keeping, however, in mind theirquality requirements. Third, after a successful search, firms negotiate for the outsourcing contract in order to lead to the relation-specific investment by theintermediate supplier. One key element of the outsourcing contract is that co-operation between parties generates customization costs depending on the distance in expertise between parties. The larger the distance, the higher are customization costs. We show that these customization costs are one of the key elements in defining the boundaries of the firm in outsourcing.
3.3.1 Investment Contract for Prototypes
Before negotiation of the final contract the intermediate producers complete with their prototype plans and after the signing of the investment contract they are able to make the final investment for the customization of the prototype.We examine, following the Grossman-Helpman model (2002b), the conditions how to define the investment contract and induced investment. The constraints in the investment contracting between the intermediate producer in country iand the final producer in the high-wage country are as follows:
2/
2/
iii
iii
Sxwor
Sxw (2)

59
where i are the costs of the customization, w are wage costs in country i and xis the distance between the supplier’s expertise and the final producer’s inputrequirement. In other words, denotes the level of investment. On theright-hand side, by assuming a Nash equilibrium, S
xw ii
i/2 is the prospective revenue that the parties share if they co-operate and the input producer develops the component suitable for the final producer’s needs. Assume also that the final producer is liable to pay an initial payment Pi to the intermediate supplier if he makes the agreed investment.
The parties have several contracting conditions: (i) if S i/2 the project is profitable for the full investment in customization by theintermediate producer even if there is no payment P
xw ii
wii; (ii), if S i/2 < ,there is no investment. In Nash bargaining, the surplus is shared equally andthe final producer’s reward net of the payment is S
xi
i/2 – P i, and the input suppliers reward net of the investment costs is S i/2 + P i – . Also, bothparties divide the investment costs evenly: P
xw ii
i = /2 when x reaches the level that > S
xw ii
xw ii i/2. In sum, Pi(x) is the payment that determines the investment contract between the intermediate and final producer when the distance in expertise is measured as x, and Ii(x) is the induced investmentlevel. That is:
otherwisewSxforxw
xP ii
iii
i
022
1)( (3)
otherwisewSxforxw
xI ii
iii
i
02)( (4)
3.3.2 Searching Partners
Searching takes place after the intermediate producers have introduced their prototype plans and the final producer starts to look for the partners by comparing these plans for producing the quality-adjusted inputs or prototypes. In other words, the final producer compares these plans and their distance of expertise, x, of his input requirement before making first the investmentcontract and finally the order contract.15 In the model, the success in searching
15 Appendix 1. The order contract is a complete contract.

60
is defined as searching intensity x in order to find a partner in country i. The firm finds the partner for sure if x 1/2mi, where m is a number of intermediate producers, and otherwise the probability of finding a partner is2mix. There are two constraints in the model. First, x is never bigger than 1/2 m i because the searching costs are assumed to increase exponentially in x andit is supposed that there is no benefit from finding a second partner whose expertise is less suited to the firm’s input needs than the first. Second,
ii
i
wSx
2 because even if the firm has found a potential supplier at such a
distance, the input producer would be unwilling to make the necessary investment in customization, in view of the contracting environment incountry i. Therefore, the final producer chooses x by maximizing its operatingprofits as:
x ihwiiiin xwdzzPSmx
0
2)(212)( (5)
Subject to
imx
21 (6)
ii
i
wSx
2, (7)
where z denotes that the final producer finds partners from the variousdistances and i describes searching costs.
3.3.3 Free-Entry Conditions
Free-entry for the final and intermediate firms is described as follows. Final producer that enters the industry y in the high-wage country earns the expected operating profits )(),(max lwlw
nhwhw
nn rr with free-entry conditions:
.nhw
n fw (8)
An intermediate producer that enters one or both countries earns the profitsS i/2 + P i – by contracting with the final producer. The potential operating profits are
xw ii
ir iiiiiim dxxwSxPn
0 21)(2 , (9)
and free-entry conditions for the intermediate producer are
country.,for0and lwhwimfwfw iim
iim
im
iim

61
3.4 Contracting Environment
The framework laid out above allows us to examine the various conditions of outsourcing decisions. From (5) we know that if n
hw > nlw the final producer
searches from the high-wage country and also all outsourcing is directed to the high-wage country. Otherwise, if n
lw > nhw there is no domestic outsourcing
and naturally if profits are equal, nlw = n
hw, the firms outsource in bothcountries. The key element to focus on our forthcoming analysis is the interpretation of equations (6) and (7), in which the former deals with thethickness of the market and the latter the relationship between customization costs , , and the intensity to search, x.i
3.4.1 Intensity to Search
Next, the optimal intensity of searching, r, for the final producer and the influence of thick market for the searching intensity are investigated. Consider the incomplete contracting where the intermediate producer invests in the customization if and only if its prospective share of profits exceeds the total cost of developing the prototype. We know from (4) that Ii = if Sxw ii i/2
, and Ixw ii i is otherwise zero.The model assumes that higher distance in expertise requires higher
intensity in searching. Final producer is searching for the partner by maximizing (5) with subject to (6) and (7). In this case, limits in search intensity are defined in three ways: x < 1/2mi, x S i/2 or MC exceeds MB.
iiw16 Total costs of searching are , where 2xw ihw
i
i describes searching costs, denotes the units of labor required in the search and = MC= > 0 and is linear. The optimal r is therefore the point wheremarginal benefits are equal to the marginal costs MC or MB reaches the constraint (7). The binding investment constraints are shown in figure 4.Lower prospective revenue, less thick market or higher customization and wage costs requires lower distance in expertise and hinders search intensity. The change in prospective revenue S
2xi
xi
xTC /whw2
i is presented in figure 4 (a): lower prospective revenues Si affect marginal benefits by moving it from MB1 toMB2 and constraint (7) from S1
i/2 to Siw 2 i/2 . Respectively, a less thick
market adopts a lower m and lowers the marginal benefit from MB
iiw
1 to MB3 . Insum, decrease in revenue or a less thick market lowers the intensity to search
16 Constraint x < 1/2mi not shown in figure 4. See Grossman – Helpman (2002b) for details.

62
and requires lower distance in expertise. Figure 4 panel (b) presents that anincrease in customization or wage costs from S i/2 to Siiw 1
i/2 lowers the intensity to search and requires lower distance in expertise in order to keep theproject profitable.
iiw 2
Sw
i
ihw
The relationship between the optimal search and thickness of the market is defined in (11), where the first row defines MC-MB-relationship, the second row sets the customization cost constraint (7) and the last row sets the thick market constraint (6):
.2
12
,min2
otherwisem
Swm
wwfor
wS
wwmfor
wSm
r
i
i
iii
ii
ihw
ii
i
ii
ihwi
ihw
ii
i (11)
x
MC, MB MC, MB
(a) (b)
iii wS 2/1
ihww2
iiSmii Sm 21
MB1
MB
MB MB
MC
MB2
iiSm 11
MC
iii wS 2/2iii wS 12/iii wS 22/
ihww2
MB3ii Sm 12
x
Figure 4: Choice of Search Intensity
3.4.2 Choice of Human Capital and R&D
So far, we have ignored the setting of the global outsourcing model and, inparticular, the relationship between the optimal search intensity, wages,

63
customization costs and thickness of the market. Next we take a closer look for the customization costs and suppose that the outsourcing incentives of final producers depends crucially on the conditions when countries differ due to their stock of human capital and R&D. In other words, we discuss about thecontracting environment for the firms to explain the general conditions of innovation: the role of human capital and R&D. That is, the final producer in high-wage country (hw) is looking for the jth type of quality-adjusted intermediate good q from country i.
The customization costs of the final producer are measured as the quality of the inputs of the intermediate producer: , where k denotesknowledge capital, i.e. the quality-adjusted physical input, h is the human capital input of the intermediate producer and th presents transaction costs of searching depending on the thickness of the market where the intermediate producer operates. The set-up of the production function cited is that of Grossman – Helpman (1991a, b) and Aghion – Howitt (1992), where the human capital available in the country i is H = (1-u)h + uh and the fraction (1-u) is engaged in education and u in production. We add, as investigated in the Uzawa (1965) and Lucas (1988) models, that the labor input of the firm level includes both the high-skill (hs) and low-skill (ls) employees, h = h
),,( thhkfi
hs + hls.Final producers prefer countries where the fraction of the high-skilledemployees in education is high so that the intermediate producer has a higherprobability to hire skilled employees in order to develop the quality-adjusted intermediate product. We use the simple log-linear expansion of theproduction function to justify the relationship between the customization costs,human capital and R&D:
iiii htkh ˆˆˆˆ (10)
where iˆ are the customization costs to produce the intermediate productdesigned and produced by the intermediate producer and carried out with
the outsourcing contract by the final producer. The terms iq̂
and denote thechange in the firm’s relative product quality, and we hypothesize that
. We simplify the empirical testing by assuming that thereare no rental costs for k. The parameter
0ˆ/0ˆ/ ii kh ˆ, iˆi
is a skill effect and is an innovation effect and these parameters capture the success of product and process innovations. The term is a thick market parameter, where it is hypothesized that , that is, a thicker market is intended to lower transaction costs and it reduces the customization costs and it has a positive impact on demand and exports of intermediate product, q.
0ˆ/ˆ ii ht

64
3.4.3 Customization Costs and Human Capital
Several empirical papers support our hypothesis that firms prefer high-skilled employees even if wage costs are high. Machin – Reenen (1998) found that R&D intensity is skill-biased and relative demand of high-skilled employees is increasing in developed countries in line with international trends. Berman – Bound – Machin (1998) observed that skill-biased technological change has strong evidence in developed countries. The industries have simultaneously increased the share of skilled workers across countries despite the higher relative wages. Based on these foundations, the outsourcing firms might increase both the amount of low-skill or high-skill workers in the presented firm, but the availability of high-skilled employees is restricted by high demand for them by other firms. The international race for skilled employees is increasingly in progress and this phenomenon seems to be a crucial reason why the final producer starts to search for a partner abroad. We suppose that because of the incomplete information the manager can recognize only the level of human capital at the country level and the management has no resources to establish the level of human capital in each intermediate firm. However, they have common information about the level of human capital in the specific country and the higher availability of human capital at the country level makes it more attractive among the watchful eyes of the foreign final producers.
The significance of human capital in production is presented in several theoretical studies such as in Lucas-Uzawa (1988), Rebelo (1991) and Grossman – Helpman (1991a) with clear implications for the final producer’s choices when searching for partners. These models link the quality of education with the rate of innovation and the expansion at the aggregate stock of human capital has a clear effect of increasing the R&D activities. The firms favor human capital in their firms because the costs between skilled and unskilled workers are diminished due to higher availability of skilled employees. In order to reduce customization costs, the underlying set-up leads to the choice for the final producer that he starts to look for partners from the high-skill and low-wage country. Assume that the final producer outsources production to some emerging country such as to China or to Estonia where the stock of H is high but the salary level in both the H and K sectors is initially low, and then the marginal product of human capital uh is low. Assume that a sufficient amount of final producers choose to contract with the intermediate producer in the emerging country. As shown in the Lucas-Uzawa (1988) and Rebelo (1991) models, during the outsourcing stage, the emerging economy increases the stock of physical capital and it transfers human capital from the educational sector to the production sector. However, we suppose that final

65
firms are less interested in the human capital itself than in the increment of the employee’s skills and the success of the project chosen with the intermediate producer.
We suppose that the final and intermediate producers are willing to co-operate by transferring skills between parties during the production process. Concerning the skill adjustment and the success of outsourcing, three observations can be made. First, if skills between parties differ measurably, an essential fact is that the employee skills of the intermediate producer will increase but the employee skills of the final firm might stay unchanged or even be impaired. Such arrangements are discussed e.g. by Teece (1996), who proclaimed that technological co-operation requires the transfer of key individuals and is therefore costly for the final firm. This indicates that contracting environment with a high distance in R&D expertise between partners is unsatisfactory for the final producer when employee skills differ measurably and transactions stay high as long as the learning process of intermediate employees is over. Second, assume that the final producers have incentives to search for increasing returns to scale through skill spillovers. That is based on the fact that especially outsourcing firms are interested in benefiting from skill spillovers during the co-operation because they are looking for new innovations by improving the quality of their final product. These skill spillovers are spawned by the matching of human capital between parties. Studies of Uzawa (1965), Lucas (1988) and Mulligan – Sala-i-Martin (1993) stem from this logic, whereby the increasing returns through skill spillovers improve the skills in both parties. The probability for the final producer to find the partner with skill spillovers is higher when the skills between parties are similar. In other words, the higher the probability for the skill spillovers, the more similar the skill paths are. Third, if skill levels of both parties are low then there are no skill spillovers and outsourcing is successful only when the project survives in price competition.
3.4.4 Customization Costs and R&D
Next we consider the background of the models that define quality, R&D and success in innovations. Studies such as Grilichnes – Mairesse (1984), Bernstein – Nadiri (1988), Klette (1996) have presented empirical evidence about the positive impact of R&D on performance and product quality. The models of Aghion – Howitt (1992), Grossman – Helpman (1991a and 1991b) and Barro – Sala-i-Martin (1995) form the theoretical basis for the dependence on industrial innovation, quality and technological change. Adapted from this set-up, the required technology for producing the differentiated consumer
66
goods stays at the final producer and the quality-adjusted input is defined as sequentially increasing quality-ladders. Successful applications of research help companies to reach a higher quality rung and thereby a better result. The success of new innovations is random and it depends on the scale and performance of the R&D efforts expended by the innovators inside the firm. The R&D resources are dependent on the R&D expenditures in each country and the increase in R&D resources inside the firm or between parties means a higher probability per unit of time for a successful innovation.
Based on this framework we suppose that the demand for intermediate products depends on the quality of these products, and the R&D effort is the source of increasing returns. However, the complexity of the project is the key factor when the final producer is making his outsourcing decision. The final firms prefer more complex final products because these are harder to imitate and they seek to protect their monopoly profits. We found several implications from this set-up about the trade-off between complexity, quality and outsourcing. Assume first the final product with higher complexity than quality, and the wide gap of distance in expertise between the parties in the outsourced project. In this case, the distance in expertise lowers the probability of success in R&D due to increasing transaction costs in the final firm. This co-operation is beneficial for the intermediate producer, but the decreasing success in innovations at the outsourcing process ruins the project. Consequently, if complexity dominates over the quality of the product at the final firm, it decreases the probability of success. Moreover, it restricts the final firm to outsource with the low-R&D intermediate firm and drives it to find a partner from a more advanced country with greater R&D effort. Needless to say, the final producer is searching for a partner that can upgrade the quality of the final product. In other words, the final producer is seeking a cooperative solution where the high quality of the final product dominates over the complexity of the product with low distance in expertise between parties. In this contracting environment, outsourcing leads to the increasing probability of success in innovation. Finally, with low complexity of the project and low quality there is no change in success in innovation even if the distance in expertise is low.
3.5 Empirical Testing
3.5.1 Hypothesis for Empirical Testing
The theoretical part of this chapter investigated the determinants of location of subcontracted activity in a general equilibrium model of outsourcing and
67
trade. The outsourcing was modeled as an activity that requires searching for partners and relation-specific investments that are governed by incomplete contracts. We have shown the endogenous determinants that might affect the decision-making in outsourcing. We claim that in the contracting environment there are differing country characteristics that affect the final producers’ incentives to outsource. The key element to focus on our forthcoming empirical analysis is the interpretation of the relationship between the customizing costs and outsourcing. The customizing costs are defined as the current level of several endogenous variables in each country: the level of human capital and R&D. We emphasize that these independent variables has an impact on a price elasticity of product demand in each country. Based on this theoretical background we formulate the hypotheses that:
First, the investment to improve the R&D as well as the overall educational level in the country is expected to lower the customization costs and improve its attractiveness in outsourcing; Second, the higher probability of success in innovations would also lower the customization costs and by improving the competitiveness of the intermediate producer it has a positive impact on outsourcing activity;Third, the thicker the market, the more easily the final producer finds a partner.
In other words, higher investment in human capital and R&D, and thicker markets are presumed to increase the attractiveness of outsourcing by final producers.
3.5.2 Data Definition and Variables
Next we explain data and formulate the econometric specifications in order to carry out our empirical tests. Because of the heterogeneity and huge amount of data that was very laborious to modify we used a panel data collected from the years 1985, 1990, 1995 and 2000. It included the dependent variable measured as the trade of intermediate goods and independent variables explained below covering 70 countries. As found in chapter 2, outsourcing is more viable in industries where the R&D expenditures are at the intermediate level. We estimated the incentives for outsourcing in that kind of industry where the R&D expenditures are at the intermediate level and these industries are as

68
follows: transport and machinery (non-electrical machinery (382), electrical machinery (383) and transport equipment (384)) 17. We tested five regressions and each year was estimated separately by using OLS. In the first estimation, we want to find out if there is any explanation for the intensity of exports in parts and components18 with respect to their value added (EMVA). In the second regression, we investigate whether the development of exports in parts and components in relation to total exports (EEXP) might be explained by explanatory factors chosen. The difference between the above variables is that EMVA measures the sector’s intensity to concentrate on the exports of parts and components in production and EEXP indicates the sector’s intensity to concentrate on the exports of parts and components in trade. The third and fourth regressions estimate the characteristics in each country to sustain a competitive advantage. We tested these four estimations without leads and lags. Each independent variable reported in the estimation table is picked up from the same year than the dependent variable. The fifth estimation tests the dynamics of the outsourcing process in order to show that investors have expectations about the characteristics of the target country.
The dependent variable in these equations denotes the country’s market share of parts and components (SHAE) at the world market. We described the competitive advantage as the market shares achieved in the world market. The exports of parts and components as well as total exports of machinery and transport equipment (SITC 7) are taken from the UN COMTRADE database and data for the value added from the UN Industrial Statistics and OECD STAN databases. This outsourcing data is unique and it was not used before in such testing. It was highly laborious and hand-made by the author himself. The data of independent variables was collected from the World Development Indicators database by the World Bank.
The dependent variable (OUTSOURCING) in each estimation is then defined by using the following variables:
EMVA = Ratio of exported parts and components to value added in transport and machinery
EEXP = Ratio of exported parts and components to total exports in transport and machinery
SHAE = Market share of exports in parts and components. As found in the theoretical section, we show the customization costs by
explaining them indirectly as the level of education and technology in order to measure the basis for the success in innovation. Human capital was measured 17 List of countries in Appendix 3.1 18 We use the classification by Yeats (2001). See the list of parts and components in Appendix 3.2.

69
as the overall investment in education (PSE) and two other explanatory variables consisting of enrolment rates: (SESG) and (SET). We used the science and engineering students (SCRD) and technicians (TERD) in R&D as well as at the total level (SCST) as a proxy for R&D human capital. Moreover, a proxy for success in innovation was defined as the country’s ability to invest in R&D (RDN). The thickness of the market was described as the amount of listed companies in the country.
The list of independent variables is therefore as follows: PSE = Public spending on education at the country level, total (% of
GDP)SESG = School enrolment at the country level, secondary (% gross) SET = School enrolment at the country level, tertiary (% gross) SCST = Science and engineering students at the country level (% of
total tertiary students) SCRD = Scientists and engineers in R&D at the country level (per
million people) TERD = Technicians in R&D at the country level (per million people) RDN = Research and development expenditure at the country level (% of GDP).
The thickness of the market was tested by the variable:
THICK = Total amount of listed companies in each country. Furthermore, we used several regional dummies as presented in appendix
3.4.At the convergence estimation, we defined the direction of change in
outsourcing as follows: CHEX8500 = Change in market share of exports in parts and components
of transport and machinery from 1985 to 2000 Finally, in order to measure elasticity our log-linear estimation equation is
OUTSOURCINGi = + 1PSEi + 2SESGi + 3SETi + 4SCSTi +5SCRDi + 6TERDi + 7RDNi + 8THICKi + 9DUMMYi + i ,
and the model at the convergence estimation isSHAEi = + 1CHEX8500i+ i .
70
3.5.3 Econometric Results
In the first estimation, we tested the relationship between the outsourcing intensity in production and the customization costs. These results are displayed in table 1219 According to the F-test, the total significance of each four regressions seems high and the R2 implies that explanatory variables explain around 30 per cent of the total incentives to outsource. Based on our hypothesis that higher human capital imply higher outsourcing we found that several human capital variables are correctly signed and statistically significant. This indicates that higher investment in the basic secondary school education (SESG) and science and engineering students at the country level (SCST) supports higher outsourcing. The model specification was accepted after testing the fixed effects model and then OLS results were reported. Wald(1) is the coefficient test used to show the joint significance of the education variables (PSE, SESG, SET) and Wald(2) for R&D variables (SCST, SCRD, TERD, RDN). We base a test of the null hypothesis same way than in chapter 2: H0: c(n)=0 where c is the coefficient of n:th independent variable. Also the Breusch-Godfrey Lagrange Multiplier (LM) specification test is included to measure the serial correlation of residuals and misspecification of the model as found from chapter 2. The null hypothesis of the LM test is; H0: serial correlation.20 In table 12, the Wald test statistic rejects the hypothesis that the education and R&D variables are insignificant except in second column where the dependent variable is EMVA90. The LM test rejects the null hypothesis and there is no serial correlation except in third column.
19 In each table we use the t-test levels as: significant at the ***10 %, **5 %, *1 %. We report significant variables and variables which are near to being significant. Logarithms are used in all estimations. 20 The Wald test statistics is shown in the end of each table and it rejects the null hypothesis that the independent variable is insignificant at the ***10 %, **5 %, *1 % level. The LM test indicates the serial correlation of residuals when the null hypothesis is not rejected.

71
Table 12: First Estimation: Intensity of Exported Parts and Components in Production
Variable EMVA85 EMVA90 EMVA95 EMVA00
Constant
PSE
SESG
SET
SCST
SCRD
TERD
RDN
-10.368 (-3.779)* 0.975
(2.175)** 1.560 (2.762)* 0.627
(1.950)** 0.793
(1.392)-0.923(-3.417)* 0.249
(0.983)-0.176
(-0.934)
-7.676(-5.512)* 0.950 (3.167)* 0.769
(2.197)** -
0.586 (1.930)*** -0.121
(-1.000) -
-
-9.154(-5.714)*
0.418 (1.175)1.142
(3.044)* -
0.846 (2.637)** -0.121
(-0.931) -
-
-8.670(-5.375)*
-
1.252 (3.356)*
-
0.712 (2.422)** -0.193
(-1.314)0.136
(1.109) -
Test statistics, n=70
R2
D-WF-statisticWald(1)Wald(2)LM
0.281.863.52* 7.28* 4.09* 1.88
0.301.946.86* 8.00* 2.241.51
0.271.436.15* 5.65* 3.65** 5.57***
0.271.546.04* 11.3* 2.91** 3.71
In the second estimation, we formed the regression to explain the outsourcing intensity in international trade. The estimation results are provided in table 13 When compared to the first estimation, the R2 values are lower in each regression but the regressions are still significant at least at the 10 per cent level. Also the results are more moderate than in the first regression. These moderate results can be also found from the Wald test statistic that shows the coefficient significance to the R&D variables only since 1990 and to the education variables only in 1985. Also the LM test fails to reject the null hypothesis and shows the misspecification of the model except in the last column. The coefficient interpreting the investments in human capital is significant only occasionally and carries wrong sign. On the contrary, the coefficients representing the investment in R&D human capital (SCRD,TERD) and research and development expenditure (RDN) in the years 1995 and 2000 are correctly signed and highly significant. This suggests that countries that are oriented toward exporting parts and components in total

72
trade in transport and machinery have used more investment resources for total R&D expenditure and also for R&D human capital.
Table 13: Second Estimation: Intensity of Exported Parts and Components in Trade
Variable EEXP85 EEXP90 EEXP95 EEXP00
Constant
PSE
SET
SCST
SCRD
TERD
RDN
-3.490(-3.532)*
0.559 (2.468)** 0.188
(1.515)0.369
(1.316)-
-0.133(-1.560)
-
-3.274(-3.656)*
0.331 (1.713)*** 0.124
(1.121)0.491
(2.422)** -
-0.127(-1.584)
0.084 (1.339)
-2.369(-3.360)*
-
-0.127(-1.217)
0.215 (1.351)0.335
(3.571)* -0.276
(-2.831)* 0.103 (1.932)***
-1.155(-1.134)
-
-0.132(-1.122)
-
0.160 (1.911)*** -0.190(-2.286)** 0.156
(3.001)*
Test statistics, n = 70 R2
D-WF-statisticWald(1)Wald(2)LM
0.122.462.22*** 3.76** 1.835.45***
0.172.242.60** 2.093.30** 9.27*
0.222.243.66* 1.483.96* 5.87**
0.152.011.87*** 0.732.54** 4.67
The third estimation was based on the intuition that higher reserves in education and R&D would imply the higher market share of outsourcing in international trade. The results in table 14 show that all regressions as a whole are highly significant and R2 reaches an explanatory level higher than 50 per cent in the years SHAE95 and SHAE00. The Wald test shows the significance of the R&D variables and the education variables except with SHAE00. The LM test rejects the null hypothesis in each column and the model specification was accepted. When compared to our hypothesis, the coefficients indicating human capital show the correct sign, as anticipated but only investment in secondary education (SESG) seems to be strongly significant in each estimation. One of the central results found from the third estimation implies strong statistical significance for the rest of the independent variables. The investments in R&D human capital (SCRD and TERD) are positively signed

73
and strongly significant in years 1995 and 2000. Also expenditures on R&D at the country level (RDN) have a strong relationship with the market shares in outsourcing. This suggests that the competitive advantage in outsourcing is created by investing in these factors. Moreover and what is important that investment in human capital in R&D as well as R&D expenditures has a high relationship with the market shares and it has continuously increased during the 1990s.
Table 14: Third Estimation: Market Shares in Outsourcing
Variable SHAE85 SHAE90 SHAE95 SHAE00
Constant
PSE
SESG
SCST
SCRD
TERD
RDN
-23.835 (-5.126)*
1.457 (1.921)*** 2.474
(3.129)* 1.882
(1.925)*** -
-0.326(-0.999)
0.684 (2.314)**
-21.103 (-5.328)*
1.506 (1.981)*** 2.070
(2.350)** 1.278
(1.647)*** -
-0.723(-1.599)
0.717 (2.998)*
-24.084 (-6.264)*
-
2.874 (3.524)* 1.656 (2.457)** 1.183 (2.932)* -1.417(-3.521)* 0.801 (3.728)*
-22.357 (-4.444)*
-0.552(-0.680)
2.965 (2.963)* 0.986
(1.209)0.978 (2.424)** -1.035
(-2.531)** 0.827
(3.390)*
Test statistics, n = 70 R2
D-WF-statisticWald(1)Wald(2)LM
0.431.889.60* 6.98* 4.05** 0.37
0.482.099.72* 5.14* 3.85* 0.85
0.581.98
18.04* 12.4* 7.20* 1.01
0.502.10
10.60* 0.522.52** 0.84
We made a further effort to explain the dynamics in competitive advantage by testing the convergence of market shares during 1985-2000. Table 15 reports the simplified convergence estimation where the dependent variable is the initial market shares in 1985 and the explanatory variable denotes the change in the market shares in exports of parts and components from 1985 to 2000. The results show the convergence, that is, the countries with high market shares in 1985 have lost their positions and, vice versa, the countries with initially low market shares in exports of parts and components have improved their positions.

74
Table 15: Fourth Estimation, Competitive Advantage and Convergence Analysis
Variable SHAE85
Constant
CHEX8500
0.018(3.340)*-0.006(-1.724)***
Test statistics,n = 70
R2
D-W F-statistic
0.041.592.97***
Next, the thick market hypothesis was tested and the results are reported in appendix 3.5. The number of listed firms was used as a proxy of a thick market. As found from the results, the coefficient has a positive sign and the F-test in each estimation is significant. The Wald test shows the significance of the R&D variables and the education variables in almost each estimation, and the LM test indicates the accepted specification. At least the exports of parts and components compared to its share of total exports as well as market share are positively correlated to the thickness in market. We used also several regional dummies to show whether regions would be related more intensively to the outsourcing. The regions were allocated to the groups (see appendix 3.4) based on their activity in economic integration (OECD, EU15 and CEEC) and trade agreements such as ANCOM, CACM and MERCOSUR in South America, ASEAN in Asia, APEC between Asia, Oceania and America, and NAFTA between North-America and Mexico. The results of the regional orientation in appendix 3.5 indicate that highest orientation to the outsourcing appears with the EU15, OECD, NAFTA, APEC and ASEAN regions. The groups in South America seem to have less outsourcing activity and same holds for the CEEC. The results show that the outsourcing is concentrated between and within the developed OECD and APEC countries and developing ASEAN and APEC countries. We also used the dummies to separate the high and low-income countries. It seems that the high-income countries have a positive and low-income countries a negative coefficient but the results were statistically insignificant.
Finally, we are interested to test the dynamics of the outsourcing process by using the periodical leads and lags. It should also correct the serial correlation and misspecification of the model as found from some estimations above. These results are shown in table 16. The Wald test indicates the joint significance both in the R&D variables and the education variables in each

75
estimation. The LM test rejects the null hypothesis of serial correlation and the model specification was accepted. First column shows that earlier tertiary school enrolment (SET85) are positively related to the exports of intermediate products (EMVA95 and EEXP95). Also public spending on education (PSE90) in the earlier period has positive relationship with all dependent variables (EMVA95, EEXP95 and SHAE95); Moreover, higher investments in the scientists and engineers in R&D (SCRD85) as well as the science and engineering students (SESG90) in earlier periods support higher market shares of outsourcing (SHAE95). This estimation also implied that expectations to outsource are created by investing in technicians in R&D (TERD00) because it has a positive relationship with EMVA95, and both TERD00 and higher R&D expenditures (RDN00) support higher market shares of outsourcing (SHAE95).
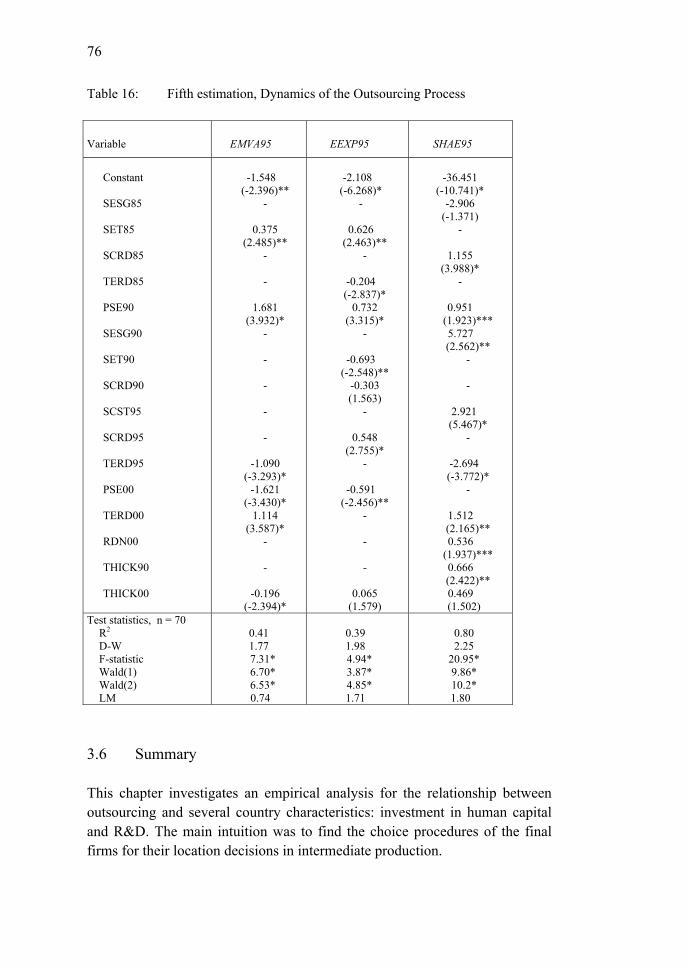
76
Table 16: Fifth estimation, Dynamics of the Outsourcing Process
Variable EMVA95 EEXP95 SHAE95
Constant
SESG85
SET85
SCRD85
TERD85
PSE90
SESG90
SET90
SCRD90
SCST95
SCRD95
TERD95
PSE00
TERD00
RDN00
THICK90
THICK00
-1.548 (-2.396)**
-
0.375 (2.485)**
-
-
1.681 (3.932)*
-
-
-
-
-
-1.090 (-3.293)*
-1.621 (-3.430)*
1.114 (3.587)*
-
-
-0.196 (-2.394)*
-2.108 (-6.268)*
-
0.626 (2.463)**
-
-0.204 (-2.837)*
0.732 (3.315)*
-
-0.693 (-2.548)**
-0.303 (1.563)
-
0.548 (2.755)*
-
-0.591 (-2.456)**
-
-
-
0.065 (1.579)
-36.451 (-10.741)*
-2.906 (-1.371)
-
1.155 (3.988)*
-
0.951 (1.923)*** 5.727 (2.562)**
-
-
2.921 (5.467)*
-
-2.694 (-3.772)*
-
1.512 (2.165)** 0.536
(1.937)*** 0.666 (2.422)** 0.469 (1.502)
Test statistics, n = 70 R2
D-W F-statisticWald(1) Wald(2) LM
0.41 1.77 7.31* 6.70* 6.53* 0.74
0.39 1.98 4.94* 3.87* 4.85* 1.71
0.80 2.25
20.95* 9.86* 10.2* 1.80
3.6 Summary
This chapter investigates an empirical analysis for the relationship between outsourcing and several country characteristics: investment in human capital and R&D. The main intuition was to find the choice procedures of the final firms for their location decisions in intermediate production.
77
We tested the choice procedure by using several outsourcing factors: the sector’s intensity to outsource in production, the sector’s intensity to outsource in international trade and their market shares in outsourcing. Our main conclusion, which is found from the empirical testing is that both investment in human capital and technology may increase the country’s ability to take part to the international outsourcing process. The first result is that higher investment in basic education and human capital in R&D supports a higher ratio of exports of parts and components to production. The second result is that countries which are oriented toward exporting parts and components in total trade in transport and machinery, have used more investment resources for total R&D expenditure and also for human capital in R&D. Third, one of the central results found was that the investment in human capital in R&D and also expenditures in R&D has a strong relationship with the market shares witnessed in outsourcing and these factors have become highly significant during the1990s. As regards the results from testing the regional orientation with respect to the outsourcing, it seems that it occurs between and within the developed OECD and APEC countries and developing ASEAN and APEC countries. When the dynamics of outsourcing is taken account it seems that the education variables in the earlier periods and the expectations of future R&D investment implies higher outsourcing in the target country.


79
PART II
OUTSOURCING, FDI AND INNOVATION SYSTEMS IN EUROPEAN INTEGRATION


81
4 INDUSTRIAL OUTSOURCING, FDI AND ORGANIZATION OF PRODUCTION IN THE CONTEXT OF EUROPEAN INTEGRATION
4.1 Introduction
This chapter presents empirical evidence about the impact of labor and capital productivity and labor costs on the direction of FDI and outsourcing in the EU.
Both foreign direct investment and outsourcing have boomed dramatically in recent years. Such a phenomenon is attributable to the ever-integrating economic structures that highlight the differences of productivity and the factor prices across countries. Grossman and Helpman (2002c) have developed a theoretical model that assists in understanding the trade-off between these events. In their model, the specialized suppliers are more efficient producers of the inputs, but the bilateral relationships between the suppliers and the final producers are plagued by contractual incompleteness. The specialization spurs customization costs and the relation-specific investments are lost if they fail in the partnership. Alternatively, the foreign subsidiary is more secure but it accumulates the transaction costs and is therefore less productive than the specialized production. The model investigates how the rise in wages or increase in productivity might contribute to the producers’ choice regarding how to organize their intermediate production. Moreover, the model shows that an increase in the productivity advantage of firms that specialize in producing components raises the fraction of firms that engage in outsourcing and the market share of such firms.
The issues of ‘FDI and productivity’ and ‘FDI and labor costs’ have been the subject of extensive research; see Driffield (1996) and Conyon et al. (1999) regarding FDI vs. wage and productivity differences in the UK; Horstmann and Markusen (1996) on MNE, FDI and the location advantages; Coe and Helpman (1995) on foreign R&D capital and productivity in the OECD countries; and Liu and Wang on FDI and the advanced technology transfer in China. The main results of the empirical testing have been that the trade of intermediate products, the productivity race and the skill-biased technological change have been found to imply lower wages and demand for the less-skilled production labor but they improve labor and capital productivity and guarantee higher wages for the skilled employees. When considering the relationship between outsourcing, productivity and the factor

82
conditions, Feenstra – Hanson (1996) found that, in the US, outsourcing has a positive effect on the demand for skilled labor and it decreases the demand for less-skilled labor because firms move the non-skill-intensive activities abroad. Feenstra and Hanson (1999) also examined the role of outsourcing and high-technology capital on wages and total factor productivity in the US. Based on their results, an increase in outsourcing and R&D have a positive effect ontotal productivity. Moreover, the rise of outsourcing and especially computer expenditures have a more positive impact on non-production wages than production wages.
Even if the theoretical literature is seeking answers on how to organize intermediate production either by outsourcing the component production or by producing their own components in the foreign subsidiaries through FDI, the empirical literature has addressed these events rather separately. Our purpose is to find empirical evidence why some industries have chosen FDI and othersoutsourcing.
This chapter is organized as follows. The next section shows the modifiedtheoretical model for empirical testing. Section 4.3 outlines the hypotheses for testing FDI versus outsourcing and describes the data and variables. In the endof the section, we empirically investigate the effects of productivity differences and the increase in wages on modes of organizing production.Section 4.4 presents concluding remarks.
4.2 The model
The Grossman-Helpman model (2002c) is presented in this section with some modifications for empirical testing in section 3. This approach combines the Grossman-Helpman models (2002a) and (2002b) allowing us to investigatethe choice of the intermediate production between FDI and outsourcing. In thismodel, the differentiated goods are designed in the high-wage country at the cost of whw fn per variety, where w is the wage rate and fn is the labor needed in design in the high-wage country.
The demand side of the model is designed as I , where is the fraction ofconsumers’ income and income is measured as I = whwLhw + wlwLlw, where L isthe fixed labor in each country. The demand for the differentiated product is:
Apy (1)
where
djjp
IA1)(
(2)

83
Equation (2) determines the industry demand, where p(j) is the price of variety j, and > 1 is the elasticity of demand. By assuming CES preferences, the elasticity of demand is same as the elasticity of substitution.
The supply side includes n final producers that choose either to act asintegrated producers or specialized producers, and they supply thedifferentiated products. If the wage, w, in the integrated producer’s country isgreater than one, he will start to search for lower-cost production possibilities abroad and move his component production to some low-wage country. Anintegrated producer needs > 1 units of labor per unit of output to produce the component himself that measures the marginal cost of production for the integrated producer. Alternatively, there is a finite number of m specialized component producers in the low-wage country and to achieve their expertise they recruit fm units of labor, and the total labor costs are wlwfm. Moreover, the required labor for customization is determined as x , where x denotes the distance in expertise. The closer the specialized intermediate producer’s expertise to the final producer’s needs is, the lower the customization costs are. Negotiations continue in two stages: firstly an investment contract is signed and secondly an order contract, as already presented in chapter 3.Finally, when the outsourcing contract is signed it is found to be incomplete because there is an uncertainty at the legal system in each country, , and each step of the parties cannot be verified in the contract. The higher is, the more efficient the country’s legal system is and more complete the contracts are.
The final producer is seeking an outsourcing partner who has either a costor know-how advantage over the other applicants. When considering our empirical testing in the next section, we make two exceptions to the model.We determine that before negotiating for the outsourcing contract the final producer decides whether he chooses to order the components from the high-wage intermediate producer at home or from the low-wage producer abroad.Before making such a decision, the final producer compares both the wagecosts and the labor productivity in these countries. Moreover, we have no measure for the legal system in the host country and therefore we assume that
= 0, that there is incomplete contracting as well as that the incapable customization technology increase the customization costs. Therefore in such circumstances, the investment contract is attractive if an up-front payment isformed as a function of distance x as
otherwisewSxforxw
xP ii
oii
i
022
1)( , (3)
and thereby

84
,2/ilwlwlw
hwhwhwlwlwlw
Sxw
andxwxw
(4)
the final producer chooses the particular low-wage country and the projectis profitable for the full investment in customization by the intermediate producer. In (4) S denotes the joint profits of the project that are sharedequally. After the investment contract is signed the parties sign an efficientcontract to deliver the component, where the price of the final product is
/11,/1sp , and the joint profits from the outsourcing partnership are:11)1( AS o (5)
The final producer makes a foreign direct investment to buy a foreign subsidiary when the marginal cost of the intermediate products 1 by settingthe price, /vp , and the operating profit will be
ov SS 1 . (6)
The final producer makes its decision about vertical integration by usingFDI or outsourcing. If the distance between the final producer and the nearest intermediate producer is iio wSx 2 , then these firms choose the vertical integration by using FDI. If the expertise is closer than the final producer needs ( iio wSx 2 ), then he should choose between the profits of vertical integration, Sv, or outsourcing, So/2 – P(x). Assume that 211 that assures,
which Sv < So/2 – P(x) when 2oSx , and the final producer choosesoutsourcing. In contrast, if 211 then the final producer chooses vertical integration with FDI. It follows that the cut-off point for choosing the mode ofoutsourcing is:
2
oo Sx (7)
In this model, the entry of firms and the maximization of profits are such that final producers, m, locate in the unit circle as explained in chapter 3 and inGrossman – Helpman (2002b) such that the distance between them is 1/m.Each intermediate producer delivers components to all final producers within xo and therefore the number of final producers is 2nxo. By using (3) and (6),total profits are
nx
dxxSxPn
o
x om
o
2
0
)(
21)(2
, (8)

85
where P(x) + 1/2So – x is the marginal profit at distance x for the intermediate producer, and in equilibrium, mlwm fw .
A final producer starts to look for the intermediate producers randomly. If he finds a partner within the distance of xo, with a probability of 2mxo, the final producer outsources his intermediate production with the profits of So/2 –P(x). The expected profits regarding whether to outsource or integrate are
1
1
0
212
22)21(
)(2
12)21(
x
xx
dxxPSx
mxSmxox o
oovo
n
(9)
In equilibrium, the profits can be equalized as nhwn fw and with (3), (6), (7) the zero-profit condition for the final producers as described as the nn-linein figure 5 is
1)21(1
2nhwo fwx , (10)
where the fraction of outsourcing producers is described as = 2mxo . From (2), (5) and (7), and with /1sp , vp , mlwm fw , the zero-
profit condition for the intermediate producers and the expression for the mm-line is
111
2
SlwNhw
mlwo
LwLwfw
x (11)
nn-line
mm-line
xo
Figure 5: Equilibrium for xo and

86
The equilibrium for (fraction of final producers that engage in outsourcing) and xo (distance of the nearest supplier) is demonstrated in figure 5. The outsourcing firms have a productivity advantage that is described as .We know that if 1 and 1, then , that is, the increase of 11
decreases by . It follows that the increase of 1 moves the mm-linedownward more than the nn-line upward by increasing the fraction of final producers that engage in outsourcing, . That is, with higher marginal costs of production and lower productivity, the firms choose to outsource their intermediate production. Consider next the change in the wage level in acertain variety of a product. Assume that the wage level of such a variety increases in the high-wage country by raising the design costs, . An increase of shifts the nn-line upward and mm-line downward in order to increase outsourcing. Alternatively, the higher increases the costs of expertise that is employed to customize intermediate products and complicates their attempts to find a partner. The rise in wages moves the mm-curve upwardand lowers the incentives of the final producers to outsource their intermediate production.
nhw fw
hww
lww
21
4.3 Empirical implications
4.3.1 Hypotheses for testing FDI versus Outsourcing
The Grossman-Helpman model (2002c) with our modifications suggests several hypotheses:
First, a decline in productivity or rise in wages in the final producer’s country increases the probability that the final producers, either by foreign vertical integration or outsourcing,move their intermediate production to the higher productivity or low-wage country. Second, the improvement in productivity in the intermediate producer’s country increases the fraction of final producers that decide to outsource and therefore the probability that industries from the final producer’s country choose to outsource their intermediate production to the better-productivity country. It follows that the outsourcing industries are more sensitive to the labor productivity than the vertically integrated industries
21 We assume that a wage increase in some variety has a marginal effect on Ls.

87
because specialized producers have more expertise and they have to pay the outsourcing costs. Third, the outsourcing industries are more sensitive to the increase of wages than the integrated producers because it increases their customization costs and impedes their finding a partner.Fourth, we predict that the big EU countries are more active both in FDI and outsourcing than the small EU countries because they have more MNEs to make FDIs and the thick market assumption favors them in outsourcing.
4.3.2 Data Definition and Variables
To test our hypotheses about the choice between FDI and outsourcing that reflects the change of productivity and wages in the EU, we gathered panel data on EU industrial sectors in years 1985, 1990, 1995 and 2000. Our data includes 6 manufacturing industries (food, wood and paper, non-electrical machinery, electrical machinery, transport) from 12 European Union countries (Austria, Belgium, Denmark, Finland, France, Germany, Italy, the Netherlands, Portugal, Spain, Sweden, the United Kingdom). The industrial sector data is restricted to only those industries because of the restrictions in data. Moreover, we use the trade data as a proxy of production in each industry because of the unavailability of such production data. We use the same outsourcing data source as in chapter 3, the UN COMTRADE database for the years 1985, 1990, 1995 and 2000. The FDI data is collected from the European Union Foreign Direct Investment Yearbook 2001 including the years 1992-2000. The data for productivity, value added, invested fixed capital as well as labor costs are from the OECD STAN database.
The outsourcing data is built up from the years 1985, 1990, 1995 and 2000. The dependent variable (OUT) in testing is then defined by using several variables as:
OUTIM(year) = Imported intermediate products, total sum OUTEX(year) = Exported intermediate products, total sum OUTIMVA(year) = Ratio of imported intermediate products to value addedOUTEXVA(year) = Ratio of exported intermediate products to value
added.OUTIMVACH(year) = Change in the ratio of imported intermediate
products to value added OUTEXVACH(year) = Change in the ratio of exported intermediate
products to value added. Because of the shortcomings in the FDI data, it is divided to two periods:
1992-1995 and 1996-1999. The dependent variables (FDI) are:

88
FDIOTAV(period) = Average of the FDI outflows, total sum FDIITAV(period) = Average of the FDI inflows, total sum FDIOCH(period) = Yearly change of the FDI outflows FDIICH(period) = Yearly change of the FDI inflows FDIOVA(period) = Ratio of the FDI outflows to value added FDIIVA(period) = Ratio of the FDI inflows to value added. FDIOVACH(period) = Change in the ratio of the FDI outflows to value addedFDIIVACH(period) = Change in the ratio of the FDI inflows to value added.
The independent variables are calculated as follows. Labor productivity is measured as the ratio of value added per employee and labor costs are determined as the ratio of labor compensation to value added. The capital productivity is employed as the ratio of value added to the fixed capital stock. These variables are collected for the years 1985, 1990, 1995 and 2000. The change in labor productivity, capital productivity and labor costs are calculated from the average of yearly change in periods 1985-1990, 1991-1995 and 1996-2000. The list of independent variables is therefore as follows:
LABROD(year) = Labor productivity LABRCH(period) = Change in the labor productivityLABCOST(year) = Labor costs LABCOCH(period) = Change in the labor costs CAPROD(year) = Capital productivityCAPRCH(period) = Change in the capital productivity
Finally, depending on our hypotheses, the dependent variable is either from the list OUT or FDI and with the chosen independent variables, our estimation equations are
MODEi(t) = + 1LABRODi(t-1) + 2LABRODi(t) + 3LABRODi(t+1) +4LABCOSTi(t-1) + 5LABCOSTi(t) + 6LABCOSTi(t+1) + 7CAPRODi(t-1) + 8CAPRODi(t) + 9CAPRODi (t+1) +10DUMMYi + i ,
MODEi(t) = + 1LABRCHi (t-1) + 2LABRCHi(t) + 3LABRCHi(t+1) + 4LABCOCHi(t-1) + 5LABCOCHi (t) + 6LABCOCHi(t+1) + 7CAPRCHi(t-1) + 8CAPRCHi(t) + 9CAPRCHi(t+1) + 10DUMMYi
+ i ,Where the expressions t+1 and t–1 denote the periodical leads and lags and
the DUMMY variable include the country and industrial dummies.
4.3.3 Econometric Results
In order to test our hypotheses, we first need to explain how the dependent variables correlate, that is, how outsourcing is related to FDI. This is relevant

89
because industries can make foreign direct investment to some foreign country and import components in accordance with their needs instead of outsourcing. Table 17 reports the basic relationship between these dependent variables. The upper section of the table denoted by correlation 1 shows that the imported intermediate products in 1995 (OUTIM95) are more related with the FDI outflows in the period of 1996-1999 (FDIOT9699) than with those in the period of 1992-1995 (FDIOT9295). This should be the case because industries should invest first and then afterwards import the components. However, the ‘right’ relationship between OUTIM95 and FDIOT9295 as well as between OUTIM00 and FDIOT9699 is around 40 per cent. Moreover, the relationship between exported components in 2000 (OUTEX00) and the FDI inflows (FDIIT9699) is near 40 per cent. When outsourcing and FDI are proportioned to the value added, the results are shown in the section denoted by correlation 2. It shows that correlation is stronger with the FDI inflows than with the FDI outflows. It also implies that the FDI boom with the imported and exported components has been concentrated more on the period of 1992-1995 than the period of 1996-1999. In contrast, the section under the heading correlation 3 presents the relationship concerning the change of the ratio of FDI to value added and the ratio of outsourcing to value added. The results indicate that the change of the FDI outflows/value added (between the periods of 1992-1995 and 1996-1999, FDIOVACH) is most highly related to the change of the imported as well as the exported components/value added. As a consequence, these correlation tables suggest that the relationship between the FDI and outsourcing data is rather weak. Thus, the results allows us to expect that there is a difference between the industries or firms that organize their intermediate production by using FDI and those who organize it by outsourcing.
Next we test our first hypothesis and our first prediction is that productivity should have a positive and the labor costs a negative linear relationship with outsourcing. The model specification was accepted after testing the fixed effects model and then OLS results were reported. In each estimation, we use the restricted Wald test. Wald(1) is the coefficient test used to show the joint significance of the labor productivity variable, Wald(2) show the joint significance of the capital productivity variable and Wald(3) tests the joint significance of the labor cost variable. The Breusch-Godfrey Lagrange Multiplier (LM) specification test is included to measure the serial correlation of residuals and possible misspecification of the model. The null hypothesis of the LM test is; H0: serial correlation. We base a test of the null hypothesis
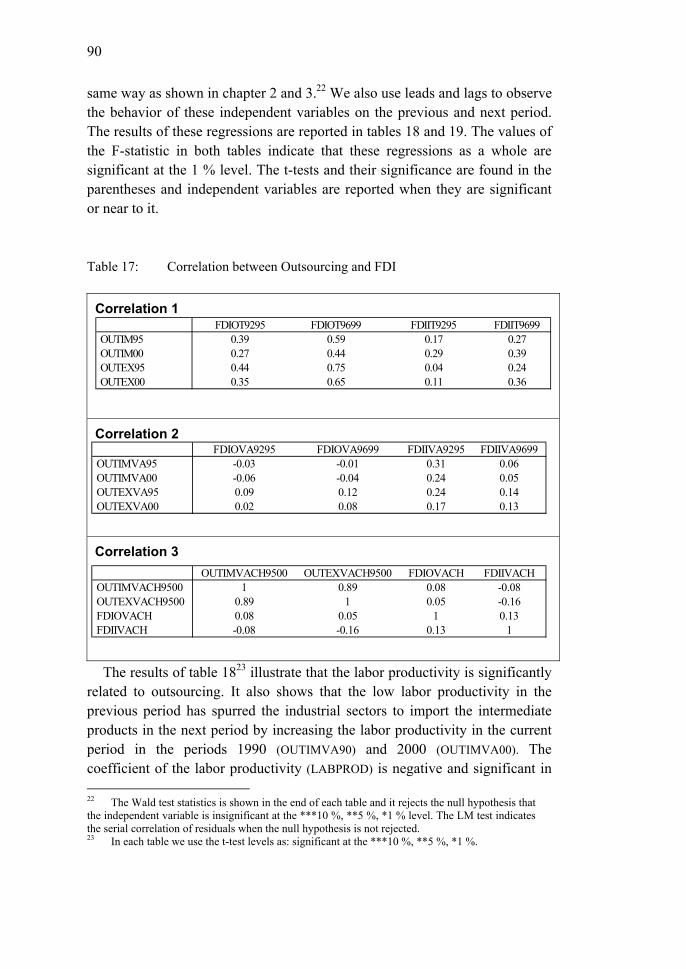
90
same way as shown in chapter 2 and 3.22 We also use leads and lags to observethe behavior of these independent variables on the previous and next period.The results of these regressions are reported in tables 18 and 19. The values ofthe F-statistic in both tables indicate that these regressions as a whole are significant at the 1 % level. The t-tests and their significance are found in theparentheses and independent variables are reported when they are significantor near to it.
Table 17: Correlation between Outsourcing and FDI
Correlation 1
Correlation 2
Correlation 3
FDIOT9295 FDIOT9699 FDIIT9295 FDIIT9699 OUTIM95 0.39 0.59 0.17 0.27 OUTIM00 0.27 0.44 0.29 0.39 OUTEX95 0.44 0.75 0.04 0.24 OUTEX00 0.35 0.65 0.11 0.36
FDIOVA9295 FDIOVA9699 FDIIVA9295 FDIIVA9699 OUTIMVA95 -0.03 -0.01 0.31 0.06 OUTIMVA00 -0.06 -0.04 0.24 0.05 OUTEXVA95 0.09 0.12 0.24 0.14 OUTEXVA00 0.02 0.08 0.17 0.13
OUTIMVACH9500 OUTEXVACH9500 FDIOVACH FDIIVACH OUTIMVACH9500 1 0.89 0.08 -0.08 OUTEXVACH9500 0.89 1 0.05 -0.16 FDIOVACH 0.08 0.05 1 0.13 FDIIVACH -0.08 -0.16 0.13 1
The results of table 1823 illustrate that the labor productivity is significantly related to outsourcing. It also shows that the low labor productivity in the previous period has spurred the industrial sectors to import the intermediate products in the next period by increasing the labor productivity in the current period in the periods 1990 (OUTIMVA90) and 2000 (OUTIMVA00). The coefficient of the labor productivity (LABPROD) is negative and significant in
22 The Wald test statistics is shown in the end of each table and it rejects the null hypothesis thatthe independent variable is insignificant at the ***10 %, **5 %, *1 % level. The LM test indicatesthe serial correlation of residuals when the null hypothesis is not rejected.23 In each table we use the t-test levels as: significant at the ***10 %, **5 %, *1 %.

91
the previous period but positive and significant in the current period in 1990, turning to be slightly insignificant in 2000. In 1985 (OUTIMVA85), the coefficient of labor productivity is negative in the current period but positive in the next period, and in 1995 (OUTIMVA95) it is insignificant. The coefficient is small but shows the right signs.
The coefficient of the labor costs seems more modestly related to outsourcing when compared to the estimation results with the labor productivity but the coefficient of the labor costs is larger. The high labor costs in the previous period have been positively affected by outsourcing in 1990 and 1995. Also the high labor costs in the next period in 1995 and in the current period in 2000 has motivated industrial sectors to import the intermediate products. Moreover, the capital productivity has become more important in recent years. The high capital productivity has pushed producers to outsource their intermediate production in 1995 and 2000.
The dummy variables are used to yield the industry and country effects. As reported in table 18, the results of the industry effects imply that the intermediate products are imported in the machinery, electrical machinery and transport industries. As expected, the statistical significance in these industries is strong. The results of the country effects are more inconclusive when considering the small EU countries because it might be expected that especially the small open economies import intermediate products. In contrast, the result is that only in Belgium and the Netherlands are the coefficients positive and, for example, in Sweden or Finland the results are negative and mostly insignificant. In the big EU countries such as in Germany or the UK the results are mostly insignificant and negative. Such a result also fails to indicate clearly the country effects between the big and small EU countries. The Wald test statistic rejects the hypothesis that the independent variables are insignificant when they are included to the estimation. The LM test rejects the null hypothesis of serial correlation and the model specification was accepted only in first and last column. This misspecification of second and third column was corrected by using the lagged dependent variable as an explanatory variable. The results are shown in appendix 4.1. and it indicates that the industries who outsource in the past also outsource in the future.

92
Table 18: Dependent Variable: Ratio of Imported Intermediate Products to Value Added
Variable OUTIMVA85 OUTIMVA90 OUTIMVA95 OUTIMVA00
Constant
LABPROD85
LABCOST85
CAPPROD85
LABPROD90
LABCOST90
CAPPROD90
LABPROD95
LABCOST95
LABPROD00
LABCOST00
CAPPROD00
MACH
ELMACH
TRANS
BELGIUM
GERMANY
FRANCE
ITALY
NETHERLANDS
PORTUGAL
SWEDEN
-0.0175(-0.64)-0.0065
(-2.21)**-
-
0.0048 (2.04)**
-
-
-
-
-
-
-
0.114 (2.64)* 0.132
(3.05)* 0.414
(9.46)* 0.174
(3.11)* -
-
-0.067(-1.20)0.115
(2.06)** -
-
-0.274 (-4.78)* -0.0055 (-1.82)***
0.799 (13.92)*
-0.009(-1.50)0.0040 (1.63)***
-
0.029 (2.49)**
-
-
-
-
-
0.188 (4.11)* 0.202
(4.67)* 0.568
(11.7)* 0.175
(3.00)* -
-
-0.079(-1.38)0.241
(4.13)* -0.199
(-2.65)*-
-0.456 (-2.60)**
-
-
-
-
1.168(4.08)*
-
-
-1.808 (-2.66)*
-
1.877 (3.28)* 0.036
(2.32)** 0.276
(4.04)* 0.269
(4.00)* 0.850
(14.1)* 0.144
(1.76)*** -0.207 (-2.54)** -0.159 (-1.90)*** -0.093 (-1.04)
-
-
-0.191 (-2.17)**
-0.022 (-0.43)
-
-
-
-
-
-
-0.0024 (-2.14)**
-
0.0016 (1.61) 0.409
(1.99)**-
0.283(4.90)*0.297
(5.12)*0.851
(14.4)*0.253
(3.37)*-
-0.062(-0.82)-0.176
(-2.34)**-
-
-0.105(-1.32)
Test statistics, n = 72 R2
D-WF-statisticWald(1)Wald(2)Wald(3)LM
0.631.9613.6*4.03**
--
0.35
0.922.1548.6*3.40**5.53*193.8*5.00***
0.842.12
19.6*-
5.38*3.97**6.98**
0.812.0123.1*5.17*3.96***
-1.25

93
Table 19: Dependent Variable: Ratio of Exported Intermediate Products to Value Added
Variable OUTEXVA85 OUTEXVA90 OUTEXVA95 OUTEXVA00
Constant
LABPROD85
LABCOST85
CAPPROD85
LABPROD90
LABCOST90
CAPPROD90
LABPROD95
LABPROD00
LABCOST00
CAPPROD00
MACH
ELMACH
TRANS
BELGIUM
DENMARK
FINLAND
FRANCE
ITALY
NETHERLANDS
PORTUGAL
SPAIN
SWEDEN
UK
-0.118 (-3.97)*-0.0019 (-1.93)***
0.057 (1.68)***-0.005
(-2.35)**0.0015
(1.89)*** 0.175
(1.83)*** 0.011
(2.74)*-
-
-
-
0.086 (5.87)*0.092
(6.49)*0.234
(14.8)* 0.074
(3.58)*0.042
(1.91)***-
0.060 (3.05)*0.031(1.55)0.107
(5.11)*-
-
0.075 (3.57)*
0.068 (3.49)*
-0.007(-0.30)
-
-
-
-0.0031 (-2.10)**
0.201 (3.04)*
-
0.0024 (2.06)**
-
-
-
0.210 (8.44)*0.157
(6.22)*0.449
(17.6)*0.057(1.61)
-
-0.090(-2.67)*
-
-0.040(-1.19)0.057(1.60)-0.064
(-1.69)*** -0.040(-1.14)
-
-0.043(-1.25)
-0.357 (-4.04)*
-
-
-
-
-
-
-0.0012(-1.98)***0.0010(1.80)***1.037
(5.74)*0.029
(3.65)*0.232
(6.43)*0.176
(5.08)*0.670
(20.3)* 0.131
(3.08)*-
-0.078 (-1.82)***
-
-
-
-0.079(-1.83)***-0.114 (-2.57)**
-
-0.119(-2.61)**
-0.261 (-2.88)*
-
-
-
-
-
-
-
-
0.696 (3.66)*0.020
(2.60)** 0.221
(5.67)*0.204
(5.43)*0.631
(17.78)*0.208(4.52)
-
-0.067(-1.44)
-
-
-
-0.044 (-0.94)-0.063(-1.36)
-
-
Test statistics, n = 72 R2
D-WF-statisticWald(1)Wald(2)Wald(3)LM
0.901.9329.9*1.893.84**26.3*5.12***
0.882.1929.6*2.23
-9.26*2.88
0.901.6543.8*2.1813.3*33.0*3.44
0.862.0042.9*
-6.78*13.4*2.60
Also table 19 presents some reasonable findings. It reports the results of thenext estimation that regressed the exported intermediate products on the independent variables. The first meaningful result is that the labor productivity
94
is negatively related to outsourcing in the current period but it is positively related after outsourcing in the next period. Such results can be found in 1985, 1990 and 1995. In combination with the results of the first estimation, this finding supports the theory and provides empirical evidence that the improving labor productivity increases outsourcing. Even if the coefficient of the labor productivity is small it shows the right direction regarding the reactions of the specialized producers. The second result is that the coefficients of the labor costs are positively signed and significant in the current period in 1985, 1990 and 2000 and in the next period in 1985 and 1995. These estimation results were not of the expected direction because we have predicted them to be negatively signed. There can be at least two explanations for such findings. The first is that our sample included only the EU countries and they are mostly high-wage countries compared, for example, to the East Asian or the Eastern European countries. The second can be that the specialized producers, bolstered by higher labor productivity, can pay higher wages. The last result of this estimation is that the coefficients of the capital productivity are positively signed and significant in 1985, 1995 and 2000. However, the size of the coefficient has increased in recent years. This predicts that the magnitude of the capital productivity has increased when the firms make their outsourcing decisions.
The Wald test statistic rejects the hypothesis that the independent variables are insignificant when they are included to the estimation. The LM test rejects the null hypothesis of serial correlation and the model specification was accepted only in first and last column. The misspecification of second column was corrected by using the lagged dependent variables as an explanatory variable as just explained. These results are shown in appendix 4.1. and implies the same than before that those industries who outsource in the past also outsource in the future.
We continued with this approach by estimating the structural change at the industrial level in order to find support for our second hypothesis by testing the relationship between the changes in outsourcing to the changes in productivity and the labor costs. These results are displayed in appendix 4.2 and 4.3. The results of imported intermediate products in appendix 4.2 are less encouraging because the coefficients of the labor productivity, the labor costs and the capital productivity failed to reach the significance in almost each estimation and the results of the industrial and country dummies are mixed. Instead, the estimation results of the exported intermediate products in appendix 4.3 implied more intelligible outcomes. The coefficients of the labor and the capital productivity gave positive and significant signs at least in 1995 even if the labor costs seem to increase in line with the productivity variables.

95
Also in this estimation we are incapable of finding clear guidelines from the results of the industry and country dummies.
Table 20: Dependent Variable: Change in Imported Intermediate Products to Value Added
Variable OUTIMVACH8590 OUTIMVACH9095 OUTIMVACH9500
Constant
LABCOCH8590
CAPRCH8590
CAPRCH9095
LABPRCH9500
LABCOCH9500
TEXT
MACH
ELMACH
TRANS
AUSTRIA
DENMARK
FINLAND
DENMARK
GERMANY
ITALY
NETHERLANDS
PORTUGAL
SWEDEN
UK
0.339 (2.22)**
-
-3.126 (-1.71)***
3.404 (1.86)***
-
-
-
0.500 (2.23)**
0.300(1.33)0.567
(2.37)**0.422(1.39)
-
-
-
-
-0.268(-0.91)-0.510
(-1.69)*** 0.535(1.16)-0.464(-1.51)-0.279(-0.95)
-0.104 (-0.88) 1.825
(1.73)*** 2.246
(1.86)*** -
-2.672 (-1.91)***
1.200(1.21)0.263
(1.95)**0.378
(2.79)*0.476
(3.28)*0.308
(2.24)**-
-
-
0.355 (2.11)** 0.325
(1.91)***0.181(1.08)
-
-
0.289 (1.66)***
0.325 (1.62)***
1.149 (5.97)*
-
-
-
-4.997 (-2.39)**
-3.071 (-1.95)**
-0.912 (-4.09)* -0.860 (-3.83)* -0.686 (-2.99)* -0.769 (-3.45)*
-
-0.366(-1.35)-0.385(-1.32)
-
-
-
-
-0.533 (-1.91)***
-
-
Test statistics, n = 72 R2
D-WF-statisticWald(1)Wald(2)Wald(3)LM
0.260.86
1.87*** -
2.79***-
28.1*
0.341.98
2.25** 3.64***3.47***
1.930.07
0.381.17
4.27*5.73**
-3.79***21.0*
Because the foregoing results were moderate, we continued to test by using the same estimation method but with different data modification. The dataused next was expressed as a ratio relative to the value added as in the estimation results presented in tables 18 and 19. The results of these estimations are shown in table 20, where the dependent variable is the change

96
in the ratio of imported intermediate products to value added and in table 21, where the dependent variable is the change in the ratio of exported intermediate products to value added.
Table 20 shows that in the period of 1985-1990 (OUTIMVACH8590) thecoefficient of the capital productivity is negatively signed and significant in the current period but turns out to be positively signed in the next period. The last estimation results (OUTIMVACH9500) show that the coefficient of labor productivity has the right sign but the coefficient of the labor costs should be positive. This finding might indicate that those firms who import the intermediate products react more sensitively to the changes in the labor productivity than to the changes in the labor costs. In these two estimation, the Wald test statistic rejects the hypothesis that the independent variables are insignificant when they are included to the estimation but the F-statistic is just slightly significant and the positive autocorrelation seems to appear. Moreover the LM test fails to reject the null hypothesis of serial correlation and the model specification was rejected in first and last column. This misspecification cannot be corrected by using the leaded and/or lagged dependent variables as an explanatory variables. These estimations were misspecified but the second column works. Thus, the most engrossing is the period of 1990-1995 (OUTIMVACH9095) because we can use both the leads and lags of the independent variables and the specification was accepted. This estimation shows that the increasing labor costs in the previous period and the expectations about the rising labor costs in the next period as well as the expectation about the deteriorating labor productivity in the next period drive firms to find a partner abroad. The coefficients of these independent variables have a significant and right sign. Instead, we have no explanation why the capital productivity in the previous period is positively related to the dependent variable.

97
Table 21: Dependent Variable: Change in Exported Intermediate Products to Value Added
Variable OUTEXVACH8590 OUTEXVACH9095 OUTEXVACH9500
Constant
LABCOCH8590
CAPRCH8590
LABPRCH9095
CAPRCH9095
LABPRCH9500
LABCOCH9500
CAPRCH9500
FOOD
TEXT
MACH
ELMACH
TRANS
DENMARK
FRANCE
NETHERLANDS
PORTUGAL
UK
1.166 (4.920)*
3.223(1.903)***
4.443(2.730)*-4.778
(-2.256)**2.781
(1.735)***4.593
(2.279)**3.970
(2.729)*-
-2.155(-9.462)*
-0.473(-2.184)**
-0.444(-1.976)***
-0.428(-1.837)***
-0.529(-2.274)**
-
-
-
-
-0.770(-2.806)*
0.301(5.238)
-
-
-
-
-
-
1.471(1.688)***
-
-
-
-
0.179(1.517)0.355
(2.088)**-0.406
(-2.467)**-0.522
(-3.226)*-0.444
(-2.716)*-
0.900(5.818)*
-
-
-
-
-
-2.435(-1.505)
-
-
-0.997(-3.967)*
-0.941(-3.712)*
-0.855(-3.331)*
-0.847(-3.369)*
-0.408(-1.344)
-
-
-
-
Test statistics, n=72R2
D-WF-statisticWald(1)Wald(2)Wald(3)LM
0.742.0113.7*3.94**4.45**4.57**3.74
0.302.174.77*
-2.85***
-0.63
0.310.754.91*
--
2.2730.3*

98
Table 21 shows, in the first column, that the increase in the labor productivity in the future periods and the increase in the capital productivity in the current and next period is related to the increasing exported intermediate products, which supports our predictions. Instead the coefficient of LAPRCH9095 has wrong sign and the coefficient of the labor costs is different sign than expected. Moreover, the results of the next two estimations are less encouraging. In the next column (OUTEXVACH9095), only the coefficient of the capital productivity is significant. In the last column (OUTEXVACH9500), the coefficient of the labor costs has the right sign but it fell short of statistical significance and the LM test statistic shows the misspecification of the model. As found from the previous estimations, it is difficult to find exact guidelines from the industry or country dummies.
The next step was to estimate the effects of productivity, labor costs and the dummy variables with the FDI inflows and outflows. In table 22, we present the results from regressing the average FDI outflows and inflows on these independent variables. The coefficients of LABPROD indicate that low labor productivity decreases the FDI outflows and in contrast the improving labor productivity in the next period increases the FDI inflows. In this estimation, the coefficients of LABCOST and CAPPROD were more modestly related to the dependent variable. The labor costs are negatively related to the FDI inflows but the relationship was coincidental and it failed to reach a level of significance with respect to the FDI outflows. This might make sense, i.e. that inflows are more sensitive to the labor costs than outflows. The capital productivity was only associated with the FDI inflows in the period of 1996-1999 and the relationship was positive in the current period but it turns out to be negative in the next period. This result means that the increasing capital productivity in the current period might increase the FDI inflows but afterward such a relationship is negative. Finally, the country dummies with FDI data show more clearly ‘the big country effect’ than with outsourcing data. The big EU countries – France, Germany and the UK – are more active in both the FDI inflows and outflows than the small EU countries. The coefficient and specification tests imply as follows. The Wald test statistic rejects the hypothesis that the independent variables are insignificant except in second and third column. The low significance of the coefficients can be found also by the t-test. The LM test rejects the null hypothesis of serial correlation and the model specification was accepted except in first column.
Table 23 summarizes the effects of the ratio of FDI outflows and inflows to value added and the independent variables. Again the FDI inflows give better results than the FDI outflows. These estimations indicate, as found in the previous results, that the improvement of the labor productivity might direct the FDI inflows. The decreasing labor productivity attracts the FDI inflows

99
and the relationship turns out to be positive in the future. This might imply that the expectations of the improving labor productivity increase the FDI inflows. The explanation for the increasing FDI inflows might derive also from the decreasing labor costs. At least in the period 1996-1999, the negative relationship between the last period’s labor costs and the FDI inflows is robust. The capital productivity has a significant and negative relationship with the FDI inflows only in the end of 1990s. In other words, the FDI is directed to the countries where the capital productivity is low. This might make sense if the firms invest to the countries where the current capital productivity is low but the expectations of the future capital productivity are high. The country dummies indicate that the small EU countries are more sensitive to invest when the FDI is taken into consideration as a proportion of value added. The Wald test statistic indicates the insignificance of the capital productivity coefficient in second column and the joint insignificance of the labor market coefficient in third column. The LM test rejects the null hypothesis of serial correlation and the model specification was accepted.

100
Table 22: Dependent Variable: Average of FDI Outflows and Inflows
Variable FDIOAV9295 FDIOAV9699 FDIIAV9295 FDIIAV9699
Constant
LABPROD90
CAPPROD90
LABPROD95
LABCOST95
CAPPROD95
LABPROD00
LABCOST00
CAPPROD00
FOOD
TEXT
MACH
ELMACH
TRANS
DENMARK
FINLAND
FRANCE
GERMANY
NETHERLANDS
PORTUGAL
SPAIN
SWEDEN
UK
8.00(0.17)6.00
(3.70)*-
-
-
-
-3.16 (-2.92)*
-
-
140.00(1.94)***-82.91(-1.13)
-
115.95(1.58)***-
-
-
-
235.68 (2.52)**
240.39 (2.15)**
428.92(4.07)*
-
-
159.31(1.69)***235.92 (2.51)**
-247.93(-0.54)
-
-
35.91 (3.94)*
-
-
-27.28 (-3.49)*
-
62.75(1.16)
-
-692.33 (-1.64)***-
-
-
-
-
-
-
2134.49(3.26)*1897.91(3.18)*
-
-
-
1014.24(1.79)***
327.43(4.36)*-1.22
(-1.69)***-
-
-574.84(-3.29)*
-
0.69(1.41)
-
-26.20(-3.93)*
-
-72.71 (-1.97)***
-
71.83(1.88)***
-
-
-
210.73(4.37)*
-
-
-
255.12(5.18)*117.86
(2.45)**305.87
(6.19)*
838.09 (1.80)**’-24.39
(-6.77)*-37.88 (-1.28)
-
-
131.73(2.72)*14.85
(6.34)*-1614.21 (-1.68)***-160.82
(-3.21)*-
-
383.19 (1.98)**’297.84(1.58)433.02 (2.31)**-399.52(-1.32)-234.06(-0.97)550.17(1.97)***
-
-
-425.27 (-1.71)***
-
-
691.10(2.81)*
Test statistics R2
D-WF-statisticWald(1)Wald(2)Wald(3)LM
0.492.345.90*9.35*
--
5.49***
0.472.19
8.22*8.91*1.34
-1.21
0.592.138.73*1.7715.4*10.8*0.53
0.561.915.23*22.6*4.60*3.61***1.21

101
Table 23: Dependent Variable: Ratio of FDI Outflows and Inflows to Value Added
Variable FDIOVA9295 FDIOVA9699 FDIIVA9295 FDIIVA9699
Constant
LABPROD95
LABCOST95
LABPROD00
CAPPROD00
FOOD
TEXT
TRANS
BELGIUM
DENMARK
FINLAND
NETHERLANDS
PORTUGAL
SPAIN
SWEDEN
UK
0.012 (2.29)**
-
-0.025(-1.10)
-
-
0.013 (2.04)** -0.014
(-2.11)**-
0.015 (1.70)*** 0.018
(1.98)*** 0.033
(3.75)* 0.037
(4.22)* -
-
0.034 (3.73)*
-
0.016(1.61)
0.00025 (1.97)***
-
-
-
0.042 (2.11)**
-
-
-
-
-
0.081 (3.05)*
-
-
0.035(1.33)
-
0.002(0.41)
-0.00027 (-1.91)***
-
0.00022 (1.77)***
-
-
-
0.025 (3.40)*
-
0.024 (2.45)**
-
-
0.022 (2.20)**
0.028 (2.85)* 0.032
(3.35)* -
0.066(2.35)**-0.00068 (-2.37)**
-0.145 (-2.36)** 0.00058(2.34)**-0.005
(-2.21)** -
-
-
-
0.043 (2.42)**
0.041 (2.34)**
0.048 (2.47)**
-
-
0.056 (3.13)* 0.041
(2.28)* Test statistics, n=72
R2
D-WF-statisticWald(1)Wald(2)Wald(3)LM
0.432.06
6.00*--
1.211.30
0.212.16
4.48*3.89**
--
1.45
0.361.63
5.12*1.73
--
4.09
0.402.00
4.53*2.80***4.88**5.59**0.10
To examine how the movements of the independent variables might affect the direction of the FDI flows, we estimated the last regression as displayed intable 24. The dependent variable is determined as the change of the FDI flows between the periods of 1992-1995 and 1996-1999. Contrary to expectations, these estimations show that the decreasing labor costs increase the FDI outflows. This seems absurd because it should decrease the outflows. When considering the change in the FDI inflows, the sign is right but the coefficient has no significance. The change in the capital productivity seems to relate also negatively to the change in the FDI outflows. This seems reasonable because an increase in capital productivity keeps the investments in the home country. Finally, the change in the labor productivity is only significant with the change in the FDI inflows. This indicates, as expected, that the increasing labor productivity increases the FDI inflows. The Wald test rejects the null

102
hypothesis when considering the significance of the labor productivity in first column and when considering the significance of the capital productivity and labor costs in the second column. The LM test accepts the specification of both models.
Table 24: Dependent Variable: Change in FDI Outflows and Inflows to Value Added
Variable FDIOVACH FDIIVACH
Constant
LABCOCH9095
CAPRCH9095
LABPRCH9500
LABCOCH9500
CAPRCH9500
ELMACH
FINLAND
GERMANY
SPAIN
0.135(0.44)-7.532
(-2.29)** -8.156
(-2.54)** 5.306(1.37)-4.679(-1.37)-8.701
(-1.97)***-1.245
(-3.48)* -
1.519(2.78)*1.443
(2.81)*
-0.932(-2.73)*-3.590(-1.10)-4.286(-1.33)17.533 (4.14)*
-
-4.953(-1.35)-0.519(-1.33)1.279
(2.41)** 0.710(1.23)
-
Test statisticsR2
D-WF-statisticWald(1)Wald(2)Wald(3)LM
0.352.39
4.31*1.883.50*2.70***3.40
0.251.98
2.97*17.1*1.201.340.03
Finally, the results of outsourcing were compared with the results of the FDI flows. We predicted in our hypotheses that the outsourcing firms are moresensitive to the adjustments of the labor costs than the vertically integrated firms because these adjustments change their customization costs. Moreover,the outsourcing firms are expected to be more productive because they are more specialized and they have to carry off the conflicts in contracting. The first comparison can be made between tables 18, 19 and table 23 because these results are estimated by using the same methods. We should be careful what tocompare because we will consider those industries that import intermediate products to the FDI outflows and vice versa. By comparing OUTIMVA00 and FDIOVA9699 it seems that the outsourcing firms react more to the changes in the labor productivity than the vertically integrated firms but between OUTIMVA95 and FDIOVA9295 the results are not statistically significant. Also,
103
when comparing the capital productivity the outsourcing industries seem to be more reactive than the vertically integrated firms. Moreover, the clearest distinction can be found from the labor costs where the coefficients are bigger and more significant in the outsourcing estimations. The comparison of the exported intermediate products with the FDI inflows (OUTEXVA00 vs. FDIIVA9699, OUTEXVA95 vs. FDIIVA9295) indicates that the labor productivity is a more important determinant of outsourcing than of the FDI inflows in the early 1990s (OUTEXVA95 vs. FDIIVA9295) because the coefficients are bigger and more significant. However, the outcome is the opposite in the end of the 1990s (OUTEXVA00 vs. FDIIVA9699). Again, the coefficients of the capital productivity and the labor costs give more supporting outcomes to the outsourcing in both estimations.
Next we compared the results of tables 20, 21 and 24 to explain how the changes in the independent variables move the direction of outsourcing and the FDI flows. The first comparison included the pairs OUTIMVACH9095 vs. FDIOVACH and OUTIMVACH9500 vs. FDIOVACH. In the former comparison, we found that the imported intermediate production is more sensitive to the labor productivity but less sensitive to the labor costs and capital productivity than the FDI outflows. The productivity signs are as expected but the labor costs seem to indicate the opposite direction. The latter comparison supports the recent results but the coefficients of the labor costs are almost the same in both estimations, which is more consistent with our hypothesis. Finally, when comparing the estimations of the exported intermediate products and the FDI inflows, the results are more inconclusive. Labor productivity gives sensible results only for FDI inflows.
In final estimations we were curious to correct serial correlation in outsourcing estimations (dependent variable: OUTIMVA95) and find out results where the lagged dependent variable is one of the explanatory variables. Appendix 4.4. displays these results. The clear result is that the previous outsourcing and FDI behavior explains such tendency in the future. Even if these results give high significance to the lagged dependent variable, F-statistic and t-values were correct and the model passed the coefficient and significance tests, however, the logic and significance of other explanatory variables was more moderate than found from the previous estimations. Therefore we dismissed to use such model specification in all estimations.
4.4 Summary
This chapter has presented the empirical support for the theory of Grossman and Helpman (2002c). The goal of the chapter was to estimate the influence of

104
the organization modes versus the differences on productivity and labor costs across the European Union countries between 1985-2000. Our analysis leads to several findings. The first finding is that the final producers react to the deteriorating labor productivity in the previous period by importing the intermediate products, which improves the labor productivity in the current period. Correspondingly, for those final producers who export the intermediate products the labor productivity improves in the next period.
The second finding relates to the analysis that investigated how the changes in the productivity and the labor costs might affect outsourcing. When considering the imported intermediate products, it seems that the increasing labor costs in the previous period and the expectations about the rising labor costs in the next period as well as the expectation about the deteriorating labor productivity in the next period drive producers to find a partner abroad. However, those producers who import intermediate products react more sensitively to the changes in the labor productivity than the changes in the labor costs.
The third finding is based on the analysis of the FDI versus the productivity and the labor costs variables. This analysis leads to the conclusion that the FDI outflows increase when the labor productivity decreases while in contrast the FDI inflows increase when the labor productivity is increasing in the next period. When the FDI were expressed as a proportion of value added, the estimations indicate that the expectations of the improving labor productivity and the decreasing labor costs increase the FDI inflows. We also found that the FDI inflows are more sensitive to the labor costs than the FDI outflows. Moreover, the FDI tends to be directed to the countries where the capital productivity is low. When considering how the change in our independent variables affects to the FDI, we found that the increase in the labor productivity should increase the FDI inflows and the increase in capital productivity keeps the investments in the home country.
The industrial dummies indicate that the industries most likely to outsource are the machinery, electrical machinery and transport industries. The country dummies show more clearly ‘the big country effect’ with the FDI than with the outsourcing data. The big EU countries – France, Germany and the UK – are more active in both FDI inflows and outflows than the small EU countries.
In conclusion, these results support the theory and provide the empirical evidence that the specialized producers are more productive than the vertically integrated producers but not in all cases. The labor and capital productivity relates more clearly to outsourcing than to the FDI. Also the adjustments of the labor costs seem to explain better the changes in outsourcing than the FDI.

105
5 EU OUTSOURCING TO THE EAST, GOVERNANCE AND INNOVATION SYSTEMS IN THE BALTIC COUNTRIES – A THREE-STAGE APPROACH
5.1 Introduction
This chapter is intended to answer the question how several improvements in the institutional structure at the transition period in the Baltic countries promote industrial co-operation (outsourcing, FDI) and economic growth?
When we got acquainted with the transition literature in the Baltic countries we found that this literature is mostly concentrated on macroeconomic stabilization, privatization and main institutional arrangements or only financial governance called corporate governance. We found out that there is a lack of research about emerging innovations in transition and the upcoming EU-Baltic innovation system. Also the current literature neglects to separate principal and managerial incentives in transition circumstances. Therefore we claim that the current understanding about corporate governance is too narrow. We emphasize that the financial governance leans on the principal’s incentives, and governance in production and innovation respectively managerial incentives, and such incentives are formed not only inside in firms but also through institutional arrangements exerted by the national innovation systems.
That is why this chapter aims to find answers to several questions: i) todemonstrate the role of privatization and financial governance to the principal incentives and innovative activity; ii) to provide an institutional system framework for the governance in production, EU-Baltic industrial integration, and managerial incentives; iii) to investigate a resource capability framework and organizational structure for the governance of innovation and managerial incentives. The research method used in this chapter is comparable and it applies corporate governance, innovation and institutional theory to the Baltic examples. The chapter is separated into three stages. It seems that the aim of stage I was to minimize risks (macroeconomic stabilization, privatization & financial governance), while the aim of stages II and III has been to maximize benefits (governance in production, governance for innovation, EU-Baltic innovation system, EU programs).

106
5.2 Overview of Baltic Industrial Base and Analysis of Outsourcing and FDI in 1990-2000
5.2.1 Industrial Integration, EU-Baltic Outsourcing and FDI
Before exploring the future prospects of the Baltic manufacturing industry in great depth we will briefly describe the background of developments during and after the transition period in the 1990s.
After the centrally planned period, industrial production was of key importance in the Baltic countries, accounting for around two thirds of the GDP and total employment. However, the composition of the Baltic industrial sectors seemed both typical and atypical for the centrally planned economy. The typical part was that the industries were based on natural resources such the food industry, or intermediate capital-intensive and labor-intensive metal industry and the highly labor-intensive textile industries. Also, energy production was in a crucial position for example in Estonia. The atypical part was that the highly human capital-intensive electronics sector played a significant role in the Baltic countries.
During the transition period, the collapse of industrial production was estimated to be on magnitude of 60 per cent in the food processing, machinery and consumer products industries. The decrease was less dramatic in metallurgy because the Baltic metallurgy products fared well in price competition and the exports to the Western markets in such basic products remained low. The decrease of the industrial production slowed down by 1994 and the manufacturing sector began to recover in 1995. By 1997, the high or average labor-intensive industries had bolstered their positions: after the transition period the food processing, textiles and metal industries including electronics appeared to be turning into the biggest industrial sectors in the Baltic countries.
The collapse of the Estonian manufacturing industry was dramatic during 1991-1994, and the growth in production volumes slowed down particularly in their core industries: electronics, metal industry, pulp and paper industries. After the collapse, the Estonian wood processing industry continued to produce mainly sawn wood and board products but also wood products (wooden doors, windows, houses) and specialized skills were found in furniture manufacturing. The forest industry consisted of four paper and pulp factories located in Kehra, Tallinn, Kohila and Räinä, but these were pressured to close down for environmental reasons before 1994. The metal industry was spearheaded by the average capital-intensive and labor-intensive machinery sector, but also the high human capital-intensive transport equipment industry had a focal role. Industrial production recovered after 1995 and by 1997 the

107
main survivors included the chemical, wood processing and textile industries as well as the emerging information technology industry. At present, the international advantage of the wood industry is based on hand-made furniture and shows increasing demand, at least in Finland. The high R&D levels are not an answer in each industrial sector but instead the learning by doing approach can lead to enhanced competitiveness in the EU markets. The competitive advantage for the Estonian furniture industry can be found from the example of Italy, as Porter (1998) puts it, because the Italian furniture industry has found its innovativeness from modern design, flexible technology and learning by doing.
By the end of 1990s, the Estonian industry had three success stories: food processing, textiles and electronics. Food processing contained an important part through the planned product chain and it continued to produce meat and meat products, milk and milk products as well as soft drinks mostly for the domestic demand but also for foreign markets. Moreover, the textile industry started to attract foreign direct investments because of the low labor costs and skills related to hand-made products. The survival of the electronics and its reorientation to the IT sector had its roots in the large-scale electronics companies from the centrally planned period. Conceivably, the human capital-intensive electronics industry contains the clearest opportunities for industrial integration with the EU companies.
Latvia’s success in competition and reorientation to the international markets rested mainly on the human capital-intensive electronics but also on the capital-intensive and labor-intensive industries such as in the food processing, machinery and wood industries. The machinery sector produced diesel engines, vehicles as small buses, trams and electric trains. Furthermore, the Latvian industry produced machines for agriculture, the steel industry and railway reconstruction workshops. The Latvian wood processing sector included the sawn wood and board industry, in which the pulp and paper industry showed moderate growth. The possibilities for the higher quality seemed realistic because Latvian forest resources were extensive. This augmented the export potential of the furniture industry, and facilitated a more modern sawn wood and pulp industry because of its sound influence on employment and low intensiveness in energy (Van Arkadie – Karlsson 1992, Hyvärinen – Hernesniemi 1995).
In the beginning of the 1990s, industrial production generated half of Lithuania’s total GDP and therefore it had a slightly smaller role than in other Baltic countries. Moreover Lithuania had the lowest industrial capacity and it leaned on the natural resource-based industries such as the food processing industry because the country boasted a large raw material base and enjoyed access to enormous markets located in the CIS countries. The share of food

108
processing remained significant also after the transition period and 30 per cent of the industrial production consisted of the food and soft drinks. While the heterogeneous transportation services sector continued to play a significant role, the Lithuanian share of the chemical industry within total industrial output remained extensive also after the transition period. The metal industry was estimated to be one of the future cornerstones because it had specialized toward the electronics industry and machinery in the centrally planned period (Hernesniemi - Hyvärinen 1995). In spite of such estimates, the development of the metal industry has remained more moderate than expected and its share of the total industrial production has decreased sufficiently during the transition period.
Outsourcing to Baltic Countries
The exports of intermediate products from the new applicant countries to the EU have almost tripled from 3.1 billion EUR in 1995 to 12.5 billion EUR in 2000. As displayed in appendixes 5.1 and 5.2, the leading three Visegrad countries (Czech Republic, Hungary, Poland) provide the largest trade sharesof intermediate and final products in manufacturing. In 2000, almost 10 percent of the intermediate imports to the EU flowed from these countries to the EU while the Baltic countries achieved only a half percent share of the EUtotal imports in intermediate products. In addition, the EU is a net exporter because their intermediate exports exceeded the intermediate imports from the new applicant countries almost by 5.4 billion EUR in 2000.
Table 25: Share of CEE Exports to EU in Intermediate Products, %
1995 Finland Austria Italy Germany SwedenCzech Republic 0,00 0,06 0,03 0,79 0,01Estonia 0,70 0,00 0,00 0,05 0,22Hungary 0,00 0,21 0,04 0,58 0,01Lithuania 0,07 0,00 0,00 0,59 0,06Latvia 0,05 0,00 0,00 0,85 0,04Poland 0,01 0,03 0,05 0,66 0,07
2000 Finland Austria Italy Germany SwedenCzech Republic 0,00 0,08 0,02 0,66 0,01Estonia 0,57 0,00 0,00 0,10 0,31Hungary 0,00 0,11 0,04 0,63 0,01Lithuania 0,07 0,00 0,01 0,54 0,12Latvia 0,22 0,00 0,00 0,36 0,17Poland 0,01 0,03 0,11 0,53 0,05
Source: COMTRADE
When considering industrial outsourcing in general, the neighboring effectseems significant. The German industry has formed strong linkages to the Czech Republic, Hungary and Poland. Austria has outsourced especially to the

109
Czech Republic and Hungary, and Finland and Sweden to the Baltic countries. The study of Marin and Lorentowicz (2002) investigates that especially lower wages have been a driving force when German firms have been outsourcing to the Eastern Europe. Table 25 shows that the Estonian industry had its strongest outsourcing linkages with Finland in 1995. Between 1995-2000, the role of Finnish industry has slightly decreased and instead the linkages to Sweden and Germany have strengthened. As found from these figures, the Estonian main outsourcing industries are telecommunications, transport and machinery.
More than two-thirds of the Estonian intermediate exports to Finland consist of telecommunications equipment parts. Other Estonian parts and components exported to Finland include machinery: parts of lifting and loading machines, rotating electric motors, switchgear, and paper mill and paper making machinery.
Lithuanian industrial linkages are mostly connected to Germany but outsourcing activity especially with the Swedish industry has increased since 1995. Latvian industry has lost its position in Germany but increased its industrial integration with Sweden and Finland. German outsourcing to Lithuania and Latvia is concentrated on electronics because Lithuania’s main intermediate exports to Germany consist of telecommunications equipment parts, but also inputs for machinery such as parts of carriages and cycles from Lithuania, and parts of cultivating equipment as well as parts of harvesting machinery from Latvia have an essential role. Moreover, Swedish outsourcing to Lithuania includes intermediate products for transport and electronic machinery: parts of switchgear, parts of office and adding machinery and parts of aircraft and helicopters are the main exported inputs from Lithuania to Sweden. Latvian exports of intermediate products to Sweden consist the parts of switchgear, cultivating equipment, motor vehicles and accessories, and lifting and loading machines. Finland is the second largest intermediate importer from Latvia after Germany. The main products are parts of switchgear (64 % of imports), office and adding machinery, motor vehicles and accessories as well as telecommunications equipment.
The outsourcing success of the Baltic telecommunication industry rests firmly on the significant role of the Baltic electronics industry during the centrally planned period. In Estonia, the electronics products were geard toward military equipment and various other kinds of machinery as well as for intermediate products in the fuel industry. The metal industry consisted of large-scale manufacturers such as Dvigatel, Tondi Elektroniika, Elektrotehnika and Volta. They produced nuclear plants and parts for space ships (Dvigatel), vintergarted circuits and medical hearing aids (Tondi), transformers (Elektrotehnika), electric motors and electric radiators (Volta).

110
These engineering and electronics firms were discovered as flagships in the centrally planned period by including the skilled human capital-intensive and labor-intensive resources, and with the low labor costs they fostered the possibilities of exporting high-quality intermediate products to the high-wage countries. For this reason, they are destined to play a key role in the Estonian industrial policy. In Latvia, the high human capital-intensive electrical industry played a significant role and also as a regional center because the large-scale electronics firms employing more than 5000 person such as VEF, RAR (Rigas autoelekroaparatu rupnica) and RER (Rigas elektromasinbuves rupnica) located near Riga. They manufactured telecommunication products; electronic parts are for the automotive industry and electronic parts for trains. Furthermore, firms producing consumer electronics, computers and military electronics were also located near Riga. Therefore, Riga and its neighboring area have fulfilled their high potential by developing into a regionally strong and internationally competitive electronics cluster.
In sum, the Baltic industrial basis as well as its success in competition and reorientation to the international markets leans largely on the high human capital-intensive electrical and information technology industry or transport equipment and average capital- and labor-intensive sectors such as the metal industry and the high labor-intensive textile and furniture industries. The industries based on natural resources such as the food industry and wood processing mainly had a domestic role.
Behavior of FDI Stock and Inflows
To conclude this section, we briefly compare the role of FDI inflows in the CEE and the Baltic countries. As found from EBRD (2000), the Visegrad countries collected most of the FDI inflows directed to the CEE and Baltic countries. The difference was influenced by the direction of the big investor countries – the United States and Germany – whose firms were seeking the joint ventures from the thicker CEE markets. During the 1990s, the FDI have been mainly directed towards the Czech Republic, Hungary and Poland, which have received two thirds of all CEE and Baltic country FDI. By comparing absolute net statistics, we find that the amount of the FDI was growing in the early 1990s especially in Hungary but slowed down in the mid-1990s when the Czech Republic and Poland took the leading role.
When considering the industrial FDI to the Visegrad countries, mostly these FDI belonged to the operations of the multinational companies (MNE), and the strategies of the MNEs such as Nestle and Phillip Morris undoubtedly utilized the internalization advantage to expand their activities in the CEE markets, because in consumer goods it was more advantageous to produce near to consumers than export these products from the Western markets. The

111
electronics companies such as General Electric and automotive industrial companies (Volkswagen-Audi, Suzuki Motor Co., General Motors) had a traditional production idea of the vertical multinationals and intermediates (Zhang – Markusen, 1999), and their eagerness to invest in CEE countries was dependent on the advantageous availability of local skilled labor and lower production costs. Their behavior seems plainly to follow two foreign investment advantages examined by Markusen (1995): an ownership advantage, in which these firms redeemed the production processes and therefore retarded the access of other firms; and a location advantage because it was more profitable to produce in the CEE countries than in Western countries. Moreover, Marin and Lorentowich (2002) show in their empirical analysis that the host country in the Eastern Europe benefit from the German FDI because most innovative and dynamic firms are able to look for the new markets from the Eastern Europe. These firms are also the most active in corporate governance but they avoid to bring most advanced technology to the target country.
The infrastructure investments to telecommunications or transport utilities (Amertech, Deutsche Bundespost Telecom, US West International, CGE Telecom Division, UTS, Nokia) followed the investment strategies of the location advantage but also the horizontal multinationals contexts by Markusen – Venables (2000) because the integration to the CEE telecommunication networks seemed to lead to the higher firm-level scale economies.
Similarly, the Baltic countries started to reap the fruits of the transition period when the FDI inflows begun to grow steadily, even if at a slower rate than in the other CEE countries (EBRD 2000). However, in Estonia both the FDI inflows per capita and the ratio of FDI to GDP are among the region’s highest. Based on the UNCTAD (2003) statistics, Estonia’s inward FDI stock has doubled in 1998-2001, reaching 4.1 billion EUR in 2001. The FDI inflows have been channeled from Finland and Sweden mostly to the finance, trade, transport and telecommunications sectors but also to labor-intensive manufacturing sectors such as the textiles, wood and food industries. The FDI inflows to Latvia had a increasing trend from 1990 to 2000 but a slump in 2001, and an inward stock totaling 2.6 billion EUR has accumulated. The FDI has been directed to trade, finance and business activities but also to the energy sector, especially to gas, from the United States, Germany and Denmark. In Lithuania, the FDI inflows have grown appreciably during the 1990s and reached a stock valued as 3 billion EUR in 2001. The FDI stock is mainly directed toward trade, telecommunications and financial intermediation, and when considering the industrial sectors, the main targets

112
are the fuel and chemical industry. The main FDI partners come from Denmark, Sweden and Estonia.
5.3 Industrial Reorganization and institutional evaluation in Baltic Countries – A Three-Stage Approach
The objective of this section is to explain the industrial reconstruction of the Baltic countries as a three-stage approach focusing on the objectives of the privatization and macroeconomic stabilization as well as to the functioning interrelation of restructured firms and innovation in the EU-Baltic system after EU enlargement to the East. Stage I describes firstly the process of privatization mainly in Estonia, Latvia and Lithuania but also in comparison with Poland, Hungary and Czech Republic in the early 1990s. It covers both the Baltic and Visegrad countries because they acted as a bellwether with their broader experience in the privatization process already in the 1980s. In the end of the stage I, we emphasize the relation between financial governance and innovation activity. Stage II analyzes the industrial reorganization and institutional structure, that is, the role of government as well the leading mechanisms of governance structures in production as found from Grossman – Helpman (2002b) – especially the significance of the outsourcing costs and the quality of the legal system. Stage III finally investigates how the resource capabilities might be in a key position in order to form the governance for innovation between firms themselves. The purpose of the last stage is therefore to explore human capital and R&D in the innovation system from the perspective of the industrial integration between the EU and Baltic firms.
5.4 Stage I: Macroeconomic Stabilization, Privatization and Financial Governance
5.4.1 Macroeconomic Stabilization during Transition Period
The traditional studies of transition economies typically emphasize that the stabilization of the macroeconomic environment can play a key role in solving many of the problems in the production sector. In other words, the best way to achieve a sound macroeconomic environment is to stabilize the prices and exchange rate fluctuations in order to guarantee conditions for transition firms that are equal to those found in the Western countries. The analysis of such a concept as the “first step” during the transformation process can be found from several studies (see, for example, Lipton and Sachs 1990, Blanchard 1991)

113
that the stable macroeconomic environment acted as the basic factor before the structural reorganization in production. For example, Lipton and Sachs (1990) maintained that “a working price system cannot be put in place without ending excess demand and creating a convertible currency; and a credit squeeze and tight macroeconomic policy cannot be sustained unless prices are realistic, so that there is a rational basis for deciding which firms should be allowed to close.” Such a citation described conclusively the guidelines for discussion by the western economists about the transition paradigm in the early 1990s. Therefore, one can see the main message: the first step was to stabilize the macroeconomic environment but after this was done, more attention should be paid on the modes of industrial organization than only to the macroeconomic policy itself.
When the Baltic countries received their re-independence in the early 1990s, one can mention that their economic situation differed from other CEE transition countries such as Poland, Czech Republic and Hungary. The reason for such a difference stems from the fact that the economic coordination and vertically integrated industrial links stayed immutable to the end of the centrally planned system. To be precise, 90 per cent of the Baltic industry was commanded by the ministries of the centrally planned system. Furthermore, their industrial competitiveness was estimated to be weaker than in these CEE countries, but better than for example in Bulgaria, Romania or the CIS countries. As a result, the collapse of the centrally planned system turned out more dramatic and induced a deeper demand, production and input crisis in the Baltic countries, but they managed to avoid a complete disaster.
As a result of this collapse, the shortage of the inputs weakened the Baltic industrial production already in the centrally planned period but the ultimate collapse triggered a sharp rise in the costs and prices in the industrial sector. The concrete act from the government was the first price reform in the years 1990-1991 and 1992, which raised the consumer and producer prices emersely. Finally, the collapse of trade with other CEE countries and CIS countries was the final straw forcing the Baltic countries to transform their vertical and narrow production structure and redirect their trade to the new export markets. Since 1994, the Baltic countries overcame the three-year transition period and stabilized their macroeconomic environment (BOFIT 2002). In sum, Estonia, Latvia and Lithuania followed a stringent macroeconomic policy which has led to low inflation, stopped their output from falling and redirected it to a growth path, as well as stabilized their new currencies.
114
5.4.2 Privatization and Incentives for Innovation
Next, we briefly present the general features of the Baltic privatization programs. Because the privatization programs have been already extensively discussed we only review the main foundations and compare them to the Baltic circumstances. The arguments for the rapid privatization in the transition period were supported by several studies, for example, Borenstein – Kumar (1990), Frydman – Rapaczynski (1990), Lipton – Sachs (1990), Blanchard (1991) and Grosfeld (1994). These economists built up several privatization models and classified them as small-scale and large-scale privatization. The small-scale privatization included shops, cafes etc. and these above-mentioned studies put pressure to accomplish this procedure with direct sales, probably guaranteed by the state. In contrast, the large-scale privatization was found to be in a key and therefore sensitive position as regards the future success of the industrial base. The large-scale firms were advised to move out from under the state control and then to create a market-based governance system inside the firm.
As highlighted also in other transition countries, the purpose of the privatization in the Baltic countries was to give the tools for the reorganization of the industrial structure. Especially in this concept, the large size of the industrial firms compared to their size of the economy constituted high risks for the stability of the economy. The starting point was to split up the state monopolies and strengthen the flexibility, competitiveness and innovativeness of the emerging SME industry. After this process was successfully finished, the shares should be dealt optimally to the specific interest groups. Since the process was unique, the distinctive exceptions can be based on the previous experiences of the market-economy privatization programs. Several deviate objectives for the privatization in the Baltic countries can be found where the first three were common also in other CEE countries but the last two seem more crucial for the Baltic countries:
The first main objective, as found from other CEE countries during the transition period, was that such a process should form high-powered incentives for the principals and thereby they should stimulate managers by pushing firms first to compete in the domestic markets but, because the domestic demand was modest, also to enter later the more competitive EU markets. In other words, the privatization gave alternatives to decide how such an industrial structure with low-powered incentives should be liquidated and then reorganized in a more innovative fashion in the hands of the new interest groups. Concerning this issue and comparing the deepness and scale of the privatization between the market-based and Baltic countries, as Vickers and Yarrow (1991) put it, the distinctions seemed rather clear. First, a clear

115
difference can be detected regarding the number of firms which competed in the international markets. The success in innovations seemed to be an enigma of the survival of these firms and at least partially it was unclear. Also the restructuring projects were troublesome to carry out without market-based oriented managerial skills because of the old-fashioned and heavy industrial structure. Second, another difference can be found by comparing the privatization of the state monopolies. Almost all Baltic firms belonged to this group, while in the market economies it consisted of some sectors such as energy, public transport or telecommunications. The concern for this issue was that the property just moved from “the left-side pocket to the right-side pocket” by increasing the crossholdings and power coalitions between former owners without any new innovative activity.
The second main objective was the continuation of the first. This objective of the privatization process itself was to create the market-based governance structure for the privatized Baltic firms. It included both the internal governance system of the firms and external governance of financial institutions.
The third main objective, also familiar to other CEE countries, was the separation of business and politics to remove or at least restrict the political decision-making inside the firm and was called the “depolitisation” of the economic environment. According to Frydman and Rapaczynski (1993), one of the main objectives in the CEE programs was to distinguish the political and economical decision-making by separating the economically significant business sector from the state. The ownership issue itself seemed to be a multifaceted political question and the depolitisation became sensitive project to carry out because of the conflicts with the several interest groups. Moreover, the investigations including the background and incentives of the several owners as well as the structure of the ownership collusions that might occur after these economic reforms were deemed fruitful.
The next two main objectives were more familiar to the Baltic countries than other CEE countries. The fourth objective was that, after returning to the market environment, for an operation to split up the large-scale vertical structure to a smaller one, the resulting more flexible firms had to achieve higher success in innovations. The goal of such a procedure was to increase the innovativeness of the industrial sector. Several theoretical papers such as Holmström (1989) and Teece (1996) support such a procedure by claiming that an increase in firm size lowers at least product R&D. Holmström (1989) emphasizes that the small-scale firms act more innovatively than large firms because of the lower agency costs in the innovation process, and Teece (1996) maintains that principal-agent distortions in large-scale firms might impair innovation because agents trade-off the performance of the firm for their own

116
welfare. Such a procedure found support already earlier by several empirical studies such as Mansfield (1981), Link (1982) and Scherer (1991). According to Mansfield (1981), within industries, the process and product R&D increases less than firm size. Scherer (1991) shows that process R&D increases relative to product R&D as the firm size increases, and Link (1982) stresses that the share of R&D dedicated to process innovation increases with the market concentration among most R&D industries.
The last objective was clearly a practical problem. The Baltic countries lacked the financial resources to follow successfully through on such privatization programs. Impaired by the several exchange rate and price reforms after the centrally planned period, domestic savings remained at an insufficiently low rate in order for the public to invest in company shares, and in addition, foreign direct investments were unable to fill the gap required (UN 1999).
Privatization Methods – Visegrad vs. Baltic Countries
The first step in the process was to choose an appropriate privatization method. According to Sadowski (1992), the privatization process can be separated into: (i) returning the ownership rights to their previous owners; (ii)Selling the enterprise or some of its parts to the private owners; (iii) Selling the whole stock of shares or some parts of them; (iv) Changing the ownership rights without compensation to the private owners. When comparing these methods, and because the ownership rights before the centrally planned economy emerged were laborious to clear up, the Baltic countries decided to use re-privatization rather than returning the ownership rights back to the previous owners. To quote Sadowski, the main methods in the privatization process would be to sell the shares to the new owner groups as (ii)-(iii) and distribute them for free by using for example vouchers (iv). By choosing the selling method, the suitable interest groups were found to be the management, employees, banks, investment banks, funds, other domestic firms, citizens and foreign investors.
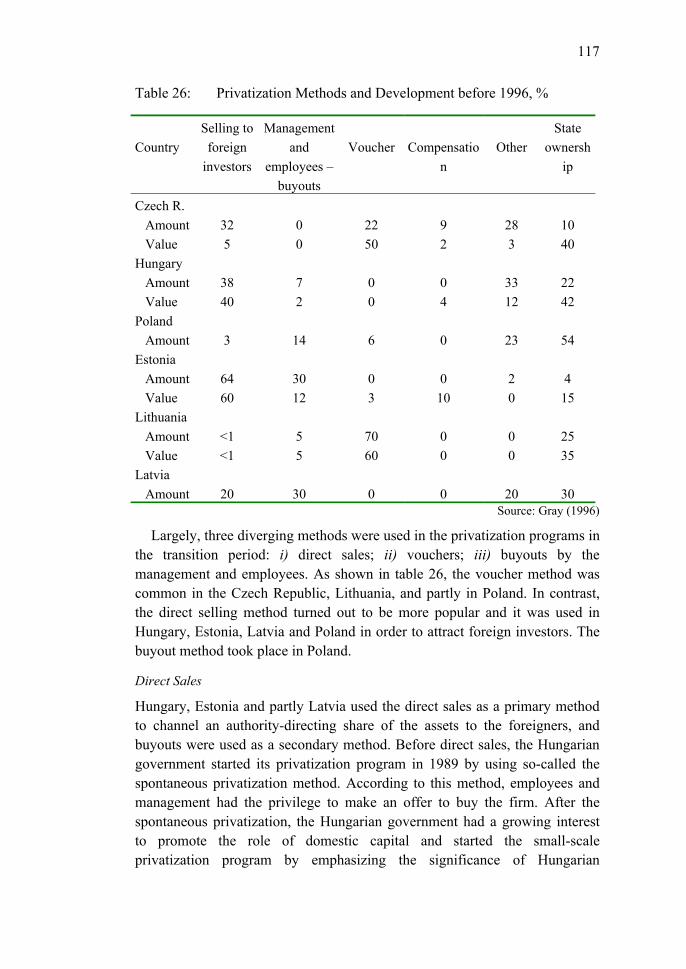
117
Table 26: Privatization Methods and Development before 1996, %
CountrySelling to foreign
investors
Management and
employees – buyouts
Voucher Compensation
OtherState
ownership
Czech R. Amount Value
325
00
2250
92
283
1040
Hungary Amount Value
3840
72
00
04
3312
2242
Poland Amount 3 14 6 0 23 54Estonia Amount Value
6460
3012
03
010
20
415
Lithuania Amount Value
<1<1
55
7060
00
00
2535
Latvia Amount 20 30 0 0 20 30
Source: Gray (1996)
Largely, three diverging methods were used in the privatization programs in the transition period: i) direct sales; ii) vouchers; iii) buyouts by the management and employees. As shown in table 26, the voucher method was common in the Czech Republic, Lithuania, and partly in Poland. In contrast, the direct selling method turned out to be more popular and it was used in Hungary, Estonia, Latvia and Poland in order to attract foreign investors. The buyout method took place in Poland.
Direct Sales
Hungary, Estonia and partly Latvia used the direct sales as a primary method to channel an authority-directing share of the assets to the foreigners, and buyouts were used as a secondary method. Before direct sales, the Hungarian government started its privatization program in 1989 by using so-called the spontaneous privatization method. According to this method, employees and management had the privilege to make an offer to buy the firm. After the spontaneous privatization, the Hungarian government had a growing interest to promote the role of domestic capital and started the small-scale privatization program by emphasizing the significance of Hungarian

118
entrepreneurship. As suggested from these steps, one can point out that the Hungarian privatization program leaned on the selling methods and case-by-case solutions without vouchers. The Hungarian State Property Agency (SPA) organized the privatization programs and the main purpose was to find foreign capital for their large-scale plants. In this procedure SPA negotiated directly with the foreign investors, and they had two possibilities: directly offer to buy out the firm or buy the state-held part of the shares, which in general led to a majority position in the firm.
As in Hungary, the Estonian privatization program included only two noteworthy methods: selling to foreign investors and buyouts by the management and employees. Estonia’s privatization program was firstly directed towards the large-scale electronics, engineering and metal companies. In Estonia, six industrial branch ministries, of which five were subordinate to the union-republican party (building materials, light industry, wood processing industry, meat and milk industry and food industry) while the sixth was subordinated to the republican ministry (local industry), lost their coordination rights and firms were sold mainly to foreigners. Before the privatization program, the state-owned sector of the Estonian industry was split into three organizational units: state enterprises, state joint-stock companies and companies leased in various forms to workers’ collectives (Hyvärinen – Borsos 1994). After the privatization, such a governance structure was shut down and it was replaced by the market-based and firm-specific governance system. Therefore, the goal was twofold at the same time, to split down the large-scale firm structure and then reorganize the supervision with domestic management, employees and especially with the foreign ownership. Since 2000, the medium and large-scale privatization has ended in the industrial sector and the reorganization still continues in the state-owned infrastructure companies (EBRD 2000). Moreover, Kalmi (2002a, 2002b, 2003) has emphasized in the empirical analysis how the employee ownership has succeeded in Estonia. He found out that “old” employees are less active to sell their shares than expected in literature, but to include new employees as owners are more risky to the employee ownership. One clear excuse for the decline of the employee ownership is that the impact of transaction costs increase relatively faster than the impact of decision making when the employee ownership disperses. When comparing the efficiency of the firms, in general, the employee-owned firms are as successful as the other domestic-owned firms. Mostly employee-owned firms have lower capital, lower sales volatility and less-risky compared to other firms. Moreover, the traditional Coase-theorem does not hold in these circumstances because high information asymmetries are present in the Estonian insider-owned firms.

119
The Latvian government leaned also on the selling method both in the small- and medium-scale as well as the large-scale privatization. The required domestic capital or entrepreneur groups were absent and thus “the selling to foreigners” method seemed to be the only choice. This method was similar to that in Hungary and Estonia, and was directed to the large-scale firms because the small- and medium-scale firms such as cafes and restaurants were privatized to the domestic entrepreneurs. In the large-scale privatization, the purpose was to find foreign investors in order to install a market-based governance framework. Even if the Latvian firms had sufficient technology and educated employees, “market-based” innovations and business culture were urgently needed. According to EBRD (2000), the remaining large-scale privatization is progressing slowly because the domestic industrial groups use their power in politics and because of the desire of the state to own a majority stake in the privatized firms.
Buyouts
The buyouts by management and employees acted clearly as the primary method only in Poland even if it was first called mass privatization. In that way, the Polish privatization programs differed when comparing to other CEE transition countries, and the clearest distinction was the variability of the methods used by the Polish authorities. The mass privatization program started in 1991 and first four hundred firms were accepted to the privatization program. The Workers’ Councils were in a pivotal position because the employees in the privatized firms received 10 per cent of the shares for free (Stark 1992). The privatization process in Poland continued also with the selling method. According to this program, the state property was moved to the control of the ministry and then the shares were delivered to the national privatization fund. This fund was governed by domestic and foreign representatives. In practice, the domestic and foreign consulting firms and investment banks had a central role during the privatization. The privatized firms were intended to be reorganized before selling, but the procedure seemed complicated. The opinions of the buyers and sellers regarding the condition of the firms differed significantly, and the selling method turned out to be a disappointment in Poland. Instead, most of the firms were privatized in using the “buying method” through the mass privatization in which the employees and ongoing management bought the firm. As mentioned earlier, the privatization of the Polish firms proved to be complicated, and therefore the state ownership after the privatization appeared highest in Poland compared to other CEE countries.

120
Vouchers
The goal of the voucher method was to keep the ownership in domestic hands. In that way the practice in the large-scale privatization in the Czech Republic (and in the former Czechoslovakia) and Lithuania differed from other countries. The reason for such difference was that the government distributed vouchers for the purchase of shares, and therefore most of the capital of the large-scale firms, to the citizens. By using this method the government emphasized that the ordinary citizens would have incentives to watch over the development of the domestic industry (Winiecki 1992). The process in practice turned out as follows. First, the state property was transferred to three privatization funds, which were responsible for the building up the joint-stock firms. Next, shares were sold against vouchers to the citizens, and finally the rest of the shares to domestic and foreign institutions and private investors.
The privatization method used in Lithuania was similar to that of the Czech Republic and it was called the investment voucher. The voucher method included various rights because the vouchers could be used for not only buying shares in a firm but also for buying an apartment or house. Since 1993, the citizens were able to exchange vouchers, which diminished and avoided the risks of the ownership itself. The advantage of such a method was that it hastened the Lithuanian privatization process because it made it possible to start the reorganization of the industrial structure rapidly. From the point of view of active governance, the privatization experts in Lithuania deemed it crucial that the management owned some stake in the firm and the foreign investors had an active role in order to facilitate access to western technology and marketing channels. The disadvantage of the investment voucher method was that the government lost its power to influence the internationally competitive firms. The weakness of the Lithuanian privatization method seemed obvious because the government was unable to collect any funds for the purpose of supporting the technology transfer or emerging firms. In the beginning of the transition period such behavior could have been appropriate by promoting the Lithuanian firms to become more sophisticated to the Western markets.
As familiar from Hungary, Estonia and Latvia, another method with vouchers used in Lithuania was the selling procedure in order to attract foreign investors. Such a method turned to be satisfactory, however, because the direct deals with the foreign investors generated no particular interest. Finally, the voucher privatization came to an end in June 1995 and afterwards, as found for example from EBRD (1998, 2000), the rest of the firms have privatized by using direct offers, but the lack of transparency and political interference have raised the concerns about the success of direct sales.
121
Summary
As above discussed, the privatization methods carried out in these countries have been relatively different. The basis for such differences is that Hungarian firms were in a different position compared to the firms in Czech Republic and Poland. The firm culture followed in Hungary seemed more free-minded than in its counterparts because the management had a rather powerful position in the decision-making, and the control of the state was wanted to be as minimal as possible. Compared to Poland the difference seemed crucial, because both the state and employees dominated in the firm’s decision making. From the early 1980s the employee committee had privileges by law to take an active part in the firm by transferring the power from the state officials to the employee committees. These arrangements discussed above had already transferred the monitoring to some interest groups inside the firm before the final privatizing process in Hungary and Poland. By contrast, the monitoring in the Czech Republic followed the traditional socialistic ideology where the control over the firms was focused on the state. The management of the firms was led through the ministry, and even if, for example, the employees committee was responsible of choosing the management, the government made the final decision for appointing the management (Frydman et al. 1993). Comparing the Baltic countries, the same ideology seems viable. Estonia was free-minded about selling sell its share of stocks to foreigners and strongly wanted to integrate with the market-based economies. In addition, its industrial base provided more advanced integration modes with the EU industry compared to Latvia and Lithuania.
When considering the relation between the various privatization methods and a firm’s willingness to innovate, our outlook seems as follows. Privatization determined basic rules to build up such governance inside the firms that might lead to the successful innovations, but it was unable to solve the governance approach itself. Comparing several privatization methods, the direct sale method seems the most viable to change such an infrastructure the most rapidly. The voucher method seems inappropriate because it lacked a mechanism to collect urgently needed financial funds and restructuring the capital markets is time-consuming. Finally, buyouts without entry of foreign investors might lead to an industrial structure where the previous rulers hindered the radical reforms. This seems to be the case in Poland and Lithuania.

122
5.4.3 Financial Governance, Innovation and Ownership Modes
In this section we introduce several contexts where various modes of ownership with the chosen financial governance might amplify or impair incentives in innovation. The contribution to discuss is then how several ownership combinations including the state, domestic public owners or foreign investors might affect the principal incentives when restructuring the privatized firm in the Baltic circumstances. The main question in this approach is the credibility problem, that is, how the managers of the Baltic firms are able to convince outside investors to channel their funds to the Baltic investment plans.
Concerning the issue of financial governance and ownership, several claims can be proposed before analyzing their impact on the principal incentives in the Baltic countries: first, the politicians in power paradigm maintained that there could be conflicts in decision-making between politicians and new owners, and funds might be channeled to other targets than innovative assets; second, the paradigm about optimal dispersion of shares showed that more attention should be paid to the ethics of ownership and financial governance, and privatization proved to be incapable of collecting the state funds for the purpose of investing in education and R&D programs; third, the absence of a capital market paradigm indicated that such capital markets had a minor role in corporate control; fourth, experiences with soft budget constraints, a bad debt problem and bankruptcy procedures delayed the restructuring process, raised the doubts of foreign investors and directed funds to the inappropriate and unknown targets; fifth, the conception of foreign investors’ aims was mixed and created conflicts between domestic and foreign owners.
Paradigm between Society Welfare and Politicians in Power
The conception by several authors discussed next emerged as follows: the privatization process in principle was flawed and therefore an imperfect and artificial way to move the property “in the spirit of the fair play” to the new owners. At least it functioned that way in the Russian large-scale gas and oil companies.
Several aspects shed light on the disadvantages when the politicians have a governing responsibility. Among others, Vickers and Yarrow (1991) emphasized essential failures based on such a process. They claimed that the state was still one of the main owners and there will be a conflict between the political and common welfare in the firm. The costs for the continued state ownership could be described as some kind of sub-optimal investments for social purposes influenced by the state. In this case, increasing ownership by the public therefore diminishes the influence of the state and guarantee more

123
appropriate principal incentives and better protection for choosing new technological investments. As a result of the Baltic privatization programs, we infer that the influence of politicians was largest in Lithuania, where the privatization turned out to be less efficient. In contrast, in Latvia and Estonia, a direct sale method produced quickly the independently working firms and it follows that direct influence of the state officials in firms’ decision-making decreased radically.
Based on above framework, Vickers and Yarrow (1988) found the state ownership complex in a way that politicians also maximize their own success both inside the firm and in the political arena. Therefore, politicians are constrained to make decisions that are politically sensitive. Another goal for the state could be to promote full employment at the expense of competitiveness in the foreign markets (Williamson 1985). The political decisions in these circumstances such as the mass firing of employees and closing down the factories might lead to rapidly increasing unemployment among voters. If we rely on the national statistics of the Baltic countries, this claim has no evidence at least in Estonia, where the unemployment decreased below 10 per cent in 2002. Also in Lithuania, unemployment started to decrease in 2002 but in both Lithuania and Latvia it appears to stay at a relatively high level, over 13 per cent.
One main advantage for the state ownership, which is a sensitive approach in the transition period, is that the state’s obligation as an owner is to take care of the social welfare in the whole economy. The main concern, according to Shapiro - Willig 1990, was that these newly governed firms abandoned the social aspects in their investment policies. They were concerned, in both cases, that the society might jump radically from the centrally planned society to a hard-core capitalism even if the public or foreigners had ownership rights. In the transition circumstances when the state lost its control over, for example, tax policy, environment issues or labor markets, the privatized and largely foreign-integrated firms can act independently without any governance from the state. Additionally, Laffont and Tirole (1993) found several advantages of the state ownership by fostering social welfare. The optimally carried out state ownership would generate the welfare such as full employment for the society without restricting the profit maximization. However, as cited in their study, due to the state ownership, it gives the possibility for the state to reach the “society goals” which are a part of the profit maximization, but these goals restrict principals to redirect resources to more innovative targets. The good example of these “society goals” was the social services, such as day-care centers or employee housing, offered by the centrally planned firms. Therefore in this case, the state ownership can prevent new owners from putting the reorganization plans into effect for political reasons.

124
Reflecting such a concern as regards the Baltic countries, we are aware that the complex goals for social welfare might harm the setting of the principal incentives but we expect that such concern is there rather different. In the Baltic countries, the state has behaved as a bridge builder between the various interest groups. That is, contrary to experiences of other transition countries and especially of Russia, the Baltic governments - led by Estonia - have gradually reformed their economies in order to improve the circumstances of both the domestic and foreign firms to make more complete contracts and thereby foster industrial innovations. However, at least one concern can be raised which can lead to uneven development. Those employees who have the ability to work at the restructured and maybe foreign-integrated firm compared to the other employees will rapidly reach a higher standard of living.
Optimal Dispersion of Shares and Absence of Capital Markets
The debate about corporate governance falls within two distinctive frameworks: to Anglo-Saxon stock-based and alternatively to bank-based models as in Germany and Japan. An extensive body of literature can be found regarding this approach by the Western economists (see e.g. Fama – Jensen, 1983; Sheard, 1989; Franks - Mayer, 1990; Stiglitz 1991b; Prowse, 1995; Groenewegen 1997; Edwards - Nibler, 2000). Also a large body of literature is adapting this approach to the transition circumstances (see e.g. Schleifer – Vishny, 1986; Stiglitz, 1991a; Frydman – Rapaczynski, 1993; Goodhart, 1994; Hyvärinen 1996). We review only the main findings that might be appropriate in the Baltic financial structure by concerning ourselves with which model might be more appropriate. The consequential wisdom is that such literature concerns the optimal dispersion of the share holdings for the purpose of finding a solution to share the ownership by optimizing the strongest possible efficiency in governance. In discussions about transition governance structures, these Western governance models were used as a backbone to find solutions for the principal incentives in transition.
One of the most clear adverse effects on domestic and foreign ownership after the privatization programs was the separation effect. The question in this approach is what does the privatization actually solve? To change the centrally planned state governance to the public ownership might lead to a lack of separation of ownership and control as well. The conclusion is that the ownership structure itself sounds incapable of solving the problem of incomplete contracting because each modes of the separation of ownership and control even in Western circumstances can create contract incompleteness and misuse of firms’ assets. We rate the significance of the principal incentives to be high during the reorganization of the financial institutions.

125
The right choice of the governance system has been recognized as essential in order to develop the principals’ incentive structure. Some skeptical standpoints were found that both of these models are flawed (Frydman – Rapaczynski, 1993) because the transition countries started from the trash and most of the firms might end up in bankruptcy before such financial institutions are installed. In other words, in order to refinance the extant industrial firms, the hidden soft-budget constraints threateningly hindered the controlling of debt by the financial sector. This was the parting shot to deepening the soft budget constraints or bad debt case. However, the clear need for the well-functioning financial institutions were observed because these institutions directed their attention towards the necessary market information. Such information gave the necessary signals of the directions of the transition firms. Therefore, Goodhart (1994) recognized that, in the short run, a quick decision of choosing the Western governance system in the reorganization stage is essential to guarantee the success of the process itself but, on the long run, there should be careful consideration of which governance model to use. Moreover, Stiglitz (1991b) brought forward that there might be also other possibilities to amend the governance. In addition of these models he suggested alternatives as external corporate governance or the networking system with the other interest groups of the firm. This led to the insight that the governance leaned on the law in finance, corporate law, country-specific financial and firm structures as well as the current level and progress of the various financial institutions, which could indirectly lead to the control through the bank-based or the stock market-based system. Moreover, Dosi (1990) connected these two financial systems and industrial change to the learning and selection. Dosi suggested that firm size, levels and distributions of technological capabilities differs from performance such as rates of innovation and productivity growth when these are mapped to learning and selection. Therefore finance is an essential bridge where the financial institutions exert pressure on the industrial firms to choose the rates by pushing them to learn and innovate new products, and in a different environment such a process leads to various paths.
Such a learning and selection process can be found from the Baltic financial markets. In the early stage, the critics focused more on the stock-based system than on the bank-based system because the CEE financial structure differed greatly from the Anglo-Saxon model and therefore it was unable to influence the industrial dynamics (see for example Frydman – Rapaczynski, 1993). Therefore, the governance mechanisms found from the centrally planned firms conformed to the bank-based instead of stock-based system for several reasons.

126
One clear excuse for the bank-based system was found from the poorly functioning capital markets. Hyvärinen (1996) found that – at least during the transition period – the banking sector was more appropriate for controlling the invested funds than capital markets because their debt financing bound them to make settlements that are more comprehensive and they were able to make contracts that are more explicit. Moreover, certain disadvantages can be found with respect to the CEE capital markets. The first was that, after the privatization programs in the mid 1990s, funds were absent to bolster the capital markets. The second was that after creating the Baltic stock market around 1996, the volatility was too high to create sufficient control through share prices. In other words, the inoperability of its main controlling mechanisms such as the absence of takeovers, and its implications as the absence of market information clearly impaired the functionality of the capital markets.
The role of the Western bank-based governance seemed fruitful for several reasons. First, there was no market-based value for the firms because of the broader absence of a well-functioning financial infrastructure such as capital markets and reliable financial information; second, there was an absence of the historically aware shareholders and especially a concern of the trustworthy shareholders and power coalitions after the privatization process. Moreover, there was no procedure for the other controlling mechanisms such as direct sales or takeovers; finally, there was no procedure how to reorganize the insolvent parts of the firms or soft budget constraints. The closing down these firms would have been profitable by decreasing the transaction costs in the long run even if it was a sensitive procedure in the short run.
Several attempts to create a market-based financial system can be found. The main finding was that the aim of the Czech privatization program was to create shareholders’ visible hand, which is familiar in the stock market-based system. The suitable proposals on the reorganization of ownership in the Czech transformation process were discussed in several studies, for example, Mejstrik (1992), Bouin (1993) and Parker (1993). However, the critics claimed that if the shareholdings are largely dispersed, none of the principals has incentives or power to govern the firm, and the political opposition can efficiently slow down the whole reorganization process. To avoid such behavior, the Czech privatization authorities developed the funds where the approach of dispersed shareholding could be avoided and shareholding could be concentrated to the hands of the motivated and enlightened investors. Mladek and Hashi (1993) indicated that the grouping of the shareholdings would improve the corporate governance but they were concerned about the ethics of such groups by asking that “who is responsible for their decision making and who will control them?” Based on these critiques, Boycko,

127
Shleifer and Vishny (1993) also provided evidence on the planning of the voucher privatization. Their research shows that they dealt critically with the quality and tradability of the vouchers and its realization at the time of sale. They paid attention to the ethically responsible owners and to the absence of institutions, especially a capital market. They argued critically that a mismatch between the reasonable owners and allocated capital raises the question of the urgent need for the market-based economic institutions, which can offer the suitable governance.
We maintain that a sound structure of financial institutions is a cornerstone of the Baltic innovation activity. Because FDI inflows were mostly directed to the Visegrad countries and the domestic markets were small in size and domestic investors rare, this restricted the funds available. In addition, the direct sales privatization method solved the ownership dispersion problem in Estonia and Latvia but developments might have been more complex in Lithuania, where the investment voucher was the main privatization method. Even if it solved the dispersion problem it created a new one. Without the voucher method the availability of tradable shares stays more moderate in the Baltic stock markets than in the Visegrad stock markets. The market value of Vilna, Tallinn and Riga stock exchanges was less than 5 billion EUR while the market value reached, for example, 12 billion EUR in Prague, 13 billion EUR in Budapest and 29 billion EUR in Warsaw in the end of 2002. In spite of this, as based on the research of Hyvärinen (2001) the average weekly returns were on par with those of the Visegrad stock markets or even to the Western stock markets although the Baltic markets were marked by thinness and high standard deviation in returns.
Financing Imperfections
The approach of the soft budget constraint appeared as one of the most significant issues against state ownership. The pioneering article by Kornai (1979) was a starting point about discussing this approach. According to his view, the state firms in the socialist countries were unwilling to adjust their costs to the profits because they financed their losses from the state budget. Because of the state subventions, the firms had no threat of bankruptcy and this diluted the managerial incentives to keep the firms profitable. The incapability of the state authorities to make competitive-based decisions to steer the firms toward the market-based environment without subventions was the reason for the current approach. It was not only the problem of some of the firms as it spread through the whole industry as well to the banking sector. According to Stiglitz (1991a), the cross loans between firms and banks spread the soft incentives to the whole society. The centrally planned multiple production matrix aimed at safeguarding production at each level made

128
impossible to undertake the bankruptcy procedure by raising the soft-budget constraint. Laffont and Tirole (1993) found that the absence of such controls caused the misallocation of resources and it reduced the willingness for investments in technology and human capital. The absence of the information through the signaling procedure of the share values blurred the long-term investment plans.
The argument of the soft budget constraint seemed significant during the CEE privatization process. The subventions by the state during the crisis protected the firms from bankruptcy procedures. The costs of that procedure decreased the principal incentives in order to push the management to improve the innovativeness and competitiveness of the firm in both the domestic and foreign markets. Therefore the privatization was justified because it diminished the transaction costs of the state interventions because of the harder budget constraints (Sappington – Stiglitz, 1987).
In the Baltic countries, the soft budget constraint worked through the centrally planned product chain where, in the end of command economy, the Baltic firms started to lack the required inputs to finalize their products. The soft budget constraint created a financial crisis because they were unable to obtain payments from other parts mainly from the Russian federation. Therefore, the Baltic firms suffered from the soft budgets but they were not creating the dilemma themselves.
There was one specific risk when using the bankruptcy procedure for the Baltic firms. In the beginning of the transition, most inefficient firms were closed down. This process showed that the property of the firm was sold out to the Western countries at scrap value and employees disappeared to the other sectors. Such process was a good example that the transition might lead to the rapid liquidation of the poorly-functioning firms by slashing also the value of the better-functioning firms. For this reason, the bankruptcy procedure was recognized to be a last resort measure because, with the bad debt problem, it would cause a large-scale crisis in the whole economy because the value mechanism of assets was under development. Even in the market economies, bankruptcy was found to be an inefficient measure to reorganize the assets. In the beginning of the transition period, it would be inefficient measure to transform capital in the Baltic countries where the ownership right regimes were weak.
As indicated above, bankruptcy procedures should be used as a control mechanism in order to show which parts should be closed down. Based on this procedure, when the Baltic markets were slowly opened up to international competition and the transition period came to an end, such a mechanism, when adapt studiously, might encourage firms to develop the covering mechanisms for their debt-financed investments. Such behavior would prevent the waste of

129
the innovative assets by channeling the property to the specific coalitions. Moreover, such a covering might in turn encourage investors to use bankruptcy as an instrument against the poorly functioning firm. Therefore, this instrument would give the right to the investors to close down the poor parts and then reorganize the more innovative parts of the firm.
In conclusion, it seems that the bankruptcy procedure sounds useful among some other procedures, that is, market forces, competition and the threat of the bankruptcy together would be an efficient method for the governance in the Baltic countries. Because the power coalitions formed after the privatization programs with the large-scale sized firms would be an inefficient combination to make needed modifications, then the threat of the bankruptcy through the market-based competition would be a necessary procedure to force these power coalitions to re-orientate their assets. In these circumstances, the miniscule increase in competition would have the needed influence to wag the whole structure and it might be restorative when the state was incapable to restore the whole industry. In other words, the increase in competition would strengthen the role of the state early on through the soft budget constraints and protectionism but later on the fear of liquidation would increase the incentives of the management in order to increase the productivity.
Foreign Investors and Western Governance
As mentioned above, the approach of the Western-like governance was found useful in the transition process at least in the short run. Several researchers such as Frydman – Rapaczynski (1991) presented weaknesses at the development of the CEE industrial organization structure and agency problems that might be corrected by foreign governance. According to their view, the main shortcoming of the state firms was their inability to form effective corporate governance to the market-based circumstances. Since the privatization process was the basis for further deregulation and decentralization then the efficient governance system formed a link between the principals and the agent. During this principal-agent process, the argument for the foreign owner seemed essential where the knowledge of the Western governance created the incentive framework to the CEE management.
Next question is why not take the well-functioning foreign governance system abroad with the FDI? At least, there are some advantages for the foreign investors and governance. For example, the reorganization effect was strongest because they had no strains from the centrally planned period. Comparing the involvement and role of the foreign investors in Estonia, Latvia and Lithuania it was investigated whether the ownership rights used the various methods to shape the assorted incentives to the management. At the same moment, according to these methods, the behavior of the management

130
and the profitability between the firms seemed to form differently. The clearest distinction has been found from the firms when the Baltic firm found the Western partner, which brought technological know-how, and upgraded its own incentive and governance system to suit the transition circumstances.
In general, the reform programs carried out for example in Estonia led to the conclusion that the role of foreign investors seemed to be a remarkable cornerstone in the Estonian industrial restructuring process and their role was accentuated especially in the large-scale privatization. Therefore, the Estonian reform turned out to be a successful procedure for finding the core investors abroad who could be helpful in installing the new methods of corporate governance and managerial incentives as well as enclosing Estonian firms in market-based information, know-how and innovation networks.
It seems that Lithuania found support for its investment voucher program from the Visegrad countries. Not surprisingly, because of the difficulties of firm valuation, a number of reasons can be discovered why especially the Hungarian economists such as Hunya (1991) and Mihalyi (1993) took a critical attitude of this process. They claimed that such a process is harmful to Hungarian domestic investors because with this large-scale privatization method "the family silverware was sold to the foreign investors". Another reason was that a low valuation might imply low revenues to the government. Mihalyi (1993) emphasized that in the large-scale privatization, the main income was collected from the foreign investors but the less competitive parts of the firms stayed in the state hands. Such behavior can be insisted in a way that the foreign investors focused their interest only on the well-equipped parts of the firm or industrial branch and left the uncompetitive parts to the state. The critics of such a procedure said that the profits of the well-equipped parts spilled abroad but the domestic managers and authorities had to find an answer for the reconstruction of the uncompetitive parts. In sum, however, as the result of the Lithuania privatization programs, the state ownership in the industrial sector remains still significant and complex because some parts of the production plants are found to be uncompetitive.
5.4.4 Specific Features about Financial Governance and Contracting Environment after Stage I
In this section, we observed heterogeneity among several Baltic privatization methods and financial governance, and examined specific features which might have an effect when forming the high-powered incentives for principals. In summary of this approach, we raise several statements.

131
1. Privatization was a focal procedure to create a basis for the reorganization process and ongoing integration into the EU markets.
It was commonly known that the privatization programs were a starting point for the transition process in the Central European countries. It emancipated the ownership rights and gave more “elbowroom” to the industrial reorganization and institutional development itself by separating the decisions of the economic agents from the state control. However, the privatization process was not enough: it was incomplete and therefore insufficient for solving the governance process in production and fostering success in innovation. Therefore our analysis needs further analysis to explain these governance modes.
2. Several privatization methods, political opposition and an unclear mixture of shareholdings confused investors and slowed down the principal incentives.
As mentioned, each CEE country used its own specific privatization methods. Such a variability of the methods created confusion about who would be responsible for the decisions made inside the firm. The voucher method moved the ownership rights to the citizens, but there was a concern of highly dispersed ownership in the same way as found in the Anglo-Saxon stock markets. After the vouchers were distributed no one could be sure who would eventually own the shares and use power inside the firms. Because the standard of living remained low, the citizens were tempted to sell the shares even at a low price. Moreover, ownership by the public had no inherent advantage over the state ownership. That is, both ownership modes faced the same problems concerning the principal-agent issues, dispersed ownership structure, failures or inefficiencies in the board working due to the asymmetric or loss of relevant information and the power coalitions inside the firm and the board.
Furthermore, the direct sale method to the foreign investors concerned the CEE economists. They claimed that there is no evidence of their motives and they can just liquidate the firm’s assets, put the money in their own pocket and disappear. The main concern raised, however, was that the society could jump radically from a centrally planned society to a hard-core capitalistic society no matter whether its assets were owned by the public or the state. In sum, the ownership mode was inadequate to offer a final solution in the reorganization process; it gave the authorization to start the process but more enriched explanations were needed to find out the excuses, which might lead to the efficient governance in production as well as the industrial integration or enlargement process in the EU.
132
3. The shortcomings in firms’ financial relations and absence of a functional financial sector channeled funds to inefficient targets.
To analyze the relationship between the shortcomings in finance (absence of capital markets, soft budget problem, bad debt, bankruptcy procedures and validity of foreign investors) and innovative activity, it was found clear that these institutional weaknesses channeled funds for other purposes than education or R&D programs and hindered the high-powered incentives of principals. Moreover, the heterogeneity of foreign investors created uncertainty and conflicts between domestic and foreign principals. The unclear question was still the industrial competitiveness and the cost structure in closer integration with the competitive EU markets.
5.5 Stage II: Institutional Framework and Governance in Production
As studied above, stage I examined the relationship between the financial governance and principal incentives to enhance innovation. Next, stages II and III explain the factors of sound institutional development and contractual environment for the purpose of improving managerial incentives. Thus we identify the meaning of the governance framework of production and innovation for the speed of the outsourcing process itself. Moreover, in stages II and III, we use the framework of the theoretical study of Grossman – Helpman (2002b) to investigate the relationship between managerial incentives and institutional structure of the governance in production and then governance for innovation.
In this section, we suppose that the aim of the EU and Baltic contracting partners is to minimize the searching and customization costs, and the gap in technological expertise. We establish that the searching costs are mostly born from the institutional infrastructure and instead the firms themselves handle the customization costs by improving their incomplete contracts. However, the government can at least partly decrease the customization costs by improving the country’s ability to maintain the required level of human capital and R&D. The ability to match technology between parties and the gap in technological expertise are both linked to the sufficient country-level infrastructure in human capital and R&D.
Concerning the context of the incomplete contracting, industrial restructuring and managerial incentives, we define the institutional framework in this section. Such a framework includes the factors about the institutional development that might help clarifying and diminishing the costs originated from the quality of the legal system and distance in expertise. Concerning such an institutional framework, we first discuss on the several policies, which
133
belong to the duties of the state authorities. These are a legal framework of the firm and trade regulations as well as industrial and technology policy, where the aim is to minimize the technology gap between the Baltic and EU firms. Second, we analyze the role of state officials in order to minimize the searching costs, customization costs and distance in expertise between contracting firms. To put it briefly, the purpose is to review the main shortcomings and advantages found from the Baltic institutional environment.
5.5.1 Spontaneous Step-by-step Institutional Reconstruction and Transaction Costs Approach
The transaction cost approach became one of the most interpretative theories in the CEE transition period because it indicated pertinently the shortcomings of the centrally planned institutions. Needless to say, these institutions comprised the costs as routines, bureaucracy, hierarchies and the lack of efficient coordination as investigated in the context of the transaction cost theory. The urgent need to create a new and less-hierarchical, market-based institutional structure was emphasized in several studies such as Frydman – Rapaczynski (1993) and North (1997) due to the need to govern the production sector during the transition process. However, according to Frydman – Rapaczynski (1993), the rapid reorganization of the institutions to correspond to the Western institutions included high risks. It was clear that new and unknown market-based institutional arrangements increased the risk of failure. Therefore, they suggested that new institutions should be formed spontaneously while taking into account the needs of the markets, therefore making the reorganization process “spontaneously evolutionary”. However, such an evolutionary process was found out to be problematic because the long history of the central-planning administration took its toll and the local authorities became estranged from the Western logic. According to Frydman and Rapaczynski, instead of the rapid jump to the Western institutions, the CEE institutions should have been developed by the step-by-step procedure with the self-correcting mechanism because there appeared to be at least two main shortcomings. The first was that there is insufficient interest in the new type of institutional models or their functionality is uncertain. The reorganization was not enough because it created new sticky and established bureaucracies just replacing the hierarchies from the centrally planned period without changing routines. Another shortcoming was that new managers can choose the passive role in their investment policy without seeking to reorganize the firm, and shirking and opportunistic behavior might continue

134
also after the transition period. The needed reallocation of resources could therefore fail.
As found from these studies, it was increasing recognized that the dynamics of an innovative industrial structure falls not only on the firms itself but also on the functionality of the economic institutions and the regulations by law. In this approach, as quoted by North (1991), the key issue of economic development is the evolution of the economic institutions of creating an economic environment that induces increasing productivity. Concerning the transition issue, North (1997) mentioned that the collapse of the centrally planned system destroyed the formal institutional framework, but the most of the informal constraints still existed. As a result, the attention should be focused on trying to develop a better understanding between the formal and informal constraints in which these activities took place. Based on these opinions, it seems clear that the goal for the Baltic countries was to attenuate the institutional gap between them and market-based economies by breaking down especially informal constraints and then restructuring the institutional environment in parallel with the emerging industrial structure.
Consequently, the message of this analysis is that the purpose of the EU integration to the East is especially to change these informal constraints. We assume that the target for the reorganization and institutional building is based on the conception that the target for the Baltic industrial firms is to survive on the enlarged EU markets and not only for example to retain their positions in the domestic, Russia, other CEE or CIS markets. We neglect to define these competition circumstances but we describe the factors that might help us reach such a level of institutional development and industrial restructuring. In other words, concerning our topic of outsourcing, that is the level that leads to the increasing outsourcing contracts between the Baltic intermediate and EU final producers.
5.5.2 Institutional Framework and Quality of Legal System as Signaling Procedure
First we examine the broad framework to help clarify the legal system that would be the basis for the successful EU industrial integration to the East. We claim that its purpose is more than just to guarantee legally each other’s obligations, but it has also the signaling effect to the EU-Baltic integrating partners. The opinions above clearly suggest that a functioning legal system acts as a critical element supporting the development of efficient, competitive and durable entrepreneurship. The functioning environment flows as the

135
interaction of many sources such as business, finance, labor, R&D and trade regulations.
Legal Framework
The similar weaknesses, as found from the other CEE countries, troubled the Baltic legal institutions because they were unable to sort firms into the survivors and non-survivors. The economic links formed in the centrally planned period still supported the firms where the possibilities to compete in the new circumstances remained low. At the same time the firms with the competitive innovations had difficulties to acquire any support. Furthermore, there were no regulations how to solve financial insolvencies such as the bad debt problem, which caused bankruptcies in the firms that, at least in the long run, had competitive prospects, and firms with the low estimates on the long run, received financing based on their centrally planned political background (CCET 1994). Therefore, it was not surprising that the legal framework had to be reformed to signal that such insufficient procedures can be handled and it was not an impediment for the outsourcing activities before the industrial integration between the Baltic and EU firms could be lucrative.
As found out by Rumpunen (1997), since the centrally planned period, the Baltic countries have been active to re-adopt their laws in the commercial and economic fields. In order to create an efficient business law framework, the clear rules of ownership rights might be the first essential cornerstone to secure the obligations and responsibilities on the decision-making inside the firm and between parties. Also the business law should define the rules of public information of the privatized firms. Such information included the necessary releases of the compulsory publications (annual reports) or other announcements in order to improve the transparency of the stock markets and other financial institutions. Furthermore, the clearness of the labor and social security regulations such as minimum wages and other compensations and also the law concerning R&D, for example the intellectual property rights (patents etc.), improved the quality of the legal system and increased the incentives for the EU final producers to make intermediate contracts with Baltic producers.
Concerning this issue, new laws have been adopted, for example in Estonia: law on foreign investment (1991); bankruptcy law (1992); securities, competition and privatization law (1993); law on property rights (1996), in Latvia: competition law (1991); privatization law (1992), company law (1992); in Lithuania: privatization law (1991), bankruptcy and competition law (1992); company law (1994), (see EBRD 1998, 2000). Before new laws were ratified, the Baltic authorities used foreign expertise, for example, German authorities and some international consultant services. These

136
consultant firms have been used to formulate the current and future legislation in accordance with EU standards. Especially the funds through the PHARE program granted by the European Commission have helped the Baltic countries to harmonize their laws with the EU legislation as well as to educate the law personnel working in the several governmental law institutions. Furthermore, the last step to harmonize the legislation between the Baltic and the EU countries was to follow the recommendations of the White Paper on integration into the Internal Market of the Union.
Trade Liberalization and Deregulation
In general, the involvement with free trade agreements improved the quality of the legal system. When considering the competitive viewpoints, the lowering of the trade barriers and allowing competition that is more liberal enhanced the progress of the privatization. The tightening competition improved the outside control of the firm and increased both the resource allocation and productivity (Hart 1983, Holmström 1982). If the competition was restricted through entry or trade barriers by the state, then carrying out market deregulation and liberalization at the same time with the privatization process would lead to the appropriate results. The tightening competition might be more effective than only restructuring the ownership rights. Also deregulation only has brought improvements to productivity.
When considering the trade regulations after the centrally planned and transition period, the Baltic institutions needed more education and training to learn how to negotiate new regulations with the European officials and with other trade organizations to give them equal access to the Western markets like other countries. With the former member countries of the Soviet Union there were no foreign trade systems in place at all. According to Hyvärinen – Borsos (1994), the development of the Baltic foreign trade policy agreements after the centrally planned period was approximately as follows. The progress of the Baltic countries, compared with the other CIS counties, has been successful in building institutional links to the rest of the world through a set of agreements concerning free trade and MFN (Most-Favored-Nation) status. First, The Baltic countries concluded the bilateral agreements of that time with EFTA countries (Finland, Norway, Sweden and Switzerland). All these agreements were basically of the same content and provided for duty free trade in industrial goods subject to rules with origin. When Finland and Sweden joined the European Union in 1995, it was agreed with the EU that the Nordic countries could negotiate free trade agreements with the Baltic countries.
The first step for the Baltic countries was to be granted MFN status by the EU. The mutual granting of MFN status was agreed upon in the Agreement on Trade and Commercial and Economic Co-operation, and GSP (Generalized

137
System of Preferences) status was granted during the year 1992. In general, these agreements included that industrial goods can be exported to the EU as duty-free and agricultural products with reduced tariffs without any quantitative limits if they do not belong to the group of “sensitive products”.
The next step was to negotiate the same trade agreements with the EU as concluded between the EU and other six Central European countries called “Europe agreements”. These agreements included a framework for strengthening co-operation such as political relations, technical assistance, and harmonization of legislation. When the provisions of the Europe Agreements were fully implemented, the Baltic countries with other CEE countries re-evaluated the position that EFTA countries enjoyed regarding the trade in manufactured goods with the EU countries. Moreover, Berg (1997) discussed the recent developments of the Baltic trade agreements based on the Baltic Sea Region Programme and the Union pre-accession strategy on this region. The improvements in trade relations between the EU, Baltic Sea region and Russia will speed up trade and industrial integration in the Baltic countries. Concerning the international trade agreements, Estonia and Latvia joined the WTO in 1999. One of the significant issues was the WTO negotiation round between the Baltic countries and Russia in order to support the reduction of the trade barriers. Import tariffs and export subsidies in trade between Russia and Lithuania have complicated the WTO accession negotiations with Lithuania.
In sum, the Baltic countries had chosen rather free regulations in international trade, which is a signal for further fluent trade and industrial relations between the EU and Baltic firms. After joining the EU, more education and training will be needed so that the Baltic countries can utilize the advantages of the enlarged Europe.
5.5.3 Institutional Framework, Searching Costs, Customization Costs and Distance in Expertise
The next step is to consider how the improvements in the institutional framework might decrease the costs of outsourcing. The improvements in the contract technology lead to lower searching costs through two channels. The first reform ideology of the institutional framework depends on overall communication infrastructure (telecommunications, transport and other services such as accommodation). Another reform ideology in such a framework concerns the improvements in human capital and R&D institutions, which creates innovation capabilities, that is, education and R&D policy and in that way decreases the customization costs and narrows the gap in expertise.
138
Institutional Structure and Searching Costs
The institutional framework includes factors such as transport services, telecommunication and education infrastructure. Before starting the production process itself, both parties will search for the suitable partners. Therefore there should be an infrastructure to meet and negotiate for the final production process. This approach is examined in several studies such as Hyvärinen – Borsos (1994), Hyvärinen – Hernesniemi (1995), Hernesniemi – Hyvärinen (1995) and Kilvits et al. (1997). First, the fluent activity of the transport services such as air transport will therefore be required. In the Baltic countries, the highest business activity is concentrated around their capitals: Riga, Tallinn and Vilnius. The main challenge is to rebuild the capital airports to correspond to international standards. The Riga airport was modernized with an EBRD loan in order to improve the runways and the lighting system. In addition, the Tallinn airport has been repaired in 1995 to respond to the needs of the international air traffic. Second, a functioning telecommunication network is one of the crucial links to lower the searching costs. Versatile, high-quality and cost-efficient telecommunication services improve the efficiency of the intermediate and final producers on both sides. The telecommunication investments in the Baltic countries are a promising area for co-operation in which the Nordic telecommunication companies such as Nokia and Ericsson have provided significant inputs. The recent investments in the mobile telephone NMT and GSM networks will fulfill the Western standards in business calls. Third, the education investments in the management would indirectly lower the searching costs. These include language and negotiating skills by the management. The international co-operation in education might lead to sufficient results so that the Baltic managers can be trained with the Western partners or University programs either at home or abroad. The Institute of Stockholm School of Economics in Riga (Latvia), where also Estonian and Lithuanian students are allowed to study, is an encouraging example of that kind of co-operation.
Institutional Structure, Customization Costs and Distance in Expertise
Now we turn to examine the need for the institutional framework as described above, but we analyze its significance due to the decrease in the customization costs and distance in expertise.
The geographical location of the Baltic countries with respect to goods distributors or markets affects the transport costs by easing the business activities and industrial integration. The functioning of the transportation system was therefore one basic factor behind the industrial competitiveness by lowering the customization costs and the incompleteness in contracting. Delays and interruptions in transport increase these costs and disturb final

139
production, and therefore the state may play a major role in improving the functioning of industrial transport via its investment through its transport investment.
According to Baldwin – Martin (1998), the increase of information and communication technology has radically diminished the transportation and communication costs. Such a development has several advantages concerning the behavior of MNEs when advanced information and communication technologies make it possible to control and decentralize the MNE operations more efficiently (Pajarinen et al. 1998). These claims also fit the Baltic countries. The state transport firms are being privatized and activities are decentralized in order to increase competition and stabilize transport prices. Owing to their geographical location, the Baltic countries have functioning transport connections via the Baltic Sea. The location is favorable for transit traffic both in the east-west direction to Russia as well as in the north-south direction between Northern and Central Europe. Latvia’s most important commercial harbors are Ventpils and Riga. Ventpils is more significant for industrial logistics. It is designed primarily for oil and oil products, but most of the grain transports were transferred through Ventpils to the East, and deliveries of coal, timber and metal products to the West. Estonia’s most significant harbors are Muuga, City and Kopli owned by the state enterprise Tallinn Port. Muuga is the main harbor for industrial goods, also handling grain, oil products and wheeled vehicles. City port transfers metal products, lump cargo, including containers, packets and wheeled cargo. Kopli port handles oil products, timber and sawn timber and mineral building materials. Lithuania is located between the CIS countries, Latvia and the Baltic Sea and it has a relatively well-functioning logistics chain through the east-west railway network and Klaipedan harbor. Therefore its main task has been to handle bulk goods to the CIS countries (see for example Kilvits et al. 1997, Hyvärinen – Hernesniemi 1995, Hernesniemi – Hyvärinen 1995).
The next step in this approach is the significance of education policy. As is well known, the advantage of the Baltic countries rests on their high level of education, and their basic education policies have guaranteed the necessary qualifications of the employees by lowering the customization costs and distance in expertise. The first step to compare the Baltic educational level with the Western educational systems was to assess it using the ISCED classification system (Kilvits et al. 1997). University-level teaching is considered as being theoretically advanced and enrollment levels have stayed rather high in the Baltic countries. University teaching has strong traditions in natural sciences and some fields of engineering. Since the Baltic labor force needs retraining, adult education must also be emphasized. The upgrading of the competence of the Baltic labor force depends also upon co-operation

140
between restructured firms and government. Possible mechanisms of retraining are apprenticeship programs, joint research projects of firms and universities as well as firms’ own training programs in areas such as industrial processes and material handling, accounting and techniques of quality management. Co-operation in education systems can be developed internationally so that the Baltic workers could be trained in Western companies abroad (Hyvärinen – Borsos 1994). The Baltic countries have growing opportunities to increase co-operation in programs organized with Western organizations. Such programs cover management training, assistance to business particularly SMEs, investment promotion, and industry-related environment protection.
The debate about the urgent need for R&D policies in the Baltic countries and their eagerness to become integrated in the EU market has been found to be remarkable for two reasons. First, their domestic markets are small and the large-scale industrial conglomerates were unable to respond to the domestic demand because the industrial structure was geared toward heavy industry and capital goods at the expense of the light industry, services and consumer goods. Second, as found also from the other transition countries, an urgent need for the institutions by supporting R&D activities and education was and still is essential to enforce consolidation of labor-market institutions, skill-adjustment, technology transfer and industrial R&D because the highly educated R&D personnel is disappearing to the other sectors.
As indicated above, in order to lower the customization costs and lower the distance in expertise between the Baltic intermediate and EU final producers, the R&D policy including technology transfer and diffusion of R&D offers one of the needed institutional frameworks. The technology gap proved to be the biggest concern in the Baltic countries because, as compared to the OECD countries, the share of high-technology products has been remarkably low. According to this concern, the future technological progress depended on how well the newly restructured firms were supported by the technological infrastructure and how they were prepared to internalize the technological change.
As can be found from the Baltic industrial integration process, the small Baltic firms benefit from the technological progress when they subcontract with the large-scale multinationals, which had already gone through the international competitive pressure. The western firms, which organize new innovations and technology transfer, would likewise benefit from diffusing these new innovations into final products in the intermediate Baltic producers. The government had a central role because the technology transfer can be reinforced by public support or new R&D investments in the new industrial fields and steering of the training programs into new R&D directions. As

141
discussed in Kilvits et al. (1997), these training programs consist of the EU as well as international scientific-technical co-operation through several of the European Union and the world-wide research, technological and innovation programs: FRAMEWORK V, EUREKA, COST, PHARE, ESA, CERN, ESF and EMBL. The aim of these programs is to combine the R&D interests of scientific institutions and the needs of industrial firms. As a result, we propose that Baltic firms should take the next step in the near future. The Baltic governments have the responsibility via R&D policy to support these firms starting to produce own final high-R&D products and in that way decrease the risks of the hold-up problem. As found from Sharp (1996), EU R&D funding is mostly channeled to a small number of large firms instead of SMEs. Therefore, the Baltic firms cannot stay passive in the EU R&D programs during the integration process and leave its formation to the governments in order to channel EU R&D funds to the SMEs and in this way they should take an active role in forming their own R&D identity.
After joining to the EU, the successful co-operation and participation with these programs and foreign firms will be the cornerstone of successful Baltic R&D policy. As is well known, external technological infrastructure emphasizes the role of research institutions as well as the foreign technology in the innovation process and the diffusion of technology. In general, the Baltic universities, which carry out the basic research and support the conversion of innovation into the industrial production, had long research traditions in the natural and technology sciences (Hyvärinen – Hernesniemi 1995, Hernesniemi – Hyvärinen 1995, World Bank 1993). However, one can see that in such circumstances it still takes an inconveniently long time for basic and applied research to have a competitive impact upon industrial production processes. It was generally comprehended that the Baltic countries have no time for such a procedure to reach the R&D level of the EU countries. That is why the restructured firms have to prepare their personnel to benefit from the foreign technical assistance. Even if some branches, such as the Baltic electronics sector, have been proclaimed the flagships of the centrally planned industrial base, most of the Baltic production machinery still needs new technological investments because the current levels of quality and productivity lag behind those of the West.
5.5.4 Specific Features about Institutional Framework, Governance in Production and Contracting Environment after Stage II
In this section, we identify the institutional arrangements that help to form the high-powered managerial incentives and therefore enhance the contractual

142
eagerness toward EU-Baltic industrial integration. Several implications about the usefulness and shortages of sound institutional framework can be proposed:
1. Transaction costs approach seemed to be the first challenge for the Baltic countries to refrain the complexity, fuzziness and hierarchical character of state institutions.
To solve this argument, the first suggestion was that rapid change included remarkable risks. Therefore new institutions should be created in a spontaneous way and by taking into account the needs of the ever-changing and evolutionary transition process. In such circumstances, the step-by-step procedure with the self-correcting mechanism might be appropriate. It also seems appropriate that the goal of the Baltic countries was to attenuate the institutional inefficiency by increasing the transparency of informal constraints inside institutions.
2. By supposing that the government is responsible for the functioning institutional framework which enhances the governance in production, it is the government’s responsibility to form legal framework to guarantee the obligations of each interest groups and use it as the signaling procedure.
One difficulty between the Baltic and EU firms was the discrepancy in corporate law. With the help of foreign expertise, the Baltic countries have been active to revamp their centrally planned laws in the fields of commerce, finance and economics but they also adopted completely new market-based laws. Significant efforts to improve the contracting environment were made in the such fields as ownership rights, public information on privatized firms, labor and social security regulations and the law concerning R&D. Further, the Baltic countries took an active part in negotiating their new trade agreements but they still need more education and training to solve the negotiation procedures with the EU and with other international organizations. The Baltic countries have successfully built trade links with the rest of the world through a set of trade agreements such as GSP, MFN, “Europe agreements” and finally their procedure to joining the EU.
3. Functional institutions act in the key role of regulating the guidelines which definitely affect the outsourcing costs.
This argument works via two indirect channels. The first is that the government can be active in building the serviceable communication infrastructure that reduces the searching costs in contracting between parties. Since the industrial activity in the Baltic countries is concentrated around their capitals (Riga, Tallinn and Vilnius), this makes it worthwhile to build the communication infrastructure such as airports, accommodations and

143
telecommunication around these regions. Another channel for reducing customization costs and distance in expertise rests on the workable education and R&D policy. As regards the merits of the Baltic education level, according to ISCED standards, university-level teaching is considered as being theoretically advanced and capabilities in natural sciences and some fields of engineering are strong. Concerning employee training, possible mechanisms of retraining are apprenticeship programs, joint research projects of firms and universities as well as firms’ own training programs in such areas as industrial processes and material handling, accounting and techniques of quality management.
As indicated above, the R&D policy including technology transfer offers one of the needed institutional frameworks for the diffusion of technology in the Baltic firms. The Baltic governments have an increasing challenge after joining the EU to support new R&D investments in the emerging industrial fields and steer the training programs toward the new R&D directions. The co-operation and participation with the EU as well as international scientific-technical co-operation and training programs might be the cornerstone of Baltic R&D success in the near future. The final goal is to create their own industrial identity so they can produce their own final products for the enlarged EU markets.
To conclude the stage II, we have found that the correspondence between the institutional arrangements and governance in production can be established, but more investigations are needed to discuss about the governance with respect to innovation. This approach is investigated in the next section.
5.6 Stage III: Governance in Innovation and EU Industrial Integration to the East
After introducing the financial governance and institutional framework of governance in production we are ready to examine governance in innovation. Sections I and II lacked the analysis how innovations take place inside industrial organizations. In this section we explain the essential features of the governance for innovation approach to investigate the process of industrial reconstruction during the preparation of the EU industrial integration between the Baltic intermediate and EU final producers. While the literature in this field is extensive, we have chosen two ways to examine this approach. First is the resource capability framework in which we consider the meaning of high-skilled human capital and success in R&D innovations. Second is theorganizational framework inside the reorganized Baltic firms, which discusses

144
the conditions to form the high-powered managerial incentives. This framework includes the improvements to the governance structure for innovations inside the firm, investments to the inside firm training for purpose of the market–based leadership and communication skills. That is, the management capabilities lead to the innovations by picking up the right production processes and by joining to the international technological progress such as technology transfer and diffusion.
5.6.1 Resource Capability Framework and Human Capital
Meaning of Capability, Human Capital and Growth
So-called endogenous growth theory was a hit in the early 1990s. Several theoretical models of R&D-based or more specifically innovation-based growth such as Grossman – Helpman (1991a) and Aghion – Howitt (1992) hypothesize that the conventional human capital might be incorporated. It seems natural to suppose that the utilization of human capital is beneficial when the stock of human capital is increasing. It is stressed, for example, in Stokey (1991) that the quality of schooling rather than quantity is one of the main sources of long-term growth. She also shows that if a small open economy with slightly higher human capital than in the rest of the world starts to trade in the intermediate goods, its investment in human capital can give an ever-increasing boost to growth. Based on this insight, one can argue that the Baltic countries might reach such a path and the catch-up effect will be high: their advantages from EU industrial integration might be higher than the effects of integration in the EU countries, because small economies are more flexible to adapt R&D-intensive production compared to larger CEE economies.
High-skilled Human Capital
Based on the recent foundations of Machin – Reenen (1998) and Berman – Bound – Machin (1998), the skill-biased R&D intensity and technological change and also relative demand for high-skilled employees are increasingly needed resources in the developed countries. Such a tendency is also a signal to the Baltic firms that skilled personnel acts as a key factor in the EU outsourcing process and in that way has an upgrading effect on managerial incentives. High-skilled human capital in principle generates the final producers’ incentives to search for their conceivable partners from such region, and Baltic firms might be better off by finding more profitable contracts with the EU final producers. As discussed in the previous section, the starting point for skill-biased employees in R&D is estimated to be at a

145
high level in the Baltic countries. The next purpose is to find a partner among the EU final producers to fulfill their practical skills in their firm-specific training programs. Under such conditions, however, the concern might emerge that the employees are divided among the different groups according to which contract the Baltic firms are able to sign. As earlier briefly discussed, this implies that a more efficient contract leads to the uneven development between Baltic firms if they have managed to sign a contract with more profitable EU firms. Intuitively, a race for profitable contracts divides the Baltic firms into winners and losers, and that way leads to the high dispersion of employee wages and sharply biased skill-structure for successful contracting firms compared to losers. Thus also the national education and training infrastructure is needed as investigated in stage II to compensate for such an uneven development.
Skill Spillovers, Innovations and Integration
An important result in the spillover and innovation literature is that a critical mass around it is needed to be successful (Baldwin 1989). The successful spillovers can be found from the regions in which similar types of firms work as clusters and spread their knowledge by co-operating with the same kind of problems. Therefore, the skill spillovers are supported by the fact that skilled employees have low barriers to use each other’s information. Such clusters can be formed to the Baltic capitals: Tallinn, Riga and Vilnius. Such a view also implies that a key factor for increasing skill accumulation in the Baltic firms requires close links with the high-technology EU firms and advanced EU technology programs.
Several studies such as Lundwall – Johnson (1994) and Gregersen – Johnson (1997) stress that the learning process and especially institutional learning are needed for successful innovations. They describe that even if the innovation systems are still nationally restricted, the learning needs international R&D integration and in that way cross-border skill spillovers. Therefore one of the key factors in building the Baltic innovation system is the functional institutional structure, which is nationally supported but leans on the EU-wide skill spillovers. Baltic institutional change should move towards a learning economy, as defined in models such as Dalum et al. (1992), Lundwall – Johnson (1994) and Smith (1996), in which the rate of knowledge turnover is high and the change of the total knowledge stock is fast. According to them, the learning economy needs, firstly, the advanced computer and communication technology that already exists in the Baltic region. Next, when the R&D in the ongoing technical progress is costly, there is a need to adapt new organizational forms which might lead to the higher utilization of innovation resources in the EU-Baltic industrial integration. Then, to

146
encourage skill spillovers in the learning economy via communication technology, there is a need for strong education institutional support in order to impact on innovation capabilities. Finally, the role of government policy is crucial for supporting such a learning process by keeping up the education institutions, incentives for education and creative destruction in education (labor mobility and retraining programs) and to keep the learning institution open for international integration.
5.6.2 Resource Capability Framework and R&D
Innovation-based Growth
For the functionality of the Baltic innovation system, the approach of innovation-based growth plays a critical role both at the industrial and the country level, and such growth would be appropriate also in the Baltic countries. This approach is extensively discussed for example in Baldwin (1989) and Grossman – Helpman (1994) that profit-seeking investments in technology improvements are at the noteworthy place during the sustainable long-run growth. They emphasize that the profit-motivated innovations are explained by the Schumpeterian pattern where technological know-how with the managerial skills clinches how the inputs are combined when creating new innovations. In other words, as Freeman (1994) puts it: “in Schumpeter’s theory, the ability and initiative of entrepreneurs, drawing upon the discoveries of scientists and inventors, create entirely new opportunities for investment, growth and employment.” Moreover, as found from Baldwin, the key point is that the emerging economies such as the Baltic countries earmark sufficient funds for R&D investments and restrict consumption until they reach the same R&D level as in the developed EU countries. Therefore one can see that, in the early era of the EU, it will be beneficial for the Baltic countries to concentrate on the R&D investments and postpone consumption.
Success in R&D, Technological Regimes and Innovation Systems
Grossman – Helpman (1994) maintain that the economic growth necessitates the process where the intermediate products are improved incessantly, and for such reason raises the productivity of final products. Such a tendency abides by the Schumpeterian pattern where successful new-innovated products, introduced by the new or existing firms, replace the previously innovated products, and they race to introduce a new generation of products depending on the characteristics of each industry. The only question is when and how will the Baltic industrial base undertake such a process?
147
An essential explanation for the resource capabilities of the Baltic countries might be found from the technological regimes. Such regimes are discussed by Nelson – Winter (1982), Winter (1984, 1987), Malerba – Orsenigo (1990, 1993) and Breschi et al. (2000), and they are classified as: firstly, cumulativeness of technical advances, which denotes an innovation activity that forms a mass of innovation stock and creates possibilities to spread to new technological fields, where the high level of cumulativeness is typical for economies with high continuity of innovations and increasing returns; secondly, high appropriability of innovations, which means broad resources for protecting innovations from imitation and for reaping profits from innovative activities and instead low appropriability gives the possibility for the widespread existence of externalities; next, high technologicalopportunities, which exist in those environments where incentives for new innovations are favorable and success in innovations is therefore plentiful; lastly, the properties of the knowledge base, which can be broadly examined by the role of basic vs. applied sciences. The basic sciences generate broad general knowledge for practical problems while, in contrast, applied sciences solve the problems naturally connected with the applied technologies.
Next we should explore the following question: what might be the guidelines for the Baltic countries? The relationship between the Schumpeterian pattern and technological regimes is defined and empirically tested with European patent data from Breschi et al. (2000). They divide the technological progress into two separate patterns, where first the Schumpeterian pattern is characterized as creative destruction with technological ease of entry and the measurable role of new entrepreneurs and firms in the innovation process. Second the Schumpeterian pattern is called creative accumulation with the prevalence of large established firms and the presence of relevant barriers to entry of new innovators. The results show that the sectoral patterns of technical change are related to the nature of the underlying technological regime. Instead, the pattern of creative destruction is related to low degrees of cumulativeness and appropriability, and high importance of applied sciences and to an increasing role for external sources of knowledge from the EU. The pattern of creative accumulation is related to high degrees of cumulativeness and appropriability, high importance of basic sciences and relative low importance of applied sciences as sources of innovation.
According to the experience of the 1990s, the Baltic industrial reorganization might follow the Schumpeterian pattern of creative destruction. We know that directly after the Baltic re-independency, the number of firms grew exponentially but only a minority of the firms survived, and such behavior has continued during the 1990s. The Baltic firm behavior is typical

148
for the Schumpeterian pattern where the birth and death of firms is extensive. One might claim that the suitable pattern for the innovation system in the Baltic countries is the model that supports creative destruction with the technological regimes where cumulativeness and appropriability are low but the role of applied sciences and externalities from the EU is high.
Technological Change, Externalities and Government Regimes
The literature of this approach is indeed broad and we present some main guidelines, which could be useful for the EU-Baltic integration. Hence this framework is adapted to the Baltic case by the research of several authors, for example, the surveys of Grossman (1990) and Cohen (1995), and also the research papers of Johnson – Gregersen (1995), Teece (1996) and Gregersen – Johnson (1997), who have discussed about the sufficient environments for interactive innovations. Several foundations can be applied for the EU-Baltic industrial integration as follows:
First, one might argue that the active improvements of the Baltic governmental regimes are crucial for fluent externalities, which are generated by the rapid entry of new technologies. Especially in the Baltic countries, the innovations need interactive R&D co-operation with the EU firms and technological programs, and without such adaptation of the Baltic institutions the growth of innovative activity might be moderate. The technological change is based on the new innovation-promoting regulations of the state. That is why the state’s role in the Baltic industrial integration into the EU is crucial for guaranteeing the functionality of intellectual property rights, patents, capital and labor market regulations and laws for efficient contracting between parties.
Second, the economy that has concentrated on the increasing force of learning and technological change should also revise the governmental regimes (Gregersen – Johnson 1997). As found directly after the re-independency of the Baltic countries, the traditional infrastructure investments such as energy and transport have already been finished or are in the home stretch. As the targets of industrial policy, these will become less important after their decreasing costs in the near future but for that reason the regimes should be focused more clearly on targets, by matching with the production sector, such as education, information technology, EU technical standards, applied research and other parts of the knowledge infrastructure.
Third, in relation to EU-Baltic technological co-operation, the benefits of the spillover effect are one of the clear externalities, and highly advisable for the Baltic firms because they might be the fastest way to mitigate the technology gap. Several studies such as Grossman (1990), Griliches (1991) and Nadiri (1993) support this relation of spillovers and firm performance.

149
According to their view, international dissemination of new ideas and technologies takes place by international industrial integration and through the operations of multinational corporations, and the spillover effect is positively related to efficiency gains both in intra-industry and inter-industry spillovers. Mowery – Rosenberg (1989) and Cohen – Levinthal (1989) among others demonstrate that firms need also their own R&D investments because these firms are, firstly, more capable of generating their own innovations and, secondly, of exploiting more intensively external knowledge. Instead, the free ride effect is, however, noticed to reduce their own R&D funding, as noted by Grossman (1990): “Intra-industry and inter-industry spillovers are found together with the substantial evidence that firms reduce their own R&D expenditures when the opportunity to free ride on others increases”.
Finally, the Baltic countries are dependent on the EU funding in R&D both at the public and the firm level. Grossman (1990) is helpful for discussing about the government’s role in funding of R&D. Most industrialized countries already subsidize R&D in the forms of direct government grants to universities and think-tanks for basic research, grants to firms for certain types of applied research. As indicated earlier in stage I, after the re-independency and privatization programs the Baltic countries still lacked the required finance in order to acquire their own R&D funding. Even if the privatization programs were carried out by the selling method, the urgent need to finance other targets from the budget such as the social and health sector meant that funds for the national R&D programs were absent. However, it might be more efficient to utilize the firm-specific R&D activity because, according to Grossman (1990), government-funded research has been substantially less productive than projects financed by the firms themselves.
As examined in stage II, the link between finance and R&D investments can be emerged both at the institutional and firm levels. First, at the institutional level, the key target for the governmental regime is to guarantee a stable and viable environment for the financial institutions. Teece (1996) points out that well-functioning capital markets should offer the multiple sources of funding, and in general, the R&D funding is basically based on the internal cash flow and new equity. This indicates that the Baltic stock markets are in a critical position by offering enough equity to be invested in the R&D of new product development because new firms had no internal cash flow. However, as earlier indicated, a snapshot from the Baltic stock markets appears to seem moderate. Since the beginning, the structure of the stock markets has been biased to shares of banking and service companies, and the investments to the industrial shares still seem to be low. Secondly, at the firm level, the capital market imperfections are replaced by the internal cash flow when possible, and therefore such a characteristic is typical for the large-scale

150
firms. On the other hand, SME firms are more active in using the R&D spending and it is growing with the cash flow, and an increase in their leverage reduces the R&D intensities (Hall 1990, Hao – Jaffe 1990). The difference between SME and large-scale firms is that SME firms finance their R&D by debt and larger firms use equity (Acs –Isberg (1991). This argument indicates that if the volatility of the Baltic stock markets is led by the shares of the banking or service sector and the equity capital in the industrial sector is low, then in these circumstances the banking sector should find resources to finance the R&D investments of the SME firms.
5.6.3 Organizational Structure for Human Capital and R&D
Firm Size, Integration of R&D Assets and Success in Innovations
When considering the success in innovations, the organizational form is crucial for creating the high-powered incentives for the management. First, clear implications for the role of the organizational form and size with respect to the success in innovations is discussed in studies such as Holmström (1989), Aghion and Tirole (1994) and Teece (1996). Holmström (1989) shows that the small-scale firms are more active in innovative research compared to large-scale firms. The reason for such an outcome is that the research is highly expensive and mixing innovative tasks with routines might lead more easily to the misallocation of research resources in the large-scale firms.
About the relation of the integration and intellectual inputs, the research supports flexible networks but not vertical integration. Aghion and Tirole (1994) have formed a model which emphasized the organization of R&D activity when contracts are incomplete. The model was based on the Grossman - Hart (1986) and they found several implications. First, if intellectual inputs dominate the incentives to innovate are higher when the research is allocated to the independent firms, and vice versa, the R&D activity is vertically integrated if the capital inputs dominate over the intellectual inputs. Second, if the multiple innovations emerge, then the property rights should be split based on their comparative advantage in creating value.
Moreover, Teece (1996) emphasizes that the formal and informal organizational structure is a more crucial determinant of innovation rather than only the product market structure. Complex forms of inter-firm agreements such as high-flex “Silicon Valley” and virtual –type firms might link their human resources & organizational capabilities, and lead to the higher rate and direction of innovations than traditional conglomerates and vertically integrated firms. The high-flex “Silicon Valley” and virtual-type forms might
151
be recommended with the Milgrom-Roberts (1995) type of lean and flexible manufacturing in production. Such manufacturing is well suited to circumstances where the production runs are short and changes in production are frequent. The resource capabilities needed are the skilled workers with cross-training of both parties and product development includes cross-functional teams, and the decision making is based on the local information and self-regulation. It is well known that the legacy of the centrally planned - mass production without competition - period was extremely different from these modern types: the cultural gap is enormous. Because of the insolvency of the centrally planned industrial structure and high investment costs of reconstructing it to suit the EU competitive environment, these new modes of production with the small-scale industrial structure are highly recommended. When the Baltic countries seek to adapt to commercial operations and production modes, the case could be completely the opposite, which avoids the contracts of generating the costs of the hold-up problem.
Managerial Incentives, Outsourcing and Resource Capabilities
During this section, we have shown guidelines, which might improve managerial incentives because they play the key role when analyzing the outsourcing costs. Lastly the managerial incentives and skills resolve the success or failure of matching partners. As known from Grossman – Helpman (2002b), the success of outsourcing is dependent on how to minimize searching costs, customization costs and distance in expertise by improving the incomplete contracts between parties. When resource capability framework is evaluated in conjunction with the outsourcing approach, this provides several arguments for the EU-Baltic industrial integration as follows:
Firstly, searching costs might be reduced subject to their capability to join the international co-operation. The first required step is the advanced computer and communication technology with the skilled employees in order to find a partner among the EU final producers to fulfill their practical skills in firm-specific training programs.
Secondly, the customization costs and the distance in expertise are closely connected to each other. The reduction of customization costs needs the managerial capabilities to innovate to pick up the right production processes as well as the high-skilled employees of R&D and trained assembly workers. The distance in expertise might be minimized by, firstly, rapid technological progress where the externalities through the EU-Baltic R&D programs, and with the EU-Baltic industrial integration are crucial by generating technology transfer and imitation; secondly, creative destruction with the technological regimes where cumulativeness and appropriability are low but the role of applied sciences and externalities from the EU is at pivotal importance. In

152
other words, in the EU-Baltic technological co-operation, the benefits of the spillover effect are highly advisable especially for the Baltic firms because it is the fastest way to mitigate the technology gap.
5.6.4 Specific Features about Governance for Innovation, Managerial Incentives and Contracting Environment after Stage III
This section examines the insights that might be useful to form a national innovation system for the Baltic counties in order to consider their joining the European Union. Several aspects are highlighted as follows:
1. High-skilled human capital and skill spillovers are the premises for the successful innovations and high-powered managerial incentives
High-skilled human capital is the strength of the Baltic innovation system. By furthering the progress of skilled human capital, the Baltic firms need close links with the high-technology EU firms and advanced EU technology programs. As is well known, the Baltic infrastructure already includes advanced computer and communication technology, which is needed for keeping up the learning economy paradigm, but it still requires, firstly, new organizational forms for the higher utilization of innovation resources in the EU-Baltic industrial integration, and secondly, strong support of education institutions in order to impact on innovation capabilities. That is the government policy that supports the advanced learning process by keeping up the education institutions, incentives for education and creative destruction in education.
2. Main guidelines for the resource capabilities of R&D are based on the technological regimes of creative destruction with EU externalities.
Based on our analysis, the suitable pattern for the innovation system in the Baltic countries is the model that supports creative destruction with the technological regimes where the role of applied sciences and externalities from the EU are in a key position. Baltic governmental regimes should be targeted for the rapid entry of new technologies, interactive R&D co-operation with the EU firms and technological programs. Moreover, the regimes should be focused more clearly on targets like education, information technology, EU technical standards, applied research and other parts of the knowledge infrastructure. The Baltic firms urgently need the R&D spillovers because it seems to be the fastest way to mitigate the technology gap. Finally, the Baltic countries are dependent on the EU funding in R&D both at the public and firm level. While large-scale firms can channel their cash flow and new equity to the R&D projects, the small-scale firms are more likely to finance their R&D

153
spending with debt. Therefore, in these circumstances the banking sector should find resources to finance the R&D investments of the small-scale firms. That is because small-scale firms are more active to create new innovations and without public funding the finance should be channeled through the EU technology programs or as a by-product of industrial integration via the EU final producers.
3. New Baltic industrial structure should be encouraged to create modern forms of organization and modes of production
As previously discussed, the SME firms are more active in innovative research compared to the large-scale firms. Therefore the small-scale industrial structure is again more appropriate than the large-scale structure. The reason for such outcome is that the research is very expensive and mixing innovative tasks with routines might lead more easily to the misallocation of research resources in the large-scale firms. Another reason for this comes from the intellectual inputs, which are crucial for outsourcing: if intellectual inputs dominate, the incentives to innovate are higher when the research is allocated to the independent firms. The innovation system should therefore be modern to encourage firms to form new modes of organization and production. The high-flex “Silicon Valley” and virtual-type of organization modes might be recommended with the lean and flexible manufacturing in production.
Moreover, managerial incentives play a central role when analyzing the outsourcing costs. Searching costs might be reduced subject to whose capability to participate in the international co-operation. When advanced computer and communication technologies are in efficient use, the management should fulfill the practical skills of the employees in the firm-specific training programs. Then, the customization costs rest on the managerial capabilities to innovate and pick the right production processes, and on the skill-biased employees of R&D and trained assembly workers. The distance in expertise might be minimized by the externalities through the EU-Baltic R&D programs, while the EU-Baltic industrial integration is crucial for generating technology transfer and imitation through the externalities.
5.7 Summation of the EU-Baltic Innovation System
Baltic Industrial Reorientation, Outsourcing and FDI: Main Foundations.
The Baltic industrial comparison shows that the Baltic success in competition and reorientation to the EU markets seems narrow. It rests mainly on the human capital-intensive electronics and telecommunication industry. Conceivably, the human capital-intensive electronics industry contains the clearest opportunities for

154
industrial integration with the EU companies. However, the broader success might be reached by the low labor costs and hand-made skills in industries such as the food processing, textiles, machinery and wood industries. The leading country is Estonia followed by Latvia, while Lithuania’s industrial capacity seems to be the lowest.
When considering outsourcing, the Baltic countries have achieved only a half percent share of the EU total imports in intermediate products of machinery and transport equipment in 2000. The neighboring effect seems significant because the most significant outsourcing partners with the Baltic companies can be found from Finland and Sweden. More than two-thirds of the Estonian intermediate exports to Finland consist telecommunications equipment parts, and the role of Swedish industrial relations has increased since 1995. In addition, Latvian industry has lost its position with Germany but increased the industrial integration with Sweden and Finland especially in telecommunication parts and components. Finland is the second largest intermediate product importer from Latvia after Germany. Swedish industry has a central role in Lithuania and Swedish outsourcing to Lithuania includes intermediate products to transporting and electronic machinery.
STAGE I
Macroeconomic Stabilization & Privatization: A First but not Complete Step.
The Baltic countries have followed the basic neoclassical path by stabilizing their macroeconomic environment. As a result, Estonia, Latvia and Lithuania have followed the proportionally contracted macroeconomic policy which has led to low inflation, stopped their output from falling and redirected it to the growth path, as well as stabilized their new currencies. Such stabilization was needed but it was only a basis for the industrial reorganization.
Over-sized Industrial Structure and no Domestic Wealth.
When considering an efficient industrial structure for innovation in the Baltic countries, the over-sized industrial firms compared to the size of the economy formed the high barriers to strengthen the flexibility, competitiveness and innovativeness of the SME industry.
We suggest that the direct sales used Estonia and partly Latvia as a primary privatization method were the most efficient way to split up these monopolies and find quick solutions with help of the foreign investors to restructure the viable part of the industry. The weakness of the Lithuanian privatization method seemed obvious because the government was unable to collect any funds for the purpose of supporting the technology transfer or emerging firms.
However, the privatization process is incomplete for solving the governance process in production and success for innovation. When considering the

155
relation between the various privatization methods and a firm’s willingness to innovate, our outlook seems as follows. Privatization determined the basic rules to build up such governance inside the firms that might lead to the successful innovations, but it was unable to solve the governance approach itself. Comparing several privatization methods, the direct sale method seems the most appropriate to change such an infrastructure the most rapidly. The voucher method seems inappropriate because it neglected to collect urgently needed financial funds and restructuring the financial institutions such as capital markets is time-consuming.
To analyze the relationship between the shortcomings in finance (absence of capital markets, soft budget problem, bad debt, bankruptcy procedures and validity of foreign investors) and innovative activity, then the direct sale method gives also the quickest way to find solutions to this approach.
Financial Governance and Politicians in Power.
As a result of the Baltic privatization programs, we infer that the influence of politicians was largest in Lithuania, where the privatization turned out to be less efficient. Instead, in Latvia and Estonia, a direct sale method produced quickly the independently working firms and it follows that a direct influence of the state officials on the firms’ decision-making decreased radically. Moreover, let us consider the claim that politicians are constrained in making decisions that are politically sensitive, for example, by increasing unemployment. It seems that this claim has no evidence at least in Estonia, where the unemployment has decreased gradually, even if both in Lithuania and Latvia, it appears to stay at a relatively high level.
Financial Governance, Share Dispersion and Absence of Financial Institutions: Bank-based or Stock-based Financial Structure?
We maintain that a sound structure of financial institutions is a cornerstone for the Baltic innovation activity. We claim that the banking sector and foreign investors are the main sources for the Baltic firms. However, FDI mostly directed to the Visegrad countries and the small size of the domestic markets and rare domestic investors restricted the funds available. In addition, the direct sales privatization method solved the ownership dispersion problem in Estonia and Latvia but the situation might be more complex in Lithuania, where the investment voucher was the main privatization method. Even if it solved the dispersion problem, it has created a new one. Without the voucher method the availability of tradable shares stays more moderate in the Baltic stock markets than in the Visegrad stock markets. In spite of this, the average weekly returns are at the average level when comparing them to the Visegrad stock markets or even to the Western stock markets, even if the Baltic market thinness with the high standard deviation in returns seems evident.

156
Financial Governance and Financing Imperfections.
In the Baltic countries, the soft budget constraint worked through the centrally planned product chain where, at the end of the command economy, the Baltic firms started to lack the required inputs to finalize their products. The soft budget constraint created the financial crisis because they were unable to obtain payments from other parts mainly from the Russian federation. Therefore, the Baltic firms suffered from the soft budgets but they were not creating the dilemma themselves.
There was one specific risk when using the bankruptcy procedure for the Baltic firms. In the beginning of the transition, most of the incapable firms were closed down. This process showed that the property of the firm was sold out to the Western countries at scrap value and employees disappeared to the other sectors. Such a process was a good example that the transition might lead to a rapid meltdown by cutting also the value of the better-functioning firms. For this reason, the bankruptcy procedure was recognized as the last measure because, with the bad debt problem, it would cause a large-scale crisis for the whole economy since the value mechanism of assets was under development. Therefore we propose that this instrument would give the right for the investors to close down the poor parts and then reorganize the more innovative parts of the firm. Market forces, competition and the threat of the bankruptcy together would be an efficient method for the governance in the Baltic countries.
Financial Governance and Foreign Investors.
In general, the reform programs carried out for example in Estonia led to the conclusion that the role of foreign investors seemed to be a remarkable cornerstone in the Estonian industrial restructuring process and they played a pronounced role especially in installing in the large-scale privatization. Therefore, the Estonian reform turned out to be a successful procedure for finding the core investors abroad, which could have been helpful in installing the new methods of corporate governance and managerial incentives as well as exposing Estonian firms to marked-based information, know-how and innovation networks. Such a policy is recommendable also to Latvia and especially to Lithuania even if there is a concern that, in the large-scale privatization, the foreign investors might own the most viable part of the industry while the less competitive parts of the firms stay in state hands.
STAGE II
Institutional Framework and Tools for the Governance in Production.
Managerial incentives set the governance in production. We propose that the goal of the EU and Baltic outsourcing firms is to minimize the searching and
157
customization costs, and the gap in technological expertise. To reach this goal we establish that the searching costs are mostly born from the institutional infrastructure and instead the firms themselves handle the customization costs by improving their incomplete contracts.
Step-by-step Institutional Reconstruction face Informal Constraints.
We have found out that Baltic institutions should be created in a spontaneous way and by taking into account the needs of the ever-changing and evolutionary transition process, and especially by breaking down informal constraints.
Quality of Legal System is a Key Signaling Procedure.
We claim that this approach is more than just to guarantee legally each other’s obligations, and therefore it has also the signaling effect to the EU-Baltic integrating partners. The opinions above clearly suggest that a functioning legal system acts as a critical element for supporting the efficient, competitive and durable entrepreneurship. One difficulty between the Baltic and EU firms was the discrepancy in corporate law. With help of foreign expertise, the Baltic countries have been active to re-adopt their centrally planned laws at the commercial, financial and economic fields but they also adopted completely new market-based laws. Furthermore, they have actively harmonized their legislation with respect to the Internal Market of the European Union.
In general, the involvement of the free trade agreement improved the quality of the legal system. When considering the competitive viewpoints, the lowering of the trade barriers and allowing more liberal competition enhanced the progress of the privatization. The Baltic countries have taken an active part in negotiating their new trade agreements but in the future they will need more education and training to facilitate the negotiation procedures with the EU and with other international organizations. The Baltic countries have successfully built the trade links with the rest of the world through a set of trade agreements such as GSP, MFN, “Europe agreements”, WTO and finally their EU accession procedures.
In sum, the Baltic countries had chosen rather free regulations in the international trade, which is a positive signal for further trade and industrial relations between the EU and Baltic firms. After joining the EU, it will be the training process and more education and training are needed so that the Baltic countries can utilize the advantages of the enlarged Europe.
Functional Institutional Framework has a Positive Impact on Outsourcing Costs and Distance in Expertise.
This argument works with two indirect channels. The first is that the government can be active in building the serviceable communication

158
infrastructure that reduces the searching costs in contracting between parties. When the industrial activity in the Baltic countries is concentrated around their capitals (Riga, Tallinn and Vilnius), this means there are advantages in building infrastructure such as airports, accommodation and telecommunication around these regions. Owing to their geographical location, the Baltic countries have functioning transport connections via the Baltic Sea. The location is favorable for transit traffic both in the east-west direction to Russia as well as in the north-south direction between Northern and Central Europe.
Another channel for reducing customization costs and distance in expertise rests on the workable education and R&D policy. As regards the advantages of the Baltic education level, according to ISCED standards, university-level teaching is considered as being theoretically advanced and capabilities in natural sciences and some fields of engineering are strong. Possible mechanisms of retraining are apprenticeship programs, joint research projects of firms and universities as well as firms’ own training programs in areas such as industrial processes and material handling, accounting and techniques of quality management. Co-operation in education systems can be developed internationally so that the Baltic workers could be trained in Western companies abroad.
As indicated above, the R&D policy including technology transfer offers one of the needed institutional frameworks for the diffusion of technology in the Baltic firms. There is still an urgent need for the institutions to support R&D activities, and education was and still is essential to enforce consolidation of labor-market institutions, skill-adjustment, technology transfer and industrial R&D because the highly educated R&D personnel is disappearing to the other sectors. Then Baltic governments have an increasing challenge after joining the EU to support new R&D investments in the emerging industrial fields and form the training programs to the new R&D directions. The co-operation and participation with the EU as well as international scientific-technical co-operation and training programs might be the cornerstone of Baltic R&D success in the near future. The final goal is to create their own industrial identity so as to produce their own final products for the enlarged EU markets.
As can be found from the Baltic industrial integration process, the SME Baltic firms benefit from the technological progress when they subcontract with the large-scale multinationals which have already gone through the international competitive pressure. That is, the Baltic firms cannot stay in a passive role during the integration process because they should take an active role to form their own industrial identity. Even if some parts, such as the Baltic electronics, have been proclaimed as one of the flagships of the
159
centrally planned industrial base, most of the Baltic production machinery still needs new technological investments because the ongoing technology fails to fulfill the western quality and productivity levels.
STAGE III
The quality of schooling rather than quantity is one of the main sources of the long-rate growth.
We suggest that in Baltic circumstances the endogenous growth effect might work: a small open economy with slightly higher human capital than in the rest of the world starts to trade with the intermediate goods, its investment in human capital can give an ever-increasing impact on growth. We argue that, in the Baltic countries, the advantages of EU industrial integration might be higher than the effects of integration in the EU countries, because small economies are more flexible to adapt R&D-intensive production compared to larger applying CEE economies.
High-skilled Human Capital is a Key Resource in the EU-Baltic Integration.
Such a tendency is a signal to Baltic firms that skilled personnel act as a key factor in the EU outsourcing process and this generates the final producers’ incentives to search for their conceivable partners from such a region, and Baltic firms might be better off by finding more profitable contracts with the EU final producers.
Skill Spillovers Need a Critical Mass.
When the successful spillovers take place in regions in which similar types of firms work as clusters, the Baltic capitals, Tallinn, Riga and Vilnius, fulfill such a purpose. However, to become such a regional cluster the learning economies or regions need international R&D integration and in that way cross-border skill spillovers. Baltic institutional change should move towards such a learning economy and clustering industries with high rate of knowledge turnover and fast change in total knowledge stock.
Success in R&D might be found from Technological Regimes and EU-Baltic Innovation Systems.
We maintain that the suitable pattern for the innovation system in the Baltic countries is the model that supports creative destruction with the technological regimes where cumulativeness and appropriability are low but the role of applied sciences and externalities from the EU is found to be remarkable.
Externalities might be helpful with rapid technological change and EU-Baltic Co-operation both at the Institutional and Firm Level.

160
Especially in the Baltic countries, the innovations need interactive R&D co-operation with the EU firms and technological programs, and without adaptation of the Baltic institutions the growth of innovative activity might be moderate. The co-operation should be focused more clearly on targets that match with the production sector, such as education, information technology, EU technical standards, applied research and other parts of knowledge infrastructure.
In relation to EU-Baltic technological co-operation, the benefit of the spillover effect is one of the clear externalities, and highly advisable for the Baltic firms because it might be the fastest way to mitigate the EU technology gap. As found above, international dissemination of new ideas and technologies takes place by international industrial integration and through the operations of multinational corporations, and the spillover effect is positively related to efficiency gains both in intra-industry and inter-industry spillovers.
Finance of R&D Projects is in a Pivotal Position.
After the re-independency and privatization programs the Baltic countries still lacked the required finance in order to acquire their own R&D funding. Even if the privatization programs were carried out by the selling method, the urgent need to finance other targets from the budget such as the social and health sector meant that funds for the national R&D programs were absent. We know from the Western markets that well-functioning capital markets should offer multiple sources of funding, and in general, the R&D funding is mainly based on the internal cash flow and new equity. This indicates that the Baltic stock markets are in a critical position by offering enough equity to be invested in the R&D of new product development because new firms had no internal cash flow. However, as earlier indicated, because of the imperfections in the Baltic stock markets where the equity flows to offer the needed funding to the industrial sector, then in these circumstances the banking sector should find resources to finance the R&D investments of the SME firms.
The Organizational Framework should be based on the High-Flex and Virtual Type of Forms with Lean and Flexible Manufacturing in Production.
Our analysis indicates that the SME firms are more active in innovative research compared to large-scale firms. About the relation of the integration and intellectual inputs, the research finds indications against vertical integration and for flexible networks. The high-flex “Silicon Valley” and virtual type of forms might be recommended with the lean and flexible manufacturing in production. Such manufacturing is well suited to circumstances where the production runs are short and changes in production are frequent. When the Baltic countries seek to adapt to commercial operations

161
and production modes it could be completely the opposite, which avoids the contracts of generating the costs of the hold-up problem.


163
6 CONCLUSIONS
Much attention has been focused on the research to provide evidence for the disintegration of production, defining it as “production sharing”, “external orientation“, “intra-product specialization” or “vertical industrial specialization” at the country level by the trade shares or vertical trade chains of production. Despite this, less attention has been paid to the determinants of the organizational structure or industrial environment where these firms operate. The concepts such as “governance costs”, “asset specificity” or “hold-up problem” found from contracting theory have been poorly connected to the theory of disintegration of production. The advantage of three studies of Grossman and Helpman (2002a, b, c) is that these papers show a theoretical background how these contracting and transaction cost theory parameters would affect the firms’ outsourcing decisions. Our purpose in this study is to find empirical support for these theoretical findings. Our results are as follows.
The second chapter investigates how the degree of competition pushes industrial firms to organize their “make-or-buy” decisions. We use the model by Grossman and Helpman (2002a) to test an unlinear relationship between the degree of competition and outsourcing. The methodology used offers some empirical results in order to find more conclusive explanations between the vertical product differentiation and outsourcing. The results show that there is an inverted U-shaped relationship between the degree of competition and outsourcing both in the OECD and EU industries. Also outsourcing is less viable in the “thick” market because the industries from the big countries are more likely to find their partners from the home market than abroad.
The third chapter presents empirical implications of the theoretical study by Grossman and Helpman (2002b). The theoretical part investigates the determinants that might affect the location of the subcontracted activity in a general equilibrium model of outsourcing and trade. The key element to focus on our empirical analysis was the relationship between outsourcing and customization costs: the stock of human capital and R&D, wages and the thickness of the market. We have tested this relationship in industries with middle range R&D expenditures where the outsourcing activity is highest: machinery and transport equipment. The main empirical findings are as follows: first, the level of human capital and R&D expenditures has a positive impact on outsourcing; second, the level of basic education and human capital in R&D have a positive relationship with the ratio of outsourcing to the

164
sector’s production; third, the level of R&D expenditure and human capital in R&D has a positive relationship with the ratio of outsourcing to the sector’s total trade; fourth, the level of human capital and R&D expenditures has a strong positive relationship with the market shares reached in outsourcing and the role of R&D has become highly significant during the 1990s; fifth, thick markets have a positive impact on outsourcing; next, the results of regional orientation in outsourcing show that it occurs between and within the developed OECD and APEC countries and developing ASEAN and APEC countries; and finally, outsourcing is pervasive between high-wage countries.
The fourth chapter compares whether FDI or outsourcing is more influenced by the differences of the productivity levels and the labor costs in the EU countries. The basis for the empirical evidence is the theoretical model of Grossman-Helpman (2002c), which analyzes the trade-off between FDI and outsourcing in the equilibrium model. Our estimations gives empirical support to this theory by providing evidence that the outsourcing industries are more sensitive to the changes in productivity and the adjustments of the labor costs than the vertically integrated industries with FDI.
The fifth chapter utilizes the main findings of the Grossman-Helpman (2002a, b, c) studies and connects them to the principal-agent model, the institutional economics and the EU outsourcing to the East. Traditional analyses of economic transition in the CEE countries link the industrial reconstruction only to macroeconomic stabilization, privatization and overall institutional improvements. Focusing on the Baltic countries, we carry out a deeper analysis of the industrial reconstruction by stressing that both governance of financial assets and governance in production together are essential to a sustainable contracting environment in order to facilitate innovative activity in the Baltic countries. We claim that special features solved in financial governance enabled the Baltic countries to carry out the governance in production. We further emphasize that, in the EU-Baltic innovation system, the key aim of the governance in production is to match existing human capital and technology by increasing the rate of innovations. The goal of such behavior, that is, survival in the future enlarged EU market competition, is provided only when the contracting environment with the EU firms and foreign direct investments are assured.

165
ABSTRACT
This thesis investigates both the regional and global aspects of outsourcing in production. The theoretical part of the study is based on contracting theory, the principal-agent model and institutional economics. The study include two parts, the first of which addresses the role of competition, human capital and R&D to outsourcing decisions in the global economy, and the second part concentrates on outsourcing in the EU; FDI versus outsourcing decisions, and the EU-Baltic innovation systems in the EU outsourcing to the East. Chapter 2 presents new empirical evidence regarding whether a certain level of competition in the machinery and transport industries increases the probability to outsource or not, and compares the results between the EU and OECD countries. It shows that there is an inverted-U shape relationship between the degree of competition and outsourcing. That is, in highly competitive markets, outsourcing will require a large per-unit cost advantage for specialized input producers compared to vertically integrated producers. Therefore, with strong competition, outsourcing is unlikely because it would require a huge cost disadvantage for an integrated firm. It also indicates that high R&D expenditures generates information inside the firm that is sensitive to outsource. On the contrary, with little competition, cost differences or pricing inefficiencies do not matter much and outsourcing is unlikely because it would entail huge governance costs associated with integration. It was first time estimated in this study how differences in R&D expenditures in the industrial branch-level might relate to the competition circumstances in outsourcing. Chapter 3 examines how firms’ outsourcing decisions are related to the country characteristics, i.e. the level of human capital and R&D. The empirical testing includes the machinery and transport industries from 70 countries and several trade and other country groups in the years 1985-2000. This outsourcing data estimated in chapters 3 and 4 is unique and it was first time used in such testing. It was highly laborious to build up and hand-made by the author himself. The main finding of chapter 3 is that both investment in human capital and technology may increase the country’s ability to survive in the international outsourcing process. The trade of intermediate products is most evident between and within the developed OECD and APEC countries and developing ASEAN and APEC countries. Chapter 4 emphasizes whether intermediate production is carried out by FDI or outsourcing. The choice between these modes of organization is based on the labor cost and

166
productivity differences. In the outsourcing mode, the production is more efficient but the contracts are incomplete. Alternatively, the FDI mode is more secure because the production process can be controlled inside the firm but the hierarchy of controlling such process spurs more transaction costs. Our analysis shows that the outsourcing mode is more sensitive to labor cost and productivity differences than the FDI mode. This is a pioneer study that explores outsourcing by using such extensive data and so broad set of the country characteristics as found from the chapters 3 and 4. Chapter 5 combines the features of outsourcing theory, the principal-agent model and institutional economics, and gives the guidelines how the firms in the Baltic countries might survive in the enlargened EU markets. Such guidelines are presented in three stages to demonstrate an institutional system framework connecting financial governance, the governance in production and the governance of innovation in order to enhance the principal and managerial incentives for higher innovative activity in the enlargened EU-Baltic industrial integration.

167
TIIVISTELMÄ
Tämä väitöskirja tarkastelee ulkoistamisen alueellisia ja globaaleja vaikutuksia teollisuustuotannossa. Tutkimuksen teoreettinen osa perustuu sopimus-teoriaan, päämies-agenttiteoriaan ja institutionaaliseen taloustieteeseen. Se sisältää kaksi osaa joista ensimmäinen osa selvittää kilpailun roolia sekä inhimillisen pääoman ja t&k-panostuksen vaikutusta ulkoistamiseen globaalissa taloudessa ja toinen osa keskittyy tuotantomuodon valintaan suorien sijoitusten ja ulkoistamisen välillä EU:ssa sekä EU:n ja Baltian maiden innovaatiojärjestelmiin siinä tapauksessa että EU laajenee itään. Toinen luku esittää empiirisiä tuloksia, kuinka tietty kilpailun taso teollisuuden toimialoilla joko lisää tai vähentää ulkoistamisen todennäköisyyttä ja vertailee tuloksia EU- ja OECD-maissa. Tulokset osoittavat, että kilpailun asteen ja ulkoistamisen välistä suhdetta kuvaa alaspäin avautuva U-muotoinen käyrä. Tämä tarkoittaa, että kilpailun asteen ollessa korkea komponenttien valmistuksessa ulkoistaminen vaatisi pitkän etumatkan yksikkökustannuksissa verrattuna vertikaalisesti integroituun tuotantoon. Siksi ulkoistaminen on epätodennäköistä, koska se tuottaa selvästi suuremmat kustannukset kuin integroitu tuotanto. Tämä myös indikoi, että suuret t&k-menot generoivat yritykseen sellaista osaamista, joka halutaan pitää yrityksessä omana tietona eikä sitä haluta ulkoistaa. Toisaalta kun kilpailu on vähäistä kustannuserot tai hinnoittelun tehottomuudet eivät merkitse ja myöskään tässä tapauksessa ulkoistaminen ei kannata koska se tuottaisi suuremmat hallinnointi-kustannukset kuin integroitu tuotanto. Tämä tutkimus valottaa ensimmäistä kertaa kuinka erot t&k-menoissa toimialatasolla vaikuttavat ulkoistamisen kilpailuolosuhteisiin. Kolmas luku tutkii maiden ominaispiirteiden vaikutuksia yritysten ulkoistamispäätöksiin. Tässä tarkastelussa nämä ominaispiirteet ovat maan inhimillisen pääoman ja t&k-panostuksen taso. Empiirinen testaus on tehty 70 maan konepaja- ja elektroniikkateollisuuden sekä kulkuneuvojen tuotannon aineistolla vuosina 1985-2000, mihin on lisätty mm. kaupparyhmien vaikutus. Tutkimuksen luvuissa 3 ja 4 käytetty ulkoistamisaineisto on ainutlaatuinen ja sen työstämiseen käsintehtynä kului paljon aikaa. Tulosten mukaan sekä panostukset humaaniin pääomaan että t&k-toimintaan lisäävät maahan kohdistuvaa ulkoistamishalukkuutta. Lisäksi välituotteiden kauppa osoittautui suurimmaksi kehittyneiden OECD- ja APEC-maiden välillä sekä kehittyvien ASEAN- ja APEC-maiden välillä. Luku 4 selvittää, mitkä tekijät vaikuttavat siihen, hankitaanko välituotteet joko suorilla sijoituksilla vai
168
ulkoistamalla. Tätä valintaa testattiin työvoimakustannus- ja tuottavuuseroilla. Teorian mukaan ulkoistamalla saavutetaan tehokkaampi tuotanto, mutta sopimusten epätäydellisyys tekee siitä epävarmemman. Vertikaalinen integraatio suorien sijoitusten kautta on varmempaa, koska toimituksiä yrityksen sisällä voidaan tehokkaammin valvoa, mutta valvonnan hierarkia aiheuttaa suuremmat liiketoimikustannukset. Analyysimme osoittaa, että valita ulkoistaminen tuotantomuodoksi on herkempi työvoimakustannusten ja tuottavuuden eroille kuin valita vertikaalinen integraation tuotantomuoto. Kyseistä tutkimusta ei ole aikaisemmin tehty, jossa ulkoistamista näin laajalla aineistolla empiirisesti tutkitaan ja jota tarkastellaan näin laajalla maiden ominaispiirteiden aineistolla kuten luvuissa 3 ja 4 ilmenee. Luku 5 yhdistää tutkimuksessa esitetyt ulkoistamisteorian löydökset, päämies-agenttimallin ja institutionaalisen taloustieteen tarjoamalla arvioita kuinka Baltian maiden yritykset selviävät laajenevilla EU:n markkinoilla. Nämä suuntaviivat esitetään kolmivaiheisena mallina demonstroimalla institutionaalinen järjestelmä, joka yhdistää rahoituksen, tuotannon ja innovaatioiden hallintojärjestelmät. Näiden tarkoituksena on kannustaa omistajia ja johtajia korostamaan innovaatioiden merkitystä laajenevassa EU:n ja Baltian maiden välisessä teollisuuden integraatiossa.

169
REFERENCES
Abraham, K. – Taylor S. (1996) Firm’s Use of Outside Contractors: Theory and Evidence. Journal of Labor Economics, 14.
Acs, Z. – Isberg S. (1991) Innovation, Firm Size and Corporate Finance, Economic Letters, 35.
Aghion, P. – Blanchard O. – Burgess R. (1994) The Behavior of State Firms in Eastern Europe, Pre-privatization. European Economic Review,38.
Aghion, P. – Dewatripoint, M. – Rey P. (1994) Renegotiation Design with Unverifiable Information, Econometrica, 62.
Aghion, P. – Howitt P. (1992) A Model of Growth Through Creative Destruction, Econometrica, 60.
Aghion, P. – Tirole J. (1994) The Management of Innovation, Quarterly Journal of Economics, 109.
Alchian, A. – Demsetz H. (1972) Production, Information Costs, and Economic Organization, American Economic Review, 62.
Alen, C. – Gasiorek M. – Smith A. (1998) The Competition Effects of the Single Market in Europe, Economic Policy.
Amiti, M. – Wakelin K. (2002) Investment Liberalization and International Trade, CEPR Discussion Papers No. 3492.
Van Arkadie, B. – Karlsson, M. (1992) Economic Survey of the Baltic States;Ministry of Foreign Affairs, Sweden. Published and printed by Printer publishers Ltd., London.
Audet, D. (1996) Globalization in the Clothing Industry, In Globalization of Industry: Overview and Sector Reports, OECD.
Baldwin, R. (1989) The Growth Effects of 1992, Economic Policy, 9.Baldwin, R. – Martin, P. (1998) Two Waves of Globalization: Superficial
Similarities, Fundamental Differences. Paper presented at the Kiel Conference on Globalization and Labor, Kiel, June 1998.
Barro, R. – Sala-i-Martin X. (1995) Economic Growth, New York, McGraw-Hill.
Berg, B. (1997) Estonian Industry as a Part of European Industrial Structure, in Berg (ed.) Estonian Economy and European Integration, ETLA C 75; Helsinki, Finland.
170
Berman, E. – Bound, J. – Machin, S. (1998) Implications of Skill-Biased Technological Change: International Evidence, Quarterly Journal of Economics, 113 (4).
Bernstein, J. – Nadiri, M. (1989) Research and Development and Intra-Industry Spillovers: An Empirical Aplication of Dynamic Duality, Review of Economic Studies, 56.
Bhagwati, J. – Dehejia, V. (1994) Freer Trade and Wages of the Unskilled – Is Marx Striking Again? In Bhagwati – Kosters, eds. Trade and Wages: Leveling Wages Down? The American Enterprise Institute Press: Washington.
Blanchard, O. (1990) Reform in Eastern Europe, Cambridge, Mass. Blanchard, O. – Giavazzi, F. (2001) Macroeconomic Effects of Regulation and
Deregulation in Goods and Labour Markets, CEPR Discussion Papers No. 2713.
BOFIT (2002) Bank of Finland, Institute for Economies in Transition, Reviews.
Borenstein, E. – Kumar, M. (1990) Proposals for Privatization in Eastern Europe, IMF Staff Papers, vol. 38, 2.
Bouin, O. (1993) Privatization in Czechoslovakia, in Ramanadham (ed.), Privatization, A Global Perspective.
Boycko, M. – Schleifer, A. – Vishny, R. (1993) Privatising Russia, Brooking Papers on Economic Activity, 2.
Breschi, S. – Malerba, F. – Orsenigo, L. (2000) Technological Regimes and Schumpeterian Patterns of Innovation, The Economic Journal,110.
Campa, J. – Goldberg, L. (1997) The Evolving External Orientation of Manufacturing Industries: Evidence from Four Countries, NBERWorking Paper 5958.
CCET (1994) Trends and Policies in Privatization, OECD, Paris. Coase, R. (1937) The Nature of the Firm, Economica 4. Coe, D. – Helpman, E. (1995) International R&D Spillovers, European
Economic Review, 39. Cohen, W. (1995) Empirical Studies of Innovative Activity, in Stoneman
(ed.), Handbook of the Economics of Innovation and Technological Change, Blackwell, Oxford.
Cohen, W. – Levinthal, D. (1989) Innovation and Learning: The Two Faces of R&D – Implications for the Analysis of R&D Investment, Economic Journal, 99.

171
Conyon, M. – Girma, S. – Thompson, S. – Wright, P. (1999) The Impact of Foreign Acquisition on Wages and Productivity in the UK Centre for Research on Globalisation and Labour Markets, ResearchPaper 99/8.
Cowling, K. (1990) A New Industrial Strategy, International Journal of Industrial Organization, 8, North-Holland.
Dalum, B. – Johnson, B. – Lundvall B. (1992) Public Policy in the Learning Economy, in Lundval, (ed.), National Systems of Innovation, London.
Davies, S. – Lyons, B. (1996) Industrial Organization in the European Union – Structure, Strategy, and the Competitive Mechanism, Clarendon Press, Oxford.
Dixit, A. – Stiglitz, J. (1977) Monopolistic Competition and Optimum Product Diversity, American Economic Review.
Domberger, S. (1998) The Contracting Organization – A Strategic Guide to Outsourcing, Oxford University Press.
Dosi, G. (1990) Finance, Innovation and Industrial Change, Journal of Economic Behavior and Organization, 13.
Driffield, N. (1996) Global Competition and the Labour Market, Reading, Harwood.
EBRD (2000) Transition Report 2000; Employment, Skills and Transition,European Bank for Reconstruction and Development.
Edwards, J. – Nibler, M. (2000) Corporate Governance in Germany: the Role of Banks and Ownership Concentration, Economic Policy.
Emmerij, L. (1992) Globalization, Regionalization and World Trade, The Columbia Journal of world Business, Summer 1992.
European Economy (1994) Private Capital Flows to CEE’s and NIS, No. 3. Fagerberg, J. (1996) Technology and Competitiveness, Oxford Review of
Economic Policy, Vol. 12, No. 3. Fagerberg, J. – Verspagen, B. – Caniels, M. (1997) Technology, Growth and
Unemployment across European Regions, Regional Studies, Vol. 31.
Fama, E. – Jensen, M. (1983) Separation of Ownership and Control, Journal of Law and Economics, 26.
Feenstra, R. (1998) Integration of Trade and Disintegration of Production in the Global Economy, Journal of Economic Perspectives, Vol. 12, 4.
Feenstra, R. – Hanson, G. (1996) Foreign Direct Investment, Outsourcing and Wage Inequality, NBER Working papers No. 5424.
172
Feenstra, R. – Hanson, G. (1999) The Impact of Outsourcing and High-Technology Capital on Wages: Estimates for the United States, 1979-1990. The Quarterly Journal of Economics, August.
Foss, N. (1997) Incomplete Contracts and Economic Organization: Brian Loasby and the Theory of the Firm. DRUID Working Paper No. 97-11.
Franks, J. – Mayer, C. (1990) Corporate Ownership and Corporate Control: A Study of France, Germany, and the UK, Economic Policy, 10.
Freeman, C. (1994) Innovation and Growth, in Dodgson – Rothwell (eds.), The Handbook of Industrial Innovation, Cornwall.
Frydman, R. –Phelps, E. – Rapaczynski, A. – Schleifer, A. (1993) Needed Mechanisms of Corporate Governance and Finance in Eastern Europe, Economic of Transition, vol. 1(1).
Frydman, R – Rapaczynski, A. (1990) On Privatizing Privatization: A New Proposal of Ownership Transformation in Poland, mimeo.
Frydman, R – Rapaczynski, A. (1991) Privatization and Corporate Governance in Eastern Europe: Can a Market Economy be Designed? in Winckler (ed.), Central and Eastern Europe Roads to Growth.
Frydman, R. – Rapaczynski, A. (1993) Insiders and the State: Overview of Responses to Agency Problems in East European Privatizations, Economic of Transition, vol. 1(1).
Geroski, P. – Jacquemin, A. (1985) Industrial Change, Barriers to Mobility, and European Industrial Policy, Economic Policy, 1.
Goodhart, C. (1994) Banks and the Control of Corporation, Economic Notes by Monte dei Paschi di Siena, 23.
Gray, C. (1996) In Search of Owners: Privatization and Corporate Governance in Transition Economies, The World Bank Research Observer,vol. 11.
Gregersen, B. – Johnson, B. (1997) Learning Economies, Innovation Systems and European Integration, Regional Studies, 31.
Griliches, Z. (1991) The Search for R&D Spillovers, NBER Working paperNo. 3768.
Griliches, Z. – Mairesse, J. (1984) Productivity and R&D at the Firm Level, In Z. Griliches ed. R&D, Pattents and Productivity, Chicago: University of Chicago Press.
Groenewegen, J. (1997) Institutions of Capitalism: American, European, and Japanese Systems Compared, Journal of Economic Issues, June.
Grosfeld, I. (1994) Financial Systems in Transition: Is There a Case for Bank Based System? CEPR Discussion Paper No. 1062.

173
Grossman, G. (1990) Promoting New Industrial Activities: A Survey of Recent Arguments and Evidence, OECD Publications.
Grossman, G. – Helpman, E. (1991a) Innovation and Growth in the Global Economy, The MIT Press, Cambridge.
Grossman, G. – Helpman, E. (1991b) Quality Ladders in the Theory of Growth, Review of Economic Studies, LVIII.
Grossman, G. – Helpman, E. (1994) Endogenous Innovation in the Theory of Growth, Journal of Economic Perspectives, 8.
Grossman, G. – Helpman, E. (2002a) Integration versus Outsourcing in Industry Equilibrium; Quarterly Journal of Economics, 117.
Grossman, G. – Helpman, E. (2002b) Outsourcing in a Global Economy, CEPR Discussion Papers No. 3165.
Grossman, G. – Helpman, E. (2002c) Outsourcing versus FDI in Industry Equilibrium, CEPR Discussion Papers No. 3647.
Grossman, G. – Helpman, E. (2002d) Managerial Incentives and the International Organization of Production, NBER Working PaperNo. 9403.
Grossman, S. – Hart, O. (1986) The Costs and Benefits of Ownership: a Theory of Vertical and Lateral Integration, Journal of Political Economy 94.
Hall, B. (1990) The Impact of Corporate Restructuring on Industrial Research and Development, Brookings Papers on Economic Activity.
Hao, K. – Jaffe, A. (1990) The effect of Liquidity on Firms’ R&D Spending, Discussion Paper 1492, Harvard Institute of Economic Research.
Hart, O. (1983) The Market Mechanism as an Incentive Scheme, Bell Journal of Economics, 14.
Hart, O. (1995a) Corporate Governance: Some Theory and Implications, The Economic Journal, 105.
Hart. O. (1995b) Firms, Contracts, and Financial Structure, Clarendon Press, Oxford.
Hart, O. – Holmström, B. (1987) Theory of Contracts, in T. Bewley ed., Advances in Economic Theory, Cambridge University Press.
Hart, O. – Moore, J. (1999) Foundations of Incomplete Contracts, Review of Economic Studies, 66.
Helper, S. (1991) Strategy and Irreversibility in Supplier Relations: The Case of the U.S. Automobile Industry, Business History Review, 65.
Hillman, A. (2003) Trade Liberalization and Globalization: A Survey, CEPR Discussion paper No. 3845.
Hernesniemi, H. – Hyvärinen, J. (1995) Industrial Strategies for Lithuania, (Nordic Council of Ministers, seminar report), ETLA.

174
Holmström, B. (1982) Managerial Incentives Problems: A Dynamic Perspective. In Essays in Honor of Lars Wahlbeck. Helsinki: Swedish School of Economics.
Holmström, B. (1989) Agency Costs and Innovation, Journal of Economic Behavior and Organization, 12.
Holmström, B. – Milgrom, P. (1994) The Firm as an Incentive System, TheAmerican Economic Review, 84.
Holmström, B. – Tirole, J. (1989) The Theory of the Firm, Handbook of Industrial Organization.
Holmström, B. – Tirole, J. (1989) Theory of the firm, in Schmalensee – Willig (eds), Handbook of Industrial Organization. Amsterdam: North-Holland.
Horstmann, I. – Markusen, J. (1996) Exploring New Markets: Direct Investment, Contractual Relations and the Multinational Enterprise, International Economic Review, 37.
Hummels, D. – Rapport, D. – K- Yi (2001) Vertical Specialization and the Changing Nature of World Trade, Federal Reserve Bank of New York Economic Policy Review, 4.
Hunya, G. (1991) Speed and Level of Privatization of Big Enterprises in Central and Eastern Europe - General Concepts and Hungarian Practice WIIW, Discussion papers No: 176.
Hunya, G. (1993) Foreign Direct Investment and Privatization in Central and Eastern Europe, WIIW; no. 145, Vienna.
Hyvärinen, J. (1996) A Survey of Corporate Governance - Which Model for Transition Countries? ETLA – Discussion Papers, No. 557.
Hyvärinen, J. (1997) EU Regional Convergence and Public Sector in European Monetary Union, Institute for European Studies, Discussion Papers 3/97, 53 p.
Hyvärinen, J. (1999) Globalization, Economic Growth and Deepening Regionalisation, ETLA – Discussion Papers, No. 668, 68 p.
Hyvärinen, J. (2001) Siirtymätalousmaiden teollisuuden ja rahoitusjärjestelmän jälleenrakentaminen, Lisensiaatintyö: Rahoitusinstituutiot ja yritysten hallinnointi – kansainvälinen vertailu, LTKK.
Hyvärinen, J. (2002) Empirical Implications to Competition and Outsourcing in Industrial Reconstruction, DEA thesis, Graduate Institute of International Studies, Geneva, Switzerland, 53 p.
Hyvärinen, J. – Borsos, J. (1994) Emerging Estonian Industrial Transformation - Towards a Dual Industrial Strategy for Estonia,C 68-series, ETLA.

175
Hyvärinen, J. – Hernesniemi, H. (1995) Industrial Strategies for Latvia (Nordic Council of Ministers, seminar report), ETLA.
Jensen, M. – Meckling, W. (1976) Theory of the Firm: Managerial Behavior, Agency Costs, and Capital Structure. Journal of Financial Economics, 3.
Johnson, B. – Gregersen, B. (1995) Systems of Innovation and Economic Integration, Journal of Industrial Studies, 1.
Jones, R. (2000) Globalization and the Theory of Input Trade, The MIT Press, Cambridge, Massachusetts.
Kalmi, P. (2002a) On the (In)stability of Employee Ownership, Estonian Evidence and Lessons for Transition Economies, Copenhagen Business School, Ph.D.
Kalmi, P. (2002b) Employee Ownership and Degeneration, Evidence from Estonian Case Studies, Helsinki School of Economics, Workingpapers W-328.
Kalmi, P. (2003) The Rise and Fall of employee Ownership in Estonia, 1987-2001, Helsinki School of Economics, Working papers W-345.
Kilvits, K. – Kuus, T. – Laving, J. – Puss, T. – Venesaar, U. – Viies, M. – Vitsur, E. (1997) Estonian Economy and Role in the International Division of Labor, in Berg (ed.) Estonian Economy and European Integration, ETLA C 75; Helsinki, Finland.
Klein, B. – Crawford, R. – A. Alchian (1978) Vertical Integration, Appropriable Rents, and the Competitive Contracting Process, Journal of Law and Economics, 21.
Klette, T. (1996) R&D, Scope Economics, and Plant Performance, RandJournal of Economics, 27.
Kornai, J. (1979) Resource-constrained versus Demand Constrained Systems, Econometrica, 47.
Krugman, P. (1996) Does Third World Growth Hurt First World Propensity, Harvard Business Review, 72.
Laffont, J. – J. Tirole (1993) A Theory of Incentives in Procurement and Regulation, The MIT Press, Massachusetts.
Lainela, S. (1995) Baltian maat vuonna 1994, Review of Economies in Transition, 1/1995, Bank of Finland.
Latvian Ministry of the Economy (1994) Publications. Leamer, E. (1996) In Search of Stolper-Samuelson Effect on U.S. Wages,
NBER Working Paper No. 5427.Levinsohn, J. (1989) Strategic Trade Policy when Firms can Invest Abroad:
When are Tariffs and Quotas equivalent?, Journal of International Economics, 27.

176
Link, A. (1982) A Disaggregated Analysis of Industrial R&D: Product versus Process Innovation, in Sahal (ed.), The Transfer and Utilization of Technical Knowledge, Lexington.
Lipton, D. – Sachs, J. (1990) Creating a Market Economy in Eastern Europe: The Case of Poland, Brooking Papers of Economic Activity.
Lithuanian Investment Agency (1995) Publications. Liu, X. – Wang, C. (2003) Does FDI facilitate Technological Progress?
Evidence from Chinese Industries, Research Policy, June. Lucas, R. (1988) On the Mechanics of Development Planning, Journal of
Monetary Economics, 22.Lundwall, B. – Johnson, B. (1994) The Learning Economy, Journal of
Industrial Studies, 1.Lyons, B. – Sembenelli, A. (1996) EU Manufacturing Industry in Context, in
Davies, S. – B. Lyons: Industrial Organization in the European Union – Structure, Strategy, and the Competitive Mechanism,Clarendon Press, Oxford.
Machin, S. – Reenen, J. (1998) Technology and Changes in Skill Structure: Evidence from Seven OECD Countries, Quarterly Journal of Economics, 113 (4).
Malerba, F. – Orsenigo, L. (1990) Technological Regimes and Patterns of Innovation: A Theoretical and Empirical Investigation of the Italian Case, in Heertje – Perlman (eds.): Evolving Technologies and Market Structure, Michigan.
Malerba, F. – Orsenigo, L. (1993) Technological Regimes and Firm Behaviour, Industrial and Corporate Change, 2.
Mansfield, E. (1981) Composition of R&D Expenditures: Relationship to Size, Concentration, and Innovation Output, Review of Economics and Statistics, 62.
March, J. – Simon, H. (1958) Organizations. New York: Wiley.Marin, D. – Lorentowich, A. (2002) Ownership, Capital of Outsourcing: What
Drives German Investment to Eastern Europe? CEPR Discussion Papers No. 3515.
Markusen, J. (1994) Multinationals, Multi-Plant Economies, and the Gains from Trade, Journal of International Economics, 16.
Markusen, J. (1995) The Boundaries of Multinational Enterprises and the Theory of International Trade, Journal of Economic Perspectives,9.
Markusen, J. (1997) Trade versus Investment Liberalization, NBER working paper 6231.
Markusen, J. (1998) Multinational Firms, Location and Trade, The World Economy, 21.

177
Markusen, J. (2002) Multinational Firms and the Theory of International Trade, The MIT Press, Cambridge, Massachusetts.
Markusen, J. – Venables, A. (1998) Multinational Firms and the New Trade Theory, Journal of International Economics, 46.
Markusen, J. – Venables, A. (2000) The Theory of Endowment, Intra-Industry and Multinational Trade, Journal of International Economics, 52.
Marris, R. (1964) The Economic Theory of Managerial Capitalism, Glencoe: Free Press.
Maskin, E. – Tirole, J. (1999) Unforeseen Contingencies and Incomplete Contracts, Review of Economic Studies, 66.
McAfee, R. – McMillan, J. (1995) Organizational Diseconomies of Scale, Journal of Economics & Management Strategy, Vol. 4, 3.
McLaren, J. (2000) Globalization and Vertical Structure, The American Economic Review, Vol. 90, No. 5.
McMillan, J. (1995) Reorganizing Vertical Supply Relationships, in Siebert, ed., Trends in Business Organization: Do Participation and Cooperation Increase Competitiveness, Tubingen.
Meeks, G. (1977) Disappointing Marriage: A Study of the Gains from Merger,Cambridge University Press.
Mejstrik, M. (1992) Privatization in Czechoslovakia, in Ramanadham (ed.), Privatization: A Global Perspective.
Mihalyi, P. (1993) Privatization in Hungary: An overview, in Privatization in the Transition Process, Recent Experiences in Eastern Europe. United Nations.
Milgrom, P. – Roberts, J. (1996) Continuous Adjustment and Fundamental Change in Business Strategy and Organization, in ed. by H. Siebert, Trends in Business Organization: Do Participation And Cooperation Increase Competitiveness? Tubingen.
Mladek, J. – Hashi, I. (1993) Voucher Privatization, Investment Funds and Corporate Governance in Czechoslovakia, British Review of Economic Issues, vol. 15, 37.
Mowery, D. – Rosenberg, N. (1989) Technology and the Pursuit of Economic Growth, Cambridge.
Mueller, D. (1980) The Determinants and Effects of Mergers: An International Comparison, Chapter 10, Cambridge.
Mueller, D. (1987) The Corporation: Growth, Diversification and Mergers,Harwood Academic Publishers.
Mulligan, C. – Sala-i-Martin, X. (1993) Transitional Dynamics in Two-Sector Models of Endogenous Growth, Quarterly Journal of Economics,108.

178
Nadiri, W. (1993) Innovations and Technological Spillovers, NBER Working Paper 4423.
Nelson, R. – Winter, S. (1982) An Evolutionary Theory of Economic Change,Cambridge Mass.
North, D. (1991) Institutions, Institutional Change and Economic Performance, Cambridge University Press.
North, D. (1997) The Contribution of the New Institutional Economics to and Understanding of the Transition Problem, UNU/WIDER, Helsinki, Finland.
OECD (1992) Reforming the Economies of Central and Eastern Europe,OECD, Paris.
Pajarinen, M. – Rouvinen, P. – Ylä-Anttila, P. (1998) Small Country Strategies in Global Competition – Benchmarking the Finnish Case, ETLA B144, Helsinki.
Parker, D. (1993) Unravelling the Planned economy: Privatization in Czecho-Slovakia: Communist Economies of Economic Transformation,Vol. 5. No. 3.
Porter, M. (1998) The Competitive Advantage of Nations, London. Prowse, S. (1995) Corporate Governance in an International Perspective: A
Survey of Corporate Control Mechanisms Among Large Firms in the U.S., U.K., Japan and Germany, Financial Markets, Institutions and Instruments, vol. 4, 1.
Ravenscraft, D. – Scherer, F. (1988) Mergers and Managerial Performance, in J. Coffee et. Al. eds., Takeovers and Contests for Corporate Control, Oxford University Press.
Rebelo, S. (1991) Long Run Policy Analysis and Long Run Growth; Journal of Political Economy, 99.
Riordan, M. – Williamson, O. (1985) Asset Specificity and Economic Organization, International Journal of Industrial Organization, 3.
Rowthorn, B. – Chang, H. (1993) Public Ownership and the Theory of the State, in Clarke – Pitelis (eds.), The Political Economy of Privatization, London.
Rumpunen, J. (1997) Eastern Enlargement of the European Union, in Berg (ed.) Estonian Economy and European Integration, ETLA C 75; Helsinki, Finland.
Sadowski, P. (1992) Privatization in Eastern Europe: Goals, Problems, and Implications. Oxford Review of Economic Policy, 7.
Sala-i-Martin, X. (1996) Regional Cohesion: Evidence and Theories of Regional Growth and Convergence, European Economic Review,40.

179
Sappington, D – Stiglitz, J. (1987) Privatization, Information and Incentives, Journal of Policy, Analysis and Management, 6.
Scherer, F. (1991) Changing Perspectives on the Firm Size Problem, in Acs – Audretsch (eds.), Innovation and Technological Change: An International Comparison, New York.
Schleifer, A. – Vishny, R. (1986) Large Shareholders and Corporate Control. Journal of Political Economy, 94.
Schmalensee, R. (1988) Industrial Economics: An Overview, the Economic Journal, 98.
Segal, I. (1999) Complexity and Renegotiation: A Foundation for IncompleteContracts, Review of Economic Studies, 66.
Shapiro, C. – Willig, R. (1990) Economic Rationales for the Scope of Privatization, Olin Program Discusson Paper 41, Woodrow Wilson School, Princeton University.
Sharp, M. (2001) The Need for New Perspectives in European Commission Innovation Policy, in Archibugi – Lundvall (eds.), TheGlobalizing Learning Economy, Oxford.
Sheard, P. (1989) The Main Bank System and Corporate Monitoring and Control in Japan, Journal of Economic Behavior and Organization, 11.
Smith, A. – Venables, A. (1988) Completing the Internal Market in the European Community – Some Industry Simulations, European Economic Review, 32.
Smith, K. (1996) Economic Infrastructures and Innovation Systems, in Edquist (ed.) (1997) Systems of Innovation: Technologies, Institutions and Organizations, London.
Stark, D. (1992) Path Dependence and Privatization Strategies in East Central Europe, East European Politics and Societies, Vol. 6, No. 1.
Statistical Office of Estonia (1999), Publications.Stiglitz, J. (1991a) Some Theoretical Aspects of the Privatization:
Applications to Eastern Europe, in Baldassari – Paganetto – Phelps (eds.), Privatization Processes in Eastern Europe - Theoretical Foundations and Empirical Results, St. Martin's Press, Rome.
Stiglitz, J. (1991b) Symposium on Organizations and Economics, Journal of Economic Perspectives, 5.
Stokey, N. (1991) Human Capital, Product Quality, and Growth, Quarterly Journal of Economics.
Sutton, J. (1991) Sunk Costs and Market Structure – Price Competition, Advertising, and the Evolution of Concentration, London.

180
Svejnar, J. – Singer, M. (1994) Using Vouchers to Privatize an Economy: the Czech and Slovak Case. Economics of Transition, 2.
Teece, D. (1996) Firm Organization, Industrial Structure, and Technological Innovation, Journal of Economic Behavior & Organization, 31.
United Nations (1999) World Investment Report 1999: Foreign Direct Investment and the Challenge of Development, New York and Geneva.
United Nations (2003) World Investment Directory online, UNCTAD. Uzawa, H. (1965) Optimal Technical Change in an Aggregate Model of
Economic Growth, International Economic Review, 6. Venables, A. (1990) The Economic Integration of Monopolistic Markets,
European Economic Review, 34. Vickers, J. – Yarrow, G. (1988) Privatization: An Economic Analysis.
Cambridge, MA: MIT Press. Vickers, J. – Yarrow, G. (1991) Economic Perspectives on Privatization,
Journal of Economic Perspectives, 5. Williamson, O. (1975) Markets and Hierarchies: Analysis and Anti-Trust
Implications, New York. Williamson, O. (1985) The Economic Institutions of Capitalism: Firms,
Markets, Relational Contracting, New York. Williamson, O. (1989) “Transaction Cost Economics” in Schmalensee, R. –
R. Willig eds. Handbook of Industrial Organization, Amsterdam: North-Holland.
Winiecki, J. (1992) Privatization in Poland: A Comparative Perspective, Kiel Studies, No. 248, Institute of World Economics, Germany.
Winter, S. (1984) Schumpeterian Competition in Alternative Technological Regimes, Journal of Economic Behavior and Organization, 5.
Winter, S. (1987) Knowledge and Competence as Strategic Assets, in Teece (ed.) The Competitive Challenge: Strategies for Industrial Innovation and Renewal, Cambridge Mass.
World Bank (1993) Country Study, Estonia, the Transition to a Market Economy, Washington.
Wyplosz, C. (1999) Financial Restraints and Liberalization in Postwar Europe, CEPR Discussion Papers No. 2253.
Wyplosz, C. (2001) How Risky is Financial Liberalization in the Developing Countries, CEPR Discussion Papers No. 2724.
Yeats, A. (2001) Just How Big is Global Production Sharing? In Arndt, S. – H. Kierzkowski, eds., Fragmentation: New Production Patterns in the World Economy. Oxford University Press.
Zhang, K. – Markusen, J. (1999) Vertical Multinational and Host Country Characteristics, Journal of Development Economics, 59.

181
APPENDIX
Appendix for Chapter 1.
Appendix 1.1. Country Groups
ANDEAN = Bolivia, Colombia, Ecuador, Peru, Venezuela
APEC = Australia, Brunei, Canada, Chile, China, Hong Kong, Indonesia, Japan, Malaysia, Mexico, New Zealand, Papua New Guinea, Peru, Philippines, Korea Republic, Russia, Singapore, Taiwan, Thailand, the United States, Viet Nam
ASEAN = Brunei, Cambodia, Indonesia, Laos, Philippines, Singapore, Thailand, Viet Nam
CARICOM = Antigua and Barbuda, Barbados, Belize, Dominica, Grenada, Guyana, Jamaica, Montserrat, Saint Kitts and Nevis, Saint Lucia, Saint Vincent and the Grenadines, Suriname, Trinidad and Tobaco
EU15 = Austria, Belgium, Denmark, Finland, France, Germany, Greece, Ireland, Italy, Luxemburg, Netherlands, Portugal, Spain, Sweden, the United Kingdom
LDC = Least developed countries as classified by the United Nations: Afghanistan, Angola, Bangladesh, Benin, Bhutan, Burkina Faso, Burundi, Cambodia, Cape Verde, Central African Republic, Chad, Comoros, Congo Rep., Djibouti, Eritrea, Ethiopia, Gambia, Guinea, Guinea-Bissau, Haiti, Kiribati, Lao People's Dem. Rep., Lesotho, Liberia, Madagascar, Malawi, Maldives, Mali, Mauritania, Mozambique, Myanmar, Nepal, Niger, Rwanda, Samoa, Sao Tome and Principe, Senegal, Sierra Leone, Solomon Islands, Somalia, Sudan, Togo, Tuvalu, Uganda, United Republic of Tanzania, Vanuatu, Yemen, Zambia
MERCOSUR = Argentina, Brazil, Paraguay, Uruguay
NAFTA = Canada, Mexico, the United States

182
OECD = Australia, Austria, Belgium, Canada, Czech Republic, Denmark, Finland, France, Germany, Greece, Hungary, Iceland, Ireland, Italy, Japan, Korea Republic, Luxembourg, Mexico, Netherlands, New Zealand, Norway, Poland, Portugal, Slovak Republic, Spain, Sweden, Switzerland, Turkey, the United Kingdom, the United States

183
Appendix 1.2. Exports of Parts and Components
Motor Vehicles
0
500
1000
1500
2000
2500
1985 1990 1995 2000
Mill
ion
EUR
LDC
CARICOM
ANDEAN
MERCOSUR
Non-Electrical Machinery
0
200
400
600
800
1000
1200
1400
1600
1800
1985 1990 1995 2000
Mill
ion
EUR
LDC
CARICOM
ANDEAN
MERCOSUR
Radio, TV and CommunicationEquipment
0
50
100
150
200
250
1985 1990 1995 2000
Mill
ion
EUR
LDC
CARICOM
ANDEAN
MERCOSUR
Other Transport
020
4060
80100120
140160
180200
1985 1990 1995 2000
Mill
ion
EUR
CARICOM
ANDEAN
LDC
MERCOSUR
Office Machinery and Computers
0
20
40
60
80
100
120
140
160
180
1985 1990 1995 2000
Mill
ion
EUR
LDC
ANDEAN
CARICOM
MERCOSUR
Wood, Publishing and Printing
0
5
10
15
20
25
30
35
1985 1990 1995 2000
Mill
ion
EUR
CARICOM
LDC
ANDEAN
MERCOSUR
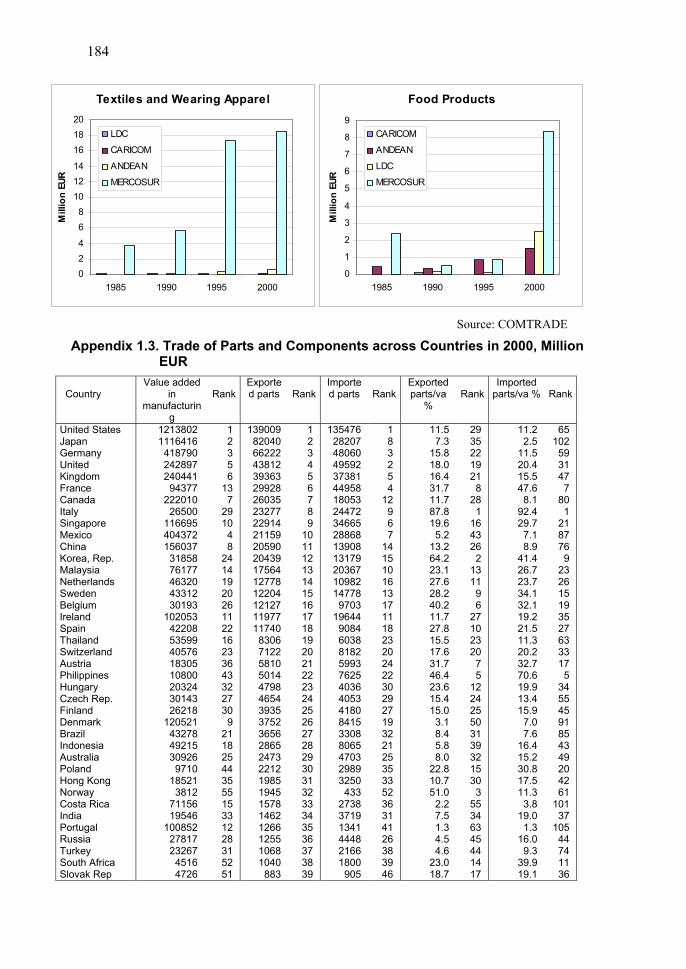
184
Textiles and Wearing Apparel
024
68
101214
161820
1985 1990 1995 2000
Mill
ion
EUR
LDC
CARICOM
ANDEAN
MERCOSUR
Food Products
0
1
2
3
4
5
6
7
8
9
1985 1990 1995 2000
Mill
ion
EUR
CARICOM
ANDEAN
LDC
MERCOSUR
Source: COMTRADE
Appendix 1.3. Trade of Parts and Components across Countries in 2000, Million EUR
CountryValue added
inmanufacturin
g
RankExported parts Rank
Imported parts Rank
Exportedparts/va
%Rank
Importedparts/va % Rank
United States JapanGermanyUnitedKingdomFranceCanadaItalySingaporeMexicoChinaKorea, Rep.MalaysiaNetherlandsSwedenBelgiumIrelandSpainThailandSwitzerlandAustriaPhilippinesHungaryCzech Rep.FinlandDenmarkBrazilIndonesiaAustraliaPolandHong KongNorwayCosta RicaIndiaPortugalRussiaTurkeySouth Africa Slovak Rep
12138021116416418790242897240441
94377222010
26500116695404372156037
3185876177463204331230193
1020534220853599405761830510800203243014326218
1205214327849215309269710
185213812
7115619546
100852278172326745164726
12356
137
291048
24141920261122162336433227309
21182544355515331228315251
139009820406622243812393632992826035232772291421159205902043917564127781220412127119771174083067122581050144798465439353752365628652473221219851945157814621266125510681040
883
123456789
101112131415161718192021222324252627282930313233343536373839
13547628207480604959237381449581805324472346652886813908131792036710982147789703
1964490846038818259937625403640534180841533088065470329893250
433273837191341444821661800
905
183254
12967
1415101613171118232024223029271932212535335236314126383946
11.57.3
15.818.016.431.711.787.819.65.2
13.264.223.127.628.240.211.727.815.517.631.746.423.615.415.03.18.45.88.0
22.810.751.02.27.51.34.54.6
23.018.7
29352219218
281
1643262
131196
2710232075
1224255031393215303
55346345441417
11.22.5
11.520.415.547.68.1
92.429.77.18.9
41.426.723.734.132.119.221.511.320.232.770.619.913.415.97.07.6
16.415.230.817.511.33.8
19.01.3
16.09.3
39.919.1
651025931477
801
2187769
2326151935276333175
34554591854349204261
10137
10544741136

185
SloveniaArgentina Romania GreeceEstoniaNew Zealand Tunisia Croatia Venezuela Chile MoroccoLithuania Colombia KazakhstanMacedonia IranUruguay LatviaBelize PeruLebanon Trin. & Tob. Barbados Botswana Saudi Arabia Azerbaijan JordanPakistanArmenia Georgia Bolivia Cote d'Ivoire El Salvador Guatemala MauritiusPapua N. G. GhanaMoldova Turkmenistan Nepal Honduras Senegal Ecuador GuineaZambia GabonKenya Paraguay St. Lucia Albania Belarus SurinameTajikistan Mongolia Nigeria Panama Nicaragua Uganda Togo GambiaSyria Benin Jamaica Malawi St. V. & Gren. ComorosEthiopia
51330 9597
12296 900
10938 3845 3967
17630 11628 6353 2343
11306 3401
68418822 3610
990130
8265 1692
611209285
16181 372
1217 9386
460228
1153 1905 3358 2725 1028
378508191
1794 556
1104 842
2497 131362223
1253 1172
35470
8566 66
21957
1773 82037556312820
4966 214
1074 231199
446
1745397442545337404961415777345673984865789589388767468391696258597285819663807075609788926668
1028247
10093
1016476867999
10350947190
10410584
855682517421332300268207143112838041363332282422221915151413121212997655444443333222221111111
0.50.30.20.20.10.10.10.1
0.020.01
0.004
404142434445464748495051525354555657585960616263646566676869707172737475767778798081828384858687888990919293949596979899
100101102103104105
2990 969
2185 724
1144 691339
1141 1088
41026278242146
1671 25418718
53523517068
2094099
1454186794542
12782
2073107356
22030
17046
12566
192327682
1451171238
338374
483671665740118
11317
1472841
64
3445374842495743445560475389406167985162698264287254509091747865598186639668887583669580797376
100935894
1038756708592
10110277997197
10410584
1.77.14.2
46.83.07.86.81.21.21.83.50.71.25.30.20.92.8
18.60.31.33.17.35.30.13.61.00.12.64.00.80.40.20.20.41.10.82.00.20.60.30.40.12.20.61.00.20.25.30.3
0.011.50.41.60.10.10.10.10.21.0
0.0020.1
0.010.030.10.1
0.001
5937464
523338666458497465428771531883625136419648699154477380868577677257847582799256767089904081
102617860
1009493988868
10499
1031019597
105
5.810.117.880.410.518.08.56.59.46.5
11.26.9
12.46.78.97.0
18.913.76.5
13.927.832.673.425.339.134.37.29.8
18.411.04.36.2
11.47.1
14.943.415.79.58.3
11.37.87.7
24.721.136.911.69.9
33.98.13.9
55.92.0
83.920.720.315.27.19.0
39.92.37.8
13.712.320.59.5
14.3
9868413
6740789573966492569377903853945222184
2412148670396699976088508
46727962828425281358691681
1006
1042
293248897510
103835457307151
Source: COMTRADE

186
Appendix for Chapter 2.
Appendix 2.1. EU Statistics across Countries
Imported inputs/gross output% R&D expenditures/gross output% Country Mean St dev Min Max Mean St dev Min Max
DEN 22.58 11.98 0.00 42.39 2.21 3.55 0.00 14.13
FIN 18.53 14.16 0.00 65.92 1.98 2.71 0.00 12.95
FRA 13.90 7.64 1.03 29.91 3.20 4.66 0.07 17.05
GER 11.77 4.79 0.00 20.04 2.66 5.85 0.00 26.74
ITA 12.61 8.59 0.33 36.45 2.09 4.18 0.01 18.75
NED 25.84 14.29 0.00 56.43 1.69 2.69 0.00 10.52
UK 29.20 13.56 4.99 59.51 2.90 4.32 0.06 19.27
Total 19.20 12.74 0.00 65.92 2.39 4.08 0.00 26.74
Source: COMTRADE, STAN Appendix 2.2. EU Statistics across industries
Imported inputs/gross output% R&D expenditures/gross output%
Industry Mean St dev Min Max Mean St dev Min Max
1Food, beverages & tobacco 7.57 2.89 4.49 13.28 0.33 0.21 0.04 0.70
2Textiles, apparel & leather 26.28 12.80 10.97 45.47 0.22 0.19 0.01 0.59
3Wood products & furniture 15.59 10.21 4.43 31.03 0.12 0.12 0.02 0.35
4Paper, paper products & printing 15.32 6.26 4.83 21.67 0.14 0.15 0.01 0.46
5 Industrial chemicals 25.14 7.79 15.75 34.81 2.68 1.13 0.85 3.65
6Drugs & medicines 20.57 6.32 13.05 29.46 8.85 6.52 0.00 19.27
7Petroleum & coal products 5.23 4.03 0.33 11.72 1.05 1.29 0.00 3.72
8Rubber & plastic products 28.79 10.14 13.75 42.39 0.80 0.44 0.37 1.64
9Non-metallic mineral products 9.81 5.54 2.29 15.95 0.76 0.58 0.05 1.65
10 Iron & steel 17.34 9.34 4.43 32.49 0.75 0.62 0.28 2.09
11Non-ferrous metals 25.59 17.36 0.00 52.18 0.45 0.29 0.00 0.77
12Metal products 17.66 8.48 5.95 28.82 0.55 0.30 0.31 1.07
13Non-electrical machinery 18.42 7.96 8.38 26.92 1.32 0.79 0.24 2.52
14Office & computing machinery 32.07 23.71 0.00 65.92 5.15 3.38 0.00 10.25
15Electrical apparatus, nec 20.58 10.83 7.66 37.53 2.99 1.54 1.53 5.66
16Radio, TV & communication equipment 22.45 17.08 0.00 53.67 4.54 4.95 0.00 14.57
17Shipbuilding & repairing 19.35 5.75 12.40 28.40 1.42 1.52 0.13 4.56
18Other transport equipment 17.82 16.14 0.00 38.46 1.48 1.32 0.00 2.93
19Motor vehicles 18.45 13.68 0.00 40.31 2.33 1.15 0.00 3.54
20Aircraft 20.31 19.14 0.00 56.43 11.03 10.13 0.00 26.74
21Professional goods 16.97 13.03 0.00 39.40 2.59 2.92 0.00 8.81
22Other manufacturing 21.16 7.40 11.06 32.95 2.99 5.04 0.00 12.95
Total 19.20 12.74 0.00 65.92 2.39 4.08 0.00 26.74
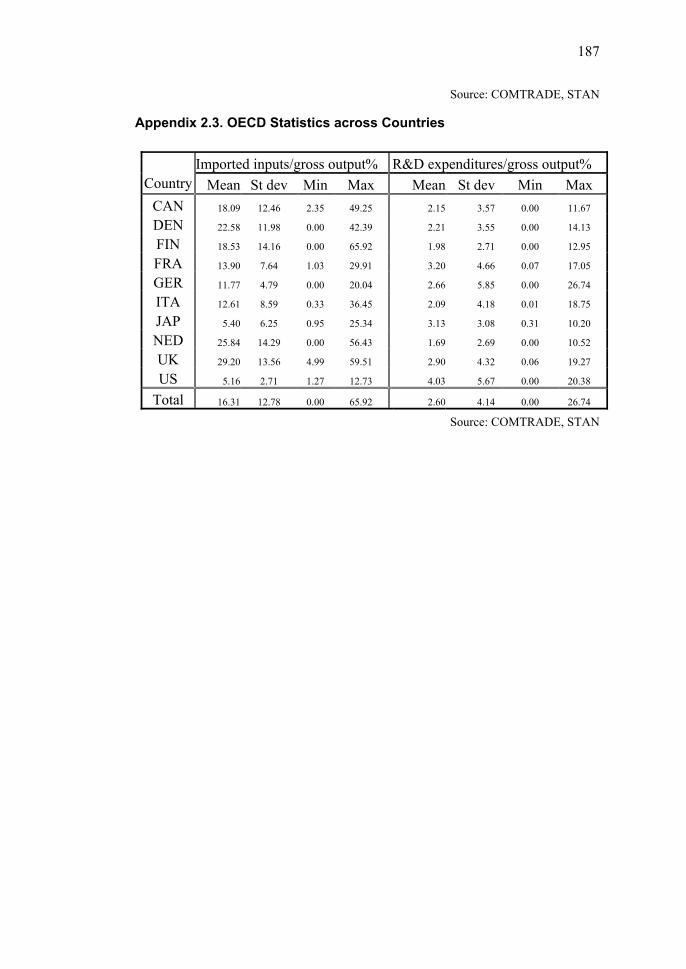
187
Source: COMTRADE, STAN
Appendix 2.3. OECD Statistics across Countries
Imported inputs/gross output% R&D expenditures/gross output%Country Mean St dev Min Max Mean St dev Min Max
CAN 18.09 12.46 2.35 49.25 2.15 3.57 0.00 11.67
DEN 22.58 11.98 0.00 42.39 2.21 3.55 0.00 14.13
FIN 18.53 14.16 0.00 65.92 1.98 2.71 0.00 12.95
FRA 13.90 7.64 1.03 29.91 3.20 4.66 0.07 17.05
GER 11.77 4.79 0.00 20.04 2.66 5.85 0.00 26.74
ITA 12.61 8.59 0.33 36.45 2.09 4.18 0.01 18.75
JAP 5.40 6.25 0.95 25.34 3.13 3.08 0.31 10.20
NED 25.84 14.29 0.00 56.43 1.69 2.69 0.00 10.52
UK 29.20 13.56 4.99 59.51 2.90 4.32 0.06 19.27
US 5.16 2.71 1.27 12.73 4.03 5.67 0.00 20.38
Total 16.31 12.78 0.00 65.92 2.60 4.14 0.00 26.74
Source: COMTRADE, STAN

188
Appendix 2.4. OECD Statistics across Industries
Imported inputs/gross output% R&D expenditures/gross output%
Industry Mean St dev Min Max Mean St dev Min Max
Food, beverages & tobacco 6.30 3.23 1.27 13.28 0.34 0.20 0.04 0.70
Textiles, apparel & leather 21.60 13.20 6.55 45.47 0.26 0.19 0.01 0.59
Wood products & furniture 12.34 9.85 3.66 31.03 0.16 0.12 0.02 0.35
Paper, paper products & pr. 12.20 7.20 3.91 21.67 0.21 0.16 0.01 0.46
Industrial chemicals 20.48 10.16 3.54 34.81 2.69 1.25 0.83 4.37
Drugs & medicines 15.61 9.62 1.93 29.46 9.03 5.56 0.00 19.27
Petroleum & coal products 4.17 3.72 0.33 11.72 1.04 1.06 0.00 3.72
Rubber & plastic products 22.68 13.50 3.09 42.39 0.87 0.51 0.22 1.67
Non-metallic mineral
products 7.89 5.60 1.74 15.95 0.85 0.64 0.05 1.95
Iron & steel 13.92 9.61 2.81 32.49 0.69 0.57 0.22 2.09
Non-ferrous metals 22.63 15.56 0.00 52.18 0.76 0.67 0.00 2.40
Metal products 14.27 9.16 1.92 28.82 0.54 0.28 0.21 1.07
Non-electrical machinery 15.71 9.13 2.55 26.92 1.42 0.82 0.24 2.73
Office & computing
machinery 29.12 22.86 0.00 65.92 7.30 5.52 0.00 20.38
Electrical apparatus, nec 17.08 10.91 5.03 37.53 3.10 1.65 0.82 5.66
Radio, TV & comm. eq. 20.94 16.93 0.00 53.67 5.80 4.72 0.00 14.57
Shipbuilding & repairing 16.85 8.82 1.94 28.40 1.05 1.38 0.00 4.56
Other transport equipment 15.51 14.52 0.00 38.46 1.42 1.30 0.00 3.01
Motor vehicles 18.24 15.09 0.00 42.12 2.42 1.42 0.00 4.50
Aircraft 19.05 16.39 0.00 56.43 11.40 8.47 0.00 26.74
Professional goods 15.02 12.24 0.00 39.40 3.43 2.93 0.00 8.81
Other manufacturing 17.13 9.52 2.01 32.95 2.48 4.20 0.00 12.95
Total 16.31 12.78 0.00 65.92 2.60 4.14 0.00 26.74
Source: COMTRADE, STAN
Appendix for Chapter 3.
Appendix 3.1. The Order Contract
This contract is a complete contract, because both parties can verify the quantity and the price of the component. They write an ordering contract, which specifies the output and sale of intermediate input. From (1) it is known

189
that jth variety of the good y, l = location, faces a constant-elasticity demandas
),(),( ljApljy (1’)
when it charges the price p(j,l) where
1
0
)(ˆ
0
1),(ln
ii
djdlljp
EA (2’)
where Ei is a spending on consumer goods in country i (i = hw, lw). In such circumstances profits are maximised by mark-up pricing. The joint profits are maximised when P i(x) = w i / because co-operation have MC’s of w i, and themaximal joint profits are:
1
)1(i
i wAS (3’)
Finally, the optimal order contract of intermediate product is: i
i wAy (4’)
And a total payment by the final producer to the input supplier becomes: iwA
21 (5’)

190
Appendix 3.2. List of Countries
Country
Exports of parts
and components in
1985 (EPAR85),
1000 EUR
Market share in
World trade
1985,
(SHAE85), %
Exports of parts and
components in 2000
(EPAR00), 1000
EUR
Market share
in World trade
2000
(SHAE00), %
Change in
market share
1985-2000
(CHEX8500)
Argentina 96556 0.071 788129 0.124 0.55
Australia 265450 0.196 2641238 0.414 0.75
Austria 870446 0.642 6566398 1.030 0.47
Bangladesh 3488 0.003 24655 0.004 0.41
Belgium 2357868 1.740 11251674 1.765 0.01
Brazil 767910 0.567 3459342 0.543 -0.04
Bulgaria 0.008 0.016 10294 102945 0.75
Canada 10048721 7.416 27593635 4.328 -0.54
Chile 13384 0.010 131810 0.021 0.74
China 4117 0.003 19508444 3.060 6.91
Colombia 12769 0.009 73531 0.012 0.20
Costa Rica 8107 0.006 1793624 0.281 3.85
Croatia 28058 0.021 247409 0.039 0.63
Cyprus 12521 0.009 8199 0.001 -1.97
Czech Republic 774789 0.190.572 4424131 0.694
Denmark 858239 0.633 3628024 0.569 -0.11
Egypt, Arab Rep. 39 0.000 6388 0.001 3.55
El Salvador 361 0.000 5557 0.001 1.18
Estonia 23526 0.017 388230 0.061 1.25
Finland 542194 0.400 4291002 0.673 0.52
France 9588747 7.076 36293141 5.692 -0.22
Germany 19567111 14.440 61057019 9.576 -0.41
Greece 29932 0.022 476299 0.075 1.22
Guatemala 455 0.000 5069 0.001 0.86
Hong Kong 1330055 0.982 2039455 0.320 -1.12
Hungary 153834 0.114 4622822 0.725 1.85
India 239197 0.177 1454930 0.228 0.26
Indonesia 7420 0.005 3370992 0.529 4.57
Ireland 898118 0.663 11180947 1.754 0.97
Israel 410272 0.303 4977396 0.781 0.95
Italy 6251822 4.614 24004198 3.765 -0.20
Japan 16852882 12.437 75641223 11.863 -0.05
Jordan 2085 0.002 11285 0.002 0.14

191
Kazakhstan 4231 0.003 37509 0.006 0.63
Kenya 671 0.000 1928 0.000 -0.49
Korea, Rep. 695130 0.513 18984310 2.977 1.76
Latvia 5361 0.004 26024 0.004 0.03
Lithuania 6111 0.005 76158 0.012 0.97
Macao, China 8448 0.006 8962 0.001 -1.49
Malaysia 348621 0.257 18845102 2.956 2.44
Malta 38583 0.028 84382 0.013 -0.77
Mauritius 157 0.000 4252 0.001 1.75
Mexico 497042 0.367 21126325 3.313 2.20
Morocco 11615 0.009 102974 0.016 0.63
Netherlands 3485497 2.572 16194453 2.540 -0.01
New Zealand 51922 0.038 305903 0.048 0.22
Norway 472626 0.349 1829924 0.287 -0.19
Pakistan 5391 0.004 11275 0.002 -0.81
Paraguay 5 0.000 1745 0.000 4.28
Peru 4169 0.003 20372 0.003 0.04
Philippines 37049 0.027 5357043 0.840 3.43
Poland 270693 0.200 2279801 0.358 0.58
Portugal 184739 0.136 1347616 0.211 0.44
Romania 108683 0.080 629214 0.099 0.21
Saudi Arabia 616 0.000 12600 0.002 1.47
Senegal 1720 0.001 3174 0.000 -0.94
Singapore 2102805 1.552 21461517 3.366 0.77
Slovenia 78041 0.058 814282 0.128 0.80
South Africa 272271 0.201 984839 0.154 -0.26
Spain 1393178 1.028 11042991 1.732 0.52
Sweden 3024479 2.232 11781008 1.848 -0.19
Thailand 423872 0.313 10823938 1.698 1.69
Trinidad and Tob. 26111 0.019 17425 0.003 -1.95
Tunisia 30894 0.023 276488 0.043 0.64
Turkey 202676 0.150 1157368 0.182 0.19
United Kingdom 12912307 9.529 40394517 6.335 -0.41
United States 37915133 27.981 128166062 20.101 -0.33
Uruguay 2199 0.002 29518 0.005 1.05
Venezuela 26943 0.020 190591 0.030 0.41
Zimbabwe 3437 0.003 9626 0.002 -0.52
Source: COMTRADE
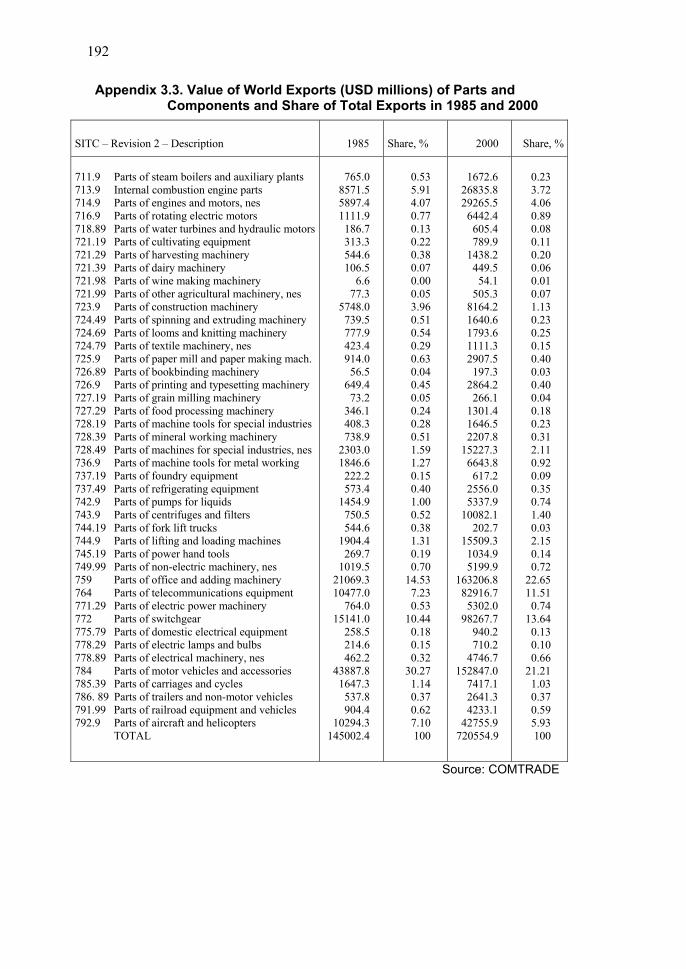
192
Appendix 3.3. Value of World Exports (USD millions) of Parts and Components and Share of Total Exports in 1985 and 2000
SITC – Revision 2 – Description 1985 Share, % 2000 Share, %
711.9 Parts of steam boilers and auxiliary plants 713.9 Internal combustion engine parts 714.9 Parts of engines and motors, nes 716.9 Parts of rotating electric motors 718.89 Parts of water turbines and hydraulic motors721.19 Parts of cultivating equipment 721.29 Parts of harvesting machinery 721.39 Parts of dairy machinery 721.98 Parts of wine making machinery 721.99 Parts of other agricultural machinery, nes 723.9 Parts of construction machinery 724.49 Parts of spinning and extruding machinery 724.69 Parts of looms and knitting machinery 724.79 Parts of textile machinery, nes 725.9 Parts of paper mill and paper making mach. 726.89 Parts of bookbinding machinery 726.9 Parts of printing and typesetting machinery 727.19 Parts of grain milling machinery 727.29 Parts of food processing machinery
186.7
106.5
728.19 Parts of machine tools for special industries 728.39 Parts of mineral working machinery 728.49 Parts of machines for special industries, nes 736.9 Parts of machine tools for metal working 737.19 Parts of foundry equipment 737.49 Parts of refrigerating equipment 742.9 Parts of pumps for liquids 743.9 Parts of centrifuges and filters 744.19 Parts of fork lift trucks 744.9 Parts of lifting and loading machines 745.19 Parts of power hand tools 749.99 Parts of non-electric machinery, nes 759 Parts of office and adding machinery 764 Parts of telecommunications equipment 771.29 Parts of electric power machinery 772 Parts of switchgear 775.79 Parts of domestic electrical equipment 778.29 Parts of electric lamps and bulbs 778.89 Parts of electrical machinery, nes 784 Parts of motor vehicles and accessories 785.39 Parts of carriages and cycles 786. 89 Parts of trailers and non-motor vehicles 791.99 Parts of railroad equipment and vehicles 792.9 Parts of aircraft and helicopters TOTAL
765.0 8571.5 5897.4 1111.9
313.3 544.6
6.6 77.3
5748.0 739.5 777.9 423.4 914.0 56.5
649.4 73.2
346.1 408.3 738.9
2303.0 1846.6 222.2 573.4
1454.9 750.5 544.6
1904.4 269.7
1019.5 21069.3 10477.0
764.0 15141.0
258.5 214.6 462.2
43887.8 1647.3 537.8 904.4
10294.3 145002.4
0.53 5.91 4.07 0.77 0.13 0.22 0.38 0.07 0.00 0.05 3.96 0.51 0.54 0.29 0.63 0.04 0.45 0.05 0.24 0.28 0.51 1.59 1.27 0.15 0.40 1.00 0.52 0.38 1.31 0.19 0.70
14.53 7.23 0.53
10.44 0.18 0.15 0.32
30.27 1.14 0.37 0.62 7.10 100
1672.6 26835.8 29265.5
6442.4 605.4 789.9
1438.2 449.5 54.1
505.3 8164.2 1640.6 1793.6 1111.3 2907.5 197.3
2864.2 266.1
1301.4 1646.5 2207.8
15227.3 6643.8 617.2
2556.0 5337.9
10082.1 202.7
15509.3 1034.9 5199.9
163206.8 82916.7
5302.0 98267.7
940.2 710.2
4746.7 152847.0
7417.1 2641.3 4233.1
42755.9 720554.9
0.23 3.72 4.06 0.89 0.08 0.11 0.20 0.06 0.01 0.07 1.13 0.23 0.25 0.15 0.40 0.03 0.40 0.04 0.18 0.23 0.31 2.11 0.92 0.09 0.35 0.74 1.40 0.03 2.15 0.14 0.72
22.65 11.51 0.74
13.64 0.13 0.10 0.66
21.21 1.03 0.37 0.59 5.93 100
Source: COMTRADE

193
Appendix 3.4. List of Dummies Country Region Income Country Region IncomeArgentina MERCOSUR LOW Korea, Rep. OECD, APEC LOWAustralia OECD, APEC HIGH Latvia CEEC LOWAustria OECD, EU15 HIGH Lithuania CEEC LOWBangladesh - LOW Macao, China APEC LOWBelgium OECD, EU15 HIGH Malaysia ASEAN, APEC LOWBrazil MERCOSUR LOW Malta - LOWBulgaria CEEC LOW Mauritius SADC LOW
CanadaOECD, NAFTA, APEC HIGH Mexico
OECD, NAFTA, APEC LOW
Chile APEC LOW Morocco - LOWChina APEC LOW Netherlands OECD, EU15 HIGHColombia ANCOM LOW New Zealand APEC HIGHCosta Rica CACM LOW Norway OECD HIGHCroatia - LOW Pakistan - LOWCyprus - LOW Paraguay MERCOSUR LOWCzech Rep. OECD, CEEC LOW Peru APEC, ANCOM LOWDenmark OECD, EU15 HIGH Philippines ASEAN, APEC LOWEgypt - LOW Poland OECD, CEEC LOWEl Salvador CACM LOW Portugal OECD, EU15 HIGHEstonia CEEC LOW Romania CEEC LOWFinland OECD, EU15 HIGH Saudi Arabia - HIGHFrance OECD, EU15 HIGH Senegal - LOWGermany OECD, EU15 HIGH Singapore ASEAN, APEC LOWGreece OECD, EU15 LOW Slovenia - LOWGuatemala CACM LOW South Africa SADC LOWHong Kong APEC HIGH Spain OECD, EU15 HIGHHungary OECD, CEEC LOW Sweden OECD, EU15 HIGHIndia - LOW Thailand ASEAN, APEC LOWIndonesia ASEAN, APEC LOW Trinidad and T. - LOWIreland OECD, EU15 HIGH Tunisia - LOWIsrael - HIGH Turkey OECD LOWItaly OECD, EU15 HIGH United Kingdom OECD, EU15 HIGH
Japan OECD, APEC HIGH United States APEC, NAFTA, OECD HIGH
Jordan - LOW Uruguay MERCOSUR LOWKazakhstan - LOW Venezuela ANCOM LOWKenya - LOW Zimbabwe SADC LOW

194
Appendix 3.5. Estimation Results with Thick Market Variable and Regional Dummies
Variable SHAE90 SHAE95 SHAE00
Constant
PSE
SESG
SCST
SCRD
TERD
RDN
ANCOM
ASEAN
APEC
EU15
OECD
NAFTA
THICK90
THICK95
THICK00
-23.742 (-7.428)*
2.042 (4.006)* 0.937
(1.563) 1.883
(3.398)* -
-
0.210 (1.384)
-
1.859 (1.976)*** 1.729
(2.309)** 1.011 (1.281) 2.019
(3.042)* -
0.430 (2.532)**
-
-
-23.009 (-6.122)*
-
1.752 (2.421)** 1.586
(2.814)* 1.062
(3.309)* -1.146 (-3.449)* 0.517
(2.804)* -
-
1.244 (1.925)*** 2.129
(3.215)* -
2.596 (2.354)**
-
0.433 (2.547)**
-
-26.141 (-7.510)*
-
2.240 (3.556)* 1.487 (2.583)**
-
-
-
-
3.783 (4.680)*
-
-
2.506 (4.345)*
1.818 (1.663)***
-
0.603 (3.845)*
Test statistics, n=70 R2
D-WF-statisticWald(1) Wald(2) LM
0.77 2.16 22.5* 15.4* 8.53* 3.08
0.76 1.82 21.4* 5.86** 6.90* 2.87
0.74 2.10 29.9* 43.4* 10.4* 0.29

195
Appendix for Chapter 4.
Appendix 4.1. Lagged dependent Variable as Explanatory Variable
Variable OUTIMVA90 OUTIMVA95 OUTEXVA85
Constant
OUTIMVA85
OUTIMVA90
OUTEXVA90
LABCOST85
LABCOST90
CAPPROD90
LABCOST00
MACH
ELMACH
TRANS
BELGIUM
FRANCE
ITALY
NETHERLANDS
PORTUGAL
SWEDEN
UK
-0.186(-6.025)*
0.769(9.182)*
-
-
0.704(17.17)*
-
0.009(3.487)*
-
0.129(3.868)*
0.104(3.080)*
0.284(6.244)*
-
-
-
0.134(3.148)*-0.177
(-3.257)*-
-
-0.012(-0.368)
-
0.730(9.638)*
-
-
-0.614(-3.722)*
-
0.698(3.940)*0.153
(3.382)*0.147
(3.339)*0.361
(5.539)*0.156
(2.927)*-
-0.087(-1.624)
-
-
-
-
-0.055(-4.068)*
-
-
0.426(11.58)*0.083
(7.197)*-
0.006(2.348)**
-
-
0.023(2.085)**0.046
(2.663)**0.030
(2.024)**0.033
(2.344)**0.027
(2.688)*0.042
(2.688)*-
0.032(2.016)**0.055
(4.091)*Test statistics, n = 72
D-WF-statisticWald(1)Wald(2)Wald(3)LM
0.952.10
147.3*-
R2
12.2*294.6*1.75
0.911.6781.4*
-9.14*
-2.13
0.941.7879.1*
-3.72**51.8*1.13

196
Appendix 4.2. Dependent Variable: Change in Imported IntermediateProducts
Variable OUTIMCH8590 OUTIMCH9095 OUTIMCH9500
Constant
LABPRCH8590
CAPRCH9095
LABPRCH9500
TEXT
WOODPAPER
MACH
ELMACH
TRANS
BELGIUM
DENMARK
FINLAND
ITALY
NETHERLANDS
PORTUGAL
SPAIN
SWEDEN
0.145(0.74)6.769
(3.15)*-
-
-
0.790 (3.76)*0.651
(3.08)*0.527(2.51)**
-
-
-
-0.273(-1.00)-0.361(-1.32)-0.436(-1.60)
-
-0.311(-1.13)
0.142 (2.35)*
-
1.219 (1.52)***
-
-
-
0.290(2.51)**0.318
(2.72)*0.379
(3.21)*-
0.493 (3.17)*
-
-
-
-
0.272 (1.73)***
-
1.221 (7.97)*
-
-
-1.877(-1.07)-1.219
(-6.16)*-0.977
(-4.94)*-0.878
(-4.44)*-
-0.888 (-4.48)
-
-0.374 (-1.56)
-
-
-
-0.294 (-1.22)
-
-
Test statistics, n = 72R2
D-WF-statisticWald(1)Wald(2)Wald(3)LM
0.361.084.4*9.95*
--
23.6*
0.301.984.7*
-2.30
-0.39
0.471.418.3*1.15
--
19.9*

197
Appendix 4.3. Dependent Variable: Change in Exported Intermediate Products
Variable OUTEXCH8590 OUTEXCH9095 OUTEXCH9500
Constant
CAPRCH8590
LABPRCH9095
LABCOCH9095
CAPRCH9095
LABCOCH9500
CAPRCH9500
FOOD
TEXT
WOODPAPER
MACH
ELMACH
TRANS
BELGIUM
DENMARK
GERMANY
FRANCE
ITALY
NETHERLANDS
SWEDEN
UK
1.481 (8.18)*3.540
(3.24)*-5.685(-2.50)**
-
1.756(1.29)
-
-
-1.744 (-10.0)*
-
0.757(4.30)*
-
-
-
-
-
-0.665(-2.69)**
-
-0.239(-1.00)0.429(1.58)-0.383(-1.55)-0.727
(-3.03)*
0.462 (7.23)*
-
-
1.776(1.71)***1.996(2.07)**
-
1.735(1.70)***
-
-0.282(-2.44)**
-
-
-
0.197 (1.64)***0.378(2.30)**0.591
(3.41)*-
-
-
-
-
-
-0.041(-0.36)
-
-
-
-
-1.292(-1.26)-0.867(-0.84)2.103
(14.0)*-
0.141(0.94)0.320(2.14)**0.474
(3.13)*0.328(2.20)**
-
-0.512 (-3.02)*
-
0.181(1.14)
-
-
-0.167(-1.06)
-
Test statistics. n = 72R2
D-WF-statisticWald(1)Wald(2)Wald(3)LM
0.731.9116.7*6.26*8.26*
-4.65
0.322.184.4*
-2.88***2.93***1.11
0.831.9828.8*
-0.701.606.61**
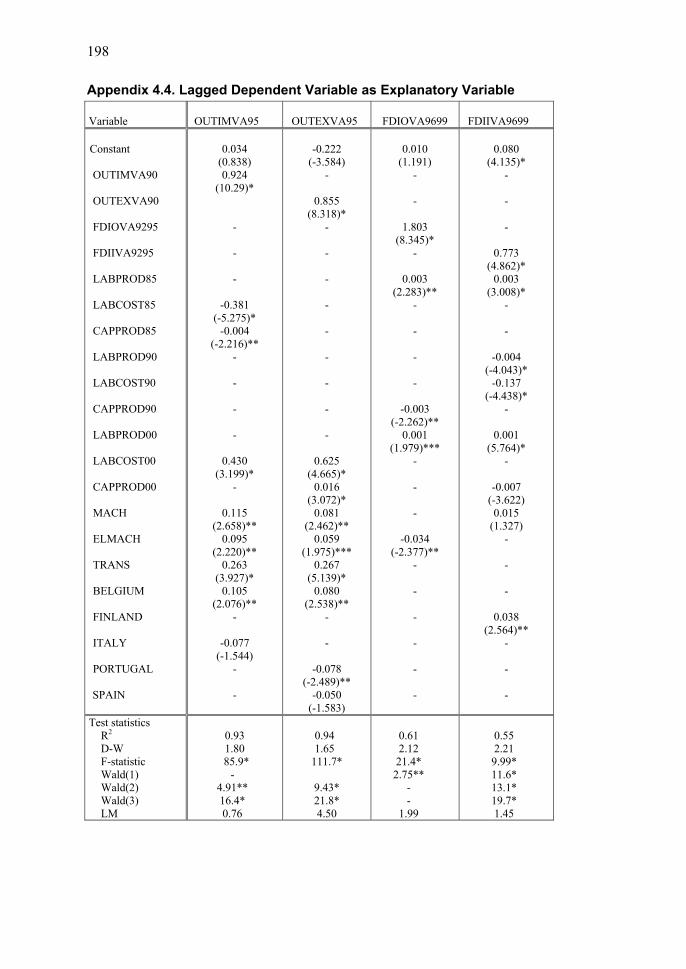
198
Appendix 4.4. Lagged Dependent Variable as Explanatory Variable
Variable OUTIMVA95 OUTEXVA95 FDIOVA9699 FDIIVA9699
Constant
OUTIMVA90
OUTEXVA90
FDIOVA9295
FDIIVA9295
LABPROD85
LABCOST85
CAPPROD85
LABPROD90
LABCOST90
CAPPROD90
LABPROD00
LABCOST00
CAPPROD00
MACH
ELMACH
TRANS
BELGIUM
FINLAND
ITALY
PORTUGAL
SPAIN
0.034(0.838)0.924
(10.29)*
-
-
-
-0.381(-5.275)*
-0.004(-2.216)**
-
-
-
-
0.430(3.199)*
-
0.115(2.658)**
0.095(2.220)**
0.263(3.927)*
0.105(2.076)**
-
-0.077(-1.544)
-
-
-0.222(-3.584)
-
0.855(8.318)*
-
-
-
-
-
-
-
-
-
0.625(4.665)*
0.016(3.072)*
0.081(2.462)**
0.059(1.975)***
0.267(5.139)*
0.080(2.538)**
-
-
-0.078(-2.489)**
-0.050(-1.583)
0.010(1.191)
-
-
1.803(8.345)*
-
0.003(2.283)**
-
-
-
-
-0.003(-2.262)**
0.001(1.979)***
-
-
-
-0.034(-2.377)**
-
-
-
-
-
-
0.080(4.135)*
-
-
-
0.773(4.862)*
0.003(3.008)*
-
-
-0.004(-4.043)*
-0.137(-4.438)*
-
0.001(5.764)*
-
-0.007(-3.622)0.015
(1.327)-
-
-
0.038(2.564)**
-
-
-
Test statisticsR2
D-WF-statisticWald(1)Wald(2)Wald(3)LM
0.931.8085.9*
-4.91**16.4*0.76
0.941.65
111.7*
9.43*21.8*4.50
0.612.1221.4*
2.75**--
1.99
0.552.219.99*11.6*13.1*19.7*1.45

199
Appendix for Chapter 5.
Appendix 5.1. CEE Shares of EU Exports and Imports in 2000
Share of EU
exports to CEE in
parts and
components
Share of EU
imports from CEE
in parts and
components
Share of EU
exports to CEE in
manufacturing
(SITC7)
Share of EU imports
from CEE in
manufacturing
(SITC7)
Bulgaria 0.1 0.1 0.3 0.1
Cyprus 0.1 .. 0.1 0.0
Czech Republic 2.7 3.4 2.3 2.6
Estonia 0.4 0.3 0.3 0.3
Hungary 4.3 4.0 2.5 3.7
Lithuania 0.1 0.0 0.2 0.1
Latvia 0.1 0.0 0.2 0.0
Malta 0.1 0.0 0.2 0.1
Poland 2.5 1.7 3.0 2.2
Romania 0.5 0.4 0.6 0.4
Slovak Republic 1.1 0.7 0.8 1.0
Slovenia 0.6 0.7 0.7 0.6
Total 12.6 11.4 11.3 11.0
Source: COMTRADE

200
Appendix 5.2. CEE Exports and Imports with EU in Parts and Components, Million EUR
Imports from EU 1993 % 1995 % 1997 % 2000 %Bulgaria .. .. .. .. 98.1 1.1 163.8 1.1Cyprus 57.0 2.6 62.5 1.4 77.4 0.9 122.7 0.8Czech Republic 529.1 24.4 1374.4 30.4 1986.1 21.9 3221.1 21.0Estonia .. .. 166.9 3.7 247.9 2.7 461.6 3.0Hungary 485.4 22.4 630.7 14.0 2330.2 25.7 5169.0 33.7Lithuania .. .. 67.0 1.5 131.7 1.5 135.5 0.9Latvia .. .. 48.3 1.1 81.7 0.9 177.4 1.2Malta 83.6 3.9 84.6 1.9 99.4 1.1 105.4 0.7Poland 562.3 26.0 1186.1 26.3 2334.7 25.7 3019.9 19.7Romania 169.1 7.8 269.7 6.0 317.4 3.5 643.4 4.2Slovak Republic .. .. 195.0 4.3 811.6 8.9 1377.6 9.0Slovenia 278.2 12.9 430.2 9.5 560.3 6.2 728.3 4.8Total 2164.7 100.0 4515.4 100.0 9076.6 100.0 15325.8 100.0
Exports to EU 1993 % 1995 % 1997 % 2000 %Bulgaria .. .. .. .. 36.1 0.7 62.9 0.5Cyprus 1.2 0.1 2 0.0 2.5 0.0 .. ..Czech Republic 280.0 24.1 1214 38.6 1643.0 31.0 3764.8 30.0Estonia .. .. 107 3.4 175.6 3.3 353.0 2.8Hungary 384.7 33.1 739 23.5 1553.0 29.3 4431.9 35.4Lithuania .. .. 5 0.2 10.1 0.2 24.6 0.2Latvia .. .. 9 0.3 22.2 0.4 13.2 0.1Malta 24.3 2.1 55 1.7 44.1 0.8 53.9 0.4Poland 209.3 18.0 451 14.4 837.7 15.8 1874.7 15.0Romania 20.0 1.7 79 2.5 128.1 2.4 468.9 3.7Slovak Republic .. .. 148 4.7 454.0 8.6 768.2 6.1Slovenia 244.1 21.0 336 10.7 397.1 7.5 716.5 5.7Total 1163.5 100.0 3144 100.0 5303.5 100.0 12532.8 100.0
Source: COMTRADE