Embed Size (px)
Citation preview
Journal of Finance and Accountancy
Empirical evidence of financial, page 1
Empirical evidence of financial statement manipulation during
economic recessions
Cristi Tilden
Deloitte, LLP
Troy Janes
Rutgers University School of Business-Camden
ABSTRACT
This paper uses Benford’s Law, a mathematical law that predicts the frequency of
naturally occurring numbers, to investigate the occurrence of the intentional manipulation of
reported financial statement numbers during recessionary times. The analysis shows that
reported financial statement data generally conforms to Benford’s Law. However, in periods
surrounding recessions occurring since 1950, reported financial statement numbers fail to
conform, indicating an increased level of manipulation. It is important to note that the data used
in this study has been restated to correct the effects of financial statement manipulations that
have been caught and corrected. Therefore, the results of this study indicate that, during
recessionary times, there is a certain level of financial statement manipulation that goes
undetected—most likely because the manipulations are corrected when the economy improves
and are not exposed by events such as bankruptcy. It is also important to note that the tests in
this study cannot distinguish between manipulations that may be within the parameters of
generally accepted accounting procedures and those that may cross the line into fraud.
Keywords: Financial statement manipulation, earnings management, recession, Benford’s Law,
fraud
Copyright statement: Authors retain the copyright to the manuscripts published in AABRI
journals. Please see the AABRI Copyright Policy at http://www.aabri.com/copyright.html.
Journal of Finance and Accountancy
Empirical evidence of financial, page 2
INTRODUCTION
Earnings management has been described as the opportunistic manipulation of reported
financial statement numbers (Schipper, 1989). Prior studies have documented an association
between earnings management and declining firm performance. For instance, DeFond and
Subramanyam (1998) find evidence of earnings management preceding a change in auditors
(auditor changes are generally interpreted as a negative signal about firm performance). Dechow,
Sloan, and Sweeney (1996) document that firms that manage earnings are more likely to be
subject to SEC enforcement actions for violations of generally accepted accounting principles.
Xie (2001), Dichev and Skinner (2002) and DeFond and Jiambalvo (1994) have all shown that
firms attempt to manipulate earnings to avoid problems such as debt covenant violations.
Other studies have shown that firms manage earnings to delay or avoid filing for
bankruptcy. This concept is illustrated in the bankruptcy of the airline Swissair in 2001.
Throughout the 1990s, Swissair utilized several methods, including income increasing
accounting accruals, to create an inaccurate perception of financial strength. This perception of
strength allowed the company to pursue a growth strategy instead of addressing its problems.
This strategy ultimately resulted in bankruptcy and liquidation for the airline (Jorissen and Otley,
2009).
Recent research on bankruptcy emergence provides further support for this idea. Bryan,
Tiras, and Wheatley (2002) find that bankrupt firms that made income increasing accounting
choices prior to bankruptcy have a lower chance of emerging from bankruptcy. The authors
theorize that the use of income-increasing accounting choices delays the filing of bankruptcy
until the firm’s financial problems are deeper, thus resulting in a lower likelihood that the firm
will be able to successfully reorganize and emerge from bankruptcy.
In addition to the studies cited above, there have been many papers that document
increases in levels of occupational fraud (e.g. employee theft) during economic declines
(Pomeranz, 1995; Levisohn, 2009; Malamed, 2010). During economic downturns, corporate
earnings decline, placing pressures on firms similar to those previously studied. However, no
prior study formally documents an increased existence of earnings management during these
periods.
Most of the academic studies cited above use a measure of discretionary accruals to
proxy for earnings management, hypothesizing that increased discretionary accruals indicate the
opportunistic manipulation of financial reporting numbers. This study uses a mathematical law
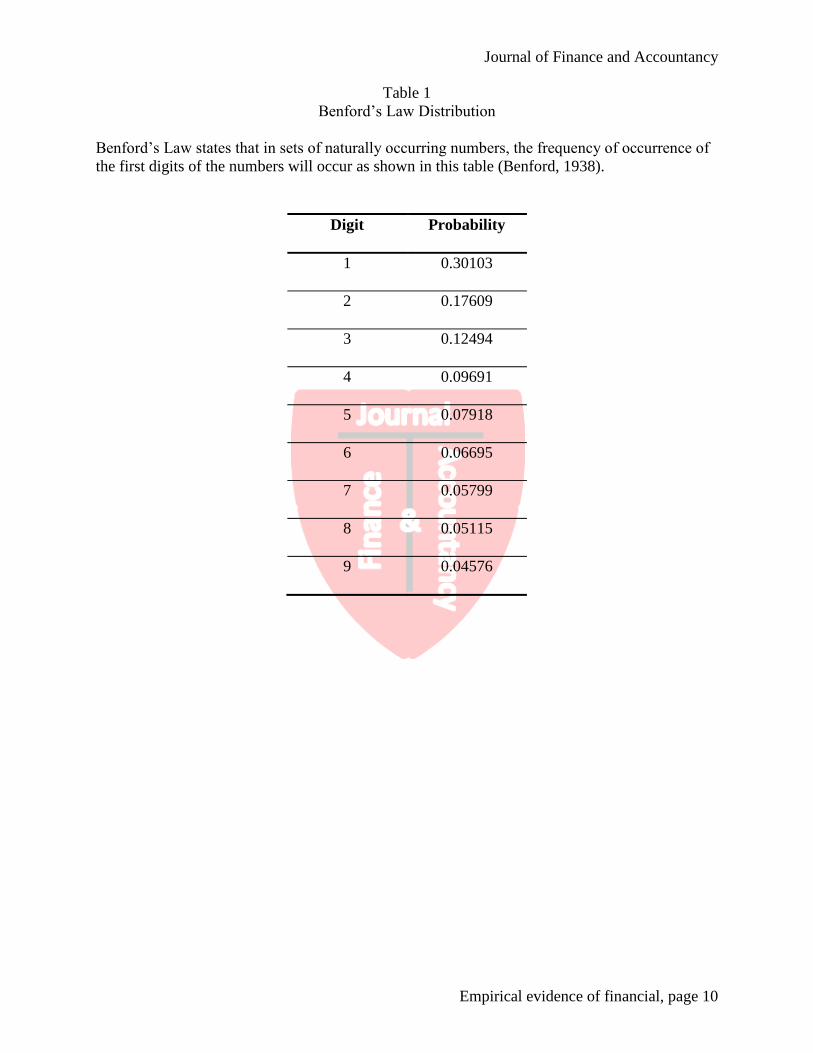
known as Benford’s Law to identify the presence of manipulated numbers. Benford’s Law
implies that, in a naturally occurring set of numbers, the leading digits of the numbers are
discrete exponentially distributed rather than uniformly distributed; meaning that the numbers
one through nine do not have equal probability of occurring (Phillips, n.d.). Table 1 (Appendix)
shows the frequency of occurrence predicted by Benford’s Law of the first digit in a series of
data. Because Benford’s Law shows that there is some predictability in the distribution of the
first digit in a series of data, it can be used to indicate the presence of fictitious or artificially
manipulated numbers. Benford’s law analysis has been used to detect fraudulent scientific data
(Diekmann, 2007), voter fraud (Bruenig and Goerres, 2011; Battersby, 2009), and campaign
finance fraud (Tam Cho and Gaines, 2007), among other things.
In the context of financial reporting, the lack of compliance with Benford’s Law may
indicate fraud. Many times financial professionals use Benford's Law analysis as an
investigative tool in the search for fraud (Blasi, 2010; Bowen, 2010; Gadawaski, 2010). An
Journal of Finance and Accountancy
Empirical evidence of financial, page 3
example is using Benford’s Law analysis to detect the presence of non-naturally occurring
numbers (i.e. numbers that have been falsified) on a group of tax returns (May, 2010) or use of
the analysis to detect check fraud (McConville, 1995).
Benford’s Law analysis has also been used in academic accounting studies. Quick and
Wolz (2005) show that German financial reporting data complies well with Benford’s Law.
Carslaw (1988) and Skousen, Guan, and Wetzel (2004) have used Benford’s Law analysis to
provide evidence of earnings management in New Zealand and Japanese accounting data.
Nigrini (2005) uses Benford’s Law to identify wide-scale earnings management in the period
around the Enron crisis, and in Enron’s reported financial statement numbers, in particular.
This paper adds to the accounting literature by providing evidence from Benford’s Law
that documents that earnings management activity increases during economic downturns.
SAMPLE
Benford's Law can be used to perform fraud analysis on large sets of accounting data.
However, there are certain criteria that contribute to the law being most accurate and applicable:
1. Variability in the data
2. No requirement of minimum, maximum, or repeating numbers
3. Large sample size
4. Results of standard transactions or calculations
5. Numbers that are created by humans will not conform (Kyd, 2007)
Criterion 4, which states that Benford’s Law is applicable to the results of standard
transactions or calculations, applies to "sets of numbers that result from mathematical
combination of numbers or results that come from two distributions. An example of two
distributions would be Accounts Receivable (price x amount sold)" (Durtschi, Hillison, and Carl,
2004). Criterion 5, referring to numbers created by humans, refers to items such as check
numbers (Durtschi, et al , 2004). These items provide a basis for what type of accounts and data
are appropriate for use Benford's Law analysis. Data meeting these criteria should conform to
Benford’s Law, and lack of conformity in data meeting the above criteria indicates the presence
of manipulated or falsified data. As described in the previous section, prior studies have shown
that financial reporting data meets these criteria.
To use Benford's Law to detect earnings manipulation during economic downtowns, this
study examines financial reporting data from all available firms during economic recessions
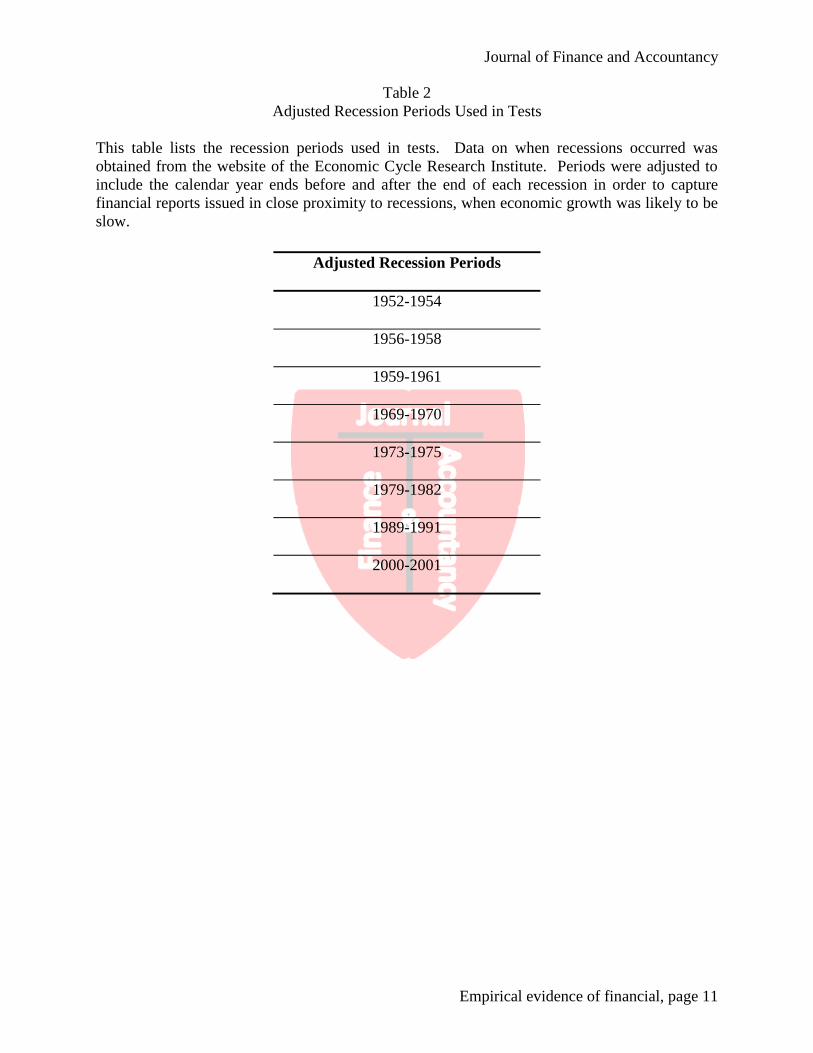
occurring since 1950. Dates of recession periods were obtained from the website of the
Economic Research Cycle Institute. Many recession periods lasted less than a full year, so for
the purpose of this study, a window around the recession periods that included the December
before and after the end of the recession period was examined. This was done to ensure that the
sample included the last reporting period before and after the recession period for companies
with the fiscal typical year end of December. Lastly, the years 1979-1980 were combined with
1981-1982 due to the double-dip recession during those years. Table 2 (Appendix) shows the
adjusted recession periods.
To test for manipulation of financial statement amounts, accounts that are most prone to
fraud and manipulation were selected. In its Fraud Examiners’ Manual, the Association of
Certified Fraud Examiners reports that their studies show that the following are the most
common indicators of financial reporting fraud: increasing expenses, increasing cost of goods
Journal of Finance and Accountancy
Empirical evidence of financial, page 4
sold, increasing receivables combined with decreasing cash, increasing inventories, increasing
sales combined with decreasing cash, and increasing of sales returns and allowances (ACFE,
2010). Based on these findings, net sales, net income, inventory, and allowance for doubtful
accounts were selected for testing.
Data was obtained from the Compustat database and includes all available data for the
selected variables in the periods under examination. Note that prior to 1969, the Compustat
database does not contain sufficient data on Allowance for Doubtful Accounts to conduct an
analysis. Therefore, an analysis of that account was only conducted for the adjusted recession
periods beginning in 1969 and after.
It is important to note that the data included in the Compustat database has been restated
for companies that have published financial statements that were subsequently restated due to
accounting errors or financial reporting fraud. Thus, results of tests using Compustat data will
provide evidence of financial statement manipulations that have gone undetected.
RESULTS
For each recession period, data for each test variable was analyzed for conformity with
Benford’s Law. As a baseline, data for the test variables for all companies from 1950 to 2006
was analyzed. The results of this analysis are presented graphically in Figures 1 through 4
(Appendix) and numerically in Tables 3 through 6 (Appendix), alongside the results of testing
recession period data. The results of these tests indicate that the reported financial statement data
complies with Benford’s Law. Following Nigrini (2000), z-tests were also performed which
indicate that there is no statistical difference between the distribution of test variables and the
Benford’s Law distribution. The results of the z-tests are also presented in Tables 3 through 6
(Appendix).
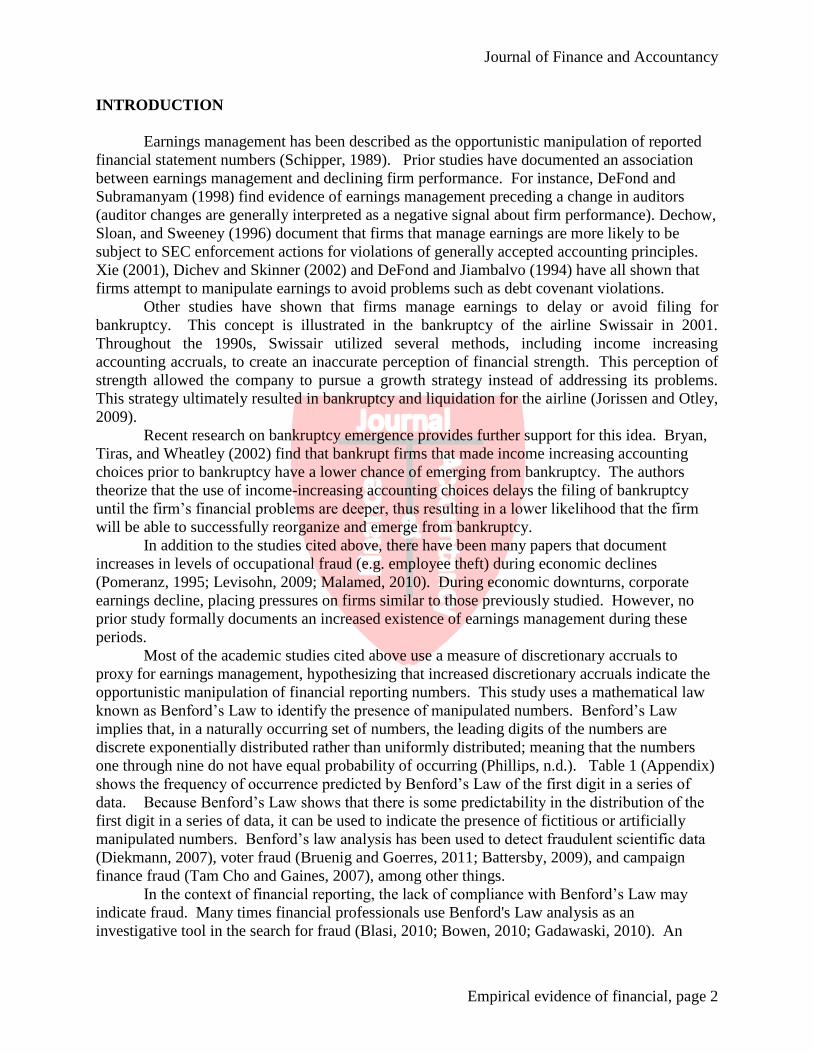
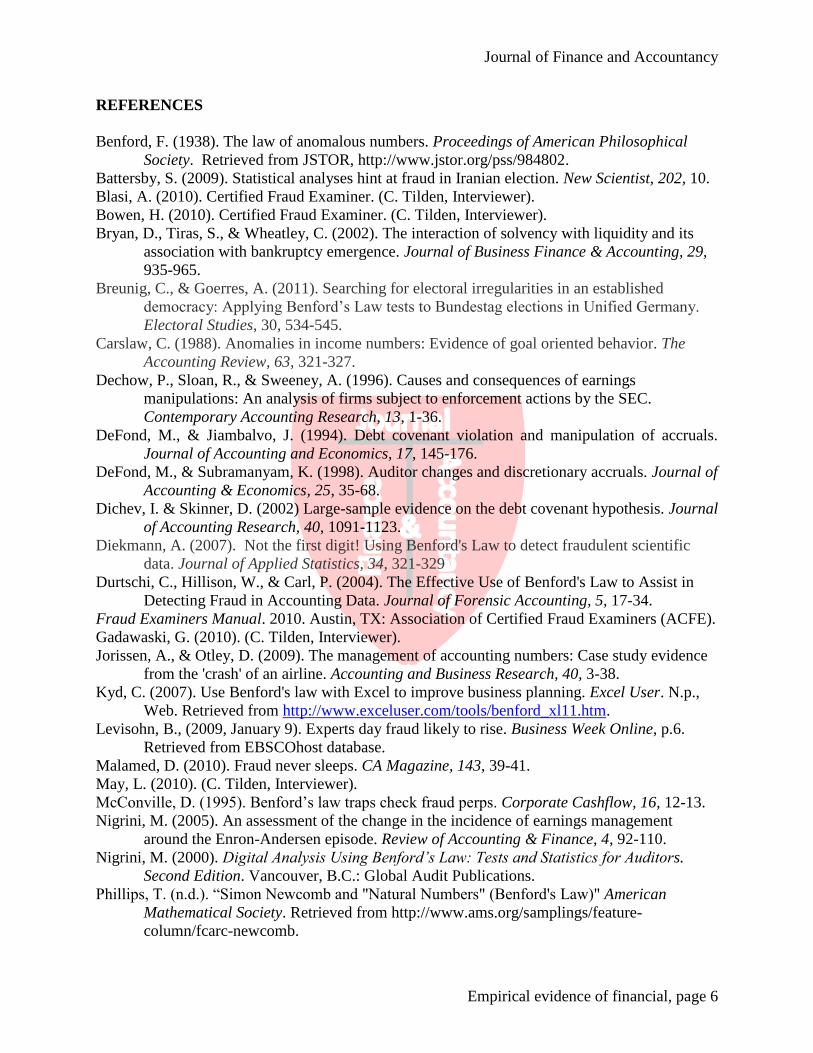
Figure 1 (Appendix) shows the results of tests on net sales. The bar graph compares the
actual distribution of the first digits in reported net sales data during the test period (i.e. adjusted
recession periods) to the distribution of all years’ data and the Benford's Law distribution.
Graphically, Figure 1 shows that reported data for all years follows the Benford’s Law
distribution. Net sales data, however, appears to deviate somewhat from the Benford’s Law
distribution.
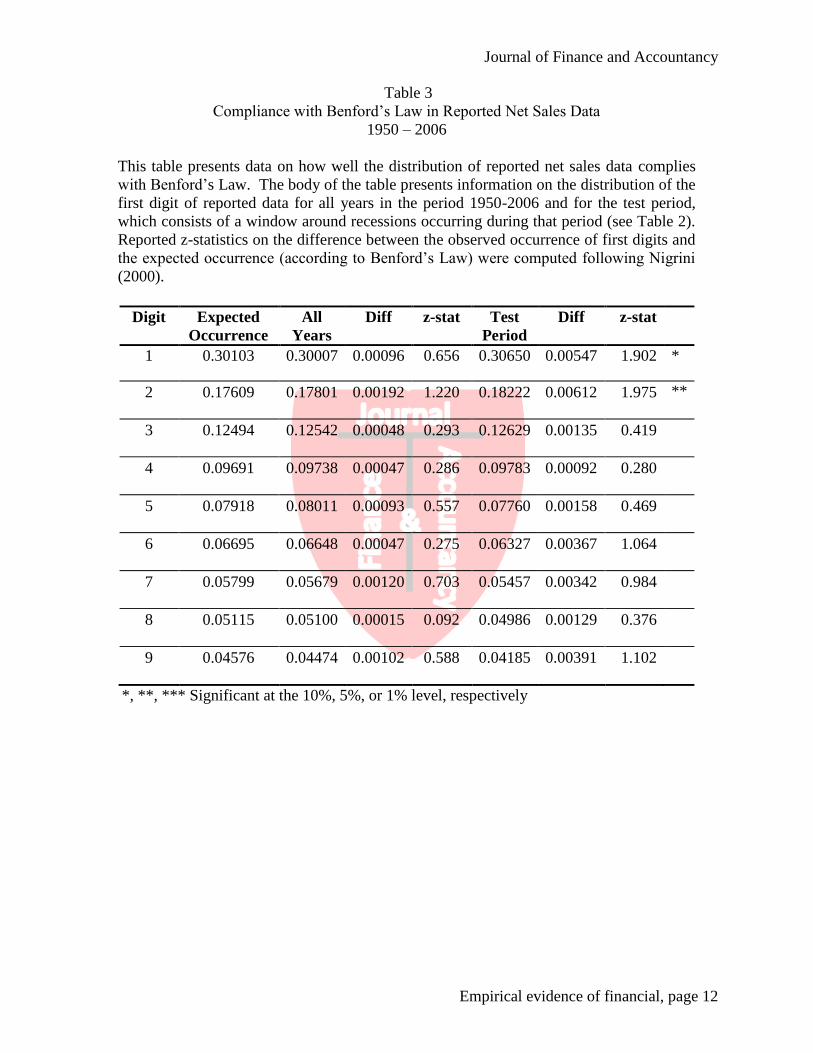
Table 1 (Appendix) presents numerical data for net sales for all years and for the test
period. A z-test of the difference between the data from all years and the expected occurrences
under Benford’s Law and the data from the test period and Benford’s Law is also presented. The
z-statistics reported in the table show that there is, statistically, no difference between the
distribution of net sales data from all years and the distribution expected from Benford’s Law.
Z-statistics for the difference between the test period and the expected occurrences indicate only
minor differences between the recession period data and the expected occurrences under
Benford’s Law. Taken together with the results depicted in Figure 1, there is only weak evidence
from Benford’s Law that net sales has been manipulated during recession periods.
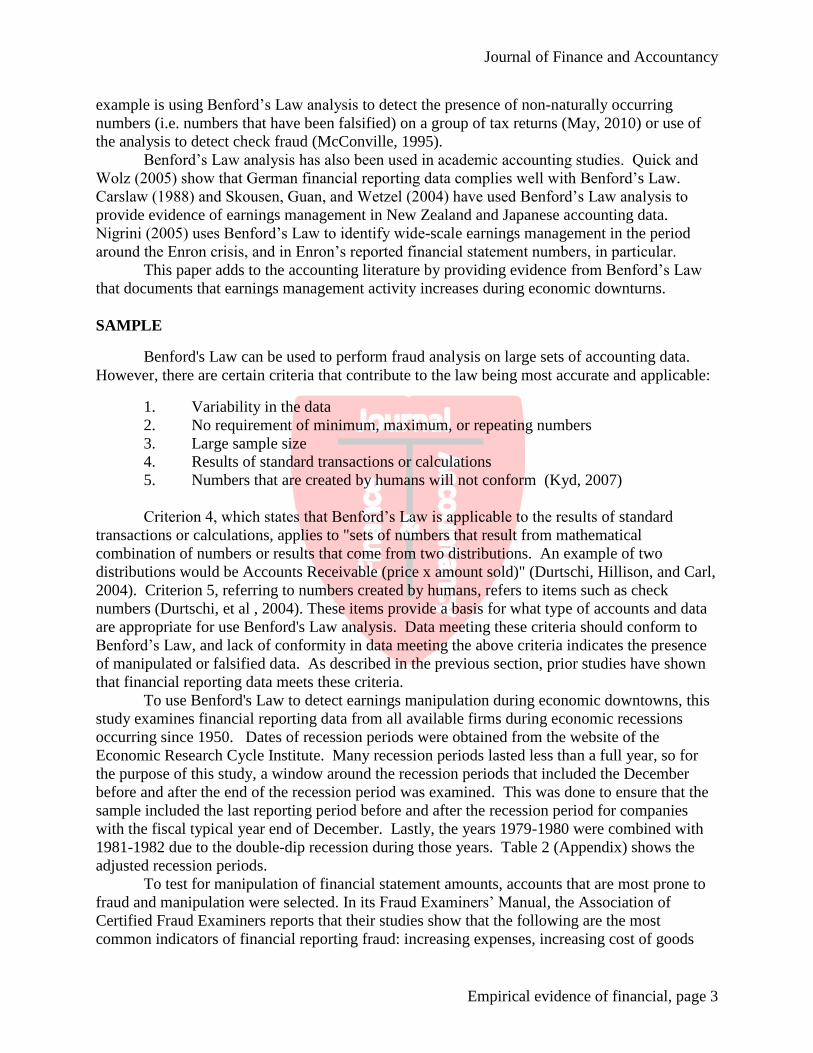
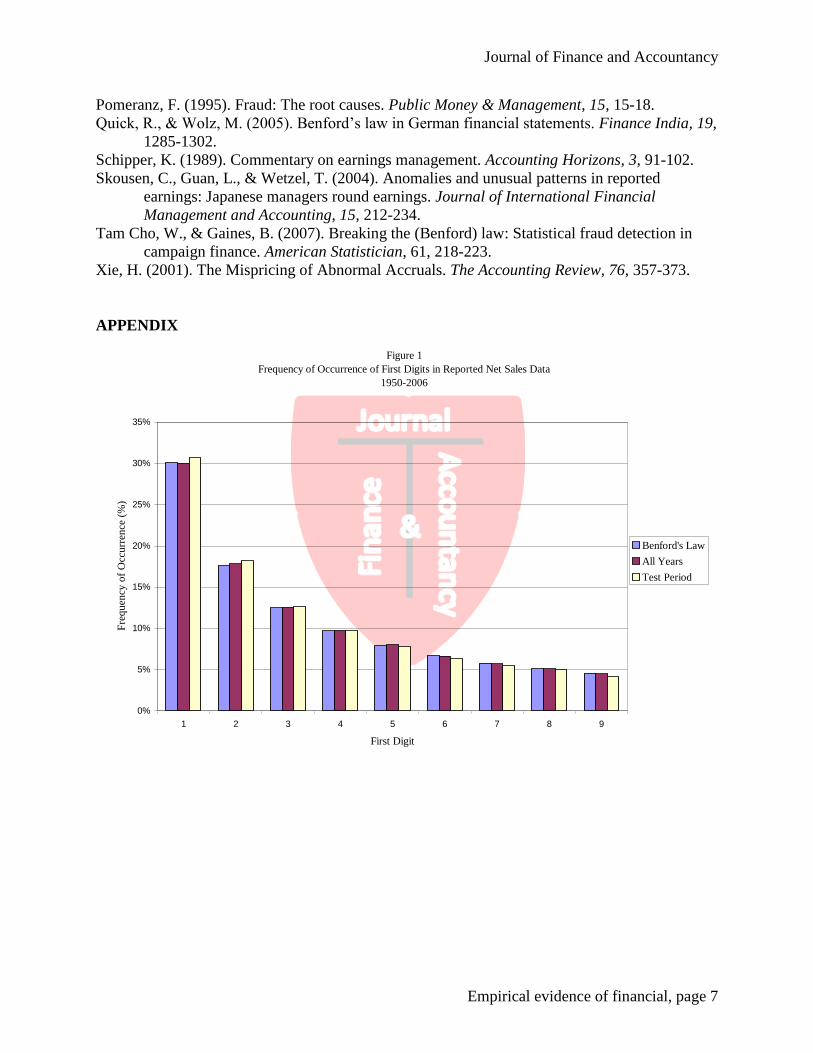
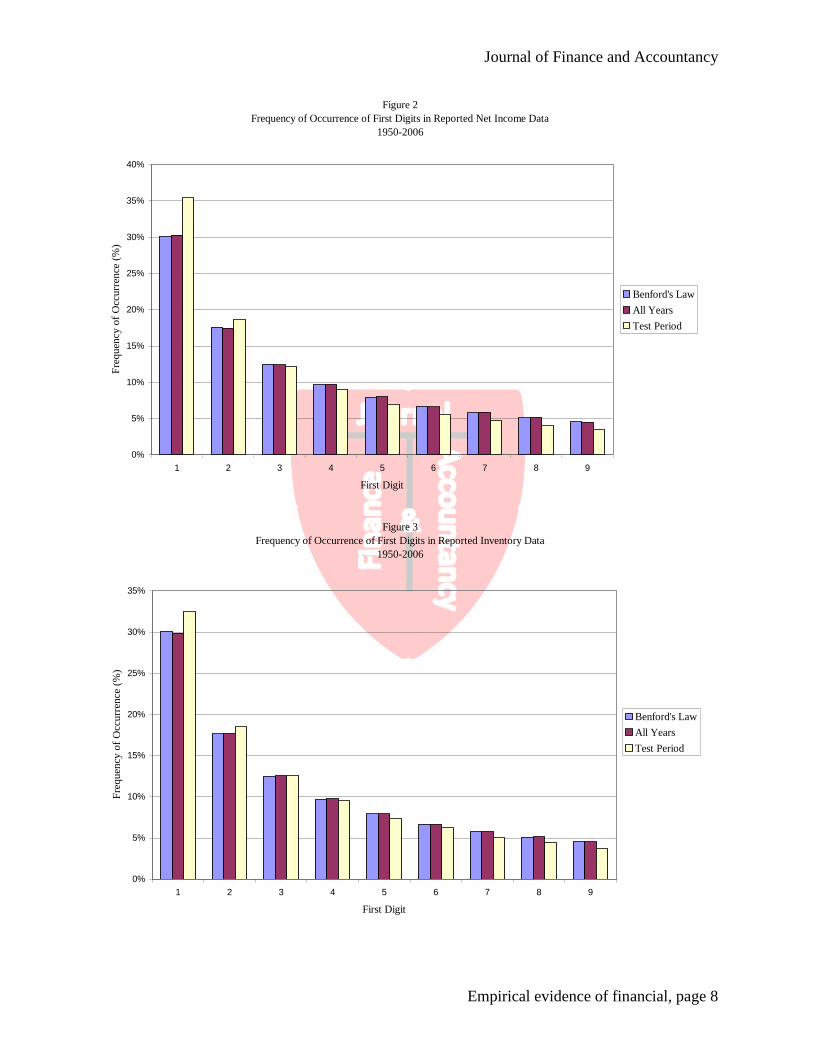
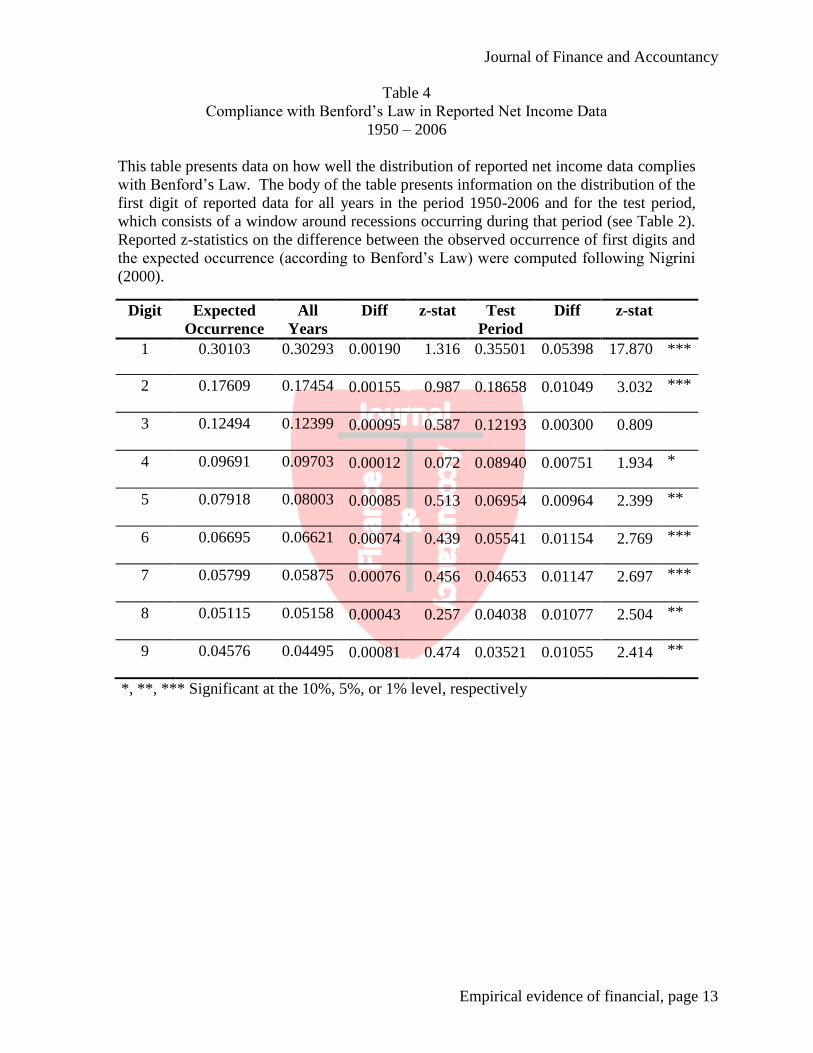
Results of tests on net income are shown in Figure 2 (Appendix). The results show that
the data from all years fits the Benford’s Law distribution quite well. The results of z-tests on
the difference between the observed net income data for all years and the expected occurrences
under Benford’s Law, presented in Table 4 (Appendix), also show that there is no statistical
difference between the observed distribution of net income data and the expected occurrences.
However, Figure 2 shows a large degree of noncompliance with Benford’s Law during the
Journal of Finance and Accountancy
Empirical evidence of financial, page 5
recession periods examined. The graphical depiction in Figure 2 is supported by the results of z-
tests presented in Table 4, which show that the difference between the recession period reported
net income data and the expected occurrences is significant at the five percent level or better for
almost all digits. These results provide strong evidence that reported net income was
manipulated during recession periods.
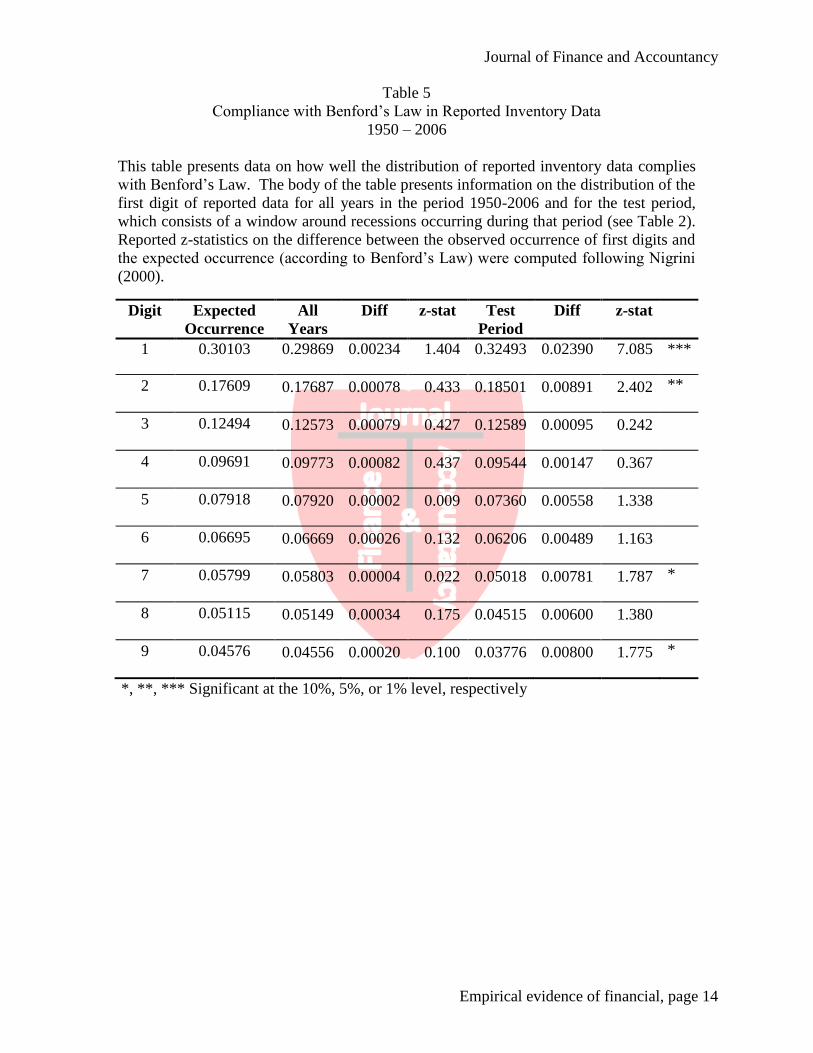
As indicated in Figure 3 (Appendix), there is evidence that reported inventory numbers
were also manipulated during recession periods. Again, the bar graph and the z-statistics
presented in Table 5 (Appendix) show that the data from all years behaves as expected. The bar
graphs show that the distribution of inventory numbers during the test period does not comply
with Benford’s Law. Z-tests of the statistical difference between the recession period data and
the expected occurrences, shown in Table 5, show that reported inventory numbers do differ
significantly from the Benford’s Law distribution.
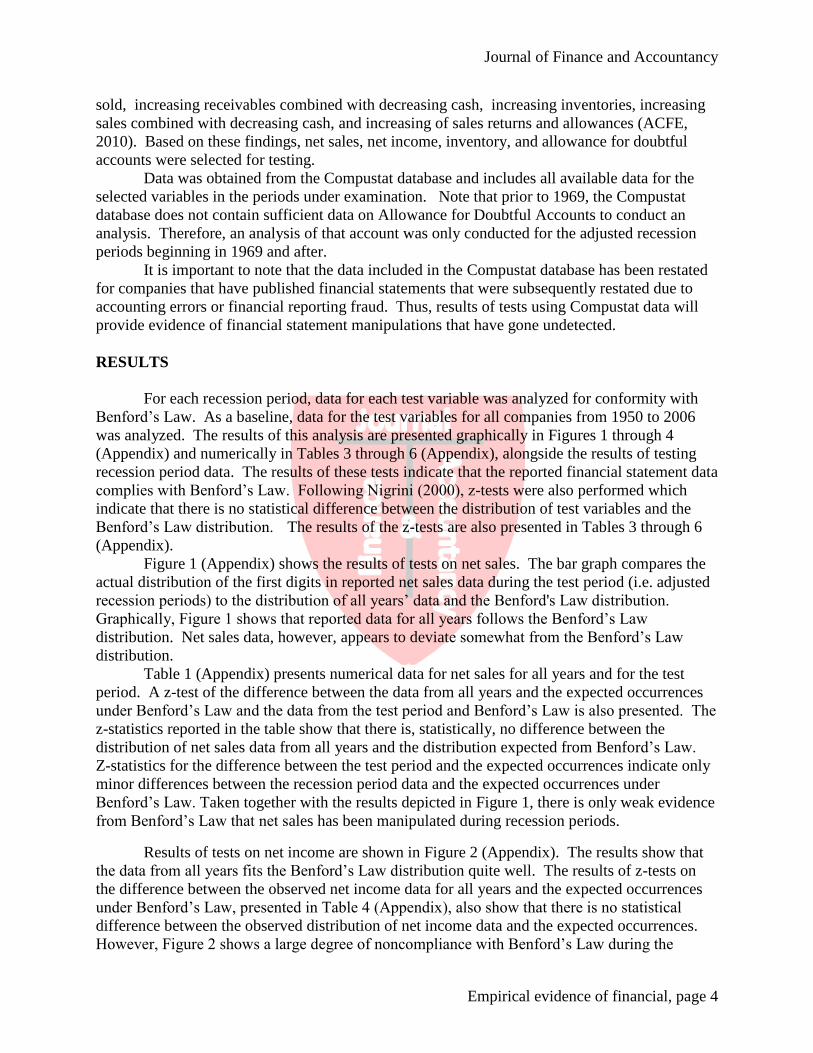
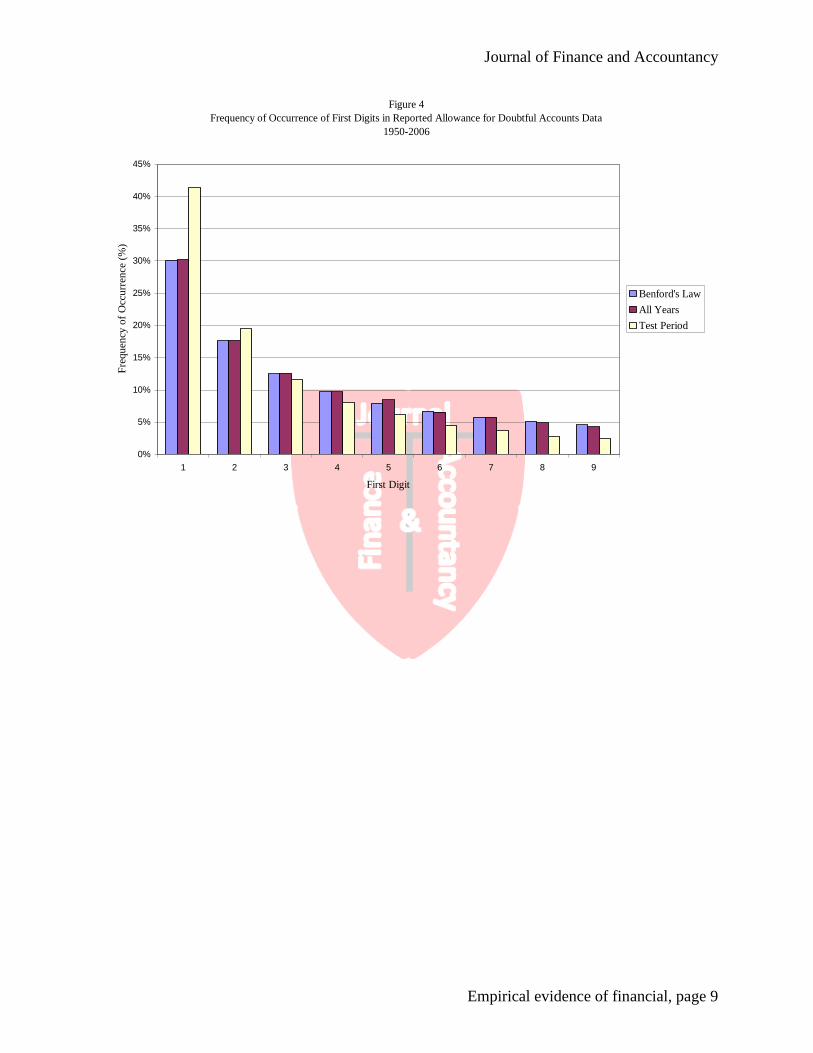
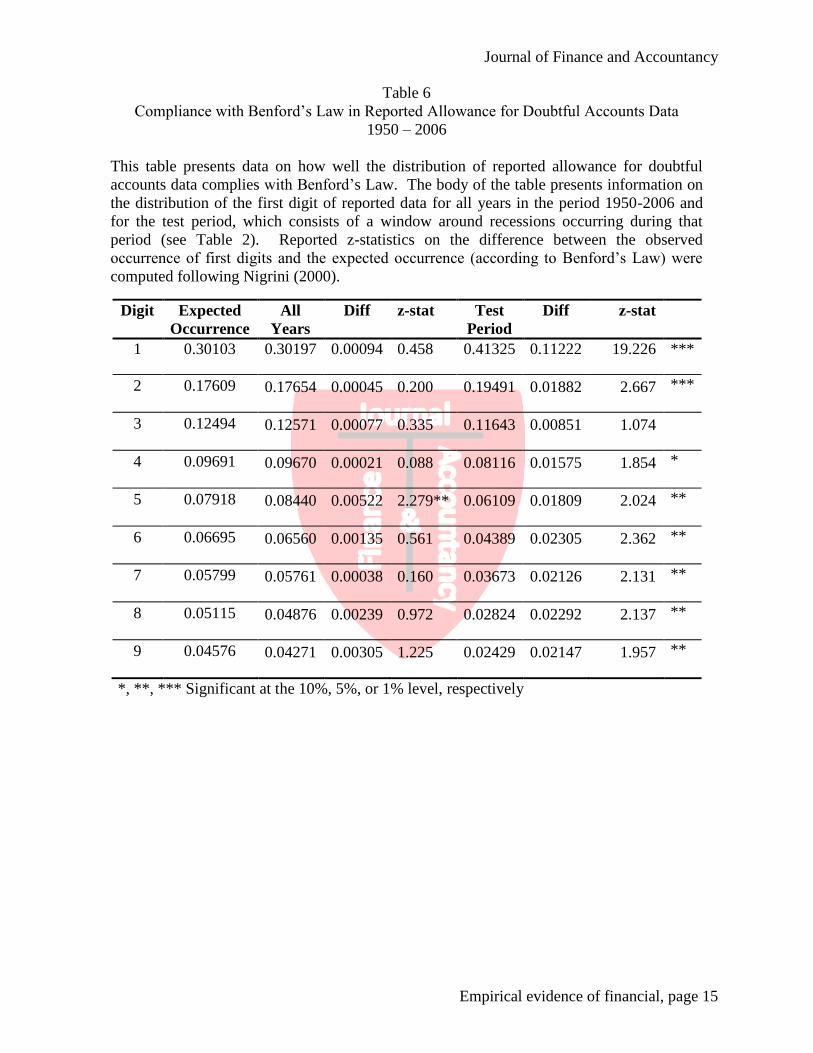
Finally, Figure 4 (Appendix) reports the results of tests on reported allowance for
doubtful accounts numbers. The results show very poor compliance with Benford’s Law in the
recession periods in the analysis, but strong compliance with the Law for the data from all years.
The results graphically depicted in Figure 4 are supported by the data reported in Table 6
(Appendix), which shows no statistical difference between the data from all years and
expectations, but strongly significant differences between the test period data and expectations.
These results may not be surprising, given that the allowance for doubtful accounts is an estimate
created by management. However, the estimate is typically computed as a consistent percentage
of credit sales or year-end accounts receivable, which meets the criteria for the applicability of
Benford’s Law. Thus, the conclusion is that allowance for doubtful accounts was manipulated a
great deal during recession periods.
CONCLUSION
Prior studies have shown that companies manipulate reported financial statement
numbers (commonly referred to as earnings management) in response to declining firm
performance. Although many studies have addressed the increased instance of occupational
fraud during economic downturns, no study to date has addressed the question of whether
financial statement manipulation increases during these times. Using Benford’s Law, a
mathematical law that is frequently used to detect the existence of falsified or manipulated data,
this study provides evidence of increased financial statement manipulation during economic
recessions. In an examination of financial reporting data surrounding recessions occurring from
1950-2006, results strongly indicate the presence of manipulated or falsified data in allowance
for doubtful accounts and net income. Results provide weaker evidence of manipulations in
inventories and net sales. These results provide evidence that firms turn to earnings
management in response to economic downturns.
It is important to note that the data used in this study has been restated to correct the
effects of financial statement manipulations that have been caught and corrected. Therefore, the
results of this study indicate that during recessionary times, there is a certain level of financial
statement manipulation that goes undetected—most likely because the manipulations are
corrected when the economy improves and are not exposed by extreme events, like bankruptcy.
It is also important to note that the tests in this study cannot distinguish between manipulations
that may be within the parameters of generally accepted accounting procedures and those that
may cross the line into fraud.
Journal of Finance and Accountancy
Empirical evidence of financial, page 6
REFERENCES
Benford, F. (1938). The law of anomalous numbers. Proceedings of American Philosophical
Society. Retrieved from JSTOR, http://www.jstor.org/pss/984802.
Battersby, S. (2009). Statistical analyses hint at fraud in Iranian election. New Scientist, 202, 10.
Blasi, A. (2010). Certified Fraud Examiner. (C. Tilden, Interviewer).
Bowen, H. (2010). Certified Fraud Examiner. (C. Tilden, Interviewer).
Bryan, D., Tiras, S., & Wheatley, C. (2002). The interaction of solvency with liquidity and its
association with bankruptcy emergence. Journal of Business Finance & Accounting, 29,
935-965.
Breunig, C., & Goerres, A. (2011). Searching for electoral irregularities in an established
democracy: Applying Benford’s Law tests to Bundestag elections in Unified Germany.
Electoral Studies, 30, 534-545.
Carslaw, C. (1988). Anomalies in income numbers: Evidence of goal oriented behavior. The
Accounting Review, 63, 321-327.
Dechow, P., Sloan, R., & Sweeney, A. (1996). Causes and consequences of earnings
manipulations: An analysis of firms subject to enforcement actions by the SEC.
Contemporary Accounting Research, 13, 1-36.
DeFond, M., & Jiambalvo, J. (1994). Debt covenant violation and manipulation of accruals.
Journal of Accounting and Economics, 17, 145-176.
DeFond, M., & Subramanyam, K. (1998). Auditor changes and discretionary accruals. Journal of
Accounting & Economics, 25, 35-68.
Dichev, I. & Skinner, D. (2002) Large-sample evidence on the debt covenant hypothesis. Journal
of Accounting Research, 40, 1091-1123.
Diekmann, A. (2007). Not the first digit! Using Benford's Law to detect fraudulent scientific
data. Journal of Applied Statistics, 34, 321-329
Durtschi, C., Hillison, W., & Carl, P. (2004). The Effective Use of Benford's Law to Assist in
Detecting Fraud in Accounting Data. Journal of Forensic Accounting, 5, 17-34.
Fraud Examiners Manual. 2010. Austin, TX: Association of Certified Fraud Examiners (ACFE).
Gadawaski, G. (2010). (C. Tilden, Interviewer).
Jorissen, A., & Otley, D. (2009). The management of accounting numbers: Case study evidence
from the 'crash' of an airline. Accounting and Business Research, 40, 3-38.
Kyd, C. (2007). Use Benford's law with Excel to improve business planning. Excel User. N.p.,
Web. Retrieved from http://www.exceluser.com/tools/benford_xl11.htm.
Levisohn, B., (2009, January 9). Experts day fraud likely to rise. Business Week Online, p.6.
Retrieved from EBSCOhost database.
Malamed, D. (2010). Fraud never sleeps. CA Magazine, 143, 39-41.
May, L. (2010). (C. Tilden, Interviewer).
McConville, D. (1995). Benford’s law traps check fraud perps. Corporate Cashflow, 16, 12-13.
Nigrini, M. (2005). An assessment of the change in the incidence of earnings management
around the Enron-Andersen episode. Review of Accounting & Finance, 4, 92-110.
Nigrini, M. (2000). Digital Analysis Using Benford’s Law: Tests and Statistics for Auditors.
Second Edition. Vancouver, B.C.: Global Audit Publications.
Phillips, T. (n.d.). “Simon Newcomb and "Natural Numbers" (Benford's Law)" American
Mathematical Society. Retrieved from http://www.ams.org/samplings/feature-
column/fcarc-newcomb.
Journal of Finance and Accountancy
Empirical evidence of financial, page 7
Pomeranz, F. (1995). Fraud: The root causes. Public Money & Management, 15, 15-18.
Quick, R., & Wolz, M. (2005). Benford’s law in German financial statements. Finance India, 19,
1285-1302.
Schipper, K. (1989). Commentary on earnings management. Accounting Horizons, 3, 91-102.
Skousen, C., Guan, L., & Wetzel, T. (2004). Anomalies and unusual patterns in reported
earnings: Japanese managers round earnings. Journal of International Financial
Management and Accounting, 15, 212-234.
Tam Cho, W., & Gaines, B. (2007). Breaking the (Benford) law: Statistical fraud detection in
campaign finance. American Statistician, 61, 218-223.
Xie, H. (2001). The Mispricing of Abnormal Accruals. The Accounting Review, 76, 357-373.
APPENDIX
Figure 1
Frequency of Occurrence of First Digits in Reported Net Sales Data
1950-2006
0%
5%
10%
15%
20%
25%
30%
35%
1 2 3 4 5 6 7 8 9
First Digit
Fre
qu
ency
of
Occ
urr
ence
(%
)
Benford's Law
All Years
Test Period
Journal of Finance and Accountancy
Empirical evidence of financial, page 8
Figure 2
Frequency of Occurrence of First Digits in Reported Net Income Data
1950-2006
0%
5%
10%
15%
20%
25%
30%
35%
40%
1 2 3 4 5 6 7 8 9
First Digit
Fre
qu
ency
of
Occ
urr
ence
(%
)
Benford's Law
All Years
Test Period
Figure 3
Frequency of Occurrence of First Digits in Reported Inventory Data
1950-2006
0%
5%
10%
15%
20%
25%
30%
35%
1 2 3 4 5 6 7 8 9
First Digit
Fre
qu
ency
of
Occ
urr
ence
(%
)
Benford's Law
All Years
Test Period
Journal of Finance and Accountancy
Empirical evidence of financial, page 9
Figure 4
Frequency of Occurrence of First Digits in Reported Allowance for Doubtful Accounts Data
1950-2006
0%
5%
10%
15%
20%
25%
30%
35%
40%
45%
1 2 3 4 5 6 7 8 9
First Digit
Fre
qu
ency
of
Occ
urr
ence
(%
)
Benford's Law
All Years
Test Period
Journal of Finance and Accountancy
Empirical evidence of financial, page 10
Table 1
Benford’s Law Distribution
Benford’s Law states that in sets of naturally occurring numbers, the frequency of occurrence of
the first digits of the numbers will occur as shown in this table (Benford, 1938).
Digit Probability
1 0.30103
2 0.17609
3 0.12494
4 0.09691
5 0.07918
6 0.06695
7 0.05799
8 0.05115
9 0.04576
Journal of Finance and Accountancy
Empirical evidence of financial, page 11
Table 2
Adjusted Recession Periods Used in Tests
This table lists the recession periods used in tests. Data on when recessions occurred was
obtained from the website of the Economic Cycle Research Institute. Periods were adjusted to
include the calendar year ends before and after the end of each recession in order to capture
financial reports issued in close proximity to recessions, when economic growth was likely to be
slow.
Adjusted Recession Periods
1952-1954
1956-1958
1959-1961
1969-1970
1973-1975
1979-1982
1989-1991
2000-2001
Journal of Finance and Accountancy
Empirical evidence of financial, page 12
Table 3
Compliance with Benford’s Law in Reported Net Sales Data
1950 – 2006
This table presents data on how well the distribution of reported net sales data complies
with Benford’s Law. The body of the table presents information on the distribution of the
first digit of reported data for all years in the period 1950-2006 and for the test period,
which consists of a window around recessions occurring during that period (see Table 2).
Reported z-statistics on the difference between the observed occurrence of first digits and
the expected occurrence (according to Benford’s Law) were computed following Nigrini
(2000).
*, **, *** Significant at the 10%, 5%, or 1% level, respectively
Digit Expected
Occurrence
All
Years
Diff z-stat Test
Period
Diff z-stat
1 0.30103 0.30007 0.00096 0.656 0.30650 0.00547 1.902 *
2 0.17609 0.17801 0.00192 1.220 0.18222 0.00612 1.975 **
3 0.12494 0.12542 0.00048 0.293 0.12629 0.00135 0.419
4 0.09691 0.09738 0.00047 0.286 0.09783 0.00092 0.280
5 0.07918 0.08011 0.00093 0.557 0.07760 0.00158 0.469
6 0.06695 0.06648 0.00047 0.275 0.06327 0.00367 1.064
7 0.05799 0.05679 0.00120 0.703 0.05457 0.00342 0.984
8 0.05115 0.05100 0.00015 0.092 0.04986 0.00129 0.376
9 0.04576 0.04474 0.00102 0.588 0.04185 0.00391 1.102
Journal of Finance and Accountancy
Empirical evidence of financial, page 13
Table 4
Compliance with Benford’s Law in Reported Net Income Data
1950 – 2006
This table presents data on how well the distribution of reported net income data complies
with Benford’s Law. The body of the table presents information on the distribution of the
first digit of reported data for all years in the period 1950-2006 and for the test period,
which consists of a window around recessions occurring during that period (see Table 2).
Reported z-statistics on the difference between the observed occurrence of first digits and
the expected occurrence (according to Benford’s Law) were computed following Nigrini
(2000).
*, **, *** Significant at the 10%, 5%, or 1% level, respectively
Digit Expected
Occurrence
All
Years
Diff z-stat Test
Period
Diff z-stat
1 0.30103 0.30293 0.00190 1.316 0.35501 0.05398 17.870 ***
2 0.17609 0.17454 0.00155 0.987 0.18658 0.01049 3.032 ***
3 0.12494 0.12399 0.00095 0.587 0.12193 0.00300 0.809
4 0.09691 0.09703 0.00012 0.072 0.08940 0.00751 1.934 *
5 0.07918 0.08003 0.00085 0.513 0.06954 0.00964 2.399 **
6 0.06695 0.06621 0.00074 0.439 0.05541 0.01154 2.769 ***
7 0.05799 0.05875 0.00076 0.456 0.04653 0.01147 2.697 ***
8 0.05115 0.05158 0.00043 0.257 0.04038 0.01077 2.504 **
9 0.04576 0.04495 0.00081 0.474 0.03521 0.01055 2.414 **
Journal of Finance and Accountancy
Empirical evidence of financial, page 14
Table 5
Compliance with Benford’s Law in Reported Inventory Data
1950 – 2006
This table presents data on how well the distribution of reported inventory data complies
with Benford’s Law. The body of the table presents information on the distribution of the
first digit of reported data for all years in the period 1950-2006 and for the test period,
which consists of a window around recessions occurring during that period (see Table 2).
Reported z-statistics on the difference between the observed occurrence of first digits and
the expected occurrence (according to Benford’s Law) were computed following Nigrini
(2000).
*, **, *** Significant at the 10%, 5%, or 1% level, respectively
Digit Expected
Occurrence
All
Years
Diff z-stat Test
Period
Diff z-stat
1 0.30103 0.29869 0.00234 1.404 0.32493 0.02390 7.085 ***
2 0.17609 0.17687 0.00078 0.433 0.18501 0.00891 2.402 **
3 0.12494 0.12573 0.00079 0.427 0.12589 0.00095 0.242
4 0.09691 0.09773 0.00082 0.437 0.09544 0.00147 0.367
5 0.07918 0.07920 0.00002 0.009 0.07360 0.00558 1.338
6 0.06695 0.06669 0.00026 0.132 0.06206 0.00489 1.163
7 0.05799 0.05803 0.00004 0.022 0.05018 0.00781 1.787 *
8 0.05115 0.05149 0.00034 0.175 0.04515 0.00600 1.380
9 0.04576 0.04556 0.00020 0.100 0.03776 0.00800 1.775 *
Journal of Finance and Accountancy
Empirical evidence of financial, page 15
Table 6
Compliance with Benford’s Law in Reported Allowance for Doubtful Accounts Data
1950 – 2006
This table presents data on how well the distribution of reported allowance for doubtful
accounts data complies with Benford’s Law. The body of the table presents information on
the distribution of the first digit of reported data for all years in the period 1950-2006 and
for the test period, which consists of a window around recessions occurring during that
period (see Table 2). Reported z-statistics on the difference between the observed
occurrence of first digits and the expected occurrence (according to Benford’s Law) were
computed following Nigrini (2000).
*, **, *** Significant at the 10%, 5%, or 1% level, respectively
Digit Expected
Occurrence
All
Years
Diff z-stat Test
Period
Diff z-stat
1 0.30103 0.30197 0.00094 0.458 0.41325 0.11222 19.226 ***
2 0.17609 0.17654 0.00045 0.200 0.19491 0.01882 2.667 ***
3 0.12494 0.12571 0.00077 0.335 0.11643 0.00851 1.074
4 0.09691 0.09670 0.00021 0.088 0.08116 0.01575 1.854 *
5 0.07918 0.08440 0.00522 2.279** 0.06109 0.01809 2.024 **
6 0.06695 0.06560 0.00135 0.561 0.04389 0.02305 2.362 **
7 0.05799 0.05761 0.00038 0.160 0.03673 0.02126 2.131 **
8 0.05115 0.04876 0.00239 0.972 0.02824 0.02292 2.137 **
9 0.04576 0.04271 0.00305 1.225 0.02429 0.02147 1.957 **