Embed Size (px)
Citation preview

© Institute for Fiscal Studies
Empirical Evidence and Tax Reform: Lessons from the Mirrlees Review
Richard Blundell
University College London and Institute for Fiscal Studies
Friedman Forum
BFI, Chicago
May 2013
http://www.ifs.org.uk/mirrleesReview

• Comprehensive review of tax reform, drawing on:
– new evidence
– new (applied) theory
– new economic environment
• View the tax system as a whole
– savings and capital
– earnings and direct taxation
– indirect taxation
– corporate taxation
• For developed open economies
– the UK as the running experiment
Scope of the Mirrlees Review

The Mirrlees Review Reforming the Tax System for the 21st Century
Chairman: Sir James Mirrlees
Tim Besley (LSE & IFS)
Richard Blundell (IFS & UCL)
Malcolm Gammie QC (One Essex Court)
James Poterba (MIT & NBER)
with:
Stuart Adam (IFS)
Steve Bond (Oxford & IFS)
Robert Chote (OBR)
Paul Johnson (IFS)
Gareth Myles (Exeter & IFS)

Two Volumes
- „Dimensions of Tax Design‟: published April 2010
- a set of 13 chapters on particular areas by IFS researchers + international experts, along with expert commentaries (MRI)
- „Tax by Design‟: findings published September 2011
- an integrated picture of tax design and reform, written by the editors (MRII)
• OUP but also open access at:
– http://www.ifs.org.uk/mirrleesReview
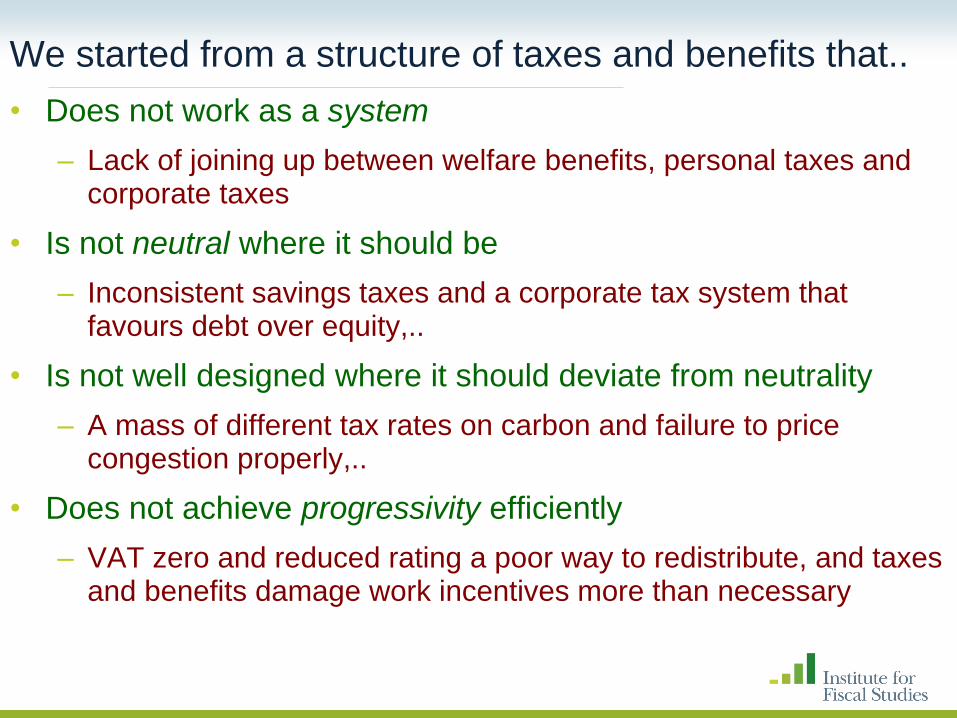
We started from a structure of taxes and benefits that..
• Does not work as a system
– Lack of joining up between welfare benefits, personal taxes and corporate taxes
• Is not neutral where it should be
– Inconsistent savings taxes and a corporate tax system that favours debt over equity,..
• Is not well designed where it should deviate from neutrality
– A mass of different tax rates on carbon and failure to price congestion properly,..
• Does not achieve progressivity efficiently
– VAT zero and reduced rating a poor way to redistribute, and taxes and benefits damage work incentives more than necessary

In this talk I want to focus on the role of evidence
loosely organised under five headings:
1. Key margins of adjustment to tax reform
2. Measurement of effective tax rates
3. The importance of information and complexity
4. Evidence on the size of responses
5. Implications from theory for tax design
• Emphasis on earnings taxation, with some discussion
of the taxation of consumption and savings.
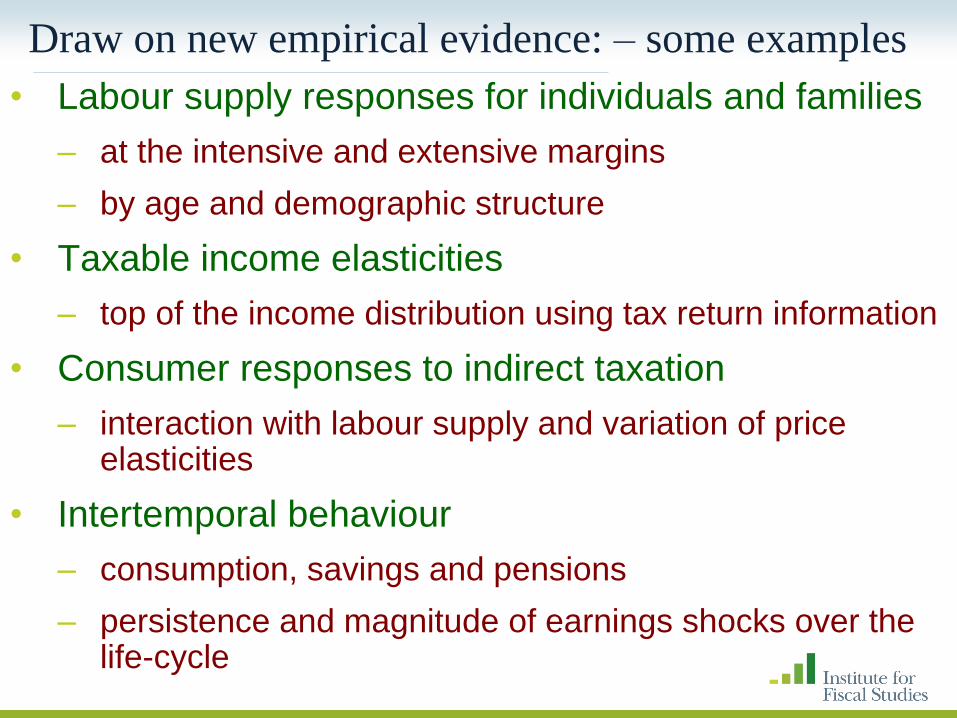
• Labour supply responses for individuals and families
– at the intensive and extensive margins
– by age and demographic structure
• Taxable income elasticities
– top of the income distribution using tax return information
• Consumer responses to indirect taxation
– interaction with labour supply and variation of price elasticities
• Intertemporal behaviour
– consumption, savings and pensions
– persistence and magnitude of earnings shocks over the life-cycle
Draw on new empirical evidence: – some examples

Taxation of earnings:
• leading example of the mix of theory and evidence
• new evidence on extensive and intensive margins
• key implications for tax design
• It also takes most of the strain in distributional
adjustments of other parts of the reform package
• Illustrate with VAT and savings taxation..
• Draw on additional papers (IFS Working Papers)
• Blundell and Shephard (2012, REStud)
• Blundell, Bozio and Laroque (2011, AER)
• and Blundell, Costa-Dias, Meghir and Shaw (2013)…
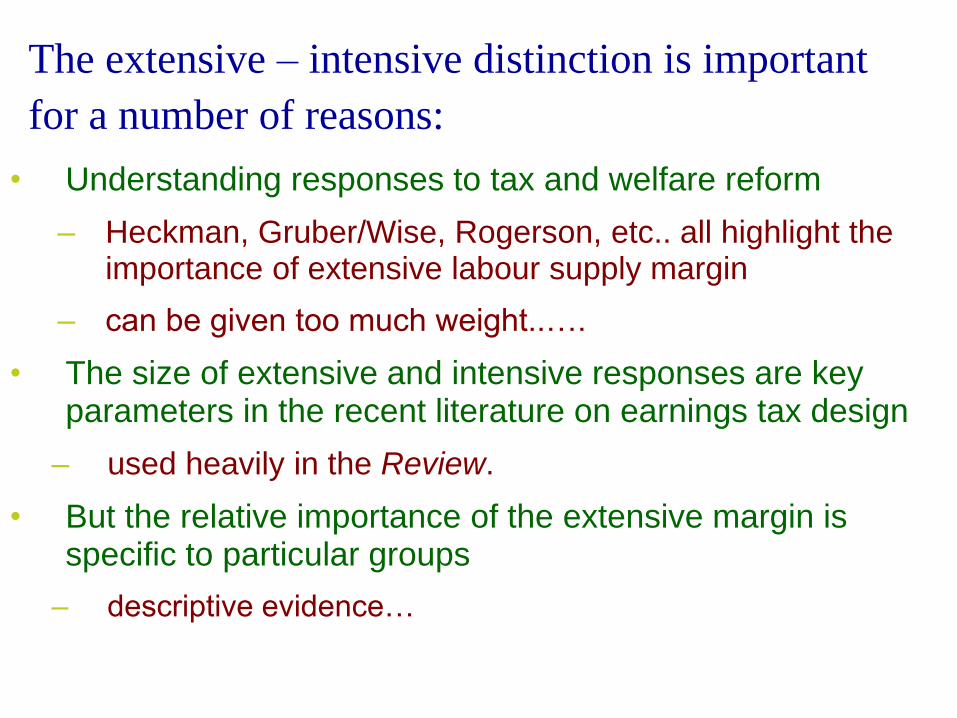
The extensive – intensive distinction is important
for a number of reasons:
• Understanding responses to tax and welfare reform
– Heckman, Gruber/Wise, Rogerson, etc.. all highlight the importance of extensive labour supply margin
– can be given too much weight..….
• The size of extensive and intensive responses are key parameters in the recent literature on earnings tax design
– used heavily in the Review.
• But the relative importance of the extensive margin is specific to particular groups
– descriptive evidence…
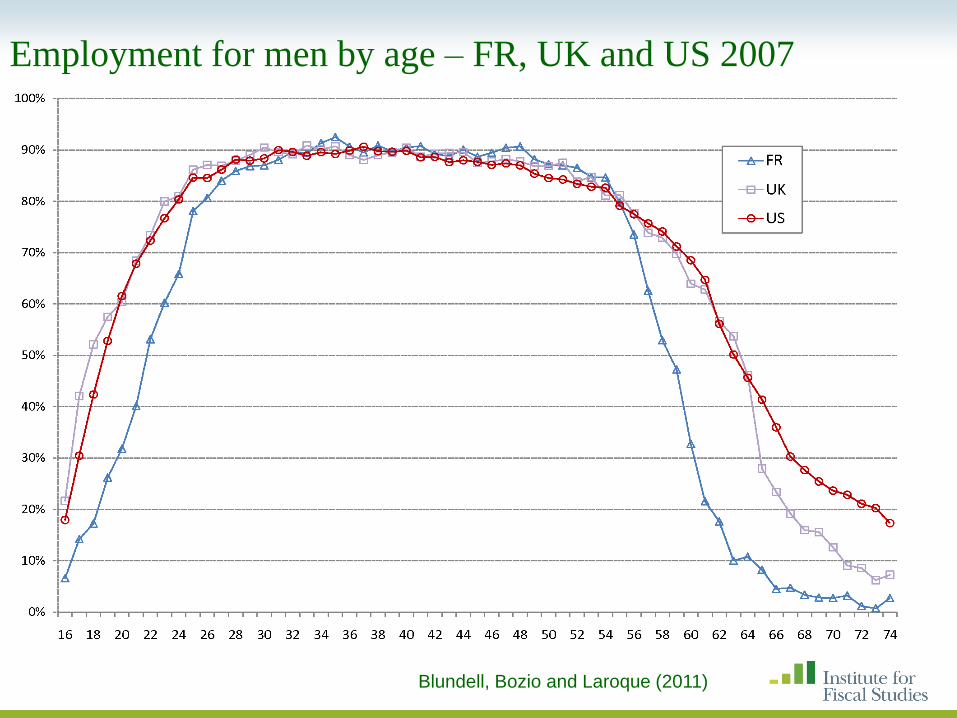
Employment for men by age – FR, UK and US 2007
Blundell, Bozio and Laroque (2011)
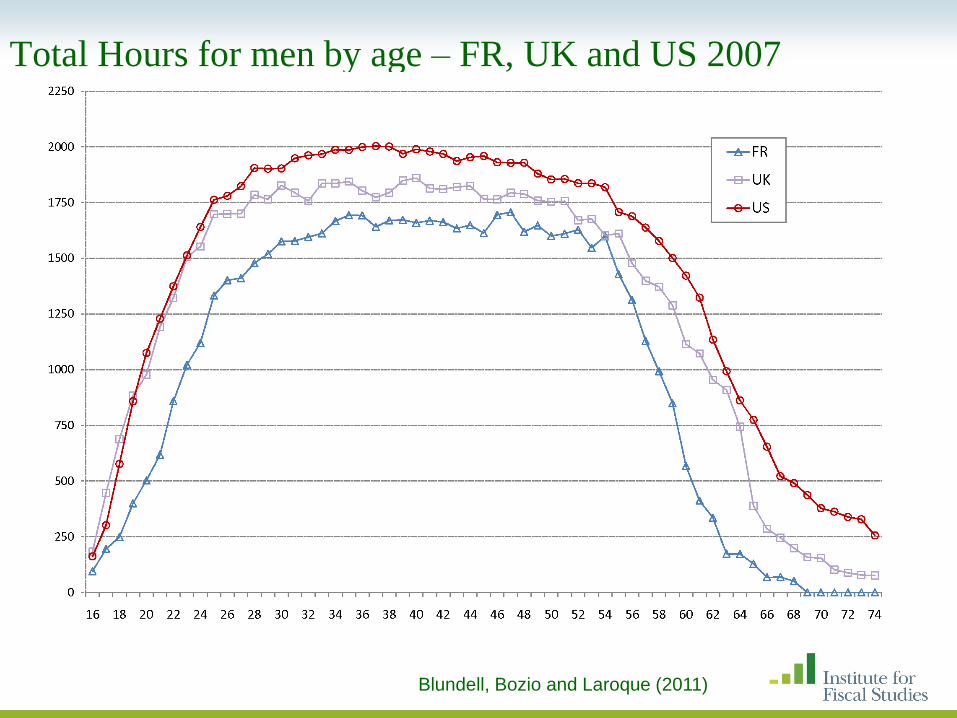
Total Hours for men by age – FR, UK and US 2007
Blundell, Bozio and Laroque (2011)
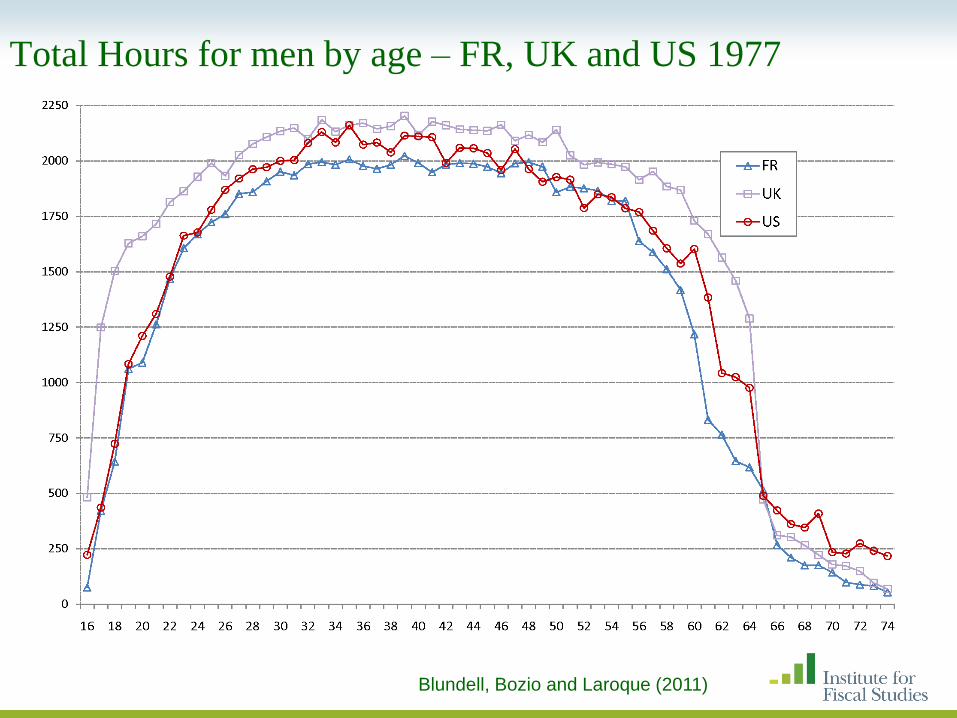
Total Hours for men by age – FR, UK and US 1977
Blundell, Bozio and Laroque (2011)
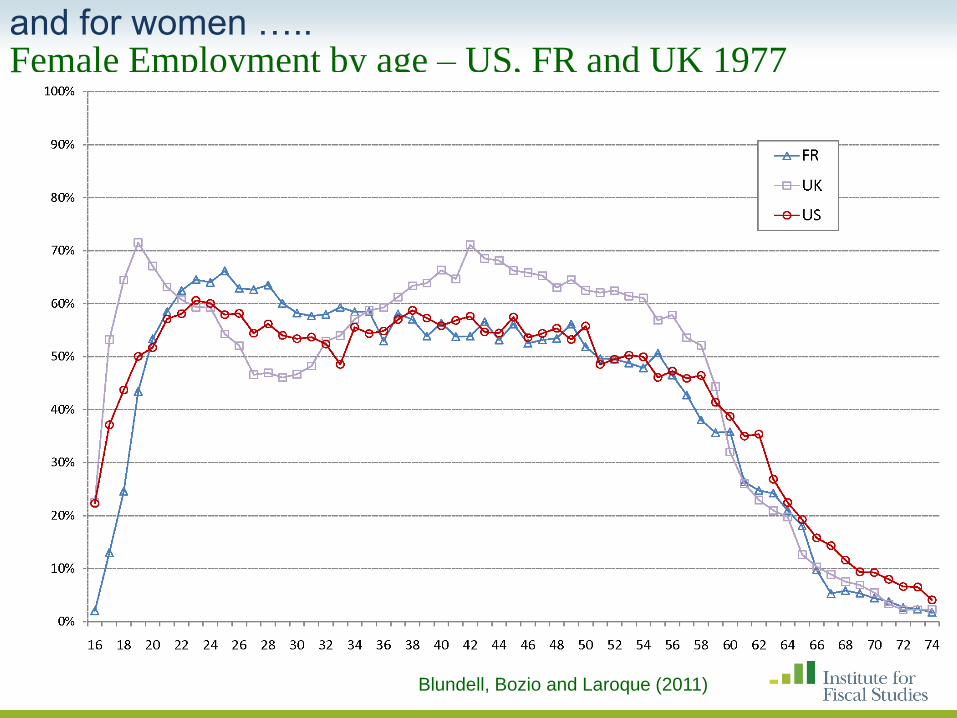
Female Employment by age – US, FR and UK 1977
Blundell, Bozio and Laroque (2011)
and for women …..
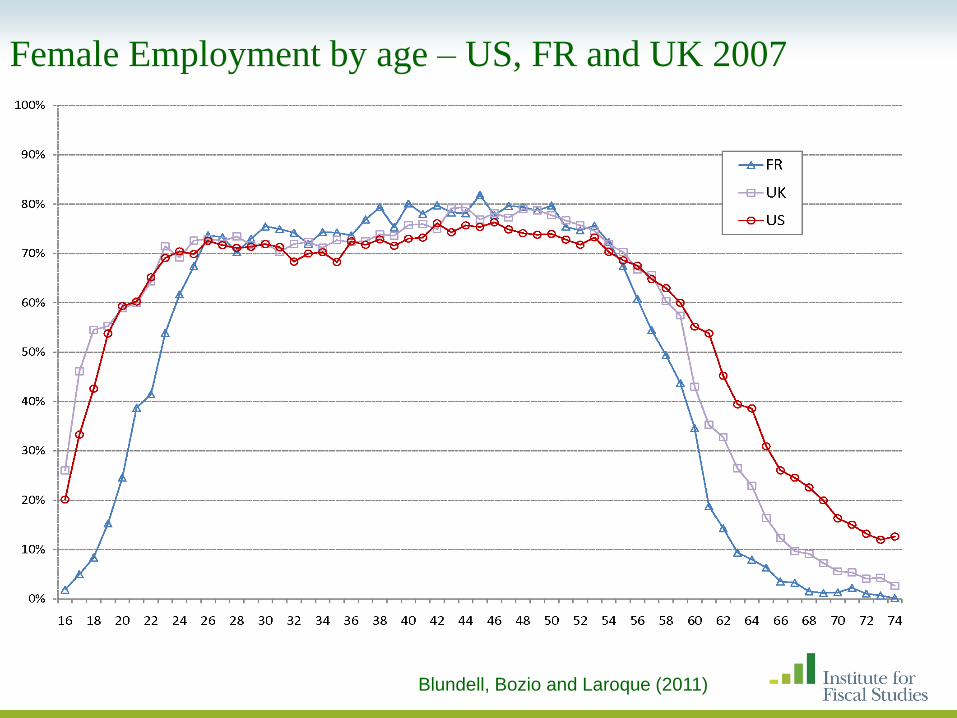
Female Employment by age – US, FR and UK 2007
Blundell, Bozio and Laroque (2011)
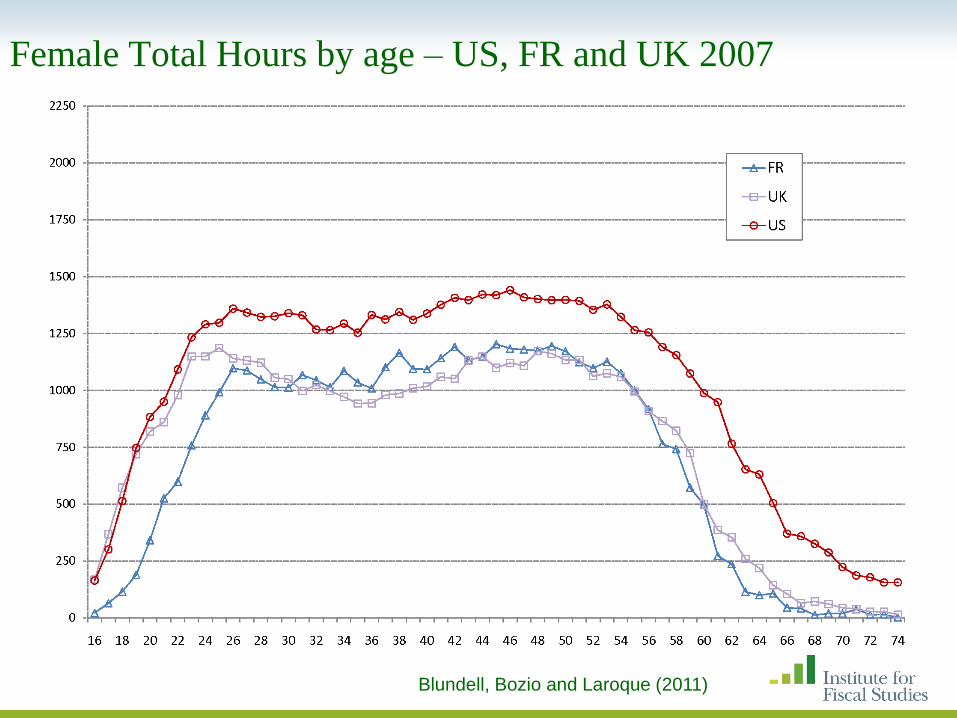
Female Total Hours by age – US, FR and UK 2007
Blundell, Bozio and Laroque (2011)
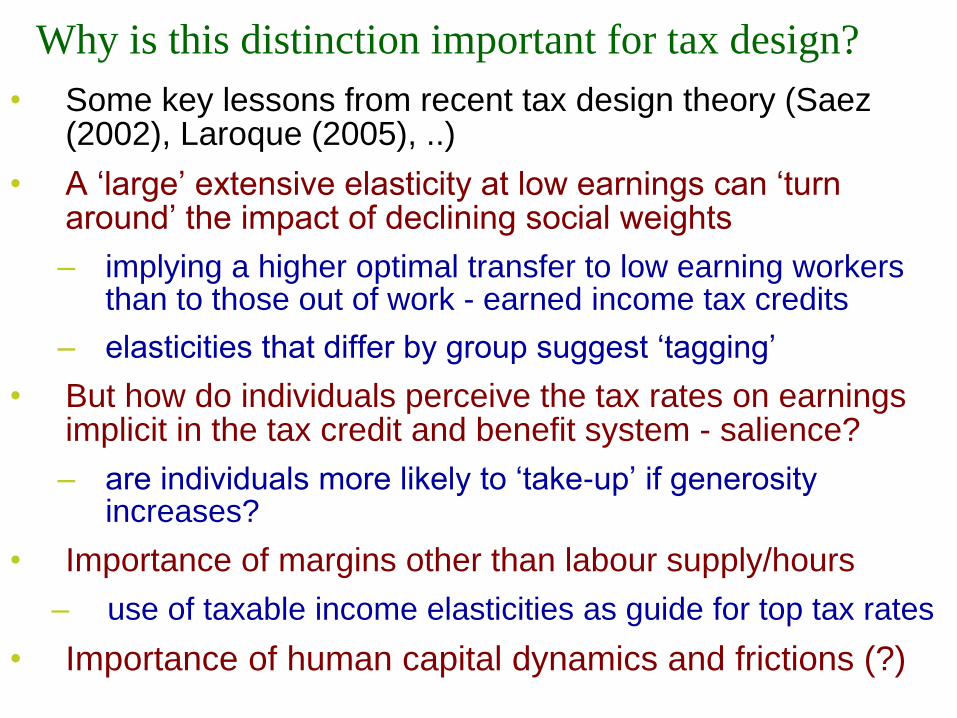
Why is this distinction important for tax design?
• Some key lessons from recent tax design theory (Saez (2002), Laroque (2005), ..)
• A „large‟ extensive elasticity at low earnings can „turn around‟ the impact of declining social weights
– implying a higher optimal transfer to low earning workers than to those out of work - earned income tax credits
– elasticities that differ by group suggest „tagging‟
• But how do individuals perceive the tax rates on earnings implicit in the tax credit and benefit system - salience?
– are individuals more likely to „take-up‟ if generosity increases?
• Importance of margins other than labour supply/hours
– use of taxable income elasticities as guide for top tax rates
• Importance of human capital dynamics and frictions (?)
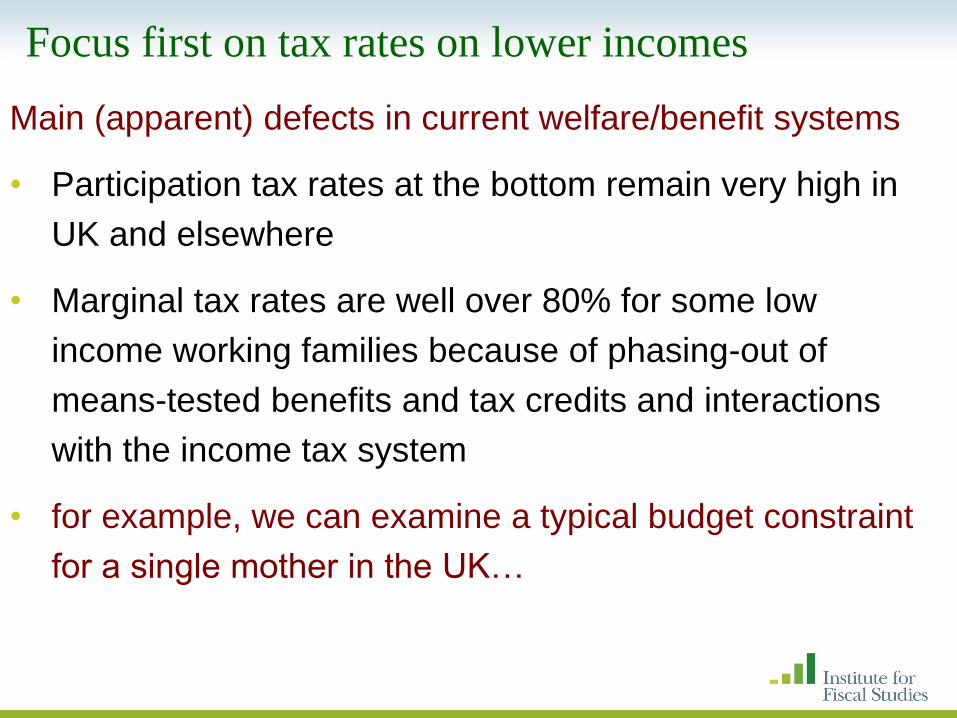
Focus first on tax rates on lower incomes
Main (apparent) defects in current welfare/benefit systems
• Participation tax rates at the bottom remain very high in
UK and elsewhere
• Marginal tax rates are well over 80% for some low
income working families because of phasing-out of
means-tested benefits and tax credits and interactions
with the income tax system
• for example, we can examine a typical budget constraint
for a single mother in the UK…

£0
£50
£100
£150
£200
£250
£300
0 4 8 12 16 20 24 28 32 36 40 44 48
hours of work
WFTC
Income Support
Net earnings
Other income
The interaction of WFTC with other benefits in the UK
Low wage
lone parent

£0
£50
£100
£150
£200
£250
£300
0 4 8 12 16 20 24 28 32 36 40 44 48
hours of work
Local tax rebate
Rent rebate
WFTC
Income Support
Net earnings
Other income
Strong
implications
for EMTRs,
PTRs and
labour supply
The interaction of WFTC with other benefits in the UK
Low wage
lone parent
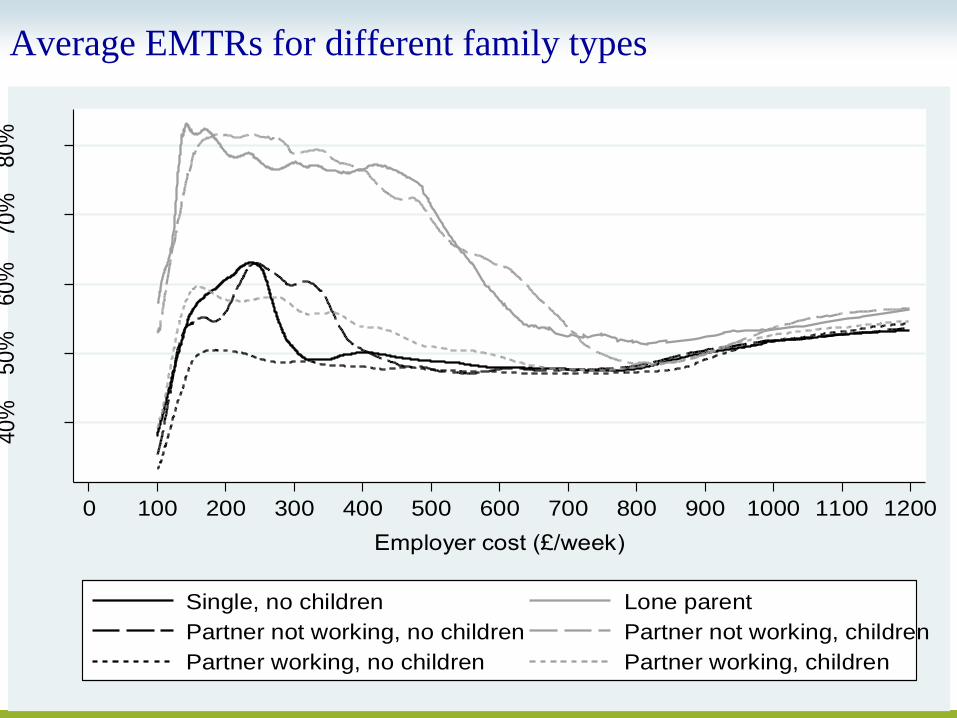
Average EMTRs for different family types 40
%50
%60
%70
%80
%
0 100 200 300 400 500 600 700 800 900 1000 1100 1200
Employer cost (£/week)
Single, no children Lone parent
Partner not working, no children Partner not working, children
Partner working, no children Partner working, children
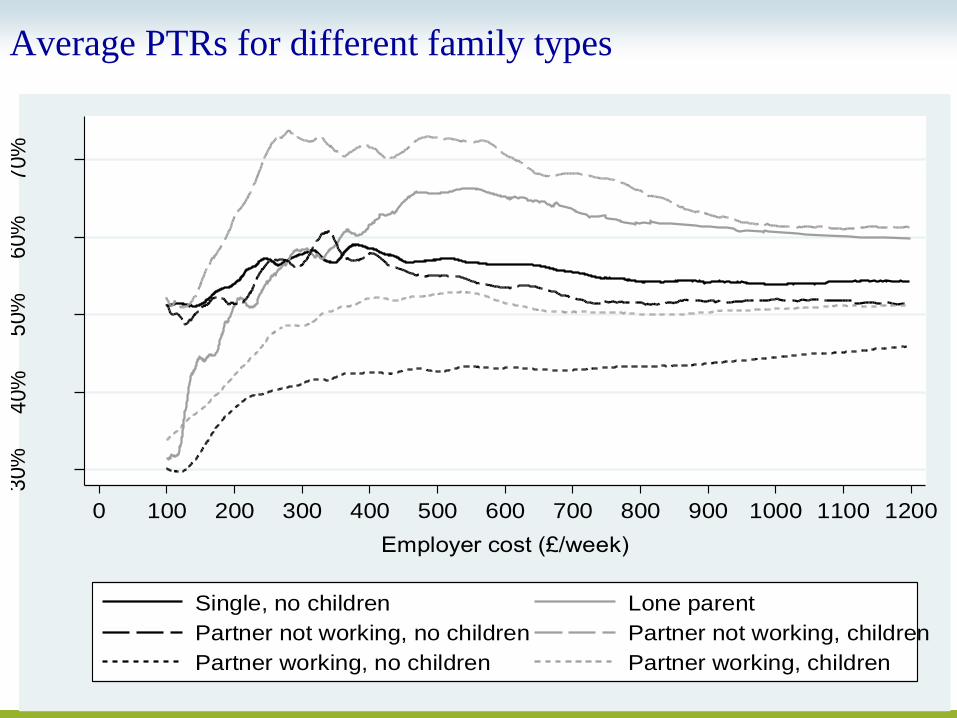
Average PTRs for different family types 3
0%
40%
50%
60%
70%
0 100 200 300 400 500 600 700 800 900 1000 1100 1200
Employer cost (£/week)
Single, no children Lone parent
Partner not working, no children Partner not working, children
Partner working, no children Partner working, children
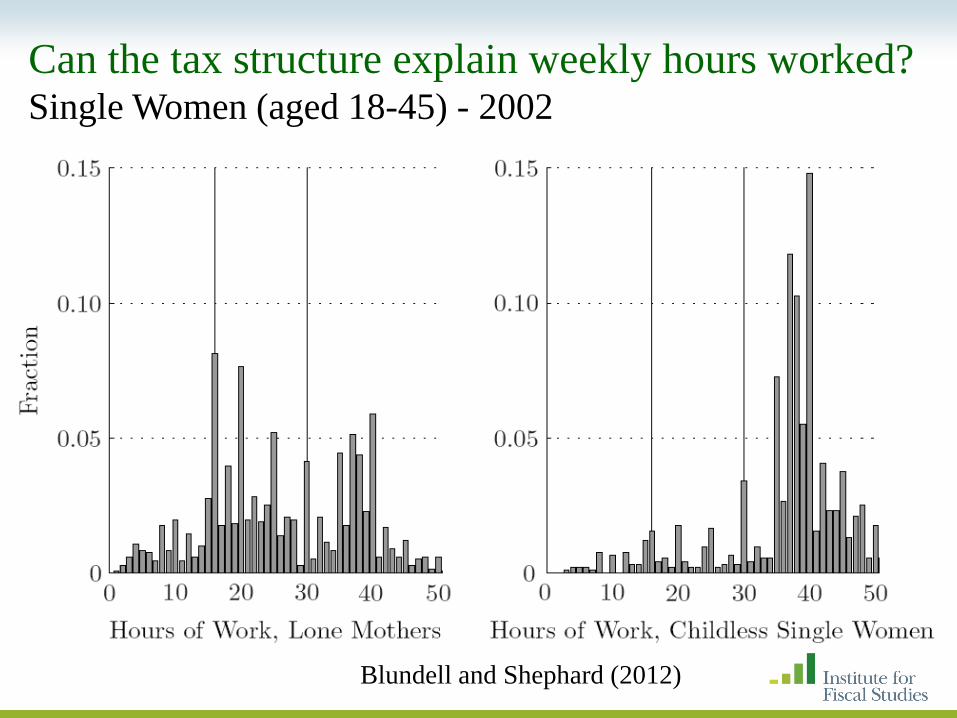
Can the tax structure explain weekly hours worked? Single Women (aged 18-45) - 2002
Blundell and Shephard (2012)
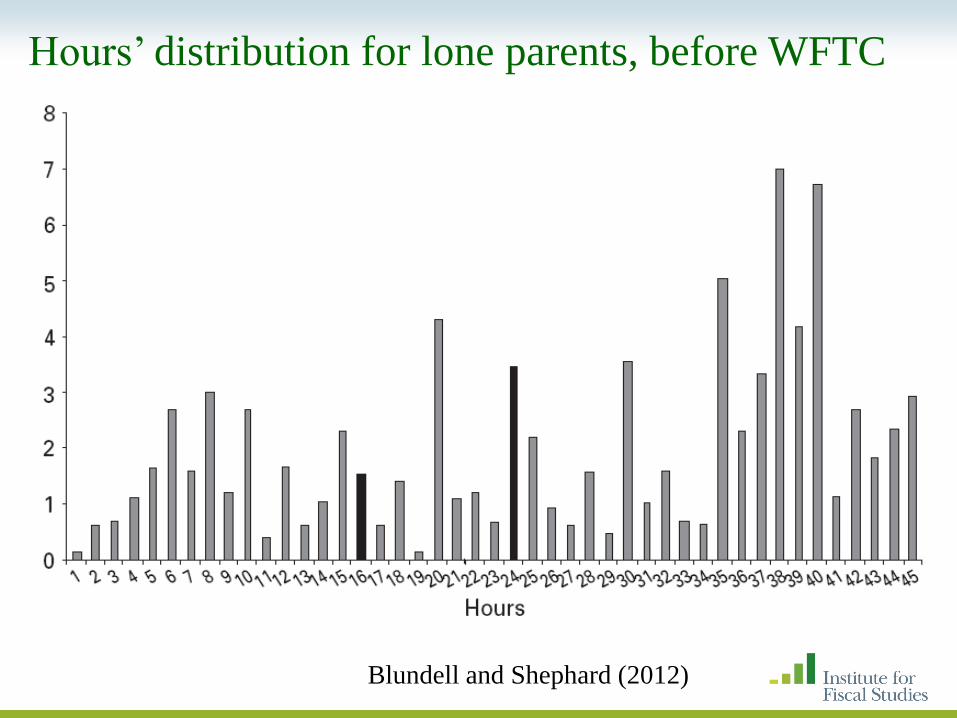
Hours’ distribution for lone parents, before WFTC
Blundell and Shephard (2012)
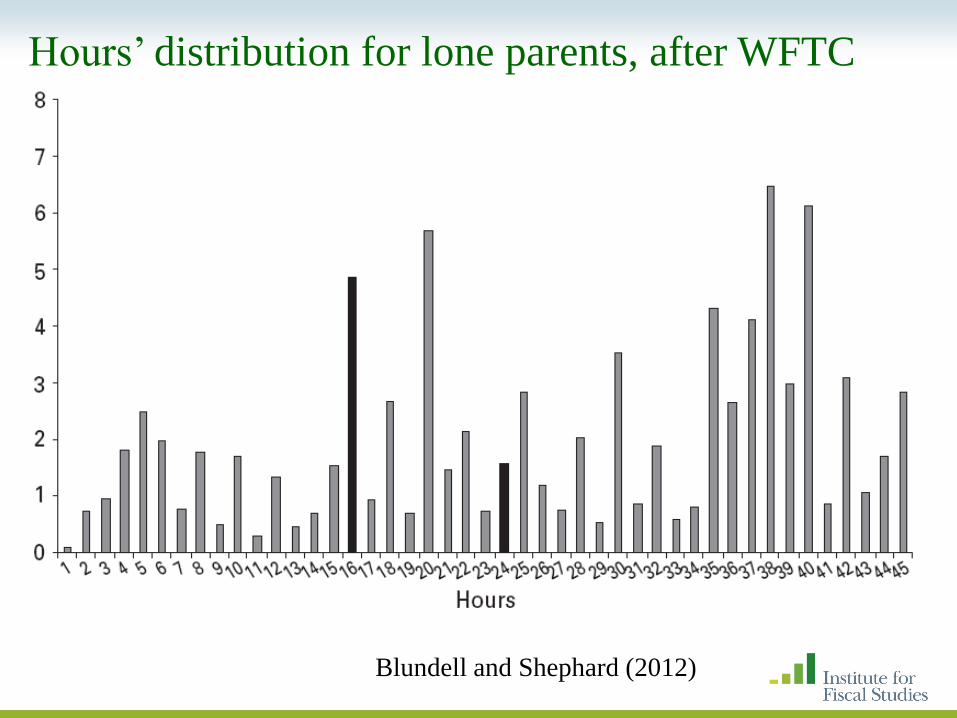
Hours’ distribution for lone parents, after WFTC
Blundell and Shephard (2012)

Hours trend for low ed lone parents in UK
1200
1250
1300
1350
1400
1450
1500
1550
1600
1985 1986 1987 1988 1989 1990 1991 1992 1993 1994 1995 1996 1997 1998 1999 2000 2001 2002 2003 2004 2005 2006 2007 2008

Employment trends for low ed lone parents
0.3
0.35
0.4
0.45
0.5
0.55
0.6
0.65
0.7
0.75
0.8
No College

Employment trends for lone parents in UK
0.3
0.35
0.4
0.45
0.5
0.55
0.6
0.65
0.7
0.75
0.8
1985 1986 1987 1988 1989 1990 1991 1992 1993 1994 1995 1996 1997 1998 1999 2000 2001 2002 2003 2004 2005 2006 2007 2008
College
No College
WFTC
Quasi experiment - matching and anticipation
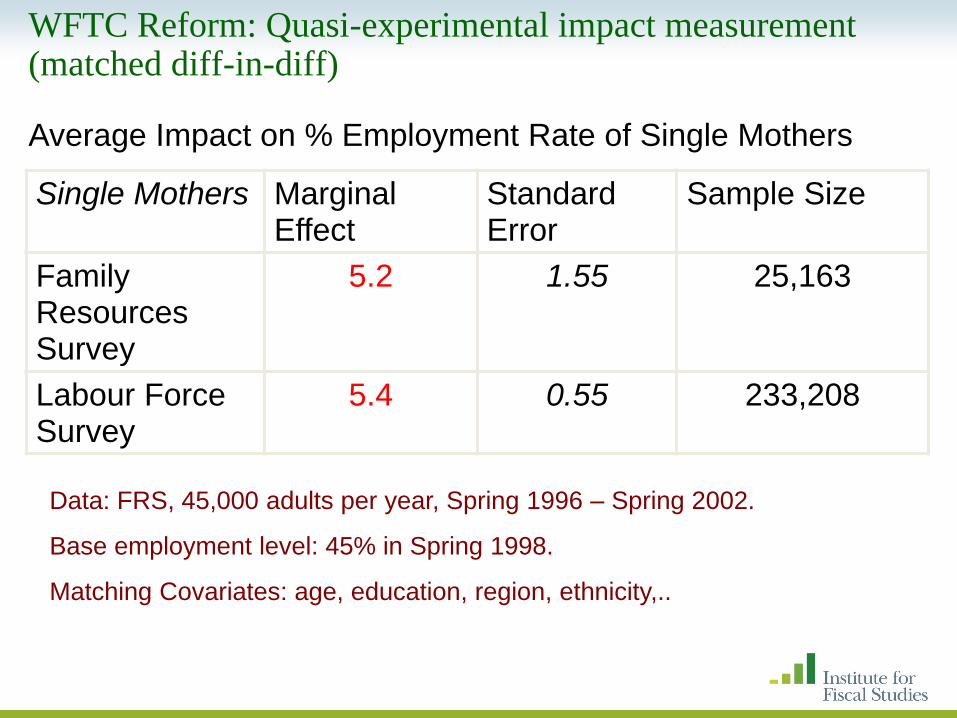
WFTC Reform: Quasi-experimental impact measurement (matched diff-in-diff)
Single Mothers Marginal Effect
Standard Error
Sample Size
Family Resources Survey
5.2 1.55 25,163
Labour Force Survey
5.4 0.55 233,208
Data: FRS, 45,000 adults per year, Spring 1996 – Spring 2002.
Base employment level: 45% in Spring 1998.
Matching Covariates: age, education, region, ethnicity,..
Average Impact on % Employment Rate of Single Mothers
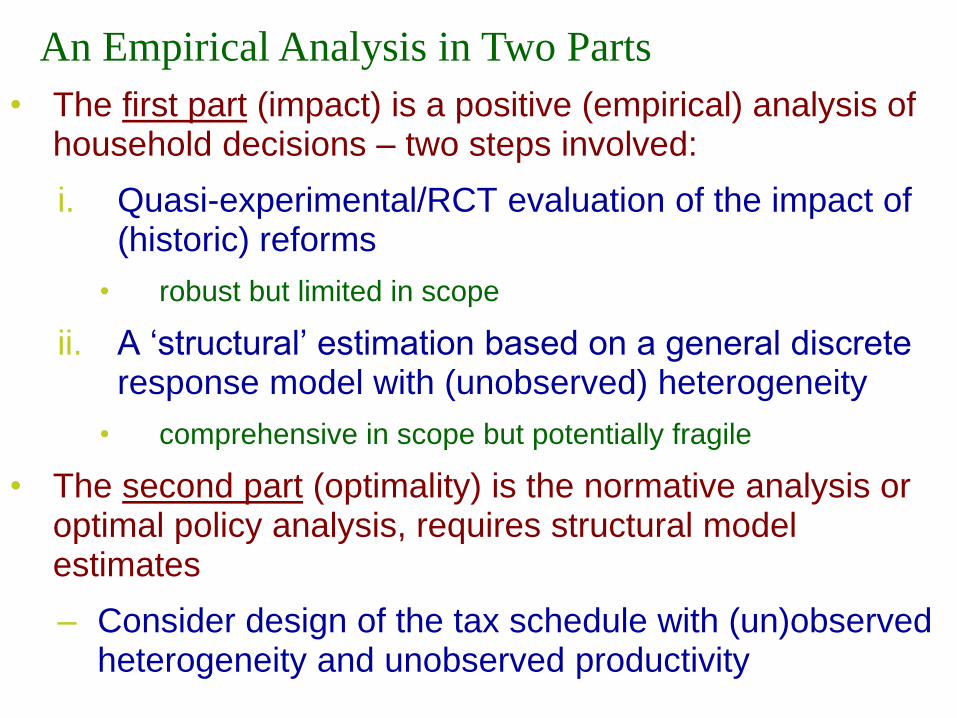
• The first part (impact) is a positive (empirical) analysis of household decisions – two steps involved:
i. Quasi-experimental/RCT evaluation of the impact of (historic) reforms
• robust but limited in scope
ii. A „structural‟ estimation based on a general discrete response model with (unobserved) heterogeneity
• comprehensive in scope but potentially fragile
• The second part (optimality) is the normative analysis or optimal policy analysis, requires structural model estimates
– Consider design of the tax schedule with (un)observed heterogeneity and unobserved productivity
An Empirical Analysis in Two Parts

• budget constraint - tax/tax-credit and benefit interactions
• preferences - multinomial choice across discrete hours
• heterogeneity - demographics, ethnicity, etc; unobs. het.
• fixed costs of work - obs. and unobs. het.
• childcare costs and prices - key ‘fixed costs’ of work
• stigma/hassle costs - take-up versus eligibility; unobs het.
Key features of the structural model
main elements:
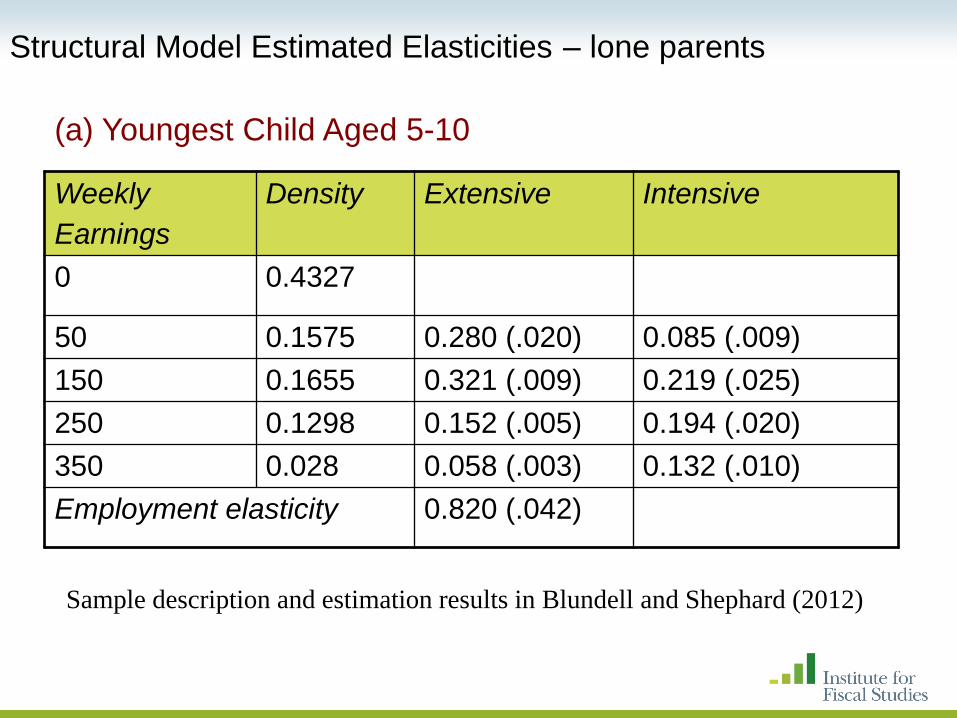
Structural Model Estimated Elasticities – lone parents
Weekly
Earnings
Density Extensive Intensive
0 0.4327
50 0.1575 0.280 (.020) 0.085 (.009)
150 0.1655 0.321 (.009) 0.219 (.025)
250 0.1298 0.152 (.005) 0.194 (.020)
350 0.028 0.058 (.003) 0.132 (.010)
Employment elasticity 0.820 (.042)
(a) Youngest Child Aged 5-10
Sample description and estimation results in Blundell and Shephard (2012)
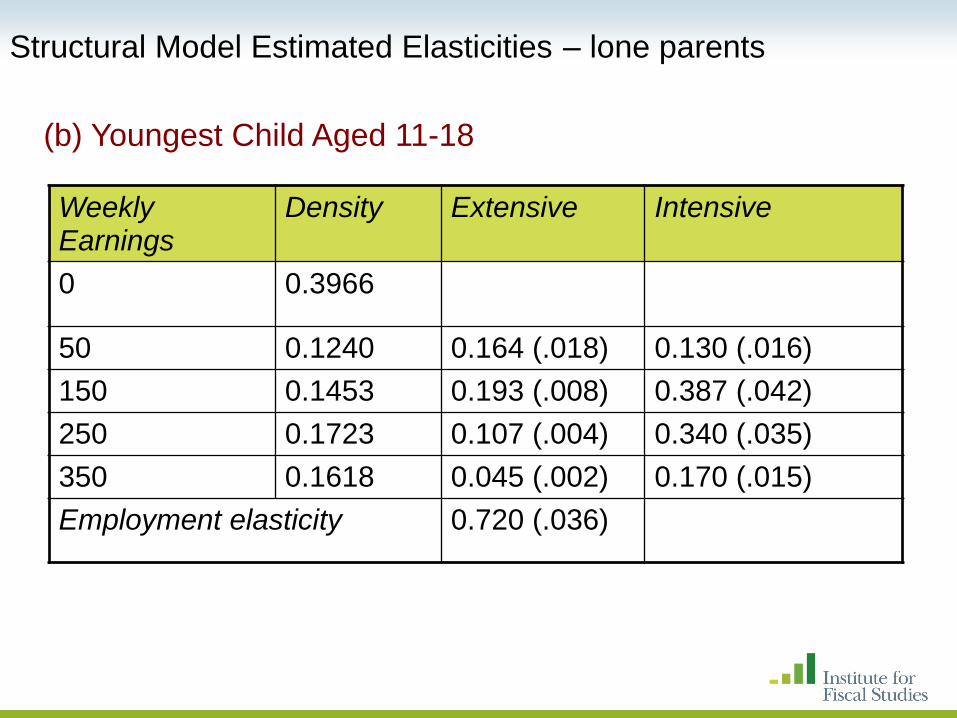
Weekly Earnings
Density Extensive Intensive
0 0.3966
50 0.1240 0.164 (.018) 0.130 (.016)
150 0.1453 0.193 (.008) 0.387 (.042)
250 0.1723 0.107 (.004) 0.340 (.035)
350 0.1618 0.045 (.002) 0.170 (.015)
Employment elasticity 0.720 (.036)
(b) Youngest Child Aged 11-18
Structural Model Estimated Elasticities – lone parents
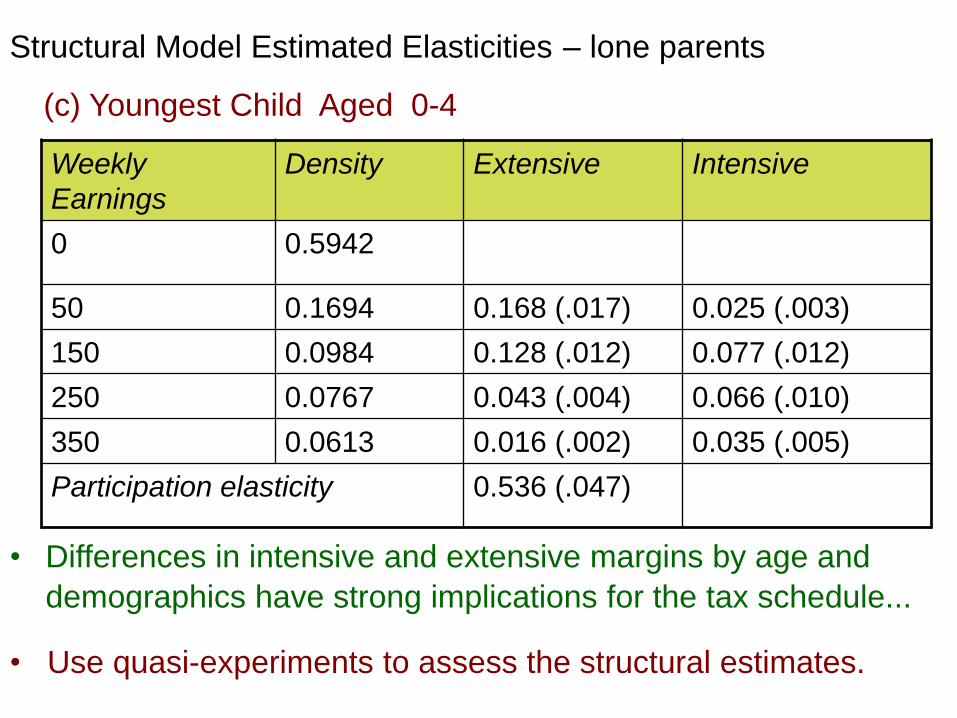
Weekly
Earnings
Density Extensive Intensive
0 0.5942
50 0.1694 0.168 (.017) 0.025 (.003)
150 0.0984 0.128 (.012) 0.077 (.012)
250 0.0767 0.043 (.004) 0.066 (.010)
350 0.0613 0.016 (.002) 0.035 (.005)
Participation elasticity 0.536 (.047)
(c) Youngest Child Aged 0-4
• Differences in intensive and extensive margins by age and
demographics have strong implications for the tax schedule...
• Use quasi-experiments to assess the structural estimates.
Structural Model Estimated Elasticities – lone parents
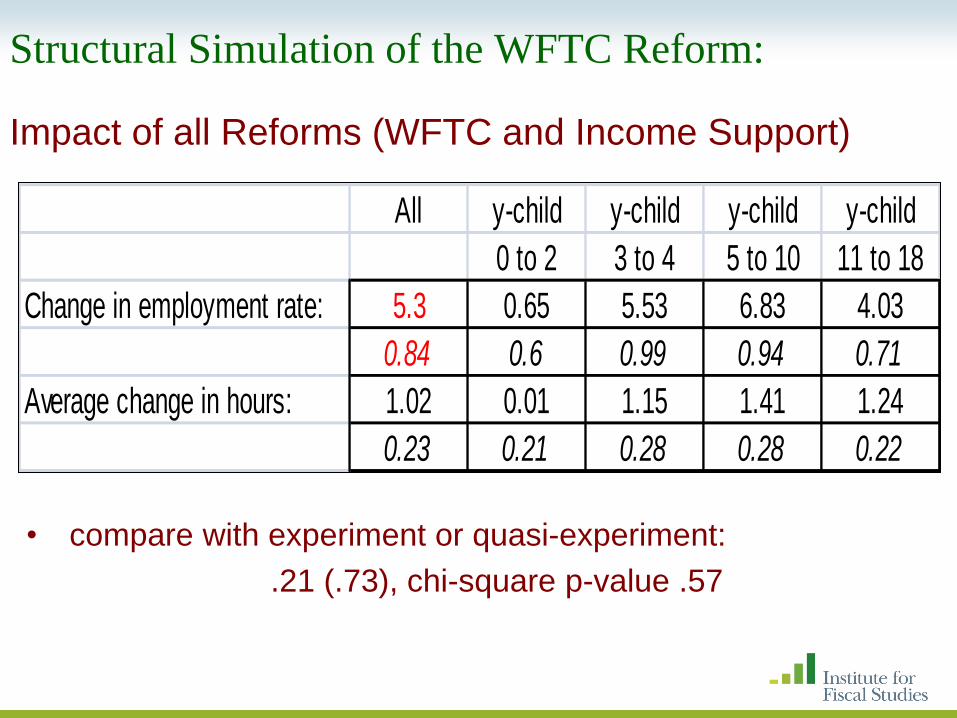
Structural Simulation of the WFTC Reform: Impact of all Reforms (WFTC and Income Support)
All y-child y-child y-child y-child
0 to 2 3 to 4 5 to 10 11 to 18
Change in employment rate: 5.3 0.65 5.53 6.83 4.03
0.84 0.6 0.99 0.94 0.71
Average change in hours: 1.02 0.01 1.15 1.41 1.24
0.23 0.21 0.28 0.28 0.22
• compare with experiment or quasi-experiment:
.21 (.73), chi-square p-value .57
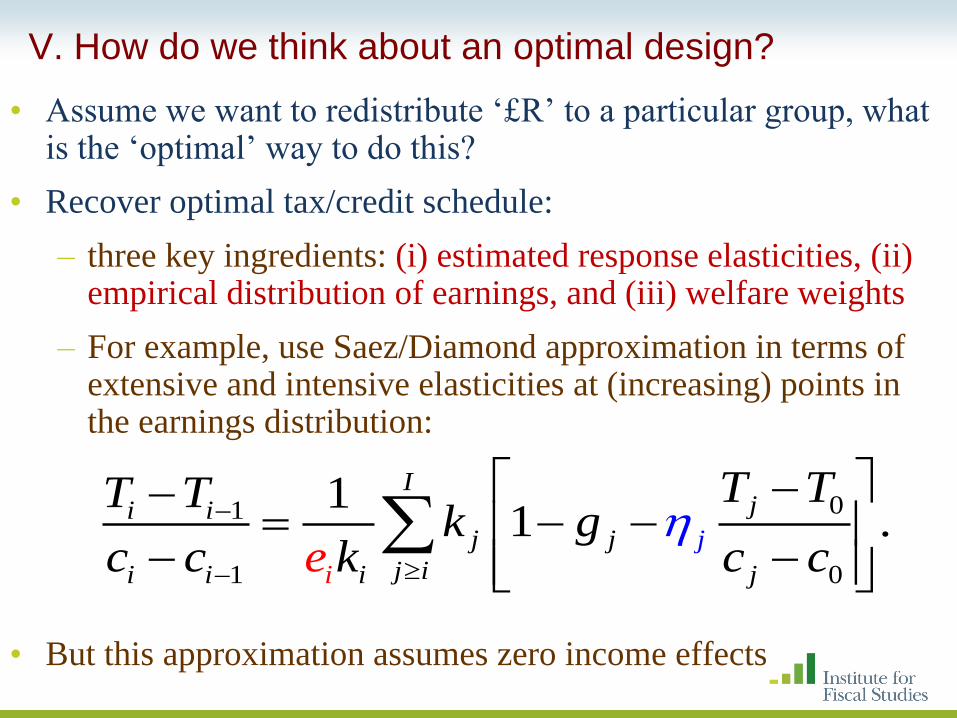
V. How do we think about an optimal design?
• Assume we want to redistribute ‘£R’ to a particular group, what is the ‘optimal’ way to do this?
• Recover optimal tax/credit schedule:
– three key ingredients: (i) estimated response elasticities, (ii) empirical distribution of earnings, and (iii) welfare weights
– For example, use Saez/Diamond approximation in terms of extensive and intensive elasticities at (increasing) points in the earnings distribution:
• But this approximation assumes zero income effects
01
1 0
11 .
Iji i
j j
j ii i i
j
i j
T TT Tk g
ec c k c c

• Assume earnings and some limited characteristics, e.g. age, are all that is observable to the tax authority
* * *( ( ; ( , ; ) ( ) ( ), ; ,( ) )X
U c h T w h X hW dF dG XX
The tax structure T(.) is chosen to maximise
subject to:
for a given R.
* *( , ; ( ) ( ) )) (X
T dwh h F dG XX T R
Complement with design based on the microeconometric
model

Control preference for equality by
1
( | ) (exp ) 1U U
when θ is negative, the function favors the equality of
utilities.
Objective: robust policies for fairly general social welfare
weights, document the weights in each case (Table 7,
Blundell and Shephard, 2012)
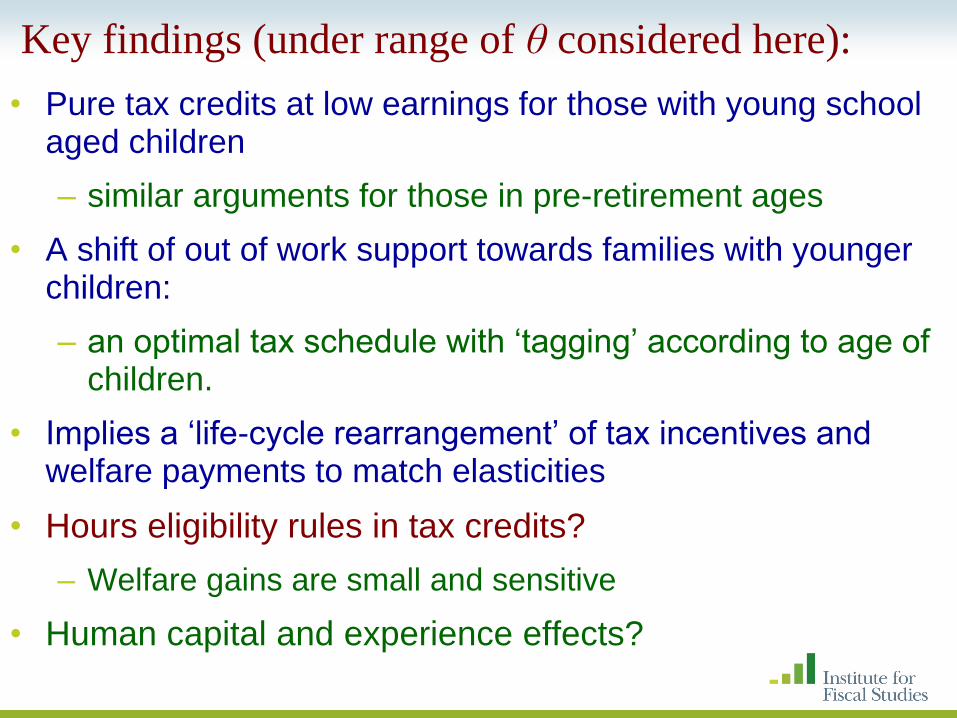
Key findings (under range of θ considered here):
• Pure tax credits at low earnings for those with young school aged children
– similar arguments for those in pre-retirement ages
• A shift of out of work support towards families with younger children:
– an optimal tax schedule with „tagging‟ according to age of children.
• Implies a „life-cycle rearrangement‟ of tax incentives and welfare payments to match elasticities
• Hours eligibility rules in tax credits?
– Welfare gains are small and sensitive
• Human capital and experience effects?
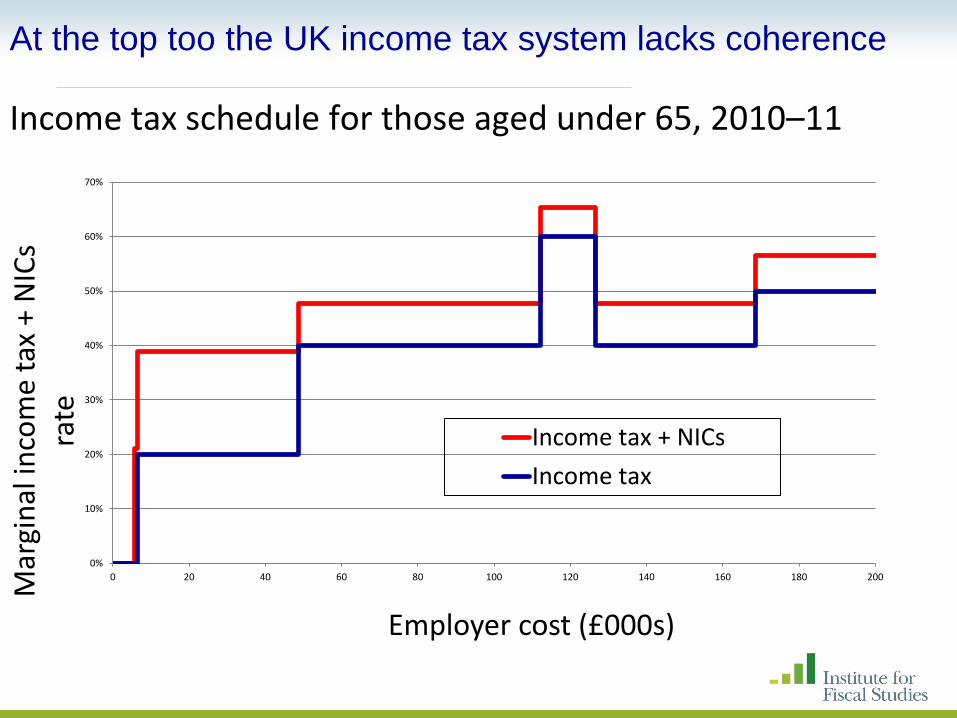
At the top too the UK income tax system lacks coherence Income tax schedule for those aged under 65, 2010–11
0%
10%
20%
30%
40%
50%
60%
70%
0 20 40 60 80 100 120 140 160 180 200
Mar
gin
al in
com
e ta
x +
NIC
s ra
te
Employer cost (£000s)
Income tax + NICs
Income tax

Suppose we want to maximise the review collected – what
should the tax rate on the top income bracket be?
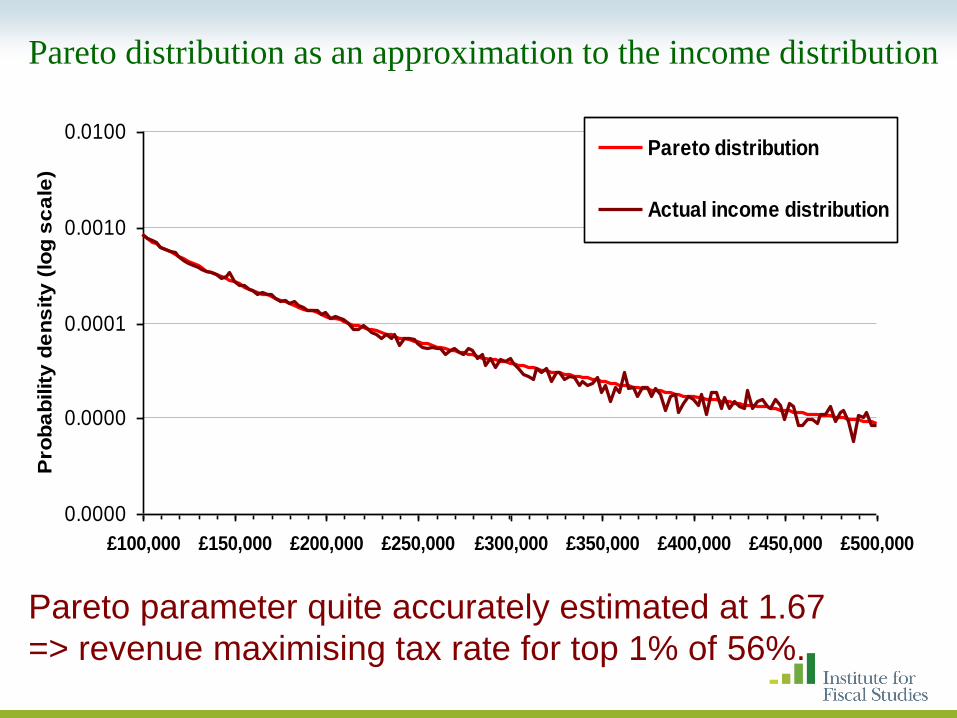
An ‘optimal’ top tax rate ‘t’
e – taxable income elasticity
t = 1 / (1 + a∙e)
where a is the Pareto parameter.
Estimate a ≈ 1.67 from the empirical distribution
Estimate e ≈ 0.46 from the evolution of top incomes in
tax return data
Top tax rates and taxable income elasticities
0.0000
0.0000
0.0001
0.0010
0.0100
£100,000 £150,000 £200,000 £250,000 £300,000 £350,000 £400,000 £450,000 £500,000
Pro
ba
bilit
y d
en
sit
y (
log
sc
ale
)
Pareto distribution
Actual income distribution
Pareto distribution as an approximation to the income distribution
Pareto parameter quite accurately estimated at 1.67
=> revenue maximising tax rate for top 1% of 56%.
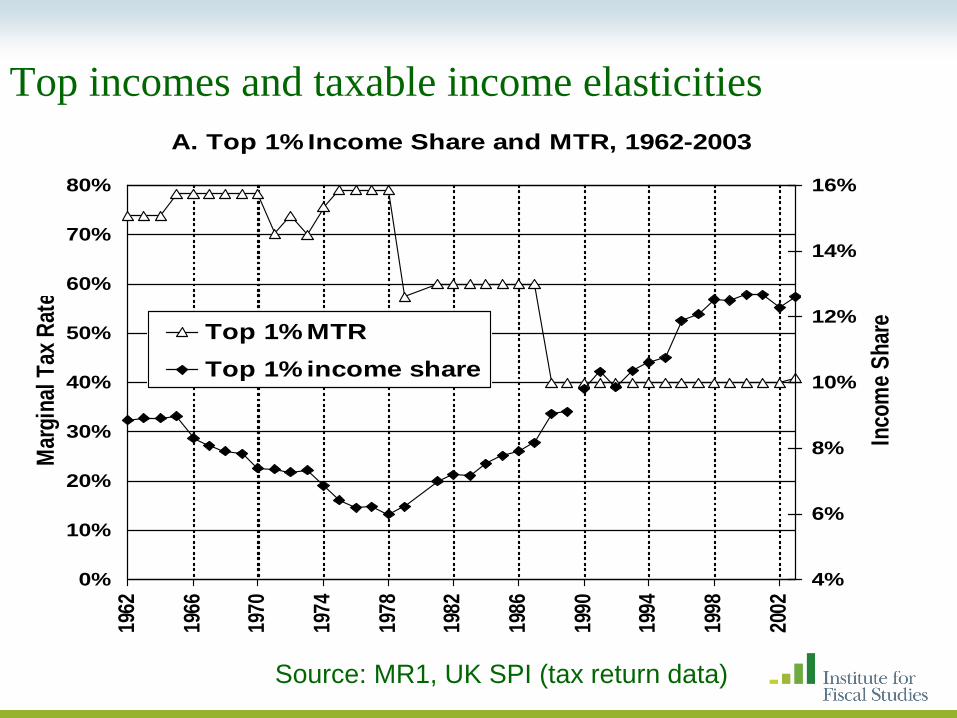
Top incomes and taxable income elasticities
A. Top 1% Income Share and MTR, 1962-2003
0%
10%
20%
30%
40%
50%
60%
70%
80%
1962
1966
1970
1974
1978
1982
1986
1990
1994
1998
2002
Mar
gin
al T
ax R
ate
4%
6%
8%
10%
12%
14%
16%
Inco
me
Sh
are
Top 1% MTR
Top 1% income share
Source: MR1, UK SPI (tax return data)
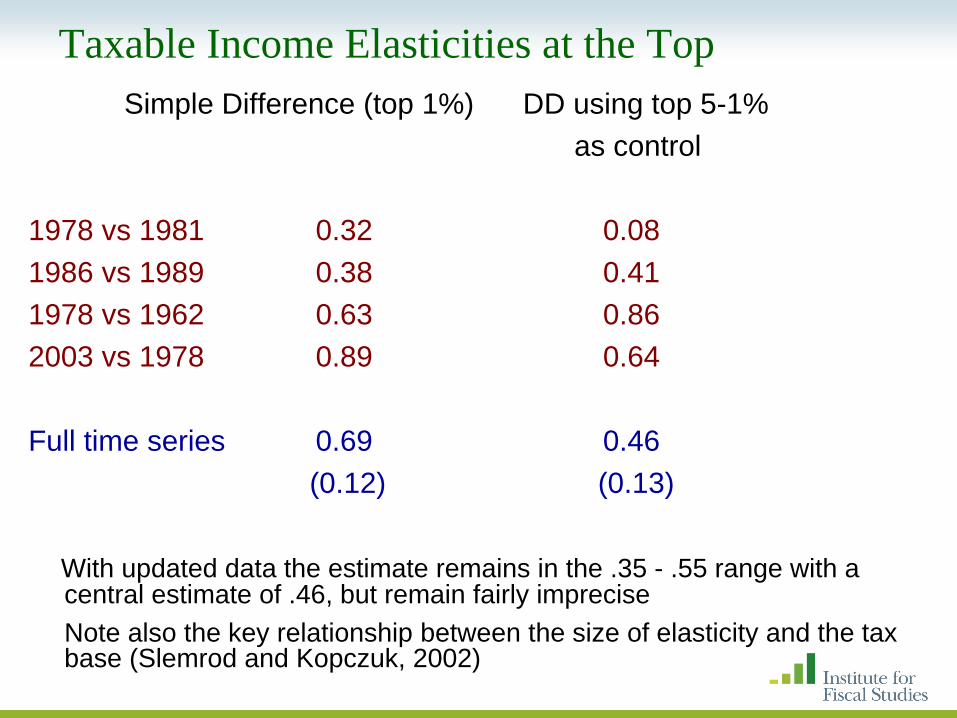
Taxable Income Elasticities at the Top
Simple Difference (top 1%) DD using top 5-1%
as control
1978 vs 1981 0.32 0.08
1986 vs 1989 0.38 0.41
1978 vs 1962 0.63 0.86
2003 vs 1978 0.89 0.64
Full time series 0.69 0.46
(0.12) (0.13)
With updated data the estimate remains in the .35 - .55 range with a central estimate of .46, but remain fairly imprecise
Note also the key relationship between the size of elasticity and the tax base (Slemrod and Kopczuk, 2002)
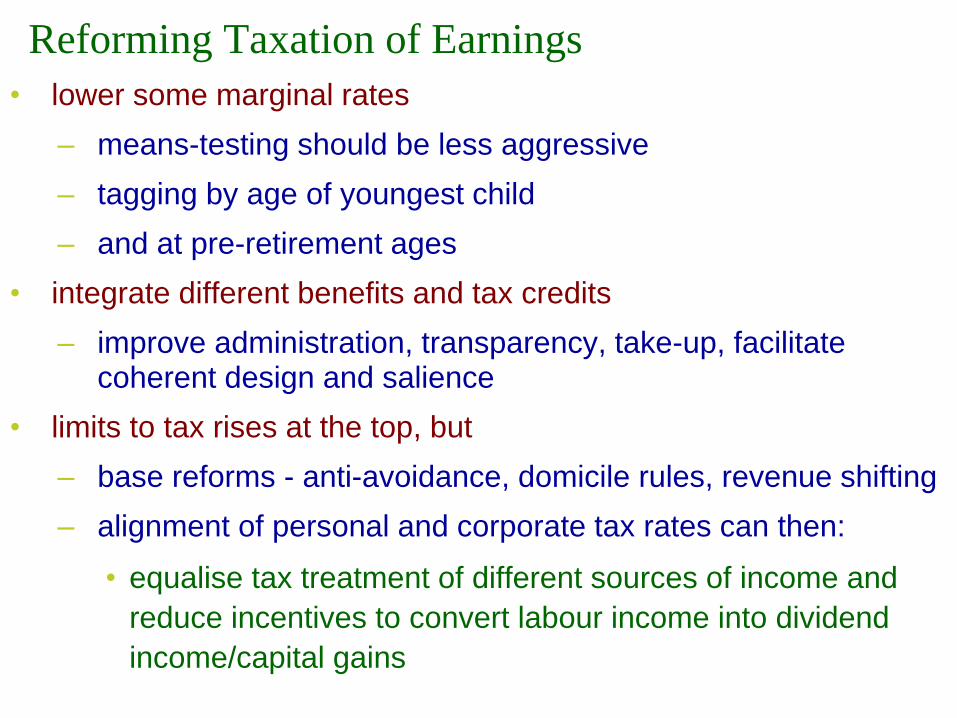
Reforming Taxation of Earnings
• lower some marginal rates
– means-testing should be less aggressive
– tagging by age of youngest child
– and at pre-retirement ages
• integrate different benefits and tax credits
– improve administration, transparency, take-up, facilitate coherent design and salience
• limits to tax rises at the top, but
– base reforms - anti-avoidance, domicile rules, revenue shifting
– alignment of personal and corporate tax rates can then:
• equalise tax treatment of different sources of income and
reduce incentives to convert labour income into dividend
income/capital gains
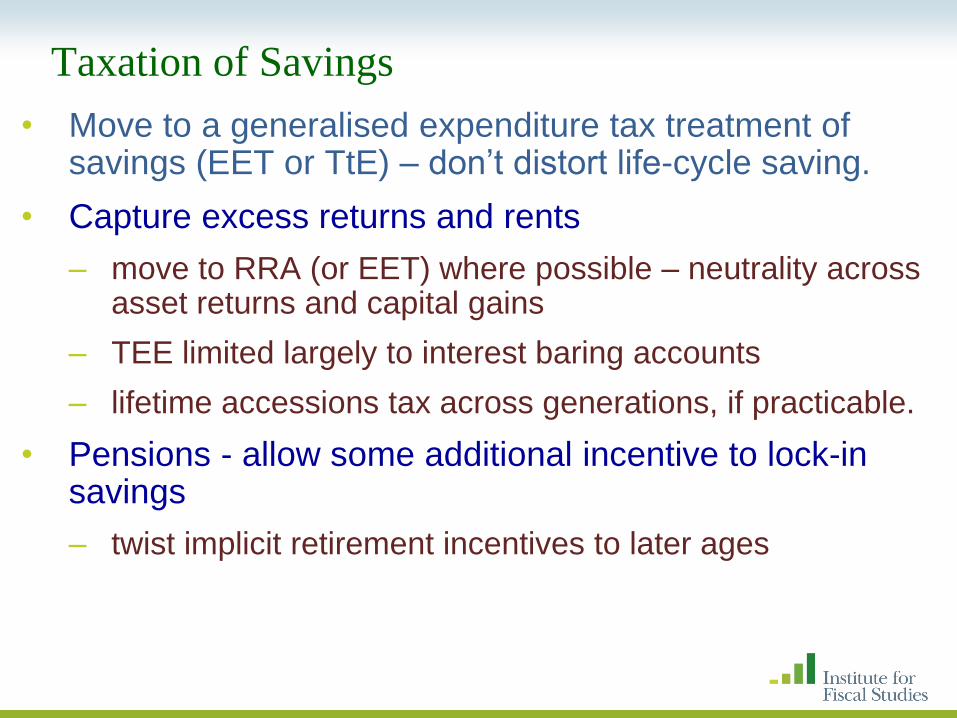
• Move to a generalised expenditure tax treatment of savings (EET or TtE) – don‟t distort life-cycle saving.
• Capture excess returns and rents
– move to RRA (or EET) where possible – neutrality across asset returns and capital gains
– TEE limited largely to interest baring accounts
– lifetime accessions tax across generations, if practicable.
• Pensions - allow some additional incentive to lock-in savings
– twist implicit retirement incentives to later ages
Taxation of Savings
© Institute for Fiscal Studies
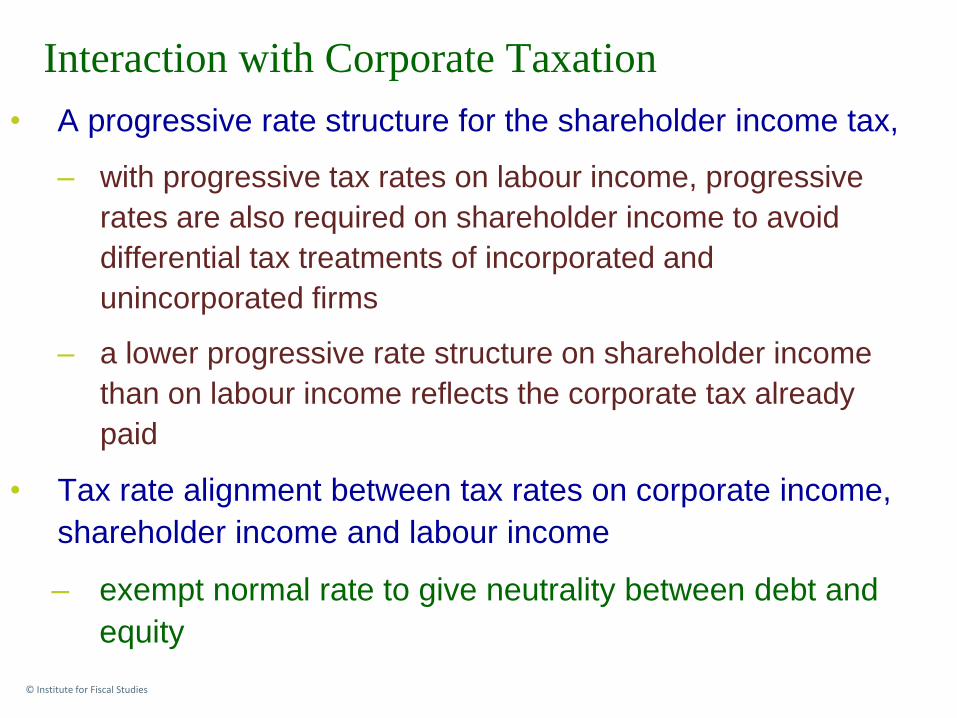
• A progressive rate structure for the shareholder income tax,
– with progressive tax rates on labour income, progressive
rates are also required on shareholder income to avoid
differential tax treatments of incorporated and
unincorporated firms
– a lower progressive rate structure on shareholder income
than on labour income reflects the corporate tax already
paid
• Tax rate alignment between tax rates on corporate income,
shareholder income and labour income
– exempt normal rate to give neutrality between debt and
equity
Interaction with Corporate Taxation
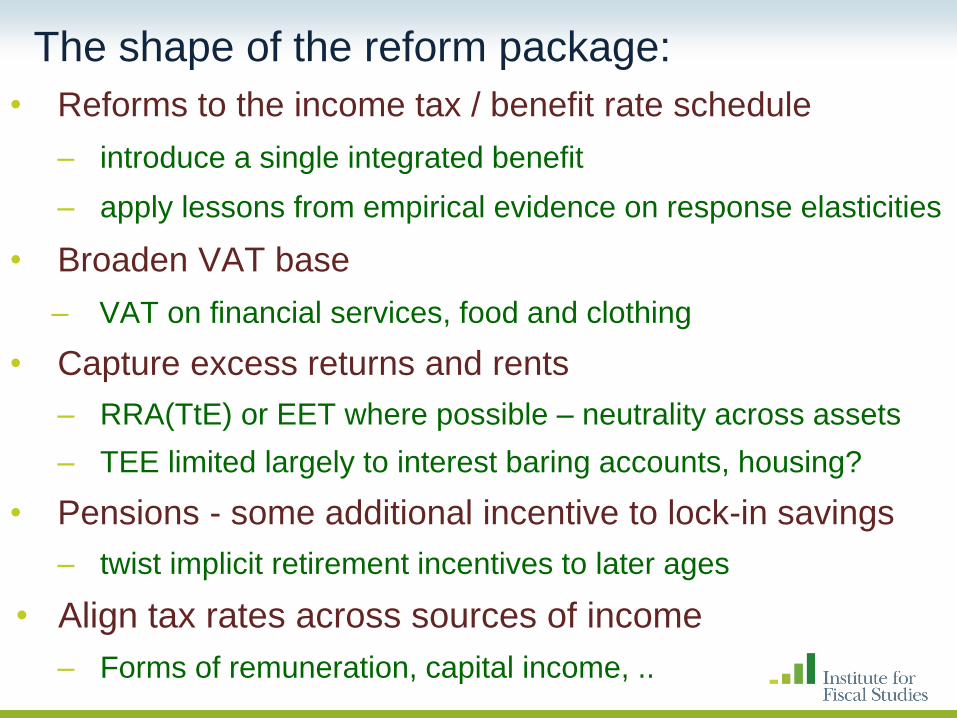
• Reforms to the income tax / benefit rate schedule
– introduce a single integrated benefit
– apply lessons from empirical evidence on response elasticities
• Broaden VAT base
– VAT on financial services, food and clothing
• Capture excess returns and rents
– RRA(TtE) or EET where possible – neutrality across assets
– TEE limited largely to interest baring accounts, housing?
• Pensions - some additional incentive to lock-in savings
– twist implicit retirement incentives to later ages
• Align tax rates across sources of income
– Forms of remuneration, capital income, ..
The shape of the reform package:

© Institute for Fiscal Studies
Five building blocks for the role of evidence in tax design….
• Key margins of adjustment to tax reform
• Measurement of effective tax rates
• The importance of information, complexity and salience
• Evidence on the size of responses
• Implications for tax design
see
http://www.ifs.org.uk/mirrleesReview
Empirical Evidence and Tax Reform: Lessons from the Mirrlees Review

VAT and financial services
• Consumption of financial services should be taxed
• Exemption causes serious problems
– Financial services too cheap for households, too expensive for firms
– Costs around £7bn (though insurance premium tax recoups £2bn)
• Can‟t be taxed through standard VAT mechanism
• But there are equivalent alternatives
– Cash-flow tax, Tax Calculation Accounts, Financial Activities Tax,...
• Need detailed study to find the most practical option
© Institute for Fiscal Studies
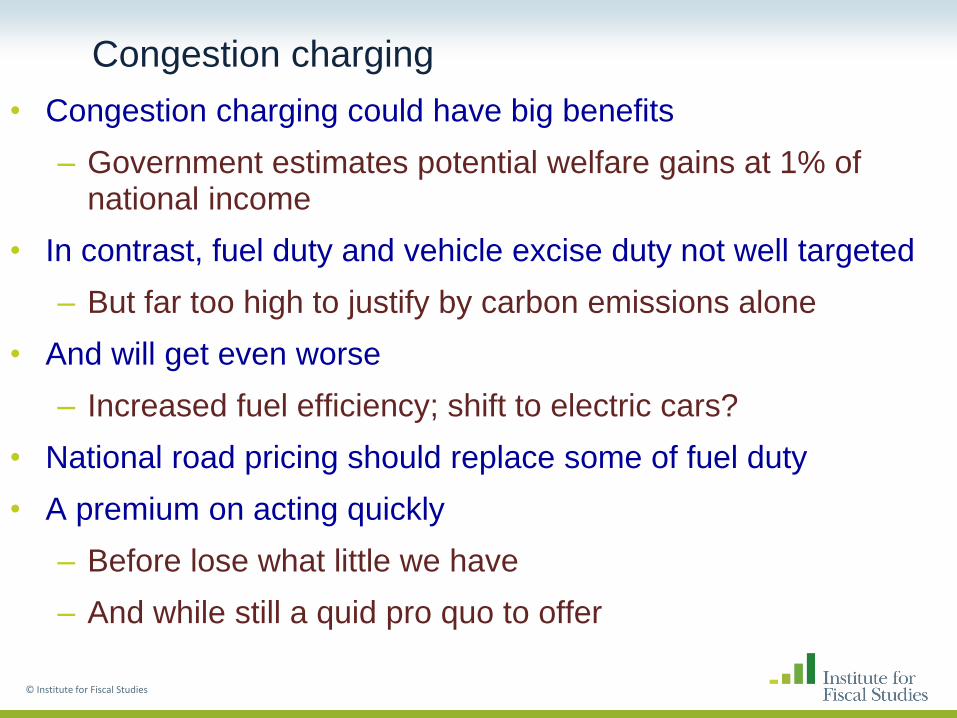
Congestion charging
• Congestion charging could have big benefits
– Government estimates potential welfare gains at 1% of national income
• In contrast, fuel duty and vehicle excise duty not well targeted
– But far too high to justify by carbon emissions alone
• And will get even worse
– Increased fuel efficiency; shift to electric cars?
• National road pricing should replace some of fuel duty
• A premium on acting quickly
– Before lose what little we have
– And while still a quid pro quo to offer
© Institute for Fiscal Studies
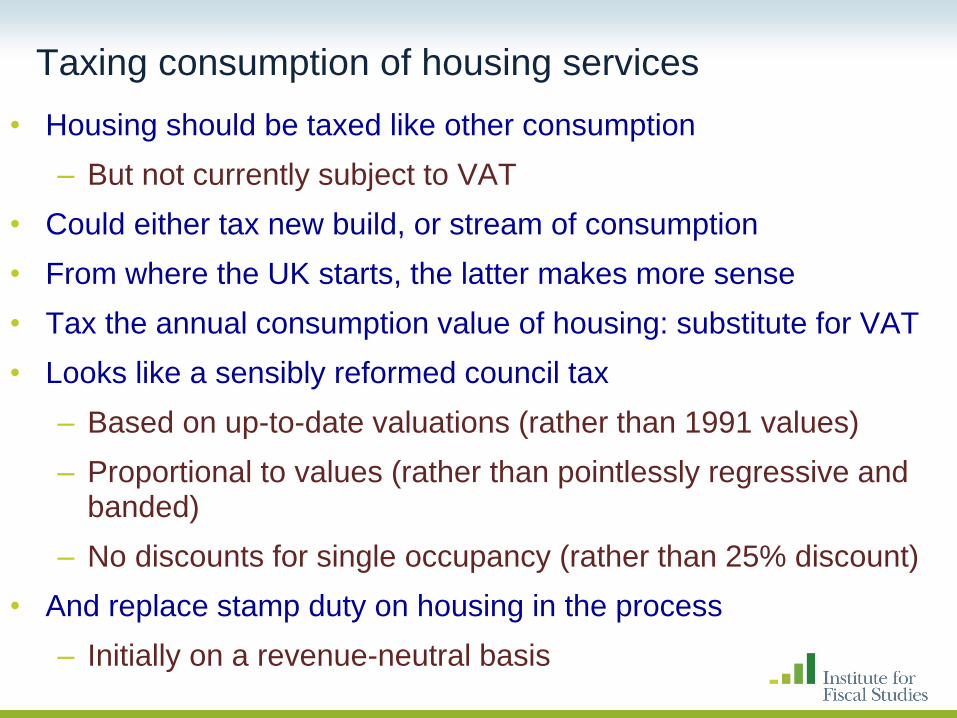
Taxing consumption of housing services
• Housing should be taxed like other consumption
– But not currently subject to VAT
• Could either tax new build, or stream of consumption
• From where the UK starts, the latter makes more sense
• Tax the annual consumption value of housing: substitute for VAT
• Looks like a sensibly reformed council tax
– Based on up-to-date valuations (rather than 1991 values)
– Proportional to values (rather than pointlessly regressive and banded)
– No discounts for single occupancy (rather than 25% discount)
• And replace stamp duty on housing in the process
– Initially on a revenue-neutral basis

© Institute for Fiscal Studies
A „housing services tax‟ Note: rough guide only – see Chapter 16 for details
$0
$1,000
$2,000
$3,000
$4,000
$5,000
$6,000
£0 £200,000 £400,000 £600,000 £800,000 £1,000,000
Current property value
Council tax bill
Housing services tax bill

(Some) Additional References (see also Dimensions of Tax Design and Tax by Design)
Banks, J., Blundell, R., and Tanner, S. (1998) “Is there a retirement-savings puzzle?”,
American Economic Review, 88, 769 – 788.
Besley, T. and S. Coate (1992), “Workfare versus Welfare: Incentive Arguments for
Work Requirement in Poverty Alleviation Programs”, American Economic Review,
82(1), 249-261.
Blundell, R. Bozio, A and G. Laroque (2011), “The Extensive Margin and Labour
Supply”, American Economic Review, May.
Blundell, R.W., Duncan, A. and Meghir, C. (1998), "Estimating Labour Supply
Responses using Tax Policy Reforms", Econometrica, 66, 827-861.
Blundell, R, Duncan, A, McCrae, J and Meghir, C. (2000), "The Labour Market Impact
of the Working Families' Tax Credit", Fiscal Studies, 21(1).
Blundell, R. and Hoynes, H. (2004), "In-Work Benefit Reform and the Labour Market",
in Richard Blundell, David Card and Richard .B. Freeman (eds) Seeking a Premier
League Economy. Chicago: University of Chicago Press.
Blundell, R. and MaCurdy (1999), "Labour Supply: A Review of Alternative
Approaches", in Ashenfelter and Card (eds), Handbook of Labour Economics,
Elsevier North-Holland.
Blundell, R., Meghir, C., and Smith, S. (2002), „Pension incentives and the pattern of
early retirement‟, Economic Journal, 112, C153–70.
Blundell, R., and A. Shephard (2012), „Employment, hours of work and the optimal
taxation of low income families‟, Review of Economic Studies, 79(2), April.
Brewer, M. A. Duncan, A. Shephard, M-J Suárez, (2006), “Did the Working Families
Tax Credit Work?”, Labour Economics, 13(6), 699-720.
Card, David and Philip K. Robins (1998), "Do Financial Incentives Encourage Welfare
Recipients To Work?", Research in Labor Economics, 17, pp 1-56.
Chetty, R., Guren, A., Manoli, D. & Weber, A. (2011), `Are Micro and Macro Labor
Supply Elasticities Consistent? A Review of Evidence on the Intensive and Extensive
Margins', American Economic Review Papers and Proceedings
Diamond, P. (1980): "Income Taxation with Fixed Hours of Work," Journal of Public
Economics, 13, 101-110.
Eissa, Nada and Jeffrey Liebman (1996), "Labor Supply Response to the Earned
Income Tax Credit", Quarterly Journal of Economics, CXI, 605-637.
Immervoll, H. Kleven, H. Kreiner, C, and Saez, E. (2005), `Welfare Reform in
European Countries: A Micro-Simulation Analysis‟ Economic Journal.

Keane, M.P. and Moffitt, R. (1998), "A Structural Model of Multiple Welfare Program
Participation and Labor Supply", International Economic Review, 39(3), 553-589.
Kopczuk, W. (2005), „Tax bases, tax rates and the elasticity of reported income‟,
Journal of Public Economics, 89, 2093–119.
Laroque, G. (2005), “Income Maintenance and Labour Force Participation”,
Econometrica, 73(2), 341-376.
Mirrlees, J.A. (1971), “The Theory of Optimal Income Taxation”, Review of Economic
Studies, 38, 175-208.
Moffitt, R. (1983), "An Economic Model of Welfare Stigma", American Economic
Review, 73(5), 1023-1035.
Phelps, E.S. (1994), “Raising the Employment and Pay for the Working Poor”,
American Economic Review, 84 (2), 54-58.
Saez, E. (2002): "Optimal Income Transfer Programs: Intensive versus Extensive
Labor Supply Responses," Quarterly Journal of Economics, 117, 1039-1073.
Sørensen , P. B. (2009) “Dual income taxes: a Nordic tax system”, Paper prepared for
the conference on New Zealand Tax Reform – Where to Next?.