Embed Size (px)
Citation preview
Demographic Research a free, expedited, online journal of peer-reviewed research and commentary in the population sciences published by the Max Planck Institute for Demographic Research Doberaner Strasse 114 · D-18057 Rostock · GERMANY www.demographic-research.org
DEMOGRAPHIC RESEARCH VOLUME 3, ARTICLE 7 PUBLISHED 20 SEPTEMBER 2000 www.demographic-research.org/Volumes/Vol3/7/ DOI: 10.4054/DemRes.2000.3.7
Empirical Assessments of Social Networks, Fertility and Family Planning Programs: Nonlinearities and their Implications
Hans-Peter Kohler
Jere R. Behrman
Susan Cotts Watkins
© 2000 Max-Planck-Gesellschaft.
http://www.demographic-research.org/Volumes/Vol3/7/ 20 September 2000
Empirical Assessments of Social Networks, Fertility
and Family Planning Programs:
Nonlinearities and their Implications
Hans-Peter Kohler1
Jere R. Behrman2
Susan Cotts Watkins3
Abstract
Empirical studies of the diffusion of modern methods of family planning have increasing
incorporated social interaction within nonlinear models such as logits. But they have not considered
the full implications of these nonlinear specifications. This paper considers the implications of using
nonlinear models in empirical analyses of the impact of family programs, modulated by social
interaction, on reproductive behavior. Three implications of nonlinear models, in comparison with
linear models, are developed. (1) With nonlinear models, there may be both low and high
contraceptive-use equilibria (i.e., the ultimate level of use of modern family planning that a
population can be expected to reach after the effects of a sustained change in a family planning
program have worked through the population) rather than just one equilibrium as in linear models.
If there are multiple equilibria, then one striking and important result is that a transitory large
program effort may move a community from sustained low- to high-level contraceptive use. (2) With
nonlinear models the extent to which a social interaction multiplies program efforts depends on
whether the community is at a low or high level of contraceptive use rather than being independent
of the level of contraceptive use as in linear models. (3) With nonlinear models, intensified social
interaction can retard or enhance the diffusion of family planning, in contrast to only enhancing
diffusion as within linear models. To clarify these implications, for comparison a simple and more
transparent linear model is also discussed. Illustrative estimates are presented of simple linear and
nonlinear models for rural Kenya that demonstrate that some of these effects may be considerable.
1 Head of the Research Group on Social Dynamics and Fertility, Max-Planck Institute for Demographic Research,
Doberaner Str. 114, 18057 Rostock, Germany, e-mail: [email protected] Director of the Population Studies Center and the W.R. Kenan, Jr. Professor of Economics, McNeil 160, 3718
Locust Walk, University of Pennsylvania, Philadelphia, PA 19104-6297, USA; telephone 215 898 7704, fax 215898 2124, e-mail: [email protected]
3 Professor of Sociology, McNeil 113, 3718 Locust Walk, University of Pennsylvania, Philadelphia, PA 19104-6299, USA; telephone 215 898 4258, fax 215 898 2124, e-mail: [email protected].
http://www.demographic-research.org/Volumes/Vol3/7/ 20 September 2000
1. Introduction
Most empirical studies of the diffusion of modern methods of family planning have treated family
planning programs as if they only affect individuals directly [Note 1]. It is unlikely, however, that
all of those who hear family planning messages on the radio or from the clinic keep quiet about what
they have heard [Katz and Lazarsfeld 1955]. Indeed, exposure to messages from formal sources may
stimulate conversation, perhaps especially when there is widespread uncertainty–for example, about
the desirability of fewer children, the legitimacy of deliberate control of fertility in marriage, or the
safety of modern methods of family planning.
If social interaction is relevant for attitudes and behavior, then family planning programs have
both a direct effect on those who are in contact with the program and an indirect effect produced by
social interaction [Bongaarts and Watkins 1996, Montgomery and Casterline 1993, Montgomery and
Casterline 1996]. This latter, indirect effect of family planning programs leads to a social multiplier
effect that implies that the total–or long term–change in family planning use exceeds the change in
contraceptive prevalence that is directly attributable to program interventions. For example, in a
recent household survey conducted in Nyanza Province, Kenya and described in more detail below,
the majority of women who reported hearing a family planning talk in a clinic or receiving a family
planning message from the radio, movies or newspapers or who were visited by a Community Based
Distribution agent, said they then talked about it with others. Moreover, substantial proportions of
those who had not directly been exposed to a program message nonetheless had chatted about family
planning with others. Indeed, it may be that messages heard second-hand may be particularly
influential and thus lead to additional increases in contraceptive use among women who were not
reached or not convinced by the initial program effort. For instance, in the qualitative component of
the Nyanza study, the process of transmission of information from person to person was often
accompanied by an evaluation of the generic program information to suit the particular local context,
and social interaction therefore augmented and modulated the information provided by the program
[Watkins 1998, Watkins, Rutenberg, and Green 1995].
Because social interactions might be important in helping us to understand fertility change in
developing countries, there has been a small, though rapidly growing, empirical literature that
examines their possible impact [e.g., Arends-Kuenning 1997, Entwisle and Godley 1998, Kohler,
Behrmann, and Watkins 2001, Montgomery and Casterline 1993, Montgomery and Casterline 1996,
Montgomery and Chung 1994, Munshi and Myaux 1997]. But despite the increasing attention given
by demographers to issues of social interaction, there remain fundamental problems of analysis and
inference.
In this paper we consider the implications of using nonlinear models in empirical analyses of
the impact of family planning programs, modulated by social interaction, on reproductive attitudes
and behavior. To clarify these implications, we discuss for comparison a simple and more
http://www.demographic-research.org/Volumes/Vol3/7/ 20 September 2000
transparent linear model that we perceive is the basis of the intuitions of many analysts regarding the
impact of social interactions on family planning adoption. Although this linear model is used in some
studies [e.g., Montgomery and Casterline 1993], most studies of social interactions in the context
about the adoption of contraception use nonlinear models, frequently logistic models, without
extensive discussion of the implications of this choice [Arends-Kuenning 1997, Entwisle and Godley
1998, Kohler, Behrman, and Watkins 2001, Montgomery and Chung 1994, Munshi and Myaux
1997]. Although the implications of using nonlinear models might appear to be a technical issue with
little consequence for the results of empirical analyses, the implications of this choice for
understanding behavior and for policy may be substantial. We are unaware of any prior consideration
of the implications of using nonlinear models, nor of the consequences of using linear versus a
nonlinear model, in the literature on the diffusion of contraception with social interactions.
If the relation between program effort and the use of family planning is linear, there is only one
stable equilibrium, i.e., the ultimate level of use of modern family planning that a population can be
expected to reach after the effects of a sustained change in a family planning program have worked
through the population. The extent to which social interaction multiplies program efforts is
unaffected by whether the equilibrium is at a low or high level of contraceptive use. With a nonlinear
model, however, there may be both low and high equilibria; in the former family planning use is low
despite program effort, and in the latter it is high. In this nonlinear world, the effects of program
efforts depend on whether the community targeted by the program has a low or a high level of
contraceptive use. A striking implication of a nonlinear model, moreover, is that a sufficiently large
change in program intensity may cause a large shift from a old, low-family-planning-use equilibrium
to a new, high-level equilibrium even if the program change is transitory rather than sustained. This
means that even were program efforts to subsequently diminish – due, for example, to donor fatigue
or strained governmental budgets– fertility would continue to be controlled [Note 2].
Just as the form of the model has implications for evaluating the impact of intensified program
efforts, the form of the model has implications for evaluating the impact of intensified social
interaction. If the relation is linear, any intensified social interaction must increase the social
multiplier effect, i.e., the difference between the total and direct change in family planning use that
results from program interventions. It is plausible, however, that program efforts may provoke
opposition. For example, where the elderly rely on their descendants for economic support, the
introduction of an accessible family planning clinic may intensify opposition by parents-in-law, who
worry even more that the numbers of their grandchildren – and thus the intergenerational support
they hope for – might be diminished [Watkins 1998]. Moreover, researchers and other observers
long have known that new users of family planning may not be satisfied: rather, they may alarm their
friends by detailing the negative side effects of modern methods that they have perceived [DeClerque
et al. 1986, Forthingham 1968, Rutenberg and Watkins 1997]. Although this aspect has been
discussed in the literature at least since Granovetter [1973] introduced the notion of weak and strong
http://www.demographic-research.org/Volumes/Vol3/7/ 20 September 2000
ties [e.g., for relevant demographic discussions see Crook 1978, Bongaarts and Watkins 1996,
Montgomery and Casterline 1993, Montgomery and Casterline 1996], it has not been addressed
within formal analyses on the adoption of contraception. Our analyses in this paper show that if the
model is nonlinear, the ambiguous effect of intensifying social interaction is represented in the
theoretical framework. In a nonlinear model, intensified social interaction can increase or decrease
the social multiplier effect and intensified social interaction can thus retard or enhance the diffusion
of family planning after program interventions. The direction of this effect is then an empirical
question, and it is no longer imposed by the formal theoretical framework as is the case with a linear
model.
Section 2 presents a formal model of diffusion with social interactions, develops the
implications of the nonlinearity of the model, and contrasts this model with a linear probability
model. Section 3 summarizes the two data sets that we use for illustration. Section 4 presents and
discusses our empirical estimates. We emphasize that we do not address completely or satisfactorily
what we consider to be the central substantive issue: the impact of social networks on contraceptive
use and fertility. This question raises other important methodological issues, such as the role of
endogenous choices of social network partners and unobserved heterogeneities, that cannot be well
addressed with the cross-sectional data we use for our estimates here. The comparisons in Section
4, nevertheless, provide insight into evaluating program effects under the maintained hypothesis that
estimation problems such as unobserved heterogeneities, while they may affect each of the estimates
being compared, do not affect them differentially.
http://www.demographic-research.org/Volumes/Vol3/7/ 20 September 2000
2. Implications of Linear and Nonlinear Models of Family Planning Diffusion with Social Interactions
In this section we formally identify the direct program impact versus total effect (i.e., the direct
effect modulated by social interactions, see below) of increases in family planning program efforts
in both linear and nonlinear models. We then compare the implications of linear and nonlinear
models in situations in which program efforts are increased and in situations in which social
interactions are intensified.
Linear probability model: We begin with the linear model because it is simpler and more
transparent despite its well-known limitations. Let the probability that a woman adopts modern
family planning (y = 1) be:
P(y=1 | x, yc) =α*(-.5 + yc) + β*x + δ {1}
The term α*(-.5 + yc) represents the influence of social interaction on a woman’s probability to use
family planning and is chosen to match our subsequent specification of the nonlinear model. The
parameter α reflects the ‘strength’ or relevance of social interaction and determines the extent to
which the adoption probability is affected by the contraceptive behavior in the village or reference
group (yc). For α = 0 there is no effect of social interaction, and increasing levels of α tend to
increase the relevance of social interaction for a woman’s family planning decision. As shown
below, 0 < α < 1 is necessary for there to be an interior equilibrium in which some women in a
community, but not every woman in the community, uses contraceptives. The term 0.5 represents
a critical level that determines the direction of the social influence on a woman’s contraceptive
decision. If the contraceptive prevalence in the reference group (yc) is above 0.5, then social
interaction increases the probability of using family planning as compared to the situation when no
social interaction is present, and otherwise it decreases the probability. In a situation with yc = .5, i.e.,
a situation where half of the population uses and half does not use family planning, social
interactions has no effect on a woman’s decision to adopt contraception. The coefficient β is the
direct effect of program efforts (x), and larger program efforts increase the probability of using
contraception when β > 0. The final term δ is the constant. For simplicity, in our discussion of this
theoretical model in this section (but not in our estimates in Section 4) we consider only women who
are identical with respect to individual characteristics, which permits us to combine the effect of
these characteristics into the constant term. As in the nonlinear model below, the constant term is
assumed only to represent these individual characteristics and is assumed not to adjust to offset
changes in the first term that determines the relevance of social influences on women’s fertility
decisions.
The solid line in Figure 1 plots the curve implied by equation {1}: the vertical axis gives an
individual’s probability of using contraception as related to the average contraceptive use for the
individual’s reference group (yc, on the horizontal axis) given the program effort x (e.g., proportion

http://www.demographic-research.org/Volumes/Vol3/7/ 20 September 2000
of other villagers who “heard a family planning message on the radio”). The slope of the solid line
indicates how the probability of individual use changes when there is a discrepancy between the
probability of an individual’s use and the average contraceptive use of other women in her village.
It is important to note that the lines in Figure 1 specify the dependence of individual behavior
on the family planning prevalence in the social environment of that individual. The figure therefore
represents a micro-macro relation between individual and population behavior, and not an
intertemporal relation. In particular, the linear model in Figure 1 is consistent with the typical S-
shaped diffusion curve reflecting the increased adoption of an innovation over time in aggregate data
[e.g., see Rogers 1995].
The linear model in Figure 1 exhibits only one equilibrium, the point at which each
individual’s behavior mirrors the village average -- where the solid line intersects the 45o ray from
the origin in Figure 1 [Note 3]. This equilibrium therefore satisfies P(y=1 | x, ye) = ye, where ye is the
equilibrium level of contraceptive use. In linear models, this equilibrium level can be calculated
directly from the model parameters as ye=βx/(1-α) + (δ - .5α)/(1-α). If individuals prefer to behave
somewhat like others in their reference group (so that α is positive but less than one), this
equilibrium is stable. To the left of it the individual probability of use is above the village average
use; therefore the average village use increases because the individual is in the reference group for
others in the village, which causes movement to the right towards the equilibrium (and vice versa
to the right of the equilibrium).
What happens when there is an increase in program effort, for example a new media
campaign? We depict this changed relation between the program and social interaction as a shift
from the solid to the dashed line in Figure 1. The direct effect on the probability of the individual’s
use of changing program efforts is the vertical distance indicated as the “direct program effect” in
Figure 1 (the result of changing program effort by one unit while holding constant village average
use). This direct program effect is not modulated by social interactions. If, however, the individual
adjusts to her reference group, we get a social multiplier [Montgomery and Casterline 1993]. The
social multiplier leads to a new and higher equilibrium level of contraceptive use, i.e., where the
dashed line intersects the 45o ray. The total increase in the probability of contraceptive use is thus
the total program effect, consisting of a direct program effect plus its multiplication by social
interaction.
It is obvious that if one evaluates changes in family planning programs without taking the
indirect effects of social interaction into account, the total effect provides an overestimate of the
direct influence of program interventions. Whereas the direct effect is immediately linked to the
intervention, the total effect results in addition from feedbacks in which initial program interventions
are augmented through interaction. Formally, the total change in contraceptive use due to a unit
increase in the program effect is ∂ ye/ ∂ x = β/(1 - α), which is greater than the direct impact of βbecause of social interactions if 0 < α < 1. The factor 1/(1 - α) represents the social multiplier effect
http://www.demographic-research.org/Volumes/Vol3/7/ 20 September 2000
ML in the linear model, and this multiplier effect equals the ratio of the total program effect to the
direct impact of the program. Since ML in the linear model exceeds one for 0 < α < 1, the total
program effect is always larger than the direct effect of the program. Moreover, the social multiplier
has the same value for all levels of contraceptive use, and its value is greater the greater is α. That
is, intensifying social interaction - in the sense of making the reference-group behavior more relevant
for a woman’s contraceptive decision by increasing the parameter α - increases the social multiplier
effect. Formally, this positive effect of strengthening social interaction on the multiplier effect is seen
in the derivative ∂ ML/ ∂ α = 1/(1 - α)2 > 0. It is important to note that this increase of the social
multiplier due to more intensive interaction is independent of the sign of ∂ P(y=1 | x, yc)/ ∂ α, i.e.,
the effect of the change in α on the individual probability to use modern contraception.
While a fully dynamic model of social interaction is desirable [e.g., see Montgomery and
Casterline 1998 or Montgomery and Zhao 1998 for simulation-based dynamic models of social
interactions and fertility decisions], the distinction between direct and total effects provides a first
approximation for interpretation of estimates within a dynamic framework. The direct effects of
program changes can be interpreted to be short-term effects of program intervention, while the total
effects incorporate the long-term implications that also include the eventual indirect consequences
of family planning programs on knowledge about contraception and on norms of reproductive
behavior.
A nonlinear model: We use the logistic form of a nonlinear model, a specification that is
frequently used in theoretical models of social interactions [Brock and Durlauf 1995, Kohler
2000a,b, Manski 1993] and for empirical estimates [Arends-Kuenning 1997, Entwisle and Godley
1998, Kohler, Behrman, and Watkins 2001, Montgomery and Chung 1994, Munshi and Myaux
1997]. In addition, and importantly for our discussion below, this logistic model can be motivated
from individual utility maximization [McFadden 1981]. While the standard motivation is
individualistic--behavior depends only on individual characteristics (and prices)--we also include
dependence of behavior on the social environment. In particular, we represent social interactions via
a social utility term in which women experience disutility if their behavior deviates from the average
level of contraceptive use in their reference group. This assumption captures our findings in the
ethnographic interviews in the Kenya Diffusion and Ideational Change Project (KDICP) that in
Nyanza, where family planning use was still quite low, there was substantial uncertainty about the
appropriateness and the safety of modern methods [Rutenberg and Watkins 1997]. Alternatively,
small families may be socially stigmatized if a large family norm is prevalent. Thus, we expect that
increases in the prevalence of family planning in a village lead to a reduction in uncertainty about
the consequences of small families and that these increases also make the use of family planning
methods socially more acceptable.
We assume that the disutility from deviating from the average behavior of woman’s reference
group is related linearly to the difference between an individual's decision to use or not to use and
http://www.demographic-research.org/Volumes/Vol3/7/ 20 September 2000
the average reference group behavior yc. More specifically, we assume that the social utility term
takes the form of a*(-.5 + yc), where .5 is the critical level above which the prevalence of
contraceptive use in a woman’s village or reference group has a positive influence on the adoption
of family planning, and a is the ‘strength’ or relevance of this social interaction effect. The standard
derivation leads to the probability that a woman uses a modern method of family planning given by
P(y=1|x, yc) = F(a*(- .5 + yc) + b*x + d), {2}
where d is a constant including the effect of the individual characteristics and F is the cumulative
logistic distribution.
The above model is interesting because with slight modifications it can capture two important
processes that are frequently used to motivate the relevance of social interactions: social learning
and social influence [Montgomery and Casterline 1993]. The former stresses that contraceptive
adoption decisions are subject to substantial uncertainty, for example about the medical side effects
of modern contraception and/or the benefits of choosing a smaller number of children. Learning
about the experiences of other women through social interactions may reduce this uncertainty and
thus change the probability that a woman adopts contraception or reduced fertility herself. The
second aspect, social influence, emphasizes normative influences on behavior. Social influence
captures the fact that preferences regarding modern contraception and/or the number of children are
affected by the fertility-related opinions and behaviors that prevail in an individual's social
environment. These two aspects can be incorporated in {2} by replacing the term .5 in the social
utility term with a more general critical level φ. Kohler et al. [2001] have shown that the above
framework can then be used to empirically and theoretically distinguish between social learning and
social influence based on data that include information about the structure of women’s social
networks. If social influence is most relevant, then we expect φ to be relatively large since φrepresents a critical level of contraceptive use among her network partners that needs to be exceeded
before networks have a positive effect on the adoption of modern contraception. If social learning
dominates, then φ is small because even a small proportion of users in a network can provide useful
information about modern contraception that reduces the respondent's uncertainty about this
innovation.
In the context of this paper, however, the critical level φ is only of secondary importance. In
particular, we focus here on the strength of social interaction – as reflected in the parameter a – since
this aspect is most relevant for the comparison between linear and nonlinear models and for the
existence of multiple equilibria. In our analyses of model {2} we therefore assume that the critical
level φ equals 0.5 because this level constitutes in our opinion a plausible specification and most
data-sources will not allow the estimation of an alternative value.
The total effect of family planning programs in the presence of social interactions can be
characterized in the above nonlinear model, as in the linear case, by equilibria in which an
individual’s choice probability mirrors the cluster or village average. That is, an equilibrium is a
http://www.demographic-research.org/Volumes/Vol3/7/ 20 September 2000
level of contraceptive use that satisfies P(y=1|x,ye ) = ye, or equivalently, an equilibrium is a fixed
point at which ye = F(a*(-.5 + ye) + b*x + d). These equilibria are thus at intersections of the "s-
shaped" curve F(.) with the diagonal.
The solid line in Figure 2 displays a case in which only one such equilibrium exists. The solid
line in Figure 3, on the contrary, shows a case with three intersections. Multiple equilibria are a
possibility, though not a necessity, with nonlinear models; they arise when the effect of social
interaction (the social utility term in {2}) is sufficiently strong, or alternatively, if the coefficient a
is sufficiently large (A necessary but not sufficient condition for the existence of multiple equilibria
is that the largest derivative {2} with respect to yc exceeds one, which implies that a needs to be
larger than four). The equilibria at low and high levels of contraceptive use are stable for reasons
parallel to those discussed with regard to Figure 1. The same reasoning, however, indicates that the
center equilibrium always is unstable. A population converges to one of the two stable equilibria
depending on whether it is to the left or right of the unstable equilibrium.
The use of the logistic distribution F(.) in the nonlinear model {2} is convenient choice, but
it is not essential for the implications of our model. The most important aspect of ‘nonlinearity,’
which is implied by the logistic function F(.) but also many other functional forms, is the convex-
concave property, or the s-shape, of the curve in Figure 3. Multiple equilibria can arise if the
functional form in model {2} exhibits a s-shape for sufficiently strong social interaction effects, i.e.,
for a sufficiently large value of a. Analytically less convenient, but otherwise very similar functional
forms that can be used instead of the logistic function F(.) are the cumulative normal distribution or
the arctan function (i.e., the inverse of the tangent function).
The above nonlinear model points to three relevant aspects of social interactions for program
effects.
First, social interactions increase the impact of program effects beyond the direct program
effect similarly to the linear model in Figure 1 by changing the location of equilibria. Social
interaction leads again to a social multiplier effect that amplifies and enhances the direct effect. If
the nonlinear model exhibits only one equilibria, the total effect is measured by the shift in the
equilibrium level in Figure 2, similar to our earlier discussion of the linear case in Figure 1. If there
are multiple equilibria, as in Figure 3, small and large program changes lead to qualitatively different
implications. On one hand, large program changes, which are further discussed below, can displace
an equilibrium and lead to transitions between the high and low fertility equilibria. On the other
hand, small program changes lead to shifts in the level of each equilibria and to social multiplier
effects in populations that are close to the high or low fertility equilibrium. The relation between the
direct and the total program effects, which we developed for the single equilibrium case above,
therefore applies ‘locally’ to both the high and low fertility equilibria as long as the program changes
are small.

http://www.demographic-research.org/Volumes/Vol3/7/ 20 September 2000
This effect of small changes in program efforts on the location of equilibria can be evaluated
analytically. Assume that a population is currently at an equilibrium ye = ye(x,a,b,d) which satisfies
ye = F(a*(-.5+ ye) + b*x + d). The direct effect of changing the program effort x then equals
∂ P(y=1|x,ye)/ ∂ x = ∂ F(.)/ ∂ x = b*ye*(1-ye), where the equilibrium value ye is held constant when
taking the derivative with respect to x. The total—or long term—program effect is measured by the
shift in the equilibrium level caused by program efforts and thus equals ∂ ye/ ∂ x. Using the implicit
function theorem we obtain ∂ ye/ ∂ x = b (ye*(1-ye))/ [1- a (ye*(1-ye))] = (1-a*ye*(1-ye))-1
* ∂ P(y=1|x,ye)/ ∂ x, where ∂ P(y=1|x,ye)/ ∂ x is the direct program effect. Because at a stable
equilibrium ∂ F(.)/∂ y y=ye =a*ye*(1-ye) < 1, the total program effect exceeds the direct effect at a
stable equilibrium. In particular, the ratio of the total to direct effect, or the social multiplier, equals
1/(1-a*ye*(1-ye)) and is larger than one.
Therefore, in the nonlinear case as well as in the linear case, the social multiplier effect implies
that the total change in contraceptive use exceeds the direct program effect. Ignoring social
interaction is therefore likely to lead to overestimates of direct program effects. Similarly, in the
linear case the change in the equilibrium level of contraceptive use is maintained only if the change
in program effort is permanent. But, in contrast to the linear model, in the nonlinear model the size
of the social multiplier depends on the extent of average use in the reference group and the shape of
the curves in Figures 2 and 3. If the curve is more sharply upwardly sloped around the initial
equilibrium, for example, the social multiplier for a given increase in program effort is greater.
Second, whereas in the linear model there is only one steady state that a population reaches
after the effects of a family planning innovation have worked their way through the population,
nonlinear models may have multiple equilibria. If there are multiple equilibria, social interactions
may reinforce large transitory program efforts and shift a population from a stable equilibrium with
a low prevalence of contraceptive use (high level of desired fertility) to a stable equilibrium with
high contraceptive use (low desired fertility) in which everybody may be better off (as in Figure 3).
In such a case, small permanent changes in program effort may only affect the location of the
equilibrium slightly, so that the population remains stuck in a Malthusian low-level equilibrium trap.
But large changes in program effort, reinforced by social interactions, can shift the population from
the low contraceptive use (i.e., high fertility) equilibrium to the high contraceptive use equilibrium,
as illustrated by the shift from the solid to the dashed curve in Figure 3. Transitions between
equilibria are often thought to occur at rapid pace, resulting in large changes of contraceptive
prevalence within a relatively short time. Perhaps even more important for the financing of family
planning programs is that because the high- and low-fertility equilibria are stable, a transitory
increase in program effort, if sufficiently large, can yield this sustainable long-term changes in family
planning usage if it results in the shift between equilibria. In contrast, if a change in program effort
affects only the location of an equilibrium, the program effort needs to be maintained at the new
level in order to result in permanent changes of family planning prevalence levels.

http://www.demographic-research.org/Volumes/Vol3/7/ 20 September 2000
In the presence of these multiple equilibria, the onset of a fertility decline can constitute a
coordination problem where a critical mass of fertility change can initiate a sustainable transition
towards low fertility, and where expectations about future fertility levels are an important element
in contemporary fertility decisions. Kohler [2000b] shows that in the context of such a coordination
problem, social networks can be an important determinant of the onset and pace of fertility change
in addition to program efforts and socioeconomic change. The specific effect depends on the
structure and content of the interaction in social networks. In particular, ‘information networks’ that
provide information about the fertility intentions of other members of the village or reference groups
have little effect on a population’s ability to achieve a fertility decline as long as there is a stable high
fertility equilibrium that inhibits the adoption of low fertility. However, if the population is out of
equilibrium, for example, due to recent program efforts or socioeconomic changes, then information
networks increase the speed of a change in fertility behavior that is already taking place. If social
interaction is in the form of ‘coordination networks,’ i.e., if the ties among individuals in a group are
sufficiently strong to allow collective action among individuals, then social interactions can lead to
an earlier onset and a faster pace of a fertility transition.
Social interactions therefore have a twofold implications for the dynamics of fertility change.
First, if social effects are sufficiently strong and if the nonlinear model {2} describes a woman’s
decision to adopt family planning or low fertility, then the presence of social interaction can lead to
multiple equilibria with a Malthusian ‘high fertility trap’ and sustainable fertility decline that results
from temporary interventions by family planning. Second, social interactions not can not only lead
to these multiple equilibria, but also be an important determinant – in addition to program efforts
and socioeconomic change – of whether a population can ‘escape’ the high fertility equilibrium and
initiate a sustainable transition to the low fertility equilibrium.
Third, the intensification of social interaction may have a negative effect on the size of the
social multiplier; thus, intensified social interaction can lead to a reduction in the total change in
contraceptive use that results from family planning programs. We define the intensification of social
LQWHUDFWLRQ�DV�DQ�LQFUHDVH�RI�WKH�SDUDPHWHU� �RU�a in relations {1} or {2}, which implies a greater
relevance of the contraceptive behavior yc of a woman’s reference group for her own family planning
decision. More intensive social interaction therefore implies that a women’s decision to adopt family
planning is relatively more influenced by her social environment, and relatively less influenced by
her personal characteristics and socioeconomic incentives, than with less intense social interaction.
In the linear model in Figure 1, intensifying social interaction necessarily increases the social
multiplier, and ‘more’ social interaction always increases the ratio of total to direct program effects
[Note 4]. In the nonlinear logistic model as in Figures 2 and 3, however, increasing the impact of
social interaction may increase or reduce the social multiplier [Note 5]. Therefore, the ratio of total
to direct changes in family planning use that result from program efforts may become larger or
smaller when the intensity of social interaction is increased. More intensive interactions, therefore,
http://www.demographic-research.org/Volumes/Vol3/7/ 20 September 2000
can make it more difficult for program interventions to achieve a given amount of total—or long
term—change in contraceptive use. We denote the fact that more intensive social interaction, i.e.,
D�KLJKHU�YDOXH�RI� �RU�a in relations {1} or {2}, decreases the social multiplier effects as status-quo
enforcement.
This result points to an important and intuitive, but in the literature on modeling social
interactions and fertility not sufficiently emphasized and elaborated point [e.g., Bongaarts and
Watkins 1996, Montgomery and Casterline 1993, Montgomery and Casterline 1996]. There are
situations in which there are stable equilibria with positive but not universal contraceptive use in
which social interactions are status-quo enforcing. For instance, the discomfort of deviating from
a high-fertility social norm may increase the more a woman interacts with others in her village who
behave according to the high-fertility norm. Increasing the strength of social interactions then tends
to increase the disutility of a small family, and it can reduce the total behavioral change that results
from program efforts. In such cases, social interactions are status-quo enforcing: the more intensive
is social interaction, the more the multiplier effect of family planning programs decreases.
If there is only one equilibrium, then social interaction can be-- but need not be-- status-quo
enforcing. On the other hand, if there are multiple equilibria then social interaction is always status-
quo enforcing (see note 5 for the formal derivation of this property). Most importantly, therefore, an
intensified social interaction at a Malthusian high fertility equilibrium reduces the multiplier effect
of increased family planning efforts at this equilibrium and therefore makes it more difficult for
program efforts and other socioeconomic changes to increase the level of contraceptive use in a
population that is at such a high fertility equilibrium.
It is important to keep in mind that this status-quo enforcement of social interaction is a "local"
property that reflects changes in the social multiplier due to small changes in program effort x in the
neighborhood of a stable equilibrium ye. It does not affect the implication discussed above that
transitory large changes in x can induce a transition from a high-fertility to a low-fertility equilibrium
in cases with multiple equilibria. Moreover, status-quo enforcement in our definition depends only
on the social multiplier effect, i.e., the ratio of total to direct changes in family planning use caused
by program efforts. It is not necessarily associated with a specific level of contraceptive use. Status-
quo enforcement thus characterizes situations where more intensive social interaction makes it more
difficult for program efforts to change the level of contraceptive use in a population.
In summary, for distinguishing between the direct and indirect effects of small changes in
family planning program interventions on contraceptive use, the linear model and the nonlinear
model are similar, though the social multiplier in the nonlinear case depends on the nature of the
initial equilibrium while in the linear case it is constant. However, only the nonlinear model allows
multiple equilibria with a potential 'Malthusian Trap', and only the nonlinear model permits the
possibility that an intensified social interaction has negative effects on the social multiplier such that
social interaction can be status-quo enforcing.
http://www.demographic-research.org/Volumes/Vol3/7/ 20 September 2000
3. Data and Context of Empirical Estimation
Program efforts began in Kenya in the late 1950s in urban areas, and were expanded after President
Kenyatta’s government adopted a family planning policy in 1967. Support for the program was quite
modest, however, until Moi became president in 1978. Moi’s public support of efforts to reduce
population growth rates may have acted as a “shock” to the system, legitimizing family planning and
permitting much greater donor activity [Robinson 1992]. Family planning messages were regularly
distributed over the radio and through posters and routine family planning talks in the clinics, and
by the early 1990s family planning was widely accessible in local clinics in rural areas. The methods
and messages are widely and frequently discussed in informal conversations, which thus may
multiply program efforts. The overall picture from our household surveys as well as from qualitative
data is of conversations about family planning that occur frequently and casually [Rutenberg and
Watkins 1997, Watkins and Warriner 1999]. Because transportation is limited and expensive and
telephones very few, frequent interaction is largely restricted to members of the local community.
For our empirical illustrations of how the estimation of program effects is affected by incorporating
the social interaction, we use the Kenya Diffusion and Ideational Change Project (KDICP) of
Watkins and colleagues and the Kenya Demographic and Health Survey (KDHS 1989 and 1993).
Using two data sets permits us to evaluate whether our results hold across time and across data sets,
and across different measures of social interaction based on cluster (village) aggregates and reported
social networks. In addition, the KDHS data have the advantage of being similar to data that are
widely available, so others can replicate our analysis in other settings. The KDICP data were
collected in South Nyanza District (subsequently subdivided and renamed) in Nyanza Province, a
predominantly rural area. To maximize comparability with the KDICP data, we restrict the KDHS
to Nyanza Province. The characteristics of rural Nyanza Province are quite similar to those of South
Nyanza District [Ayiemba 1986, Blount 1972, Ndisi 1974, Ocholla Ayayo 1976, Olenja 1991,
Reynar 2000] and the KDICP and the KDHS for Nyanza give similar results for a variety of
measures. (In preliminary analysis we further restricted the KDHS to rural South Nyanza, but this
reduced the sample size substantially)
The KDHS was aimed at providing accurate measurement of basic demographic characteristics and
to permit evaluation of the national population program, with few direct measures of social
interactions. The KDICP was intended to examine the role of social interactions in fertility change
and has many measures of social interactions. In particular, respondents were asked with how many
people they had talked about family planning, followed by questions about the names and
characteristics of a maximum of four of these individuals, including where the network partner lives
and whether the network partner uses family planning [see Watkins and Warriner 1999 and
http://www.pop.upenn.edu/networks for a detailed description of the available network data].
However, the KDICP data include only few measures of contact with the formal family planning
http://www.demographic-research.org/Volumes/Vol3/7/ 20 September 2000
program and a limited range of basic demographic information. Even though the overlap of
comparable variables between these data sets is limited, it includes enough of the standard variables
for analysis of contraceptive use to make the comparisons that we present in Section 4 of interest.
Because the KDICP 1994 data were gathered only one year after the KDHS 1993 data, there are not
likely to be large differences between these two data sets due to events associated with the passage
of time.
In the analyses in this paper, the unit in which social interaction is assumed primarily to take place
is the sample cluster in the KDHS and the village in the KDICP. The KDHS clusters correspond to
larger geographical units than the KDICP villages, and thus are likely to approximate less well than
villages the area of local social interactions. Thus, from the point of view of each respondent’s local
social interactions, a cluster average is likely to be a noisy indicator of the average for the
respondent’s (smaller) village. This means that the coefficient estimates of the cluster averages are
likely to be biased towards zero in comparison with the coefficient estimates that would have been
obtained were village averages available from the DHS; the bias is smaller in clusters that have
villages with similar family planning use rates than clusters in which villages have different family
planning use rates. In the absence of data on both, however, it is not possible to know how large
these biases are.
By comparing the estimates based on village aggregates with those that use individual-level social
network data in the KDICP, we are able to assess the extent to which these aggregate measures of
social interaction lead to different results than the individual-level information on the interaction
about family planning with members of the respondent’s social network.
We restrict the analyses in this paper to currently married women respondents, whether or not
their husband was present, to avoid complications related to absent husbands (27.4% of the husbands
were not present at the time of the first wave of the KDICP, most of them because they were working
elsewhere), which are unimportant for the purposes of this paper. Moreover, there is evidence from
the KDICP data and elsewhere that in fact women may be the final arbiters of contraceptive use, at
least in part because the availability of modern methods permits them to use family planning without
their husband’s agreement [Bawah et al. 1999, Biddlecom and Fapohunda 1998, Pictet and
Ouedraogo 1999, Reynar 1998, Reynar 2000, Watkins, Rutenberg and Wilkinson 1997].
Table 1 gives basic sample characteristics and variable means for the variables used in this
paper. Panel A gives the total number of respondents, the number of clusters/villages, and the
average number of respondents in each cluster/village. Panel B summarizes the distributions of the
main variables in the samples used for our estimates.
Dependent variable: Our dependent variable is whether the respondent has ever used family
planning. We think that ever-use of contraception is a better indicator of innovative behavior than
is current use because discontinuation rates are high and modern contraception is frequently used
temporarily for spacing. The average level of this dependent variable is somewhat higher for the

http://www.demographic-research.org/Volumes/Vol3/7/ 20 September 2000
1993 KDHS than for the KDICP, which may be due to the fact that the former is based on a larger
geographic area (Nyanza Province instead of South Nyanza District) [Note 6].
Right-side variables: The only measure of the population program that was the same in both
surveys concerned hearing a family planning message on the radio. We measure program effect
through the proportion of women (other than the respondent) in a cluster or village who have heard
a family planning message on the radio [Note 7]. Because this program representation basically is
an aggregate variable in the statistical sense of having almost the same representation of a right-side
variable for every respondent in a given village or cluster, we use the Huber-White correction for
our standard errors. The proportion reporting that they heard a family planning message on the radio
is notably larger for the KDICP than for the KDHS. This may be due to the fact that the KDHS made
reference to specific family planning programs, whereas the KDICP questionnaire contained only
one general question about exposure to family planning messages on the radio. We use two measures
of interaction. For both the KDHS and the KDICP data, we use the cluster (village) aggregate of the
dependent variable for individuals, excluding the respondent -- e.g. the proportion of others in the
cluster (village) that reported having ever used family planning. For the KDICP data, we additionally
use the proportion of network partners who have ever used family planning.
http://www.demographic-research.org/Volumes/Vol3/7/ 20 September 2000
4. Estimates and Interpretation
Table 2 summarizes the pertinent implications of the estimates (fully presented in the appendix) for
the basic nonlinear estimates in Panel A and for the comparison between the nonlinear and the linear
estimates in Panel B. The theoretical derivation in Section 2 assumes that the population is
homogeneous. This assumption is relaxed for the empirical implementation. Initially we therefore
calculate individual-level direct and total effects for each woman in the sample, assuming she
interacts with a population having a distribution of characteristics as do the remaining women in the
sample. We then average over these individual-level effects and obtain the (overall) direct and total
effects. These (overall) direct and total effects are reported in Tables 2. They measure the average
direct and total increases in the probability of ever using family planning for all women in the sample
resulting from a small increase in program effort x. The specific equations to calculate these effects
are extensions of the respective equations in Section 2 and are reported in the Appendix.
The first three columns in Table 2 gives the results for the KDHS 1989, KDHS 1993, and
KDICP 1994/5 data sets on the basis of cluster (village) based measures of interaction. The last
column reports the results for the KDICP 1994/5 data using reported networks. For each of the two
dependent variables there are eight sets of estimates – one for the nonlinear logistic model and one
for the linear probability model for each of the four columns. In tables A2 and A3 in the appendix
we additionally provide the corresponding results that are obtained from an alternative measure of
family planning effort based on the distance to the nearest family planning clinic (KDHS 1989 and
1993 only).
Multiple equilibria: We first consider whether the estimates for the logistic model imply that
there is more than one stable equilibrium after the effects of a family planning innovation have
worked their way through the population, an interesting possibility with policy implications that we
discussed above. We find that in these data there is only one equilibrium level of ever used family
planning [Note 8]. Our estimates thus imply that Nyanza is not stuck in a low-level Malthusian
equilibrium with another high contraceptive use stable equilibrium that is attainable if there were
a large enough program effort. This, then, suggests that a large but transitory program effort would
not have the effect of shifting women in this province rapidly to a sustainable high-contraceptive-use
and low-fertility equilibrium. Persistent changes in program effort are necessary to affect the
equilibrium and therefore long-term levels of contraceptive use and desires to stop childbearing.
Equilibrium levels: The equilibrium levels are of interest because, as noted, they represent the
levels of use at which there is no incentive for systematic change (though there may be transitory
fluctuations around them) as long as program efforts are sustained at a given level. At an
equilibrium, individual probabilities of contraceptive use equal the network partners’ average
probability of use. Row A1 gives the estimated equilibrium levels (ye) for the nonlinear model. These
estimated equilibrium levels for the nonlinear models are slightly below the observed levels. The
http://www.demographic-research.org/Volumes/Vol3/7/ 20 September 2000
estimated equilibrium levels for the linear model are slightly higher (row B1) and are basically at the
sample means.
Direct program effects, without and with social interactions: The estimated direct effects from
a marginal increase in program effort are given both for a specification with no social interactions
and a specification with social interactions (rows A2 and A3). All the estimates indicate that the
failure to include social interactions would result in substantial upward biases in the estimated direct
program effects. These overestimates are considerable – in the nonlinear models by from 33 to 148%
for the effect of how program efforts change the level of ever used family planning (row A6). The
linear model produces estimates of direct program effects that are higher than the nonlinear model
in the KDICP data, but lower than the nonlinear model in the KDHS data (rows B2 and B3).
Moreover, the direct effect with and without social interaction for the KDICP data differ relatively
little depending on whether village averages or network averages are used to measure social
interaction, although the bias caused by ignoring social interactions in the direct program effect is
lower when individual-level measures of social interaction are used.
Total program effects with social interactions: The total program effects with social
interactions in the nonlinear model have a marginal effect on the probability of having ever used
family planning in the range of 0.14 to 0.20 (row A4). These estimates imply that social interactions
amplify the direct program effects on the propensity to ever use family planning considerably,
ranging from 21 to 75% (row A7). The estimates for the total program effort in the KDICP data
differ relatively little between the two measures of social interaction, while the social network-based
estimates yield the lower social multiplier. Similar to our estimates of direct program effects, the
linear model estimates of the total program effect are less than the nonlinear model estimates for the
KDHS data (by -4.2 to -16.1%), but tend to be greater for the KDICP (with a range from 0.7 to
33.7%, row B4).
In the linear model, the total program effect does not depend on individual characteristics. In
the nonlinear model, however, subpopulations with different levels of contraceptive use can be
subject to different multiplier effects and also total effects. Since the education level is a significant
determinant of having used family planning, we provide in Panel C of Table 2 the total effect
separately for women with low and high education. The results clearly demonstrate that both the total
effect and the social multiplier are higher–sometimes substantially so-- for the high education
subpopulation with a higher overall propensity of ever using family planning.
Effect of increasing the impact of social interactions: Table 2 present two effects of
intensifying social interaction that measure the change in the total program effect (row A5) and in
the social multiplier effect (row A8) that are caused by increasing the ‘strength’—or parameter a or
α— of social interaction (see note 5 for the respective formal derivations). The estimates for the
nonlinear model indicate that the effects of intensifying social interaction on the total effect are
negative, while the effect of ‘more’ social interaction on the social multiplier effect is positive.
http://www.demographic-research.org/Volumes/Vol3/7/ 20 September 2000
Intensified social interaction therefore reduces the total effect that results from program efforts, but
since it also reduces the direct effect, the social multiplier defined as the ratio of total to direct effect
slightly increases. While the results therefore do not classify social interaction as status-quo
enforcing (which is defined as a negative effect of intensifying social interaction on the social
multiplier), ‘more’ social interaction would still be undesirable from a program standpoint because
the total effects resulting from program efforts would decrease as a consequence of this intensified
social interaction. Thus, any assumption that increasing the impact of social interactions must
accelerate diffusion make it easier for family planning programs to achieve changes in the prevalence
of contraceptive use is not supported by our preferred nonlinear estimates. The linear estimates, as
noted, imply a positive effect of increasing social interaction on both the social multiplier and the
total program effect, and the linear estimates thus suggest the opposite effect of intensifying
interaction on the total effect as compared to the nonlinear estimates (so the signs are negative in row
B5).
http://www.demographic-research.org/Volumes/Vol3/7/ 20 September 2000
5. Conclusions
This paper is motivated by the increasing attention that has been given by demographic analysts and
family planning program supporters to the possible roles of social interactions in the diffusion of
knowledge, attitudes and behaviors related to family planning. The few previous empirical studies
of this topic suggest that if social interactions are important, their omission from empirical models
is likely to result in distorted estimates of the direct effects of family planning programs. Our
analysis adds to this literature by showing that there are some important implications of using
nonlinear models for measuring program effects and for evaluating the roles of social interaction that
have not been explicitly considered in the previous empirical literature. We demonstrate some of
these properties formally, and investigate them empirically using data that includes measures of
social interactions. We find that for Nyanza, Kenya, the nonlinear versus the linear specifications
indeed lead to different substantive results with different implications for demographic analysts and
program supporters.
First, we distinguish between the direct effects of a family planning program on an
individual’s probability of using family planning and the indirect effects due to social interaction.
Our empirical estimates show that the nonlinear model of the relations among program effects, social
interaction and of modern family planning leads to some fairly large differences in the estimates of
program effects from those obtained with the linear model – e.g., with estimated direct program
effects on the ever use of family planning from 20% lower to 27% higher for the linear than the
nonlinear model. We then show empirically that in our data as much as 43% of total program effects
are due to social interaction [Note 9]. This social multiplier effect, as it has been named by
Montgomery and Casterline [1993], is due to a feedback loop that occurs because social interaction
renders the family decisions of community members interdependent. Because of this social
multiplier effect, attributing all of the total change in contraceptive behavior to a direct impact of
changes in program effort is a substantial overestimate of the direct program effect.
In addition, the linear specification assumes that the total program effect and the social
multiplier are identical across subpopulations with different levels of contraceptive use. This need
not be the case in the nonlinear model, and our results show important differences in these effects
between the women with low and high education: social interaction leads to substantially larger
multiplier effects in the high education subpopulation with a higher overall propensity of using
family planning.
Second, we show formally that if the model is nonlinear, there may be both a low-level
Malthusian equilibrium in which contraceptive use remains relatively low despite ongoing program
efforts as well as an equilibrium where contraceptive use is high [Note 10]. If a population is at a
low-contraceptive-use and high-fertility equilibrium – a situation that may characterize much of sub-
Saharan Africa, including places with family planning programs – small program changes have

http://www.demographic-research.org/Volumes/Vol3/7/ 20 September 2000
relatively small effects. However, large increases in program efforts – even if transitory – may cause
a shift to a high-contraceptive-use and low-fertility equilibrium. In a linear model, in contrast, large
program efforts can lead to high contraceptive use, but the program efforts must be maintained at
high levels to sustain high contraceptive use. Our empirical analysis does not indicate the presence
of multiple equilibria in our data. Thus, these estimates suggest that there is little likelihood that a
sharp transitory increase in program activities in Nyanza would lead to a rapid shift to much higher
sustained levels of contraceptive use. But such possibilities may exist in other contexts.
Third, we show formally that intensified social interactions may either increase or decrease the
total effect and social multiplier effect resulting from family planning program efforts, and ‘more’
social interaction can thus reinforce or retard the diffusion of an innovation. When a nonlinear
(logistic) model is used, increasing the impact of social interactions is status quo reinforcing close
to a stable equilibria (whether at low or high contraceptive use) in a multiple-equilibria situation.
Therefore, if a new program effort were to intensify social interactions near the stable equilibria, the
total—or long-term—change in contraceptive use resulting from the program effort is reduced and
these more intensive social interactions would retard the diffusion of family planning after the
program interventions. Our nonlinear empirical estimates for S. Nyanza District imply that when
social interactions are intensified, they reduce the total effect associated with program interventions,
but slightly increase the social multiplier effect. These findings are in contrast to the linear estimates
that imply that more intense social interaction leads to a larger social multiplier effect and an
increased total effect after the program interventions.
Thus, we show formally that there are some important implications of nonlinear models of
social interactions that have not been emphasized in the previous literature and how they contrast
with the implications of linear models, and we show empirically that in the Nyanza case there are
some substantial differences in estimating program effects required for a sustainable fertility
transition between the nonlinear and the linear specifications The value of having the right model
may be considerable and the implications of nonlinear models in this context need to be understood
to interpret fully their results.

http://www.demographic-research.org/Volumes/Vol3/7/ 20 September 2000
Acknowledgment
The authors thank an anonymous referee for very useful comments on a previous draft. This research
was supported in part by NIH RO1 HD37276-01 and by TransCoop Program of the German-
American Academic Council. The data used in this paper were collected with funding from USAID’s
Evaluation Project (Watkins and Naomi Rutenberg Co-PI’s) and The Rockefeller Foundation (for
a larger project including Malawi with Watkins and Eliya Zulu Co-PI’s).
http://www.demographic-research.org/Volumes/Vol3/7/ 20 September 2000
Appendix: Calculation of direct and total effect in heterogeneous populations
The calculations of the direct and total effect reported in Table 2 assume that a woman interacts with
a population having a distribution of characteristics as do the remaining women in the sample and
that the program effort in the population equals the average program effort in the sample. Based on
this assumption we first calculate the equilibrium level, and the individual-level direct and total
effects for each woman in the sample. We then average over these individual-level effects and obtain
the (overall) direct and total effects that are reported in Table 2. In this appendix we provide the
specific equations that are used for these calculations.
Denote as zi the individual characteristic of women i = 1, ..., N in the sample, where N is the
sample size. Moreover, denote x as the average program effort in the sample, i.e., the proportion
of women in the sample who have heard a family planning message on the radio. Denote as xi the
specific program effect for women i, which in our estimations equals the proportion of family
planning user’s in woman i’s village of residence.
Linear model: The parameters ˆ ,α β̂ and δ̂ re the coefficients from estimating relation {1}
via a linear regression of woman i’s contraceptive use on the proportion of contraceptive users in
woman i’s village/reference group, the program effort xi in the woman’s village of residence, and
the individual characteristics zi (i.e., the regression subsumes term -.5α in {1} into the constant
term). The equilibrium level ye is then calculated as ˆ ˆˆ ˆ/(1 ) /(1 )e iy x zβ α δ α= − ⋅ + − . The direct and
total effect of changes in program effort is given respectively by β̂ and ˆ ˆ/(1 )β α− and in the linear
model neither effect depends on the level or distribution of the individual characteristics zi in the
data.
Nonlinear model: The parameter ˆ,a b̂ and d̂ are the coefficients from the estimation of
relation {2} via a logistic regression of woman i’s contraceptive use on the proportion of
contraceptive users in woman i’s village/reference group, the program effort xi in the woman’s
village of residence, and the individual characteristics zi (i.e., the logistic regression again subsumes
the term -.5α in {2} into the constant term). The equilibrium level is then calculated iteratively and
solves 1
1ˆ ˆˆ( )
N
e e iiy N F ay bx dz−
== + +∑ , that is, the equilibrium level equals the average probability
that women in the sample use family planning, given that they interact with a reference group with
a prevalence of ye. This definition of the equilibrium level is analogous to the definition of the
equilibrium level in homogeneous populations after equation {2} above. The direct effect in Table
2 is then obtained as the average of the individual direct effectsˆ ˆ ˆ ˆ ˆˆ ˆ( )(1 ( ))e i e ibF ay bx dz F ay bx dz+ + − + + , and the total effect is calculated as the average of the
individual-level total effects ( ) 11ˆ ˆ ˆ ˆ ˆˆ ˆ ˆ[ ( )(1 ( ))]e i e ib F ay bx dz F ay bx dz a
−−⋅ + + − + + − .
http://www.demographic-research.org/Volumes/Vol3/7/ 20 September 2000
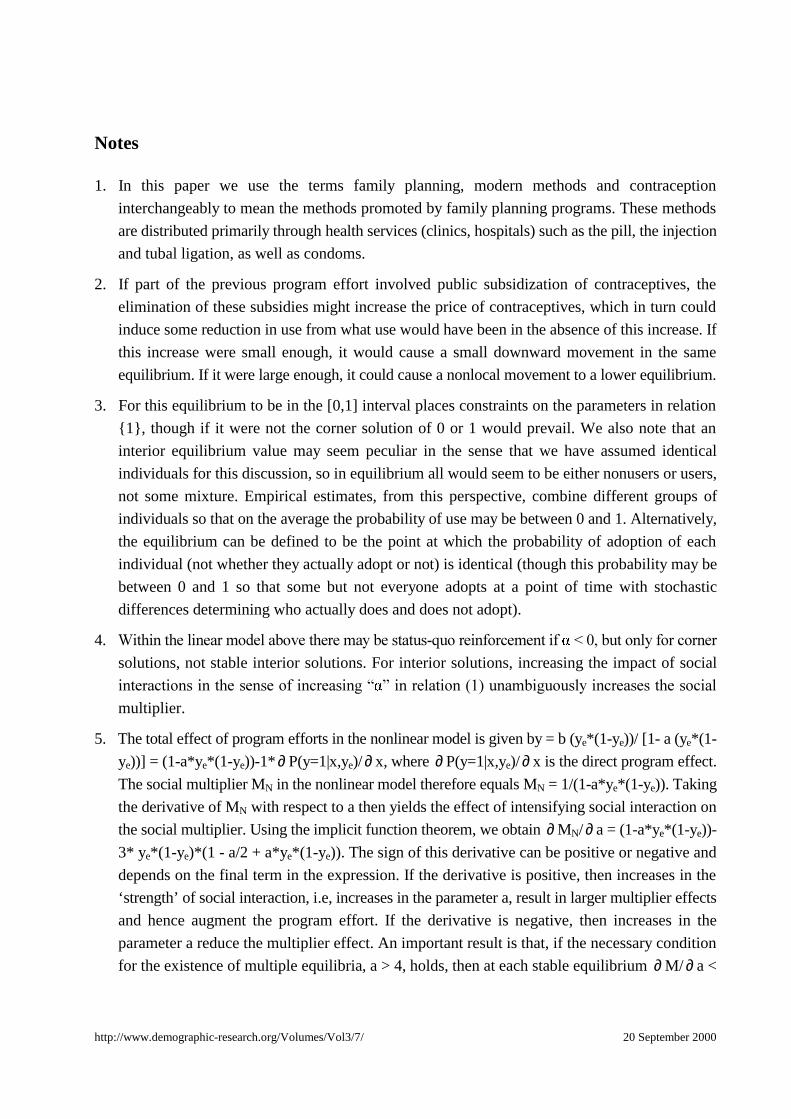
Notes
1. In this paper we use the terms family planning, modern methods and contraception
interchangeably to mean the methods promoted by family planning programs. These methods
are distributed primarily through health services (clinics, hospitals) such as the pill, the injection
and tubal ligation, as well as condoms.
2. If part of the previous program effort involved public subsidization of contraceptives, the
elimination of these subsidies might increase the price of contraceptives, which in turn could
induce some reduction in use from what use would have been in the absence of this increase. If
this increase were small enough, it would cause a small downward movement in the same
equilibrium. If it were large enough, it could cause a nonlocal movement to a lower equilibrium.
3. For this equilibrium to be in the [0,1] interval places constraints on the parameters in relation
{1}, though if it were not the corner solution of 0 or 1 would prevail. We also note that an
interior equilibrium value may seem peculiar in the sense that we have assumed identical
individuals for this discussion, so in equilibrium all would seem to be either nonusers or users,
not some mixture. Empirical estimates, from this perspective, combine different groups of
individuals so that on the average the probability of use may be between 0 and 1. Alternatively,
the equilibrium can be defined to be the point at which the probability of adoption of each
individual (not whether they actually adopt or not) is identical (though this probability may be
between 0 and 1 so that some but not everyone adopts at a point of time with stochastic
differences determining who actually does and does not adopt).
4. :LWKLQ�WKH�OLQHDU�PRGHO�DERYH�WKHUH�PD\�EH�VWDWXV�TXR�UHLQIRUFHPHQW�LI� ������EXW�RQO\�IRU�FRUQHUsolutions, not stable interior solutions. For interior solutions, increasing the impact of social
LQWHUDFWLRQV�LQ�WKH�VHQVH�RI�LQFUHDVLQJ�³ ´�LQ�UHODWLRQ�����XQDPELJXRXVO\�LQFUHDVHV�WKH�VRFLDOmultiplier.
5. The total effect of program efforts in the nonlinear model is given by = b (ye*(1-ye))/ [1- a (ye*(1-
ye))] = (1-a*ye*(1-ye))-1* ∂ P(y=1|x,ye)/ ∂ x, where ∂ P(y=1|x,ye)/ ∂ x is the direct program effect.
The social multiplier MN in the nonlinear model therefore equals MN = 1/(1-a*ye*(1-ye)). Taking
the derivative of MN with respect to a then yields the effect of intensifying social interaction on
the social multiplier. Using the implicit function theorem, we obtain ∂ MN/ ∂ a = (1-a*ye*(1-ye))-
3* ye*(1-ye)*(1 - a/2 + a*ye*(1-ye)). The sign of this derivative can be positive or negative and
depends on the final term in the expression. If the derivative is positive, then increases in the
‘strength’ of social interaction, i.e, increases in the parameter a, result in larger multiplier effects
and hence augment the program effort. If the derivative is negative, then increases in the
parameter a reduce the multiplier effect. An important result is that, if the necessary condition
for the existence of multiple equilibria, a > 4, holds, then at each stable equilibrium ∂ M/ ∂ a <

http://www.demographic-research.org/Volumes/Vol3/7/ 20 September 2000
0. In all situations with multiple equilibria, therefore, intensifying social interaction reduces the
social multiplier effect and ‘more’ social interaction is therefore not desirable from the
standpoint of program effectiveness because they retard rather then reinforce the changes
introduced by programs. The effect of intensifying social interaction on the total program effect
can be analyzed similarly by taking the derivative ∂ 2(ye)/∂ x ∂ a, and the sign of this derivative
is also ambiguous. Similar to the effect of intensified social interaction on the multiplier effect,
the total effect also decreases with ‘more’ social interaction at each stable equilibrium in a
multiple-equilibria situation.
6. The transitions between the equilibria in our theoretical model are reversible, i.e., there can be
a transition from the low to high contraceptive use equilibrium and also vice versa. The
proportion of women who have ever used contraception in a population, however, cannot
decline. Since S. Nyanza District is still at early stages in the fertility decline and has never
experienced a high level of contraceptive use, only the former transition is empirically relevant.
This transition from low to high contraceptive use can be measured with both dependent
variables "ever used contraception" and "currently using contraception". We believe that the
former provides a better measure for the adoption of modern family planning and we
subsequently use it in our empirical analyses. The reverse transition from high to low levels of
contraceptive use, which cannot be measured with a dependent variable like "ever use", is not
empirically relevant in the present context.
7. Note that this variable is not confounded by the well-known problem of selective recall (i.e. that
the respondent who is more disposed to using contraception is more likely than average in her
community to recall hearing a family planning message on the radio) because the variable is
constructed so that the respondent’s response is not included in the measure used for that
respondent.
8. That is, in none of the estimated models that underlie Table 2 do the estimates for the parameter
a exceeded the critical level a > 4 which is necessary in order to have multiple equilibria [Table
A1].
9. That is, if the social multiplier is 175%, the proportion of the total effect due to social interaction
is 75/175.
10. Related models of multiple equilibria and path dependency in the context of fertility decline are
found in [e.g. Becker, Murphy and Tamura 1990, Galor and Weil 1996, Kohler 1997, Kohler
2000b].

http://www.demographic-research.org/Volumes/Vol3/7/ 20 September 2000
References
Arends-Kuenning, M. “How Do Family Planning Worker Visits Affect Women’s Behavior in
Bangladesh?” 1997, New York: Population Council, mimeo.
Ayiemba, E. H. O. “Demographic Patterns”. In: Gideon S. Were, Ben E.. Kipkorir, Elias O. editors.
South Nyanza District Socio-Cultural Profile. 1986, Nairobi. The Ministry of Planning and
National Development and The Institute of African Studies, University of Nairobi, pp.112-30
Bawah, Ayaga Agula, Patricia A., Ruth S., Phillips, J. F. “Women’s Fears and Men’s Anxieties: The
Impact of Family Planning on Gender Relations in Northern Ghana.”. Studies in Family
Planning , 1999, 30(1):54-66.
Becker, Gary S., Murphy Kevin M., Tamura, R. “Human Capital, Fertility, and Economic Growth”.
Journal of Political Economy, 1990, 98(5) (part 2): 12-37.
Biddlecom, Ann E., Fapohunda, B. M. “Covert Contraceptive Use: Prevalence, Motivations, and
Consequences.” Paper presented at the annual meeting of the Population Association of
America,1998, April 2-4, Chicago, IL.
Bongaarts, John and Watkins, Susan C. “Social Interactions and Contemporary Fertility Transitions.”
Population and Development Review, 1996, 22(4):639-682.
Blount, Ben G. “The Luo of South Nyanza, Western Kenya.” In: Molnos Angela Ed. Cultural Source
Materials for Population Planning in East Africa. Vol 2,"Innovations and Communication".
1972. Nairobi: East Africa Publishing House : 275-80
Brock, William A., Durlauf, S. N. Discrete Choice with Social Interactions, Part I: Theory. National
Bureau of Economic Research Working Paper #5291, 1995.
Crook, Nigel R. “On Social Norms and Fertility Decline.” Journal of Development Studies, 1978,
14(4):198-210.
DeClerque, J., Tsui, Amy Ong, Abul-Ata, M. F., Barcelona, D. “Rumor, Misinformation and Oral
Contraceptive Use in Egypt.” Social Science Medicine, 1986, 23(1):83-92
Entwisle, B., Godley, J. “Village Networks and Patterns of Contraceptive Choice,” Paper presented
at a meeting of the Population Committee of the National Academy of Sciences, 1998, January
29-30,. Washington, D.C. Forthcoming in the conference volume.
Forthingham, Nathaniel. Report to the Pathfinder Fund on Population Concerns and Family Planning
in Africa South of the Sahara. 1968 January.
Galor, O., Weil, D. N. “The Gender Gap, Fertility and Growth”. American Economic Review, 1996,
86(3) : 374-387.
Granovetter, Mark S. “The Strength of Weak Ties.” American Journal of Sociology, 1973,
73(6):1361-1380.
Katz, E., Lazarsfeld, P. F. Personal Influence: The Part Played by People in the Flow of Mass
Communication. 1955.Glencoe, Il.:Free Press

http://www.demographic-research.org/Volumes/Vol3/7/ 20 September 2000
KDHS: Kenya National Council for Population and Development, Kenya Central Bureau of
Statistics, and Macro International Inc., 1994, Kenya Demographic and Health Survey 1993.
Nairobi, Kenya and Calverton, Maryland
Kenya: Central Bureau of Statistics, Ministry of Economic Planning and Development.. Kenya
Fertility Survey 1977-78, First Report, Vol. 2. 1980. Nairobi, Kenya: World Fertility Survey
Programme
Kohler, Hans-Peter. “Learning in Social Networks and Contraceptive Choice”. Demography, 1997
34(3): 369-383.
Kohler, Hans-Peter. “Social Interaction and Fluctuations in Birth Rates”. Population Studies, 2000a,
forthcoming
Kohler, Hans-Peter. “Fertility Decline as a Coordination Problem”. Journal of Development
Economics, 2000b, forthcoming.
Kohler, H.-P., Behrman, Jere R., Watkins, Susan C. “The Density of Social Networks and Fertility
Decisions: Evidence from S. Nyanza District, Kenya.” Demography ,2001,forthcoming.
Manski, Charles F. “Identification of Endogenous Effects: The Reflection Problem.”. Review of
Economic Studies, 1993, 60: 531-542.
Marsden, P., Friedkin, N. “Network Studies of Social Influence”. Sociological Methods and
Research, 1993, 22.
McFadden, Daniel L. “Econometric Models of Probabilistic Choice.” In: Manski, Charles F.,
McFadden, Daniel L. Structural Analysis of Discrete Data with Econometric Application.
1981. Cambridge: MIT Press.
Montgomery, Mark R., Casterline, John B. “Social Influence, Social Learning and New Models
of Fertility.” Population and Development Review, 1996, 22:151
Montgomery, Mark R., Casterline, John B.. “The Diffusion of Fertility Control in Taiwan: Evidence
from Pooled Cross-Section, Time-Series Models.” Population Studies, 1993, 47(3): 457-479.
Montgomery, Mark R. and Casterline, John B.. Social networks and the diffusion of fertility control.
Population Council, Policy Research Division, Working Papers, 1998 No.119 .
Montgomery, Mark R., Chung, Woojin. “Social Networks and the Diffusion of Fertility Control: The
Korean Case ”. In: Leete, R. ed., Values and Fertility Change. 1994, Oxford: Oxford
University Press.
Montgomery, Mark R., Zhao, J. Social Learning and Networks in the Diffusion of Fertility Control.
Paper presented at the Annual Meeting of the Population Association of America, 1998. April
2-4, Chicago, Il.
Munshi, K., Myaux, J. “Social Effects in the Demographic Transition: Evidence from Matlab,
Bangladesh”. 1997, Boston: Boston University, mimeo.
Ndisi, John W. A Study in the Economic and Social Life of the Luo of Kenya. 1974, Lund, Sweden:
Berlingska Boktryckeriet.

http://www.demographic-research.org/Volumes/Vol3/7/ 20 September 2000
Ocholla Ayayo, A. B. C. Traditional Ideology and Ethics Among the Southern Luo. 1976, Uppsala:
Scandinavian Institute of African Studies.
Olenja, Joyce M. “Women and Health Care in Siaya District”. In: Collette A. S. a. J. M. O. Gideon
S. Were, editors. Women and Development in Kenya: Siaya District. 1991, Nairobi: Institute
of African Studies: 44-69.
Pictet, G., Ouedraogo, C. “Let’s Talk About It: Married Couples and Fertility Decisions in Rural
Burkina Faso”. Paper presented at the annual meeting of the Population Association of
America, New York, 1999, March 25-27.
Reynar, A. “He Says, She Says, Who Gets Their Way? Marital Dynamics and Fertility in Kenya.”
Paper presented at the annual meeting of the Population Association of America, 1998, April
1-3, Chicago, IL.
Reynar, A. G. Fertility Decision Making by Couples Amongst the Luo of Kenya. PhD Dissertation,
Graduate Group in Demogaphy, University of Pennsylvania.2000
Robinson, Warren C. “Kenya Enters the Fertility Transition.” Population Studies, 1992, 46: 445-457
Rutenberg, N., Watkins, S.C. “The Buzz Outside the Clinics: Conversations and Contraception in
Nyanza Province, Kenya.” Studies in Family Planning, 1997, 28(4): 290-307.
Rogers, Everett M. Diffusion of Innovations. 1995, New York: Free Press.
Watkins, S. C. “Local and Foreign Models of Reproduction in Nyanza Province, Kenya.” Population
and Development Review, 26(4), forthcoming.
Watkins, Susan C., Rutenberg, N., Green, S. “Diffusion and Debate: Reproductive Change in
Nyanza Province, Kenya”. 1995, Philadelphia, PA: University of Pennsylvania, mimeo.
Watkins, Susan C., Rutenberg, N., Wilkinson, D. “Orderly Theories, Disorderly Women”. In:. Jones,
G. W., Douglas, R. M., Caldwell, J.C., D’Souza, R. M. The Continuing Demographic
Transition. 1997, Oxford, Clarendon Press, pp. 213-245.
Watkins, Susan C., Warriner, I. “Causal Inferences from Observational Data: Questioning
Assumptions of Selectivity”. 1999, Philadelphia, PA: University of Pennsylvania, mimeo.
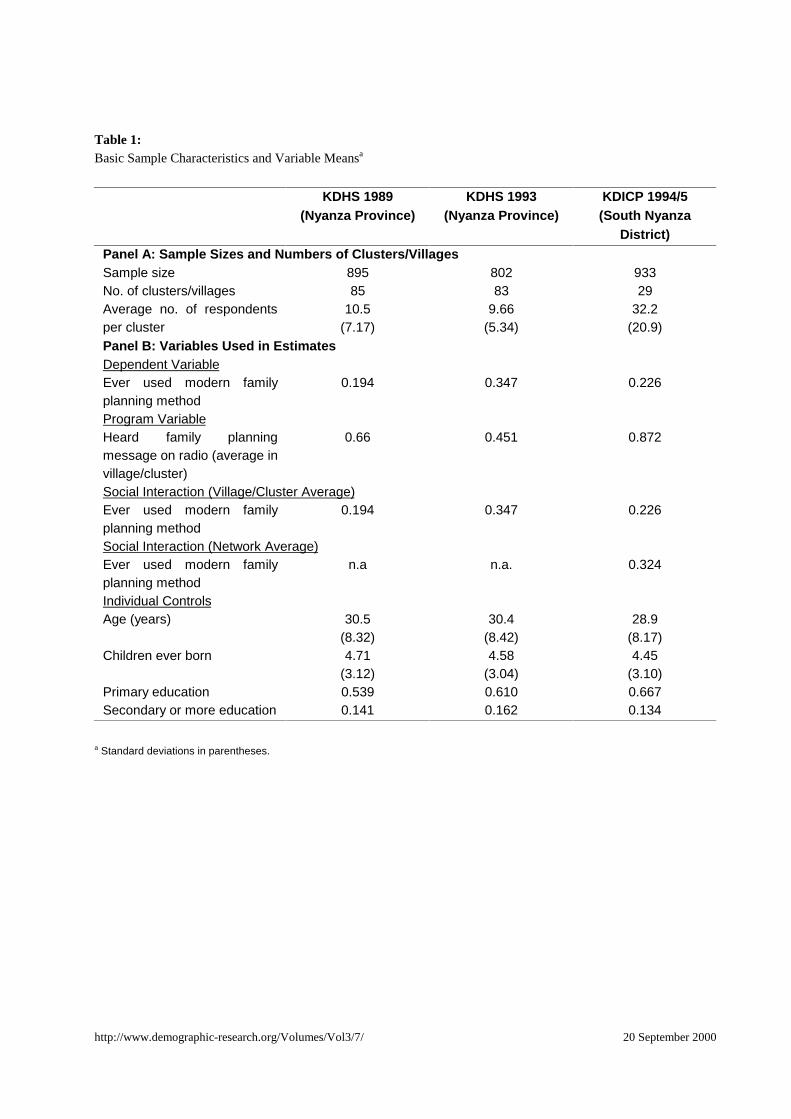
http://www.demographic-research.org/Volumes/Vol3/7/ 20 September 2000
Table 1:Basic Sample Characteristics and Variable Meansa
KDHS 1989(Nyanza Province)
KDHS 1993(Nyanza Province)
KDICP 1994/5(South Nyanza
District)Panel A: Sample Sizes and Numbers of Clusters/VillagesSample size 895 802 933No. of clusters/villages 85 83 29Average no. of respondentsper cluster
10.5(7.17)
9.66(5.34)
32.2(20.9)
Panel B: Variables Used in EstimatesDependent VariableEver used modern familyplanning method
0.194 0.347 0.226
Program VariableHeard family planningmessage on radio (average invillage/cluster)
0.66 0.451 0.872
Social Interaction (Village/Cluster Average)Ever used modern familyplanning method
0.194 0.347 0.226
Social Interaction (Network Average)Ever used modern familyplanning method
n.a n.a. 0.324
Individual ControlsAge (years) 30.5
(8.32)30.4
(8.42)28.9
(8.17)Children ever born 4.71
(3.12)4.58
(3.04)4.45
(3.10)Primary education 0.539 0.610 0.667Secondary or more education 0.141 0.162 0.134
a Standard deviations in parentheses.
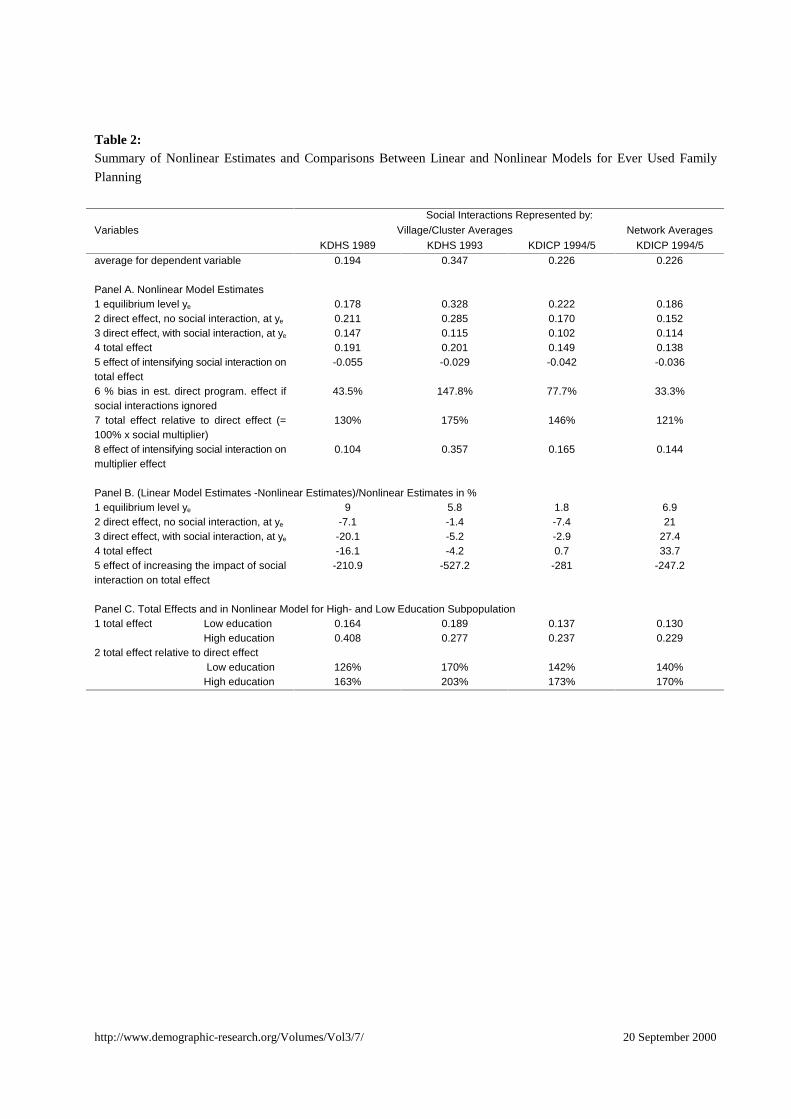
http://www.demographic-research.org/Volumes/Vol3/7/ 20 September 2000
Table 2:Summary of Nonlinear Estimates and Comparisons Between Linear and Nonlinear Models for Ever Used Family
Planning
Social Interactions Represented by:Village/Cluster Averages Network AveragesVariables
KDHS 1989 KDHS 1993 KDICP 1994/5 KDICP 1994/5average for dependent variable 0.194 0.347 0.226 0.226
Panel A. Nonlinear Model Estimates1 equilibrium level ye 0.178 0.328 0.222 0.1862 direct effect, no social interaction, at ye 0.211 0.285 0.170 0.1523 direct effect, with social interaction, at ye 0.147 0.115 0.102 0.1144 total effect 0.191 0.201 0.149 0.1385 effect of intensifying social interaction ontotal effect
-0.055 -0.029 -0.042 -0.036
6 % bias in est. direct program. effect ifsocial interactions ignored
43.5% 147.8% 77.7% 33.3%
7 total effect relative to direct effect (=100% x social multiplier)
130% 175% 146% 121%
8 effect of intensifying social interaction onmultiplier effect
0.104 0.357 0.165 0.144
Panel B. (Linear Model Estimates -Nonlinear Estimates)/Nonlinear Estimates in %1 equilibrium level ye 9 5.8 1.8 6.92 direct effect, no social interaction, at ye -7.1 -1.4 -7.4 213 direct effect, with social interaction, at ye -20.1 -5.2 -2.9 27.44 total effect -16.1 -4.2 0.7 33.75 effect of increasing the impact of socialinteraction on total effect
-210.9 -527.2 -281 -247.2
Panel C. Total Effects and in Nonlinear Model for High- and Low Education Subpopulation1 total effect Low education High education
0.1640.408
0.1890.277
0.1370.237
0.1300.229
2 total effect relative to direct effect Low education High education
126%163%
170%203%
142%173%
140%170%
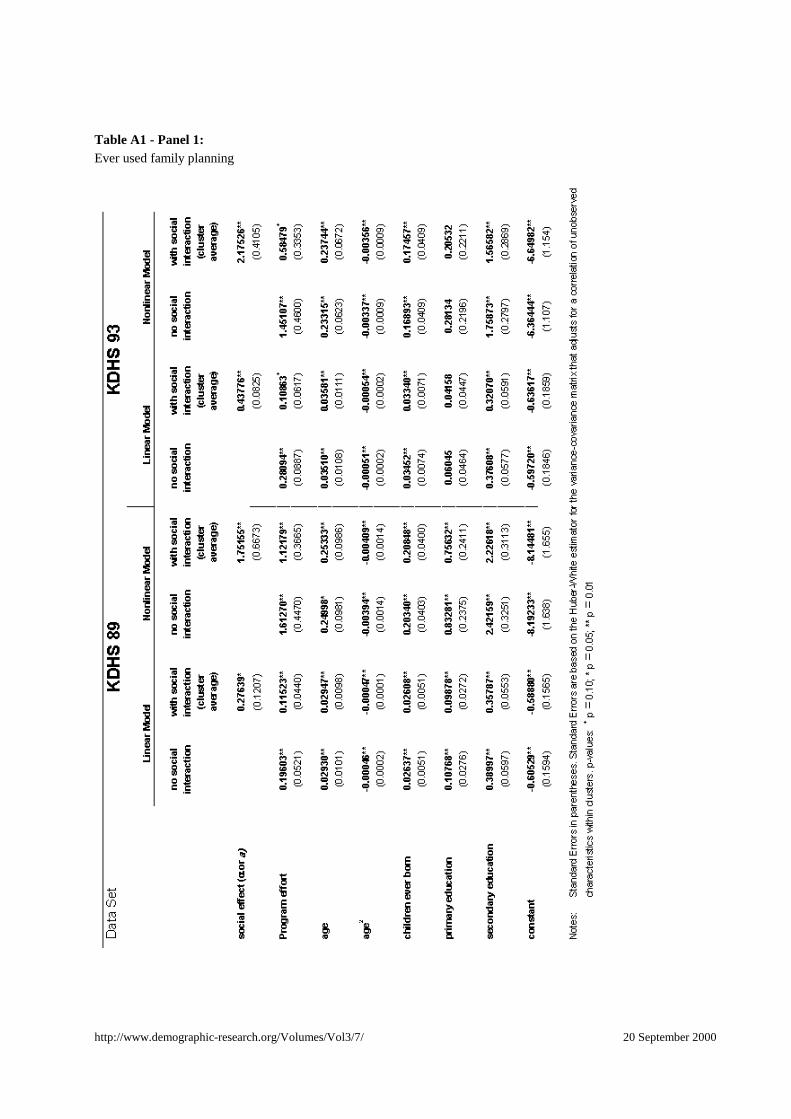
http://www.demographic-research.org/Volumes/Vol3/7/ 20 September 2000
Table A1 - Panel 1:Ever used family planning
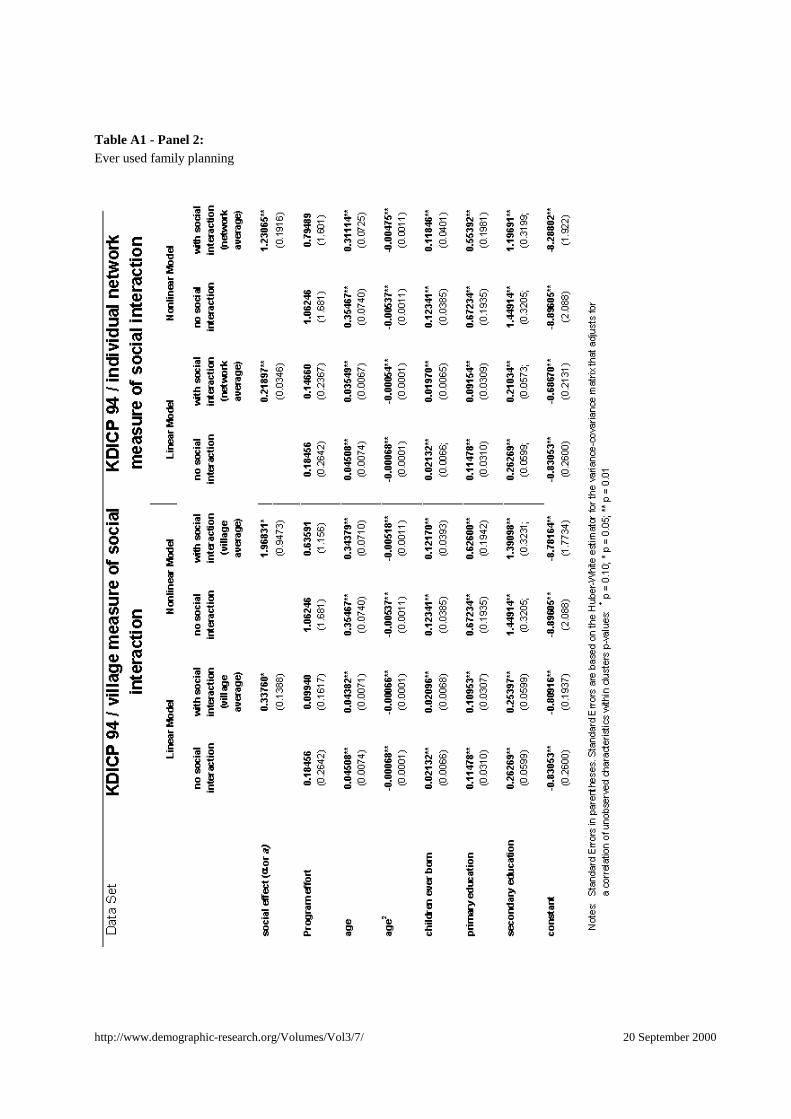
http://www.demographic-research.org/Volumes/Vol3/7/ 20 September 2000
Table A1 - Panel 2:Ever used family planning
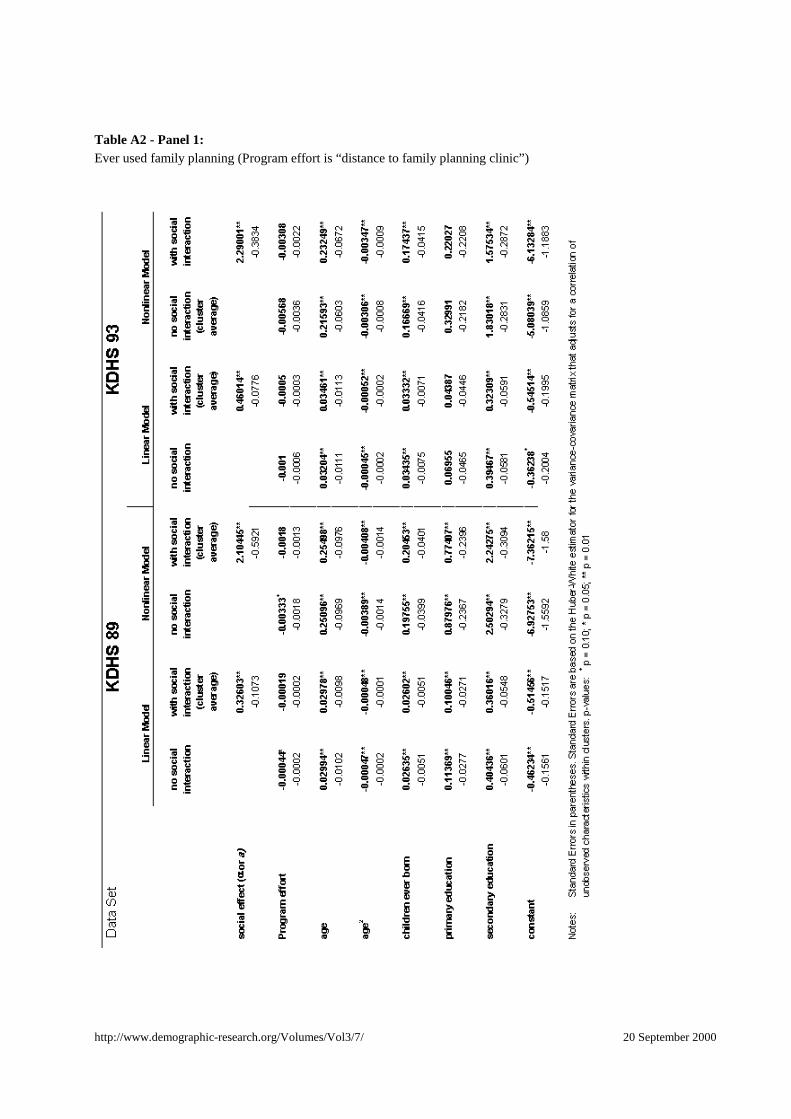
http://www.demographic-research.org/Volumes/Vol3/7/ 20 September 2000
Table A2 - Panel 1:Ever used family planning (Program effort is “distance to family planning clinic”)
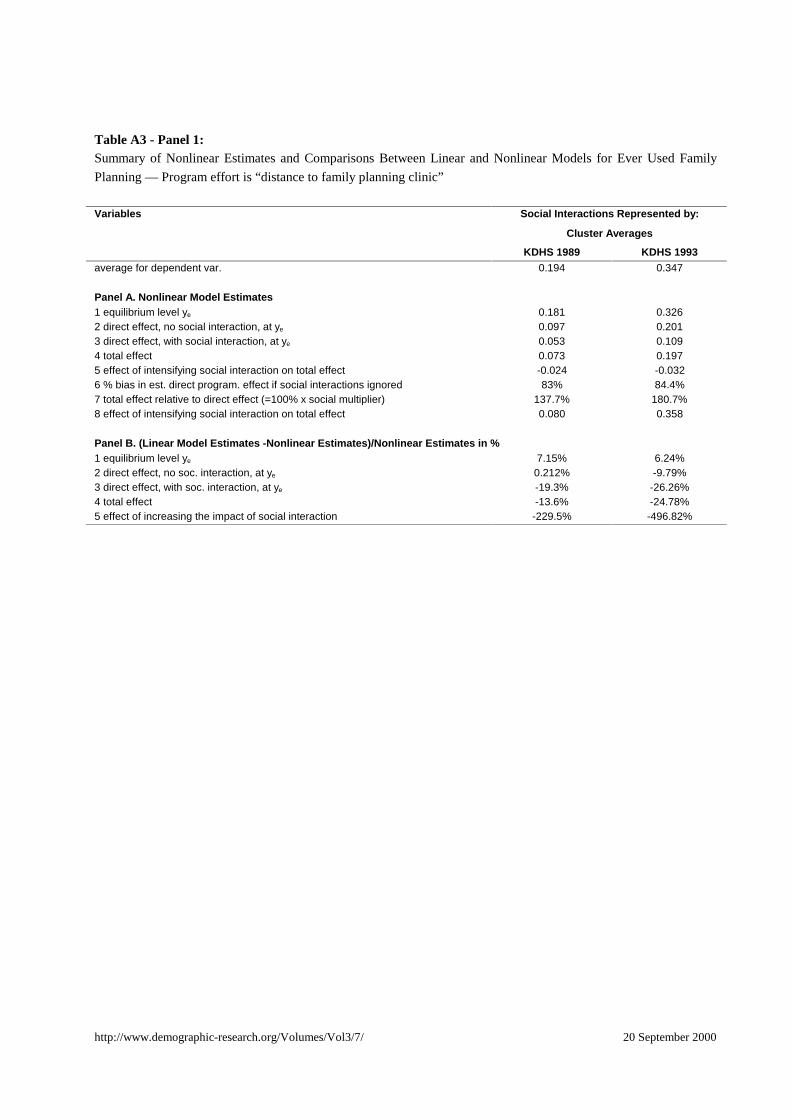
http://www.demographic-research.org/Volumes/Vol3/7/ 20 September 2000
Table A3 - Panel 1:Summary of Nonlinear Estimates and Comparisons Between Linear and Nonlinear Models for Ever Used Family
Planning — Program effort is “distance to family planning clinic”
Social Interactions Represented by:
Cluster Averages
Variables
KDHS 1989 KDHS 1993average for dependent var. 0.194 0.347
Panel A. Nonlinear Model Estimates1 equilibrium level ye 0.181 0.3262 direct effect, no social interaction, at ye 0.097 0.2013 direct effect, with social interaction, at ye 0.053 0.1094 total effect 0.073 0.1975 effect of intensifying social interaction on total effect -0.024 -0.0326 % bias in est. direct program. effect if social interactions ignored 83% 84.4%7 total effect relative to direct effect (=100% x social multiplier) 137.7% 180.7%8 effect of intensifying social interaction on total effect 0.080 0.358
Panel B. (Linear Model Estimates -Nonlinear Estimates)/Nonlinear Estimates in %1 equilibrium level ye 7.15% 6.24%2 direct effect, no soc. interaction, at ye 0.212% -9.79%3 direct effect, with soc. interaction, at ye -19.3% -26.26%4 total effect -13.6% -24.78%5 effect of increasing the impact of social interaction -229.5% -496.82%
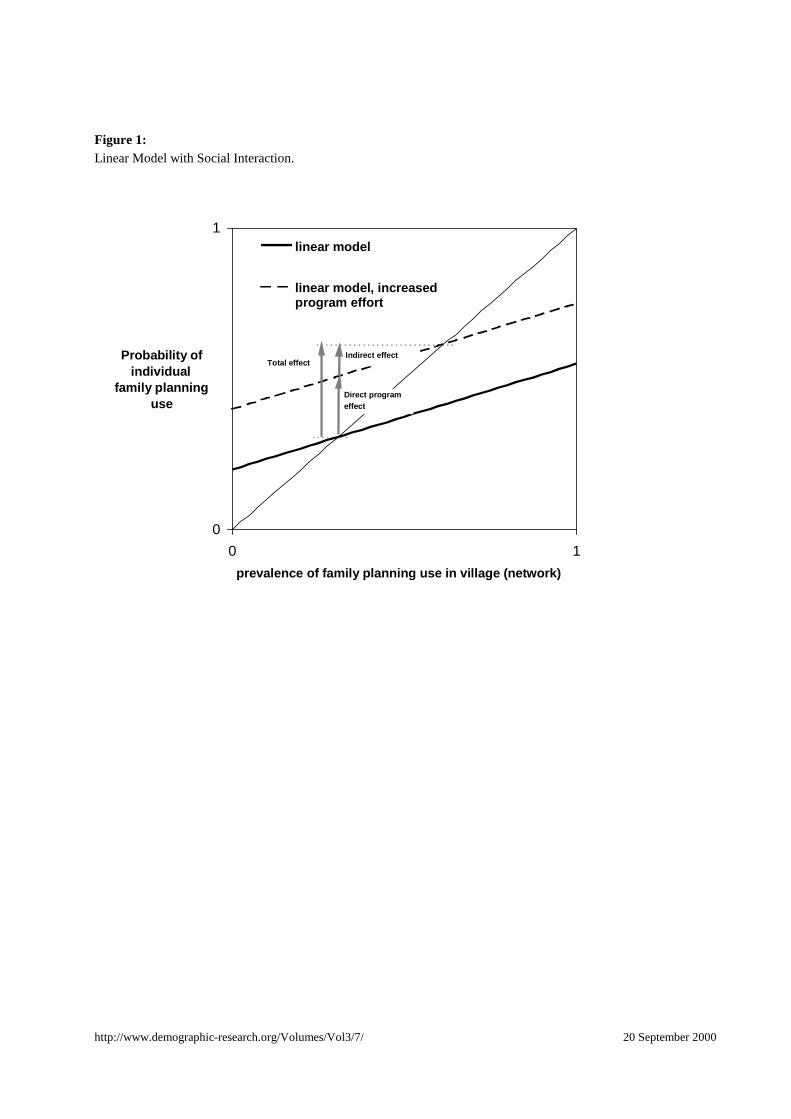
http://www.demographic-research.org/Volumes/Vol3/7/ 20 September 2000
Figure 1:Linear Model with Social Interaction.
0
1
0 1
prevalence of family planning use in village (network)
Probability ofindividual
family planning use
linear model
linear model, increasedprogram effort
Indirect effect
Direct programeffect
Total effect
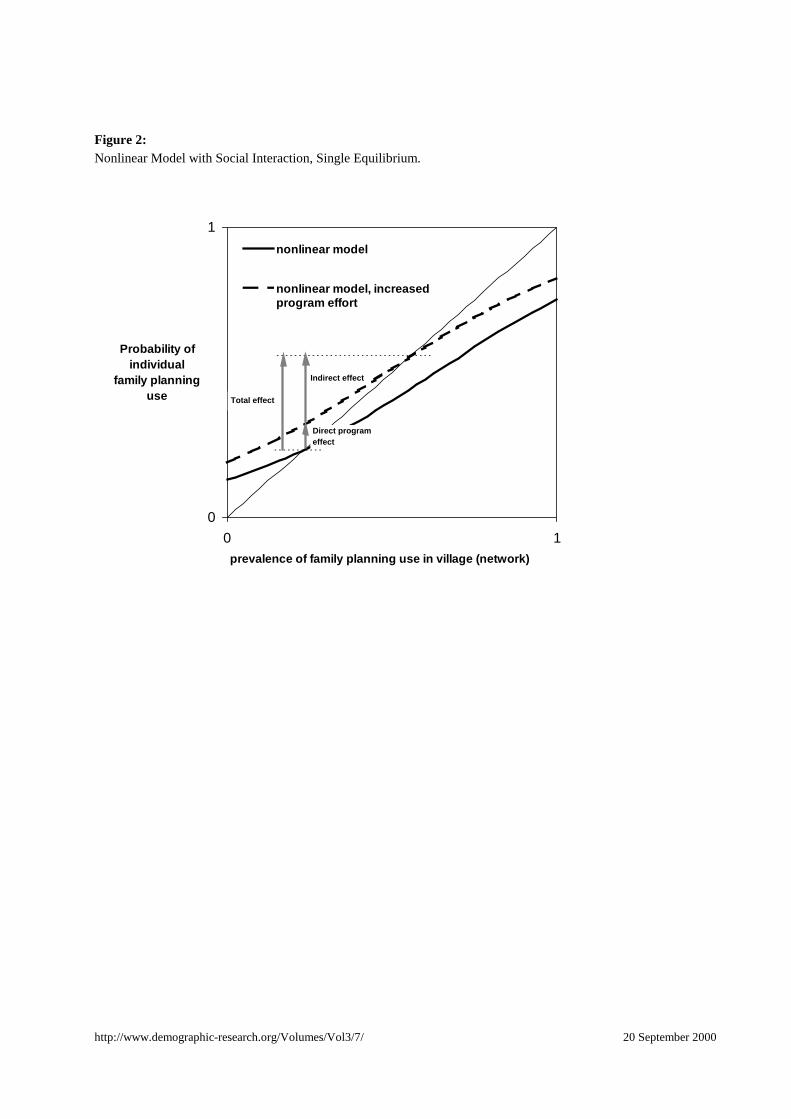
http://www.demographic-research.org/Volumes/Vol3/7/ 20 September 2000
Figure 2:Nonlinear Model with Social Interaction, Single Equilibrium.
0
1
0 1prevalence of family planning use in village (network)
Probability ofindividual
family planninguse
nonlinear model
nonlinear model, increasedprogram effort
Indirect effect
Direct program effect
Total effect
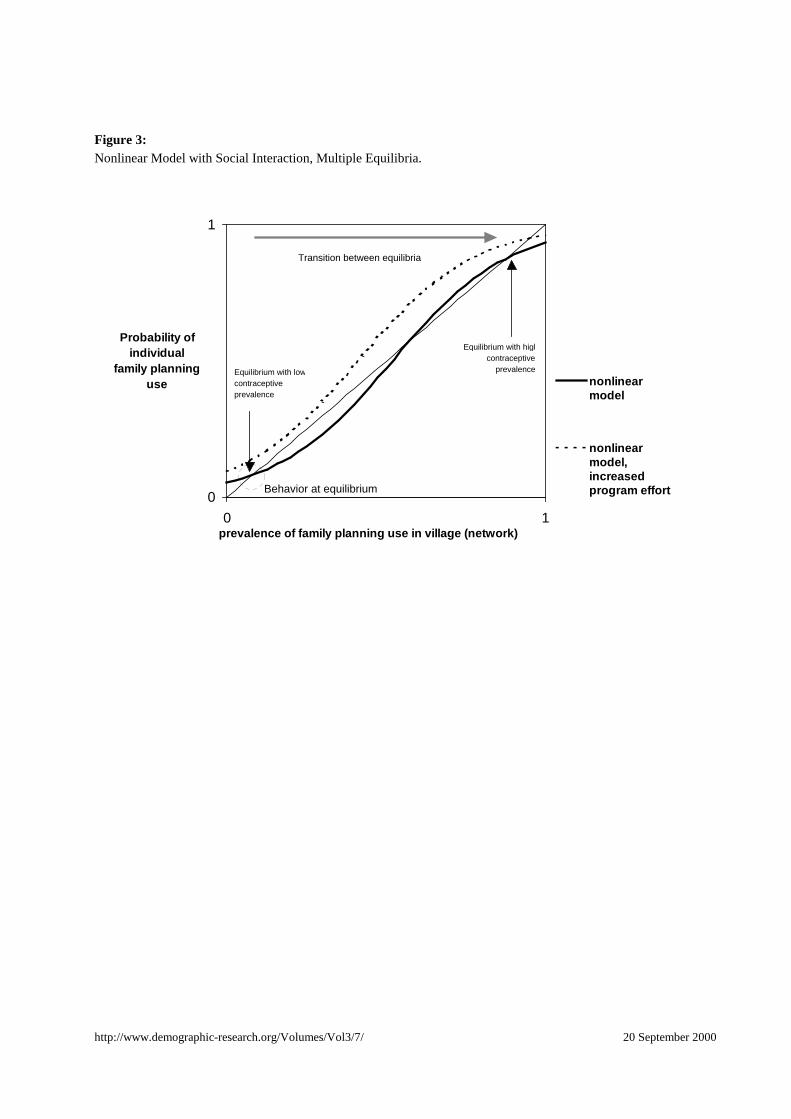
http://www.demographic-research.org/Volumes/Vol3/7/ 20 September 2000
Figure 3:Nonlinear Model with Social Interaction, Multiple Equilibria.
0
1
0 1prevalence of family planning use in village (network)
Probability ofindividual
family planninguse nonlinear
model
nonlinearmodel,increasedprogram effortBehavior at equilibrium
Transition between equilibria
Equilibrium with lowcontraceptive prevalence
Equilibrium with highcontraceptive
prevalence