Embed Size (px)
Citation preview
EMPIRICAL AND DETERMINISTICAPPROACH FOR THE OPTIMIZATION OFWIDEBAND RF POWER AMPLIFIERS’BEHAVIOR MODELING ANDPREDISTORTION STRUCTURE
Marie-Claude Fares,1 Slim Boumaiza,1 and John Wood2
1 EmRG Research Group, Department of Electrical and ComputerEngineering, University of Waterloo, 200 University Ave W.,Waterloo, ON, Canada N2L-3G1; Corresponding author:[email protected] Freescale Semiconductor, Inc., RF Division, 2100 E. Elliot Road,Tempe, AZ 85284
Received 21 April 2010
ABSTRACT: This article presents an approach to determining thesmallest number of coefficients of a Parallel Hammerstein (PH) model
to reduce the development complexity of wideband RF power amplifiers’(PA) modeling and predistortion schemes. The visualization of theimpulse responses of the different filters of the PH yields a systematic
and single-iteration approach for determining the optimal modelingstructure, for example, filters’ lengths. The approach was used to
determine an optimal structure that linearizes the response of a 400-watt LDMOS Doherty PA driven with a four carrier WCDMA signal. Inthe experiments conducted, the number of coefficients in the PH was
reduced by about a factor of 2.5 without compromising its modeling andlinearization performance. VC 2010 Wiley Periodicals, Inc. Microwave
Opt Technol Lett 53:116–118, 2011; View this article online at
wileyonlinelibrary.com. DOI 10.1002/mop.25660
Key words: linearization technique; behavioral modeling; poweramplifier; digital predistortion
1. INTRODUCTION
Devising and deploying linearization techniques to compensate for
the distortions exhibited by high-efficiency power amplifier (PA)
become more challenging as the signals’ bandwidth increases.
Indeed, these techniques are required to mitigate the two types of
distortions of typical PA: memoryless nonlinear distortion and
memory effects. Conversely, they need to be optimized by reduc-
ing their mathematical complexity while maintaining the perform-
ance required in terms of comprehensiveness and accuracy.
In the literature, authors seized the capability of artificial
neural networks, Volterra series and their derivations and pro-
posed several models, which were used in behavioral modeling
and digital predistortion (DPD) of wideband RF PA [1–4].
Among those models, the memory polynomial (M-Polynomial)
[4] is a widely-used model with proven behavioral modeling ac-
curacy and linearization capability The essential criteria leading
to the development of these models were modeling accuracy
and scheme complexity. Yet, radio systems designers strive to
achieve the best modeling or linearization accuracy with a mini-
mal complexity scheme. Infact, they lack practical means to
determine the optimal structure required for their application.
The iterative and heuristic procedures can be inaccurate and
time-consuming.
This article presents a novel deterministic approach for find-
ing the optimal filter structure, which is made possible by the
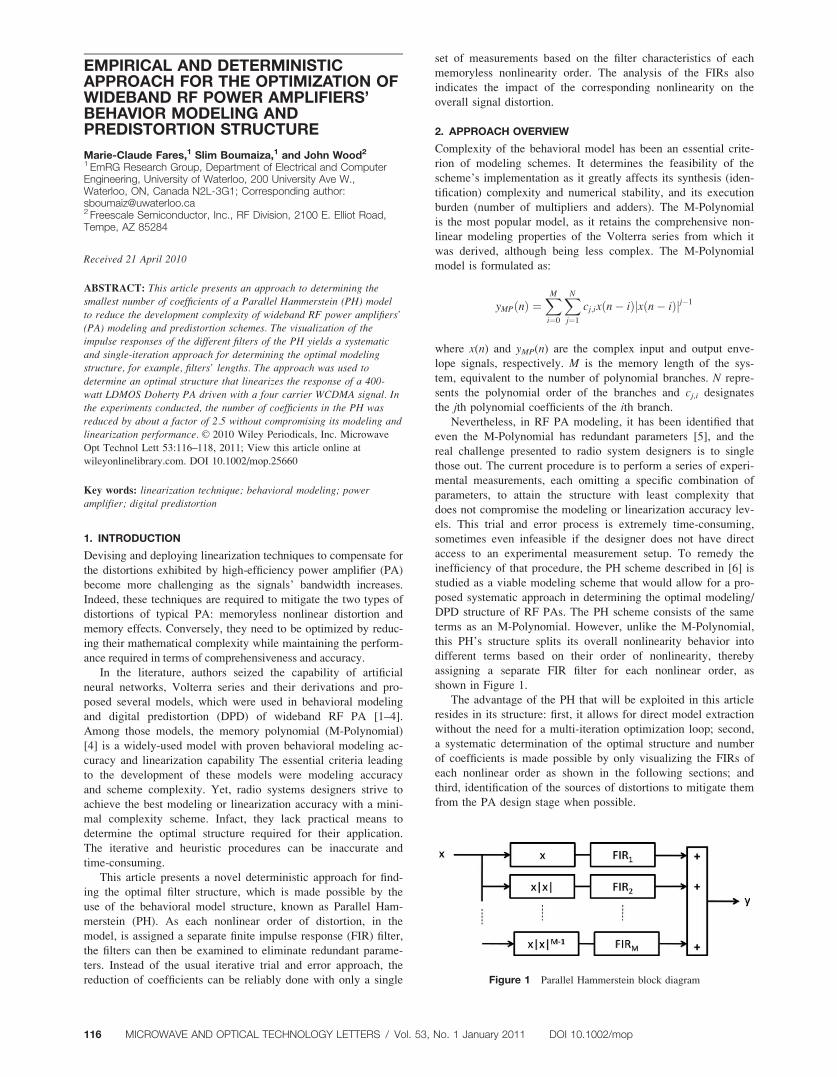
use of the behavioral model structure, known as Parallel Ham-
merstein (PH). As each nonlinear order of distortion, in the
model, is assigned a separate finite impulse response (FIR) filter,
the filters can then be examined to eliminate redundant parame-
ters. Instead of the usual iterative trial and error approach, the
reduction of coefficients can be reliably done with only a single
set of measurements based on the filter characteristics of each
memoryless nonlinearity order. The analysis of the FIRs also
indicates the impact of the corresponding nonlinearity on the
overall signal distortion.
2. APPROACH OVERVIEW
Complexity of the behavioral model has been an essential crite-
rion of modeling schemes. It determines the feasibility of the
scheme’s implementation as it greatly affects its synthesis (iden-
tification) complexity and numerical stability, and its execution
burden (number of multipliers and adders). The M-Polynomial
is the most popular model, as it retains the comprehensive non-
linear modeling properties of the Volterra series from which it
was derived, although being less complex. The M-Polynomial
model is formulated as:
yMPðnÞ ¼XM
i¼0
XN
j¼1
cj;ixðn� iÞjxðn� iÞjj�1
where x(n) and yMP(n) are the complex input and output enve-
lope signals, respectively. M is the memory length of the sys-
tem, equivalent to the number of polynomial branches. N repre-
sents the polynomial order of the branches and cj,i designatesthe jth polynomial coefficients of the ith branch.
Nevertheless, in RF PA modeling, it has been identified that
even the M-Polynomial has redundant parameters [5], and the
real challenge presented to radio system designers is to single
those out. The current procedure is to perform a series of experi-
mental measurements, each omitting a specific combination of
parameters, to attain the structure with least complexity that
does not compromise the modeling or linearization accuracy lev-
els. This trial and error process is extremely time-consuming,
sometimes even infeasible if the designer does not have direct
access to an experimental measurement setup. To remedy the
inefficiency of that procedure, the PH scheme described in [6] is
studied as a viable modeling scheme that would allow for a pro-
posed systematic approach in determining the optimal modeling/
DPD structure of RF PAs. The PH scheme consists of the same
terms as an M-Polynomial. However, unlike the M-Polynomial,
this PH’s structure splits its overall nonlinearity behavior into
different terms based on their order of nonlinearity, thereby
assigning a separate FIR filter for each nonlinear order, as
shown in Figure 1.
The advantage of the PH that will be exploited in this article
resides in its structure: first, it allows for direct model extraction
without the need for a multi-iteration optimization loop; second,
a systematic determination of the optimal structure and number
of coefficients is made possible by only visualizing the FIRs of
each nonlinear order as shown in the following sections; and
third, identification of the sources of distortions to mitigate them
from the PA design stage when possible.
Figure 1 Parallel Hammerstein block diagram
116 MICROWAVE AND OPTICAL TECHNOLOGY LETTERS / Vol. 53, No. 1 January 2011 DOI 10.1002/mop
The PH’s output, y(n), in terms of the input x(n) and its sam-
ples over time are expressed as:
yðnÞ ¼XMi
j¼1
XN
i¼0
ai;jxðn� iÞjxðn� iÞjj�1
where N is the maximum nonlinearity, Mj being the number of
taps of the FIR filter corresponding to the jth nonlinear order.
It is clear that the terms constituting the M-Polynomial
model are all found in the PH formulation. However, the reparti-
tion of these terms into a structure that is useful in modeling is
shown in Figure 1 as the PH diagram. For low-pass equivalent
modeling and predistortion purposes, it is necessary and suffi-
cient to use only the odd nonlinear orders.
As the PH model is linear in ai,j, the FIRs’ coefficients iden-
tification algorithm is carried out using the least square (LS)
error method, which involves matrix pseudoinversion and singu-
lar value decomposition. The calculation complexity of the LS
algorithm is proportional to the cube of the number of
unknowns, which significantly improves with a lower number of
model coefficients to be extracted. The accuracy and stability of
the results are directly related to the numerical conditioning of
the matrix to be inverted.
3. OPTIMIZATION OF PH MODEL
In Figure 1, conventional PH uses the same number of taps in
the different FIR filters associated to the various order of nonli-
nearity. Furthermore, determining the memory length, or equiva-
lently the number of filter taps required for an efficient PA lin-
earization, is usually done by trial and error. The best DPD
configuration is chosen based on figures of merit, such as nor-
malized mean square error (NMSE), using an iterative and
lengthy process. Therefore, the process of determining the mem-
ory length required is one of sequential optimization of simula-
tion results, followed by experimental checks. Conversely, in
this section, the visualization of the impulse response of every
digital filter in the PH structure will be used to elaborate a
deterministic way for finding the optimal FIR filter lengths of
each nonlinearity order. This will also yield the smallest number
of taps in each filter that maintains the modeling/linearization
capability.
Starting from the coefficients of the PH scheme, constructed
with an order of nonlinearity of 9 and a memory order of 10,
the different filters’ coefficients, corresponding to the nonlinear-
ity orders of 1, 3, … 9, are visualized in Figure 2. One can eas-
ily detect a generic trend in the amplitude of the filter taps.
They all tend to converge to a certain range that is much lower
than the first tap, whereas the rate of change between taps
becomes minimal. This implies that the signal samples corre-
sponding to those memory levels do not affect the output of the
model, or equivalently the corresponding DPD. Therefore, elimi-
nating those taps would reduce the complexity of the model
without compromising its accuracy and linearization efficiency.
The FIR visualization of Figure 2 indicates that in this case,
using a uniform filter length of 10 taps, for each FIR in Figure
1 is overestimating the memory effects of the DUT. In fact, the
comparison of the spectra of Figure 4 shows a similar lineariza-
tion capability of the PH when using filter lengths of 10 for all
the FIR filters of the model, and the case where the lengths used
were reduced for each order. The second measurement uses FIR
filter lengths of 5, 6, 3, 3, and 3 for filters FIR1, FIR3, FIR5,
FIR7, and FIR9, respectively. These lengths were determined by
examining at the last significant filter tap on the visualization of
Figure 2 and cutting out the taps after the change in amplitude
trend—in other words, after the drop in tap amplitudes. As the
first tap of each filter corresponds to the purely nonlinear, mem-
oryless response, its amplitude is much higher compared with
the rest of the taps that correspond to the perturbations of
smaller amplitude associated with memory effects. Hence, for a
closer visualization of the FIRs in Figure 2, the first tap is left
out, showing only the rest of the filter, that is, Taps 2–10, as
shown in Figure 3. Common to all the filters responses, an
increase in tap amplitude is observed followed by a relatively
sharp decrease, most obvious in FIR3. Filters 5, 7, and 9 clearly
show that the taps following the sharp change in amplitude fol-
low a mathematical fitting for the problem formulation of the
model.
Both the full model and the complexity-reduced model
achieve similar linearization capability as per Figure 4, which
shows the PA output signal when the PA is linearized using
Figure 2 Individual FIR filter coefficients plots for parallel Hammer-
stein DPD using odd-only nonlinearities of maximum order 9 and FIR
filter length of 10. [Color figure can be viewed in the online issue,
which is available at wileyonlinelibrary.com]
Figure 3 Zoomed-in view of the FIR response: Taps 2–10. The arrows
indicate where the amplitude suddenly decreases after aconstant increase
from Tap 2. [Color figure can be viewed in the online issue, which is
available at wileyonlinelibrary.com]
DOI 10.1002/mop MICROWAVE AND OPTICAL TECHNOLOGY LETTERS / Vol. 53, No. 1 January 2011 117
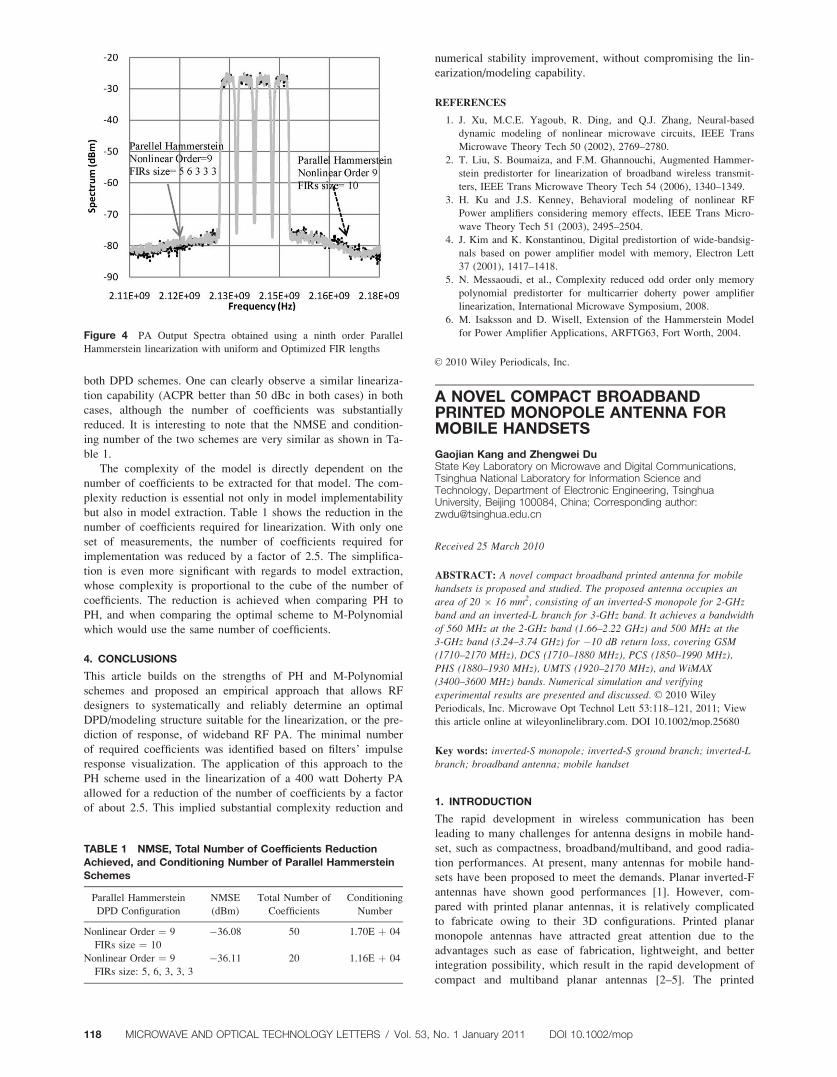
both DPD schemes. One can clearly observe a similar lineariza-
tion capability (ACPR better than 50 dBc in both cases) in both
cases, although the number of coefficients was substantially
reduced. It is interesting to note that the NMSE and condition-
ing number of the two schemes are very similar as shown in Ta-
ble 1.
The complexity of the model is directly dependent on the
number of coefficients to be extracted for that model. The com-
plexity reduction is essential not only in model implementability
but also in model extraction. Table 1 shows the reduction in the
number of coefficients required for linearization. With only one
set of measurements, the number of coefficients required for
implementation was reduced by a factor of 2.5. The simplifica-
tion is even more significant with regards to model extraction,
whose complexity is proportional to the cube of the number of
coefficients. The reduction is achieved when comparing PH to
PH, and when comparing the optimal scheme to M-Polynomial
which would use the same number of coefficients.
4. CONCLUSIONS
This article builds on the strengths of PH and M-Polynomial
schemes and proposed an empirical approach that allows RF
designers to systematically and reliably determine an optimal
DPD/modeling structure suitable for the linearization, or the pre-
diction of response, of wideband RF PA. The minimal number
of required coefficients was identified based on filters’ impulse
response visualization. The application of this approach to the
PH scheme used in the linearization of a 400 watt Doherty PA
allowed for a reduction of the number of coefficients by a factor
of about 2.5. This implied substantial complexity reduction and
numerical stability improvement, without compromising the lin-
earization/modeling capability.
REFERENCES
1. J. Xu, M.C.E. Yagoub, R. Ding, and Q.J. Zhang, Neural-based
dynamic modeling of nonlinear microwave circuits, IEEE Trans
Microwave Theory Tech 50 (2002), 2769–2780.
2. T. Liu, S. Boumaiza, and F.M. Ghannouchi, Augmented Hammer-
stein predistorter for linearization of broadband wireless transmit-
ters, IEEE Trans Microwave Theory Tech 54 (2006), 1340–1349.
3. H. Ku and J.S. Kenney, Behavioral modeling of nonlinear RF
Power amplifiers considering memory effects, IEEE Trans Micro-
wave Theory Tech 51 (2003), 2495–2504.
4. J. Kim and K. Konstantinou, Digital predistortion of wide-bandsig-
nals based on power amplifier model with memory, Electron Lett
37 (2001), 1417–1418.
5. N. Messaoudi, et al., Complexity reduced odd order only memory
polynomial predistorter for multicarrier doherty power amplifier
linearization, International Microwave Symposium, 2008.
6. M. Isaksson and D. Wisell, Extension of the Hammerstein Model
for Power Amplifier Applications, ARFTG63, Fort Worth, 2004.
VC 2010 Wiley Periodicals, Inc.
A NOVEL COMPACT BROADBANDPRINTED MONOPOLE ANTENNA FORMOBILE HANDSETS
Gaojian Kang and Zhengwei DuState Key Laboratory on Microwave and Digital Communications,Tsinghua National Laboratory for Information Science andTechnology, Department of Electronic Engineering, TsinghuaUniversity, Beijing 100084, China; Corresponding author:[email protected]
Received 25 March 2010
ABSTRACT: A novel compact broadband printed antenna for mobilehandsets is proposed and studied. The proposed antenna occupies an
area of 20 � 16 mm2, consisting of an inverted-S monopole for 2-GHzband and an inverted-L branch for 3-GHz band. It achieves a bandwidth
of 560 MHz at the 2-GHz band (1.66–2.22 GHz) and 500 MHz at the3-GHz band (3.24–3.74 GHz) for �10 dB return loss, covering GSM(1710–2170 MHz), DCS (1710–1880 MHz), PCS (1850–1990 MHz),
PHS (1880–1930 MHz), UMTS (1920–2170 MHz), and WiMAX(3400–3600 MHz) bands. Numerical simulation and verifying
experimental results are presented and discussed. VC 2010 Wiley
Periodicals, Inc. Microwave Opt Technol Lett 53:118–121, 2011; View
this article online at wileyonlinelibrary.com. DOI 10.1002/mop.25680
Key words: inverted-S monopole; inverted-S ground branch; inverted-L
branch; broadband antenna; mobile handset
1. INTRODUCTION
The rapid development in wireless communication has been
leading to many challenges for antenna designs in mobile hand-
set, such as compactness, broadband/multiband, and good radia-
tion performances. At present, many antennas for mobile hand-
sets have been proposed to meet the demands. Planar inverted-F
antennas have shown good performances [1]. However, com-
pared with printed planar antennas, it is relatively complicated
to fabricate owing to their 3D configurations. Printed planar
monopole antennas have attracted great attention due to the
advantages such as ease of fabrication, lightweight, and better
integration possibility, which result in the rapid development of
compact and multiband planar antennas [2–5]. The printed
TABLE 1 NMSE, Total Number of Coefficients ReductionAchieved, and Conditioning Number of Parallel HammersteinSchemes
Parallel Hammerstein
DPD Configuration
NMSE
(dBm)
Total Number of
Coefficients
Conditioning
Number
Nonlinear Order ¼ 9
FIRs size ¼ 10
�36.08 50 1.70E þ 04
Nonlinear Order ¼ 9
FIRs size: 5, 6, 3, 3, 3
�36.11 20 1.16E þ 04
Figure 4 PA Output Spectra obtained using a ninth order Parallel
Hammerstein linearization with uniform and Optimized FIR lengths
118 MICROWAVE AND OPTICAL TECHNOLOGY LETTERS / Vol. 53, No. 1 January 2011 DOI 10.1002/mop


![Digital Predistortion for 5G Small Cell: GPU ...sought within the scarce radio frequency spectrum [9]. In this context, higher-order symbol alphabets as well as more wideband signals](https://img.pdfslide.us/doc/110x75/60eb5dc8d5fef029346a48c9/digital-predistortion-for-5g-small-cell-gpu-sought-within-the-scarce-radio.jpg)