Embed Size (px)
Citation preview

48 TRANSPORTATION RESEARCH RECORD 1203
Empirical Analysis of Trip Chaining Behavior
KAZUO NISHII, KATSUNAO KONDO, AND RYUICHI KITAMURA
This study is concerned with commuters' trip chaining behavior in which a stop for nonwork activities is introduced to the basic home-work-home travel pattern. An important question is whether a commuter will make the nonwork stop during the commuting trip or, alternatively, will pursue the nonwork activity by making a separate trip chain from home. A theoretical model is formulated to address this question. The analysis indicates that the likelihood of pursuing the nonwork activity in a separate, home-based trip chain will increase with the speed of travel and will decrease as commuting distance, travel cost, or the density of opportunities increases. The empirical analysis, using data sets from two areas and two points in time, generally supports these theoretical relationships. It also shows, however, that trip chaining behavior does not remain stable over time despite the fact that trip rates are very stable.
Extensive knowledge of trip chaining behavior is now available through the accumulation of studies in various disciplines. Several analytical frameworks have been proposed, and common behavioral characteristics have been identified across data sets and over time. Recent developments include attempts to introduce the concept of trip chaining into demand forecasting procedures (see the review in the following section). Not unexpectedly, however, previous analyses and models are subject to limitations. Most notably, the well-recognized spatial and temporal constraints imposed on trip chaining behavior (J, 2) have rarely been incorporated into quantitative analyses. In addition, the conditions in the travel environment that induce multistop chains (i.e., a home-to-home tour that contains more than one stop) have not been determined. These limitations have motivated this study.
The objective of this study is first to determine the conditions in the travel environment that encourage or discourage linking of trips into a multistop chain. Second, the study attempts to determine whether these conditional relationships prevail over time and across metropolitan areas. For this purpose, a model of trip chaining behavior is developed while explicitly incorporating time-space constraints, and using an abstract linear-city setting. The
K. Nishii, Department of Civil Engineering, University of California, Davis, Calif. 95616. Current affiliation: Department of Civil Engineering, Yamanashi University, 4-3-11 Takeda, Kofu, Yamanashi 400, Japan. K. Kondo, Department of Civil Engineering, Fukuyama University, Fukuyama, Hiroshima 729-02, Japan. R. Kitamura, Department of Civil Engineering, University of California, Davis, Calif. 95616.
spatial and temporal stability of the behavioral properties derived from this model is examined empirically using travel data from two metropolitan areas at two points in time.
The focus of this study is on linking work trips and other trips in a constrained environment. The probability of combining work and other activities into one homebased trip chain is related to parameters characterizing the travel environment, such as the travel speed and commuting distance. The model is an extension of the one in Kondo and Kitamura (3). In the present model, in-home and out-of-home activity durations are endogenously determined assuming a specific functional form to represent the utility of activity engagement. Relationships derived from the model are examined for their empirical validity in order to identify the conditions that induce linked trips. Also evaluated through this process is the effectiveness of the model framework that draws on the notion of timespace constraints. The data sets from two areas and two points in time allow a robust assessment of the model's validity and usefulness.
Although the model enables the derivation of behavioral relationships, its development is based on certain idealizations and simplifications that may limit the generality of the results. Perhaps most critical is the assumption that opportunities are uniformly distributed in the urban area. Because of this assumption, behavioral properties derived from the model may not necessarily be compatible with observed behavior, which is obviously influenced by variations in the type and intensity ofland use within an urban area. Another idealization is that the urban area can be represented as a one-dimensional space. This simplification is not restrictive, however, because the study examines trip chaining under the assumption that destination locations are predetermined (a two-dimensional extension appears in Goulias and Kitamura [ 4] in which location choice in trip chains is the subject of analysis). It is also assumed that trip makers are homogeneous and that the properties identified through the model apply uniformly to all individuals. The applicability of the study results to population segments needs to be examined in a future effort. Despite these limitations the results presented in this paper offer behavioral insight and provide a basis for future model building efforts.
The paper is organized as follows. The next section offers a brief review of past studies of trip chaining behavior, with an emphasis on several especially pertinent ef-
Nishii et al.
forts. The following section presents the framework of the linear-city model and derives relationships between trip chaining and parameters characterizing the urban area. The results of empirical analysis appear next. Temporal and spatial stability in the distribution of path types and time use patterns is discussed. The properties obtained from the model are then empirically examined. The final section is a brief summary.
BACKGROUND
Existing models of trip chaining behavior can be classified into four broad groups: Markovian, activity-based, disaggregate utility-maximization models, and simulation models. Markovian models, which have been applied in trip chaining research since the concept oflinked trips was introduced, are frequently used to represent the linkage between trip purposes or between the facilities at trip-ends. An application of Markov chain models in the trip distribution phase of the travel demand forecasting process can be found in Sasaki (5). An extension to modal split has also been investigated by Kondo (6) and Nishii and Sasaki (7). Application of Markov renewal process models has recently been proposed for a more elaborate representation of trip chaining behavior (8). This is generalized to a timedependent, probabilistic process, assuming that the decision underlying trip chaining is influenced by factors related to the time of day (9). Extensions of discrete Markovian models can also be found in O'Kelly (10) and Borgers and Timmermans (11), who propose nonstationary Markov chain models. Many limitations of Markovian models noted in the past (12) are overcome in these recent extensions.
The activity-based approach to travel demand analysis has its roots in time geography (J) and human activity analysis (13). The main subjects for investigation include the interdependencies among household members in daily activities, the effect oflife-cycle stages on activity patterns, and characteristics of time-space paths (i.e., the trajectory formed by an individual in the time-space dimension) and constraints imposed on them (2, 14). Recently, efforts have been made to apply this approach to the examination of alternative hypotheses and development of theoretical frameworks for trip chaining behavior. In particular, Recker et al. (15) developed a model system that explicitly incorporates the time-space constraints. This model system promises to be a useful tool for a wide range of transportation planning options. The activity-based approach has contributed importantly to the analysis of trip chaining behavior.
There have been several trip chaining models that take on the utility-maximization approach (8,16). Adler and Ben-Akiva (J 7) developed a utility-maximizing model while viewing the decision for nonwork travel behavior as a choice from among a set of feasible daily paths. An effort to develop a stochastic process model using discrete choice models can be found in van der Hoorn (18, 19) and in Kitamura and Kermanshah (20,21). The effect of time-
49
space constraints on trip chaining is evaluated in a simplified context (3). In many of these applications, the decision underlying daily travel behavior is decomposed, and discrete choice models are applied to the resulting decision components. Whether these components can be integrated to reconstruct a daily travel pattern properly and meaningfully remains as a future research subject.
Another class of studies consists of simulation analyses of trip chaining. For example, Southworth applies heuristic rules to generate a set of destination locations visited in a trip chain (22). Markovian assumptions are applied in other simulation studies (23,24).
Of particular importance to this research is a set of studies that share the common interest: How nonwork activities and trips are linked to work trips. This group of work includes Oster (25), Hanson (26), Damm (14), Adiv (27), and Kondo and Kitamura (3). Damm (14) focuses on the interdependence in activity engagements across periods of the day and attempts to develop a quantitative model describing how nonwork activities are linked or not linked to work trips. Damm's tabulation using observations from Minneapolis and St. Paul (Minnesota) indicates that 45 percent of workers who engaged in nonwork activities did so in connection with work, while 48 percent pursued nonwork activities in separate, home-based chains made after work.
The linking of nonwork activities to work activities is further examined by Kondo and Kitamura (3) with the use of constrained choice models to quantify the effect of time constraints. Their analysis indicates associations between trip chaining and the duration of nonwork activity, residential location, and work trip mode. The important association between travel mode and trip chaining is also shown by Nishii and Sasaki ( 7) using Japanese data.
The "second role" of the work trip, that is, providing the opportunity to link nonwork trips, is emphasized in Oster (25) and Hanson (26). In general, the empirical results indicate the importance of this second role. Hanson (26) notes that stops at supermarkets, kiosks, and other persons' homes are most frequently made while commuting and points out that stops made during a work journey tend to be unplanned.
The analysis by Adiv (27) is motivated by the hypothesis that commuters are reluctant to use public transit because of the convenience driving offers for engaging in extra activities during the work trip. Adiv offers interesting statistics of trips and activities pursued on the way to work, during work, and on the way home from work; he reports that no particular activity type tends to be linked to work more frequently than statistically expected. Adiv's overall observation is that "in spite of the empirical results which showed the existence of extra activities during the worktrip, one has to conclude that most daily activities of working people, as represented by this sample, are still conducted independently of the journey to work" (27,p.135). Golob's tabulation of a Dutch data set indicates that approximately 80 percent of home-based trip chains are simple home-work-home chains (28), leading to the same question about the significance of trip chaining involving work in the Netherlands.

50
Adiv's observation may be a reflection of land use development particular to the San Francisco Bay Area, where his observation was taken. It is conceivable that the apparent contradiction between the results of Adiv and those of Hanson (using data from Uppsala, Sweden) may be due to land use differences. Nonetheless, Adiv's observation raises the important question of whether accounting for trip chaining behavior using more complex methods and models is justifiable from a practical viewpoint. Further effort obviously needs to be devoted to trip chaining involving work trips.
Extensive effort has been made in the analysis of trip chaining behavior. Common characteristics of trip chaining behavior have been identified as summarized in recent reviews (29,30). The field appears to be entering the state where practical and application-oriented questions need to be addressed. Surprisingly, however, relatively little is known about conditions in the travel environment that induce trip chaining. Consequently, little information is available to help determine whether trip chaining will be more prevalent in the future. This paper's aim is to determine on what conditions workers tend to link trips to form trip chains involving work and other activities.
MODEL OF TRIP CHAINING UNDER TIME-SPACE CONSTRAINTS
In this section a simple model of trip chaining behavior under time-space constraints is formulated, and some properties of the model are derived. The section's intent is to lay an analytical foundation for the empirical analysis of trip chaining behavior presented in the following section. The model is based on the one proposed by Kondo and Kitamura (3) and depicts the formation of trip chains in a linear city under constraints represented by a timespace prism (J). The study extends the model by Kondo and Kitamura by postulating a specific functional form for the utility of out-of-home and in-home activities and by endogenously determining the amounts of time allocated to out-of-home and in-home activities.
Prism in the Time-Space Coordinates
Consider a linear city in which opportunities for out-ofhome activities are distributed with constant density r(x) = r, -co< x <+co. Suppose a worker in this linear city resides at x = L and commutes to his stationary work location at x = 0. The simplest travel pattern the worker can follow is a two-leg, one-stop, home-work-home trip chain. If the worker is subject to a fixed work schedule, the timing of an additional activity is constrained in the time-space coordinates because of the work schedule and also because of the limited speed of the travel mode used. The region in the time-space coordinates that the worker can occupy is often called a "prism." A typical worker's travel behavior is confined by three prisms: one before the
TRANSPORTATION RESEARCH RECORD 1203
scheduled work, one during the lunch break, and one after work (14,31).
Figure 1 shows an example of the prism for a onedimensional urban space. The parameters that define the prism are:
L = distance between work location and home, 10 = earliest possible time that the worker can leave a
base (home or office), 11 =time by which he must arrive at a base (office or
home); v = speed of the travel mode the worker uses, T = l 1 - 10 , total available time, or height of the prism.
The maximum amount of time available for activities, h, is obtained as
h = T- L/v.
These parameters are shown with the prism in Figure 1. The analysis of this study is concerned with the case in
which the worker pursues a discretionary out-of-home activity in addition to work. If the location and time of the additional activity are not fixed, the activity can be pursued in any one of the three prisms. If the activity is pursued in the first or the third prism, the worker has the options of ( 1) combining this additional activity with the wmmuting trip and (2) pursuing the activity in a separate, home-based, one-stop trip chain. A sequence of trips, or a path, shall be called a "multichain" path ifthe additional activity is pursued in a separate, home-based trip chain and a "single-chain" path if the activity is linked to a commuting trip. Then the worker has five types of paths (f 4): a multi- or single-chain path in which the activity is pursued before work, a path with the activity pursued during work, and a multi- or single-chain path with the activity pursued after work.
Utility Components of Time-Space Paths in the Prism
Let A(x) be the attractiveness of the set of opportunities in a unit-distance interval at x. Suppose that time can be
T "nie
11 ·· ··r ·········-·········-·····
T
to .... l .... 1 ... -·-·- -....
office ; S ace
• v h/2 0 L L + vh/2
FIGURE 1 A prism in the time-space coordinates.

Nishii et al.
Case 1 : L-vh/2 < O
t(x) MC
SC -2x/v
d(x) MC
SC L-2x
Case 2 : L-vh/2 .> O
t(x) MC
SC -2x/v
d(x) MC
SC L-2x
-2x/v
3L-2x
L-2x
0
L
0
3L-2x
L
L
2(L-x)/v
0
3L-2x
L
L + vh/2
2(x-L)/v
2(x-L)/v
2x-L
2x-L
L + vh/2
2(x-L)/v
2(x-L)/v
2x-L
2x-L
51
FIGURE 2 t(x) and d(x) by activity location, x for MC path and SC path.
TABLE 1 RELATIONSHIP BETWEEN DU AND PARAMETERS CHARACTERIZING THE LINEAR CITY
L-hv/2 sx < 0 0 < x SL L < x s L+hv/2
a DU I a L < 0 <0 0
a DU I av > 0 >0 0
a DU / a e < 0 <0 0
a DU I a A < 0 cO 0
a DU I il Ho > 0 >0 > 0
freely allocated between in-home and out-of-home activities. In this case, it can be assumed that the duration of the activity at x will be determined such that the total utility of in-home and out-of-home activities will be maximized. Assume as well that the utility of the activity at x increases proportionally with the attractiveness measure A(x) and, further, that utilities of in-home and out-ofhome activity durations can be combined into a Cobb-
Douglas function. The total utility of engaging in an activity at x and allocating s amount of time can then be expressed as
U(x, s) = A(x)s11 lh - t(x) - sl 1- 11 0 < fj< 1
where
s = the duration of out-of-home activity at x, t(x) = the reduction in available activity time due to
travel, and h =the maximum activity time available, as defined
earlier.
Setting the first derivative with respect to s equal to 0, the optimal activity duration at x, s*, is obtained as
s* = fj{h - t(x)I
The total utility of the activity time in the prism with s*, U*(x), can be expressed as
U*(x) = fj 11(l - J3) 1- 11A(x){h - t(x)I

52
The net utility, then, can be formulated as follows:
U1c(X) - Odsc(x} if a single-chain path Utc(x) +Ho - OdMc(x) if a multichain path
where
d(x} =total travel distance [dsc(x) for single-chain path, dMc(x) for multichain path],
() = travel cost per unit distance, and Ho = the added utility that arises when the discretion
ary activity is pursued in a separate, home-based trip chain.
If returning home before engaging in the discretionary activity offers an opportunity to freshen up, rest, or to attend to household chores, the separate home-based trip chain may yield additional utility. This added utility, H 0 ,
is associated with the schedule convenience.
TABLE 2 INDICATORS OF TRAVEL PATTERNS BY YEAR
Indicators 1970 1980 chengor/o) 1980119 0
Trip rates Osaka 2.72 2.92 +7.4% (trips/tripmaker) Kyoto 2.77 2.92 +5 .4%
Trip rates Osaka 2.84 3.07 +8.1% (t rips/worker} Kyoto 2.87 3.03 +5.6%
The average number of Osaka 1.21 1.20 ·0.8% office-based chains Kyoto 1.20 1.20 0.0%
The ovorage number of Osaka 1.69 1.62 ·4°.1% oflice·based sojourns Kyoto 1.78 1.67 -6.2%
Tour length"(km) : Osaka 8.74 8.43 ·3.5% C.B.D. tours Kyoto 7.55 7.44 ·1.5%
Tour length• (km) : Osaka 14.01 14.45 +3.1% all tours Kyoto 12.87 12.33 -4.2%
') Tour length Is defined as the average distance between tripmake(s
home and the farthest sojourn location. The figures are for workers
who made al least one trip by car. A C.B.D. tour is one which contains
at least one stop in the central area.
TRANSPORTATION RESEARCH RECORD 1203
Formation of Trip Chains
The relation between the likelihood of trip chaining and the model parameters is now derived assuming that the worker chooses between single-chain (SC) and multichain (MC) paths given the location of the additional activity, x.
If both types of paths are feasible (i.e. L - hv /2 ::5 x ::5
L + hv/2}, it may be assumed that the choice between MC and SC paths depends on the utility difference, DU,
DU= Utc(x) - U1c(x)
= ,Bil(I - (3)C 1-il>A(x)ltsc(X) - tMc(x)} +Ho
+ O{dsc(x) + dMc(x)}
where A(x) is the attraction measure as before, and Utc(x) and U1c(x) are the net utilities of a sojourn of duration s* at an opportunity at x in an MC path and an SC path, respectively. The trip distance in the linear city, d(x}, and time available for the activity, t(x), can be determined automatically for each path type given the activity location, x. The results are summarized in Figure 2, which is prepared for the third prism. Using this result, the utility difference can be expressed as
rHo -,Bil(l - {3)'-ilA(x)(2L/v)- 20L if L- hv/2 ::5 x< 0
DU= 1H0 -f3il(l - {3)'-flA(x)(L-x)/v- 20(L ..:_ x) ifO ::5 x ::5 L
Ho ifL<x::5L+hv/2
It can be assumed that the worker is more likely to taKe on an MC path as the utility difference increases.
Using this relationship, the likelihood of MC and SC paths can be related to the model parameters that characterize the linear city. The results are summarized for L, v, 0, A(x), and Hin Table 1. Note that.the relations between DU and the model parameters vary depending on the activity location. In particular, most of the model parameters examined here are unrelated to DU if L < x ::5
L + vh/2 (see Figure 2). In the other regions of the linear city, the likelihood of an SC path increases with the
TABLE 3 DISTRIBUTION OF PATH TYPES INVOLVING TWO STOPS
Before work During After work Total city year MC SC work SC MC
Osaka 1970 193 337 2773 3280 1196 7779 2.5% 4.3% 35.6% 42.2% 15.4% 100%
1980 119 305 4072 2450 665 7611 1.6% 4.0% 53.5% 32.2% 8.7% 100%
Kyoto 1970 77 95 643 875 445 2135 3.6% 4.5% 30.1% 41.0% 20.8% 100%
1980 91 162 1282 1005 475 3015 3.0% 5.4% 42.5% 33.3% 15.8% 100%
Nishii et al.
Path Type
Before Work
Before
Work
Year
MC 1970
MC 1980
SC 1970
SC 1980
1970 During Work
1980
After SC 1970
Work SC 1980
MC 1970 After
Work MC 1980
53
0 20 40 60 80 100
Percentage of Trip Mode for Tiie addltlonal Trip (%)
• Walk
• Car • Railway ~ Others
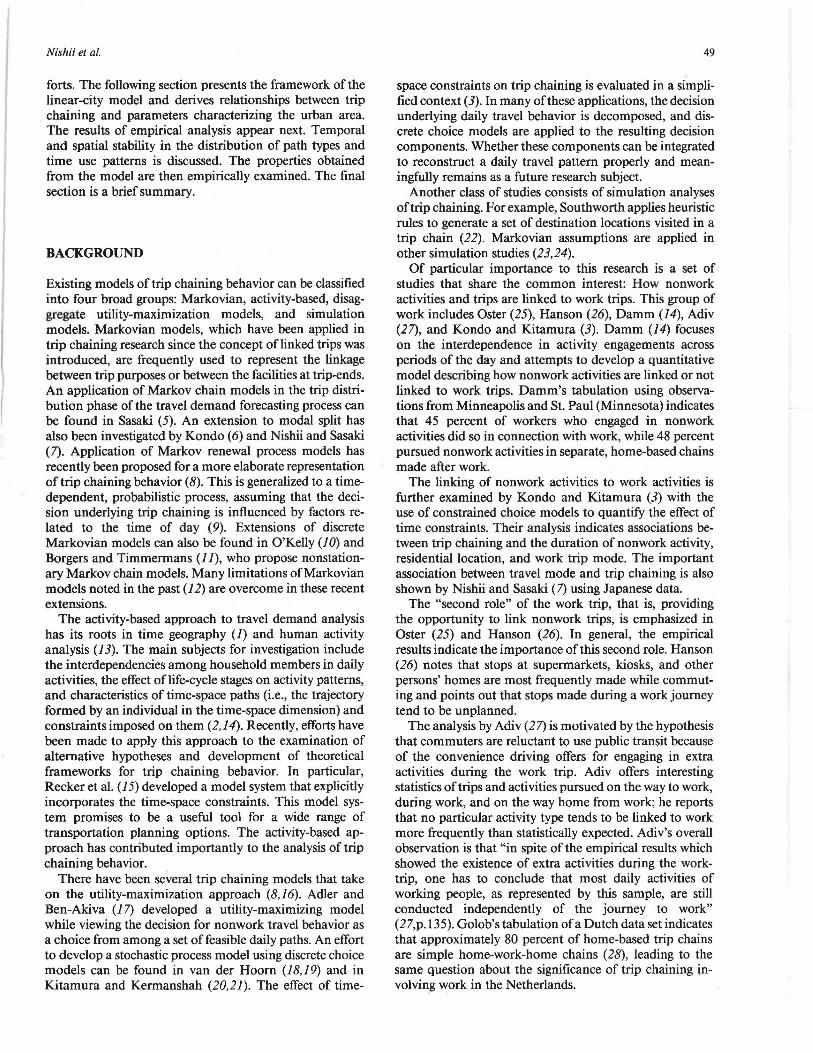
FIGURE 3 Distribution of modes used for additional activity.
commuting distance (L), travel cost (8), and the mean attractiveness of the opportunities (A(x)); that of an MC path increases with the speed of travel (v) and the added utility (Ho).
It is important to note that the relationships described are derived using the assumption of a uniform linear city. This assumption is obviously restrictive, and observed relationships may divert from these theoretical relationships because of variations in the distribution of opportunities and other irregularities. Nonetheless, the theoretical results have offered guidance to the empirical analysis, the results of which are presented in the next section.
EMPIRICAL RESULTS: TWO-STOP PATHS
The temporal and spatial characteristics of trip chaining behavior are studied in this section using observations from two time points. The validity of the behavioral properties derived from the theoretical linear city model is then examined. The latter focus reflects the de-sire to determine the usefulness of the concept of time-space constraints in analyzing travel behavior and also to determine the extent to which these constraints are binding. The analysis is limited to those paths that involve a sojourn (or two sojourns) for work at a fixed location, and a nonwork sojourn.
The data sets used are from the Kyoto-Osaka-Kobe metropolitan area in Japan. Comparable data are available from 1970 and 1980 and are suitable for a comparative analysis between the two time points ten years apart. Both data sets contain records of the entire set of trips made by each member (2:5 years old) of sample households on the survey day. Sample households of the two surveys were selected randomly based on residential location with sampling rates of approximately 3 percent.
Mobility characteristics in these data sets are summarized in Table 2. Trip rates are very similar (within 2 percent differences) between Osaka and Kyoto subareas in both 1970 and 1980. Spatial stability of trip generation is evident from this tabulation. The measures of tour length (i.e., the distance between the home base and the farthest sojourn location), on the other hand, show that a tour tends to be longer in the Osaka area, which has a much larger urban area. Table 2 also indicates that trip rates in both areas increased in 1980, with the Osaka area showing slightly higher rates of increase. Unlike trip rates, tour length does not offer a clear tendency between the two time points.
The analysis presented in the rest of this paper is based on a subsample consisting of those who ( 1) were employed at the time of survey, (2) made a work trip on the survey day, (3) pursued exactly one out-of-home activity in addition to work, and (4) had a closed home-based path.
54 TRANSPORTATION RESEARCH RECORD 1203
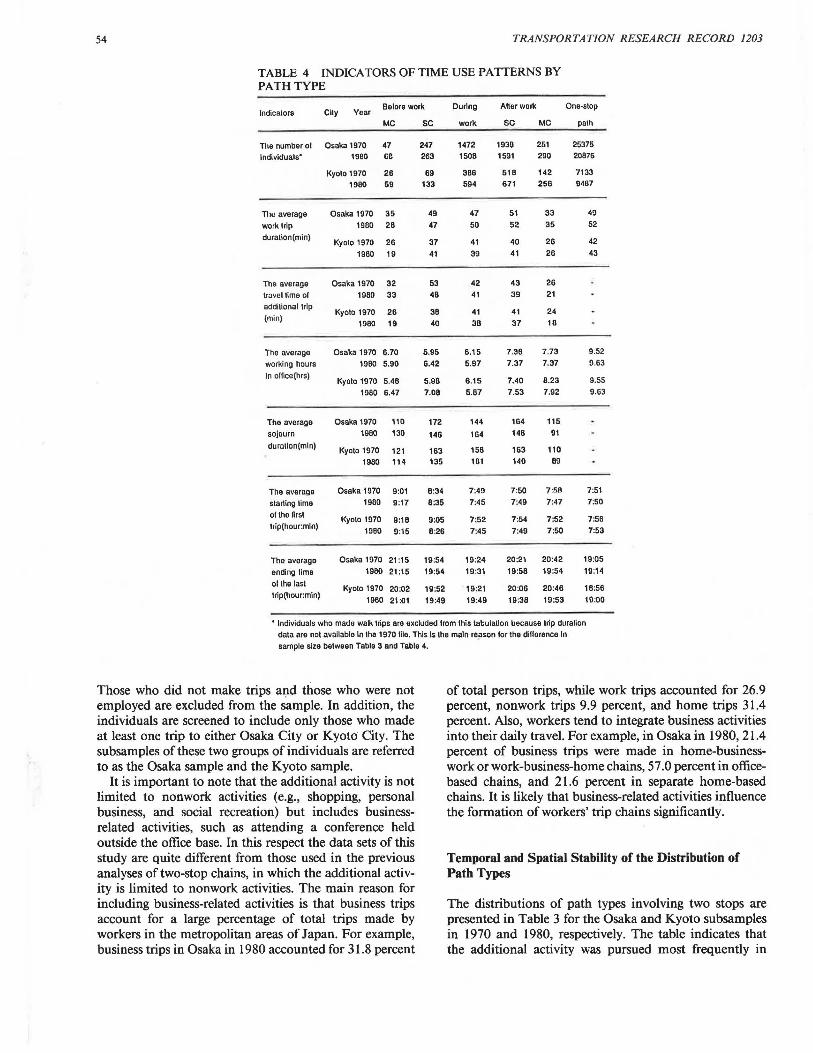
TABLE 4 INDICATORS OF TIME USE PATTERNS BY PATH TYPE
Belore work During Aherwork One-stop Indicators Cily Year
MC SC work SC MC path
The number ol Osaka 1970 47 247 1472 1930 251 25375
Individuals" 1980 ue 263 1508 1591 290 20876
Kyoto 1970 26 69 386 518 142 7133
1980 59 133 594 671 256 9~87
Thu average Osaka 1970 35 49 47 51 33 49
work trip 1900 20 47 50 52 35 52
durallon(min) Kyoto 1970 26 37 41 40 26 42
1960 19 41 39 41 26 43
The average Osaka 1970 32 53 42 43 26
travel time ol 1980 33 48 41 39 21
additional trip Kyoto 1970 26 30 41 41 24
(min) 1980 19 40 30 37 10
The average Osaka 1970 6.70 5.95 6.15 7.30 7.73 9.52
working hours 1980 5.90 6.42 5.97 7.37 7.37 9.63
in ollice(hrs) Kyoto 1970 5.48 5.96 6.15 7.40 0.23 9.55
1960 6.47 7.08 5.07 7.53 7.92 9.63
The avorage Osaka 1970 110 172 144 164 115
sojourn 1960 130 146 164 140 91
duration(mln) Kyoto 1970 121 163 156 163 110
1980 114 135 181 140 89
The average Osaka 1970 9:01 8:34 7:49 7:50 7 :58 7:51
starting time 1980 9 :17 8:35 7:45 7:49 7:47 7:50
oftho lirst Kyoto 1970 9:18 9:05 7:52 7:54 7:52 7:56
t1ip(hour:mln) 1980 9:15 8:26 7 :45 7 :49 7 :50 7:53
Tho average Osaka 1970 21:15 19:54 19:24 20:21 20 :42 19:05
ending lime 1900 21:15 19:54 19:31 19:58 19:54 19:14
ol the last Kyoto 1970 20 :02 19:52 19:21 20:06 20 :46 18:56
trip(hour:mln) 1980 21:01 19:49 19:49 19:38 19:53 10:00
• Individuals who made walk trips are excluded lrom this tabulation because trip duration
data are nol available In the 1970 lile. This Is the main reason for the diflerence In
sample size between Tablo 3 and Table 4.
Those who did not make trips and those who were not employed are excluded from the sample. In addition, the individuals are screened to include only those who made at least one trip to either Osaka City or Kyoto City. The subsamples of these two groups of individuals are referred to as the Osaka sample and the Kyoto sample.
It is important to note that the additional activity is not limited to nonwork activities (e.g., shopping, personal business, and social recreation) but includes businessrelated activities, such as attending a conference held outside the office base. In this respect the data sets of this study are quite different from those used in the previous analyses of two-stop chains, in which the additional activity is limited to nonwork activities. The main reason for including business-related activities is that business trips account for a large percentage of total trips made by workers in the metropolitan areas of Japan. For example, business trips in Osaka in 1980 accounted for 31.8 percent
of total person trips, while work trips accounted for 26.9 percent, nonwork trips 9.9 percent, and home trips 31.4 percent. Also, workers tend to integrate business activities into their daily travel. For example, in Osaka in 1980, 21.4 percent of business trips were made in home-businesswork or work-business-home chains, 57 .0 percent in officebased chains, and 21.6 percent in separate home-based chains. It is likely that business-related activities influence the formation of workers' trip chains significantly.
Temporal and Spatial Stability of the Distribution of Path Types
The distributions of path types involving two stops are presented in Table 3 for the Osaka and Kyoto subsamples in 1970 and 1980, respectively. The table indicates that the additional activity was pursued most frequently in
Nishii et al.
office-based chains during work and in single-chain paths after work. The percentage of before-work engagement and multichain after-work engagement is less than 30 percent and shows a decrease in 1980.
Office-based engagement increased substantially between 1970 to 1980 in both Osaka and Kyoto. At the same time the fraction of after-work engagement in Osaka decreased from 57.5 percent in 1970 to 40.9 percent in 1980; that in Kyoto decreased from 61.8 percent to 49.9 percent during the same period. This tabulation thus offers ample evidence that the distribution of path types is not stable over time. Comparing the Osaka and Kyoto samples, it can be found that the percentage of multichain paths is smaller in Osaka than in Kyoto, for both before-work and after-work engagements. These differences are presumably due to longer commuting durations in the much larger Osaka metropolitan area.
The increase in during-work engagement may be a factor leading to the increase in trip rates between 1970 and 1980 shown in Table 2. Figure 3 shows the distribution of the mode used for the additional trip by path type (the rail mode includes bus). Notable is the considerable decrease in walk trips and the increase in trips by "other" modes found in multichain paths, both before work and after
time 22:00
20:00
18 :00
16:00
14:00
12:00
10:00
08:00
06:00
before work
- : In-home activity
I I : In-office activity
55
work. This reflects the surge in bicycle use that took place in Japan between 1970 and 1980.
In case of during-work engagement, the differences between 1970 and 1980 are due to the increase in walk trips and the decrease in car trips. Although statistical data do not offer a direct explanation for this sharp increase, it presumably is due to the increase in nonwork activities outside the office base, especially eating meals, during the lunch break. Trip generation for shopping, eating meals, and social recreation increased by 25 percent in 1980, and the frequency of restaurants as a destination land use type more than doubled.
Temporal Stability in Time Use
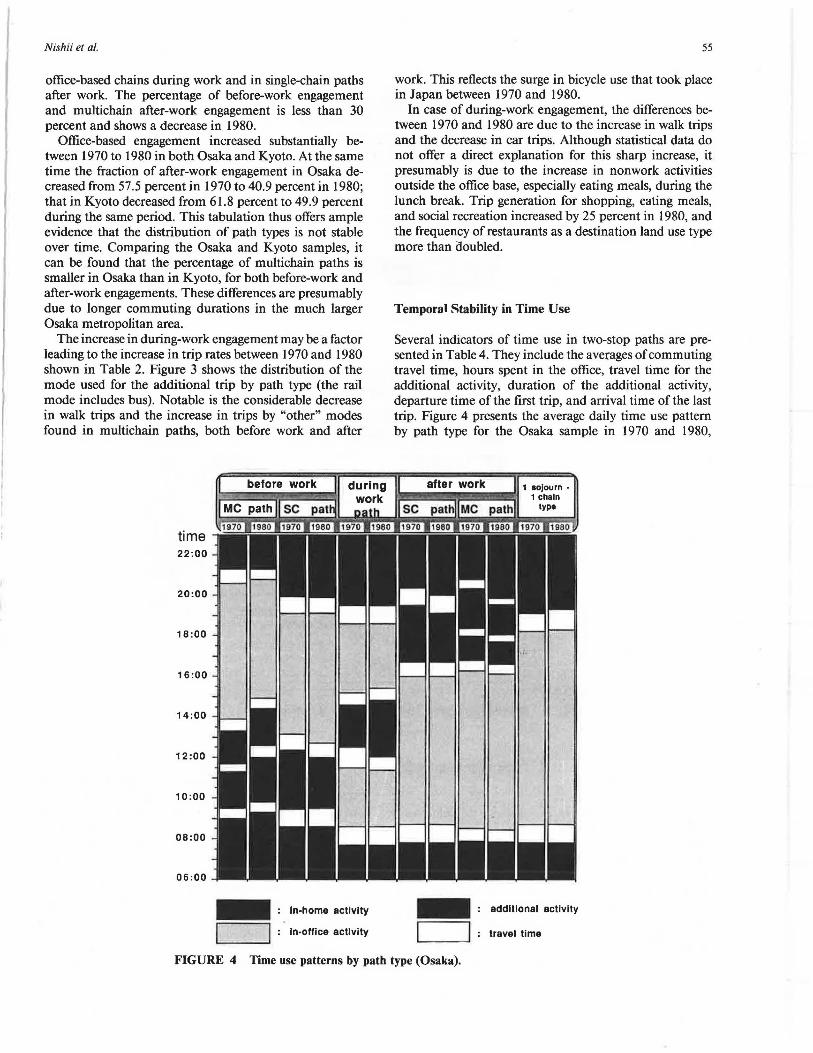
Several indicators of time use in two-stop paths are presented in Table 4. They include the averages of commuting travel time, hours spent in the office, travel time for the additional activity, duration of the additional activity, departure time of the first trip, and arrival time of the last trip. Figure 4 presents the average daily time use pattern by path type for the Osaka sample in 1970 and 1980,
after work
- addltlonal activity
j I travel time
FIGURE 4 Time use patterns by path type (Osaka).
56 TRANSPORTATION RESEAR CH RECORD 1203
Path Type (Osaka In 1970) i;;;;;;;;;;;;;;;;;;;;;;;;;;;;;;;;;;;;;;;;;;;;;;;;;;;;;;;;;;;;;;;;;;;;;;;;;;;;;;;;;;;;;;;;;;;;;;;;;;;;;;:::==::;::::====;;;;;;;;;;;;;;;;i
Before Wor1< Multl-chaln Path
Before Wor1< Slngle-chaln Path
During Wor1< Path
Alter Wor1< Slngle-chaln Path
Alter Wor1< Multl-chaln Path
0 20 40 60 80 iOO
Percentage of Work Trip Duration (%)
Before Work Multl·chaln Path
Before Work Slngle-chaln Path
During Wor1< Path
Alter Wor1< Slngle-chaln Path
Alter Wor1< Multl-chaln Path
0 20 40 60 90 100
• less10mln m 11·20mln Percentage of Work Trip Duration
(%)
• 21·30mln ~ 31·40mln D 41-50mln D 51·60mln
~ 60mlnover
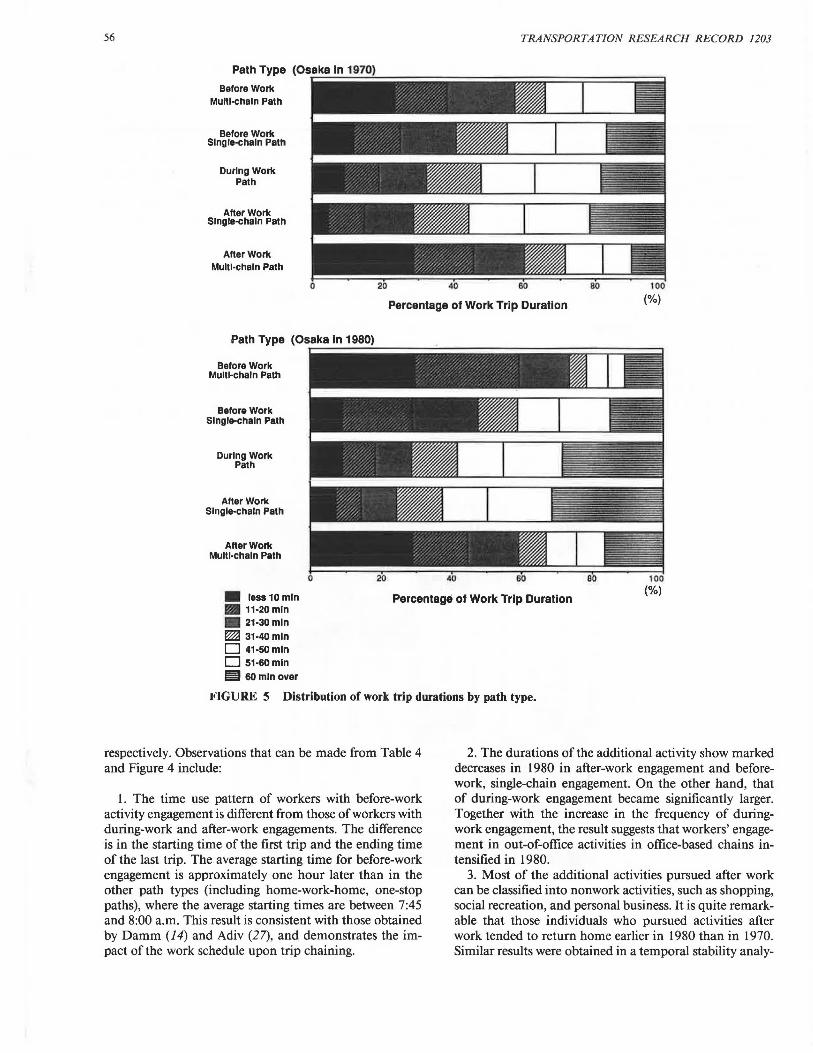
l<'IGURE 5 Distribution of work trip durations by path type.
respectively. Observations that can be made from Table 4 and Figure 4 include:
1. The time use pattern of workers with before-work activity engagement is different from those of workers with during-work and after-work engagements. The difference is in the starting time of the first trip and the ending time of the last trip. The average starting time for before-work engagement is approximately one hour later than in the other path types (including home-work-home, one-stop paths), where the average starting times are between 7:45 and 8:00 a.m. This result is consistent with those obtained by Damm (14) and Adiv (27), and demonstrates the impact of the work schedule upon trip chaining.
2. The durations of the additional activity show marked decreases in 1980 in after-work engagement and beforework, single-chain engagement. On the other hand, that of during-work engagement became significantly larger. Together with the increase in the frequency of duringwork engagement, the result suggests that workers' engagement in out-of-office activities in office-based chains intensified in 1980.
3. Most of the additional activities pursued after work can be classified into nonwork activities, such as shopping, social recreation, and personal business. It is quite remarkable that those individuals who pursued activities after work tended to return home earlier in 1980 than in 1970. Similar results were obtained in a temporal stability analy-
Nishii et al.
sis using data from the Southeast Michigan area in 1965 and 1980 (32).
In summary, the statistical analysis thus far has indicated that there were considerable changes in the travel and outof-home activity patterns of workers between 1970 and 1980 in the Osaka and Kyoto areas.
ANALYSIS OF THE RELATIONSHIPS DERIVED FROM THE LINEAR-CITY MODEL
Figure 5 presents the distribution of path types in the Osaka data for 1970 and 1980 against commuting trip duration. With a x 2 value of 226.4 ( df = 24) in 1970 and 301.9 (df= 24) in 1980, the contingency tables underlying the figure indicate an extremely significant association between the two factors. Commuting travel time corresponds to L/v and, given v, it is proportional to L. An inspection of the figure indicates that the likelihood of multichain paths decreases as commuting trip duration
Trip Mode (Osaka in 1970)
Walk
Bicycle Motorcycle
Car
Public transit
0 20
Trip Mode (Osaka In 1980)
Walk
Bicycle Motorcycle
Car
Public transit
• • • ~ D
0
MC BeforeWork
SC Before Work
During Work
SC After Work
MC After Work
57
increases. The tendency is consistent with the theoretical result that aDU/aL < 0.
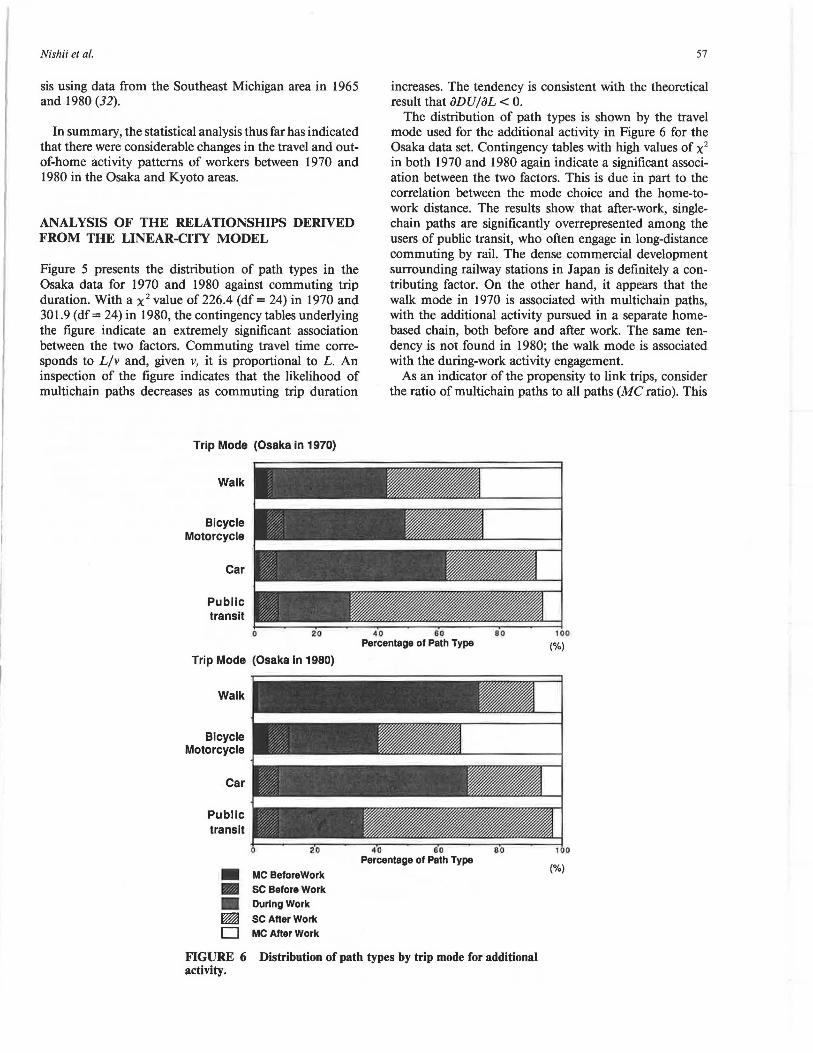
The distribution of path types is shown by the travel mode used for the additional activity in Figure 6 for the Osaka data set. Contingency tables with high values of x2
in both 1970 and 1980 again indicate a significant association between the two factors. This is due in part to the correlation between the mode choice and the home-towork distance. The results show that after-work, singlechain paths are significantly overrepresented among the users of public transit, who often engage in long-distance commuting by rail. The dense commercial development surrounding railway stations in Japan is definitely a contributing factor. On the other hand, it appears that the walk mode in 1970 is associated with multichain paths, with the additional activity pursued in a separate homebased chain, both before and after work. The same tendency is not found in 1980; the walk mode is associated with the during-work activity engagement.
As an indicator of the propensity to link trips, consider the ratio of multichain paths to all paths (MC ratio). This
40 60 80 Percentage of Path Type
40 60 Percentage of Path Type
100
(%)
(%)
FIGURE 6 Distribution of path types by trip mode for additional activity.

58 TRANSPORTATION RESEARCH RECORD 1203
TABLE 5 RELATIONSHIP BETWEEN TRIP ratio is shown in Table 5 by trip mode (private car vs. rail, MODE AND MC RA TIO BY HOME LOCATION including bus). To control for commuting distance, the (OSAKA) 1970
Home location Mode
Rail North-Osaka
Car
Rail East -Osaka
Car
South East Rail Osaka Car
Rail South-Osaka
Car
Rail Osaka city
Car
1 980
Home .location Mode
Rail North-Osaka
Car
Rail East -Osaka
Car
South East Rail Osaka Car
Rail South-Osaka
Car
Ra il Osaka city
Car
tabulation is prepared by residential zones as shown in Figure 7. Except for one case, the faster mode with a
No. of paths MC ratio Mean work smaller average trip duration has a larger MC ratio. The MC Toi al trip durallon table thus offers empirical evidence in support of the 55 768 7.3(%) 46.7 (min) theoretical result that aDU/av > 0. 22 163 13.5. 37.4 • The tendencies just discussed are found in general in 53 640 8.3 47.1 both the 1970 and 1980 data. The results indicate that 14 150 9.3. 41 .8 • time and space constraints do influence workers' trip 19 244 7 .8 52.7 chaining behavior in important ways. The results also
5 51 9.8. 50.3 • point to the important effects the commuting distance and 37 454 8.1 52 .6 speed of travel have upon trip chaining. 14 78 17.9. 46 .2 •
200 1084 18 .5 33 .1 CONCLUSION 82 387 21.2. 22 .5 •
A model of trip chaining behavior under time-space con-
No. of paths Mean work straints was developed in this study; the likelihood of
MC ratio combining stops into multistop chains is related to param-MC Total trip duration
32 788 4.1(%) 47 .1 (min) eters that characterize an urban area. The analysis was concerned with workers' trip chaining behavior where a
7 166 4.2. 47 .0 • nonwork activity is introduced to the basic home-work-
33 698 4.7 47 .8 • home chain. The theoretical results indicated that the
15 140 10.7. 49 .7 likelihood of pursuing an addjtional activity in a separate
12 228 5.3 55 1 home--based chain will increase witb the speed of travel,
6.8. 53 .5 • 3 44 and that ofmultistop chains will increase with commuting 23 454 5.1. 55 .2 • distance, travel cost, an<l the densiiy of opportunities.
3 71 4.2 58 .1 The empirical results using data sets from two areas and 80 775 10 .3 34.3 two points in time support the relation between commut-37 280 13.2 . 24 .9 • ing distance and trip chaining. In addition the results
Os11k11 19111'
Pref. N
(km)
0
FIGURE 7 Study area and zoning.
20 40

Nishii et al.
support the theoretically obtained relation that faster travel speed encourages activity participation in one-stop chains. The empirical analyses also showed that trip chaining does not remain stable over time despite the fact that trip rates are very stable. In particular, a drastic increase in officebased, nonwork activity engagement on foot was found between 1970 and 1980.
ACKNOWLEDGMENT
Funding for this study was provided through a grant from the National Science Foundation to the University of California, Davis.
REFERENCES
1. T. Hagerstrand. What About People in Regional Science? Papers of Regional Science Association, 24, 1970, pp. 7-21.
2. P. M. Jones, M. C. Dix , M. J. Clarke, and I. 0. Heggie. Understanding Travel Behavior. Gower, Aldershot, England, 1983.
3. K. Kondo and R. Kitamura. Time-Space Constraints and the Formation of Trip Chains. Regional Science and Urban Economics, 17, 1987, pp. 49-65.
4. K. G. Ooulias and R. Kitamura. On the Spatial Distribution of Linked Trips in a Uniform Two-Dimensional Space. Unpublished paper. University of California, Department of Civil Engineering, Davis, 1988.
5. T. Sasaki. Estimation of Person Trip Patterns Through Markov Chains. In Traffic Flow and Transportation (G. F. Newell, ed.), American Elsevier, New York, 1972, pp. 119-130.
6. K. Kondo. Estimation of Person Trip Patterns and Modal Split. In Transportation and Traffic Theory(D. Buckley, ed.), Elsevier, New York, 1974, pp. 715-742.
7. K. Nishii and T. Sasaki. An Analysis of Travel Patterns and Modal Split in a Business Trip Chaining. Proceedings of World Co11ference on Transport Research, forthcoming (1986).
8. S. R. Lerman. The Use of Disaggregate Choice Models in Semi-Markov Process Models of Trip Chaining Behavior. Transportation Science, 13, 1979, pp. 273-291.
9. R. Kitamura and T. N. Lam. A Time Dependent Markov Renewal Model of Trip Chaining. In Proceedings of the Eighth lnlernalional Symposium 011 Transportalion and Traffic Theory (V. F. Hurdle, E. Hauer and G. N. Steuart eds.), University of Toronto Press, Toronto, Canada, 1983, pp. 376-402.
10. M. E. O'Ke11y. A Model of the Demand for Retail Facilities, Incorporating Multistop, Multipurpose Trips. Geographical Analysis, 13, 1981, pp. 134-148.
11. A. Borgers and H. Timmermans. A Model of Pedestrian Route Choice and Demand for Retail Facilities within InnerCity Shopping Areas. Geographical Analysis, 18, 1986, pp. 115-128.
12. S. Hanson. Urban-Travel Linkages: A Review. In Behavioral Travel Modelling (D. Hensher and P. Stopher, eds.), Croom Helm, London, 1979, pp. 81-100.
13. F. S. Chapin. Human Activity Patterns in the City. John Wiley and Sons, New York, 1974.
14. D. Damm. Parameters of Activity Behavior for Use in Travel Analysis. Transportation Research, Vol. 16A, No. 2, 1982, pp. 135-148.
59
15. W. W. Recker, M. G. McNally, and G. S. Root. A Model of Complex Travel Behavior: Part I-Theoretical Development and Part II-An Operational Model. Transportation Research, 20A, 1986, pp. 307-318 and 319-330.
16. J. Horowitz. A Utility Maximizing Model of the Demand for Multidestination Non-Work Travel. Transportation Research, 14B, 1980, pp. 369-386.
17. T. Adler and M. Ben-Akiva. A Theoretical and Empirical Model of Trip Chaining Behavior. Transportation Research, 13B, 1979,pp.243-257.
18. T. van der Hoom. Experiments with an Activity-Based Travel Model. Transportation, 12, 1983, pp. 61-77.
19. T. van der Hoom. Development of an Activity Model Using a One-Week Activity-Diary Data Base. In Recent Advances in Travel Demand Analysis (S. Carpenter and P. Jones, eds.), Gower, Aldershot, England, 1983, pp. 335-349.
20. R. Kitamura and M. Kermanshah. Identifying Time and History Dependencies of Activity Choice. Transportation Research Record 944, TRB, National Research Council, Washington D.C., 1983, pp. 22-30.
21. R. Kitamura and M. Kermanshah. A Sequential Model of Interdependent Activity and Destination Choice. Transportation Research Record 987, TRB, National Research Council, Washington, D.C., 1984, pp. 81-89.
22. F. Southworth. Multi-Destination, Multi-Purpose Trip Chaining and Its Implications for Locational Accessibility: A Simulation Approach. Papers of the Regional Science Association, 57, 1985, pp. 107-123.
23. D. Swiderski. A Model for Simulating Spatially and Temporally oordinated Activity Sequences on the Basis of Mental Maps. In Recenl Advances in Tral'el Demand A 11alysis (S. Carpenter and P. Jones, eds.), Gower, Aldershot, England, 1983, pp. 313-334.
24. R. Kitamura, T. N. Lam, and N. Hioki. Stochastic Simulation of the Temporal and Spatial Interactions in Urban Travel. In 1983 Winter Simulation Conference Proceedings, Vol. I. Institute of Electrical and Electronics Engineers, New York, 1983, pp. 289-299.
25. C. V. Oster. The Second Role of the Work Trip: Visiting Non-work Destination. Transportation Research Record 728, TRB, National Research Council, Washington, D.C., 1979, pp. 79-81.
26. S. Hanson. The Importance of Multipurpose Journey to Work in Urban Travel Behavior. Transportation, 9, 1980, pp. 229-248.
27. A. Adiv. The Structure of the Work-Trip Based on Analysis of Trip Diaries in the San Francisco Bay Area. In Recent Advances in Travel Demand Analysis (S. Carpenter and P. Jones, eds.), Gower, Aldershot, England, 1983, pp. 117-136.
28. T. F. Golob. A Descriptive Analysis of Trip-Chaining Behaviour in the Netherlands. In Proceedings, Seminar H, PTRC Summer Annual Meeting, PTRC Education and Research Service, London, 1984.
29. J. C. Thill. Demand in Space and Multipurpose Shopping: A Theoretical Approach. Geographical Analysis, 17, 1985, pp. 114-129.
30. R. Kitamura. Recent Developments in Trip Chaining Analysis. Paper Presented at the PTRC Summer Annual Meeting, Bath, England, 1987.
31. L. D. Bums. Transportation, Temporal, and Spatial Components of Accessibility. D.C. Heath, Lexington, Mass. 1979.
32. L. P. Kostyniuk and R. Kitamura. Temporal Stability of Urban Travel Patterns. Transportation Policy and Transportation Decision Making, 2, 1984, pp. 481-500.
Publication of this paper sponsored by Committee on Traveler Behavior and Values.