Embed Size (px)
Citation preview

Emphysema diagnosis using X-ray dark-field imagingat a laser-driven compact synchrotron light sourceSimone Schleedea,1, Felix G. Meinelb, Martin Becha,c, Julia Herzena, Klaus Achterholda, Guillaume Potdevina,Andreas Maleckia, Silvia Adam-Neumaird, Sven F. Thiemeb, Fabian Bambergb, Konstantin Nikolaoub, Alexander Bohlae,Ali Ö. Yildirime, Roderick Loewenf, Martin Giffordf, Ronald Ruthg, Oliver Eickelberge, Maximilian Reiserb,and Franz Pfeiffera
aDepartment of Physics and Institute of Medical Engineering, Technische Universität München, 85748 Garching, Germany; bInstitute for Clinical Radiology,Ludwig-Maximilians-University Hospital Munich, 81377 Munich, Germany; cMedical Radiation Physics, Lund University, 22185 Lund, Sweden; dAnatomyDepartment, Ludwig-Maximilians-University Munich, 80336 Munich, Germany; eComprehensive Pneumology Center, Institute of Lung Biology and Disease,Helmholtz Zentrum Munich, 85764 Neuherberg, Germany; fLyncean Technologies, Inc., Palo Alto, CA 94306; and gSLAC National Accelerator Laboratory,Menlo Park, CA 94025
Edited by Joe W. Gray, Oregon Health and Science University, Portland, OR, and accepted by the Editorial Board September 20, 2012 (received for reviewMay 7, 2012)
In early stages of various pulmonary diseases, such as emphysemaand fibrosis, the change in X-ray attenuation is not detectablewith absorption-based radiography. To monitor the morphologi-cal changes that the alveoli network undergoes in the progressionof these diseases, we propose using the dark-field signal, whichis related to small-angle scattering in the sample. Combined withthe absorption-based image, the dark-field signal enables betterdiscrimination between healthy and emphysematous lung tissuein a mouse model. All measurements have been performed at 36keV using a monochromatic laser-driven miniature synchrotronX-ray source (Compact Light Source). In this paper we presentgrating-based dark-field images of emphysematous vs. healthylung tissue, where the strong dependence of the dark-field signalon mean alveolar size leads to improved diagnosis of emphysemain lung radiographs.
grating interferometer | pulmonary emphysema | X-ray imaging
Chronic obstructive pulmonary disease (COPD) is one of theleading causes of morbidity and mortality worldwide (1, 2).
The disease is characterized by airflow limitation and lung in-flammation as a response to noxious particles or gases, resultingin a progressive deterioration in lung function and health-relatedquality of life (3, 4).Emphysema is a common component of COPD, in which air-
way obstruction and aberrant activity of proteolytic enzymes causeirreversible destruction of alveolar walls and enlargement of distalairspaces. Despite this altered lung morphology, emphysema isdifficult to detect with conventional radiographic imaging, becausethe decrease in lung tissue density in emphysema may be too smallto be appreciated. Chest X-ray is routinely used to screen patientswith suspected COPD for emphysema, although it is known thatchest X-rays lack sensitivity in mild to moderate emphysema (5).Currently, screening for and early diagnosis of COPD and em-physema largely relies on spirometric lung function tests (6).Spirometry, however, strongly depends on patients’ cooperationand is unable to localize emphysematous changes within the lung.Assessing the regional distribution of pulmonary emphysema iscrucial for clinical decision-making regarding lung volume re-duction surgery and insertion of endobronchial valves (7, 8).Emphysema imaging has been greatly improved with high-reso-lution computed tomography (HRCT), but its use is limited by thehigher radiation dose applied to the patient (5). Some studies havesuggested that MRI may complement CT in the imaging of em-physema (5). However, because MRI is time-consuming, expen-sive, less available, and prone to breathing artifacts, MRI iscurrently not established in routine imaging of COPD. Directassessment of microstructural changes in the alveolar networkwould be desirable to evaluate disease progression and monitortherapy, but this can currently only be achieved through histopa-thology, which requires invasive biopsy. Especially in early stages
of the disease, identification, precise quantification, and localiza-tion of emphysema through grating-based X-ray projection im-aging could significantly improve COPD diagnosis and therapy,and avoid the higher radiation exposure associated with CT.Phase-contrast imaging can significantly increase the visibility of
lung tissue in single projections, as demonstrated by several othergroups (9–11); it has also been shown to improve the diagnosticsof pulmonary diseases (12). Multiple air-tissue interfaces presentin the inflated lung result in a high degree of X-ray phase contrastand low absorption contrast. Among the phase-contrast imagingmethods available—namely, interferometric methods, propaga-tion-based methods, and analyzer-based methods—the latter twowere intensively studied in lung imaging (9, 13, 14).In propagation-based imaging (PBI), the sample is illuminated
by a spatially partially coherent source, which creates a Fresneldiffraction pattern after a certain propagation distance behindthe sample. This pattern serves as the so-called edge-enhancedimage. Propagation-based methods have been applied to mouse,rat, and rabbit lungs and show a speckled intensity pattern that isattributed to the air-filled alveoli acting as aberrated compoundrefractive lenses (15). Using a single distance from sample todetector, PBI does not allow for a quantitative analysis of lungprojections, due to the a priori assumption of a single-materialobject composition (16). In addition to a high-brilliance X-raysource, a high-resolution detector is needed to resolve the re-fraction-induced interference fringes.In diffraction enhanced imaging (DEI) or analyzer-based im-
aging (ABI) a perfect crystal analyzer is mounted between theobject and the detector. This approach requires a high mono-chromatic flux, typically from a large-scale synchrotron X-raysource. Reflection from the analyzer crystal only occurs for X-raysin a small angular range meeting the Bragg condition of thecrystal. Tilting the crystal while monitoring the intensity in eachpixel generates a rocking curve, from which absorption, phase, andsmall-angle scattering information of the sample can be extracted(17, 18). An application of this technique to mouse lung meas-urements has been demonstrated by Kitchen et al. (19). The so-called scatter rejection or extinction contrast is produced at only
Author contributions: F.G.M., M.B., J.H., K.A., S.F.T., F.B., K.N., A.Ö.Y., R.L., M.G., R.R., O.E.,M.R., and F.P. designed research; S.S., F.G.M., M.B., J.H., K.A., G.P., A.M., S.A.-N., F.B., A.B.,R.L., M.G., R.R., and F.P. performed research; S.S., F.G.M., M.B., J.H., S.A.-N., A.B., andA.Ö.Y. analyzed data; and S.S., F.G.M., M.B., J.H., F.B., K.N., R.R., M.R., and F.P. wrotethe paper.
Conflict of interest statement: R.R.’s contributions to this publication were as a paidconsultant of Lyncean Technologies, Inc. and were not part of his Stanford Universityduties or responsibilities.
This article is a PNAS Direct Submission. J.W.G. is a guest editor invited by the EditorialBoard.1To whom correspondence should be addressed. E-mail: [email protected].
This article contains supporting information online at www.pnas.org/lookup/suppl/doi:10.1073/pnas.1206684109/-/DCSupplemental.
17880–17885 | PNAS | October 30, 2012 | vol. 109 | no. 44 www.pnas.org/cgi/doi/10.1073/pnas.1206684109
the peak position of the rocking curve, where the analyzer crystalrejects X-rays from small-angle scattering. With diffraction-en-hanced peak images, lung tissue can easily be distinguished fromthe surrounding soft tissue, leading to an improved discriminationbetween healthy and diseased lung tissue (12, 20). Comparingsingle-distance PBI and single rocking-angle DEI of mouse andrabbit lungs indicates that DEI yields images of superior contrastthan those for PBI, and both techniques show a significant contrastimprovement over conventional absorption radiographs (11). Theuse of DEI with laboratory sources suffers from low mono-chromatic flux and the resulting long exposure times, which arenot compatible with in vivo imaging applications (21, 22).Grating-based imaging yields phase and dark-field images that
are simultaneously obtained with the conventional attenuation-based X-ray image, thus providing three complementary imagemodalities that are intrinsically registered. More important, theattenuation, phase, and scattering contributions of the object areclearly separable using this technique. Unlike DEI, the grating-based interferometer supplies a large field of view and has alsobeen shown to work with polychromatic sources and in cone-beam geometry (23–26).Dark-field image contrast is created through changes in the
local scattering power of the sample. It is defined via the de-crease in visibility of the stepping curve when a scattering objectis inserted in the beam. For homogeneous specimens that showno or negligible small-angle scattering, the dark-field signal(relative visibility V) is close to unity, whereas strong scatteringsamples yield dark-field signals of V < 1.The relative visibility is directly related to small-angle scat-
tering and multiple refraction from microstructures with a scalemuch smaller than the spatial resolution of the imaging system(24, 27). This signal reveals structural information on thenanometer to hundreds-of-micrometers scale that is inaccessiblefrom both the absorption and the phase-contrast image (28, 29).Biomedical applications of dark-field contrast include bone im-aging (30, 31), calcifications in breast imaging (32), and toothimaging (33).In this paper, we use strong small-angle scattering from mouse
lungs in grating-based dark-field imaging. The distinct de-pendency of the dark-field signal on mean alveolar size leads toimproved diagnosis of emphysema in single projections.
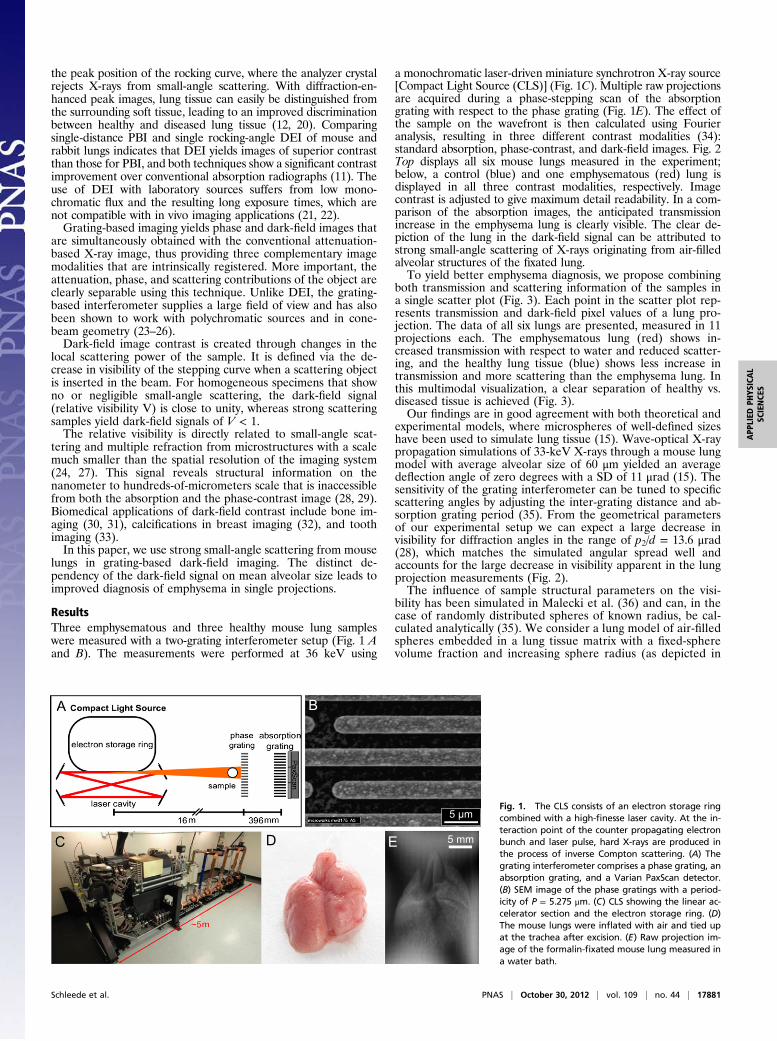
ResultsThree emphysematous and three healthy mouse lung sampleswere measured with a two-grating interferometer setup (Fig. 1 Aand B). The measurements were performed at 36 keV using
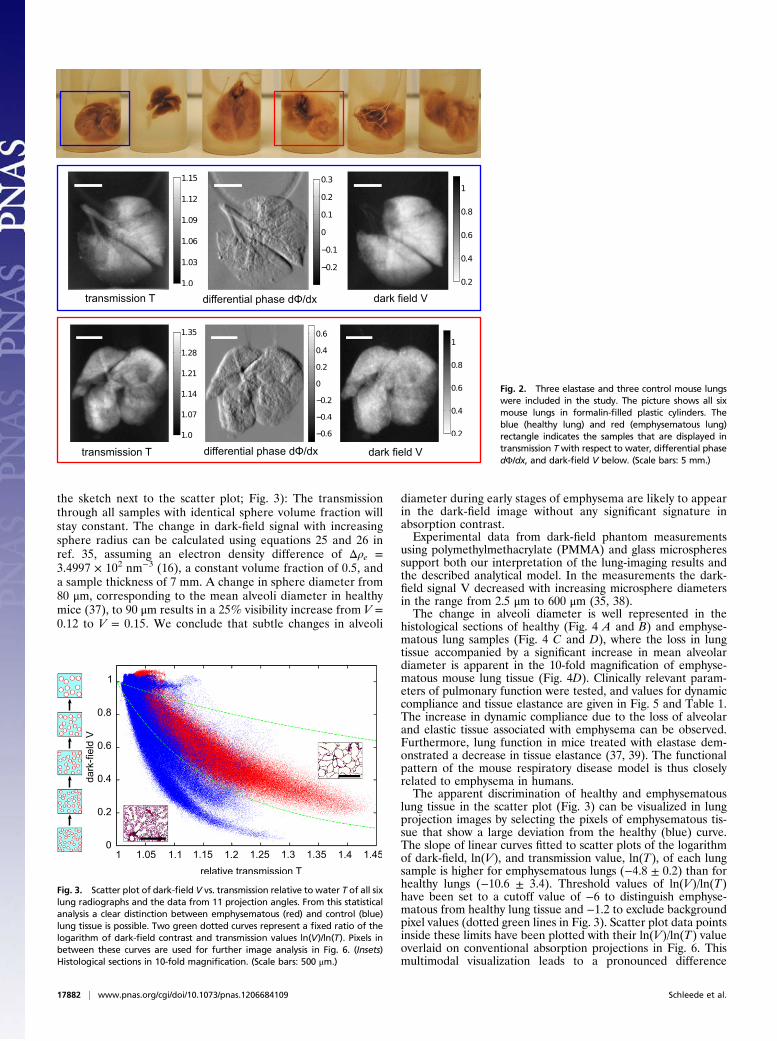
a monochromatic laser-driven miniature synchrotron X-ray source[Compact Light Source (CLS)] (Fig. 1C). Multiple raw projectionsare acquired during a phase-stepping scan of the absorptiongrating with respect to the phase grating (Fig. 1E). The effect ofthe sample on the wavefront is then calculated using Fourieranalysis, resulting in three different contrast modalities (34):standard absorption, phase-contrast, and dark-field images. Fig. 2Top displays all six mouse lungs measured in the experiment;below, a control (blue) and one emphysematous (red) lung isdisplayed in all three contrast modalities, respectively. Imagecontrast is adjusted to give maximum detail readability. In a com-parison of the absorption images, the anticipated transmissionincrease in the emphysema lung is clearly visible. The clear de-piction of the lung in the dark-field signal can be attributed tostrong small-angle scattering of X-rays originating from air-filledalveolar structures of the fixated lung.To yield better emphysema diagnosis, we propose combining
both transmission and scattering information of the samples ina single scatter plot (Fig. 3). Each point in the scatter plot rep-resents transmission and dark-field pixel values of a lung pro-jection. The data of all six lungs are presented, measured in 11projections each. The emphysematous lung (red) shows in-creased transmission with respect to water and reduced scatter-ing, and the healthy lung tissue (blue) shows less increase intransmission and more scattering than the emphysema lung. Inthis multimodal visualization, a clear separation of healthy vs.diseased tissue is achieved (Fig. 3).Our findings are in good agreement with both theoretical and
experimental models, where microspheres of well-defined sizeshave been used to simulate lung tissue (15). Wave-optical X-raypropagation simulations of 33-keV X-rays through a mouse lungmodel with average alveolar size of 60 μm yielded an averagedeflection angle of zero degrees with a SD of 11 μrad (15). Thesensitivity of the grating interferometer can be tuned to specificscattering angles by adjusting the inter-grating distance and ab-sorption grating period (35). From the geometrical parametersof our experimental setup we can expect a large decrease invisibility for diffraction angles in the range of p2/d = 13.6 μrad(28), which matches the simulated angular spread well andaccounts for the large decrease in visibility apparent in the lungprojection measurements (Fig. 2).The influence of sample structural parameters on the visi-
bility has been simulated in Malecki et al. (36) and can, in thecase of randomly distributed spheres of known radius, be cal-culated analytically (35). We consider a lung model of air-filledspheres embedded in a lung tissue matrix with a fixed-spherevolume fraction and increasing sphere radius (as depicted in
Fig. 1. The CLS consists of an electron storage ringcombined with a high-finesse laser cavity. At the in-teraction point of the counter propagating electronbunch and laser pulse, hard X-rays are produced inthe process of inverse Compton scattering. (A) Thegrating interferometer comprises a phase grating, anabsorption grating, and a Varian PaxScan detector.(B) SEM image of the phase gratings with a period-icity of P = 5.275 μm. (C) CLS showing the linear ac-celerator section and the electron storage ring. (D)The mouse lungs were inflated with air and tied upat the trachea after excision. (E) Raw projection im-age of the formalin-fixated mouse lung measured ina water bath.
Schleede et al. PNAS | October 30, 2012 | vol. 109 | no. 44 | 17881
APP
LIED
PHYS
ICAL
SCIENCE
S
the sketch next to the scatter plot; Fig. 3): The transmissionthrough all samples with identical sphere volume fraction willstay constant. The change in dark-field signal with increasingsphere radius can be calculated using equations 25 and 26 inref. 35, assuming an electron density difference of Δρe =3.4997 × 10² nm−3 (16), a constant volume fraction of 0.5, anda sample thickness of 7 mm. A change in sphere diameter from80 μm, corresponding to the mean alveoli diameter in healthymice (37), to 90 μm results in a 25% visibility increase from V =0.12 to V = 0.15. We conclude that subtle changes in alveoli
diameter during early stages of emphysema are likely to appearin the dark-field image without any significant signature inabsorption contrast.Experimental data from dark-field phantom measurements
using polymethylmethacrylate (PMMA) and glass microspheressupport both our interpretation of the lung-imaging results andthe described analytical model. In the measurements the dark-field signal V decreased with increasing microsphere diametersin the range from 2.5 μm to 600 μm (35, 38).The change in alveoli diameter is well represented in the
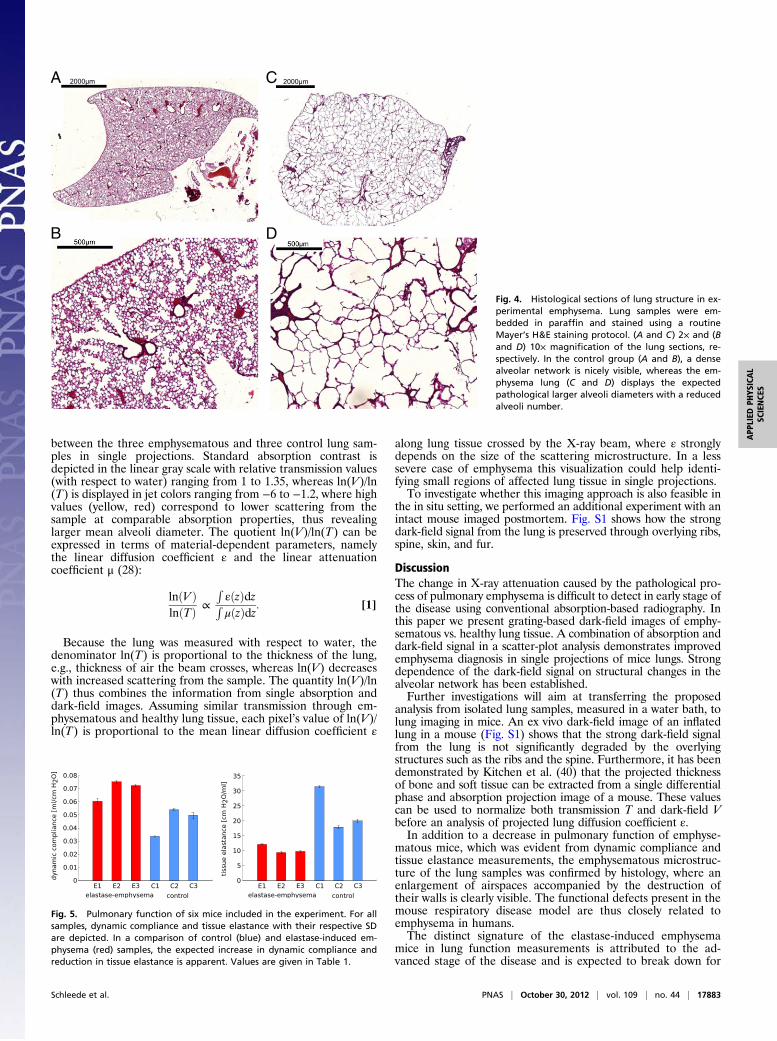
histological sections of healthy (Fig. 4 A and B) and emphyse-matous lung samples (Fig. 4 C and D), where the loss in lungtissue accompanied by a significant increase in mean alveolardiameter is apparent in the 10-fold magnification of emphyse-matous mouse lung tissue (Fig. 4D). Clinically relevant param-eters of pulmonary function were tested, and values for dynamiccompliance and tissue elastance are given in Fig. 5 and Table 1.The increase in dynamic compliance due to the loss of alveolarand elastic tissue associated with emphysema can be observed.Furthermore, lung function in mice treated with elastase dem-onstrated a decrease in tissue elastance (37, 39). The functionalpattern of the mouse respiratory disease model is thus closelyrelated to emphysema in humans.The apparent discrimination of healthy and emphysematous
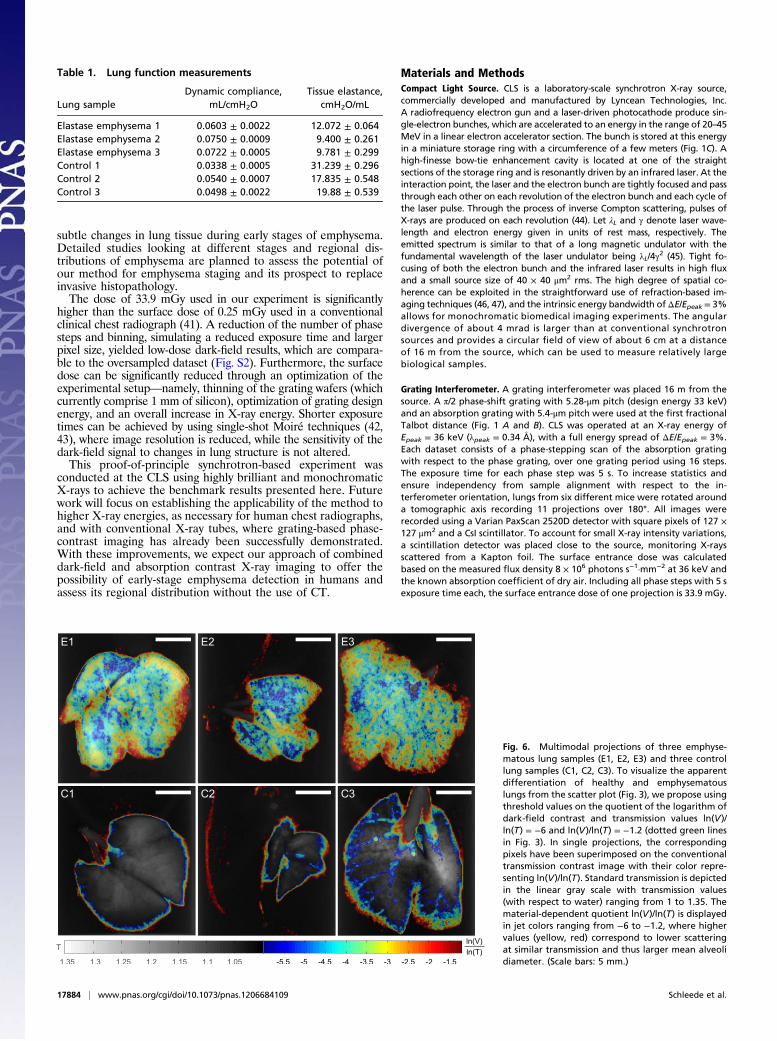
lung tissue in the scatter plot (Fig. 3) can be visualized in lungprojection images by selecting the pixels of emphysematous tis-sue that show a large deviation from the healthy (blue) curve.The slope of linear curves fitted to scatter plots of the logarithmof dark-field, ln(V), and transmission value, ln(T), of each lungsample is higher for emphysematous lungs (−4.8 ± 0.2) than forhealthy lungs (−10.6 ± 3.4). Threshold values of ln(V)/ln(T)have been set to a cutoff value of −6 to distinguish emphyse-matous from healthy lung tissue and −1.2 to exclude backgroundpixel values (dotted green lines in Fig. 3). Scatter plot data pointsinside these limits have been plotted with their ln(V)/ln(T) valueoverlaid on conventional absorption projections in Fig. 6. Thismultimodal visualization leads to a pronounced difference
Fig. 2. Three elastase and three control mouse lungswere included in the study. The picture shows all sixmouse lungs in formalin-filled plastic cylinders. Theblue (healthy lung) and red (emphysematous lung)rectangle indicates the samples that are displayed intransmission T with respect to water, differential phasedΦ/dx, and dark-field V below. (Scale bars: 5 mm.)
Fig. 3. Scatter plot of dark-field V vs. transmission relative to water T of all sixlung radiographs and the data from 11 projection angles. From this statisticalanalysis a clear distinction between emphysematous (red) and control (blue)lung tissue is possible. Two green dotted curves represent a fixed ratio of thelogarithm of dark-field contrast and transmission values ln(V)/ln(T). Pixels inbetween these curves are used for further image analysis in Fig. 6. (Insets)Histological sections in 10-fold magnification. (Scale bars: 500 μm.)
17882 | www.pnas.org/cgi/doi/10.1073/pnas.1206684109 Schleede et al.
between the three emphysematous and three control lung sam-ples in single projections. Standard absorption contrast isdepicted in the linear gray scale with relative transmission values(with respect to water) ranging from 1 to 1.35, whereas ln(V)/ln(T) is displayed in jet colors ranging from −6 to −1.2, where highvalues (yellow, red) correspond to lower scattering from thesample at comparable absorption properties, thus revealinglarger mean alveoli diameter. The quotient ln(V)/ln(T) can beexpressed in terms of material-dependent parameters, namelythe linear diffusion coefficient ε and the linear attenuationcoefficient μ (28):
lnðV ÞlnðTÞ ∝
RεðzÞdz
RμðzÞdz: [1]
Because the lung was measured with respect to water, thedenominator ln(T) is proportional to the thickness of the lung,e.g., thickness of air the beam crosses, whereas ln(V) decreaseswith increased scattering from the sample. The quantity ln(V)/ln(T) thus combines the information from single absorption anddark-field images. Assuming similar transmission through em-physematous and healthy lung tissue, each pixel’s value of ln(V)/ln(T) is proportional to the mean linear diffusion coefficient ε
along lung tissue crossed by the X-ray beam, where ε stronglydepends on the size of the scattering microstructure. In a lesssevere case of emphysema this visualization could help identi-fying small regions of affected lung tissue in single projections.To investigate whether this imaging approach is also feasible in
the in situ setting, we performed an additional experiment with anintact mouse imaged postmortem. Fig. S1 shows how the strongdark-field signal from the lung is preserved through overlying ribs,spine, skin, and fur.
DiscussionThe change in X-ray attenuation caused by the pathological pro-cess of pulmonary emphysema is difficult to detect in early stage ofthe disease using conventional absorption-based radiography. Inthis paper we present grating-based dark-field images of emphy-sematous vs. healthy lung tissue. A combination of absorption anddark-field signal in a scatter-plot analysis demonstrates improvedemphysema diagnosis in single projections of mice lungs. Strongdependence of the dark-field signal on structural changes in thealveolar network has been established.Further investigations will aim at transferring the proposed
analysis from isolated lung samples, measured in a water bath, tolung imaging in mice. An ex vivo dark-field image of an inflatedlung in a mouse (Fig. S1) shows that the strong dark-field signalfrom the lung is not significantly degraded by the overlyingstructures such as the ribs and the spine. Furthermore, it has beendemonstrated by Kitchen et al. (40) that the projected thicknessof bone and soft tissue can be extracted from a single differentialphase and absorption projection image of a mouse. These valuescan be used to normalize both transmission T and dark-field Vbefore an analysis of projected lung diffusion coefficient ε.In addition to a decrease in pulmonary function of emphyse-
matous mice, which was evident from dynamic compliance andtissue elastance measurements, the emphysematous microstruc-ture of the lung samples was confirmed by histology, where anenlargement of airspaces accompanied by the destruction oftheir walls is clearly visible. The functional defects present in themouse respiratory disease model are thus closely related toemphysema in humans.The distinct signature of the elastase-induced emphysema
mice in lung function measurements is attributed to the ad-vanced stage of the disease and is expected to break down for
A
B
C
D
Fig. 4. Histological sections of lung structure in ex-perimental emphysema. Lung samples were em-bedded in paraffin and stained using a routineMayer’s H&E staining protocol. (A and C) 2× and (Band D) 10× magnification of the lung sections, re-spectively. In the control group (A and B), a densealveolar network is nicely visible, whereas the em-physema lung (C and D) displays the expectedpathological larger alveoli diameters with a reducedalveoli number.
Fig. 5. Pulmonary function of six mice included in the experiment. For allsamples, dynamic compliance and tissue elastance with their respective SDare depicted. In a comparison of control (blue) and elastase-induced em-physema (red) samples, the expected increase in dynamic compliance andreduction in tissue elastance is apparent. Values are given in Table 1.
Schleede et al. PNAS | October 30, 2012 | vol. 109 | no. 44 | 17883
APP
LIED
PHYS
ICAL
SCIENCE
S
subtle changes in lung tissue during early stages of emphysema.Detailed studies looking at different stages and regional dis-tributions of emphysema are planned to assess the potential ofour method for emphysema staging and its prospect to replaceinvasive histopathology.The dose of 33.9 mGy used in our experiment is significantly
higher than the surface dose of 0.25 mGy used in a conventionalclinical chest radiograph (41). A reduction of the number of phasesteps and binning, simulating a reduced exposure time and largerpixel size, yielded low-dose dark-field results, which are compara-ble to the oversampled dataset (Fig. S2). Furthermore, the surfacedose can be significantly reduced through an optimization of theexperimental setup—namely, thinning of the grating wafers (whichcurrently comprise 1 mm of silicon), optimization of grating designenergy, and an overall increase in X-ray energy. Shorter exposuretimes can be achieved by using single-shot Moiré techniques (42,43), where image resolution is reduced, while the sensitivity of thedark-field signal to changes in lung structure is not altered.This proof-of-principle synchrotron-based experiment was
conducted at the CLS using highly brilliant and monochromaticX-rays to achieve the benchmark results presented here. Futurework will focus on establishing the applicability of the method tohigher X-ray energies, as necessary for human chest radiographs,and with conventional X-ray tubes, where grating-based phase-contrast imaging has already been successfully demonstrated.With these improvements, we expect our approach of combineddark-field and absorption contrast X-ray imaging to offer thepossibility of early-stage emphysema detection in humans andassess its regional distribution without the use of CT.
Materials and MethodsCompact Light Source. CLS is a laboratory-scale synchrotron X-ray source,commercially developed and manufactured by Lyncean Technologies, Inc.A radiofrequency electron gun and a laser-driven photocathode produce sin-gle-electron bunches, which are accelerated to an energy in the range of 20–45MeV in a linear electron accelerator section. The bunch is stored at this energyin a miniature storage ring with a circumference of a few meters (Fig. 1C). Ahigh-finesse bow-tie enhancement cavity is located at one of the straightsections of the storage ring and is resonantly driven by an infrared laser. At theinteraction point, the laser and the electron bunch are tightly focused and passthrough each other on each revolution of the electron bunch and each cycle ofthe laser pulse. Through the process of inverse Compton scattering, pulses ofX-rays are produced on each revolution (44). Let λL and γ denote laser wave-length and electron energy given in units of rest mass, respectively. Theemitted spectrum is similar to that of a long magnetic undulator with thefundamental wavelength of the laser undulator being λL/4γ2 (45). Tight fo-cusing of both the electron bunch and the infrared laser results in high fluxand a small source size of 40 × 40 μm2 rms. The high degree of spatial co-herence can be exploited in the straightforward use of refraction-based im-aging techniques (46, 47), and the intrinsic energy bandwidth ofΔE/Epeak = 3%allows for monochromatic biomedical imaging experiments. The angulardivergence of about 4 mrad is larger than at conventional synchrotronsources and provides a circular field of view of about 6 cm at a distanceof 16 m from the source, which can be used to measure relatively largebiological samples.
Grating Interferometer. A grating interferometer was placed 16 m from thesource. A π/2 phase-shift grating with 5.28-μm pitch (design energy 33 keV)and an absorption grating with 5.4-μm pitch were used at the first fractionalTalbot distance (Fig. 1 A and B). CLS was operated at an X-ray energy ofEpeak = 36 keV (λpeak = 0.34 Å), with a full energy spread of ΔE/Epeak = 3%.Each dataset consists of a phase-stepping scan of the absorption gratingwith respect to the phase grating, over one grating period using 16 steps.The exposure time for each phase step was 5 s. To increase statistics andensure independency from sample alignment with respect to the in-terferometer orientation, lungs from six different mice were rotated arounda tomographic axis recording 11 projections over 180°. All images wererecorded using a Varian PaxScan 2520D detector with square pixels of 127 ×127 μm2 and a CsI scintillator. To account for small X-ray intensity variations,a scintillation detector was placed close to the source, monitoring X-raysscattered from a Kapton foil. The surface entrance dose was calculatedbased on the measured flux density 8 × 10⁶ photons s−1·mm−2 at 36 keV andthe known absorption coefficient of dry air. Including all phase steps with 5 sexposure time each, the surface entrance dose of one projection is 33.9 mGy.
Table 1. Lung function measurements
Lung sampleDynamic compliance,
mL/cmH2OTissue elastance,
cmH2O/mL
Elastase emphysema 1 0.0603 ± 0.0022 12.072 ± 0.064Elastase emphysema 2 0.0750 ± 0.0009 9.400 ± 0.261Elastase emphysema 3 0.0722 ± 0.0005 9.781 ± 0.299Control 1 0.0338 ± 0.0005 31.239 ± 0.296Control 2 0.0540 ± 0.0007 17.835 ± 0.548Control 3 0.0498 ± 0.0022 19.88 ± 0.539
Fig. 6. Multimodal projections of three emphyse-matous lung samples (E1, E2, E3) and three controllung samples (C1, C2, C3). To visualize the apparentdifferentiation of healthy and emphysematouslungs from the scatter plot (Fig. 3), we propose usingthreshold values on the quotient of the logarithm ofdark-field contrast and transmission values ln(V)/ln(T) = −6 and ln(V)/ln(T) = −1.2 (dotted green linesin Fig. 3). In single projections, the correspondingpixels have been superimposed on the conventionaltransmission contrast image with their color repre-senting ln(V)/ln(T). Standard transmission is depictedin the linear gray scale with transmission values(with respect to water) ranging from 1 to 1.35. Thematerial-dependent quotient ln(V)/ln(T) is displayedin jet colors ranging from −6 to −1.2, where highervalues (yellow, red) correspond to lower scatteringat similar transmission and thus larger mean alveolidiameter. (Scale bars: 5 mm.)
17884 | www.pnas.org/cgi/doi/10.1073/pnas.1206684109 Schleede et al.
The dose level of this first in vitro study was not optimized and can be sig-nificantly decreased [e.g., by reducing the support thickness of the gratingstructures (factor 0.8), by reducing the exposure time (factor 0.25), or byusing four instead of 16 phase-steps (factor 0.25)].
Experimental Emphysema in Mice. Six- to 8-wk-old pathogen-free femaleC57BL/6N mice (Charles River Laboratories) were used throughout this study.Mice had free access to water and rodent laboratory chow. Pancreaticelastase was dissolved in sterile PBS and applied orotracheally (80 U/kg bodyweight). Control mice received 80 μL sterile PBS. All animal experiments werecarried out in strict accordance with the recommendations in the Guide forthe Care and Use of Laboratory Animals of the National Institutes of Health.The protocol was approved by the ethical committee of the regional gov-ernmental commission of animal protection (Munich).
To assess information on pulmonary function, the mice were anesthetized,tracheostomized, and connected to a Scireq flexiVent pulmonary functionsystem (EMKA Technologies). During the measurement, mice were ventilatedwith an average breathing frequency of 160/min. After amaximal vital capacityperturbation (total lung capacity), a snapshot perturbation maneuver wasapplied to determine the dynamic compliance of the whole respiratory systemaccording to the single compartment model. Then the forced oscillationtechnique perturbation maneuvers quick primewave-3 and primewave-8 wereconducted, resulting in tissue elastance. For each parameter, an average ofthree measurements per mouse was calculated and depicted. Mouse lungs
were excised 28 d after elastase application, inflated with air, and tied up atthe trachea (48) (Fig. 1C). The samples were put in formalin-filled plasticcontainers (Fig. 2) and measured in a water bath.
Histology. After washing to remove paraformaldehyde, lungs were decalcifiedin 10% (wt/vol) EDTA in H2O for 5 d. Subsequently, the specimens weredehydrated and embedded in paraffin. Multiple 10-μm thin sections wereprepared in the coronal plane at intervals of 0.5 mm to obtain representativesections covering the entire organ. Sections were deparaffinized, hydrated,stained using a routine Mayer’s H&E staining protocol, and dehydrated. Sec-tions were scanned at various magnifications to create digital images.
ACKNOWLEDGMENTS. We thank J. Hostens, B. Pauwels, A. Velroyen, andA. Yaroshenko for providing ex vivo mouse projection images. Support forthis work was provided by the Deutsche Forschungsgemeinschaft Cluster ofExcellence Munich Center for Advanced Photonics and European ResearchCouncil Seventh Framework Programme Starting Grant 240142 (to S.S., F.G.M.,M.B., J.H., K.A., G.P., A.M., S.A.-N., and F.P.). This work was partly carried outwith the support of the Karlsruhe Nano Micro Facility (KNMF; www.kit.edu/knmf), a Helmholtz Research Infrastructure at Karlsruhe Institute of Tech-nology (KIT; www.kit.edu). The Compact Light Source experiment was sup-ported in part by National Institute of General Medical Sciences Grant R44-GM074437 and National Center for Research Resources Grant R43-RR025730.S.S. and A.M. acknowledge the Technische Universität München GraduateSchool for the support of their studies.
1. Zvezdin B, et al. (2009) A postmortem analysis of major causes of early death inpatients hospitalized with COPD exacerbation. Chest 136(2):376–380.
2. Celli BR, MacNee W ATS/ERS Task Force (2004) Standards for the diagnosis and treat-ment of patients with COPD: A summary of the ATS/ERS position paper. Eur Respir J 23(6):932–946.
3. Minai OA, Benditt J, Martinez FJ (2008) Natural history of emphysema. Proc AmThorac Soc 5(4):468–474.
4. Ley-Zaporozhan J, Ley S, Kauczor HU (2008) Morphological and functional imaging inCOPD with CT and MRI: Present and future. Eur Radiol 18(3):510–521.
5. Washko GR (2010) Diagnostic imaging in COPD. Semin Respir Crit Care Med 31(3):276–285.
6. Soriano JB, Zielinski J, Price D (2009) Screening for and early detection of chronicobstructive pulmonary disease. Lancet 374(9691):721–732.
7. Sciurba FC, et al. (2010) A randomized study of endobronchial valves for advancedemphysema. N Engl J Med 363(13):1233–1244.
8. Criner GJ, Mamary AJ (2010) Lung volume reduction surgery and lung volume re-duction in advanced emphysema: Who and why? Semin Respir Crit Care Med 31(3):348–364.
9. Hooper SB, et al. (2007) Imaging lung aeration and lung liquid clearance at birth.FASEB J 21(12):3329–3337.
10. Parsons DW, et al. (2008) High-resolution visualization of airspace structures in intactmice via synchrotron phase-contrast X-ray imaging (PCXI). J Anat 213(2):217–227.
11. Kitchen MJ, et al. (2005) Phase contrast X-ray imaging of mice and rabbit lungs:A comparative study. Br J Radiol 78(935):1018–1027.
12. Connor DM, et al. (2011) Diffraction enhanced imaging of a rat model of gastric acidaspiration pneumonitis. Acad Radiol 18(12):1515–1521.
13. Zhang L, Li D, Luo S (2011) Non-invasive microstructure and morphology investigationof the mouse lung: Qualitative description and quantitative measurement. PLoS ONE6(2):e17400.
14. Jheon S, Youn HS, Kim HT, Choi GH, Kim JK (2006) High-resolution X-ray refractionimaging of rat lung and histological correlations. Microsc Res Tech 69(8):656–659.
15. Kitchen MJ, et al. (2004) On the origin of speckle in x-ray phase contrast images oflung tissue. Phys Med Biol 49(18):4335–4348.
16. Kitchen MJ, Paganin D, Lewis RA, Yagi N, Uesugi K (2005) Analysis of speckle patternsin phase-contrast images of lung tissue. Nucl Instrum Methods Phys Res A 548:240–246.
17. Khelashvili G, et al. (2006) A physical model of multiple-image radiography. Phys MedBiol 51(2):221–236.
18. Rigon L, Arfelli F, Menk R (2007) Three-image diffraction enhanced imaging algo-rithm to extract absorption, refraction and ultrasmall-angle scattering. Appl Phys Lett90(11):114102–114105.
19. Kitchen MJ, et al. (2010) X-ray phase, absorption and scatter retrieval using two ormore phase contrast images. Opt Express 18(19):19994–20012.
20. Zhong Z, Thomlinson W, Chapman D, Sayers D (2000) Implementation of diffrac-tion-enhanced imaging experiments: At the NSLS and APS. Nucl Instrum MethodsPhys Res A 450:556–567.
21. Parham C, Zhong Z, Connor DM, Chapman LD, Pisano ED (2009) Design and im-plementation of a compact low-dose diffraction enhanced medical imaging system.Acad Radiol 16(8):911–917.
22. Nesch I, et al. (2009) The design and application of an in-laboratory diffraction-enhanced x-ray imaging instrument. Rev Sci Instrum 80(9):093702.
23. Pfeiffer F, et al. (2007) High-resolution brain tumor visualization using three-dimensional x-ray phase contrast tomography. Phys Med Biol 52(23):6923–6930.
24. Pfeiffer F, et al. (2008) Hard-X-ray dark-field imaging using a grating interferometer.Nat Mater 7(2):134–137.
25. Weitkamp T, et al. (2005) X-ray phase imaging with a grating interferometer. OptExpress 13(16):6296–6304.
26. Momose A, et al. (2003) Demonstration of X-ray Talbot interferometry. Jpn J ApplPhys 42:L866–L868.
27. Bech M, et al. (2012) Experimental validation of image contrast correlation betweenultra-small-angle X-ray scattering and grating-based dark-field imaging using a laser-driven compact X-ray source. Photonic Laser Med 1(1):47–50.
28. Bech M, et al. (2010) Quantitative x-ray dark-field computed tomography. Phys MedBiol 55(18):5529–5539.
29. Chen GH, Bevins N, Zambelli J, Qi Z (2010) Small-angle scattering computed tomog-raphy (SAS-CT) using a Talbot-Lau interferometer and a rotating anode x-ray tube:Theory and experiments. Opt Express 18(12):12960–12970.
30. Potdevin G, et al. (2012) X-ray vector radiography for bone micro-architecture diag-nostics. Phys Med Biol 57(11):3451–3461.
31. Wen H, Bennett EE, Hegedus MM, Rapacchi S (2009) Fourier X-ray scattering radi-ography yields bone structural information. Radiology 251(3):910–918.
32. Momose A, et al. (2005) Attempt at visualizing breast cancer with X-ray dark fieldimaging. Jpn J Appl Phys 44:528–531.
33. Jensen TH, et al. (2010) Directional x-ray dark-field imaging of strongly ordered sys-tems. Phys Rev B 82:214103.
34. Pfeiffer F, et al. (2009) X-ray dark-field and phase-contrast imaging using a grating.interferometer. J Appl Phys 105:102006.
35. Yashiro W, Terui Y, Kawabata K, Momose A (2010) On the origin of visibility contrastin x-ray Talbot interferometry. Opt Express 18(16):16890–16901.
36. Malecki A, Potdevin G, Pfeiffer F (2012) Quantitative wave-optical numerical analysis ofthe dark-field signal in grating-based x-ray interferometry. Europhys Lett 99(4):48001.
37. Irvin CG, Bates JH (2003) Measuring the lung function in the mouse: The challenge ofsize. Respir Res 4(1):4.
38. Miller EA, White TA, McDonald BS, Seifert A, Flynn M (2010) Phase contrast x-rayimaging signatures for homeland security applications. Nuclear Science SymposiumConference Record, 2010 IEEE (Inst Elec Electr Eng, New York), pp 896–899.
39. Vanoirbeek JAJ, et al. (2010) Noninvasive and invasive pulmonary function in mousemodels of obstructive and restrictive respiratory diseases. Am J Respir Cell Mol Biol 42(1):96–104.
40. Kitchen MJ, et al. (2011) Phase contrast image segmentation using a Laue analysercrystal. Phys Med Biol 56(3):515–534.
41. Gray JE, et al. (2005) Reference values for diagnostic radiology: Application and im-pact. Radiology 235(2):354–358.
42. Takeda M, Ina H, Kobayashi S (1982) Fourier-transform method of fringe-patternanalysis for computer-based topography and interferometry. J Opt Soc Am 72(1):156–160.
43. Momose A, Yashiro W, Maikusa H, Takeda Y (2009) High-speed X-ray phase imagingand X-ray phase tomography with Talbot interferometer and white synchrotronradiation. Opt Express 17(15):12540–12545.
44. Huang Z, Ruth RD (1998) Laser-electron storage ring. Phys Rev Lett 80(5):976–979.45. Loewen R (2003) A Compact Light Source: Design and technical feasibility study of
a laser-electron storage ring x-ray source. PhD dissertation SLAC-R-632 (Stanford Univ,Stanford, CA).
46. Bech M, et al. (2009) Hard X-ray phase-contrast imaging with the Compact LightSource based on inverse Compton X-rays. J Synchrotron Radiat 16(Pt 1):43–47.
47. Schleede S, et al. (2012) Multimodal hard X-ray imaging of a mammography phantomat a compact synchrotron light source. J Synchrotron Radiat 19(Pt 4):525–529.
48. Kneidinger N, et al. (2011) Activation of the WNT/β-catenin pathway attenuatesexperimental emphysema. Am J Respir Crit Care Med 183(6):723–733.
Schleede et al. PNAS | October 30, 2012 | vol. 109 | no. 44 | 17885
APP
LIED
PHYS
ICAL
SCIENCE
S