Embed Size (px)
Citation preview
OPEN FORUM
Emotional empathy transition patterns from human brainresponses in interactive communication situations
Brain–computer and machine interactive interfacing approach
Tomasz M. Rutkowski • Andrzej Cichocki •
Danilo P. Mandic • Toyoaki Nishida
Received: 2 March 2010 / Accepted: 11 September 2010 / Published online: 24 November 2010
� Springer-Verlag London Limited 2010
Abstract The paper reports our research aiming at utili-
zation of human interactive communication modeling
principles in application to a novel interaction paradigm
designed for brain–computer/machine-interfacing (BCI/
BMI) technologies as well as for socially aware intelligent
environments or communication support systems. Auto-
matic procedures for human affective responses or emo-
tional states estimation are still a hot topic of contemporary
research. We propose to utilize human brain and bodily
physiological responses for affective/emotional as well as
communicative interactivity estimation, which potentially
could be used in the future for human–machine/environ-
ment interaction design. As a test platform for such an
intelligent human–machine communication application, an
emotional stimuli paradigm was chosen to evaluate brain
responses to various affective stimuli in an emotional
empathy mode. Videos with moving faces expressing
various emotional displays as well as speech stimuli with
similarly emotionally articulated sentences are presented to
the subjects in order to further analyze different affective
responses. From information processing point of view,
several challenges with multimodal signal conditioning and
stimuli dynamic response extraction in time frequency
domain are addressed. Emotions play an important role in
human daily life and human-to-human communication.
This is why involvement of affective stimuli principles
to human–machine communication or machine-mediated
communication with utilization of multichannel neuro-
physiological and periphery physiological signals moni-
toring techniques, allowing real-time subjective brain
responses evaluation, is discussed. We present our pre-
liminary results and discuss potential applications of brain/
body affective responses estimation for future interactive/
smart environments.
Keywords Emotional stages from brain responses
estimation � Communication with emotional stages
evaluation � Socially aware intelligent environments
design � Brain–computer or machine interfacing paradigms
1 Introduction
Human factor in design of contemporary interactive com-
munication systems as well as socially aware environments
plays an important role in a design process as discussed
by Rutkowski et al. (2007), Rutkowski and Mandic (2008).
A concept of communication supportive environments
receives broad support from the users who usually require
T. M. Rutkowski (&) � A. Cichocki
Advanced Brain Signal Processing Lab, RIKEN Brain Science
Institute, 2-1 Hirosawa, Wako-shi, Saitama 351-0198, Japan
e-mail: [email protected]
A. Cichocki
e-mail: [email protected]
Present Address:T. M. Rutkowski
BSI-TOYOTA Collaboration Center, RIKEN Brain Science
Institute, 2-1 Hirosawa, Wako-shi, Saitama 351-0198, Japan
D. P. Mandic
Department of Electrical and Electronic Engineering,
Imperial College London, Exhibition Road London,
London SW7 2BT, United Kingdom
e-mail: [email protected]
T. Nishida
Department of Intelligence Science and Technology,
Graduate School of Informatics, Kyoto University,
Yoshida-Honmachi, Sakyo-ku, Kyoto 606-8501, Japan
e-mail: [email protected]
123
AI & Soc (2011) 26:301–315
DOI 10.1007/s00146-010-0310-6
them to follow human communication principles resulting
from a long evolution (Adler and Rodman 2003). Human
brains are somehow pre-wired genetically so children are
able to learn how to communicate easily. Those who lose
their communication skills due to brain stokes, tragic
accidents, or neurological diseases hope for smart sup-
porting technologies/prostheses that would bypass such
disabilities enabling natural and interactive communication
with their environments (Cichocki et al. 2008; Pfurtscheller
et al. 2008; McFarland and Wolpaw 2008). Already
established neuroscience tools such as electroencephalog-
raphy (EEG) and functional near-infrared spectroscopy
(fNIRS) correlate conscious and affective experiences with
electromagnetic field activity and oxygenation changes
localized in cortical areas of the human brain. Additional
peripheral body measurements such as skin conductance,
heart rate, breath and pulse variability, as well facial
muscle and eye-movement characteristics also correlate to
emotional arousal (Rutkowski et al. 2007, 2008). These
physically based measures provide an objective way to
explore the realm of perception, experience, mind and
emotional processes estimate in real-time from human
subjects exposed to emotional stimuli, which could be
results of social interaction with other humans or socially
aware environments. Various multimodal stimuli presented
in a form of mythology, stories, and media through the use
of imagination, movies, music, and sounds influence usu-
ally the mind to evoke a wide range of emotions of which
response could be further utilized in social communicative
situation, or captured, analyzed, and further classified in
neuroscientific studies (Rutkowski et al. 2007, 2008,
2010). Contemporary media such as video games provide a
highly interactive platform to test how users interact with
the environment based upon their unique experiences and
anatomical structure of prefrontal cortices. With hooks into
the realm of the mind as well as the realm of the body,
interactive multimedia combined with neuro- or biofeed-
back provide a unique platform for conducting objective
investigations into the mind–body and mind–environment
relationships, which in connection with interactive com-
munication (Rutkowski et al. 2007; Rutkowski and Mandic
2008) paradigms can be further utilized in design of brain–
machine-interfacing technologies as well socially aware
interactive environments. Recent advances in brain–com-
puter/machine-interfacing (BCI/BMI) reveal also a need to
search for new and more challenging paradigms, which
would allow more natural interaction of humans and
machines with utilization of so-revealed new communica-
tion channels (Cichocki et al. 2008; Rutkowski et al.
2008). There are recognized two general classes of BMI
paradigms, those that are related to external environment
stimuli and utilizing stimuli-driven brain responses and
others that are completely independent from environmental
stimulation and relay only on an internal (imagery) brain
activity managed by the users’ will. The second class of
imagery paradigms is usually more difficult for non-trained
subjects (Guger et al. 2009), since they require learned
brain activity patterns to be captured by non-invasive brain
activity methods such us EEG and fNIRS. In this paper, we
focus on the first class of dependent and stimuli-driven
paradigms with an interactivity concept involved, so they
could be considered as test platforms for affective or
emotional influence on human subjects.
2 Communicative interactivity background
Rutkowski et al. (2007) proposed a novel concept of
communicative interactivity evaluation from natural con-
versations in audiovisual streams. The concept was based
on previously proposed analysis of communication atmo-
sphere as discussed by Rutkowski and Mandic (2007) and
further summarized by Rutkowski and Mandic (2008)
where a presence of interactive communication was judged
based on mutual information(s) between visual and audio
features (MFCC in audio and DCT in visual modalities,
respectively) for selected regions of interest (ROI)
(Hyvarinen et al. 2001), as
IAiVi¼ HðAiÞ þ HðViÞ � HðAi;ViÞ
¼ 1
2logð2peÞn RAi
j j þ 1
2logð2peÞm RVi
j j
� 1
2logð2peÞnþm RAiVi
j j
¼ 1
2log
RAij j RVij j
RAiVij j ;
ð1Þ
where i = 1, 2 and RAi;RVi
;RAiVistand for empirical esti-
mates of the corresponding covariance matrices of the fea-
ture vectors (Rutkowski et al. 2003) (computed recursively).
Simultaneous activity estimates in the same modes
(audio and video, respectively) were estimated for video
audio streams as:
IV1V2¼ 1
2log
RV1j j RV2j j
RV1V2j j ð2Þ
and, analogously, for audio streams:
IA1A2¼ 1
2log
RA1j j RA2j j
RA1A2j j ; ð3Þ
where RA1A2and RV1V2
are the empirical estimates of the
corresponding covariance matrices for unimodal feature
representing different communicators activities. Quantities
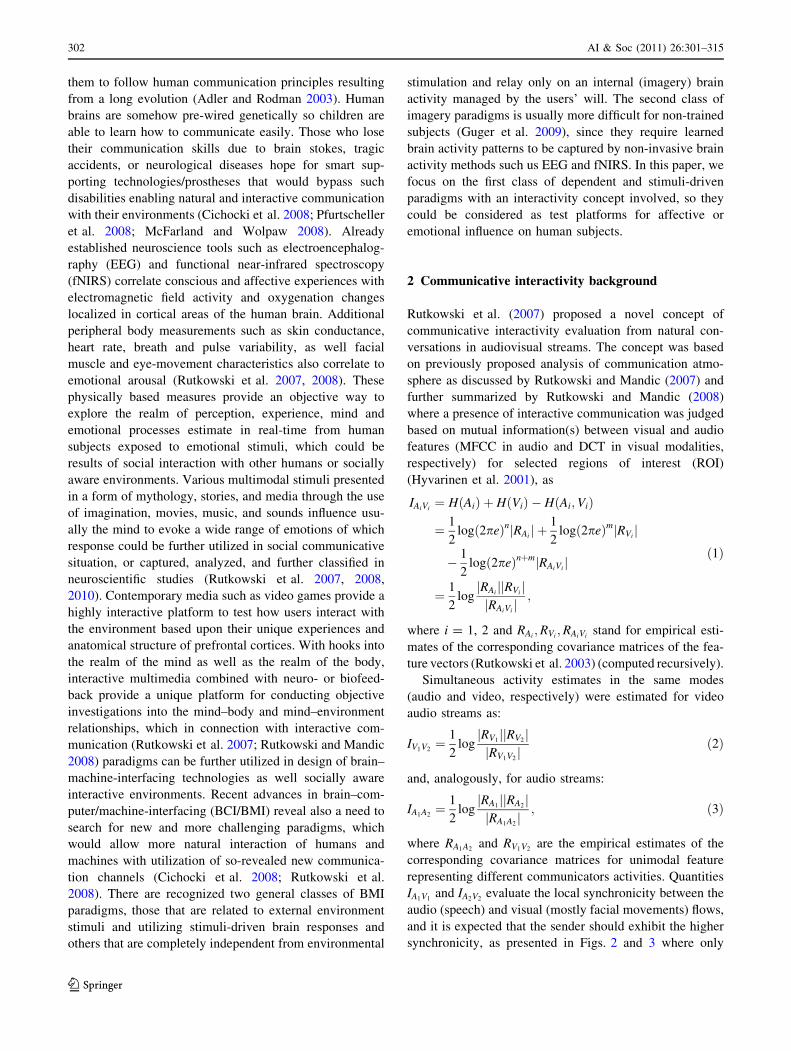
IA1V1and IA2V2
evaluate the local synchronicity between the
audio (speech) and visual (mostly facial movements) flows,
and it is expected that the sender should exhibit the higher
synchronicity, as presented in Figs. 2 and 3 where only
302 AI & Soc (2011) 26:301–315
123
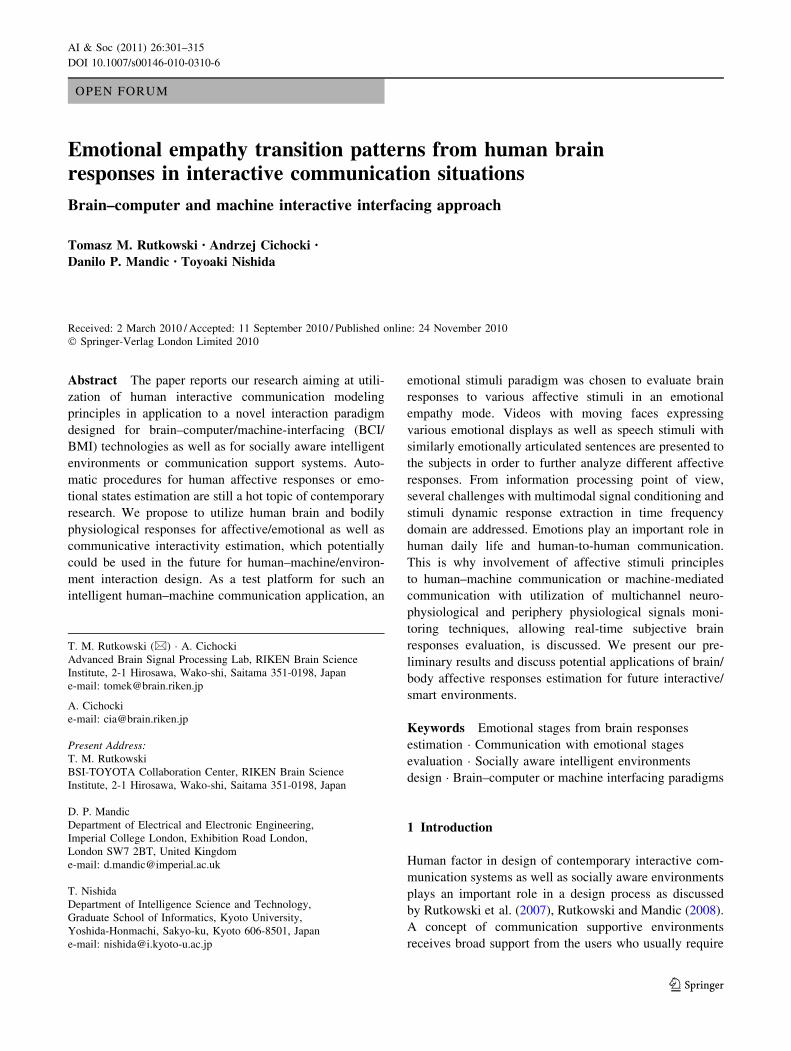
single from interacting communicators exposed higher
audiovisual synchrony IA1V1or IA2V2
, respectively. Quanti-
ties IV1V2and IA1A2
were related to the possible cross talks in
same modalities (audio–audio, video–video), reflecting the
higher activity as presented in the form of bar-plots under
captured videos in Figs. 1 and 4 where both interacting
communicators exposed (overlapped) similar audiovisual
activities resulting in lower communicative efficiency
evaluation as it was introduced by Rutkowski and Mandic
(2008). Communicative interactivity evaluation allowed
the author to assess the behavior of the participants in the
communication from the audio–visual channel and reflec-
ted their ability to ‘‘properly’’ interact in the course of
conversation. This allowed us to quantify a synchronization
and interaction of face-to-face communicative events.
3 Extension of communicative interactivity model
to brain–machine-interaction design
We propose to extend communicative interactivity
approach presented in Sect. 2 to brain (human) computer
(machine) interfacing paradigms of which contemporary
applications are presented by Cichocki et al. (2008),
Schlogl and Brunner (2008), Pfurtscheller et al. (2008),
McFarland and Wolpaw (2008), Lecuyer et al. (2008). We
postulate to apply face-to-face communicative interactivity
principles to study human brain responses during an
interaction with affective stimuli presented in visual and
auditory domains. The aim of the research is to detect
possible changes in brain response patterns in a course of
stimuli presentation to the subjects. For this purpose,
multimodal brain and body peripheral measurements are
taken as described in the following sections.
3.1 Methods of brain and body electrophysiological
as well as oxygenation activity monitoring
Combined EEG, fNIRS, and peripheral electrophysiologi-
cal signals recording experiments were conducted at the
Fig. 1 Example of communicative interactivity analysis with both
communicators being active at the same time causing similar amount
of visual and auditory features levels, which result in similar levels of
mutual information estimates IA1V1; IA2V2
; IV1V2and IA1A2
Fig. 2 Example of communicative interactivity analysis with both
communicators being active in visual domain (similar levels of
extracted motions) but only communicator #2 being more active in
auditory domain (talking), resulting in higher level of IV2A2mutual
estimate (thus classified as ‘‘a sender’’)
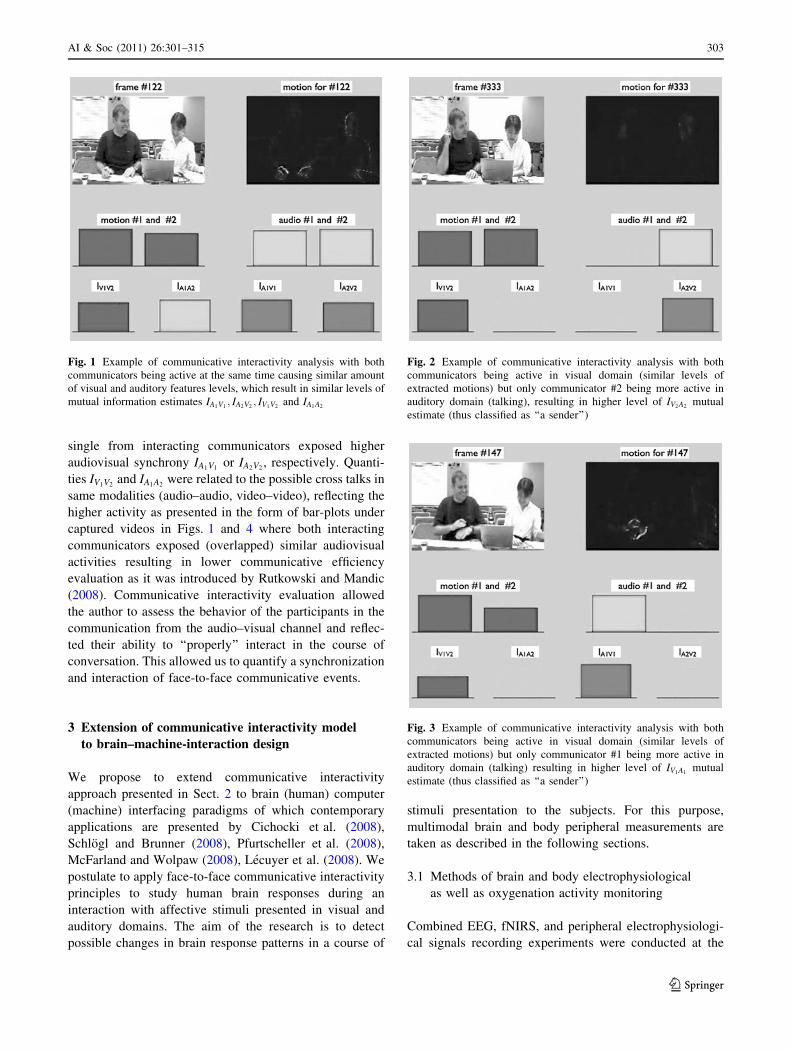
Fig. 3 Example of communicative interactivity analysis with both
communicators being active in visual domain (similar levels of
extracted motions) but only communicator #1 being more active in
auditory domain (talking) resulting in higher level of IV1A1mutual
estimate (thus classified as ‘‘a sender’’)
AI & Soc (2011) 26:301–315 303
123
Advanced Signal Processing Laboratory of the RIKEN
Brain Science Institute, Wakoshi, Japan, using two syn-
chronized g.USBamp biosignal data acquisition systems
with 16 EEG electrodes placed over frontal, temporal, and
parietal lobes; two channels of vertical and horizontal eye
movements tracing electrooculography (EOG); a single
electrocardiography (ECG) channel to monitor heart rate
variability; and pulse. Additionally, two frontal functional
near-infrared spectroscopy (fNIRS) channels were recor-
ded synchronously with NIRO-200 cerebral oxygenation
recorder. An example of such multimodal recording is
shown in Fig. 8, where a subject with electrodes placed on
his head is depicted, as well as in Fig. 5, where captured
neuro- and electrophysiological signals are visualized.
Details of brain and body monitoring methods are
explained below.
Electroencephalography (EEG) is a recording of bio-
electrical activity along the scalp produced by the firing
of neurons within the brain. In practical applications,
EEG refers to the recording of the brain’s spontaneous
electrical activity over a short period of time from
multiple electrodes placed on the scalp and attached to a
cap with fixed positions (see Fig. 5). EEG reflects
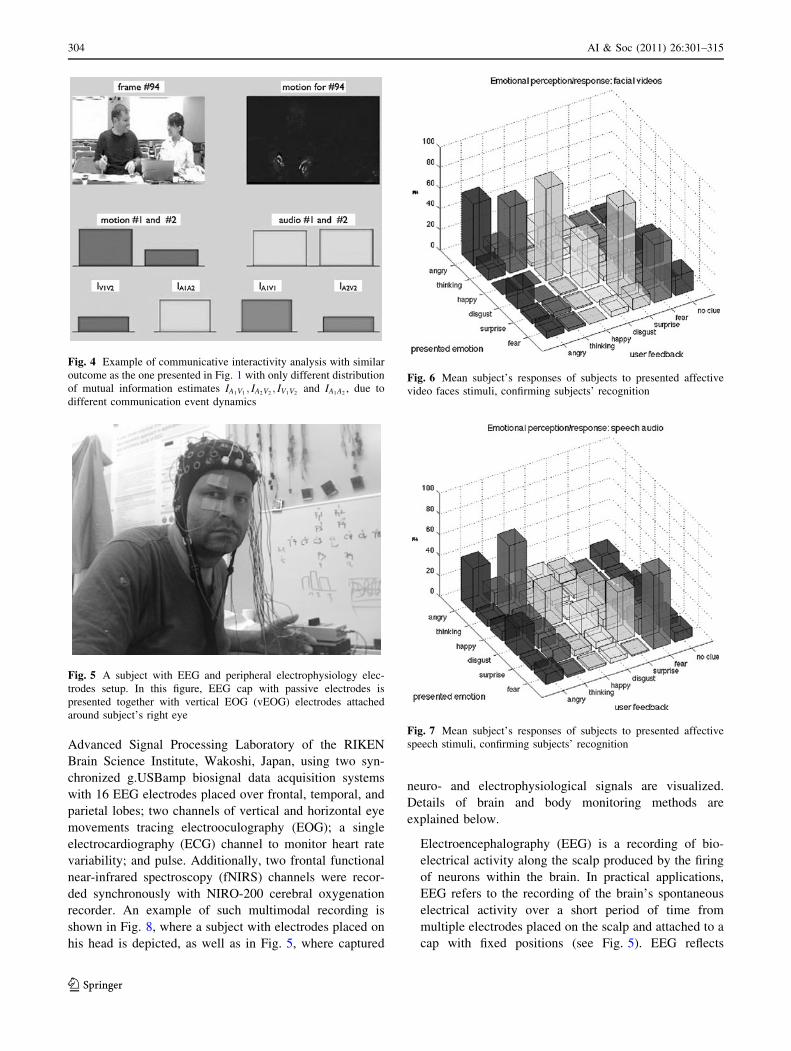
Fig. 4 Example of communicative interactivity analysis with similar
outcome as the one presented in Fig. 1 with only different distribution
of mutual information estimates IA1V1; IA2V2
; IV1V2and IA1A2
, due to
different communication event dynamics
Fig. 5 A subject with EEG and peripheral electrophysiology elec-
trodes setup. In this figure, EEG cap with passive electrodes is
presented together with vertical EOG (vEOG) electrodes attached
around subject’s right eye
Fig. 6 Mean subject’s responses of subjects to presented affective
video faces stimuli, confirming subjects’ recognition
Fig. 7 Mean subject’s responses of subjects to presented affective
speech stimuli, confirming subjects’ recognition
304 AI & Soc (2011) 26:301–315
123
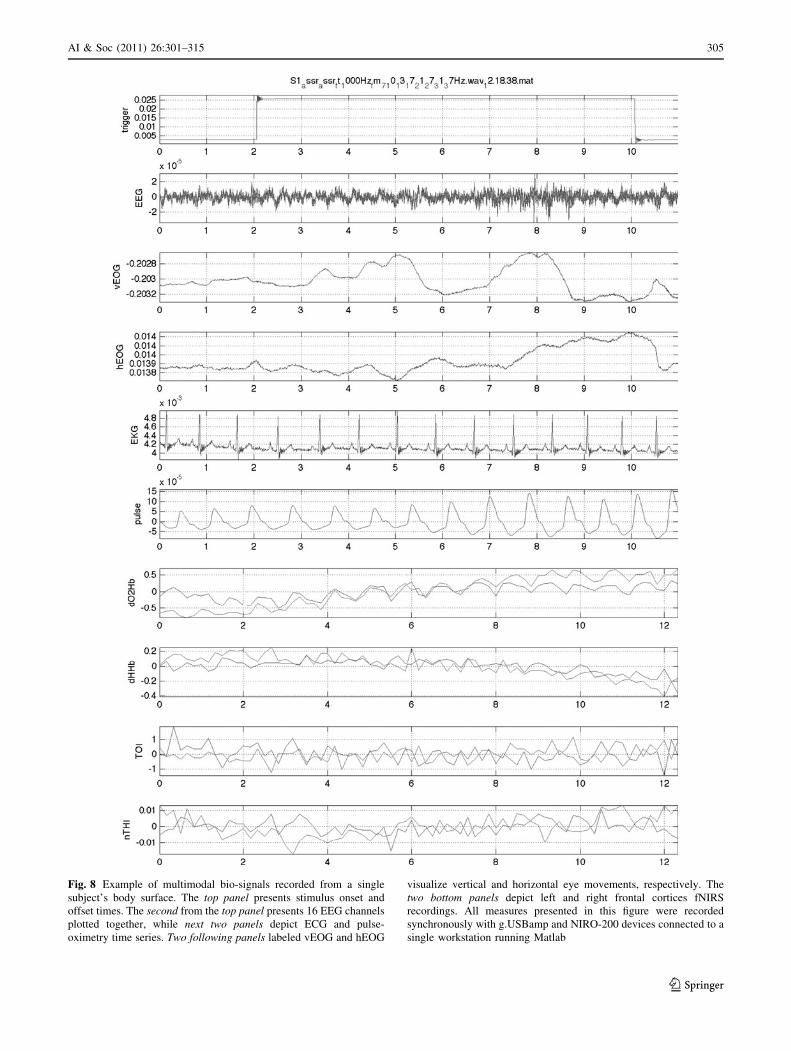
Fig. 8 Example of multimodal bio-signals recorded from a single
subject’s body surface. The top panel presents stimulus onset and
offset times. The second from the top panel presents 16 EEG channels
plotted together, while next two panels depict ECG and pulse-
oximetry time series. Two following panels labeled vEOG and hEOG
visualize vertical and horizontal eye movements, respectively. The
two bottom panels depict left and right frontal cortices fNIRS
recordings. All measures presented in this figure were recorded
synchronously with g.USBamp and NIRO-200 devices connected to a
single workstation running Matlab
AI & Soc (2011) 26:301–315 305
123
EEG, EOG & ECG of annoyed video preSTIM
C3C5T7C4C6T8
Fp1Fp2
F3F4P3P4
AF3AF4AF7AF8
vEOGhEOH
C5
T7
C4
C6
T8
Fp1
Fp2
F3
F4
P3
P4
AF
3A
F4
AF
7A
F8
vEO
GhE
OH
EC
G
EEG, EOG & ECG of annoyed video STIM
C3C5T7C4C6T8
Fp1Fp2
F3F4P3P4
AF3AF4AF7AF8
vEOGhEOH
C5
T7
C4
C6
T8
Fp1
Fp2
F3
F4
P3
P4
AF
3A
F4
AF
7A
F8
vEO
GhE
OH
EC
G
EEG, EOG & ECG of annoyed video preSTIM
pulse
left_dO2Hb
left_dHHb:
left_TOI
left_nTHI
right_dO2Hb
right_dHHb
right_TOI
left_
dO2H
b
left_
dHH
b:
left_
TOI
left_
nTH
I
right
_dO
2Hb
right
_dH
Hb
right
_TO
I
right
_nT
HI
EEG, EOG & ECG of annoyed video STIM
pulse
left_dO2Hb
left_dHHb:
left_TOI
left_nTHI
right_dO2Hb
right_dHHb
right_TOI
left_
dO2H
b
left_
dHH
b:
left_
TOI
left_
nTH
I
right
_dO
2Hb
right
_dH
Hb
right
_TO
I
right
_nT
HI
(a)
(b)
(c)
(d)
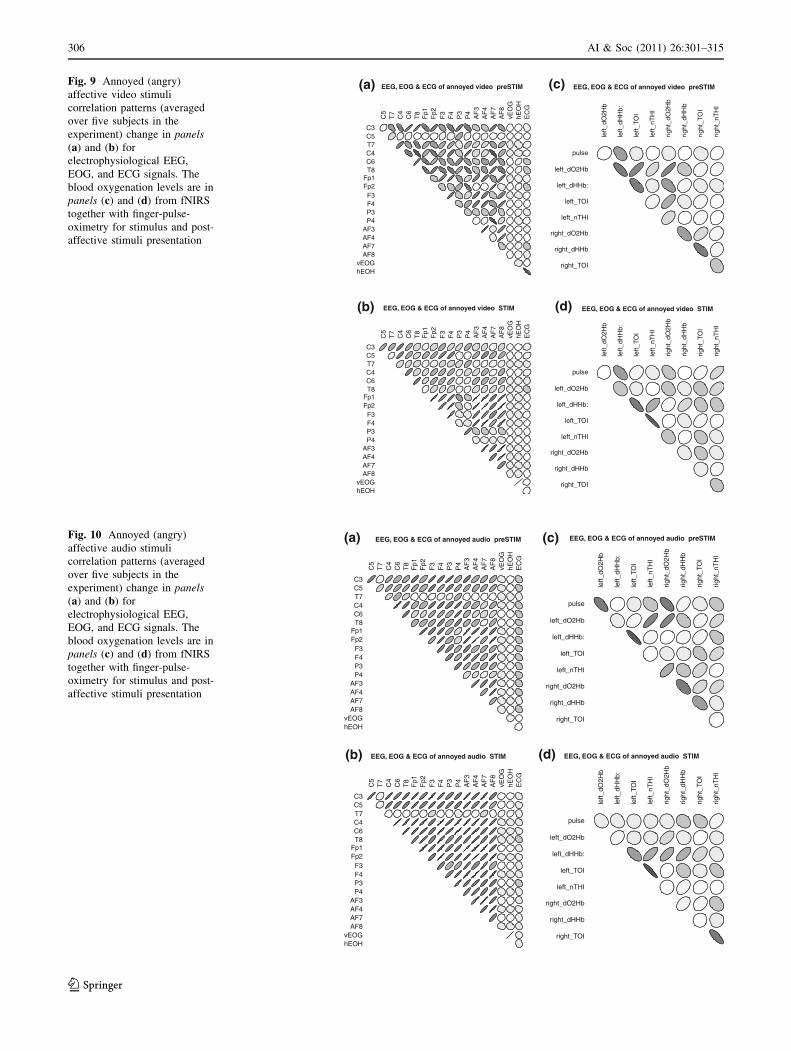
Fig. 9 Annoyed (angry)
affective video stimuli
correlation patterns (averaged
over five subjects in the
experiment) change in panels(a) and (b) for
electrophysiological EEG,
EOG, and ECG signals. The
blood oxygenation levels are in
panels (c) and (d) from fNIRS
together with finger-pulse-
oximetry for stimulus and post-
affective stimuli presentation
EEG, EOG & ECG of annoyed audio preSTIM
C3C5T7C4C6T8
Fp1Fp2
F3F4P3P4
AF3AF4AF7AF8
vEOGhEOH
C5
T7
C4
C6
T8
Fp1
Fp2
F3
F4
P3
P4
AF
3A
F4
AF
7A
F8
vEO
GhE
OH
EC
G
EEG, EOG & ECG of annoyed audio STIM
C3C5T7C4C6T8
Fp1Fp2
F3F4P3P4
AF3AF4AF7AF8
vEOGhEOH
C5
T7
C4
C6
T8
Fp1
Fp2
F3
F4
P3
P4
AF
3A
F4
AF
7A
F8
vEO
GhE
OH
EC
G
EEG, EOG & ECG of annoyed audio preSTIM
pulse
left_dO2Hb
left_dHHb:
left_TOI
left_nTHI
right_dO2Hb
right_dHHb
right_TOI
left_
dO2H
b
left_
dHH
b:
left_
TOI
left_
nTH
I
right
_dO
2Hb
right
_dH
Hb
right
_TO
I
right
_nT
HI
EEG, EOG & ECG of annoyed audio STIM
pulse
left_dO2Hb
left_dHHb:
left_TOI
left_nTHI
right_dO2Hb
right_dHHb
right_TOI
left_
dO2H
b
left_
dHH
b:
left_
TOI
left_
nTH
I
right
_dO
2Hb
right
_dH
Hb
right
_TO
I
right
_nT
HI
(a)
(b)
(c)
(d)
Fig. 10 Annoyed (angry)
affective audio stimuli
correlation patterns (averaged
over five subjects in the
experiment) change in panels(a) and (b) for
electrophysiological EEG,
EOG, and ECG signals. The
blood oxygenation levels are in
panels (c) and (d) from fNIRS
together with finger-pulse-
oximetry for stimulus and post-
affective stimuli presentation
306 AI & Soc (2011) 26:301–315
123
EEG, EOG & ECG of choosing video preSTIM
C3C5T7C4C6T8
Fp1Fp2
F3F4P3P4
AF3AF4AF7AF8
vEOGhEOH
C5
T7
C4
C6
T8
Fp1
Fp2
F3
F4
P3
P4
AF
3A
F4
AF
7A
F8
vEO
GhE
OH
EC
G
EEG, EOG & ECG of choosing video STIM
C3C5T7C4C6T8
Fp2Fp1
F3F4P3P4
AF3AF4AF7AF8
vEOGhEOH
C5
T7
C4
C6
T8
Fp1
Fp2
F3
F4
P3
P4
AF
3A
F4
AF
7A
F8
vEO
GhE
OH
EC
G
EEG, EOG & ECG of choosing video preSTIM
pulse
left_dO2Hb
left_dHHb:
left_TOI
left_nTHI
right_dO2Hb
right_dHHb
right_TOI
left_
dO2H
b
left_
dHH
b:
left_
TOI
left_
nTH
I
right
_dO
2Hb
right
_dH
Hb
right
_TO
I
right
_nT
HI
EEG, EOG & ECG of choosing video STIM
pulse
left_dO2Hb
left_dHHb:
left_TOI
left_nTHI
right_dO2Hb
right_dHHb
right_TOI
left_
dO2H
b
left_
dHH
b:
left_
TOI
left_
nTH
I
right
_dO
2Hb
right
_dH
Hb
right
_TO
I
right
_nT
HI
(a)
(b)
(c)
(d)
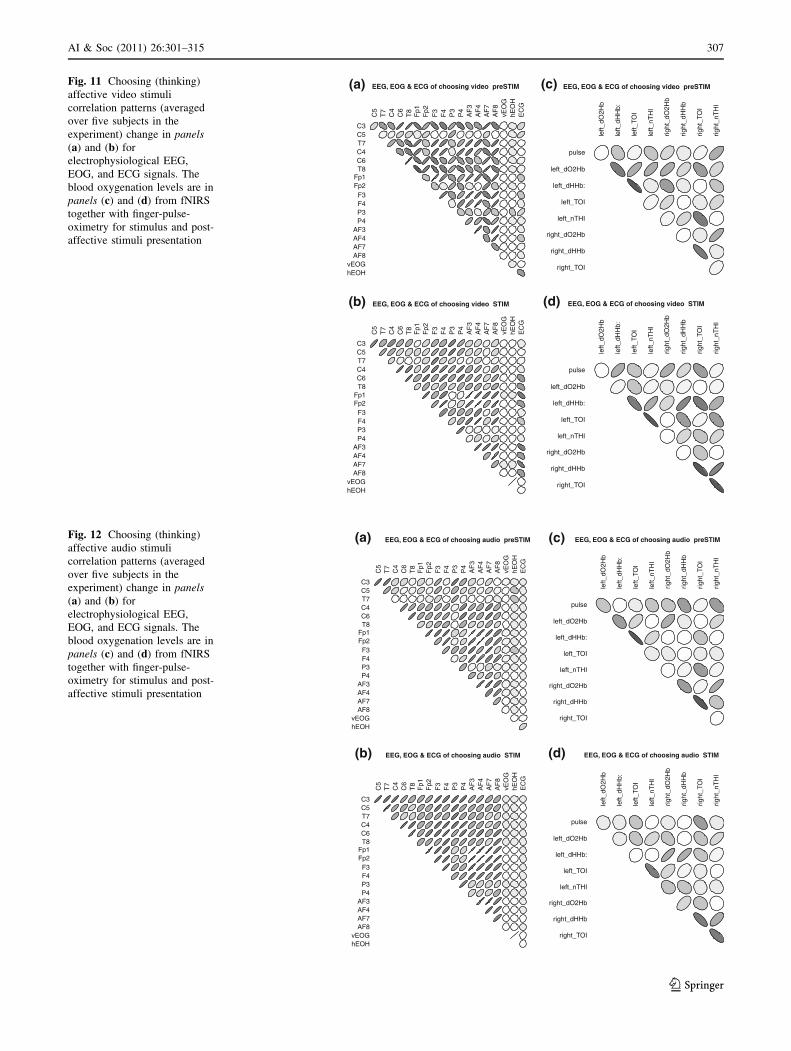
Fig. 11 Choosing (thinking)
affective video stimuli
correlation patterns (averaged
over five subjects in the
experiment) change in panels(a) and (b) for
electrophysiological EEG,
EOG, and ECG signals. The
blood oxygenation levels are in
panels (c) and (d) from fNIRS
together with finger-pulse-
oximetry for stimulus and post-
affective stimuli presentation
EEG, EOG & ECG of choosing audio preSTIM
C3C5T7C4C6T8
Fp1Fp2
F3F4P3P4
AF3AF4AF7AF8
vEOGhEOH
C5
T7
C4
C6
T8
Fp1
Fp2
F3
F4
P3
P4
AF
3A
F4
AF
7A
F8
vEO
GhE
OH
EC
G
EEG, EOG & ECG of choosing audio STIM
C3C5T7C4C6T8
Fp1Fp2
F3F4P3P4
AF3AF4AF7AF8
vEOGhEOH
C5
T7
C4
C6
T8
Fp1
Fp2
F3
F4
P3
P4
AF
3A
F4
AF
7A
F8
vEO
GhE
OH
EC
G
EEG, EOG & ECG of choosing audio preSTIM
pulse
left_dO2Hb
left_dHHb:
left_TOI
left_nTHI
right_dO2Hb
right_dHHb
right_TOI
left_
dO2H
b
left_
dHH
b:
left_
TOI
left_
nTH
I
right
_dO
2Hb
right
_dH
Hb
right
_TO
I
right
_nT
HI
EEG, EOG & ECG of choosing audio STIM
pulse
left_dO2Hb
left_dHHb:
left_TOI
left_nTHI
right_dO2Hb
right_dHHb
right_TOI
left_
dO2H
b
left_
dHH
b:
left_
TOI
left_
nTH
I
right
_dO
2Hb
right
_dH
Hb
right
_TO
I
right
_nT
HI
(a)
(b)
(c)
(d)
Fig. 12 Choosing (thinking)
affective audio stimuli
correlation patterns (averaged
over five subjects in the
experiment) change in panels(a) and (b) for
electrophysiological EEG,
EOG, and ECG signals. The
blood oxygenation levels are in
panels (c) and (d) from fNIRS
together with finger-pulse-
oximetry for stimulus and post-
affective stimuli presentation
AI & Soc (2011) 26:301–315 307
123
EEG, EOG & ECG of revulsion video preSTIM
C3C5T7C4C6T8
Fp1Fp2
F3F4P3P4
AF3AF4AF7AF8
vEOGhEOH
C5
T7
C4
C6
T8
Fp1
Fp2
F3
F4
P3
P4
AF
3A
F4
AF
7A
F8
vEO
GhE
OH
EC
G
EEG, EOG & ECG of revulsion video STIM
C3C5T7C4C6T8
Fp1Fp2
F3F4P3P4
AF3AF4AF7AF8
vEOGhEOH
C5
T7
C4
C6
T8
Fp1
Fp2
F3
F4
P3
P4
AF
3A
F4
AF
7A
F8
vEO
GhE
OH
EC
G
EEG, EOG & ECG of revulsion video preSTIM
pulse
left_dO2Hb
left_dHHb:
left_TOI
left_nTHI
right_dO2Hb
right_dHHb
right_TOI
left_
dO2H
b
left_
dHH
b:
left_
TOI
left_
nTH
I
right
_dO
2Hb
right
_dH
Hb
right
_TO
I
right
_nT
HI
EEG, EOG & ECG of revulsion video STIM
pulse
left_dO2Hb
left_dHHb:
left_TOI
left_nTHI
right_dO2Hb
right_dHHb
right_TOI
left_
dO2H
b
left_
dHH
b:
left_
TOI
left_
nTH
I
right
_dO
2Hb
right
_dH
Hb
right
_TO
I
right
_nT
HI
(a) (c)
(b) (d)
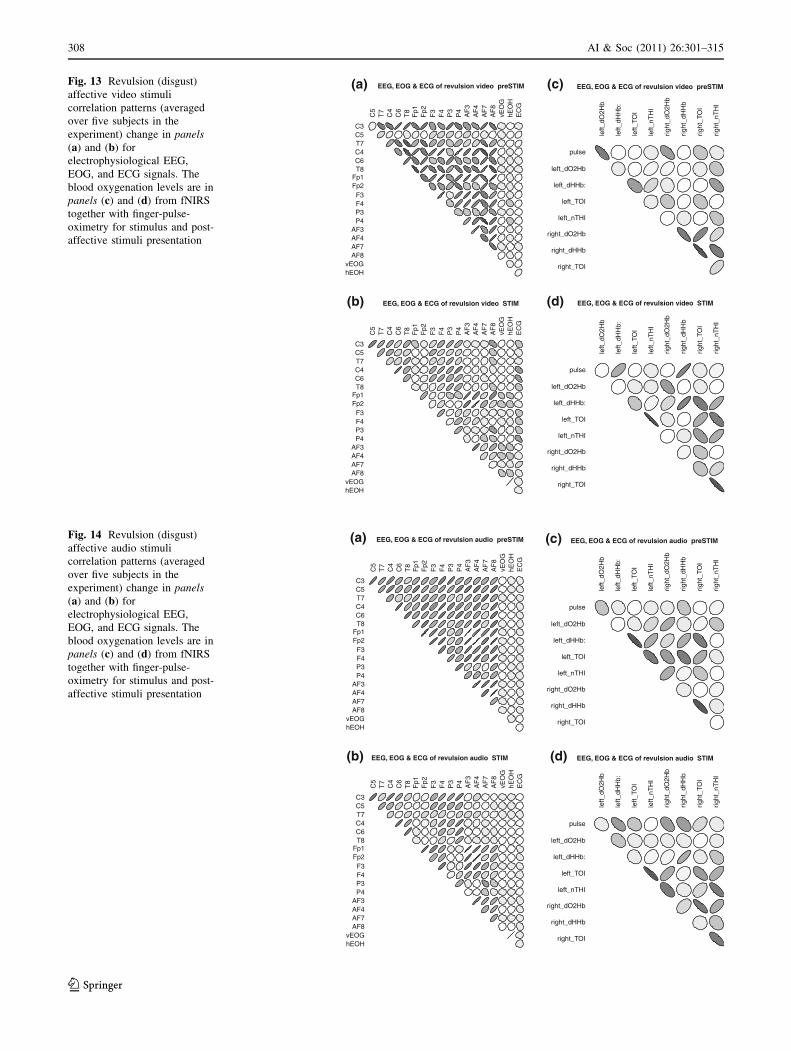
Fig. 13 Revulsion (disgust)
affective video stimuli
correlation patterns (averaged
over five subjects in the
experiment) change in panels(a) and (b) for
electrophysiological EEG,
EOG, and ECG signals. The
blood oxygenation levels are in
panels (c) and (d) from fNIRS
together with finger-pulse-
oximetry for stimulus and post-
affective stimuli presentation
EEG, EOG & ECG of revulsion audio preSTIM
C3C5T7C4C6T8
Fp1Fp2
F3F4P3P4
AF3AF4AF7AF8
vEOGhEOH
C5
T7
C4
C6
T8
Fp1
Fp2
F3
F4
P3
P4
AF
3A
F4
AF
7A
F8
vEO
GhE
OH
EC
G
EEG, EOG & ECG of revulsion audio STIM
C3C5T7C4C6T8
Fp1Fp2
F3F4P3P4
AF3AF4AF7AF8
vEOGhEOH
C5
T7
C4
C6
T8
Fp1
Fp2
F3
F4
P3
P4
AF
3A
F4
AF
7A
F8
vEO
GhE
OH
EC
G
EEG, EOG & ECG of revulsion audio preSTIM
pulse
left_dO2Hb
left_dHHb:
left_TOI
left_nTHI
right_dO2Hb
right_dHHb
right_TOI
left_
dO2H
b
left_
dHH
b:
left_
TOI
left_
nTH
I
right
_dO
2Hb
right
_dH
Hb
right
_TO
I
right
_nT
HI
EEG, EOG & ECG of revulsion audio STIM
pulse
left_dO2Hb
left_dHHb:
left_TOI
left_nTHI
right_dO2Hb
right_dHHb
right_TOI
left_
dO2H
b
left_
dHH
b:
left_
TOI
left_
nTH
I
right
_dO
2Hb
right
_dH
Hb
right
_TO
I
right
_nT
HI
(a) (c)
(b) (d)
Fig. 14 Revulsion (disgust)
affective audio stimuli
correlation patterns (averaged
over five subjects in the
experiment) change in panels(a) and (b) for
electrophysiological EEG,
EOG, and ECG signals. The
blood oxygenation levels are in
panels (c) and (d) from fNIRS
together with finger-pulse-
oximetry for stimulus and post-
affective stimuli presentation
308 AI & Soc (2011) 26:301–315
123
EEG, EOG & ECG of startled video preSTIM
C3C5T7C4C6T8
Fp1Fp2
F3F4P3P4
AF3AF4AF7AF8
vEOGhEOH
C5
T7
C4
C6
T8
Fp1
Fp2
F3
F4
P3
P4
AF
3A
F4
AF
7A
F8
vEO
GhE
OH
EC
G
EEG, EOG & ECG of startled video STIM
C3C5T7C4C6T8
Fp1Fp2
F3F4P3P4
AF3AF4AF7AF8
vEOGhEOH
C5
T7
C4
C6
T8
Fp1
Fp2
F3
F4
P3
P4
AF
3A
F4
AF
7A
F8
vEO
GhE
OH
EC
G
EEG, EOG & ECG of startled video preSTIM
pulse
left_dO2Hb
left_dHHb:
left_TOI
left_nTHI
right_dO2Hb
right_dHHb
right_TOI
left_
dO2H
b
left_
dHH
b:
left_
TOI
left_
nTH
I
right
_dO
2Hb
right
_dH
Hb
right
_TO
I
right
_nT
HI
EEG, EOG & ECG of startled video STIM
pulse
left_dO2Hb
left_dHHb:
left_TOI
left_nTHI
right_dO2Hb
right_dHHb
right_TOI
left_
dO2H
b
left_
dHH
b:
left_
TOI
left_
nTH
I
right
_dO
2Hb
right
_dH
Hb
right
_TO
I
right
_nT
HI
(a) (c)
(b) (d)
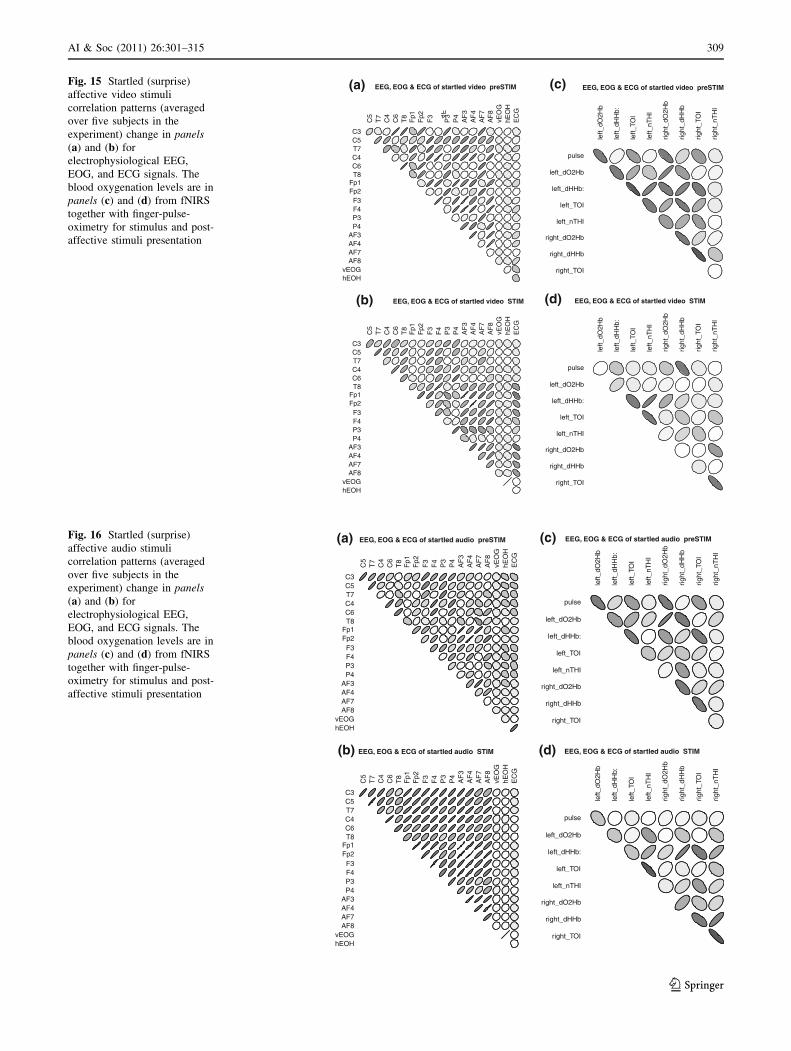
Fig. 15 Startled (surprise)
affective video stimuli
correlation patterns (averaged
over five subjects in the
experiment) change in panels(a) and (b) for
electrophysiological EEG,
EOG, and ECG signals. The
blood oxygenation levels are in
panels (c) and (d) from fNIRS
together with finger-pulse-
oximetry for stimulus and post-
affective stimuli presentation
EEG, EOG & ECG of startled audio preSTIM
C3C5T7C4C6T8
Fp1Fp2
F3F4P3P4
AF3AF4AF7AF8
vEOGhEOH
C5
T7
C4
C6
T8
Fp1
Fp2
F3
F4
P3
P4
AF
3A
F4
AF
7A
F8
vEO
GhE
OH
EC
G
EEG, EOG & ECG of startled audio STIM
C3C5T7C4C6T8
Fp1Fp2
F3F4P3P4
AF3AF4AF7AF8
vEOGhEOH
C5
T7
C4
C6
T8
Fp1
Fp2
F3
F4
P3
P4
AF
3A
F4
AF
7A
F8
vEO
GhE
OH
EC
G
EEG, EOG & ECG of startled audio preSTIM
pulse
left_dO2Hb
left_dHHb:
left_TOI
left_nTHI
right_dO2Hb
right_dHHb
right_TOI
left_
dO2H
b
left_
dHH
b:
left_
TOI
left_
nTH
I
righ
t_dO
2Hb
righ
t_dH
Hb
righ
t_TO
I
righ
t_nT
HI
EEG, EOG & ECG of startled audio STIM
pulse
left_dO2Hb
left_dHHb:
left_TOI
left_nTHI
right_dO2Hb
right_dHHb
right_TOI
left_
dO2H
b
left_
dHH
b:
left_
TOI
left_
nTH
I
righ
t_dO
2Hb
righ
t_dH
Hb
righ
t_TO
I
righ
t_nT
HI
(a) (c)
(b) (d)
Fig. 16 Startled (surprise)
affective audio stimuli
correlation patterns (averaged
over five subjects in the
experiment) change in panels(a) and (b) for
electrophysiological EEG,
EOG, and ECG signals. The
blood oxygenation levels are in
panels (c) and (d) from fNIRS
together with finger-pulse-
oximetry for stimulus and post-
affective stimuli presentation
AI & Soc (2011) 26:301–315 309
123
correlated synaptic activity resulting from post-synaptic
potentials of cortical neurons. However, the electric
potentials generated by single neurons are far too small
to be represented within the EEG; therefore, the recorded
activity always reflects a summation of the synchronized
thousands or millions of neurons that have similar spatial
orientation which is radial to the scalp. The EEG
technique therefore benefits from the parallel, radial
arrangement of apical dendrites in the cortex. Addition-
ally, problem of the method is a voltage field falling off
with the fourth power of a radius, causing an activity
from deep sources to be more difficult to detect than
currents near the skull of cortical areas (Niedermeyer
and Da Silva 2004). To the main advantages of the
technique belongs low cost and very good temporal
resolution of which the latter is perfectly suited for
analysis of very fast affective/emotional responses.
Functional EEG technique refers to utilization of electric
brain potentials topographic features differences local-
izations in brain regions covered by scalp electrodes
resulting in temporal EEG activation maps.
Functional near-infrared spectroscopy (fNIRS) is a
spectroscopic method that uses the near-infrared region
of the electromagnetic spectrum for a non-invasive
measurement of the amount and oxygen content of
hemoglobin. Functional NIRS is recently used for non-
invasive assessment of brain function through the intact
skull by detecting changes in blood hemoglobin
concentrations associated with neural activity. fNIRS
is a very compact and cost-effective technique, com-
pared to fMRI, but similar to EEG, it can only be used
to scan cortical tissue due to limited depth of infrared
penetration. To the main advantages of the technique
belong low cost and no need for any subject
preparation.
Electrooculography (EOG) is a technique for measuring
the resting potential of a retina for recording of eye
movements; thus, EOG does not represent a response to
individual visual stimuli. Usually, pairs of electrodes are
placed either above and below the eye (vertical EOG) or
to the left and right of the eye (horizontal EOG). When
the eye is moved from the center position toward one
electrode, a positive or negative potential difference
occurs between the two electrodes. Assuming that a
resting potential is constant, the recorded potential is a
measure for the eye position, allowing monitoring of
subjects visual focus of attention.
Electrocardiography (ECG) is a measurement of electri-
cal activity in the heart using electrodes placed on the
skin of the limbs and chest (limbs only in case of this
paper). It allows to analyze the overall rhythm of the
heart variability analysis caused by various affective/
emotional stimuli.
Pulse-oximetry is a non-invasive method allowing
monitoring of oxygenation of a patient’s hemoglobin
in peripheral blood vessels (finger tip in presented case),
resulting in a good peripheral pulse rhythm modulations
estimate caused by affective/emotional stimuli.
4 Affective stimuli interaction experiments
The five subjects in our experiment were given audio-
only and video-only presentations of affective displays
from the emotional utterances corpus, designed by
Baron-Cohen (2004), as portrayed by five British English
professional actors. Both the video and the audio pre-
sentations portrayed affective expressions of six basic
emotions. The video-only presentations involved short
(3–7 s long) movies; the audio-only involved short (3–7
s long) sentences. Those stimuli were chosen to emulate
natural ‘‘emotionally charged’’ communicative situations,
which are very common in daily life situations (Adler
and Rodman 2003). Subjects were seated in front of a
table with a computer display and speakers from which
video and audio stimuli were presented, respectively.
After attaching the monitoring electrodes (see Fig. 5), the
subjects were instructed to look at a white cross mark on
the computer screen and to try not to blink or move in
order to minimize muscular noise in electrophysiological
signals. Such little not natural situation and lack of
possibility to ‘‘bodily interact’’ with emotional stimuli
was created in order to search for ‘‘pre-movement’’ or
‘‘movement-planning’’ related responses that in central-
or peripheral nervous system system are generated
in human body. We should keep in mind that target
and potential artificial intelligence application for
smart interactive/communicative environments would be
designed primarily for locked-in patients who are not
able to interact with usage of their peripheral nervous
and muscular systems. The subjects were also instructed
to answer a question on the screen after the audio or
visual presentation which emotion did they perceive. The
purpose of these questions was to focus subject’s atten-
tion on the task and to give them a period of relaxation
time, as well to check validation of chosen emotional
responses. Results of subject’s responses are presented in
Figs. 6 and 7. The main goal of the experiment was a
search for interactive responses captured within neuro-
physiological and peripheral electrophysiological signals
carrying very short emotional empathy signatures that
characterize subjects emotional involvement in a simu-
lated communication process. A concept of empathy is
characterized as a capability to share one’s feelings and
understand another’s emotion or feelings. It was shown
310 AI & Soc (2011) 26:301–315
123
EEG, EOG & ECG of jubilant video preSTIM
C3C5T7C4C6T8
Fp1Fp2
F3F4P3P4
AF3AF4AF7AF8
vEOGhEOH
C5
T7
C4
C6
T8
Fp1
Fp2
F3
F4
P3
P4
AF
3A
F4
AF
7A
F8
vEO
GhE
OH
EC
G
EEG, EOG & ECG of jubilant video STIM
C3C5T7C4C6T8
Fp1Fp2
F3F4P3P4
AF3AF4AF7AF8
vEOGhEOH
C5
T7
C4
C6
T8
Fp1
Fp2
F3
F4
P3
P4
AF
3A
F4
AF
7A
F8
vEO
GhE
OH
EC
G
EEG, EOG & ECG of jubilant video preSTIM
pulse
left_dO2Hb
left_dHHb:
left_TOI
left_nTHI
right_dO2Hb
right_dHHb
right_TOI
left_
dO2H
b
left_
dHH
b:
left_
TOI
left_
nTH
I
right
_dO
2Hb
right
_dH
Hb
right
_TO
I
right
_nT
HI
EEG, EOG & ECG of jubilant video STIM
pulse
left_dO2Hb
left_dHHb:
left_TOI
left_nTHI
right_dO2Hb
right_dHHb
right_TOI
left_
dO2H
b
left_
dHH
b:
left_
TOI
left_
nTH
I
right
_dO
2Hb
right
_dH
Hb
right
_TO
I
right
_nT
HI
(a)
(b)
(c)
(d)
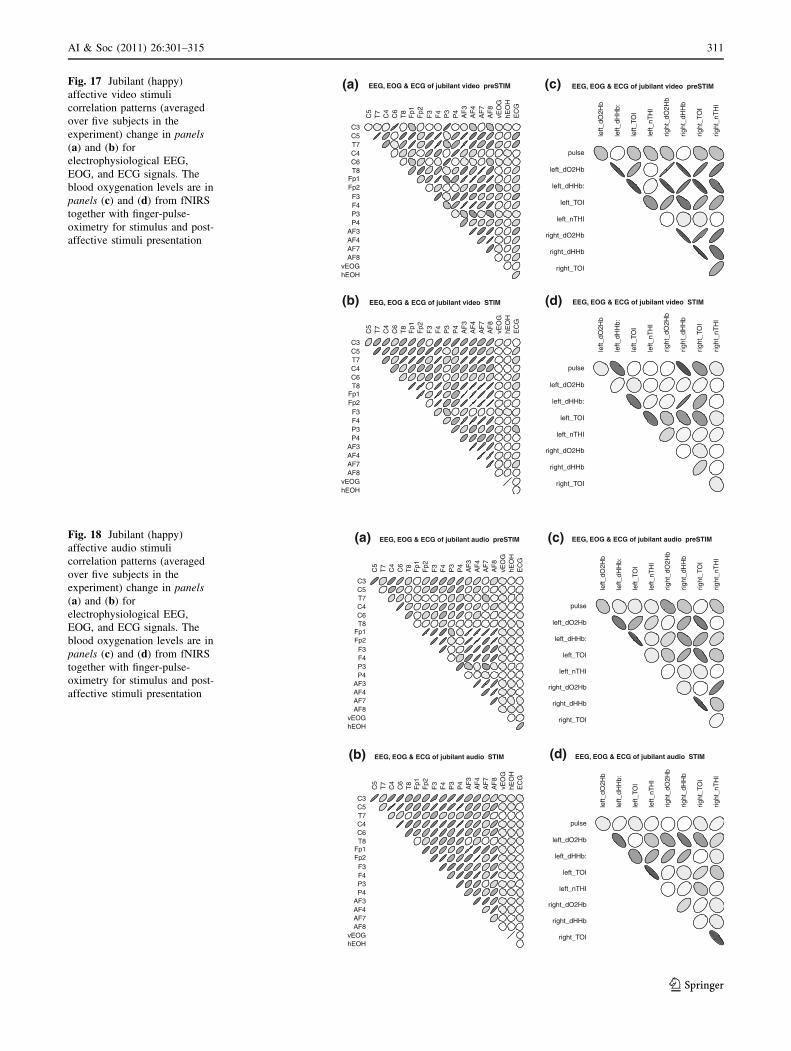
Fig. 17 Jubilant (happy)
affective video stimuli
correlation patterns (averaged
over five subjects in the
experiment) change in panels(a) and (b) for
electrophysiological EEG,
EOG, and ECG signals. The
blood oxygenation levels are in
panels (c) and (d) from fNIRS
together with finger-pulse-
oximetry for stimulus and post-
affective stimuli presentation
EEG, EOG & ECG of jubilant audio preSTIM
C3C5T7C4C6T8
Fp1Fp2
F3F4P3P4
AF3AF4AF7AF8
vEOGhEOH
C5
T7
C4
C6
T8
Fp1
Fp2
F3
F4
P3
P4
AF
3A
F4
AF
7A
F8
vEO
GhE
OH
EC
G
EEG, EOG & ECG of jubilant audio STIM
C3C5T7C4C6T8
Fp1Fp2
F3F4P3P4
AF3AF4AF7AF8
vEOGhEOH
C5
T7
C4
C6
T8
Fp1
Fp2
F3
F4
P3
P4
AF
3A
F4
AF
7A
F8
vEO
GhE
OH
EC
G
EEG, EOG & ECG of jubilant audio preSTIM
pulse
left_dO2Hb
left_dHHb:
left_TOI
left_nTHI
right_dO2Hb
right_dHHb
right_TOI
left_
dO2H
b
left_
dHH
b:
left_
TOI
left_
nTH
I
right
_dO
2Hb
right
_dH
Hb
right
_TO
I
right
_nT
HI
EEG, EOG & ECG of jubilant audio STIM
pulse
left_dO2Hb
left_dHHb:
left_TOI
left_nTHI
right_dO2Hb
right_dHHb
right_TOI
left_
dO2H
b
left_
dHH
b:
left_
TOI
left_
nTH
I
right
_dO
2Hb
right
_dH
Hb
right
_TO
I
right
_nT
HI
(a)
(b)
(c)
(d)
Fig. 18 Jubilant (happy)
affective audio stimuli
correlation patterns (averaged
over five subjects in the
experiment) change in panels(a) and (b) for
electrophysiological EEG,
EOG, and ECG signals. The
blood oxygenation levels are in
panels (c) and (d) from fNIRS
together with finger-pulse-
oximetry for stimulus and post-
affective stimuli presentation
AI & Soc (2011) 26:301–315 311
123
previously by Rutkowski et al. (2008) that empathy
response could be recognized and classified from the
EEG responses only. The multimodal EEG, fNIRS,
EOG, ECG, and pulse signals (see Fig. 8) have to be
first preconditioned due to their different sampling fre-
quencies and dynamics. In order to obtain common
coherent interactive responses carrying empathy respon-
ses an approach described by Rutkowski et al. (2009) is
utilized, which first decomposes all signals with utiliza-
tion of empirical mode decomposition (EMD), and later
it clusters the similar components in Huang-Hilbert
spectral domain. This method allows us to identify those
components within each channel which expose spectral
patterns similar across all data channels as well as syn-
chronized with onsets and offsets of the stimuli as shown
in the top panel of Fig. 8. The preprocessed multimodal
neurophysiological and peripheral electrophysiological
signals carrying only components exposing synchrony
with the emotional stimuli presented to the subjects can
be now analyzed for their multimodal cross-correlations,
which we visualize in the form of ellipsoids of pairwise
correlation coefficient matrices as in Figs. 9, 10, 11, 12,
13, 14, 15, 16, 17, 18, 19, and 20. The correlation
coefficient values are visualized in the form of ellipsoids
that are tangent to a unit character square, with the shape
chosen to match the required correlation (R Development
Core Team 2009; Murdoch and Chow 2007).
5 Results and discussion
Brain responses correlation patterns for electrophysiologi-
cal signals (EEG, EOG, and ECG) as well as for blood
oxygenation ones (fNIRS and pulse-oximetry) are pre-
sented for the following affective auditory and visual
stimuli in Figs. 9 and 10 for annoyed (angry); Figs. 11 and
12 for choosing (thinking); Figs. 13 and 14 for revulsion
(disgust); Figs. 17 and 18 for jubilant (happy); Figs. 15 and
16 for startled (surprise); Figs. 19 and 20 for terrified
(fear); emotional displays, respectively. In all the above
figures, correlation pattern transitions are presented in
panels a and b for electrophysiological EEG (brain activ-
ity), EOG (eye movement), and ECG (heart rhythmic
activity) signals (electrodes: C3, C5, T7, C4, C6, T8, Fp1,
Fp2, F3, F4, P3, P4, AF3, AF4, AF7, AF8, vEOG, hEOH,
ECG) and blood oxygenation levels in panels c and d from
fNIRS, capturing also brain activity in the form of oxygen
consumption in forehead left (dO2Hb, dHHb, TOI, nTHI)
and right (dO2Hb, dHHb, TOI, nTHI) areas together with
finger-pulse-oximetry, for stimulus and post-affective
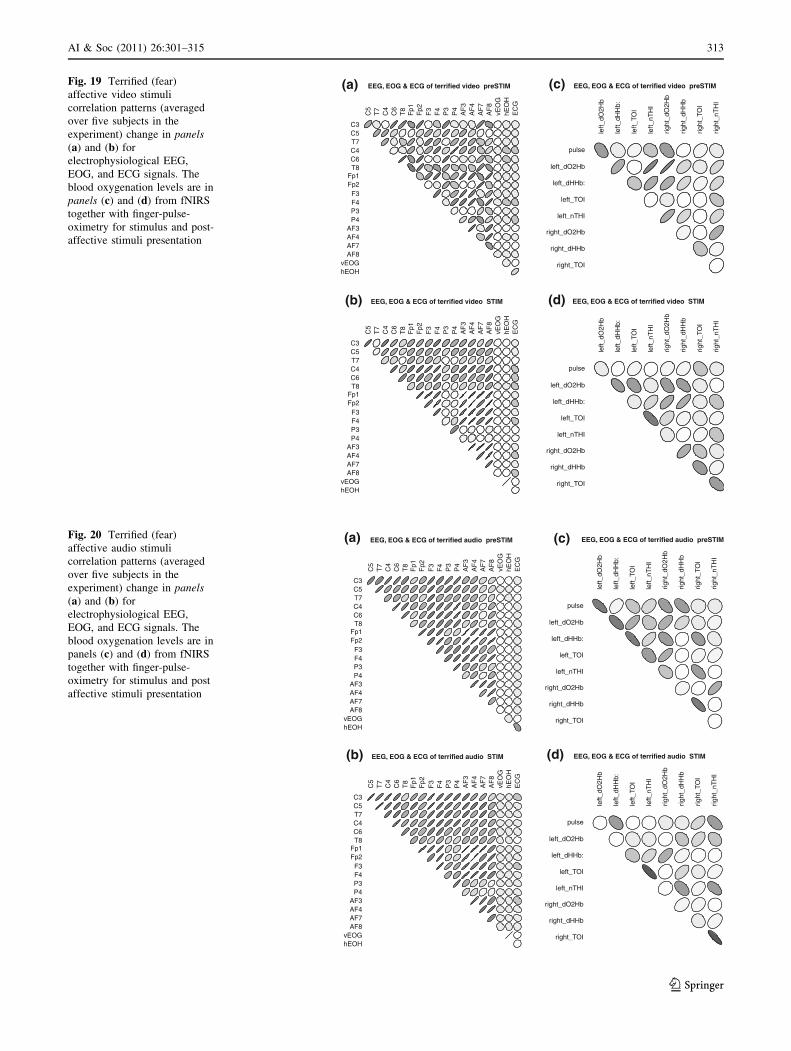
stimuli presentation. For all the cases, changes in correla-
tion matrices patterns for stimuli and pre-stimuli (equal
data lengths) are different generally causing transitions
from less correlated (chaotic) into highly correlated
responses (very synchronized) during the stimuli presen-
tations. Such correlation changes reflect subjects’ atten-
tional synchronization of brain rhythms during affective
stimuli presentation. The difference of average response
reflect changes in stimuli processing. Such different pat-
terns form perfect candidates for further automatic
response classification from user’s ‘‘body-surface-cap-
tured’’ physiological signals, which will be a subject of our
further research.
All of the Figs. 9, 10, 11, 12, 13, 14, 15, 16, 17, 18, 19,
and 20 results in panels a and b, for both auditory and
visual responses, depict transitions from lower correlation
patterns into higher ones, depicted in the form of more
‘‘organized’’ and ‘‘diagonal in shape’’ (similarly to an
unitary diagonal matrix) ellipsoidal shapes. Higher corre-
lation among electrophysiological channels means higher
synchrony or similarity of the recored signals, which usu-
ally relates to coherent stimuli processing of various brain
regions in response to presented stimuli.
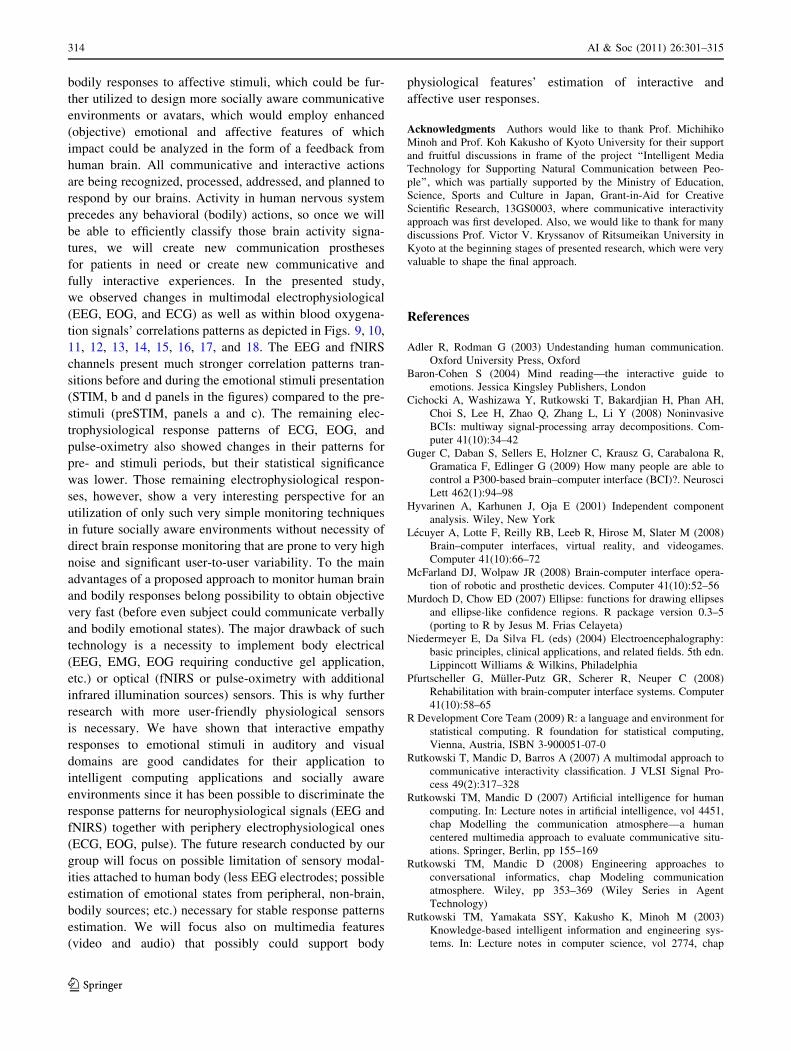
Additionally almost perfectly correlated patterns
(‘‘diagonal matrix’’ alike ellipsoidal shapes) caused by
interactions among EEG electrodes Fp1, Fp2, F3, F4 versus
AF3, AF4, AF7, AF8 emerged (see middle areas of panels
a and b in all of results Figs. 9, 10, 11, 12, 13, 14, 15, 16,
17, 18, 19, and 20), suggesting even higher synchrony in
prefrontal cortices caused by affective/emotional stimuli
interaction of the subjects’ brains. Those two basic features
of subjects’ emotional responses and interaction with
stimuli create a possibility to design brain machine inter-
facing paradigms based on inter-EEG-electrodes correla-
tion patterns, similarly as mutual information features for
natural communicative interaction evaluation utilized in
our previous research and briefly summarized in Sect. 2 In
case of blood oxygenation responses (presented in panels c
and d of all results Figs. 9, 10, 11, 12, 13, 14, 15, 16, 17,
18, 19, and 20), a very interesting drop of correlation in left
and right monitored hemisphere occurred for fNIRS
quantities TOI, nTHI, dHHB. Interactions among fNIRS
and pulse-oxymetry features were less significant, since the
formed patterns did not allow for the classification of
various responses. fNIRS technology responses are slower
and with lower spatial accuracy, thus as also confirmed
with our result, this technology is also well fitted for
interactive affective responses estimation but with less
pronounced features discriminability compared to electro-
physiological signals discussed above in this section.
6 Conclusions
As a result of the presented research, we have shown a
possibility to analyze multimodal brain and peripheral
312 AI & Soc (2011) 26:301–315
123
EEG, EOG & ECG of terrified video preSTIM
C3C5T7C4C6T8
Fp1Fp2
F3F4P3P4
AF3AF4AF7AF8
vEOGhEOH
C5
T7
C4
C6
T8
Fp1
Fp2
F3
F4
P3
P4
AF
3A
F4
AF
7A
F8
vEO
GhE
OH
EC
G
EEG, EOG & ECG of terrified video STIM
C3C5T7C4C6T8
Fp1Fp2
F3F4P3P4
AF3AF4AF7AF8
vEOGhEOH
C5
T7
C4
C6
T8
Fp1
Fp2
F3
F4
P3
P4
AF
3A
F4
AF
7A
F8
vEO
GhE
OH
EC
G
EEG, EOG & ECG of terrified video preSTIM
pulse
left_dO2Hb
left_dHHb:
left_TOI
left_nTHI
right_dO2Hb
right_dHHb
right_TOI
left_
dO2H
b
left_
dHH
b:
left_
TOI
left_
nTH
I
right
_dO
2Hb
right
_dH
Hb
right
_TO
I
right
_nT
HI
EEG, EOG & ECG of terrified video STIM
pulse
left_dO2Hb
left_dHHb:
left_TOI
left_nTHI
right_dO2Hb
right_dHHb
right_TOI
left_
dO2H
b
left_
dHH
b:
left_
TOI
left_
nTH
I
right
_dO
2Hb
right
_dH
Hb
right
_TO
I
right
_nT
HI
(a) (c)
(d)(b)
Fig. 19 Terrified (fear)
affective video stimuli
correlation patterns (averaged
over five subjects in the
experiment) change in panels(a) and (b) for
electrophysiological EEG,
EOG, and ECG signals. The
blood oxygenation levels are in
panels (c) and (d) from fNIRS
together with finger-pulse-
oximetry for stimulus and post-
affective stimuli presentation
EEG, EOG & ECG of terrified audio preSTIM
C3C5T7C4C6T8
Fp1Fp2
F3F4P3P4
AF3AF4AF7AF8
vEOGhEOH
C5
T7
C4
C6
T8
Fp1
Fp2
F3
F4
P3
P4
AF
3A
F4
AF
7A
F8
vEO
GhE
OH
EC
G
EEG, EOG & ECG of terrified audio STIM
C3C5T7C4C6T8
Fp1Fp2
F3F4P3P4
AF3AF4AF7AF8
vEOGhEOH
C5
T7
C4
C6
T8
Fp1
Fp2
F3
F4
P3
P4
AF
3A
F4
AF
7A
F8
vEO
GhE
OH
EC
G
EEG, EOG & ECG of terrified audio preSTIM
pulse
left_dO2Hb
left_dHHb:
left_TOI
left_nTHI
right_dO2Hb
right_dHHb
right_TOI
left_
dO2H
b
left_
dHH
b:
left_
TOI
left_
nTH
I
right
_dO
2Hb
right
_dH
Hb
right
_TO
I
right
_nT
HI
EEG, EOG & ECG of terrified audio STIM
pulse
left_dO2Hb
left_dHHb:
left_TOI
left_nTHI
right_dO2Hb
right_dHHb
right_TOI
left_
dO2H
b
left_
dHH
b:
left_
TOI
left_
nTH
I
right
_dO
2Hb
right
_dH
Hb
right
_TO
I
right
_nT
HI
(a)
(b)
(c)
(d)
Fig. 20 Terrified (fear)
affective audio stimuli
correlation patterns (averaged
over five subjects in the
experiment) change in panels(a) and (b) for
electrophysiological EEG,
EOG, and ECG signals. The
blood oxygenation levels are in
panels (c) and (d) from fNIRS
together with finger-pulse-
oximetry for stimulus and post
affective stimuli presentation
AI & Soc (2011) 26:301–315 313
123
bodily responses to affective stimuli, which could be fur-
ther utilized to design more socially aware communicative
environments or avatars, which would employ enhanced
(objective) emotional and affective features of which
impact could be analyzed in the form of a feedback from
human brain. All communicative and interactive actions
are being recognized, processed, addressed, and planned to
respond by our brains. Activity in human nervous system
precedes any behavioral (bodily) actions, so once we will
be able to efficiently classify those brain activity signa-
tures, we will create new communication prostheses
for patients in need or create new communicative and
fully interactive experiences. In the presented study,
we observed changes in multimodal electrophysiological
(EEG, EOG, and ECG) as well as within blood oxygena-
tion signals’ correlations patterns as depicted in Figs. 9, 10,
11, 12, 13, 14, 15, 16, 17, and 18. The EEG and fNIRS
channels present much stronger correlation patterns tran-
sitions before and during the emotional stimuli presentation
(STIM, b and d panels in the figures) compared to the pre-
stimuli (preSTIM, panels a and c). The remaining elec-
trophysiological response patterns of ECG, EOG, and
pulse-oximetry also showed changes in their patterns for
pre- and stimuli periods, but their statistical significance
was lower. Those remaining electrophysiological respon-
ses, however, show a very interesting perspective for an
utilization of only such very simple monitoring techniques
in future socially aware environments without necessity of
direct brain response monitoring that are prone to very high
noise and significant user-to-user variability. To the main
advantages of a proposed approach to monitor human brain
and bodily responses belong possibility to obtain objective
very fast (before even subject could communicate verbally
and bodily emotional states). The major drawback of such
technology is a necessity to implement body electrical
(EEG, EMG, EOG requiring conductive gel application,
etc.) or optical (fNIRS or pulse-oximetry with additional
infrared illumination sources) sensors. This is why further
research with more user-friendly physiological sensors
is necessary. We have shown that interactive empathy
responses to emotional stimuli in auditory and visual
domains are good candidates for their application to
intelligent computing applications and socially aware
environments since it has been possible to discriminate the
response patterns for neurophysiological signals (EEG and
fNIRS) together with periphery electrophysiological ones
(ECG, EOG, pulse). The future research conducted by our
group will focus on possible limitation of sensory modal-
ities attached to human body (less EEG electrodes; possible
estimation of emotional states from peripheral, non-brain,
bodily sources; etc.) necessary for stable response patterns
estimation. We will focus also on multimedia features
(video and audio) that possibly could support body
physiological features’ estimation of interactive and
affective user responses.
Acknowledgments Authors would like to thank Prof. Michihiko
Minoh and Prof. Koh Kakusho of Kyoto University for their support
and fruitful discussions in frame of the project ‘‘Intelligent Media
Technology for Supporting Natural Communication between Peo-
ple’’, which was partially supported by the Ministry of Education,
Science, Sports and Culture in Japan, Grant-in-Aid for Creative
Scientific Research, 13GS0003, where communicative interactivity
approach was first developed. Also, we would like to thank for many
discussions Prof. Victor V. Kryssanov of Ritsumeikan University in
Kyoto at the beginning stages of presented research, which were very
valuable to shape the final approach.
References
Adler R, Rodman G (2003) Undestanding human communication.
Oxford University Press, Oxford
Baron-Cohen S (2004) Mind reading—the interactive guide to
emotions. Jessica Kingsley Publishers, London
Cichocki A, Washizawa Y, Rutkowski T, Bakardjian H, Phan AH,
Choi S, Lee H, Zhao Q, Zhang L, Li Y (2008) Noninvasive
BCIs: multiway signal-processing array decompositions. Com-
puter 41(10):34–42
Guger C, Daban S, Sellers E, Holzner C, Krausz G, Carabalona R,
Gramatica F, Edlinger G (2009) How many people are able to
control a P300-based brain–computer interface (BCI)?. Neurosci
Lett 462(1):94–98
Hyvarinen A, Karhunen J, Oja E (2001) Independent component
analysis. Wiley, New York
Lecuyer A, Lotte F, Reilly RB, Leeb R, Hirose M, Slater M (2008)
Brain–computer interfaces, virtual reality, and videogames.
Computer 41(10):66–72
McFarland DJ, Wolpaw JR (2008) Brain-computer interface opera-
tion of robotic and prosthetic devices. Computer 41(10):52–56
Murdoch D, Chow ED (2007) Ellipse: functions for drawing ellipses
and ellipse-like confidence regions. R package version 0.3–5
(porting to R by Jesus M. Frias Celayeta)
Niedermeyer E, Da Silva FL (eds) (2004) Electroencephalography:
basic principles, clinical applications, and related fields. 5th edn.
Lippincott Williams & Wilkins, Philadelphia
Pfurtscheller G, Muller-Putz GR, Scherer R, Neuper C (2008)
Rehabilitation with brain-computer interface systems. Computer
41(10):58–65
R Development Core Team (2009) R: a language and environment for
statistical computing. R foundation for statistical computing,
Vienna, Austria, ISBN 3-900051-07-0
Rutkowski T, Mandic D, Barros A (2007) A multimodal approach to
communicative interactivity classification. J VLSI Signal Pro-
cess 49(2):317–328
Rutkowski TM, Mandic D (2007) Artificial intelligence for human
computing. In: Lecture notes in artificial intelligence, vol 4451,
chap Modelling the communication atmosphere—a human
centered multimedia approach to evaluate communicative situ-
ations. Springer, Berlin, pp 155–169
Rutkowski TM, Mandic D (2008) Engineering approaches to
conversational informatics, chap Modeling communication
atmosphere. Wiley, pp 353–369 (Wiley Series in Agent
Technology)
Rutkowski TM, Yamakata SSY, Kakusho K, Minoh M (2003)
Knowledge-based intelligent information and engineering sys-
tems. In: Lecture notes in computer science, vol 2774, chap
314 AI & Soc (2011) 26:301–315
123

Toward the human communication efficiency monitoring from
captured audio and video media in real environments. Springer,
Berlin, pp 1093–1100
Rutkowski TM, Cichocki A, Ralescu AL, Mandic DP (2008)
Emotional states estimation from multichannel EEG maps. In:
Wang R, Gu F, Shen E (eds) Advances in cognitive neurody-
namics ICCN 2007, Proceedings of the international conference
on cognitive neurodynamics, Neuroscience. Springer, Berlin,
pp 695–698
Rutkowski TM, Cichocki A, Tanaka T, Mandic DP, Cao J, Ralescu
AL (2009) Multichannel spectral pattern separation—an EEG
processing application. In: Proceedings of the 2009 IEEE
international conference on acoustics, speech, and signal
processing (ICASSP2009), IEEE. pp 373–376
Rutkowski TM, Mandic DP, Cichocki A, Przybyszewski AW (2010)
EMD approach to multichannel EEG data—the amplitude and
phase components clustering analysis. J Circuits Syst Comput
(JCSC) 19(1):215–229
Schlogl A, Brunner C (2008) Biosig: a free and open source software
library for BCI research. Computer 41(10):44–50
AI & Soc (2011) 26:301–315 315
123