Embed Size (px)
Citation preview

International Journal of Medicine and Medical Sciences Vol. 3(6), pp. 201-209, June 2011 Available online http://www.academicjournals.org/ijmms ISSN 2006-9723 ©2011 Academic Journals
Full Length Research Paper
Emotion recognition based on the asymmetric left and right activation
Kwang Shin Park1*, Hyun Choi1, Kuem Ju Lee1, Jae Yun Lee1, Kwang Ok An1 and Eun Ju Kim2
1National Rehabilitation Center Research Institute, 142-884, Seoul, Korea.
2National Rehabilitation Hospital, Seoul, 142-884, South Korea.
Accepted 21 June, 2011
We obtained EEG (electroencephalogram) data from 34 healthy subjects while they were watching emotion-inducing videos and we also developed a real-time emotion monitoring system based on the resulting data. When analyzed from the left and right asymmetric EEG data in each emotion state as compared to the rest state (p<0.1), the alpha wave significantly decreased only at the left temporal lobe for the negative emotion. In particular, the increase of the beta wave was observed only at the left temporal lobe in the fear emotion (p<0.0025), which means inactivation of the left brain. On the other hand, the alpha wave decreased at the C4 in the happy emotion; and in the peaceful state, the gamma wave increased in T5 and the alpha wave decreased in CP5. However, when considering that the number of sample groups was less than seventeen, this result satisfied the independence between the EEG of the frequency band of a certain electrode position of a certain emotion and that of other emotion which is the condition of the emotion recognition algorithm, but it almost does not satisfied the overlap among emotions. However, as this was possible by the additional test, the emotion recognition was considered to be possible. The purpose of the present study; area: systems > emotion was to extract emotion indicators/indices from the EEG signals detected in the human scalp and develop a real-time emotion monitor showing emotional states of people, so that they can express their thoughts and feelings, even if they are passive. Key words: Electroencephalogram (EEG), emotion, index, activation, asymmetry.
INTRODUCTION There have been quite a few studies on the relationship between emotion and the brain. For example, cortical inactivation was implicated with an increase in the alpha wave and brain activation was involved in an increase in the beta wave. Increased alpha activity (8 to 12 Hz on the EEG [Electroencephalogram] frequency band) was shown to be an indication of brain inactivity, while de-creased alpha activity was an indication of greater brain activity (Niemic, 2002). Moreover Frontal EEG alpha asymmetry, approach, and withdrawal, a sizable literature supports the approach/ withdrawal model of frontal EEG alpha asymmetry, moti-vation and emotion (Davidson, 1993, 1998). According to this model, patterns of frontal brain activity (with activity inferred as the inverse of alpha power) correspond to motivational propensities to *Corresponding author. E-mail: [email protected]. Tel: 82-02-901-1962. Fax: 82-02-901-1920.
approach versus withdraw (Coan and Allen, 2003). Specifically, relatively greater left frontal activity corresponds with an increased trait tendency to approach or respond more intensely to affectively positive stimuli, whereas relatively greater right frontal activity (or, possibly, less left activity) (Coan et al., 2001) corresponds with an increased trait tendency to withdraw or respond more intensely to affectively negative stimuli (Tomarken et al., 1990; Wheeler et al., 1993). Left frontal inactivation was an indicator of a withdrawal response, which was often linked to a negative emotion while right frontal inactivation was shown to be a sign of an approach response, or positive emotion (Bos, 2006). Both joy and happiness showed relatively greater left frontal alpha activation whereas both fear and sadness showed greater right alpha activation (Trainor and Schmidt, 2003). In other words, the asymmetry of inactivity in right and left brain which alpha and beta wave indicate could be seen as reflection of emotions.
Here, we will look into the relationship between the

202 Int. J. Med. Med. Sci.
Figure 1. 10 to 20 system of 32-channel.
emotion and the left or right activation of the brain from the increase or decrease of either side of left or right of the specific EEG which shows the left and right asymmetry. MATERIALS AND METHODS Participants Thirty four normal subjects aged ranging from 20 to 70 participated in this study with the gender ratio of around 50:50 between male and female. People with low cognitive ability were excluded in the study. For the exclusion criteria, the Korean mini-mental state exa-mination (K-MMSE), a well-known examination for overall cognitive function, was used to exclude those who received the scores less than 24 points out of 30. Apparatus and materials
The EEG data were obtained using the 32-channel EEG system (LAXTHA LXE3232-RF). Stimulations selected for this study were as follows: comic films “secret reunion”, “God of cookery”, “kung fu hustle”, “castaway on the moon”, “long river” and “my sassy girl” were chosen for visual stimulation for happy emotion; movies: “grand chef”, “be with you”, ”closer to heaven”, and “a family” were chosen for sad emotion; EBS documentary and movies: “old partner”, “up”, “good will hunting”, ”cinema paradiso”, and “forrest gump” were chosen for peaceful emotion; a horror movie: “Juon- old lady in white, girl in black”, “Yoga institute”, and “Alice in wonderland” were chosen for fearful emotion.
Procedures In the beginning of the experiment, the subjects signed an informed consent and filled out some forms including their demographic
information (for example age, years of education, handedness, etc.) and medical conditions (medical history, medication, caffeine intake, smoking, depression etc.). The experiment was done as follows: four types of visual stimulations were given in fixed randomized method for 10 min each with 5 min intervals. The EEG was measured at 256 Hz sampling rate of a total of 32 channels by placing 10 to 20 systems (Figure 1). Analyses
It was difficult to select appropriate visual stimulations since everyone had different level of emotions for the same stimulations. In this study, the subjects were told to press the emotion button in order to increase the concentration level and the reliability of the data. The data were analyzed as follows: The data of a person who was to be applied to the statistics in each emotion state were determined at the average values between 10 s before and after the button was pressed, that was to say for the period of a total of 20 s. On the other hand, in case of the resting period, it was done at the section of 5 m which was the entire section. It was necessary to regard the EEG under 4 Hz as the noise and remove it during the analysis. Therefore with relative power as a denominator, waves under 4 Hz or delta were eliminated. The relative power was redefined as follows:
Where: Th = absolute power of theta wave (4~8 Hz); Al = absolute power of alpha wave (8~13 Hz); Be = absolute power of beta wave (13~30Hz); Ga = absolute power of gamma wave (30~50 Hz).
Besides, the EEG which went through the 4 Hz high-pass filtering process was used in the SEF-90% that is ‘spectral edge frequency’ as well. Imbedded system In order to check the results statistically obtained from subjects, the embedded system which was comprised of the analog circuits of Figure 2 and the digital circuits of Figure 3 was designed. And, in order to remove the 60 Hz power noise, the following second Butterworth notch filter was designed:
(1)
Where: z: complex variable; X(z): z-transform of the digital input signal; Y(z): z-transform of the digital output signal and the result could be seen in Figure 4.
And also, in order to reduce the noise as much as possible, the following 4th Chebyshev high pass filter was gone through.
(2)
Relative power of theta wave =Th
Th + Al + Be + Ga
Relative power of beta wave = Be
Th + Al + Be + Ga
Relative power of alpha wave =Al
Th + Al + Be + Ga
Relative power of gamma wave =Ga
Th + Al + Be + Ga
Y60hz (z) =0.9634 −0.1898 z−1+0.9634 z−2
−0.1898z−1+0.9268 z−2X(z)
Y4hz (z) =0.8732 ×(1−4z−1+6z−2−4z−3+z −4)
−3.7274 z−1+5.2247 z−2
−3.2641 z−3+0.7670 z−4
Y60hz (z)

Park et al. 203
Figure 2. Analog, digital and power circuit of the real-time EEG measurement embedded system for emotion recognition.
Figure 3. Final analog EEG in the T3 (red) and 60 Hz-removed EEG (black).

204 Int. J. Med. Med. Sci.
Figure 4. State diagram that monitors the relative power for 20 s.
Then, the following 3th Chebyshev band-pass filter was used to obtain the alpha wave.
(3) Where: Bandwidth = 5 Hz.
(4) Where: Bandwidth = 20 Hz, Lower cut-off frequency = 28 Hz, Upper cut-off frequency = 52 Hz, Passing-band ripple = 0.9 db, Stop-band ripple = 2 db.
The following 3th Chebyshev band filter was used to obtain the signals of all frequency bands including theta, alpha, beta and
gamma waves to obtain the relative power.
(5) Where: Bandwidth = 46 Hz, Lower cut-off frequency = 3.5 Hz, Upper cut-off frequency = 50.5 Hz, Passing-band ripple = 0.5 db, Stop-band ripple = 10 db.
Figure 5 shows the algorithm that monitors the relative power from the wave between the beta wave and 4~50 Hz for 20 s in real time and Figure 6 shows the finally realized hardware.
RESULTS
By excluding the subjects who slept during the rest intervals from the statistical analysis, the paired t-test with
YAlpha (z) =0.000175 × (1 − 3z−2 + 3z−4 − z−6)
−5.6576z−1 + 13.5253z−2 − 17.4814z−3
+12.8824z−4 − 5.1327z−5 + 0.8642z−6
Y4hz (z)
YGamma (z) =0.0081 × (1 − 3z−2 + 3z−4 − z−6)
−3.0565z−1 + 5.4394z−2 − 5.9567z−3
+4.5247z−4 − 2.1044z−5 + 0.5744z−6
Y4hz (z)
Y4hz ~50hz (z) =0.0278 × (1 − 3z−2 + 3z−4 − z−6)
−4.4111z−1 + 8.4759z−2 − 9.2342z−3
+6.0728z−4 − 2.2803z−5 + 0.3779z−6
Y4hz (z)
Park et al. 205
Figure 5. Real-time 1-channel embedded EEG measurement system for the finally designed emotion recognition.
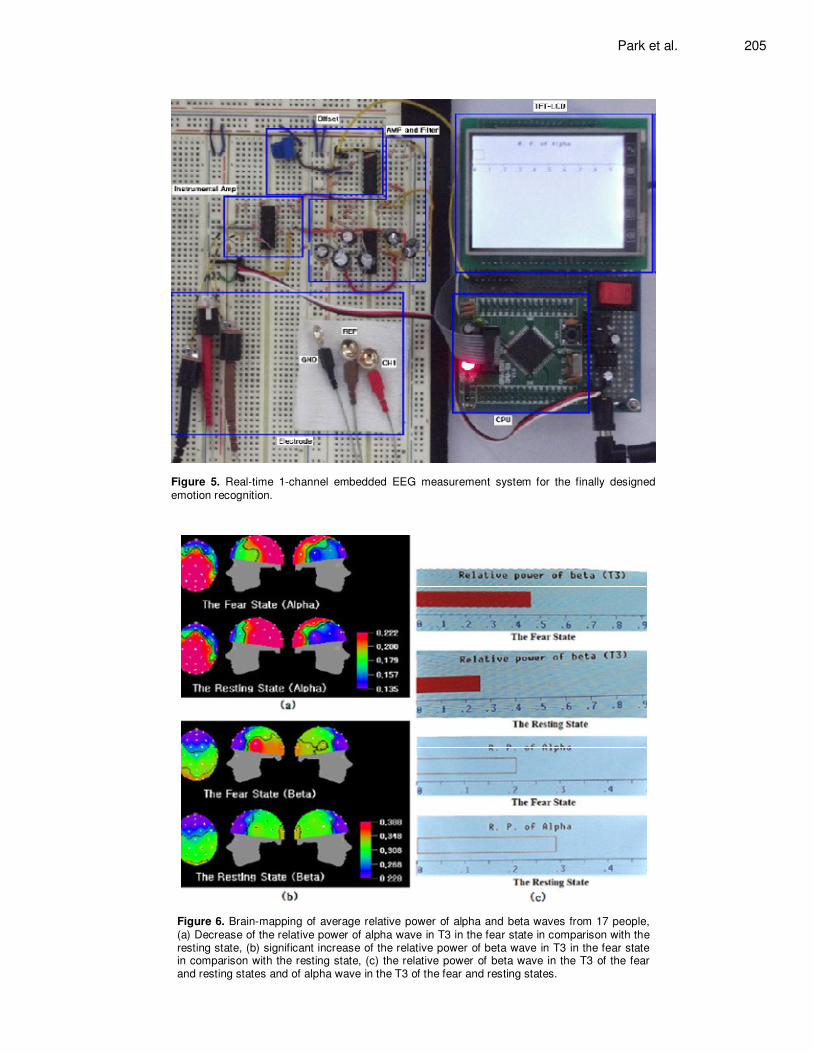
Figure 6. Brain-mapping of average relative power of alpha and beta waves from 17 people,
(a) Decrease of the relative power of alpha wave in T3 in the fear state in comparison with the resting state, (b) significant increase of the relative power of beta wave in T3 in the fear state in comparison with the resting state, (c) the relative power of beta wave in the T3 of the fear and resting states and of alpha wave in the T3 of the fear and resting states.

206 Int. J. Med. Med. Sci.
Table 1. Paired t-test of the happy, sad, peaceful, fear states and the resting state for the left and right value, and the result of subtracting the right value from the left value in the relative power of alpha, beta and gamma waves. R. P. means relative power
Variable Method Difference P value
T3 - T4
Alpha (R. P.)
Sadness<rest 0.05
T3 0.05
T3 - T4 Fear<rest
0.0025
T3 0.025
T3 - T4 Beta (R. P.) Fear>rest
0.0005
T3 0.0025
T3 - T4 SEF-90%
Fear>rest 0.01
T4 Fear<rest 0.05
T5 - T6 Alpha (R. P.) Sadness<rest
0.1
T5 0.01
T5 - T6 Gamma (R. P.) Peace>rest
0.005
T5 0.05
CP5 - CP6 Alpha (R. P.) Peace <rest
0.025
CP5 0.025
C3 - C4 Alpha (R. P.)
Happy>rest 0.05
C4 Happy<rest 0.1
the rest state was executed by having only fifteen (15) subjects for happy, seventeen (17) for sadness, sixteen (16) for peace and seventeen (17) for fear as the sample group, and the degree of the activation was evaluated by checking the case that showed the change only in either of the left or right side only when the asymmetry was shown for the specific EEG of the left and right electrode positions and the analysis was conducted through checking the arousal by SEP-90%.
Fear index
As could be seen in Table 1, when the fear and rest state at the temporal lobe (T3 and T4) for seventeen (17) subjects were compared, the significant left and right difference in the relative power of the alpha wave existed (p<0.0025), and the alpha wave decreased only at the left side in the fear state. And also, there existed a significant left and right difference in the relative power of the beta wave (p<0.0005), and the beta wave increased only at the left side in the fear state (p<0.0025). And, the SEF-90%, that is, the arousal decreased only at the right side in the fear state. Besides, when considering the significant left and right asymmetry of SEF-90% (p<0.01), it could be said that the right brain is not aroused even
though the fear emotion is introduced. As a result, it was found that the fear emotion activated the left brain only, and it could be indicated as follows and confirmed in real-time (Figure 6).
Where: R. P. means relative power; SEF means spectral edge frequency.
Sadness index
When the sadness state and rest state were compared, there existed a left and right difference in the relative power of the alpha wave for T3 and T4, and the alpha wave decreased only at the left side in the sadness state. Also, there existed a left and right difference in the relative power of the alpha wave for T5 and T6 as well, and the alpha wave decreased significantly only at the left side in the sad state (p<0.01). Though the beta wave was not considered, the activation of the left brain could be considered as one of the causes of such a phenomenon, and it could be indicated as follows and confirmed in real-time (Figure 7).
+,-. =R. P. of Beta Wave of T3
R. P. of Alpha Wave of T3

Park et al. 207
Figure 7. Brain-mapping of average relative power of alpha wave from 17 people, (a) Decrease of the relative power of alpha wave in T3 in the sad state in comparison with the resting state, (b) Significant decrease of the relative power of alpha wave in T5 in the sad state in comparison with the resting state, (c) The relative power of alpha wave in the T3 of the sad and resting states.
Peace index When the peaceful and rest state were compared, there existed a significant left and right difference in the relative power of the gamma wave for T5 and T6 (p<0.005), and the gamma wave increased only at the left side in the peaceful state. Also, there existed a left and right difference in the relative power of the alpha wave for CP5 and CP6 as well, and the alpha wave decreased only at the left side in the peaceful state. However, it was not appropriate to determine that the peace emotion activated the left brain for the decrease of the left alpha wave which was asymmetric due to the low significance. The peace emotion could be indicated as follows and confirmed in real-time (Figure 8).
Happy index When the happy and rest state were compared, there existed a left and right difference in the relative power of the alpha wave for C3 and C4, and the alpha wave decreased only at the right side in the happy state (Figure 9). The happy emotion could be indicated as follows and confirmed in real-time (Figure 9).
DISCUSSION As a result of observing the increase or decrease of EEG for either side of left or right only for the asymmetric case in the group of about seventeen (17) subjects executed by comparing each emotion state with the rest state by the positions of attached electrodes and the frequency band of EEG, there were no such cases that the positions of attached electrodes for relevant frequency band of
1 Sadness = R.P. of Alpha Wave of T3 × R.P. of Alpha Wave of T5
1,-2, =R. P. of Gamma Wave of T5
R. P. of Alpha Wave of CP5
4-556 =1
R. P. of Alpha Wave of C4

208 Int. J. Med. Med. Sci.
Figure 8. Brain-mapping of average relative power of alpha and gamma wave from 16 people, (a) Decrease of the relative power of alpha in cp5 in the peaceful state in comparison with the resting state, (b) Increase of the relative power of gamma in t5 in the peaceful state in comparison with the resting state (c) The Relative power of alpha wave in the CP5 of the peaceful and resting states and of gamma wave in the T5 of the peaceful and resting states.
Figure 9. Brain-mapping of average relative power of alpha wave
from 15 people, (a) Decrease of the relative power of alpha wave in C4 in the happy state in comparison with the resting state (b) the relative power of alpha wave in the C4 of the happy and resting states.
EEG among emotions were overlapped except for the negative emotion, that is the Alpha wave of the sadness and fear. Accordingly, we can see the possibility of emotion recognition by determining whether the algorithm for the emotion recognition is needed or not through the additional test (number of sample group≥25) and considering the verification of effectiveness of such EEG indicators in identifying the emotion state of the subject.
ACKNOWLEDGEMENT
This paper is based on research conducted within the project “EEG-based emotional recognition in people with severe disabilities” supported by the National Rehabilitation Center Research Institute
REFERENCES Niemic CP (2002). Studies of emotion: A theoretical and empirical
review of psychophysiological studies of emotion. J. Undergrad. Res., 1: 15-18.
Park et al. 209 Davidson RJ (1993). Cerebral asymmetry and emotion: Conceptual and
methodological conundrums. Cognit. Emot., 7: 115–138. Davidson RJ (1998). Affective style and affective disorders: perspec-
tives from affective neuroscience. Cognit. Emot., 12:307–330. Coan JA, Allen JJB (2003). Frontal EEG asymmetry and the behavioral
activation and inhibition systems. Psychophysiology, 40: 106. Coan JA, Allen JJB (in press). The state and trait nature of frontal EEG
asymmetry in emotion. In: K. Hugdahl and R. J. Davidson (Eds.), The asymmetrical brain. Cambridge, MA: MIT Press.
Coan JA, Allen JJB, Harmon-Jones E (2001). Voluntary facial expression and hemispheric asymmetry over the frontal cortex. Psychophysiology, 38: 912–925.
Bos DO (2006). EEG-based emotion recognition. The Influence of Visual and Auditory Stimuli University.
Trainor LJ, Schmidt LA (2003). Processing Emotions Induced by Music. Cognitive Neuroscience of Music (Oxford), 317p.