Embed Size (px)
Citation preview

20 COMBUSTION ENGINES, No. 2/2013 (153)
Vladimír HLAVŇA Jozef KRAKOvSKÝ
Emissions of the combustion engine as a source of cold for its extreme intercooling
This paper contains results of mathematical modeling connected with non-conventional energetic system using the cooling combustion engine (the engine cooling circle is the ejector of absorption cooling). We especially have focused on the influence of a more intensive cooling on the engine ecological parameters. The paper is a continuation of previ-ous publications and focuses on the results of the designed mathematical model of particulate matter formation and its experimental verification under extreme intercooling. Our previous achievements were already presented on scientific conferences and in professional journals.Key words: non-conventional energetic system, cooling combustion engine, extreme intercooling, PM formation
PTNSS-2013-203
1. IntroductionPermanent increase in primary energy prices lead the
whole energetic industry to look for more efficient methods of producing energy or design new machinery using energy at lower thermal potential levels.
To deal with the above mentioned issue, it is important to maintain both economic and commercial balance. Apart from these criteria it is also necessary to meet the ecological aspects and to create reliable system which provide enough energy in the future.
One area of the current development of existing com-bustion engines focuses on possibilities of using exergy generated by energetic machinery.
Fig. 1. Carnot cycle and coefficient of performance
Thermal efficiency of reversible Carnot cycle – Fig. 1 – expresses how much input thermal energy was transformed into work within the limits of temperatures TK > T0. However, it does not express the magnitude of maximum efficiency of input thermal energy. The maximum temperature gradient, which can be achieved in a real cycle, is the gradient related to the minimum temperature – ambient temperature TOK. The loss in thermodynamic processes in thermal machinery is an amount of heat having a temperature higher than the ambient temperature TOK and lower than the temperature T0. Though it does not mean that this amount of energy – exergy having
the temperature T in the range of TOK < T < T0 cannot be used in other thermal processes. The amount of energy having the temperature lower that the ambient temperature T < TOK, which remains non-usable, is referred to as energy.
2. Cooling combustion engineAn energetic source such as a combustion engine can be
assessed by the coefficient of performance (COP). The value of the coefficient of performance gives an attainable useful output per unit of supply of the given equipment. There is an objective to attain the highest possible level of the COP. In the case of the combustion engine, to simplify the illustration of the COP value, we used Carnot circulation – Fig. 1.
In a classic combustion engine chemically bound energy in air-fuel mixture is converted into thermal energy and by means of a mechanism is transformed to mechanical energy. A substantial part of thermal energy is taken away by the engine cooling and by exhaust gases, which is disadvanta-geous. To achieve more efficient use of thermal energy gath-ered from the burning of air-fuel mixture in the combustion chamber of the engine, cogeneration units are used. It is actually an additional use of thermal energy of the coolant and exhaust gases in exchangers.
Another possibility of using the combustion engine cooling medium is its combination with the independent absorption cooling equipment via the heat pipe. The pipe provides the supply of the engine cooling medium into the generator (expeller) of the absorption cooling equipment. Such an arrangement does not enable to make use of the usable temperature gradient. To perform simultaneously oc-curring processes the mechanical work of the engine on the one hand, and the heating of its cooling medium on the other hand, two independent sets of equipment are required. The amount of output performed by the combustion engine in the energetic system – Fig. 2 – can be defined for the cases:
– after-expansion part of energy bound by exhaust gases and in the cooling system is referred to as anergy [3],
Am = E0 = Qp · (1 – T0/TK) ≈ Qe
Article citation info: HLAVŇA, V., KRAKOVSKÝ, J. Emissions of the combustion engine as a source of cold for its extreme intercooling. Combustion Engines. 2013, 2(153), 20-27. ISSN 0138-0346.

21COMBUSTION ENGINES, No. 2/2013 (153)
– as exergy [3],
Ac = E = Qp · (1 – TOK/TK) ≈ Qc
Ac represents the maximum performance achievable in the system defined by means of the energetic system. The value of the achieved performance (corresponding to thermal flow Qc) influences the assessment of energetic efficiency of thermal equipment and energetic systems.
Fig. 2. A scheme of energetic system
The combustion engine with a non-conventional cool-ing circuit – cooling combustion engine can be used as an element for qualitatively new equipment designed for more effective use of fuel energy by means of a non-conventional progressive principle of transformation of heat to cold via thermo compression.
Non-conventionality of the combustion engine used in the solution of the non-conventional energetic unit is given by a new construction of its cooling system. The cooling system as part of the absorption cooling equip-ment is to provide the evaporation process. In order to provide the evaporation process it is necessary to use a non-conventional coolant in the engine jacket. The cool-ant features other physical properties than the original coolant.
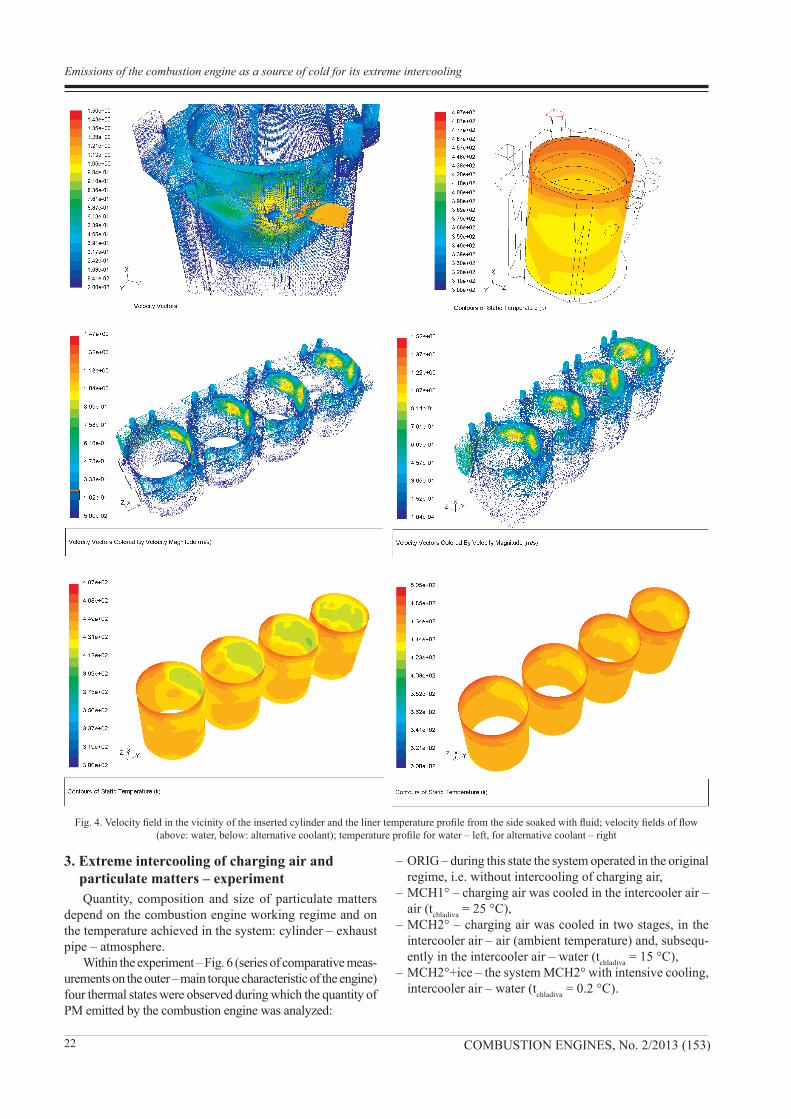
Due to the above mentioned reason of the combustion engine cooling by means of the non-conventional coolant it was necessary to examine heat transfer – energy from the cylinder liner into the fluid and flow in its vicinity.
To assess the flow and heat transfer in the inserted cyl-inder vicinity the below parameters were chosen and further examined:– pressure field in the chamber of the inserted cylinder – Fig. 3,– temperature field of heat transfer – Fig. 3,– velocity field – Fig. 4,– thermal state of the cylinder liner on the side soaked with
fluid – Fig. 4,– field of turbulent intensity on the cylinder liner – Fig. 5,
– streamlines for observation of the coolant flow pathways – Fig. 5,
– value of the specific heat flow through the cylinder liner.
Not only on the basis of the mentioned modeling but also on the basis of results from the performed experiments it can be said that the combustion engine as the expeller for the absorption cooling system will be suitable for a long-term operation when an alternate coolant is used. Possible schemes of usage are illustrated in Fig. 6. At present the op-timization of control for such an energetic system equipped with a cooling combustion engine is being resolved.
The cooling engine can be used in the motor vehicle transporting cargo which requires cooling but also to provide comfort in the passenger and service space. The produced cold can also be used for the cooling of charging medium for the combustion process to improve combus-tion parameters. That was the reason why the influence of extreme intercooling of charging medium on ecological parameters of the engine, with special focus on PM forma-tion was examined.
Fig. 3. Pressure and temperature distribution in the inserted cylinder chamber
Emissions of the combustion engine as a source of cold for its extreme intercooling
22 COMBUSTION ENGINES, No. 2/2013 (153)
3. Extreme intercooling of charging air and particulate matters – experimentQuantity, composition and size of particulate matters
depend on the combustion engine working regime and on the temperature achieved in the system: cylinder – exhaust pipe – atmosphere.
Within the experiment – Fig. 6 (series of comparative meas-urements on the outer – main torque characteristic of the engine) four thermal states were observed during which the quantity of PM emitted by the combustion engine was analyzed:
– ORIG – during this state the system operated in the original regime, i.e. without intercooling of charging air,
– MCH1° – charging air was cooled in the intercooler air – air (tchladiva = 25 °C),
– MCH2° – charging air was cooled in two stages, in the intercooler air – air (ambient temperature) and, subsequ-ently in the intercooler air – water (tchladiva = 15 °C),
– MCH2°+ice – the system MCH2° with intensive cooling, intercooler air – water (tchladiva = 0.2 °C).
Fig. 4. Velocity field in the vicinity of the inserted cylinder and the liner temperature profile from the side soaked with fluid; velocity fields of flow (above: water, below: alternative coolant); temperature profile for water – left, for alternative coolant – right
Emissions of the combustion engine as a source of cold for its extreme intercooling

23COMBUSTION ENGINES, No. 2/2013 (153)
Fig. 6. Scheme of the test bench
Fig. 7 shows the changes in amounts of PM emitted by the combustion engine in five torque regimes of the crankshaft during three modes of charging air intercooling compared with the original state, i.e. without any additional intercooling.
The experiment showed that when the temperature of the charging air decreased, the amount of PM produced by the combustion engine also decreased. The total amount of PM thus shows the dependence on the charging air temperature. The graphical dependences Figs. 8–12 illu-strate the found correlations between the decrease in the charging air temperature due to the influence of used in-tercooling and the decrease in the amount of PM emission. Because of the predictive value of the mentioned correla-tion dependence the new y-axis represents a percentage decrease – increase of the charging medium temperature
and a percentage decrease – increase of the amount of PM. The x-axis represents three sectors – three ways of used intercooling. 100 percent at the beginning of both curves represent the initial temperature of the charging medium and the initial value of MP amount without intercooling, i.e. at the “org” state.
Fig. 7. PM emission by CE in analyzed modes of intercooling
Fig. 8. Dependence of t and PM at n = 1200 min–1
Fig. 5. Turbulence intensity on the cylinder liner and streamlines of the flow field
Emissions of the combustion engine as a source of cold for its extreme intercooling

24 COMBUSTION ENGINES, No. 2/2013 (153)
At 1200 min–1 the air temperature in the location behind MCH2 without intercooling was 44.5 ºC. The recorded decrease of this value – Fig. 8 was, due to the used modes of intercooling, 6.2 °C for MCH1°, 26 °C for MCH2° and 40.2 °C for MCH2°+ice. The PM amount compared with the value without intercooling decreased by 19.4 % for MCH2° and 31.5 % for MCH2°+ice.
Fig. 9. Dependence of t and PM at n = 1450 min–1
The decrease in charging air temperature at the speed of 1450 min–1 – Fig. 9 has an almost identical character as in the previous case. The relative temperature increased up to 54.6 ºC and intercooling caused the decrease in temperatures by 17 % for MCH1°, for MCH2° by 63.2 % and for MCH2°+ice by 88.3 %. Due to the intercooling (air/air) the amount of PM emission decreased by 20.7 % for MCH2° and for the intercooling of MCH2°+ice by as much as 28.7 %.
Fig. 10. Dependence of t and PM at n = 1700 min–1
The relative temperature of the charging air at the speed of 1700 min–1 was 61.5 ºC – Fig. 10. The difference of the charging air temperature at MCH1° represented a decrease by 18.2 %, at MCH2° by 65.2 % and at MCH2°+ice by 86.3 % – to the value of 8.4 °C. The PM amount decreased for MCH1° by 2.3 %, for MCH2° by 6.4 % and for MCH2°+ice by 13.5 %.
The charging air temperature at the input to the engine for the “org” state at the speed of 1950 min–1 was 72 ºC. Its decrease due to the intercooling – Fig. 11 was for MCH1° 22.5 %, for MCH2° 67.9 % and for MCH2°+ice 84.6 %. In
this speed regime only minimal decrease in the amount of PM in exhaust gases was recorded.
Fig. 11. Dependence of t and PM at n = 1950 min–1
Fig. 12. Dependence of t and PM at n = 2200 min–1
The initial temperature of the charging air at the input of the engine at the speed of 2200 min–1 was 79.1 ºC. Fig. 12 illustrates the decrease in temperature due to the use of all three modes of intercooling, namely the decrease by 29.5 % for MCH1°, 69.2 % for MCH2° and by 83.3 % for MCH2°+ice. The decrease in the produced PM amount was observed more markedly for MCH2° and MCH2°+ice by 6.7 % and 8.5 % respectively.
4. Model of PM formationTo predict the amount of soot during combustion of air-
fuel mixture in the combustion chamber we come out of two main groups of models respecting: – the influence of selected constructional parameters – cor-
relation group, – soot formation phenomena in the real combustion chamber
– physical and chemical group. The created simulation model belongs to the group of cor-
relation models. It comes out of the existing model created by the authors C. Argachoy (São Bernardo do Campo SP Brazil) and A. P. Pimenta (São José dos Campos, SP Brazil) giving empirical relations from which the values serving as boundary conditions and parameter for calculation were obtained.
To characterize mass and velocity flows of the fuel leav-ing the nozzle opening, at least two out of three following coefficients are needed (Brasil model):
Emissions of the combustion engine as a source of cold for its extreme intercooling

25COMBUSTION ENGINES, No. 2/2013 (153)
– coefficient of fuel nozzle displacement,– coefficient of contraction,– velocity coefficient of injected fuel.
The coefficient of displacement (given by the product of the remaining two) characterizes the fuel mass flow while the remaining two characterize motion fuel flow.
Other important data are as follows: – fuel spray dispersion angle,– liquid length,– start length,– equivalence ratio of the system (oxidant-fuel ratio to
oxidant-fuel ratio in the stoichiometric mixture).
Fig. 13. 3D model of the cylinder and combustion chamber with piston at the bottom dead center
The combustion space model was created in the graphical CAD program CATIA V5R20 according to the real dimen-sions – Fig. 13. In the program environment GAMBIT, a mesh for the cylinder HEX/WEDGE volume and for the combustion space TET/HYBRID volume was defined. Fig. 14a shows a mesh of the cylinder and combustion space volume. Fig. 14b shows a cross section of the cylinder and combustion space meshing.
Fig. 14 a, b. Mesh of the volume and its cross section
The meshed volume was exported to the program FLU-ENT in which boundary conditions for fuel injection were de-fined. At the injection modeling and combustion simulation, and thus at PM formation, liquid fuel – n-heptane (C7H16) was considered. Its physical and chemical characteristics which are almost identical with diesel fuel enable its use for simulations in the chosen program environment.
The process of combustion simulation was preceded by determining and defining the position of ejection nozzle openings because the nozzle and its holder are mutually directionally oriented.
Figs. 15–17 show graphical outputs of modeling of fuel injection into the combustion chamber at different degrees of the crankshaft rotation.
Fig. 15. Beginning of injection (planes xy and xz); pre injection 24°
The influence of air whirling can be seen in Fig. 17 (whirl number 2) in the combustion chamber on a ray of injected fuel which was taken into consideration during the simulation.
The Eddy dissipation model was used as a simulation model. It is based on an assumption that a chemical reaction compared with other transportation processes is a rapid proc-ess. As soon as the reactants of a chemical reaction are mixed, products originate. The model assumes a direct connection between the speed of a chemical reaction and time needed
Emissions of the combustion engine as a source of cold for its extreme intercooling

26 COMBUSTION ENGINES, No. 2/2013 (153)
for mixing the reactants on a molecular level. The time is a dominant factor of whirling characteristics at turbulent flows and that is why the velocity is proportional to the mixing time defined by turbulent kinetic energy. It ignores chemi-cal kinetics and is based only on a mixing ratio of reactants entering the chemical reaction. It can be used for simulations of combustion of heterogeneous mixtures. The turbulence model is k–ε. The following conditions were declared as boundary for the simulation of combustion:– temperatures of the piston bottom, cylinder head and
cylinder,– temperature and pressure of air in the cylinder at the begin-
ning of compression,– whirl number,– fuel (C7H16),– oxidizer (O2).
Fig. 16. Injection phase (planes xy and xz)
The simulation was taking place during the compression and expansion strokes of the piston. The graphical output of combustion of n-heptane and air mixture in the combustion space during the expansion can be seen in Fig. 18. Khan and Greeves “one-step” model was used for simulation of originating soot. The formation of soot is resolved according to the below equation (Peters, 2000):
in which is: Ysoot – soot mass fraction, σsoot – turbulent Prandtl number of soot transport, Rsoot – net rate of soot generation.
Fig. 17. Influence of air whirling (plane xy)
Fig. 18. Combustion of C7H16 and air mixture
Fig. 19. Course of soot mass fraction (compression and expansion strokes)
Emissions of the combustion engine as a source of cold for its extreme intercooling

27COMBUSTION ENGINES, No. 2/2013 (153)
The course of soot mass fraction (from the total amount = 1) in dependence on time is shown in Fig. 19. The soot mass formed within one cycle showed a decreasing trend due to the used ways of intercooling. The total soot mass fraction towards the end of expansion is for:– org 5.7187·10–7,– MCH1° 5.2752·10–7,– MCH2° 4.6685·10–7,– MCH2°+ice 2.5430·10–7.
5. ConclusionPercentage changes in PM amounts gathered through the
experiment (Δex) and simulation (Δsi) for the considered intercooling for the maximum value of the engine momentum compared with the “org” state is as follows:– for MCH1° [%] Δex = 0.7; Δsi = 7.7;– for MCH2° [%] Δex = 20.7; Δsi = 18.4;– for MCH2°+ice [%] Δex = 28.7; Δsi = 55.1.
In conclusion we can say that the results achieved by the created prediction model of soot formation for the maximum value of the engine torque show the decrease in soot amount with the increasing intensity of intercooling.
The positive influence of the charging air reduced tem-perature on the formation of PM emitted by the combustion engine during air-fuel combustion was confirmed. The differences between results gathered experimentally and through simulation are caused by simplifying assumptions at modeling (mainly due to ignoring the fraction of absorbed hydrocarbons on soot surface). Another source of difference in the results is the fact that the simulation took place di-rectly in the engine cylinder while the exhaust gas samples were taken from the exhaust pipe (possible accumulation of amounts from other cylinders and influence of the valve overlap).
AcknowledgementsThis contribution was created within the framework of the
project KEGA 038ŽU-4/2011, which are supported by the Ministry of Education of the Slovak Republic.
NomenclatureAm mechanical workCOP coefficient of performanceICE internal combustion engineMCH1° air-to-air intercoolingMCH2° air-to-air and water-to-air intercoolingMCH2°+ice air-to-air intercooling and extremely water-to-airC7H16 n-heptane orig system without air intercooling Pe efficient performancePM solid particulatesQch heat removed by coolingQe efficient heatQost other heatQ0 heat removedQp heat suppliedQvýf exhaust heatQzv residual heatRsoot net rate of soot generationt temperatureTOK ambient temperaturev fuel injection speedYsoot soot mass ratioρ fuel densityσsoot turbulent Prandtl number for soot transportµ loss coefficient
Bibliography[1] Argachoy C., Pimenta A.P.: Phenomenological model of par-
ticulate matter emission from direct injection diesel engines. 2005. 2012 [online] . [cit. 15.01.2012]. http://www.scielo.br/pdf/jbsmse/v27n3/25398.pdf.
[2] Bradley D., et. al.: The measurement of laminar burning veloci-ties and Markstein numbers for iso-octanea-air and iso-octane-n-heptane-air mixtures at elevated temperatures and pressures in an explosion bomb. 1998. 2012 [online]. [cit. 17.01.2012]. http://leva.leeds.ac.uk/men6ml/COMBUST/Our_Publications/OctanePaper.pdf.
[3] Hlavňa V., Kovalčík A., Toporcer E.: Extremely low tempera-tures of diesel engine air charging. Žilina: Edis, s. 113, 2011.
[4] Hlavňa V., et. al.: A non conventional energetic unit with a cooling combustion engine. Žilina: Edis, 2008.
[5] Khan I.M., Greeves G.: Factors affecting smoke and gaseous emissions from direct injection engines and a method of cal-culation. SAE Technical Paper nr 730169, 1973.
[6] Lakshminarayanan P.A., Aghav Y.V.: Modelling diesel com-bustion. London: Springer, s. 305, 2009.
[7] Merkisz J.: Emisja czastek stalych przes silniki spalinowe o zaplonie samoczynnym. Poznaň: Vydavateľstvo Polytechniky Poznanskej, s. 233, 1997.
[8] Peters N.: Turbulent combustion. Cambridge University Press, s. 304, 2000.
Prof. Hlavňa Vladimír, DSc. DEng. – Professor in the Faculty of Mechanical Engineering at Univer-sity of Žilina, SKe-mail: [email protected]
Mr. Krakovský Jozef, DEng. – Faculty of Mechani-cal Engineering at University of Žilina, SK.e-mail: [email protected]
Emissions of the combustion engine as a source of cold for its extreme intercooling