Embed Size (px)
Citation preview
Atmos. Chem. Phys., 13, 9869–9897, 2013www.atmos-chem-phys.net/13/9869/2013/doi:10.5194/acp-13-9869-2013© Author(s) 2013. CC Attribution 3.0 License.
Atmospheric Chemistry
and PhysicsO
pen Access
NOx emissions in China: historical trends and future perspectives
B. Zhao1, S. X. Wang1,2, H. Liu 1,2, J. Y. Xu1, K. Fu1, Z. Klimont 3, J. M. Hao1,2, K. B. He1, J. Cofala3, and M. Amann3
1School of Environment, and State Key Joint Laboratory of Environment Simulation and Pollution Control, TsinghuaUniversity, Beijing 100084, China2State Environmental Protection Key Laboratory of Sources and Control of Air Pollution Complex, Beijing 100084, China3International Institute for Applied System Analysis, Laxenburg, Austria
Correspondence to:S. X. Wang (shxwang@ tsinghua.edu.cn)
Received: 3 April 2013 – Published in Atmos. Chem. Phys. Discuss.: 14 June 2013Revised: 26 August 2013 – Accepted: 31 August 2013 – Published: 8 October 2013
Abstract. Nitrogen oxides (NOx) are key pollutants for theimprovement of ambient air quality. Within this study we es-timated the historical NOx emissions in China for the pe-riod 1995–2010, and calculated future NOx emissions everyfive years until 2030 under six emission scenarios. Drivenby the fast growth of energy consumption, we estimate theNOx emissions in China increased rapidly from 11.0 Mt in1995 to 26.1 Mt in 2010. Power plants, industry and trans-portation were major sources of NOx emissions, account-ing for 28.4 %, 34.0 %, and 25.4 % of the total NOx emis-sions in 2010, respectively. Two energy scenarios, a businessas usual scenario (BAU) and an alternative policy scenario(PC), were developed to project future energy consumption.In 2030, total energy consumption is projected to increase by64 % and 27 % from 2010 level respectively. Three sets ofend-of-pipe pollution control measures, including baseline,progressive, and stringent control case, were developed foreach energy scenario, thereby constituting six emission sce-narios. By 2030, the total NOx emissions are projected toincrease (compared to 2010) by 36 % in the baseline whilepolicy cases result in reduction up to 61 % in the most am-bitious case with stringent control measures. More than athird of the reduction achieved by 2030 between least andmost ambitious scenario comes from power sector, and morethan half is distributed equally between industry and trans-portation sectors. Selective catalytic reduction dominates theNOx emission reductions in power plants, while life stylechanges, control measures for industrial boilers and cementproduction are major contributors to reductions in industry.Timely enforcement of legislation on heavy-duty vehicleswould contribute significantly to NOx emission reductions.About 30 % of the NOx emission reduction in 2020 and 40 %
of the NOx emission reduction in 2030 could be treated asthe ancillary benefit of energy conservation. Sensitivity anal-ysis was conducted to explore the impact of key factors onfuture emissions.
1 Introduction
Nitrogen oxides (NOx) play a crucial role in troposphericchemistry. Production of ozone in the troposphere is con-trolled by the abundance of NOx (e.g., Zhang et al., 2007).NOx also contributes to the formation of secondary inor-ganic aerosols, resulting in adverse impacts on human health(Wang et al., 2011b; Mueller et al., 2004). Increasing ni-trate / sulfate ratios in precipitation have been observed inmonitored cities in China, attributable to increasing NOxemissions (Zhao et al., 2009). In addition, NOx may lead toclimate forcing effects via ozone formation or via secondaryaerosols (Solomon et al., 2007). Therefore, NOx is a key pol-lutant for the overall improvement of ambient air quality un-der multi-objective environmental management policies.
With the rapid economic development and urbanization inChina, air pollutant emissions have been increasing at an un-precedented rate over the last decade (Xing et al., 2011). NOxemissions in China (or as part of regional/global inventories)have been estimated by a number of researchers (Kato andAkimoto, 1992; Akimoto and Narita, 1994; Olivier et al.,1998; van Aardenne et al., 1999; Xue et al., 1999; Shah etal., 2000; Streets and Waldhoff, 2000; Klimont et al., 2001;Streets et al., 2001, 2003a; Vallack et al., 2001; Hao et al.,2002; Zhang et al., 2007, 2009; Ohara et al., 2007; Wanget al., 2011a; Xing et al., 2011; Klimont et al., 2009; Zhao
Published by Copernicus Publications on behalf of the European Geosciences Union.
9870 B. Zhao et al.: NOx emissions in China
et al., 2013). The annual growth rate of NOx emissions wasas high as 6.3 % during 1995–2004 according to Zhang etal. (2007). Satellite-based observations of NO2 columns haveshown even faster growth in the same period (Richter et al.,2005). It is important to provide a reliable estimate of thehistorical trends in the past two decades with a consistentmodel structure and detailed Chinese data sources. In addi-tion, nearly all the previous studies neglected the emissionsfrom several “small industries”, including the production ofbricks, glass, lime, ceramics, and nitric acid, the emissions ofwhich were quite uncertain but fairly important.
To mitigate the adverse effect of air pollution, the Chi-nese government aims to reduce NOx emissions by 10 %(compared to 2010) during the 12th Five-Year Plan (2011–2015) (The State Council of the People’s Republic of China,2011a). It is of strategic importance to indicate the dimen-sions of the effort to achieve such an ambitious target, and toevaluate the impact of further control policies on the emis-sion pathway beyond 2015. Some previous studies have pre-sented NOx emission projections (van Aardenne et al., 1999;Shah et al., 2000; Streets and Waldhoff, 2000; Klimont et al.,2001, 2009; Ohara et al., 2007; Amann et al., 2008; Xinget al., 2011). However, these projections were based on theemissions for the year 2005 or earlier, and underestimatedChina’s economic growth experienced in the last decade, es-pecially during the period from 2006 to 2010. In addition,none of the projections anticipated the aggressive NOx emis-sion control policies envisaged in the 12th Five-Year Plan,which may fundamentally change the future NOx emissionpathway. End-of-pipe control technologies were historicallyrelied on for pollutant reductions while recent research hasillustrated the importance of energy-saving policies for emis-sion control in China (Yuan et al., 2011). The substantial re-duction of NOx emissions in the future calls for integratedcontrol policies, which contribute to energy conservation andpollutant reductions simultaneously. Previous projections of-ten adopted energy consumption projections directly fromother sources. Therefore, it was difficult to quantify the im-pact of various energy-saving policies on emission reduc-tions.
To reflect recent changes of NOx emissions and quantifythe effects of various control policies, we estimated China’sNOx emissions during 1995–2010 and developed future NOxemission scenarios in five-year steps up to 2030 using a con-sistent model structure. These scenarios envisage not onlyend-of-pipe control measures, but also integrated energy-saving measures, such as life style changes, energy structureadjustment, and energy efficiency improvement. The impactof various control measures on NOx emissions was evalu-ated, and the ancillary benefit of energy conservation on NOxemission reductions was analyzed. Sensitivity analysis wasthen conducted to explore the impact of some key factors onfuture emissions.
2 Methodology and data sources
A consistent model structure was developed for the estima-tion of historical NOx emissions, and the calculation of futureenergy consumption and NOx emissions. The energy con-sumption and final NOx emissions greatly depend on the en-ergy technology mix, energy efficiencies of each technology,and end-of-pipe control technologies. Compared with previ-ous studies, the technology-based model developed in thisstudy has more detailed representation of energy technolo-gies and end-of-pipe control technologies, which is criticalfor obtaining reliable emission estimates. A dynamic tech-nology database was established to reflect the rapid renewalof energy technologies and control technologies, both in thepast and future. While previous emission projections usu-ally adopted the energy consumption projection developedwith other models directly, this study assures the consistencyof energy and emission projections by coupling the energytechnologies and end-of-pipe control technologies. Each en-ergy technology may be coupled with several types of controltechnologies. Based on the detailed, consistent, and dynamicrepresentation of energy technologies and control technolo-gies, we quantified the impact of various energy-saving mea-sures and end-of-pipe control measures on NOx emissions, aswell as the ancillary benefit of energy conservation on NOxemission reduction (see Sects. 3.2.2 and 3.2.3), which hassignificant policy implications but were not addressed in theprevious studies.
For the past years (1995–2010), energy consumption datawere collected from statistics, and the technology distribu-tion was collected from a variety of local sources. To pro-vide a robust baseline for the calculation of future data, thehistorical energy consumption was also calculated from en-ergy service demand, technology distribution, and energyefficiencies, and the model was calibrated by adapting thetechnology-based energy calculation to energy statistics. Forthe future years (2010–2030), the driving forces (e.g., GDP,population) are assumed first, and then energy service de-mand is estimated based on driving forces. The future tech-nology distribution and energy efficiencies are assumed, andthe energy consumption is calculated. Both historical and fu-ture emissions are derived from energy consumption, emis-sion factors and assumptions on the penetration of controltechnologies. The governing equations of the model are asfollows:
E∧
k,i,j,l = Ek,i,j,lDi,jXi,j,l, (1)
E∧
k,i =
∑j
∑l∈Wj
Ek,i,j,lDi,jXi,j,l, (2)
Atmos. Chem. Phys., 13, 9869–9897, 2013 www.atmos-chem-phys.net/13/9869/2013/

B. Zhao et al.: NOx emissions in China 9871
Qmi =
∑j
∑l∈Wj
∑p∈Vl
((Fm
i,j,lDi,jXi,j,l +
∑k
f mk,i,j,lE
∧
k,i,j,l
)
Yi,j,l,p
(1−dm
i,j,l,p
)), (3)
wherei represents the economic sector in a specific province(e.g., power plants in Beijing);j represents energy servicetype; k represents fuel type;l represents energy technologytype; p represents air pollutant control technology type;m
represents air pollutant/greenhouse gas;Wj is all the energytechnologies that supply energy service typej ; Vl is all thecontrol technologies coupled with energy technologyl; D
represents the energy service demand;X is proportion of en-ergy service supplied by a specific energy technology;E isthe energy efficiency (i.e., the energy consumption to sup-ply per unit energy service with a specific energy technol-ogy); E is the total energy consumption;f is the energy-based uncontrolled emission factor (i.e., the uncontrolled airpollutant/greenhouse gas emission per unit energy consump-tion of a specific energy technology);F is the service-baseduncontrolled emission factor (i.e., the uncontrolled air pol-lutant/greenhouse gas emission per unit energy service sup-plied with a specific energy technology);Y is the propor-tion of an energy technology equipped with a specific airpollutant control technology;d is the removal rate of a spe-cific air pollutant control technology when coupled with aspecific energy technology;Q is the total final air pollu-tant/greenhouse gas emissions. The sources and values of en-ergy service demand, proportion of energy technologies, andenergy efficiencies are documented in Sect. 2.1, while thoseof uncontrolled emission factors and proportion of controltechnologies are given in Sect. 2.2 and Sect. 2.3, respectively.
This study covers 31 provinces in mainland China. Alldata are at the provincial level. Unit-based methodology isapplied to estimate the emissions from large point sourcesincluding coal-fired power plants, iron and steel plants, andcement plants (Zhao et al., 2008; Lei et al., 2011).
2.1 Data sources of energy consumption
2.1.1 Historical energy consumption
The historical energy consumption data were collected froma variety of sources, with a critical examination of the data re-liability. Energy consumption data of the stationary combus-tion sectors (power plants, heat supply, industry, and domes-tic) were derived from China Energy Statistical Yearbooks(CESY) (National Bureau of Statistics, 1998, 2001, 2004a,b, 2005, 2006, 2007, 2008a, b, 2009, 2011a, b). While CESYprovides both a national and provincial energy balances, theyare inconsistent with each other. Following the method ofZhang et al. (2009), we adopted the energy consumption val-ues from the provincial energy balances, except for diesel,
which was taken from the national balance. The shares oftechnologies were collected from a wide range of statistics,peer-reviewed papers, a number of technical reports, and un-published materials from industrial associations and researchinstitutes.
The industry sector is classified into industrial boilers andindustry process because of different combustion technolo-gies. The amount of fuel consumed for the production of var-ious industrial products was estimated from the yields andenergy efficiencies, and the amount of fuel consumed in theboilers was obtained by extracting the fuels consumed forindustrial products from the total fuel consumption of the in-dustry sector. The provincial data on industrial productionwere collected from various governmental statistics, such asChina Statistical Yearbook and China Statistical Yearbookfor Regional Economy (National Bureau of Statistics, 1996–2011, 2000–2011). The brick production was estimated fromthe unpublished data of China Bricks and Tiles Industrial As-sociation, as the governmental statistics includes only enter-prises above a specific size, which accounts for only 10–20 %of the total production (Xu, 2008, 2010).
Fuel consumption of on-road vehicles was calculated fromvehicle population, annual average vehicle mileage traveled,and fuel economy for each vehicle type, as documented inHe et al. (2005) and Wang et al. (2006). Fuel consumption ofoff-road vehicles was also derived with a bottom-up method(Zhang, 2005; Zhang, 2008). The fuel consumption of trans-portation was subtracted from other sectors in the energy bal-ance table to avoid double counting. The open burning ofagricultural residue was calculated based on the residue pro-duction, the ratio of open burning, and the burning efficiency;the method and key parameters are described in Streets etal. (2003b) and Wang and Zhang (2008). Although biomassopen burning is not the key source of emissions for NOx,it should be noted that the estimate of burned agriculturalresidue has large uncertainty. Some remote sensing productshave showed much lower activity than bottom-up estimatebased on crop residue remaining on filed and the ratio ofburning (van der Werf et al., 2010; Yevich and Logan, 2003).Soil and lightning NOx might be important emission sourcesin China (Wang et al., 2011a). However, considering the dif-ficulties to control them, we did not include soil or lightningNOx emissions but rather focused on the energy-related NOxemissions in this study.
2.1.2 Assumptions on future driving forces
1. GDP
The government aims to develop China into a medium de-veloped country by 2050, which implies the GDP per capitashould be over 20 000 USD (at 2005 exchange rate). We as-sume the annual average GDP growth rate is 8.0 % from 2011to 2015, 7.5 % from 2016 to 2020, 6.5 % from 2021 to 2025,and 5.5 % from 2026 to 2030, respectively. Based on these
www.atmos-chem-phys.net/13/9869/2013/ Atmos. Chem. Phys., 13, 9869–9897, 2013
9872 B. Zhao et al.: NOx emissions in China
assumptions and population development as discussed be-low, GDP per capita is estimated at about 9700 USD (at 2005exchange rate), or about 11 400 USD (2007 exchange rate) in2030. The provincial GDP was calculated with historical datafrom 1995 to 2010 using the logistic regression method. Mi-nor adjustment was necessary to make the total of provincialGDP consistent with the national GDP. The share of primary,secondary, and tertiary industries in GDP, and the share ofvarious industries in the secondary industry, were adoptedfrom the Energy Research Institute (2009).
2. Population
Different projections of China’s population agree fairly wellwith each other. In this study, we adopted the Research Re-port on National Population Development Strategy (NationalPopulation Development Strategy Research Group, 2007),and made minor revisions based on recent population growthrates. The national population is projected to increase from1.34 billion in 2010 to 1.44 billion in 2020 and 1.47 billionin 2030. The provincial populations were calculated with his-torical data from 1995 to 2010 using the logistic regressionmethod.
3. Urbanization and household size
Urbanization rate is assumed to increase from 49.95 % in2010 to 58 % and 63 % in 2020 and 2030, respectively, repre-senting a medium range in urbanization projections. House-hold sizes in urban and rural area are assumed to decreasefrom 2.88 and 3.95 in 2010 to 2.75 and 3.40 in 2030, respec-tively (Energy Research Institute, 2009).
2.1.3 Assumptions on future energy consumption
We developed two energy scenarios: a business as usual sce-nario (BAU) and an alternative policy scenario (PC). TheBAU scenario is based on current legislation and implemen-tation status (until the end of 2010), in particular on theassumption that CO2 intensity would be 40–45 % lower in2020 than that of 2005 (The State Council of the People’sRepublic of China, 2009). In the PC scenario, we assumethe introduction and strict enforcement of new energy-savingpolicies, including life style changes, structural adjustment,and energy efficiency improvement. Life style changes implyslower growth of energy service demand, including energy-intensive industrial products, building area and domestic ser-vice demand, vehicle population, electricity production, andheat supply, due to more conservative life styles. Structuraladjustment includes promotion of clean and renewable fuelsand energy-efficient technologies, such as renewable energypower and combined heat and power generation (CHP) forpower plants and heat supply sector respectively, arc furnaceand large precalcined kilns for industrial sector, biogas stovesand heat pumps for domestic sector, electric vehicles and bio-fuel vehicles for transportation sector, and so on. Assumed
energy efficiency improvement includes the improvement ofthe energy efficiencies of single technologies in each sector.The definition and key parameters of the energy scenarios aresummarized in Table 1 and Table 2, respectively. The energyconsumption was calculated with a 5 yr resolution, thoughthe parameters for selected years only are presented in thetables. Detailed assumptions of the energy scenarios are doc-umented below.
1. Power plants
Future electricity production is calculated based on the de-mand of final consumption sectors. The method to estimatethe demand of final consumption sectors is described in thenext few sections. The total electricity production is pro-jected to be 6690/5998 TWh and 8506/7457 TWh in BAU/PCscenario in 2020 and 2030, respectively.
The penetration of clean energy power is expected to in-crease rapidly in the future. The BAU scenario is designedbased on the plan of the National Development and Re-form Commission (2005, 2007b), with revisions accordingto recent development. The PC scenario considers an ag-gressive development plan proposed by China ElectricityCouncil (2011) and a series of other analyses and projec-tions. The installed capacities of hydropower, nuclear power,wind power, solar power, and biomass power are expectedto be 300/320 GW, 40/70 GW, 40/60 GW, 1.8/8 GW, and20/30 GW respectively in BAU/PC scenario in 2020. Thecorresponding capacities are projected to be 350/380 GW,70/130 GW, 60/120 GW, 9/30 GW, 30/55 GW in 2030. Nat-ural gas power is not expected to develop at a large scaledue to its high cost, whereas it may be constructed in somemetropolitan areas for the relief of air pollution (Zhao etal., 2011), or constructed at small scale for peak shavingin the power grid. The proportion of electricity produc-tion from coal-fired power plants is expected to decreaseto 73 % and 57 % in 2030 under BAU and PC scenarios,respectively. Newly built coal-fired power plants are domi-nated by large units (300 MW or larger); smaller units (be-low 100–200 MW) will be phased out in the near future. Be-fore 2005, sub-critical units were the dominant technology.Super-critical units have been widely applied since 2005.Ultra-supercritical units are expected to be widely promotedin the next five years. Integrated gasification-combined cycle(IGCC) units are promising to be applied at large scale in 5–10 yr. The structure adjustment of power plants is shown inFig. 1.
2. Heat supply
Future heat supply is also estimated based on the demand offinal consumption sectors. The total heat supply is projectedat 258/243 Mtce and 345/325 Mtce in BAU/PC scenario in2020 and 2030, respectively.
Atmos. Chem. Phys., 13, 9869–9897, 2013 www.atmos-chem-phys.net/13/9869/2013/

B. Zhao et al.: NOx emissions in China 9873
Table 1.Definition of the energy and emission scenarios in this study.
Energy scenarioname
Energy scenario definition Emissionscenario name
Emission scenario definition
Business asusual (abbr. BAU)
The BAU scenario is based on currentlegislation and implementation status(until the end of 2010), especially thatCO2 intensity would be 40–45 % lowerin 2020 than that of 2005.
BAU[0] The BAU[0] scenario assumes the sameenergy-saving policies as BAU sce-nario. For end-of-pipe pollution con-trol measures, it assumes that all currentlegislation (until the end of 2010) andthe current implementation status willbe followed during 2011–2030.
BAU[1] The BAU[1] scenario assumes the sameenergy-saving policies as BAU sce-nario. For end-of-pipe pollution controlmeasures, it assumes that new pollutioncontrol policies would be released andimplemented, representing progressiveapproach towards future environmentalpolicies.
BAU[2] The BAU[2] scenario assumes the sameenergy-saving policies as BAU sce-nario. For end-of-pipe pollution controlmeasures, it assumes that even moreambitious policies will be released andimplemented; such a scenario could berealized only if the government takesquick and substantially aggressive ac-tion.
Alternative policy(abbr. PC)
The PC scenario assumes that newenergy-saving policies will be releasedand enforced more stringently, includ-ing life style changes, structural adjust-ment and energy efficiency improve-ment.
PC[0] The PC[0] scenario assumes the sameenergy-saving policies as PC scenario,and the same end-of-pipe pollution con-trol measures as BAU[0] scenario.
PC[1] The PC[1] scenario assumes the sameenergy-saving policies as PC scenario,and the same end-of-pipe pollution con-trol measures as BAU[1] scenario.
PC[2] The PC[2] scenario assumes the sameenergy-saving policies as PC scenario,and the same end-of-pipe pollution con-trol measures as BAU[2] scenario.
Technologies for heat supply include CHP, coal-fired boil-ers, oil-fired boilers, and gas-fired boilers. The share of CHPis assumed to increase from 61 % in 2010 to 65 %/72 % in2030 under BAU/PC scenario, attributable to the promotionof the government, and the increasing need of district heatingfrom CHP in domestic sector. The penetration of gas-firedboiler is assumed to increase to 10 % and 15 % in BAU andPC scenarios respectively in 2030.
3. Industry sector
We applied an elasticity coefficient method for the estima-tion of future production of industrial products, the govern-
ing equation of which is as follows:
Yt1 = Yt0
(dvt1
dvt0
)δ
, (4)
wheret0 andt1 are time periods (e.g.,t0 = 2010, andt1 =
2030); Y is the yield of a specific industrial product; dvis the driving force, namely sectoral value added or pop-ulation; δ is the product-specific elasticity coefficient. Thevalues ofδ are determined through (1) the historical trendduring 1995–2010; (2) the experience of developed coun-tries; (3) the projections of some industry associations. Mostenergy-intensive products for infrastructure construction are
www.atmos-chem-phys.net/13/9869/2013/ Atmos. Chem. Phys., 13, 9869–9897, 2013

9874 B. Zhao et al.: NOx emissions in China
Table 2.Key parameters of the energy scenarios.
BAU PC
2010 2020 2030 2020 2030
GDP (2005 price)/109 CHYa 31 165 65 741 117 718 65 741 117 718Population/billion 1.340 1.440 1.474 1.440 1.474Urbanization rate/% 49.7 58.0 63.0 58.0 63.0Power generation/TWh 4205 6690 8506 5598 7457
Share of coal-fired power generation/% 75 74 73 64 57Thermal efficiency of coal-fired power/% 35.7 38.0 40.0 38.8 41.7Crude steel production/Mt 627 710 680 610 570Cement production/Mt 1880 2001 2050 1751 1751Urban residential building area per capita m−2 23.0 29.0 33.0 27.0 29.0
Rural residential building area per capita m−2 34.1 39.0 42.0 37.0 39.0Vehicle population per 1000 persons 58.2 191.2 380.2178.5 325.2Share of new and renewable energy/%b 7.5 8.3 8.9 11.9 15.8CO2 emission per GDP/(t/106 CHY)c 267 182 120 148 84
a CHY, Chinese yuan.b Including hydropower, solar energy, wind energy, ocean energy, and nuclear energy; excluding biomass.c The CO2 emission per GDP was 322 t/106 CHY in 2005, which was adopted as a benchmark value for the national target that theCO2 emission per GDP should decrease by 40–45 % from 2005 to 2020.
46
1
2
Figure 1. Structure adjustment of power plants. 3
4
(a) (b)
(c) (d)
Figure 2. Structure adjustment of heating: (a) urban area in north region; (b) urban area in 5
transition region; (c) rural area in north region; (d) rural area in transition region. 6
7
Fig. 1.Structure adjustment of power plants.
expected to increase until 2020, and stabilize or even declineafter 2020, whereas the products closely related to everydaylife are expected to increase until 2030, though at a decliningrate. Future yields in PC scenario are less than those in BAUscenario because of a more conservative life style.
The National Development and Reform Commission re-leased the Special Plan for Medium and Long Term En-ergy Conservation in 2004 (National Development and Re-form Commission, 2004), which set the aim that the compre-hensive energy efficiencies of most energy-intensive prod-ucts would reach or approach the average level of developedcountries by 2020. In BAU scenario, we assume the plan willbe realized by 2020, whereas the energy efficiencies will notincrease markedly beyond 2020. Under PC scenario, the bestavailable technologies (BATs) are assumed to be adopted insome industries by 2020, and are expected to be widely used
in 2030, which implies China’s energy efficiencies would beamong the highest in the world.
The improvement of comprehensive energy efficiency isachieved through structural adjustment and energy efficiencyimprovement of specific technology. The shares of lessenergy-intensive technologies are assumed to be higher inPC scenario than BAU scenario, as summarized in Table 3.For example, the share of precalcined kilns in cement pro-duction is projected to approach 100 % in 2030 in PC sce-nario, and 85 % of them have a capacity larger than or equalto 4000 t d−1. However, energy-intensive shaft kilns are stillexpected to account for 15 % of cement production in 2030under BAU scenario. The energy efficiencies of single tech-nologies are also expected to improve in the future. For ex-ample, the energy consumption per unit product of blast fur-naces, brick production, precalcined kilns for clinker pro-duction, machine coke ovens, and petroleum refineries is as-sumed to be 4 %, 18 %, 9 %, 33 %, and 21 % lower respec-tively in 2030 under BAU scenario compared with 2010. Thecorresponding reduction rates in the PC scenario are assumedto be 13 %, 27 %, 15 %, 44 %, and 31 % respectively.
4. Domestic sector
The domestic energy consumption is divided into urbanresidential consumption, rural residential consumption, andcommercial consumption. Building area is a key factor ofdomestic energy consumption. In this study, future buildingarea is estimated by referring to the governmental plan andcomparing with the experience of developed countries. Av-erage urban residential building area per capita is projected
Atmos. Chem. Phys., 13, 9869–9897, 2013 www.atmos-chem-phys.net/13/9869/2013/
B. Zhao et al.: NOx emissions in China 9875
Table 3.Technology evolution of selected industry sectors (%).
Process Technology 2005 2010 2020 BAU 2030 BAU 2020 PC 2030 PC
Crude steel production Arc furnace 11.8 11.2 14.0 18.0 25.0 40.0Basic oxygen furnace 88.1 88.8 86.0 82.0 75.0 60.0
Cement production Shaft kiln 50.0 24.0 19.0 15.0 2.0 0.0Other rotary kiln 5.0 1.0 0.0 0.0 0.0 0.0Precalcined kiln <2000 t d−1 10.8 8.6 7.3 6.0 6.9 3.0Precalcined kiln 2000–4000 t d−1 19.4 21.4 20.3 17.9 19.6 12.0Precalcined kiln >4000 t d−1 14.9 45.0 53.5 61.2 71.5 85.0
Glass production Float process 80.0 85.0 95.0 100.0 100.0 100.0Vertical process 20.0 15.0 5.0 0.0 0.0 0.0
Coke production Machine coke oven 81.9 87.0 96.0 100.0 100.0 100.0Indigenous coke oven 18.1 13.0 4.0 0.0 0.0 0.0
Ammonia synthesis Ammonia synthesis from oil & natural gas 37.0 23.0 23.0 23.0 23.0 23.0Ammonia synthesis from coal 63.0 77.0 77.0 77.0 77.0 77.0
Caustic soda production Ion-exchange membrane process 34.0 57.0 67.0 75.0 80.0 98.0Diaphragm process 66.0 43.0 33.0 25.0 20.0 2.0
Soda production Combined-soda process 39.5 42.0 45.0 48.0 49.0 56.0Ammonia-soda process 60.5 58.0 55.0 52.0 51.0 44.0
Nitric acid production Dual-pressure process 38.0 54.0 67.0 80.0 75.0 95.0Other process 62.0 46.0 33.0 20.0 25.0 5.0
Industrial boiler Grate boiler 90.0 89.0 85.0 82.0 81.0 75.0Circulating fluidized bed boiler 10.0 11.0 15.0 18.0 19.0 25.0
at 33 m2 in 2030 under BAU scenario, comparable to thatof Japan and the target set by the Ministry of Constructionof China. Rural residential building area per capita is pro-jected at 42 m2 since it is less populous, also comparable tothe target of the Ministry of Construction. In PC scenario,the building area per capita is 3–4 m2 lower than that of BAUscenario in both urban and rural area.
Energy service demand in the domestic sector is derivedfrom building area/population and energy service intensity,which is defined as the energy service demand per buildingarea/capita. Heating intensity is influenced by climate, theproportion of heating area, heating service quality, thermalinsulation of the building envelope, and heating duration. Asan integral effect, the heating intensity of urban area in northChina is expected to decrease, while that of rural area andtransition region (between north and south China) is expectedto increase. The heating intensity is somewhat lower in ourPC scenario than in the BAU scenario. The cooking and hotwater intensity is projected to increase by a factor of 1.25–1.45 from 2010 to 2030, depending on rural or urban area,BAU or PC scenario. As for electric appliance, urban owner-ship in 2030 is projected to account for 70–100 % of that ofJapan in 2005, while the rural ownership is lower.
People tend to use cleaner fuels for heating and cookingas incomes rise. Natural gas utilization as a domestic fuelenjoys the highest priority according to the “National Natu-ral Gas Utilization Policy” (National Development and Re-
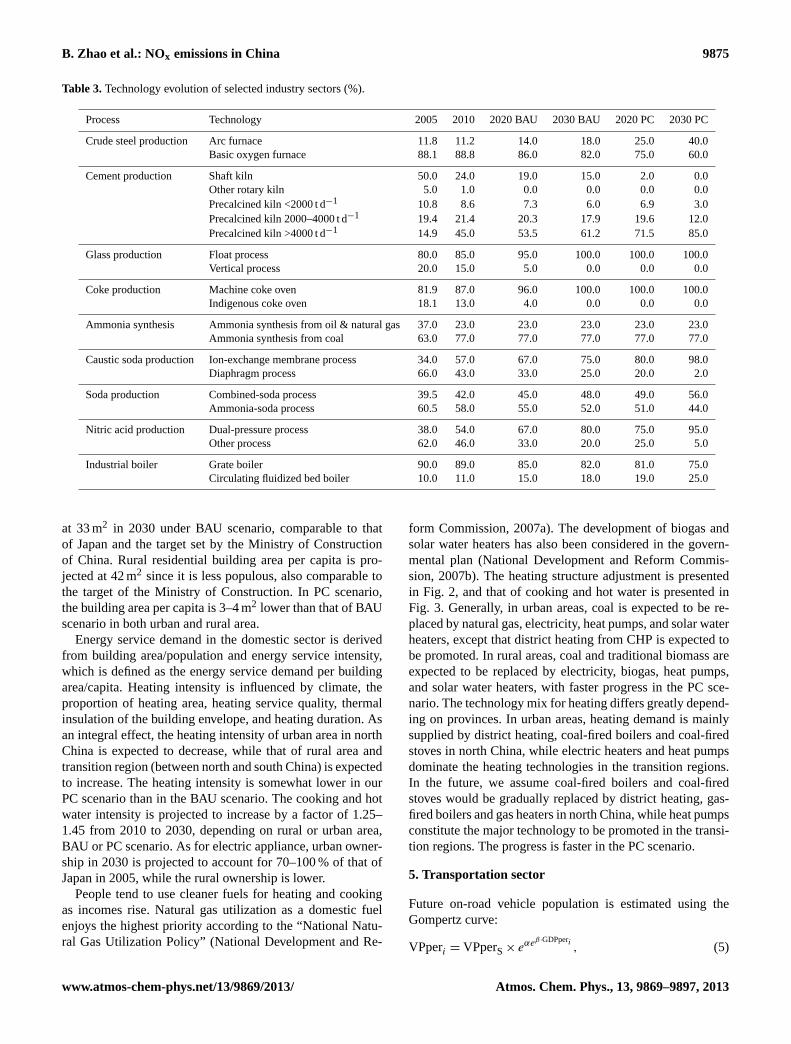
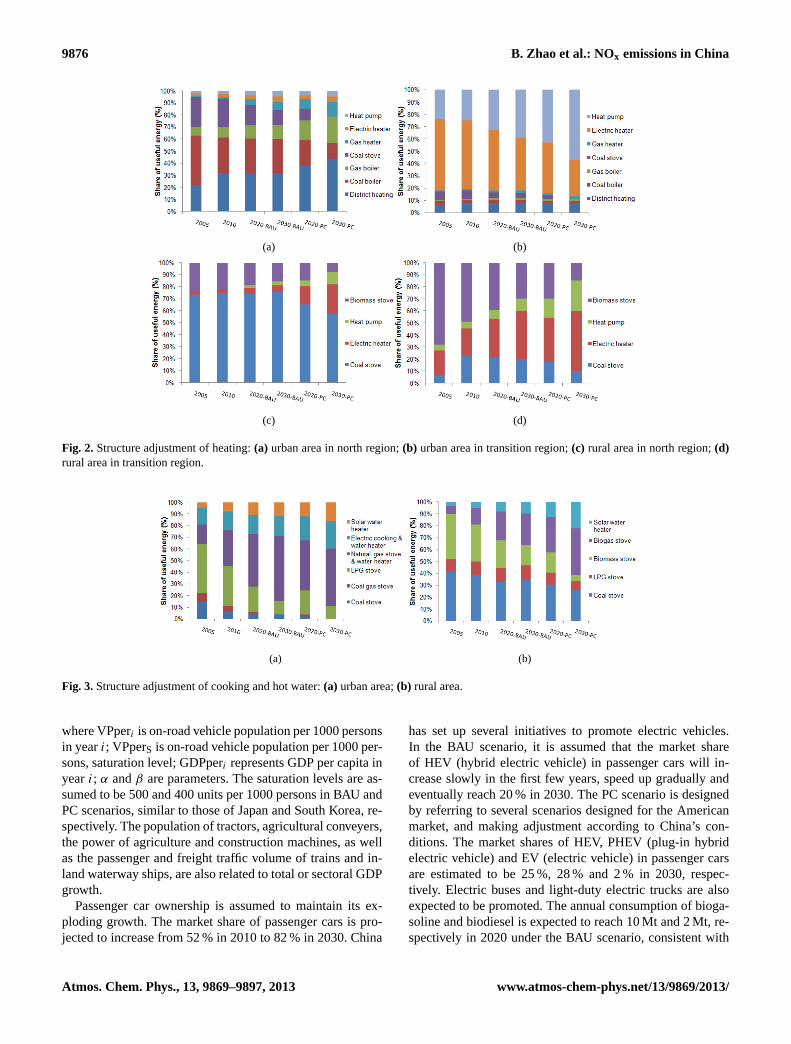
form Commission, 2007a). The development of biogas andsolar water heaters has also been considered in the govern-mental plan (National Development and Reform Commis-sion, 2007b). The heating structure adjustment is presentedin Fig. 2, and that of cooking and hot water is presented inFig. 3. Generally, in urban areas, coal is expected to be re-placed by natural gas, electricity, heat pumps, and solar waterheaters, except that district heating from CHP is expected tobe promoted. In rural areas, coal and traditional biomass areexpected to be replaced by electricity, biogas, heat pumps,and solar water heaters, with faster progress in the PC sce-nario. The technology mix for heating differs greatly depend-ing on provinces. In urban areas, heating demand is mainlysupplied by district heating, coal-fired boilers and coal-firedstoves in north China, while electric heaters and heat pumpsdominate the heating technologies in the transition regions.In the future, we assume coal-fired boilers and coal-firedstoves would be gradually replaced by district heating, gas-fired boilers and gas heaters in north China, while heat pumpsconstitute the major technology to be promoted in the transi-tion regions. The progress is faster in the PC scenario.
5. Transportation sector
Future on-road vehicle population is estimated using theGompertz curve:
VPperi = VPperS× eαeβ·GDPperi, (5)
www.atmos-chem-phys.net/13/9869/2013/ Atmos. Chem. Phys., 13, 9869–9897, 2013
9876 B. Zhao et al.: NOx emissions in China
46
1
2
Figure 1. Structure adjustment of power plants. 3
4
(a) (b)
(c) (d)
Figure 2. Structure adjustment of heating: (a) urban area in north region; (b) urban area in 5
transition region; (c) rural area in north region; (d) rural area in transition region. 6
7
Fig. 2. Structure adjustment of heating:(a) urban area in north region;(b) urban area in transition region;(c) rural area in north region;(d)rural area in transition region.
47
(a) (b)
Figure 3. Structure adjustment of cooking and hot water: (a) urban area; (b) rural area. 1
2
(a)
(b)
Figure 4. The implementation time of the vehicle emission standards: (a) BAU[0]/PC[0] 3
scenario; (b) BAU[1]/PC[1]/BAU[2]/PC[2] scenario. The Arabic numbers 1-6 represent Euro 4
I to Euro VI vehicle emission standards. Numbers in black represent standards released by the 5
end of 2010, and that in red represent those to be released in the future. 6
7
Fig. 3.Structure adjustment of cooking and hot water:(a) urban area;(b) rural area.
where VPperi is on-road vehicle population per 1000 personsin yeari; VPperS is on-road vehicle population per 1000 per-sons, saturation level; GDPperi represents GDP per capita inyeari; α andβ are parameters. The saturation levels are as-sumed to be 500 and 400 units per 1000 persons in BAU andPC scenarios, similar to those of Japan and South Korea, re-spectively. The population of tractors, agricultural conveyers,the power of agriculture and construction machines, as wellas the passenger and freight traffic volume of trains and in-land waterway ships, are also related to total or sectoral GDPgrowth.
Passenger car ownership is assumed to maintain its ex-ploding growth. The market share of passenger cars is pro-jected to increase from 52 % in 2010 to 82 % in 2030. China
has set up several initiatives to promote electric vehicles.In the BAU scenario, it is assumed that the market shareof HEV (hybrid electric vehicle) in passenger cars will in-crease slowly in the first few years, speed up gradually andeventually reach 20 % in 2030. The PC scenario is designedby referring to several scenarios designed for the Americanmarket, and making adjustment according to China’s con-ditions. The market shares of HEV, PHEV (plug-in hybridelectric vehicle) and EV (electric vehicle) in passenger carsare estimated to be 25 %, 28 % and 2 % in 2030, respec-tively. Electric buses and light-duty electric trucks are alsoexpected to be promoted. The annual consumption of bioga-soline and biodiesel is expected to reach 10 Mt and 2 Mt, re-spectively in 2020 under the BAU scenario, consistent with
Atmos. Chem. Phys., 13, 9869–9897, 2013 www.atmos-chem-phys.net/13/9869/2013/
B. Zhao et al.: NOx emissions in China 9877
the governmental plan (National Development and ReformCommission, 2007b). In the PC scenario, the annual con-sumption of biogasoline is projected to increase to 20 Mt and50 Mt in 2020 and 2030, respectively.
Several fuel efficiency standards have been released inChina, including “Limits of Fuel Consumption for PassengerCars” in 2004, “Limits of Fuel Consumption for Light DutyCommercial Vehicles” in 2007, “Low-speed Goods Vehicles– Limits and Measurement Methods for Fuel Consumption”and “Tri-wheel Vehicles – Limits and Measurement MethodsFor Fuel Consumption” in 2008. In 2010, the fuel efficienciesof new gasoline passenger cars and new heavy-duty dieselvehicles are about 13.5 km L−1 and 3.6 km L−1, respectively.In BAU scenario, only the policies released in the year 2010or before are considered. In PC scenario, for light-duty ve-hicles, a new standard entitled, “Fuel Consumption Evalua-tion Methods and Targets for Passenger Cars” issued in 2011is assumed to be implemented during 2012–2015. Potentialimprovements of fuel economy corresponding to Path Threeof NAS (US National Academy of Sciences) are assumedto be implemented during 2015–2025. Path Three, the mostaggressive pathway designed by NAS, necessitates the in-troduction of emerging technologies that have the potentialfor substantial market penetration within 10–15 yr (US Na-tional Research Council, 2002). For heavy-duty vehicles, theJapanese fuel consumption limits of new heavy-duty vehi-cles are assumed to be implemented between 2015 and 2025,and the fuel economy requirements are assumed to be 20 %more stringent than the Japanese limit after 2025. Consider-ing the policies discussed above, the resulting fuel economyof new passenger cars and light-duty buses is 33 % betterin 2030 in the PC scenario than in 2010, while the corre-sponding improvement for new heavy-duty vehicles is 57 %.The historical and future fuel economies of electric vehiclesare determined based on Lin (2010) and Huo et al. (2010).Fuel economy of motorcycle, agricultural tractors and con-veyers, agriculture and construction machines, trains, and in-land waterway ships is projected to increase by 23 %/29 %,13 %/19 %, 14 %/23 %, 10 %/12 %, and 18 %/24 %, respec-tively, in BAU/PC scenario in 2030, compared to 2010.
6. Open burning of agricultural residue
Since 1997, the government has enacted a series of regula-tions and laws to prohibit field burning (Yan et al., 2006).A formal regulation to prohibit field burning and promoteenvironmentally friendly utilization of agricultural residueswas published in 1999 (State Environmental Protection Ad-ministration, 1999). Farmers are encouraged to return cropresidue to agricultural soils as fertilizer. In addition, China’sMinistry of Environmental Protection (MEP) released a no-tice to strengthen the prohibition of open burning before theharvest season almost every year (http://www.zhb.gov.cn/).Moreover, since 2004, MEP has been monitoring agricul-tural field burning with satellites, and a report of the num-
bers and locations of fire points has been published everyday (http://hjj.mep.gov.cn/stjc/). Once the field burning wasconfirmed by satellite observations, local officials would takequick actions to forbid such behavior. Considering the gov-ernment’s continuous efforts to prohibit open burning, we as-sume the crop residue burned in the field will decline by 10 %every five years in both BAU and PC scenarios.
2.2 Data sources of uncontrolled emission factors
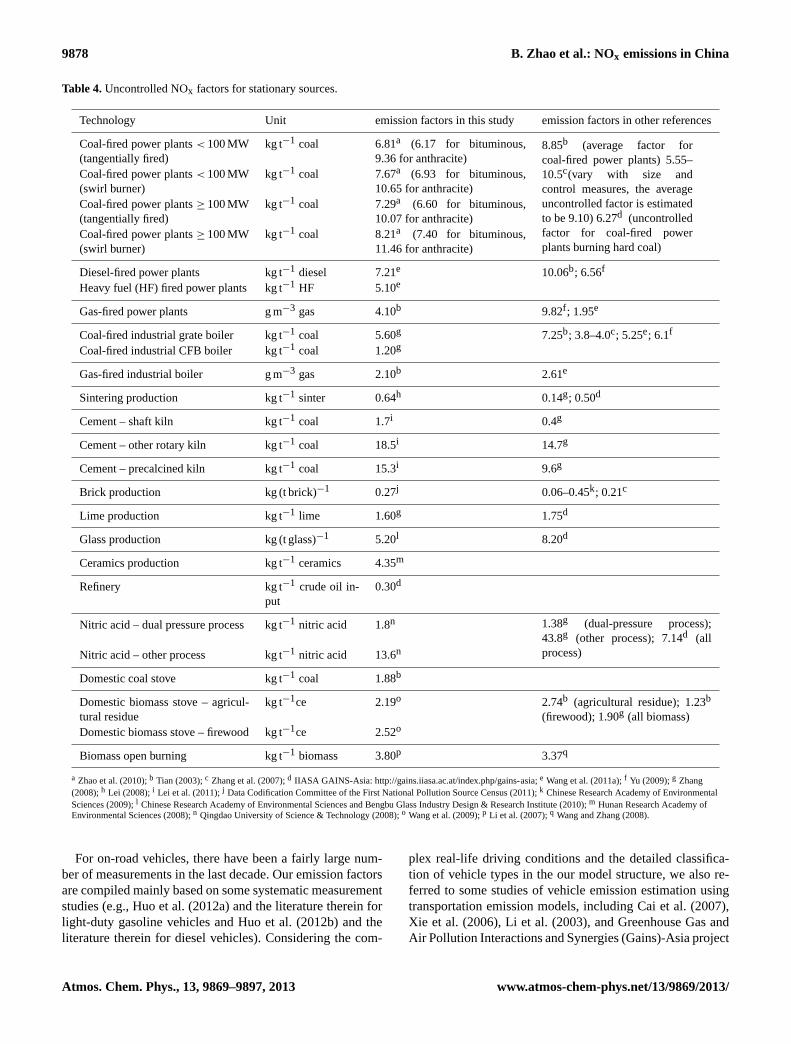
The uncontrolled emission factors were obtained through athorough survey of literature reporting field measurementsfrom Chinese sources. The uncontrolled NOx emission fac-tors for stationary sources are summarized in Table 4. Here,we include a brief discussion of the “small industries”, in-cluding the production of glass, bricks, lime, ceramics, andnitric acid, which were often neglected in previous studies.Information on emission factors for these industries is limitedbut has been increasing in the past few years. The ChineseResearch Academy of Environmental Sciences and BengbuGlass Industry Design & Research Institute (2010) investi-gated the NOx concentration in the flue gas of 14 glass plants,and estimated that the NOx emission factor was within arange of 1.7–7.4 kg (t glass)−1, and 5.2 kg (t glass)−1 on av-erage. The NOx concentrations in the flue gas of brick kilnswere within a range of 31.5–232.7 mg m−3 (78.6 mg m−3 onaverage, with annular kilns larger than tunnel kilns) for 8brick plants investigated by Chinese Research Academy ofEnvironmental Sciences (2009). However, the brick plantsunder investigation were mostly advanced tunnel kilns, andthe production capacities were larger than 10 million unitsper year. In contrast, the traditional annular kilns accountfor more than 90 % of total brick production, and theplants with production capacity less than 10 million unitsper year account for over 60 %. Zhang et al. (2007) used0.21 kg (t brick)−1 (about 106 mg m−3) based on the mea-surements of Tang et al. (1995). The Manual of Emis-sion Factors for the Pollution Source Census recommended0.27 kg (t brick)−1 (about 140 mg m−3) to represent the av-erage emission rate of brick plants in China (Data Codifica-tion Committee of the First National Pollution Source Cen-sus, 2011), which was also adopted by Chinese ResearchAcademy of Environmental Sciences (2009) for the estima-tion of total emissions. In this study, we used an emissionfactor of 0.27 kg (t brick)−1. The emission factor for ceram-ics production, 4.35 kg t−1 ceramics, was based on the mea-surements of 22 plants by Hunan Research Academy of En-vironmental Sciences (2008). Qingdao University of Science& Technology (2008) collected the NOx emission rates of60 nitric acid plants. The NOx concentrations in the flue gasof dual-pressure processes are usually less than 600 mg m−3,while those of other processes are significantly higher. We es-timated the uncontrolled NOx emission factors to be 1.8 and13.6 kg t−1 nitric acid, for dual-pressure process and otherprocesses, respectively.
www.atmos-chem-phys.net/13/9869/2013/ Atmos. Chem. Phys., 13, 9869–9897, 2013
9878 B. Zhao et al.: NOx emissions in China
Table 4.Uncontrolled NOx factors for stationary sources.
Technology Unit emission factors in this study emission factors in other references
Coal-fired power plants< 100 MW(tangentially fired)
kg t−1 coal 6.81a (6.17 for bituminous,9.36 for anthracite)
8.85b (average factor forcoal-fired power plants) 5.55–10.5c(vary with size andcontrol measures, the averageuncontrolled factor is estimatedto be 9.10) 6.27d (uncontrolledfactor for coal-fired powerplants burning hard coal)
Coal-fired power plants< 100 MW(swirl burner)
kg t−1 coal 7.67a (6.93 for bituminous,10.65 for anthracite)
Coal-fired power plants≥ 100 MW(tangentially fired)
kg t−1 coal 7.29a (6.60 for bituminous,10.07 for anthracite)
Coal-fired power plants≥ 100 MW(swirl burner)
kg t−1 coal 8.21a (7.40 for bituminous,11.46 for anthracite)
Diesel-fired power plants kg t−1 diesel 7.21e 10.06b; 6.56f
Heavy fuel (HF) fired power plants kg t−1 HF 5.10e
Gas-fired power plants g m−3 gas 4.10b 9.82f ; 1.95e
Coal-fired industrial grate boiler kg t−1 coal 5.60g 7.25b; 3.8–4.0c; 5.25e; 6.1f
Coal-fired industrial CFB boiler kg t−1 coal 1.20g
Gas-fired industrial boiler g m−3 gas 2.10b 2.61e
Sintering production kg t−1 sinter 0.64h 0.14g; 0.50d
Cement – shaft kiln kg t−1 coal 1.7i 0.4g
Cement – other rotary kiln kg t−1 coal 18.5i 14.7g
Cement – precalcined kiln kg t−1 coal 15.3i 9.6g
Brick production kg (t brick)−1 0.27j 0.06–0.45k; 0.21c
Lime production kg t−1 lime 1.60g 1.75d
Glass production kg (t glass)−1 5.20l 8.20d
Ceramics production kg t−1 ceramics 4.35m
Refinery kg t−1 crude oil in-put
0.30d
Nitric acid – dual pressure process kg t−1 nitric acid 1.8n 1.38g (dual-pressure process);43.8g (other process); 7.14d (allprocess)Nitric acid – other process kg t−1 nitric acid 13.6n
Domestic coal stove kg t−1 coal 1.88b
Domestic biomass stove – agricul-tural residue
kg t−1ce 2.19o 2.74b (agricultural residue); 1.23b
(firewood); 1.90g (all biomass)Domestic biomass stove – firewood kg t−1ce 2.52o
Biomass open burning kg t−1 biomass 3.80p 3.37q
a Zhao et al. (2010);b Tian (2003);c Zhang et al. (2007);d IIASA GAINS-Asia: http://gains.iiasa.ac.at/index.php/gains-asia; e Wang et al. (2011a);f Yu (2009);g Zhang(2008);h Lei (2008);i Lei et al. (2011);j Data Codification Committee of the First National Pollution Source Census (2011);k Chinese Research Academy of EnvironmentalSciences (2009);l Chinese Research Academy of Environmental Sciences and Bengbu Glass Industry Design & Research Institute (2010);m Hunan Research Academy ofEnvironmental Sciences (2008);n Qingdao University of Science & Technology (2008);o Wang et al. (2009);p Li et al. (2007);q Wang and Zhang (2008).
For on-road vehicles, there have been a fairly large num-ber of measurements in the last decade. Our emission factorsare compiled mainly based on some systematic measurementstudies (e.g., Huo et al. (2012a) and the literature therein forlight-duty gasoline vehicles and Huo et al. (2012b) and theliterature therein for diesel vehicles). Considering the com-
plex real-life driving conditions and the detailed classifica-tion of vehicle types in the our model structure, we also re-ferred to some studies of vehicle emission estimation usingtransportation emission models, including Cai et al. (2007),Xie et al. (2006), Li et al. (2003), and Greenhouse Gas andAir Pollution Interactions and Synergies (Gains)-Asia project
Atmos. Chem. Phys., 13, 9869–9897, 2013 www.atmos-chem-phys.net/13/9869/2013/

B. Zhao et al.: NOx emissions in China 9879
Table 5.NOx emission factors of mobile sources.
Technology Fuel Emission factors (kg t−1ce)
Uncontrolled Euro-I Euro-II Euro-III Euro-IV Euro-V Euro-VI
Heavy-duty truck Diesel 62.90 43.41 46.54 40.25 23.27 13.84 2.52
Medium-duty truck Diesel 45.13 31.14 33.40 28.89 16.71 9.92 1.81Gasoline 11.53 2.08 1.14 0.82
Light-duty truck Diesel 21.43 21.43 21.43 21.43 16.07 8.37 3.63Gasoline 18.56 5.39 2.40 1.49 0.73 0.56 0.38
Mini truck Gasoline 27.60 8.02 3.60 2.20 1.11 0.82 0.56
Heavy-duty bus Diesel 56.55 39.02 41.83 36.18 20.93 12.44 2.25Gasoline 15.69 2.84 1.58 1.11
Medium-duty bus Diesel 36.18 24.97 26.78 23.15 13.38 7.96 1.43Gasoline 16.01 2.87 1.61 1.11
Light-duty bus Diesel 15.25 15.25 15.25 15.25 11.42 5.94 2.61Gasoline 19.73 5.74 2.58 1.58 0.79 0.59 0.38
Mini bus Diesel 12.09 12.09 12.09 12.09 9.07 4.71 2.05Gasoline 18.91 5.47 2.46 1.52 0.76 0.56 0.38
Motorcycle Gasoline 4.77 4.77 4.77 3.54
Tractor Diesel 37.11 24.50 18.56 11.12 11.12 7.05 1.49
Agricultural conveyer Diesel 37.11 24.50 18.56 11.12 11.12 7.05 1.49
Train Diesel 24.88 16.42 14.93 11.21 7.46 4.74 1.00
Inland waterway ship Diesel/heavy fuel oil 32.87 21.69 19.73 14.78 9.86 6.23 1.32
Agriculture machine Diesel 13.43 8.87 6.73 4.04 4.04 2.55 0.53
Construction machine Diesel 13.43 8.87 6.73 4.04 4.04 2.55 0.53
(available online athttp://gains.iiasa.ac.at/models/). The fi-nal emission factors, including uncontrolled factors, and con-trolled factors under Euro-I, Euro-II and Euro-III, were de-rived using field measurements as a starting point, whichwere subsequently adjusted based on the results of trans-portation emission models to reflect the complicated drivingconditions in China. The emission factors of non-road vehi-cles are quite uncertain, as there are only a limited numberof studies where emission performance of non-road vehicleshas been analyzed. We rely on Tian (2003) for trains and agri-cultural tractors and conveyers, Wang et al. (2007) and Tian(2003) for agricultural and construction machinery, and Dinget al. (2000) and Song (2007) for inland waterway ships. Itis valuable to do more measurements of the emission char-acteristics of non-road vehicles in the future. The emissionfactors of transportation sector are summarized in Table 5.
2.3 Data sources for NOx emission control measures
2.3.1 Historical NOx emission control measures
Low NOx combustion technology (mainly Low NOx Burner,LNB) was the only NOx control technology widely usedin China’s power plants before 2005. Flue gas denitrifica-tion, including selective catalytic reduction (SCR) and selec-tive non-catalytic reduction (SNCR), began to be installedfrom 2005 onwards. The installed capacity of power plantsequipped with SCR/SNCR increased from 4.2 GW in 2005to 80.7 GW in 2010 (Ministry of Environmental Protectionof China, 2011a). Fifty-seven percent of the total SCR/SNCRcapacities in 2010 were located in the three “key regions”, in-cluding the Greater Beijing region (including Beijing, Tian-jin, Hebei), the Yangtze River delta (YRD, including Shang-hai, Jiangsu, Zhejiang), and the Pearl River delta (PRD,mainly Guangdong province). The LNB penetration was es-timated based on the following assumptions due to the lackof official statistics: (1) no boilers were equipped with LNBbefore 31 December 1996; (2) large units (≥ 300 MW) built
www.atmos-chem-phys.net/13/9869/2013/ Atmos. Chem. Phys., 13, 9869–9897, 2013

9880 B. Zhao et al.: NOx emissions in China
47
(a) (b)
Figure 3. Structure adjustment of cooking and hot water: (a) urban area; (b) rural area. 1
2
(a)
(b)
Figure 4. The implementation time of the vehicle emission standards: (a) BAU[0]/PC[0] 3
scenario; (b) BAU[1]/PC[1]/BAU[2]/PC[2] scenario. The Arabic numbers 1-6 represent Euro 4
I to Euro VI vehicle emission standards. Numbers in black represent standards released by the 5
end of 2010, and that in red represent those to be released in the future. 6
7
Fig. 4. The implementation time of the vehicle emission standards:(a) BAU[0]/PC[0] scenario;(b) BAU[1]/PC[1]/BAU[2]/PC[2] scenario.The Arabic numbers 1–6 represent Euro I to Euro VI vehicle emission standards. Numbers in black represent standards released by the endof 2010, and those in red represent those to be released in the future.
after 1 January 1997 were equipped with LNB, accord-ing to the emission standard released in 1996 (State En-vironmental Protection Administration, 1996b); (3) smallerunits (< 300 MW) were not equipped with LNB until 31December 2003, but LNBs were installed with new boilersafter 1 January 2004, based on the emission standard re-leased in 2003 (State Environmental Protection Administra-tion, 2003). The penetration of LNB (including LNB+SCRand LNB+SNCR) in coal-fired power plants was estimatedto be 22.3 % in 2000, 50.5 % in 2005, and 87.9 % in 2010based on the assumptions above. The data for 2005 are be-tween the estimates of Zhang (2008) (46 % in 2005) andZhao et al. (2008) (60 % in 2005).
NOx control technologies were rarely adopted in the in-dustry sector. Low NOx combustion technologies were in-stalled in some new precalcined cement kilns, while end-of-pipe control technologies like SCR/SNCR were seldom in-stalled in the cement industry by 2010. The flue gas of dual-pressure nitric acid processes can be exhausted untreated ac-cording to the current emission standard (State Environmen-tal Protection Administration, 1996a), though some plantsare equipped with end-of-pipe control technologies. In con-trast, other nitric acid processes were usually equipped withSCR or absorption methods in order to achieve the standard(Tang, 2006; Wang and Zeng, 2008).
Since 2000, China has released a series of emission stan-dards for new vehicles, which are basically consistent withthe corresponding European standards, though released sev-eral years later. The implementation timeline of these stan-
dards is summarized in Fig. 4. Megacities including Beijingand Shanghai are subject to greater pressure for regulatingvehicle emissions, and are therefore 2–3 yr ahead of the na-tional legislation. Recently, Beijing Environmental Protec-tion Bureau began promoting regulations for new emissionstandards, i.e., Euro V in 2012 and Euro VI in 2016 (Wangand Hao, 2012).
2.3.2 Assumptions on future NOx emission controlmeasures
We developed three sets of end-of-pipe pollution controlmeasures for each energy scenario, including baseline (abbr.[0]), progressive (abbr. [1]), and stringent control mea-sures (abbr. [2]), thereby constituting six emission scenar-ios (BAU[0], BAU[1], BAU[2], PC[0], PC[1], and PC[2]).The baseline control measures (BAU[0]/PC[0] scenario) as-sume that all current pollution control legislation (until theend of 2010) and the current implementation status would befollowed during 2011–2030. The progressive control mea-sures (BAU[1]/PC[1] scenario) assume that new pollutioncontrol policies would be released and implemented, rep-resenting progressive approach towards future environmen-tal policies. The stringent control measures (BAU[2]/PC[2]scenario) assume that even more ambitious policies wouldbe released and implemented; such a scenario could be real-ized only if the government takes quick and substantially ag-gressive action. The definitions of the emission scenarios aresummarized in Table 1, and the penetration of major control
Atmos. Chem. Phys., 13, 9869–9897, 2013 www.atmos-chem-phys.net/13/9869/2013/

B. Zhao et al.: NOx emissions in China 9881
Table 6.Removal rates and penetrations of air pollution control technologies (%).
Sector Technology Removal rate Penetrations
2005 2010 2020 2030 2020 2030 2020 2030BAU[0]/PC[0] BAU[0]/PC[0] BAU[1]/PC[1] BAU[1]/PC[1] BAU[2]/PC[2] BAU[2]/PC[2]
Power plants Coal-fired power plants NOC 0 46 11 5 3 0 0 0 0< 100 MW (excl. CFB) LNB 30 54 89 95 97 100 100 100 100
LNB+SNCR 58 0 0 0 0 0 0 0 0LNB+SCR 86 0 0 0 0 0 0 0 0
Coal-fired power plants NOC 0 46 11 5 3 0 0 0 0≥ 100 MW (excl. CFB) LNB 30 53 75 82 84 8 0 0 0
LNB+SNCR 58 0 1 1 1 6 7 4 5LNB+SCR 86 1 12 12 12 86 94 96 95
CFB NOC 0 100 100 100 100 65 0 20 0LNB 30 0 0 0 0 0 0 0 0LNB+SNCR 58 0 0 0 0 30 80 70 70LNB+SCR 86 0 0 0 0 5 20 10 30
NGCC NOC 0 70 21 8 4 0 0 0 0LNB 30 30 74 87 91 50 10 0 0LNB+SNCR 58 0 1 1 1 5 9 10 10LNB+SCR 86 0 5 5 5 45 81 90 90
Industrial sector Coal-fired industrial NOC 0 100 100 100 100 9 0 10 0grate boiler LNB 30 0 0 0 0 91 100 17 0
LNB+SNCR 58 0 0 0 0 0 0 73 100
Precalcined cement NOC 0 70 70 70 70 20 0 0 0kiln <2000 t d−1 LNB 30 30 30 30 30 30 25 0 0
LNB+SNCR 58 0 0 0 0 30 45 20 20LNB+SCR 86 0 0 0 0 20 30 80 80
Precalcined cement NOC 0 70 65 65 65 20 0 0 0kiln 2000–4000 t d−1 LNB 30 30 35 35 35 30 25 0 0
LNB+SNCR 58 0 0 0 0 30 45 20 20LNB+SCR 86 0 0 0 0 20 30 80 80
Precalcined cement NOC 0 70 60 60 60 0 0 0 0kiln ≥4000 t d−1 LNB 30 30 40 40 40 0 0 0 0
LNB+SNCR 58 0 0 0 0 60 60 20 20LNB+SCR 86 0 0 0 0 40 40 80 80
Glass production NOC 0 100 100 100 100 10 0 0 0– float process OXFL 75 0 0 0 0 80 88 70 70
SCR 80 0 0 0 0 10 12 30 30
Sintering NOC 0 100 100 100 100 40 10 0 0SNCR 40 0 0 0 0 36 54 20 20SCR 80 0 0 0 0 24 36 80 80
Nitric acid – dual NOC 0 75 70 70 70 10 0 0 0pressure process ABSP 75 10 12 12 12 18 18 18 18
SCR 80 15 18 18 18 72 82 82 82ABSP+SCR 94 0 0 0 0 0 0 0 0
Nitric acid – NOC 0 10 5 0 0 0 0 0 0other process ABSP 75 60 63 66 66 5 5 5 0
SCR 80 30 32 34 34 15 15 15 0ABSP+SCR 94 0 0 0 0 80 80 80 100
Notes: NOC – no control; LNB – low NOx burner; SCR – selective catalytic reduction; SNCR – selective non-catalytic reduction; LNB+SCR – combination of LNB and SCR;LNB+SNCR – combination of LNB and SNCR; ABSP – absorption method; OXFL – Oxy-fuel combustion technology.The table gives the national average penetration of NOx control technologies. However, the penetrations vary with provinces. The penetration of the “key region” is usually largerthan that of other regions.
technologies under each emission scenario is summarized inTable 6. The future emissions are calculated with a 5 yr reso-lution, though the parameters are presented for selected yearsonly.
1. Power plants
The “Twelfth Five-Year Plan for Environmental Protection”(the “Plan”) requires that all newly built thermal power plantsbe equipped with low NOx combustion technologies and fluegas denitrification (SCR/SNCR) during 2011–2015. Existingthermal power plants should be upgraded with low NOx com-
bustion technologies, and flue gas denitrification is requiredfor large units (≥ 300 MW). In the “key regions” (see Sect.2.3.1), nearly all coal-fired power plants are requested to beequipped with flue gas denitrification (The State Council ofthe People’s Republic of China, 2010, 2011c). A new emis-sion standard for thermal power plants (the “New standard”)was issued in July 2011, which is more stringent than the“Plan”. The “New standard” requires that nearly all thermalpower plants be equipped with SCR, except for some circu-lating fluidized bed (CFB) boilers and some boilers burningcoal with very high volatile matter content.
www.atmos-chem-phys.net/13/9869/2013/ Atmos. Chem. Phys., 13, 9869–9897, 2013
9882 B. Zhao et al.: NOx emissions in China
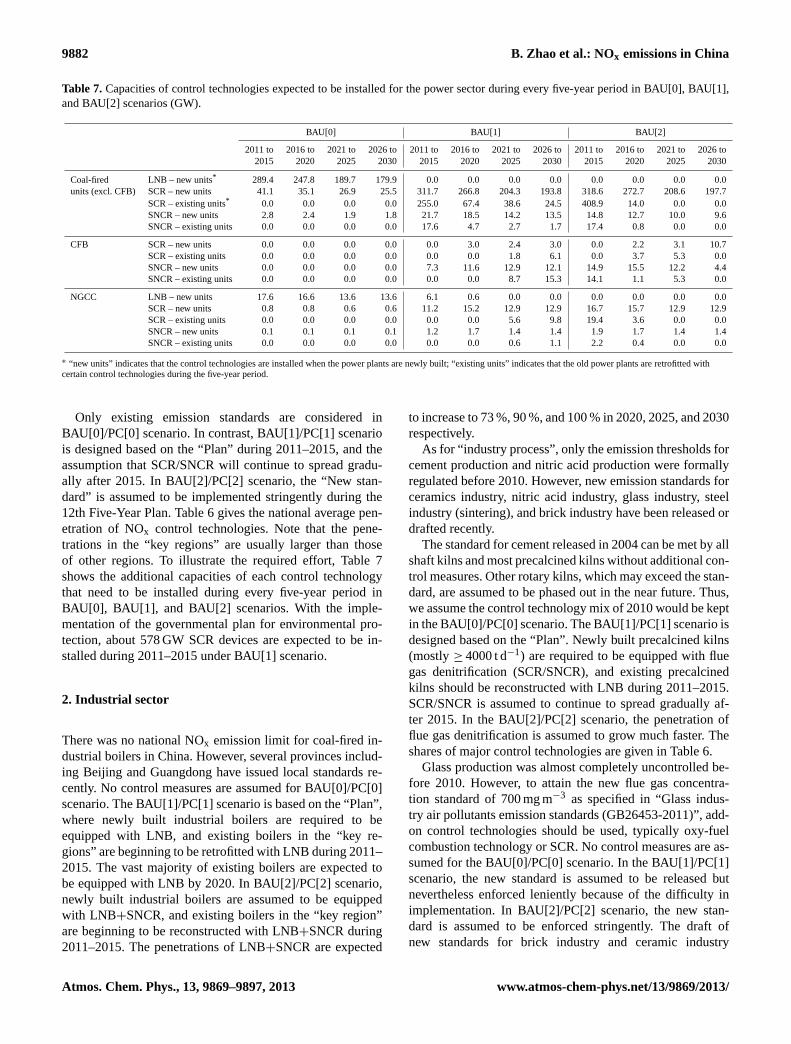
Table 7.Capacities of control technologies expected to be installed for the power sector during every five-year period in BAU[0], BAU[1],and BAU[2] scenarios (GW).
BAU[0] BAU[1] BAU[2]
2011 to 2016 to 2021 to 2026 to 2011 to 2016 to 2021 to 2026 to 2011 to 2016 to 2021 to 2026 to2015 2020 2025 2030 2015 2020 2025 2030 2015 2020 2025 2030
Coal-fired LNB – new units* 289.4 247.8 189.7 179.9 0.0 0.0 0.0 0.0 0.0 0.0 0.0 0.0units (excl. CFB) SCR – new units 41.1 35.1 26.9 25.5 311.7 266.8 204.3 193.8 318.6 272.7 208.6 197.7
SCR – existing units* 0.0 0.0 0.0 0.0 255.0 67.4 38.6 24.5 408.9 14.0 0.0 0.0SNCR – new units 2.8 2.4 1.9 1.8 21.7 18.5 14.2 13.5 14.8 12.7 10.0 9.6SNCR – existing units 0.0 0.0 0.0 0.0 17.6 4.7 2.7 1.7 17.4 0.8 0.0 0.0
CFB SCR – new units 0.0 0.0 0.0 0.0 0.0 3.0 2.4 3.0 0.0 2.2 3.1 10.7SCR – existing units 0.0 0.0 0.0 0.0 0.0 0.0 1.8 6.1 0.0 3.7 5.3 0.0SNCR – new units 0.0 0.0 0.0 0.0 7.3 11.6 12.9 12.1 14.9 15.5 12.2 4.4SNCR – existing units 0.0 0.0 0.0 0.0 0.0 0.0 8.7 15.3 14.1 1.1 5.3 0.0
NGCC LNB – new units 17.6 16.6 13.6 13.6 6.1 0.6 0.0 0.0 0.0 0.0 0.0 0.0SCR – new units 0.8 0.8 0.6 0.6 11.2 15.2 12.9 12.9 16.7 15.7 12.9 12.9SCR – existing units 0.0 0.0 0.0 0.0 0.0 0.0 5.6 9.8 19.4 3.6 0.0 0.0SNCR – new units 0.1 0.1 0.1 0.1 1.2 1.7 1.4 1.4 1.9 1.7 1.4 1.4SNCR – existing units 0.0 0.0 0.0 0.0 0.0 0.0 0.6 1.1 2.2 0.4 0.0 0.0
∗ “new units” indicates that the control technologies are installed when the power plants are newly built; “existing units” indicates that the old power plants are retrofitted withcertain control technologies during the five-year period.
Only existing emission standards are considered inBAU[0]/PC[0] scenario. In contrast, BAU[1]/PC[1] scenariois designed based on the “Plan” during 2011–2015, and theassumption that SCR/SNCR will continue to spread gradu-ally after 2015. In BAU[2]/PC[2] scenario, the “New stan-dard” is assumed to be implemented stringently during the12th Five-Year Plan. Table 6 gives the national average pen-etration of NOx control technologies. Note that the pene-trations in the “key regions” are usually larger than thoseof other regions. To illustrate the required effort, Table 7shows the additional capacities of each control technologythat need to be installed during every five-year period inBAU[0], BAU[1], and BAU[2] scenarios. With the imple-mentation of the governmental plan for environmental pro-tection, about 578 GW SCR devices are expected to be in-stalled during 2011–2015 under BAU[1] scenario.
2. Industrial sector
There was no national NOx emission limit for coal-fired in-dustrial boilers in China. However, several provinces includ-ing Beijing and Guangdong have issued local standards re-cently. No control measures are assumed for BAU[0]/PC[0]scenario. The BAU[1]/PC[1] scenario is based on the “Plan”,where newly built industrial boilers are required to beequipped with LNB, and existing boilers in the “key re-gions” are beginning to be retrofitted with LNB during 2011–2015. The vast majority of existing boilers are expected tobe equipped with LNB by 2020. In BAU[2]/PC[2] scenario,newly built industrial boilers are assumed to be equippedwith LNB+SNCR, and existing boilers in the “key region”are beginning to be reconstructed with LNB+SNCR during2011–2015. The penetrations of LNB+SNCR are expected
to increase to 73 %, 90 %, and 100 % in 2020, 2025, and 2030respectively.
As for “industry process”, only the emission thresholds forcement production and nitric acid production were formallyregulated before 2010. However, new emission standards forceramics industry, nitric acid industry, glass industry, steelindustry (sintering), and brick industry have been released ordrafted recently.
The standard for cement released in 2004 can be met by allshaft kilns and most precalcined kilns without additional con-trol measures. Other rotary kilns, which may exceed the stan-dard, are assumed to be phased out in the near future. Thus,we assume the control technology mix of 2010 would be keptin the BAU[0]/PC[0] scenario. The BAU[1]/PC[1] scenario isdesigned based on the “Plan”. Newly built precalcined kilns(mostly≥ 4000 t d−1) are required to be equipped with fluegas denitrification (SCR/SNCR), and existing precalcinedkilns should be reconstructed with LNB during 2011–2015.SCR/SNCR is assumed to continue to spread gradually af-ter 2015. In the BAU[2]/PC[2] scenario, the penetration offlue gas denitrification is assumed to grow much faster. Theshares of major control technologies are given in Table 6.
Glass production was almost completely uncontrolled be-fore 2010. However, to attain the new flue gas concentra-tion standard of 700 mg m−3 as specified in “Glass indus-try air pollutants emission standards (GB26453-2011)”, add-on control technologies should be used, typically oxy-fuelcombustion technology or SCR. No control measures are as-sumed for the BAU[0]/PC[0] scenario. In the BAU[1]/PC[1]scenario, the new standard is assumed to be released butnevertheless enforced leniently because of the difficulty inimplementation. In BAU[2]/PC[2] scenario, the new stan-dard is assumed to be enforced stringently. The draft ofnew standards for brick industry and ceramic industry
Atmos. Chem. Phys., 13, 9869–9897, 2013 www.atmos-chem-phys.net/13/9869/2013/

B. Zhao et al.: NOx emissions in China 9883
(GB25464-2010) can be reached without additional end-of-pipe control technologies, though these standards are com-parable with the most stringent standards in the world.Thus, no control measures are assumed for brick and ce-ramic production. The draft of new standards of sinter-ing in 2007 can also be attained without additional con-trol technologies. However, the “Plan” requests newly builtsintering plants to be equipped with flue gas denitrification(SCR/SNCR). The BAU[0]/PC[0] scenario assumes no con-trol measures, while BAU[1]/PC[1] scenario is developedon the basis of the “Plan”. Even more aggressive promo-tion of SCR/SNCR is assumed for BAU[2]/PC[2] scenario.To attain the new emission standard for the nitric acid in-dustry (GB26131-2010), the dual-pressure process should beequipped with absorption method (ABSP) or SCR, whileother processes need to adopt both ABSP and SCR. TheBAU[0]/PC[0], BAU[1]/PC[1], and BAU[2]/PC[2] scenariosassume the technology mix of 2010, lenient enforcement ofthe new standard, and stringent enforcement of the new stan-dard, respectively.
3. Transportation sector
In BAU[0]/PC[0] scenario, only existing standards (releasedbefore the end of 2010) are considered. In BAU[1]/PC[1]scenario, all the current standards in Europe are assumedto be implemented in China gradually, and the time inter-vals between the releases of two stage standards would bea little shorter than those of Europe. As described in Sect.2.3.1, megacities including Beijing and Shanghai have been2–3 yr ahead of the national legislation. Such a trend is as-sumed to continue in the future. The BAU[2]/PC[2] scenarioshares the same assumptions as BAU[1]/PC[1] scenario. Itshould be noted that the application of Euro IV and afterprobably varies by region, which might have considerableimpact on future emissions. We have not included such de-tailed assumptions in the current scenarios, but it is of im-portance to address this issue in the future studies. The re-moval efficiencies of the future emission standards are fromthe GAINS-Asia model of International Institute for AppliedSystem Analysis (IIASA) (Amann et al., 2008, 2011). Theemission factors are listed in Table 5, and the implementa-tion timeline of the emission standards is given in Fig. 4.
4. Heat supply, domestic sector, and open burning ofagricultural residue
The control technology mix of CHP is assumed to be thesame as ordinary thermal power plants, while that of otherheating boilers is consistent with the corresponding industrialboilers. No end-of-pipe control technology is assumed fordomestic sector, and for open burning of agricultural residuewe assume decline in activity as discussed in Sect. 2.1.3 (6).
5. Plausibility of the emission scenarios
Emission scenarios developed here represent different fu-tures, which vary with respect to stringency and enforcementof NOx emission policies. While their feasibility assessmentis beyond the scope of this study, we discuss below implica-tions of assumptions behind these scenarios, including en-forcement mechanisms, necessary pace of implementationand associated costs.
In recent years, Chinese authorities have implementedcontinuous emission monitoring systems (CEMSs), whichhave been widely used to monitor SO2 emissions from powerplants. The 12th Five-Year Plan calls for installation ofCEMSs for high emitting plants (e.g., power plants, iron andsteel plants, and large cement plants) for the online moni-toring of NOx emissions before 2015 (The State Council ofthe People’s Republic of China, 2011b). The CEMSs dataare transmitted in real time to administrative departments.Similarly, a stringent “environmental label” system is im-plemented for road vehicles. Environmental labels are nec-essary for new vehicles to come into markets. High emit-ting vehicles with “yellow labels” registered before 2005 willbe forbidden by 2015 (The State Council of the People’sRepublic of China, 2012). Finally, field inspections will bestrengthened to ensure the operation of control technologies.The SO2 scrubbers and CEMSs have been inspected once ortwice a month in the past few years, and harsh penalties wereimposed in case of non-compliance (Xu et al., 2011). Simi-lar inspections will be performed for NOx control technolo-gies. The continuity of compliance with emissions standardsfor new vehicles will be assured via frequent inspections ofmanufacturers (The State Council of the People’s Republic ofChina, 2012). The number of inspectors has increased from50 040 in 2005 to 62 468 in 2010 (Ministry of EnvironmentalProtection of China, 2006, 2012).
Scenario BAU[1] and BAU[2] set ambitious goals with re-spect to reductions and consequently require large capacitiesto be equipped with control measures within a relatively shortperiod of time. For example, as described above, 578 GWof SCR capacity are expected to be installed for powerplants during 2011–2015 under BAU[1] scenario. Such a pol-icy will be associated with significant costs. Based on Liu(2013), the investment cost for the implementation of con-trol technologies in power sector is estimated at about 65billion CHY during this period. For comparison, the gov-ernment has committed 816 billion CHY for the installa-tion of control technologies for air and water pollutants inthe same period (The State Council of the People’s Repub-lic of China, 2012), accounting for about 0.4 % of China’sGDP (40.1 trillion CHY in 2010, i.e., about 200 trillion CHYfor five years). In addition, economic policies including den-itrification compensation price and pollutant discharge feehave been released. The electricity generation unit equippedwith flue gas denitrification is supported by a price sub-sidy of 0.008 CHY kWh−1. Although it is not enough to
www.atmos-chem-phys.net/13/9869/2013/ Atmos. Chem. Phys., 13, 9869–9897, 2013
9884 B. Zhao et al.: NOx emissions in China
48
1
(a)
(b)
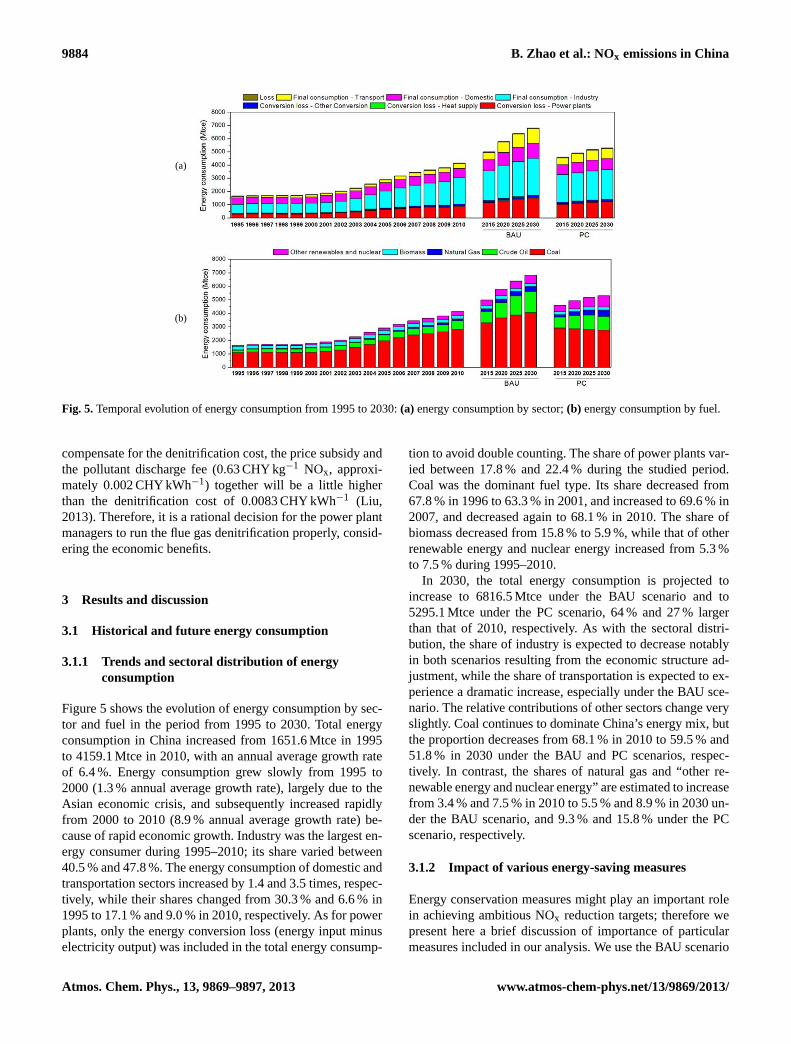
Figure 5. Temporal evolution of energy consumption from 1995 to 2030: (a) energy 2
consumption by sector; (b) energy consumption by fuel. 3
4
5
6
7
8
9
10
11
Fig. 5.Temporal evolution of energy consumption from 1995 to 2030:(a) energy consumption by sector;(b) energy consumption by fuel.
compensate for the denitrification cost, the price subsidy andthe pollutant discharge fee (0.63 CHY kg−1 NOx, approxi-mately 0.002 CHY kWh−1) together will be a little higherthan the denitrification cost of 0.0083 CHY kWh−1 (Liu,2013). Therefore, it is a rational decision for the power plantmanagers to run the flue gas denitrification properly, consid-ering the economic benefits.
3 Results and discussion
3.1 Historical and future energy consumption
3.1.1 Trends and sectoral distribution of energyconsumption
Figure 5 shows the evolution of energy consumption by sec-tor and fuel in the period from 1995 to 2030. Total energyconsumption in China increased from 1651.6 Mtce in 1995to 4159.1 Mtce in 2010, with an annual average growth rateof 6.4 %. Energy consumption grew slowly from 1995 to2000 (1.3 % annual average growth rate), largely due to theAsian economic crisis, and subsequently increased rapidlyfrom 2000 to 2010 (8.9 % annual average growth rate) be-cause of rapid economic growth. Industry was the largest en-ergy consumer during 1995–2010; its share varied between40.5 % and 47.8 %. The energy consumption of domestic andtransportation sectors increased by 1.4 and 3.5 times, respec-tively, while their shares changed from 30.3 % and 6.6 % in1995 to 17.1 % and 9.0 % in 2010, respectively. As for powerplants, only the energy conversion loss (energy input minuselectricity output) was included in the total energy consump-
tion to avoid double counting. The share of power plants var-ied between 17.8 % and 22.4 % during the studied period.Coal was the dominant fuel type. Its share decreased from67.8 % in 1996 to 63.3 % in 2001, and increased to 69.6 % in2007, and decreased again to 68.1 % in 2010. The share ofbiomass decreased from 15.8 % to 5.9 %, while that of otherrenewable energy and nuclear energy increased from 5.3 %to 7.5 % during 1995–2010.
In 2030, the total energy consumption is projected toincrease to 6816.5 Mtce under the BAU scenario and to5295.1 Mtce under the PC scenario, 64 % and 27 % largerthan that of 2010, respectively. As with the sectoral distri-bution, the share of industry is expected to decrease notablyin both scenarios resulting from the economic structure ad-justment, while the share of transportation is expected to ex-perience a dramatic increase, especially under the BAU sce-nario. The relative contributions of other sectors change veryslightly. Coal continues to dominate China’s energy mix, butthe proportion decreases from 68.1 % in 2010 to 59.5 % and51.8 % in 2030 under the BAU and PC scenarios, respec-tively. In contrast, the shares of natural gas and “other re-newable energy and nuclear energy” are estimated to increasefrom 3.4 % and 7.5 % in 2010 to 5.5 % and 8.9 % in 2030 un-der the BAU scenario, and 9.3 % and 15.8 % under the PCscenario, respectively.
3.1.2 Impact of various energy-saving measures
Energy conservation measures might play an important rolein achieving ambitious NOx reduction targets; therefore wepresent here a brief discussion of importance of particularmeasures included in our analysis. We use the BAU scenario
Atmos. Chem. Phys., 13, 9869–9897, 2013 www.atmos-chem-phys.net/13/9869/2013/
B. Zhao et al.: NOx emissions in China 9885
49
0
100
200
300
400
500
600
2015 2020 2025 2030
En
erg
y co
nsu
mp
tio
n r
edu
ctio
n (
Mtc
e)
Energy ef f iciency improvement
Structural adjustment
Life style changes
0
5
10
15
20
25
30
35
40
2015 2020 2025 2030
En
erg
y co
nsu
mp
tio
n r
edu
ctio
n (
Mtc
e) Energy ef f iciency improvement
Structural adjustment
Life style changes
Power plants Heat supply
0
100
200
300
400
500
600
2015 2020 2025 2030
En
erg
y co
nsu
mp
tio
n r
edu
ctio
n (
Mtc
e) Energy ef f iciency improvement
Structural adjustment
Life style changes
0
50
100
150
200
250
300
2015 2020 2025 2030
En
erg
y co
nsu
mp
tio
n r
edu
ctio
n (
Mtc
e)
Energy ef f iciency improvement
Structural adjustment
Life style changes
Industry Domestic
0
50
100
150
200
250
300
350
400
450
2015 2020 2025 2030
En
erg
y co
nsu
mp
tio
n r
edu
ctio
n (
Mtc
e)
Energy ef f iciency improvement
Structural adjustment
Life style changes
0
200
400
600
800
1,000
1,200
1,400
1,600
1,800
2015 2020 2025 2030
En
erg
y co
nsu
mp
tio
n r
edu
ctio
n (
Mtc
e) Energy ef f iciency improvement
Structural adjustment
Life style changes
Transportation Total reduction by control measures
0
200
400
600
800
1,000
1,200
1,400
1,600
1,800
2015 2020 2025 2030
En
erg
y co
nsu
mp
tio
n r
edu
ctio
n (
Mtc
e) Transport (Final consumption)
Domestic (Final consumption)
Industry (Final consumption)
Heat supply (conversion loss)
Power plants (conversion loss)
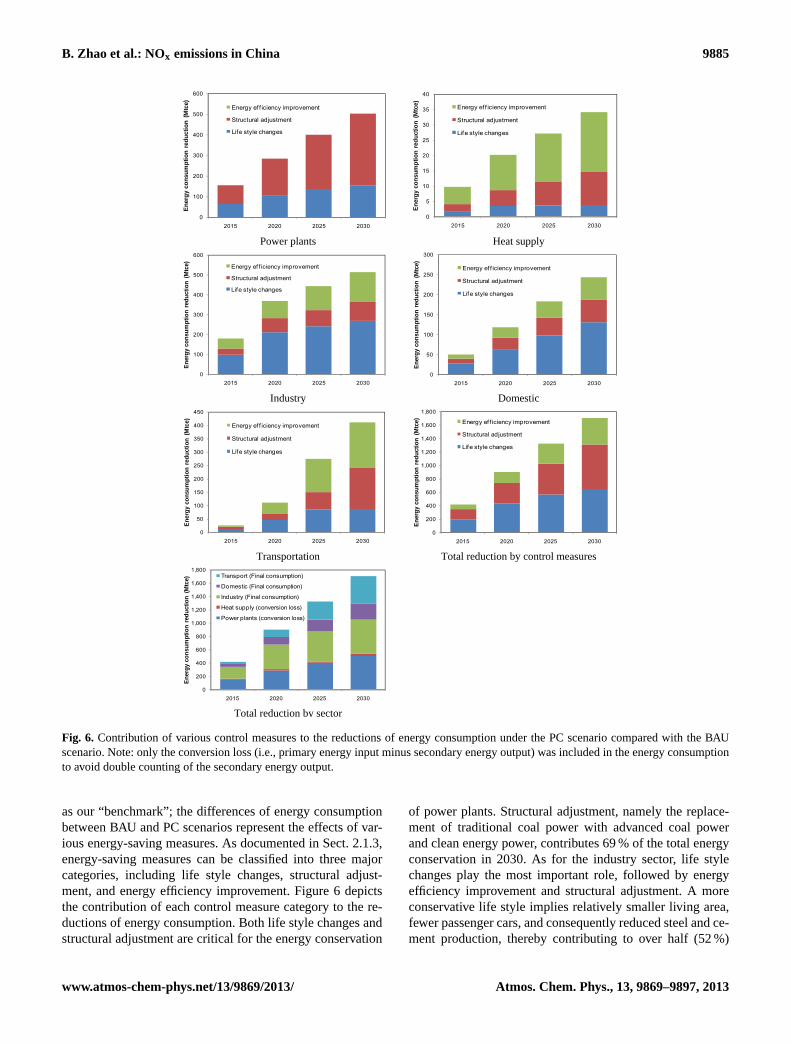
Total reduction by sector Figure 6. Contribution of various control measures to the reductions of energy consumption 1 under the PC scenario compared with the BAU scenario. Note: only the conversion loss, i.e. 2 primary energy input minus secondary energy output, was included in the energy 3 consumption to avoid double-counting of the secondary energy output. 4
Fig. 6. Contribution of various control measures to the reductions of energy consumption under the PC scenario compared with the BAUscenario. Note: only the conversion loss (i.e., primary energy input minus secondary energy output) was included in the energy consumptionto avoid double counting of the secondary energy output.
as our “benchmark”; the differences of energy consumptionbetween BAU and PC scenarios represent the effects of var-ious energy-saving measures. As documented in Sect. 2.1.3,energy-saving measures can be classified into three majorcategories, including life style changes, structural adjust-ment, and energy efficiency improvement. Figure 6 depictsthe contribution of each control measure category to the re-ductions of energy consumption. Both life style changes andstructural adjustment are critical for the energy conservation
of power plants. Structural adjustment, namely the replace-ment of traditional coal power with advanced coal powerand clean energy power, contributes 69 % of the total energyconservation in 2030. As for the industry sector, life stylechanges play the most important role, followed by energyefficiency improvement and structural adjustment. A moreconservative life style implies relatively smaller living area,fewer passenger cars, and consequently reduced steel and ce-ment production, thereby contributing to over half (52 %)
www.atmos-chem-phys.net/13/9869/2013/ Atmos. Chem. Phys., 13, 9869–9897, 2013
9886 B. Zhao et al.: NOx emissions in China
50
1
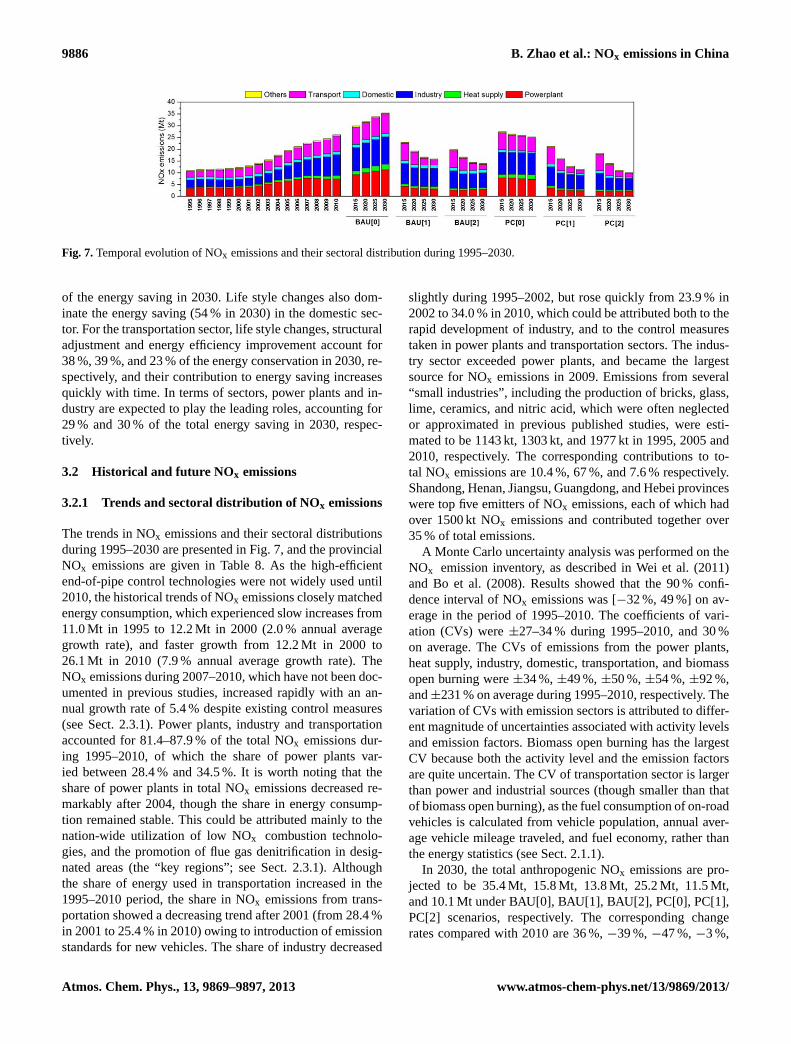
Figure 7. Temporal evolution of NOX emissions and their sectoral distribution during 1995-2
2030. 3
4
Fig. 7.Temporal evolution of NOx emissions and their sectoral distribution during 1995–2030.
of the energy saving in 2030. Life style changes also dom-inate the energy saving (54 % in 2030) in the domestic sec-tor. For the transportation sector, life style changes, structuraladjustment and energy efficiency improvement account for38 %, 39 %, and 23 % of the energy conservation in 2030, re-spectively, and their contribution to energy saving increasesquickly with time. In terms of sectors, power plants and in-dustry are expected to play the leading roles, accounting for29 % and 30 % of the total energy saving in 2030, respec-tively.
3.2 Historical and future NOx emissions
3.2.1 Trends and sectoral distribution of NOx emissions
The trends in NOx emissions and their sectoral distributionsduring 1995–2030 are presented in Fig. 7, and the provincialNOx emissions are given in Table 8. As the high-efficientend-of-pipe control technologies were not widely used until2010, the historical trends of NOx emissions closely matchedenergy consumption, which experienced slow increases from11.0 Mt in 1995 to 12.2 Mt in 2000 (2.0 % annual averagegrowth rate), and faster growth from 12.2 Mt in 2000 to26.1 Mt in 2010 (7.9 % annual average growth rate). TheNOx emissions during 2007–2010, which have not been doc-umented in previous studies, increased rapidly with an an-nual growth rate of 5.4 % despite existing control measures(see Sect. 2.3.1). Power plants, industry and transportationaccounted for 81.4–87.9 % of the total NOx emissions dur-ing 1995–2010, of which the share of power plants var-ied between 28.4 % and 34.5 %. It is worth noting that theshare of power plants in total NOx emissions decreased re-markably after 2004, though the share in energy consump-tion remained stable. This could be attributed mainly to thenation-wide utilization of low NOx combustion technolo-gies, and the promotion of flue gas denitrification in desig-nated areas (the “key regions”; see Sect. 2.3.1). Althoughthe share of energy used in transportation increased in the1995–2010 period, the share in NOx emissions from trans-portation showed a decreasing trend after 2001 (from 28.4 %in 2001 to 25.4 % in 2010) owing to introduction of emissionstandards for new vehicles. The share of industry decreased
slightly during 1995–2002, but rose quickly from 23.9 % in2002 to 34.0 % in 2010, which could be attributed both to therapid development of industry, and to the control measurestaken in power plants and transportation sectors. The indus-try sector exceeded power plants, and became the largestsource for NOx emissions in 2009. Emissions from several“small industries”, including the production of bricks, glass,lime, ceramics, and nitric acid, which were often neglectedor approximated in previous published studies, were esti-mated to be 1143 kt, 1303 kt, and 1977 kt in 1995, 2005 and2010, respectively. The corresponding contributions to to-tal NOx emissions are 10.4 %, 67 %, and 7.6 % respectively.Shandong, Henan, Jiangsu, Guangdong, and Hebei provinceswere top five emitters of NOx emissions, each of which hadover 1500 kt NOx emissions and contributed together over35 % of total emissions.
A Monte Carlo uncertainty analysis was performed on theNOx emission inventory, as described in Wei et al. (2011)and Bo et al. (2008). Results showed that the 90 % confi-dence interval of NOx emissions was [−32 %, 49 %] on av-erage in the period of 1995–2010. The coefficients of vari-ation (CVs) were±27–34 % during 1995–2010, and 30 %on average. The CVs of emissions from the power plants,heat supply, industry, domestic, transportation, and biomassopen burning were±34 %,±49 %,±50 %,±54 %,±92 %,and±231 % on average during 1995–2010, respectively. Thevariation of CVs with emission sectors is attributed to differ-ent magnitude of uncertainties associated with activity levelsand emission factors. Biomass open burning has the largestCV because both the activity level and the emission factorsare quite uncertain. The CV of transportation sector is largerthan power and industrial sources (though smaller than thatof biomass open burning), as the fuel consumption of on-roadvehicles is calculated from vehicle population, annual aver-age vehicle mileage traveled, and fuel economy, rather thanthe energy statistics (see Sect. 2.1.1).
In 2030, the total anthropogenic NOx emissions are pro-jected to be 35.4 Mt, 15.8 Mt, 13.8 Mt, 25.2 Mt, 11.5 Mt,and 10.1 Mt under BAU[0], BAU[1], BAU[2], PC[0], PC[1],PC[2] scenarios, respectively. The corresponding changerates compared with 2010 are 36 %,−39 %,−47 %,−3 %,
Atmos. Chem. Phys., 13, 9869–9897, 2013 www.atmos-chem-phys.net/13/9869/2013/
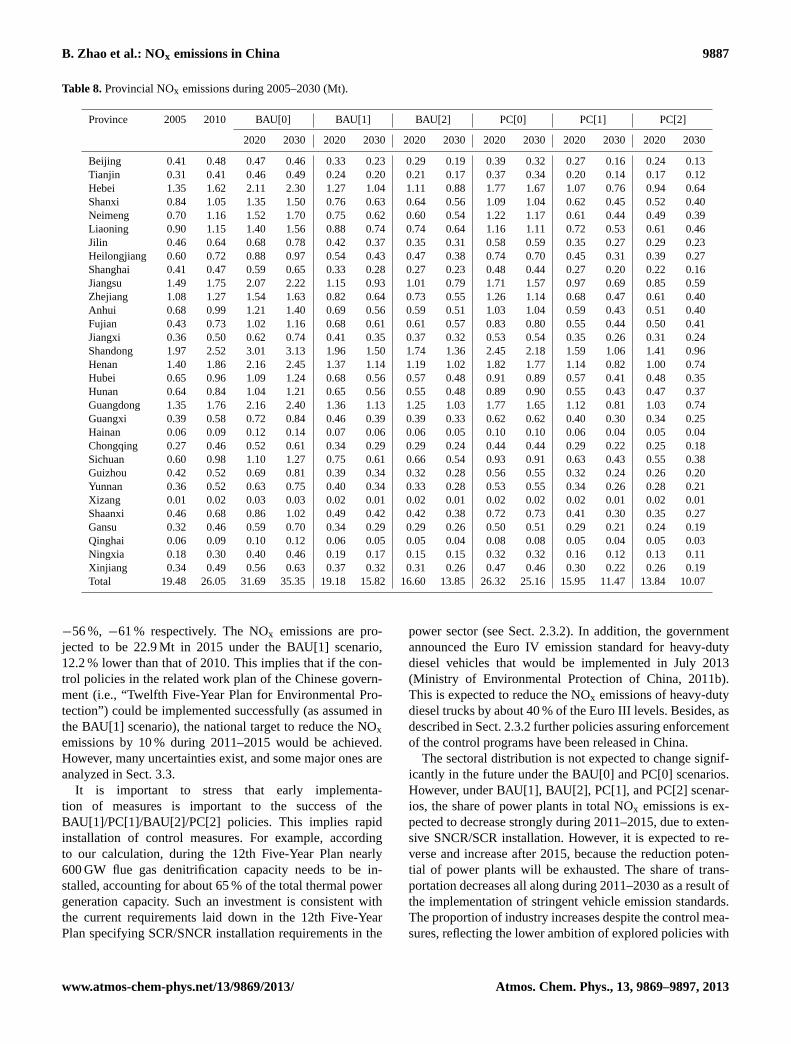
B. Zhao et al.: NOx emissions in China 9887
Table 8.Provincial NOx emissions during 2005–2030 (Mt).
Province 2005 2010 BAU[0] BAU[1] BAU[2] PC[0] PC[1] PC[2]
2020 2030 2020 2030 2020 2030 2020 2030 2020 2030 2020 2030
Beijing 0.41 0.48 0.47 0.46 0.33 0.23 0.29 0.19 0.39 0.32 0.27 0.16 0.24 0.13Tianjin 0.31 0.41 0.46 0.49 0.24 0.20 0.21 0.17 0.37 0.34 0.20 0.14 0.17 0.12Hebei 1.35 1.62 2.11 2.30 1.27 1.04 1.11 0.88 1.77 1.67 1.07 0.76 0.94 0.64Shanxi 0.84 1.05 1.35 1.50 0.76 0.63 0.64 0.56 1.09 1.04 0.62 0.45 0.52 0.40Neimeng 0.70 1.16 1.52 1.70 0.75 0.62 0.60 0.54 1.22 1.17 0.61 0.44 0.49 0.39Liaoning 0.90 1.15 1.40 1.56 0.88 0.74 0.74 0.64 1.16 1.11 0.72 0.53 0.61 0.46Jilin 0.46 0.64 0.68 0.78 0.42 0.37 0.35 0.31 0.58 0.59 0.35 0.27 0.29 0.23Heilongjiang 0.60 0.72 0.88 0.97 0.54 0.43 0.47 0.38 0.74 0.70 0.45 0.31 0.39 0.27Shanghai 0.41 0.47 0.59 0.65 0.33 0.28 0.27 0.23 0.48 0.44 0.27 0.20 0.22 0.16Jiangsu 1.49 1.75 2.07 2.22 1.15 0.93 1.01 0.79 1.71 1.57 0.97 0.69 0.85 0.59Zhejiang 1.08 1.27 1.54 1.63 0.82 0.64 0.73 0.55 1.26 1.14 0.68 0.47 0.61 0.40Anhui 0.68 0.99 1.21 1.40 0.69 0.56 0.59 0.51 1.03 1.04 0.59 0.43 0.51 0.40Fujian 0.43 0.73 1.02 1.16 0.68 0.61 0.61 0.57 0.83 0.80 0.55 0.44 0.50 0.41Jiangxi 0.36 0.50 0.62 0.74 0.41 0.35 0.37 0.32 0.53 0.54 0.35 0.26 0.31 0.24Shandong 1.97 2.52 3.01 3.13 1.96 1.50 1.74 1.36 2.45 2.18 1.59 1.06 1.41 0.96Henan 1.40 1.86 2.16 2.45 1.37 1.14 1.19 1.02 1.82 1.77 1.14 0.82 1.00 0.74Hubei 0.65 0.96 1.09 1.24 0.68 0.56 0.57 0.48 0.91 0.89 0.57 0.41 0.48 0.35Hunan 0.64 0.84 1.04 1.21 0.65 0.56 0.55 0.48 0.89 0.90 0.55 0.43 0.47 0.37Guangdong 1.35 1.76 2.16 2.40 1.36 1.13 1.25 1.03 1.77 1.65 1.12 0.81 1.03 0.74Guangxi 0.39 0.58 0.72 0.84 0.46 0.39 0.39 0.33 0.62 0.62 0.40 0.30 0.34 0.25Hainan 0.06 0.09 0.12 0.14 0.07 0.06 0.06 0.05 0.10 0.10 0.06 0.04 0.05 0.04Chongqing 0.27 0.46 0.52 0.61 0.34 0.29 0.29 0.24 0.44 0.44 0.29 0.22 0.25 0.18Sichuan 0.60 0.98 1.10 1.27 0.75 0.61 0.66 0.54 0.93 0.91 0.63 0.43 0.55 0.38Guizhou 0.42 0.52 0.69 0.81 0.39 0.34 0.32 0.28 0.56 0.55 0.32 0.24 0.26 0.20Yunnan 0.36 0.52 0.63 0.75 0.40 0.34 0.33 0.28 0.53 0.55 0.34 0.26 0.28 0.21Xizang 0.01 0.02 0.03 0.03 0.02 0.01 0.02 0.01 0.02 0.02 0.02 0.01 0.02 0.01Shaanxi 0.46 0.68 0.86 1.02 0.49 0.42 0.42 0.38 0.72 0.73 0.41 0.30 0.35 0.27Gansu 0.32 0.46 0.59 0.70 0.34 0.29 0.29 0.26 0.50 0.51 0.29 0.21 0.24 0.19Qinghai 0.06 0.09 0.10 0.12 0.06 0.05 0.05 0.04 0.08 0.08 0.05 0.04 0.05 0.03Ningxia 0.18 0.30 0.40 0.46 0.19 0.17 0.15 0.15 0.32 0.32 0.16 0.12 0.13 0.11Xinjiang 0.34 0.49 0.56 0.63 0.37 0.32 0.31 0.26 0.47 0.46 0.30 0.22 0.26 0.19Total 19.48 26.05 31.69 35.35 19.18 15.82 16.60 13.85 26.32 25.16 15.95 11.47 13.84 10.07
−56 %, −61 % respectively. The NOx emissions are pro-jected to be 22.9 Mt in 2015 under the BAU[1] scenario,12.2 % lower than that of 2010. This implies that if the con-trol policies in the related work plan of the Chinese govern-ment (i.e., “Twelfth Five-Year Plan for Environmental Pro-tection”) could be implemented successfully (as assumed inthe BAU[1] scenario), the national target to reduce the NOxemissions by 10 % during 2011–2015 would be achieved.However, many uncertainties exist, and some major ones areanalyzed in Sect. 3.3.
It is important to stress that early implementa-tion of measures is important to the success of theBAU[1]/PC[1]/BAU[2]/PC[2] policies. This implies rapidinstallation of control measures. For example, accordingto our calculation, during the 12th Five-Year Plan nearly600 GW flue gas denitrification capacity needs to be in-stalled, accounting for about 65 % of the total thermal powergeneration capacity. Such an investment is consistent withthe current requirements laid down in the 12th Five-YearPlan specifying SCR/SNCR installation requirements in the
power sector (see Sect. 2.3.2). In addition, the governmentannounced the Euro IV emission standard for heavy-dutydiesel vehicles that would be implemented in July 2013(Ministry of Environmental Protection of China, 2011b).This is expected to reduce the NOx emissions of heavy-dutydiesel trucks by about 40 % of the Euro III levels. Besides, asdescribed in Sect. 2.3.2 further policies assuring enforcementof the control programs have been released in China.
The sectoral distribution is not expected to change signif-icantly in the future under the BAU[0] and PC[0] scenarios.However, under BAU[1], BAU[2], PC[1], and PC[2] scenar-ios, the share of power plants in total NOx emissions is ex-pected to decrease strongly during 2011–2015, due to exten-sive SNCR/SCR installation. However, it is expected to re-verse and increase after 2015, because the reduction poten-tial of power plants will be exhausted. The share of trans-portation decreases all along during 2011–2030 as a result ofthe implementation of stringent vehicle emission standards.The proportion of industry increases despite the control mea-sures, reflecting the lower ambition of explored policies with
www.atmos-chem-phys.net/13/9869/2013/ Atmos. Chem. Phys., 13, 9869–9897, 2013
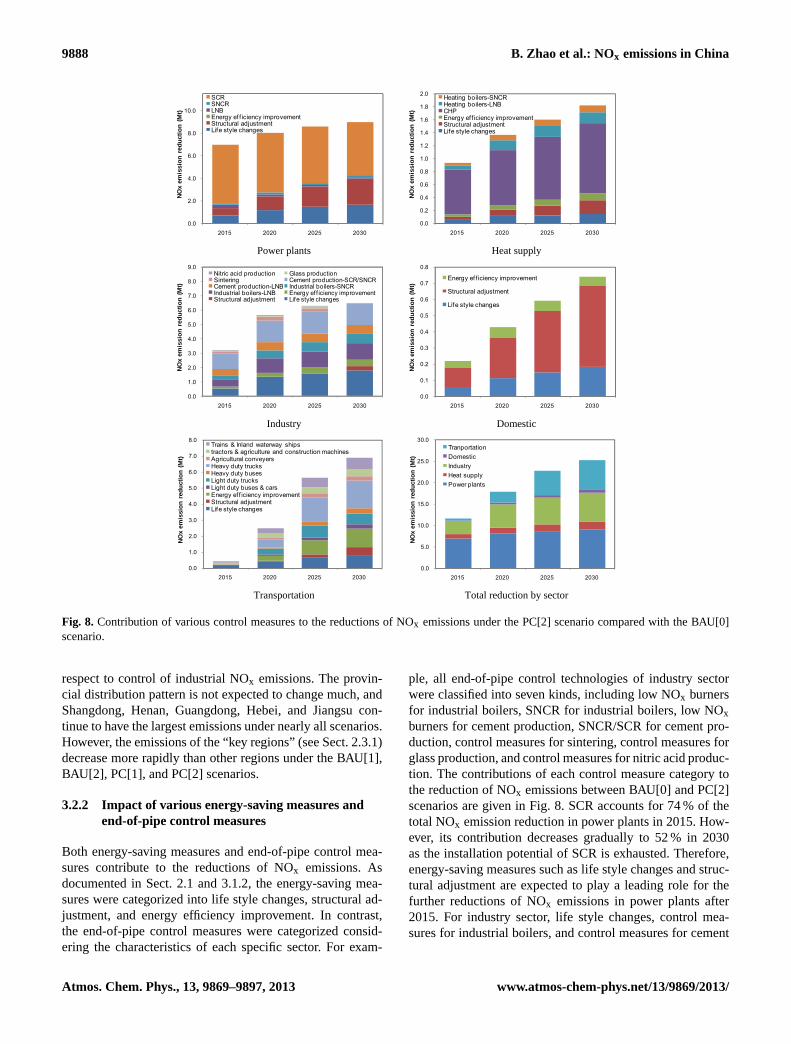
9888 B. Zhao et al.: NOx emissions in China
51
1
0.0
2.0
4.0
6.0
8.0
10.0
2015 2020 2025 2030
NO
x em
issi
on
red
uct
ion
(M
t)
SCRSNCRLNBEnergy ef f iciency improvementStructural adjustmentLife style changes
0.0
0.2
0.4
0.6
0.8
1.0
1.2
1.4
1.6
1.8
2.0
2015 2020 2025 2030
NO
x em
issi
on
red
uct
ion
(M
t)
Heating boilers-SNCRHeating boilers-LNBCHPEnergy ef f iciency improvementStructural adjustmentLife style changes
Power plants Heat supply
0.0
1.0
2.0
3.0
4.0
5.0
6.0
7.0
8.0
9.0
2015 2020 2025 2030
NO
x em
issi
on
red
uct
ion
(M
t)
Nitric acid productionSinteringCement production-LNBIndustrial boilers-LNBStructural adjustment
Glass productionCement production-SCR/SNCRIndustrial boilers-SNCREnergy ef f iciency improvementLife style changes
0.0
0.1
0.2
0.3
0.4
0.5
0.6
0.7
0.8
2015 2020 2025 2030 N
Ox
emis
sio
n r
edu
ctio
n (
Mt)
Energy ef f iciency improvement
Structural adjustment
Life style changes
Industry Domestic
0.0
1.0
2.0
3.0
4.0
5.0
6.0
7.0
8.0
2015 2020 2025 2030
NO
x em
issi
on
red
uct
ion
(M
t)
Trains & Inland waterway shipstractors & agriculture and construction machinesAgricultural conveyersHeavy duty trucksHeavy duty busesLight duty trucksLight duty buses & carsEnergy ef f iciency improvementStructural adjustmentLife style changes
0.0
5.0
10.0
15.0
20.0
25.0
30.0
2015 2020 2025 2030
NO
x em
issi
on
red
uct
ion
(M
t)
Tranportation
Domestic
Industry
Heat supply
Power plants
Transportation Total reduction by sector
Figure 8. Contribution of various control measures to the reductions of NOX emissions under 2
the PC[2] scenario compared with the BAU[0] scenario. 3
4
Fig. 8. Contribution of various control measures to the reductions of NOx emissions under the PC[2] scenario compared with the BAU[0]scenario.
respect to control of industrial NOx emissions. The provin-cial distribution pattern is not expected to change much, andShangdong, Henan, Guangdong, Hebei, and Jiangsu con-tinue to have the largest emissions under nearly all scenarios.However, the emissions of the “key regions” (see Sect. 2.3.1)decrease more rapidly than other regions under the BAU[1],BAU[2], PC[1], and PC[2] scenarios.
3.2.2 Impact of various energy-saving measures andend-of-pipe control measures
Both energy-saving measures and end-of-pipe control mea-sures contribute to the reductions of NOx emissions. Asdocumented in Sect. 2.1 and 3.1.2, the energy-saving mea-sures were categorized into life style changes, structural ad-justment, and energy efficiency improvement. In contrast,the end-of-pipe control measures were categorized consid-ering the characteristics of each specific sector. For exam-
ple, all end-of-pipe control technologies of industry sectorwere classified into seven kinds, including low NOx burnersfor industrial boilers, SNCR for industrial boilers, low NOxburners for cement production, SNCR/SCR for cement pro-duction, control measures for sintering, control measures forglass production, and control measures for nitric acid produc-tion. The contributions of each control measure category tothe reduction of NOx emissions between BAU[0] and PC[2]scenarios are given in Fig. 8. SCR accounts for 74 % of thetotal NOx emission reduction in power plants in 2015. How-ever, its contribution decreases gradually to 52 % in 2030as the installation potential of SCR is exhausted. Therefore,energy-saving measures such as life style changes and struc-tural adjustment are expected to play a leading role for thefurther reductions of NOx emissions in power plants after2015. For industry sector, life style changes, control mea-sures for industrial boilers, and control measures for cement
Atmos. Chem. Phys., 13, 9869–9897, 2013 www.atmos-chem-phys.net/13/9869/2013/

B. Zhao et al.: NOx emissions in China 9889
production contribute 26 %, 27 %, and 31 % of the total NOxemission reduction in 2030, respectively. For the transporta-tion sector, the energy-saving measures, end-of-pipe controlmeasures for on-road transportation, and end-of-pipe con-trol measures for off-road transportation account for 36 %,43 %, and 21 % of the total NOx emission reduction in 2030,respectively. Within the end-of-pipe measures for on-roadtransportation, the control measures for heavy-duty vehiclesaccount for as much as 69 % of the reduction. Adding up allthe control measures, power plants, industry, and transporta-tion contribute 60 %, 26 %, and 4 % of the total NOx emis-sion reduction in 2015. However, the relative importance ofpower plants is expected to decrease while that of transporta-tion increases after 2015. The contributions of power plants,industry, and transportation to the total NOx emission reduc-tion in 2030 are estimated to be 36 %, 27 %, and 27 %, re-spectively.
3.2.3 Ancillary benefit of energy conservation on NOxemission reduction
The contribution of energy-saving measures to total NOxemission reductions (between BAU[0] and PC[2]) is 21 %,30 %, 35 %, and 40 % in 2015, 2020, 2025, and 2030, re-spectively. We further analyzed the increment of the NOxemission reduction (between BAU[0] and PC[2]) for everyfive years. The integrated energy-saving measures accountfor only 21 % of the NOx reduction increment during 2010–2015. However, during 2025–2030, 89 % of the NOx reduc-tion increment could be attributed to energy-saving mea-sures. Therefore, the traditional end-of-pipe measures mightdominate the NOx emission reductions in the short term, buttheir reduction potential might nevertheless be exhausted inthe near future. To achieve further reductions, it is strategi-cally important to take advantage of the ancillary benefit ofenergy conservation on NOx emission reductions.
Actually, the “latent” ancillary benefit of energy saving onNOx emission reductions might be much larger than docu-mented above. Figure 9 shows the temporal evolution of en-ergy intensity (energy consumption per unit GDP) and NOxintensity (NOx emission per unit GDP) during 1995–2030(normalized to 1995). The line of “BAU_NOC” in Fig. 9defines what the NOx intensity in BAU[0]/BAU[1]/BAU[2]scenario would be if no end-of-pipe NOx control measureswere applied, and, similarly, the line of “PC_NOC” definesthat of PC[0]/PC[1]/PC[2] scenario. With no energy-savingmeasures, the NOx intensity under BAU_NOC/PC_NOCwould have remained roughly unchanged. In fact, the NOxintensity decreases by 25 % under BAU_NOC/PC_NOC,during 1995–2010, attributable to the integrated energy-saving measures in these years. In other words, energy sav-ings avoided 25 % of the NOx emissions by 2010. From 2010to 2030, the NOx intensity decreases by 46 % and 63 % underBAU_NOC and PC_NOC, respectively. This implies that theintegrated energy-saving measures assumed in BAU and PC
52
0.0
0.1
0.2
0.3
0.4
0.5
0.6
0.7
0.8
0.9
1.0
1995 2000 2005 2010 2015 2020 2025 2030
Tem
po
ral
evo
luti
on
of
ener
gy
inte
nsi
ty a
nd
NO
x in
ten
sity
(n
om
aliz
ed t
o 1
995)
Year
Energy-BAUEnergy-PCNOx-BAU_NOCNOx-PC_NOCNOx-BAU[0]NOx-BAU[1]NOx-BAU[2]NOx-PC[0]NOx-PC[1]NOx-PC[2]
Figure 9. Temporal evolution of energy intensity and NOX intensity during 1995-2030 1
(normalized to 1995). Note that this study focused on the emission pathway every five years. 2
The lines are only used to improve the readability. They do not necessarily indicate the 3
trajectories of energy intensity or emission intensity year by year. 4
5
Fig. 9. Temporal evolution of energy intensity and NOx intensityduring 1995–2030 (normalized to 1995). Note that this study fo-cused on the emission pathway every five years. The lines are onlyused to improve the readability. They do not necessarily indicate thetrajectories of energy intensity or emission intensity year by year.
scenarios could avoid 46 % and 63 % of the NOx emissionsby 2030, respectively. Thus, making full use of the ancillarybenefit of energy saving on NOx emission reductions wouldbe of strategic importance in the pollution control policies.
3.3 Sensitivity analysis
The intrinsic uncertainties in the key drivers (including eco-nomic growth, energy-saving policies, pollution control poli-cies, etc.) constitute the major sources of the uncertaintiesof future emissions, which, however, cannot be consideredthoroughly in the scenarios. It is instructive to quantify theimpacts of some key factors on the future emissions, whichwere not considered in the scenarios developed in this study(see Table 1).
3.3.1 Uncertainty in the GDP growth rate
The GDP growth rate in such a rapidly developing countryas China is quite uncertain. The actual GDP growth rate wassignificantly higher than the governmental target in the pastfew decades. Therefore, we designed a higher GDP growthcase (HGDP) for each of the scenarios developed in thisstudy (see Table 1), where the GDP growth rate was onepercent higher, i.e., 9.0 % from 2011 to 2015, 8.5 % from2016 to 2020, 7.5 % from 2021 to 2025, and 6.5 % from2026 to 2030, respectively. In 2030, the total NOx emis-sions under the six sensitivity (HGDP) cases are projected tobe 4.8–9.0 % higher than the corresponding scenarios. TheNOx emissions are estimated to be 23.8 Mt in 2015 under theHGDP-BAU[1] case, 8.6 % lower than that of 2010, imply-ing that the national target to reduce the NOx emissions by10 % during 2011–2015 might not be achieved with 1 percenthigher GDP growth.
www.atmos-chem-phys.net/13/9869/2013/ Atmos. Chem. Phys., 13, 9869–9897, 2013
9890 B. Zhao et al.: NOx emissions in China
3.3.2 Failure in the control of heavy diesel vehicles
The Euro I–Euro III standards for heavy diesels vehicles havealready been implemented nationwide, and the Euro IV isexpected to be implemented during the 12th Five-Year Plan.However, the effectiveness of the standards has been ques-tioned in recent research. Wang et al. (2012) suggested thatcurrent emission standard implemented in Beijing (Euro I–Euro IV) and nationwide might have limited impacts on re-ducing NOx emissions. Wu et al. (2012) found the NOx emis-sion factors for heavy-duty diesel buses did not improve inmost cases as emission standards became more stringent, andthat the average NOx emission factors of Euro II, Euro IIIand Euro IV buses in Beijing under the same typical driv-ing cycle were all around 12 g km−1. These findings are con-sistent with earlier work of Velders et al. (2011) for Europeas well as Huo et al. (2012b) for China, where similar non-compliance was identified. Therefore, we designed a heavy-duty diesel vehicle control failure case (HDF) for each of thescenarios developed in this study (see Table 1), where theNOx removal rates of Euro IV, Euro V, and Euro VI were as-sumed to be 50 %, 50 %, and 75 %, respectively (or relative toEuro III, reductions of 22 %, 22 %, and 60 %, respectively).In 2030, the NOx emissions of the transportation sector un-der the HDF cases are projected to be 1.5–2.8 times the cor-responding scenarios. Consequently, the total NOx emissionsunder the six HDF cases are projected to be 13–29 % higherthan the corresponding scenarios. The NOx emissions are es-timated to be 23.3 Mt in 2015 under the HDF-BAU[1] case,10.5 % lower than that of 2010, still meeting the national tar-get to reduce the NOx emissions by 10 % during 2011–2015.
3.3.3 Failure in the operation of flue gas denitrificationfor power plants
As described in Sect. 3.2.2, SCR accounts for 74 % and 52 %of the total NOx emission reductions in power plants in 2015and 2030, respectively. However, we must take into accountthat some of the installed SCRs might actually not be oper-ating. In fact, the actual operation of the SO2 scrubbers hasbeen questioned before by the government and research com-munity (Xu et al., 2009). A power plant control failure case(PPF) for each of the emission scenarios listed in Table 1was developed, where we assumed 25 % of the installed fluegas denitrification technologies were not actually running. In2030, the NOx emissions of power plants under the PPF casesare projected to be 1.0–2.3 times the corresponding scenar-ios. Consequently, the total NOx emissions under the six PPFcases are projected be 1.2–29 % higher than the correspond-ing scenarios. The NOx emissions are estimated at 25.2 Mtin 2015 under the PPF-BAU[1] case, 3.2 % lower than thatof 2010, implying failure to meet the national target to re-duce the NOx emissions by 10 % during 2011–2015.
3.4 Gridded emissions
Figure 10 shows the spatial distribution of NOx emissionsin 2005, 2010, and 2030 for four scenarios. Most coal-firedpower plants, iron and steel plants, and cement plants wereidentified as large point sources, and allocated based on theirgeographical coordinates. The historical geographical loca-tions of these large point sources were updated year by yearbased on the annual reports of industrial associations. As forfuture development, we first calculated provincial emissionsbased on the assumed energy-saving policies and emissioncontrol policies. The locations of large point sources withina specific province were assumed to remain the same as2010, and the NOx emission of each point was calculatedbased on the growth rates of provincial emissions. The othersources were treated as area sources, the emissions of whichwere distributed into 36 km× 36 km grid cells using vari-ous spatial proxies at a grid resolution of 1 km× 1 km us-ing the methodology described in Streets et al. (2003a) andWoo et al. (2003). The spatial proxies are assumed to re-main unchanged from 2010 onwards. Figure 10 illustratesthat the NOx emission intensities were much higher in east-ern China than in western China. Moreover, the vast NorthChina Plain, the eastern coastal region, the southern coastalregion, Liaoning Province and the Sichuan Basin were typ-ical high emission regions. The YRD, the PRD, and the ar-eas around Beijing stood out with highest emissions. Thischaracteristic of spatial distribution is closely related withthe unbalanced economic development in China. In consid-ered scenarios, the spatial distribution in 2030 is similar tothat of 2010. However, under the BAU[0] scenario, the emis-sion intensity of high emission regions is increasing, and thearea of such regions is increasing over the years. Under thePC[2] scenario, in which stringent energy-saving measuresand end-of-pipe control measures are taken, the emission in-tensity decreases distinctly and the high emission areas aresignificantly reduced. However, high emission intensity stilloccurs in some metropolitan areas, such as the Pearl Riverdelta and the Yangtze River delta.
3.5 Comparison with other studies and satelliteobservations
Figure 11 compares the emission estimates in this study withother studies.
Comparison of historical emissions shows that this studyrepresents a medium estimation of NOx emissions. Our es-timate was quite close to those of Zhang et al. (2007) for1995–2004, with relative errors within 6 %. The estimationof Ohara et al. (2007) was 7–15 % lower than this study dur-ing 1995–2003. The result of Klimont et al. (2001) was 12 %lower than ours in 1995, and that of Streets et al. (2003a)was 14 % lower in 2000. Estimates by Olivier et al. (2005)were 12 % higher in 1995 and 13 % higher in 2000, whilethat by Streets et al. (2001) was 9 % higher than this study
Atmos. Chem. Phys., 13, 9869–9897, 2013 www.atmos-chem-phys.net/13/9869/2013/
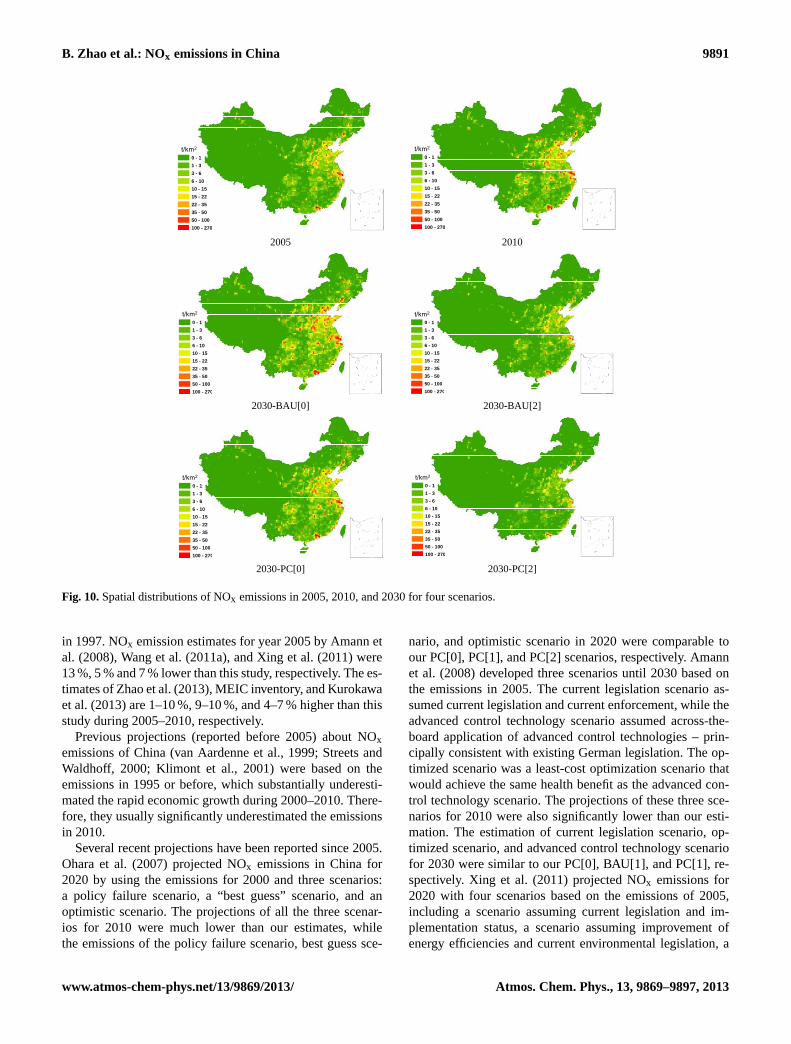
B. Zhao et al.: NOx emissions in China 9891
53
1
t/km2
0 - 1
1 - 3
3 - 6
6 - 10
10 - 15
15 - 22
22 - 35
35 - 50
50 - 100
100 - 270
t/km2
0 - 1
1 - 3
3 - 6
6 - 10
10 - 15
15 - 22
22 - 35
35 - 50
50 - 100
100 - 270 2005 2010
t/km2
0 - 1
1 - 3
3 - 6
6 - 10
10 - 15
15 - 22
22 - 35
35 - 50
50 - 100
100 - 270
t/km2
0 - 1
1 - 3
3 - 6
6 - 10
10 - 15
15 - 22
22 - 35
35 - 50
50 - 100
100 - 270 2030-BAU[0] 2030-BAU[2]
t/km2
0 - 1
1 - 3
3 - 6
6 - 10
10 - 15
15 - 22
22 - 35
35 - 50
50 - 100
100 - 270
t/km2
0 - 1
1 - 3
3 - 6
6 - 10
10 - 15
15 - 22
22 - 35
35 - 50
50 - 100
100 - 270 2030-PC[0] 2030-PC[2]
Figure 10. Spatial distributions of NOX emissions in 2005, 2010, and 2030 for four scenarios. 2
3
4
Fig. 10.Spatial distributions of NOx emissions in 2005, 2010, and 2030 for four scenarios.
in 1997. NOx emission estimates for year 2005 by Amann etal. (2008), Wang et al. (2011a), and Xing et al. (2011) were13 %, 5 % and 7 % lower than this study, respectively. The es-timates of Zhao et al. (2013), MEIC inventory, and Kurokawaet al. (2013) are 1–10 %, 9–10 %, and 4–7 % higher than thisstudy during 2005–2010, respectively.
Previous projections (reported before 2005) about NOxemissions of China (van Aardenne et al., 1999; Streets andWaldhoff, 2000; Klimont et al., 2001) were based on theemissions in 1995 or before, which substantially underesti-mated the rapid economic growth during 2000–2010. There-fore, they usually significantly underestimated the emissionsin 2010.
Several recent projections have been reported since 2005.Ohara et al. (2007) projected NOx emissions in China for2020 by using the emissions for 2000 and three scenarios:a policy failure scenario, a “best guess” scenario, and anoptimistic scenario. The projections of all the three scenar-ios for 2010 were much lower than our estimates, whilethe emissions of the policy failure scenario, best guess sce-
nario, and optimistic scenario in 2020 were comparable toour PC[0], PC[1], and PC[2] scenarios, respectively. Amannet al. (2008) developed three scenarios until 2030 based onthe emissions in 2005. The current legislation scenario as-sumed current legislation and current enforcement, while theadvanced control technology scenario assumed across-the-board application of advanced control technologies – prin-cipally consistent with existing German legislation. The op-timized scenario was a least-cost optimization scenario thatwould achieve the same health benefit as the advanced con-trol technology scenario. The projections of these three sce-narios for 2010 were also significantly lower than our esti-mation. The estimation of current legislation scenario, op-timized scenario, and advanced control technology scenariofor 2030 were similar to our PC[0], BAU[1], and PC[1], re-spectively. Xing et al. (2011) projected NOx emissions for2020 with four scenarios based on the emissions of 2005,including a scenario assuming current legislation and im-plementation status, a scenario assuming improvement ofenergy efficiencies and current environmental legislation, a
www.atmos-chem-phys.net/13/9869/2013/ Atmos. Chem. Phys., 13, 9869–9897, 2013
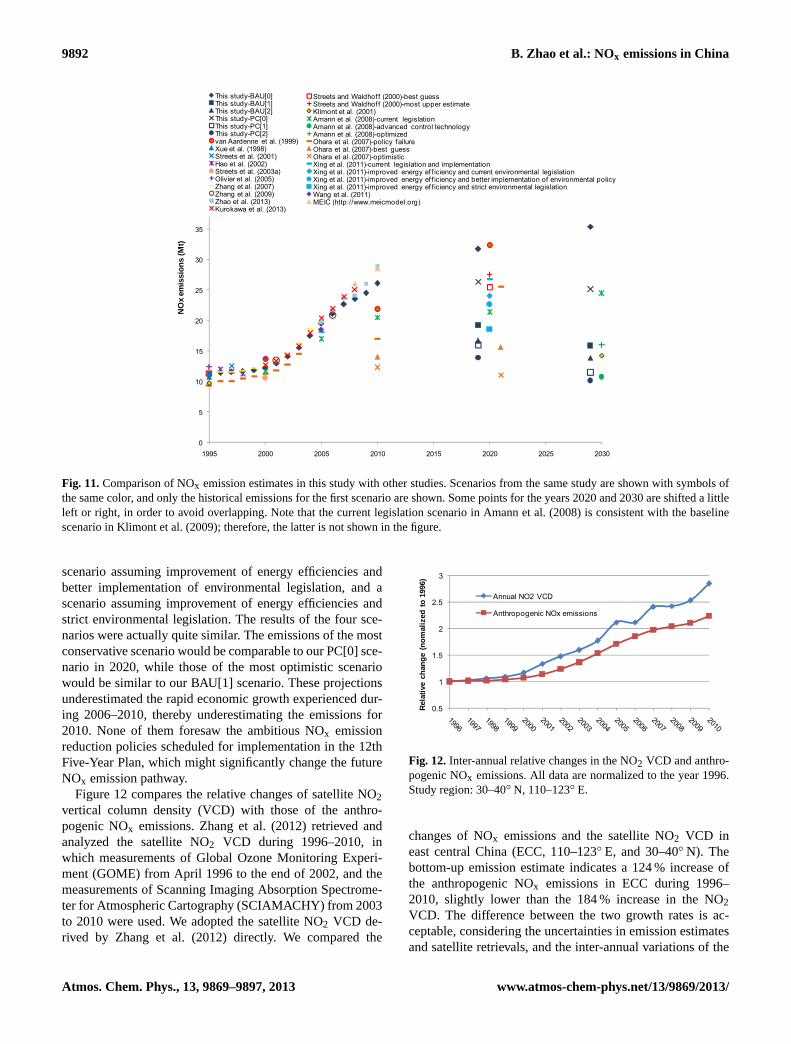
9892 B. Zhao et al.: NOx emissions in China
54
0
5
10
15
20
25
30
35
1995 2000 2005 2010 2015 2020 2025 2030
NO
x em
issi
on
s (M
t)
This study-BAU[0] Streets anThis study-BAU[1] Streets anThis study-BAU[2] Klimont eThis study-PC[0] Amann etThis study-PC[1] Amann etThis study-PC[2] Amann etvan Aardenne et al. (1999) Ohara et Xue et al. (1998) Ohara et Streets et al. (2001) Ohara et Hao et al. (2002) Xing et alStreets et al. (2003a) Xing et alOlivier et al. (2005) Xing et alZhang et al. (2007) Xing et alZhang et al. (2009) Wang et aZhao et al. (2013) MEIC (httKurokawa et al. (2013)
Streets and Waldhof f (2000)-best guessStreets and Waldhof f (2000)-most upper estimateKlimont et al. (2001)Amann et al. (2008)-current legislationAmann et al. (2008)-advanced control technologyAmann et al. (2008)-optimizedOhara et al. (2007)-policy failureOhara et al. (2007)-best guessOhara et al. (2007)-optimisticXing et al. (2011)-current legislation and implementationXing et al. (2011)-improved energy ef f iciency and current environmental legislationXing et al. (2011)-improved energy ef f iciency and better implementation of environmental policyXing et al. (2011)-improved energy ef f iciency and strict environmental legislationWang et al. (2011)MEIC (http://www.meicmodel.org)
1
Figure 11. Comparison of NOX emission estimates in this study with other studies. Scenarios 2
from the same study are shown with symbols of the same colour, and only the historical 3
emissions for the first scenario are shown. Some points for the years 2020 and 2030 are 4
shifted a little left or right, in order to avoid overlapping. Note that the current legislation 5
scenario in Amann et al. (2008) is consistent with the baseline scenario in Klimont et al. 6
(2009), therefore the latter is not shown in the figure. 7
8
Fig. 11.Comparison of NOx emission estimates in this study with other studies. Scenarios from the same study are shown with symbols ofthe same color, and only the historical emissions for the first scenario are shown. Some points for the years 2020 and 2030 are shifted a littleleft or right, in order to avoid overlapping. Note that the current legislation scenario in Amann et al. (2008) is consistent with the baselinescenario in Klimont et al. (2009); therefore, the latter is not shown in the figure.
scenario assuming improvement of energy efficiencies andbetter implementation of environmental legislation, and ascenario assuming improvement of energy efficiencies andstrict environmental legislation. The results of the four sce-narios were actually quite similar. The emissions of the mostconservative scenario would be comparable to our PC[0] sce-nario in 2020, while those of the most optimistic scenariowould be similar to our BAU[1] scenario. These projectionsunderestimated the rapid economic growth experienced dur-ing 2006–2010, thereby underestimating the emissions for2010. None of them foresaw the ambitious NOx emissionreduction policies scheduled for implementation in the 12thFive-Year Plan, which might significantly change the futureNOx emission pathway.
Figure 12 compares the relative changes of satellite NO2vertical column density (VCD) with those of the anthro-pogenic NOx emissions. Zhang et al. (2012) retrieved andanalyzed the satellite NO2 VCD during 1996–2010, inwhich measurements of Global Ozone Monitoring Experi-ment (GOME) from April 1996 to the end of 2002, and themeasurements of Scanning Imaging Absorption Spectrome-ter for Atmospheric Cartography (SCIAMACHY) from 2003to 2010 were used. We adopted the satellite NO2 VCD de-rived by Zhang et al. (2012) directly. We compared the
55
0.5
1
1.5
2
2.5
3
Rel
ativ
e ch
ang
e (n
om
aliz
ed t
o 1
996)
Annual NO2 VCD
Anthropogenic NOx emissions
1
Figure 12. Inter-annual relative changes in the NO2 VCD and anthropogenic NOX emissions. 2
All data are normalized to the year 1996. Study region: 30°–40°N, and 110°–123°E. 3 Fig. 12. Inter-annual relative changes in the NO2 VCD and anthro-pogenic NOx emissions. All data are normalized to the year 1996.Study region: 30–40◦ N, 110–123◦ E.
changes of NOx emissions and the satellite NO2 VCD ineast central China (ECC, 110–123◦ E, and 30–40◦ N). Thebottom-up emission estimate indicates a 124 % increase ofthe anthropogenic NOx emissions in ECC during 1996–2010, slightly lower than the 184 % increase in the NO2VCD. The difference between the two growth rates is ac-ceptable, considering the uncertainties in emission estimatesand satellite retrievals, and the inter-annual variations of the
Atmos. Chem. Phys., 13, 9869–9897, 2013 www.atmos-chem-phys.net/13/9869/2013/
B. Zhao et al.: NOx emissions in China 9893
meteorological factors. In terms of five-year intervals, thegrowth rates based on bottom-up emission estimates are 7 %,60 %, and 31 % during 1996–2000, 2000–2005, and 2005–2010, respectively. The satellite observations indicate thecorresponding growth rates are 17 %, 82 %, and 34 %, re-spectively.
4 Conclusions
In this study we estimated the historical NOx emissions ofChina from 1995 to 2010, calculated future NOx emissionsevery five years until 2030 under six emission scenarios, andquantified the effects of various control policies on emis-sions.
With the rapid growth of energy consumption, NOx emis-sions were estimated to more than double from 11.0 Mt in1995 to 26.1 Mt in 2010, with an annual growth rate of 5.9 %.Power plants, industry and transportation were major sourcesof NOx emissions, accounting for 28.4 %, 34.0 %, and 25.4 %of the total NOx emissions in 2010, respectively. Althoughseveral control measures have been introduced for powerplants and transportation, they were insufficient to constrainthe strong increase of NOx emissions.
Based on current legislation and current implementationstatus (BAU[0] scenario), NOx emissions are estimated toincrease by 36 % in 2030 from 2010 level. The implemen-tation of new energy-saving policies and end-of-pipe controlpolicies is expected to change the NOx emission pathway sig-nificantly in the future. With the enforcement of new energy-saving policies, including life style changes, structural ad-justments, and energy efficiency improvements, NOx emis-sions are expected to decrease by nearly 30 % in 2030 com-pared with the baseline case (BAU[0] scenario). The imple-mentation of the “progressive” and “more stringent” end-of-pipe control measures is expected to lead to about 55 % and61 % reductions of the baseline NOx emissions in 2030, re-spectively. If the energy-saving measures and stringent end-of-pipe measures are taken simultaneously, the NOx emis-sions in 2030 could be reduced further, resulting in more than70 % lower emissions than the baseline case (i.e., over 60 %less than the 2010 level).
Power plants, industry, and transportation contribute 36 %,27 %, and 27 % of the total NOx emission reduction respec-tively between the baseline and the most aggressive scenarioin 2030. Industry is expected to account for 47.5 % of thetotal remaining NOx emissions in 2030 under the most ag-gressive scenario. Research should be conducted on the re-duction potential of the industry sector in order to achievefurther NOx emission reductions beyond the scenarios in thisstudy.
About 30 % of the NOx emission reduction in 2020, and40 % of the NOx emission reduction in 2030 could be treatedas ancillary benefits of energy conservation, while the “la-tent” ancillary benefit of energy conservation could be much
larger. The contribution of energy-saving measures is ex-pected to become larger and larger in the long run, with thereduction potential of end-of-pipe measures being exhausted.Therefore, it is strategically important to adopt energy-savingmeasures besides the historically dominant end-of-pipe mea-sures.
Some policy factors that were not considered in the energyand pollution control scenarios may also have significant im-pacts on NOx emissions. Although the governmental targetto reduce the NOx emission by 10 % during the 12th Five-Year Plan (2011–2015) is estimated to be exceeded under the“progressive” control strategy, the target would not be met ifthe GDP growth rate were one percent higher, or if 25 % ofthe installed flue gas denitrification technologies for powerplants were not actually in operation. Failure in the operationof flue gas denitrification for power plants is expected to in-crease the NOx emissions dramatically in the next 5–10 yr,while failure to control heavy diesel vehicles is expected topose more adverse effects in the long term.
Acknowledgements.This study is funded by the NationalNatural Science Foundation of China (21221004), StrategicPriority Research Program of the Chinese Academy of Sciences(XBD05020300), special fund of State Key Joint Laboratory ofEnvironment Simulation and Pollution Control (12L05ESPC),and ECLIPSE European Union’s Seventh Framework Programme(FP7/2007–2013) under grant agreement no. 282688. The corre-sponding author is supported by the Program for New CenturyExcellent Talents in University (NCET-10-0532). We acknowledgethe assistance of Dr. Scott Voorhees and Maria Pia Ancora inrevising this paper.
Edited by: F. Yu
References
Akimoto, H. and Narita, H.: Distribution of SO2, NOx and CO2emissions from fuel combustion and Industrial activities inAsia with 1-degrees-X1-degrees resolution, Atmos. Environ., 28,213–225, 1994.
Amann, M., Jiang, K. J., Hao, J. M., and Wang, S. X.: Scenariosfor cost-effective control of air pollution and greenhouse gasesin China, International Institute for Applied Systems Analysis,Laxenburg, Austria, 51 pp., 2008.
Amann, M., Bertok, I., Borken-Kleefeld, J., Cofala, J., Heyes,C., Hoglund-Isaksson, L., Klimont, Z., Nguyen, B., Posch, M.,Rafaj, P., Sandler, R., Schopp, W., Wagner, F., and Winiwarter,W.: Cost-effective control of air quality and greenhouse gasesin Europe: Modeling and policy applications, Environ. Mod-ell. Softw., 26, 1489–1501, doi:10.1016/j.envsoft.2011.07.012,2011.
Bo, Y., Cai, H., and Xie, S. D.: Spatial and temporal variation of his-torical anthropogenic NMVOCs emission inventories in China,Atmos. Chem. Phys., 8, 7297–7316, doi:10.5194/acp-8-7297-2008, 2008.
www.atmos-chem-phys.net/13/9869/2013/ Atmos. Chem. Phys., 13, 9869–9897, 2013
9894 B. Zhao et al.: NOx emissions in China
Cai, H. and Xie, S. D.: Estimation of vehicular emission inventoriesin China from 1980 to 2005, Atmos. Environ., 41, 8963–8979,2007.
China Electricity Council: Viewpoint for the power generation de-velopment plan in the 12th five year plan,http://guihua.cec.org.cn/yanjiu/2011-03-10/48498.html(last access: 1 May 2012),2011 (in Chinese).
Chinese Research Academy of Environmental Sciences: Descrip-tion on developing the emission standard of air pollutants forcement industry,http://www.es.org.cn/download/381-2.pdf(lastaccess: 5 May 2012), 2004 (in Chinese).
Chinese Research Academy of Environmental Sciences: Descrip-tion on developing the emission standard of pollutants for brickand tile industry (draft),http://www.zhb.gov.cn/gkml/hbb/bgth/200912/t20091202_182559.htm(last access: 5 May 2012), 2009(in Chinese).
Chinese Research Academy of Environmental Sciences, andBangbu Glass Industry Design & Research Institute: Descriptionon developing the emission standard of air pollutants for flat glassindustry (draft),http://www.mep.gov.cn/gkml/hbb/bgth/201002/t20100201_185227.htm(last access: 5 May 2012), 2010 (in Chi-nese).
Data Codification Committee of the First National Pollution SourceCensus: Manual of Emission Factors for the Pollution SourceCensus, China Environmental Science Press, Beijing, 485 pp.,2011 (in Chinese).
Ding, H. Q., Lv, L., and Wu, J. X.: NOx emission legislation andcontrol for diesel engine on ships, Journal of Wuhan Universityof Technology, 24, 355–359, 2000 (in Chinese).
Energy Research Institute: China’s Low Carbon Development Path-ways by 2050: Scenario Analysis of Energy Demand and CarbonEmissions, Science Press, Beijing, 168 pp., 2009.
Hao, J. M., Tian, H. Z., and Lu, Y. Q.: Emission inventories of NOxfrom commercial energy consumption in China, 1995–1998,Environ. Sci. Technol., 36, 552–560, doi:10.1021/Es015601k,2002.
He, K. B., Huo, H., Zhang, Q., He, D. Q., An, F., Wang,M., and Walsh, M. P.: Oil consumption and CO2 emis-sions in China’s road transport: current status, future trends,and policy implications, Energ. Policy., 33, 1499–1507,doi:10.1016/j.enpol.2004.01.007, 2005.
Hunan Research Academy of Environmental Sciences: Descrip-tion on developing the emission standard for pollutants fromceramics industry (draft),http://www.zhb.gov.cn/info/gw/bgth/200801/t20080129_117766.htm(last access: 5 May 2012), 2008(in Chinese).
Huo, H., Zhang, Q. A., Wang, M. Q., Streets, D. G., and He, K.B.: Environmental Implication of Electric Vehicles in China,Environ. Sci. Technol., 44, 4856–4861, doi:10.1021/Es100520c,2010.
Huo, H., Yao, Z. L., Zhang, Y. Z., Shen, X. B., Zhang, Q., Ding, Y.,and He, K. B.: On-board measurements of emissions from light-duty gasoline vehicles in three mega-cities of China, Atmos. Env-iron., 49, 371–377, doi:10.1016/j.atmosenv.2011.11.005, 2012a.
Huo, H., Yao, Z. L., Zhang, Y. Z., Shen, X. B., Zhang, Q., and He,K. B.: On-board measurements of emissions from diesel trucksin five cities in China, Atmos. Environ., 54, 159–167, 2012b.
Kato, N. and Akimoto, H.: Anthropogenic emissions of SO2 andNOx in Asia – emission inventories, Atmos. Environ. A, 26,2997–3017, 1992.
Klimont, Z., Cofala, J., Schopp, W., Amann, M., Streets, D. G.,Ichikawa, Y., and Fujita, S.: Projections of SO2, NOx, NH3 andVOC emissions in East Asia up to 2030, Water. Air. Soil. Poll.,130, 193–198, 2001.
Klimont, Z., Cofala, J., Xing, J., Wei, W., Zhang, C., Wang, S., Ke-jun, J., Bhandari, P., Mathur, R., Purohit, P., Rafaj, P., Cham-bers, A., and Amann, M.: Projections of SO(2), NO(x) and car-bonaceous aerosols emissions in Asia, Tellus. B., 61, 602–617,doi:10.1111/j.1600-0889.2009.00428.x, 2009.
Kurokawa, J., Ohara, T., Morikawa, T., Hanayama, S., Greet, J.-M., Fukui, T., Kawashima, K., and Akimoto, H.: Emissions ofair pollutants and greenhouse gases over Asian regions dur-ing 2000–2008: Regional Emission inventory in ASia (REAS)version 2, Atmos. Chem. Phys. Discuss., 13, 10049–10123,doi:10.5194/acpd-13-10049-2013, 2013.
Lei, Y.: Research on Anthropogenic Emissions and Control of Pri-mary Particles and Its Key Chemical Components, Ph.D. the-sis, Department of Environmental Science and Engineering, Ts-inghua University, Beijing, 154 pp., 2008 (in Chinese).
Lei, Y., Zhang, Q. A., Nielsen, C., and He, K. B.: An inventory ofprimary air pollutants and CO(2) emissions from cement pro-duction in China, 1990–2020, Atmos. Environ., 45, 147–154,doi:10.1016/j.atmosenv.2010.09.034, 2011.
Li, W., Fu, L. X., and Hao, J. M.: The emissions of 10 air pollutantsfrom on-road vehicles in China, Urban Environment & UrbanEcology, 16, 36–38, 2003 (in Chinese).
Li, X. H., Wang, S. X., Duan, L., and Hao, J. M.: Particulate andtrace gas emissions from open burning of wheat straw and cornstover in China, Environ. Sci. Technol., 41, 6052–6058, 2007.
Lin, B. H.: Oil Consumption and CO2 Emissions from Automo-bile Sector in Major Regions of China: Present and Future, M.S.thesis, Department of Environmental Science and Engineering,Tsinghua University, Beijing, 88 pp., 2010 (in Chinese).
Liu, T.: Cost-Benefit Analysis of the NOx Emission Control ofPower Industry in China, M.S. thesis, School of Environment,Tsinghua University, Beijing, 96 pp., 2013 (in Chinese).
Ministry of Environmental Protection of China: Chinese Envi-ronmental Statistical Bulletin 2005,http://zls.mep.gov.cn/hjtj/qghjtjgb/200606/t20060612_77318.htm(last access: 5 May2012), 2006 (in Chinese).
Ministry of Environmental Protection of China: Bulletin ofurban sewage treatment facilities, and flue gas desulfur-ization/denitrification facilities of coal-fired power plants,http://www.mep.gov.cn/gkml/hbb/bgg/201104/t20110420_209449.htm(last access: 5 May 2012), 2011a (in Chinese).
Ministry of Environmental Protection of China: Notice to im-plement the Stage IV emission standard for compression ig-nition engines and vehicles,http://www.zhb.gov.cn/gkml/hbb/bgg/201201/t20120110_222376.htm(last access: 5 May 2012),2011b (in Chinese).
Ministry of Environmental Protection of China: Chinese Envi-ronmental Statistical Bulletin 2010,http://zls.mep.gov.cn/hjtj/qghjtjgb/201201/t20120118_222703.htm(last access: 5 May2012), 2012 (in Chinese).
Atmos. Chem. Phys., 13, 9869–9897, 2013 www.atmos-chem-phys.net/13/9869/2013/
B. Zhao et al.: NOx emissions in China 9895
Mueller, S. F., Bailey, E. M., and Kelsoe, J. J.: Geographic sensitiv-ity of fine particle mass to emissions of SO2 and NOx, Environ.Sci. Technol., 38, 570–580, doi:10.1021/Es021016n, 2004.
National Bureau of Statistics: China Statistical Yearbook 1996–2011, China Statistics Press, Beijing, 1996–2011.
National Bureau of Statistics: China Energy Statistical Yearbook1991–1996, China Statistics Press, Beijing, 1998.
National Bureau of Statistics: China Statistical Yearbook for Re-gional Economy 2000–2011, China Statistics Press, Beijing,2000–2011.
National Bureau of Statistics: China Energy Statistical Yearbook1997–1999, China Statistics Press, Beijing, 2001.
National Bureau of Statistics: China Energy Statistical Yearbook2000–2002, China Statistics Press, Beijing, 2004a.
National Bureau of Statistics: China Energy Statistical Yearbook2003, China Statistics Press, Beijing, 2004b.
National Bureau of Statistics: China Energy Statistical Yearbook2004, China Statistics Press, Beijing, 2005.
National Bureau of Statistics: China Energy Statistical Yearbook2005, China Statistics Press, Beijing, 2006.
National Bureau of Statistics: China Energy Statistical Yearbook2006, China Statistics Press, Beijing, 2007.
National Bureau of Statistics: China Energy Statistical Yearbook2007, China Statistics Press, Beijing, 2008a.
National Bureau of Statistics: China Energy Statistical Yearbook2008, China Statistics Press, Beijing, 2008b.
National Bureau of Statistics: China Energy Statistical Yearbook2009, China Statistics Press, Beijing, 2009.
National Bureau of Statistics: China Energy Statistical Yearbook2010, China Statistics Press, Beijing, 2011a.
National Bureau of Statistics: China Energy Statistical Yearbook2011, China Statistics Press, Beijing, 2011b.
National Development and Reform Commission: Special Plan forMedium and Long Term Energy Conservation,http://www.ndrc.gov.cn/xwfb/t20050628_27571.htm(last access: 1 May 2012),2004 (in Chinese).
National Development and Reform Commission: Medium andLong Term Development Plan for Nuclear Power,nyj.ndrc.gov.cn/zywx/W020071102318742621534.pdf, last access: 1 May2012, 2005 (in Chinese).
National Development and Reform Commission: National Natu-ral Gas Utilization Policy,http://www.sdpc.gov.cn/zcfb/zcfbtz/2007tongzhi/t20070904_157244.htm(last access: 1 May 2012),2007a (in Chinese).
National Development and Reform Commission: Mediumand Long Term Development Plan for Renewable Energy,http://www.sdpc.gov.cn/zcfb/zcfbtz/2007tongzhi/t20070904_157352.htm(last access: 1 May 2012), 2007b (in Chinese).
National Population Development Strategy Research Group: Re-search report on national population development strategy, Bei-jing, 19 pp., 2007 (in Chinese).
Ohara, T., Akimoto, H., Kurokawa, J., Horii, N., Yamaji, K., Yan,X., and Hayasaka, T.: An Asian emission inventory of an-thropogenic emission sources for the period 1980–2020, At-mos. Chem. Phys., 7, 4419–4444, doi:10.5194/acp-7-4419-2007,2007.
Olivier, J. G. J., Bouwman, A. F., Van der Hoek, K. W., andBerdowski, J. J. M.: Global air emission inventories for anthro-
pogenic sources of NOx, NH3 and N2O in 1990, Environ. Pollut.,102, 135–148, 1998.
Olivier, J. G. J., van Aardenne, J. A., Dentener, F., Pagliari, V.,Ganzeveld, L. N., and Peters, J. A. H. W.: Recent trends in globalgreenhouse gas emissions: Regional trends 1970–2000 and spa-tial distribution of key sources in 2000, Environ. Sci., 2, 81–99,2005.
Qingdao University of Science & Technology: Description on de-veloping the emission standard of pollutants for nitric acidindustry (draft),http://www.zhb.gov.cn/info/bgw/bbgth/200901/t20090121_133747.htm(last access: 5 May 2012), 2008 (in Chi-nese).
Richter, A., Burrows, J. P., Nuss, H., Granier, C., and Niemeier, U.:Increase in tropospheric nitrogen dioxide over China observedfrom space, Nature, 437, 129–132, doi:10.1038/Nature04092,2005.
Shah, J., Nagpal, T., Johnson, T., Amann, M., Carmichael, G., Foell,W., Green, C., Hettelingh, L. P., Hordijk, L., Li, J., Peng, C.,Pu, Y. F., Ramankutty, R., and Streets, D.: Integrated analysisfor acid rain in Asia: Policy implications and results of RAINS-ASIA model, Annu. Rev. Energ. Env., 25, 339–375, 2000.
Solomon, S., Qin, D., Manning, M., Chen, Z., Marquis, M., Av-eryt, K. B., Tignor, M., and Miller, H. L.: Climate Change 2007:The Physical Science Basis. Contribution of Working Group Ito the Fourth Assessment Report of the Intergovernmental Panelon Climate Change, Cambridge University Press, Cambridge,United Kingdom and New York, NY, USA, 996 pp., 2007.
Song, Y.: Measurements of the emissions from diesel engine used inZ6150ZLCZ-5 ships, Journal of Nantong Vocational & TechnicalShipping College, 6, 59–63, 2007 (in Chinese).
State Council of the People’s Republic of China: The state coun-cil executive meeting sets the GHGs (Greenhouse Gas) re-duction target of China,http://www.gov.cn/ldhd/2009-11/26/content_1474016.htm(last access: 12 January 2011), 2009 (inChinese).
State Environmental Protection Administration: Integrated emis-sion standard of air pollutants,http://kjs.mep.gov.cn/hjbhbz/bzwb/dqhjbh/dqgdwrywrwpfbz/199701/t19970101_67504.htm(last access: 5 May 2012), 1996a (in Chinese).
State Environmental Protection Administration: Emissionstandard of air pollutants for thermal power plants,http://www.foshan.gov.cn/foshangov/xxgk/ztjs/hbzt/ghbz/bz/200810/t20081021_1096534.html(last access: 5 May 2012),1996b (in Chinese).
State Environmental Protection Administration: Administrative reg-ulations to prohibit field burning and promote environmen-tal friendly utilization of agricultural residues,http://www.mep.gov.cn/gkml/zj/wj/200910/t20091022_171920.htm(last access:5 May 2012), 1999 (in Chinese).
State Environmental Protection Administration: Emission standardof air pollutants for thermal power plants,http://www.docin.com/p-43627921.html(last access: 5 May 2012), 2003 (in Chinese).
Streets, D. G. and Waldhoff, S. T.: Present and future emissions ofair pollutants in China: SO2, NOx, and CO, Atmos. Environ., 34,363–374, 2000.
Streets, D. G., Tsai, N. Y., Akimoto, H., and Oka, K.: Trends inemissions of acidifying species in Asia, 1985–1997, Water. Air.Soil. Poll., 130, 187–192, 2001.
www.atmos-chem-phys.net/13/9869/2013/ Atmos. Chem. Phys., 13, 9869–9897, 2013
9896 B. Zhao et al.: NOx emissions in China
Streets, D. G., Bond, T. C., Carmichael, G. R., Fernandes, S. D., Fu,Q., He, D., Klimont, Z., Nelson, S. M., Tsai, N. Y., Wang, M.Q., Woo, J. H., and Yarber, K. F.: An inventory of gaseous andprimary aerosol emissions in Asia in the year 2000, J. Geophys.Res-Atmos., 108, doi:10.1029/2002jd003093, 2003a.
Streets, D. G., Yarber, K. F., Woo, J. H., and Carmichael,G. R.: Biomass burning in Asia: Annual and seasonal esti-mates and atmospheric emissions, Global. Biogeochem. Cy., 17,doi:10.1029/2003gb002040, 2003b.
Tang, Q., Lu, X., Wang, S., and Zhou, L.: Industrial kiln gas pol-lution and its control, Industrial Boiler, 4, 42–47, 1995 (in Chi-nese).
Tang, W. Q.: Domestic nitric acid production and market analysis,Chemical Engineering Design, 16, 34–39, 2006 (in Chinese).
The State Council of the People’s Republic of China: The guidelinesof promoting joint prevention and control policies and improv-ing regional air quality,http://www.gov.cn/xxgk/pub/govpublic/mrlm/201005/t20100513_56516.html(last access: 2 February2013), 2010 (in Chinese).
The State Council of the People’s Republic of China: The TwelfthFive-Year Plan for National Economic and Social Developmentof the People’s Republic of China,http://www.gov.cn/2011lh/content_1825838.htm(last access: 2 February 2013), 2011a (inChinese).
The State Council of the People’s Republic of China: IntegratedWork Plan for Energy Saving and Emission Reduction Duringthe Twelfth Five-Year Plan,http://www.gov.cn/zwgk/2011-09/07/content_1941731.htm(last access: 2 February 2013), 2011b(in Chinese).
The State Council of the People’s Republic of China: The TwelfthFive-Year Plan for Environmental Protection,http://www.gov.cn/zwgk/2011-12/20/content_2024895.htm(last access: 20 April2012), 2011c (in Chinese).
The State Council of the People’s Republic of China: The TwelfthFive-Year Plan for Energy Saving and Emission Reduction,http://www.gov.cn/zwgk/2012-08/21/content_2207867.htm(last ac-cess: 2 February 2013), 2012 (in Chinese).
Tian, H. Z.: Studies on Present and Future Emissions of NitrogenOxides and Its Comprehensive Control Policies in China, Ph.D.thesis, Department of Environmental Science and Engineering,Tsinghua University, Beijing, 2003 (in Chinese).
U.S. National Research Council: Effectiveness and Impact of Cor-porate Average Fuel Economy (CAFE) Standards, NationalAcademy Press, Washington, D.C., 166 pp., 2002.
Vallack, H. W., Cinderby, S., Kuylenstierna, J. C. I., and Heaps, C.:Emission inventories for SO2 and NOx in developing countryregions in 1995 with projected emissions for 2025 according totwo scenarios, Water Air Soil. Poll., 130, 217–222, 2001.
van Aardenne, J. A., Carmichael, G. R., Levy, H., Streets, D., andHordijk, L.: Anthropogenic NOx emissions in Asia in the period1990–2020, Atmos. Environ., 33, 633–646, 1999.
van der Werf, G. R., Randerson, J. T., Giglio, L., Collatz, G. J., Mu,M., Kasibhatla, P. S., Morton, D. C., DeFries, R. S., Jin, Y., andvan Leeuwen, T. T.: Global fire emissions and the contribution ofdeforestation, savanna, forest, agricultural, and peat fires (1997–2009), Atmos. Chem. Phys., 10, 11707–11735, doi:10.5194/acp-10-11707-2010, 2010.
Velders, G. J. M., Geilenkirchen, G. P., and Lange, R. D.: Higherthan expected NOx emission from trucks may affect attainabil-
ity of NO2 limit values in the Netherlands, Atmos. Environ., 45,3025–3033, 2011.
Wang, M., Huo, H., Johnson, L., and He, D.: Projection of Chi-nese Motor Vehicle Growth, Oil Demand, and CO2 Emis-sions through 2050, Argonne National Laboratory, Argonne,IllinoisANL/ESD/06-6, 69 pp., 2006.
Wang, Q. W. and Zeng, W. P.: Summary of nitric acid productiontechnologies and the outlook of dual-pressure process, Nitroge-nous Fertilizer Technology, 29, 33–42, 2008 (in Chinese).
Wang, S. X. and Hao, J. M.: Air quality management in China: Is-sues, challenges, and options, J. Environ. Sci-China., 24, 2–13,doi:10.1016/S1001-0742(11)60724-9, 2012.
Wang, S. X. and Zhang, C. Y.: Spatial and temporal distributionof air pollutant emissions from open burning of crop residues inChina, Sciencepaper Online, 3, 1–6, 2008 (in Chinese).
Wang, S. X., Wei, W., Du, L., Li, G. H., and Hao,J. M.: Characteristics of gaseous pollutants from biofuel-stoves in rural China, Atmos. Environ., 43, 4148–4154,doi:10.1016/j.atmosenv.2009.05.040, 2009.
Wang, S. X., Xing, J., Chatani, S., Hao, J. M., Klimont, Z., Cofala,J., and Amann, M.: Verification of anthropogenic emissions ofChina by satellite and ground observations, Atmos. Environ., 45,6347–6358, doi:10.1016/j.atmosenv.2011.08.054, 2011a.
Wang, S. X., Xing, J., Jang, C. R., Zhu, Y., Fu, J. S., and Hao, J. M.:Impact assessment of ammonia emissions on inorganic aerosolsin east China using response surface modeling technique, En-viron. Sci. Technol., 45, 9293–9300, doi:10.1021/Es2022347,2011b.
Wang, X., Westerdahl, D., Hu, J. N., Wu, Y., Yin, H., Pan, X. C.,and Zhang, K. M.: On-road diesel vehicle emission factors fornitrogen oxides and black carbon in two Chinese cities, Atmos.Environ., 46, 45–55, 2012.
Wang, Z. X., Ji, X. Z., and Zhi, H. B.: Determination of the emis-sions of Euro-II diesel engine used in construction machine,Diesel Engine, 29, 9–11, 2007 (in Chinese).
Wei, W., Wang, S. X., and Hao, J. M.: Uncertainty Analysis ofEmission Inventory for Volatile Organic Compounds from An-thropogenic Sources in China, Environmental Science, 32, 305–312, 2011 (in Chinese).
Woo, J. H., Baek, J. M., Kim, J. W., Carmichael, G. R., Thong-boonchoo, N., Kim, S. T., and An, J. H.: Development of amulti-resolution emission inventory and its impact on sulfur dis-tribution for Northeast Asia, Water Air Soil Poll., 148, 259–278,2003.
Wu, Y., Zhang, S. J., Li, M. L., Ge, Y. S., Shu, J. W., Zhou, Y., Xu,Y. Y., Hu, J. N., Liu, H., Fu, L. X., He, K. B., and Hao, J. M.: Thechallenge to NOx emission control for heavy-duty diesel vehiclesin China, Atmos. Chem. Phys., 12, 9365–9379, doi:10.5194/acp-12-9365-2012, 2012.
Xie, S. D., Song, X. Y., and Shen, X. H.: Calculating the emissionfactors of Chinese vehicles with CORPERT III, EnvironmentalScience, 27, 415–419, 2006 (in Chinese).
Xing, J., Wang, S. X., Chatani, S., Zhang, C. Y., Wei, W., Hao, J. M.,Klimont, Z., Cofala, J., and Amann, M.: Projections of air pollu-tant emissions and its impacts on regional air quality in China in2020, Atmos. Chem. Phys., 11, 3119–3136, doi:10.5194/acp-11-3119-2011, 2011.
Xu, Y., Williams, R. H., and Socolow, R. H.: China’s rapid deploy-ment of SO2 scrubbers, Energ. Environ. Sci., 2, 459–465, 2009.
Atmos. Chem. Phys., 13, 9869–9897, 2013 www.atmos-chem-phys.net/13/9869/2013/
B. Zhao et al.: NOx emissions in China 9897
Xu, Y. A.: Improvements in the Operation of SO2 Scrubbers inChina’s Coal Power Plants, Environ. Sci. Technol., 45, 380–385,doi:10.1021/Es1025678, 2011.
Xu, Y. M.: The bricks and tiles industry in China: the economiccondition in 2007 and market forecast for 2008, Brick & TileWorld, 3, 1–4, 2008 (in Chinese).
Xu, Y. M.: The bricks and tiles industry in China: the economiccondition in 2009 and market forecast for 2010, Brick & TileWorld, 2, 1–4, 2010 (in Chinese).
Xue, Z., Yang, Z., and Zhao, X.: Distribution of SO2, NOx emis-sions in China, 1995, the Sixth International Conference on At-mospheric Science and its Applications to Air Quality, Beijing,132–140, 1999.
Yan, X. Y., Ohara, T., and Akimoto, H.: Bottom-up estimate ofbiomass burning in mainland China, Atmos. Environ., 40, 5262–5273, doi:10.1016/j.atmosenv.2006.04.040, 2006.
Yevich, R. and Logan, J. A.: An assessment of biofuel use and burn-ing of agricultural waste in the developing world, Global. Bio-geochem. Cy., 17, doi:10.1029/2002gb001952, 2003.
Yu, C.: Study on the Control Technology Choices of NOx Emis-sion from Power Plants and Industrial Boilers, M.S. thesis, De-partment of Environmental Science and Engineering, TsinghuaUniversity, Beijing, 79 pp., 2009 (in Chinese).
Yuan, J. H., Kang, J. J., Yu, C., and Hu, Z. G.: En-ergy conservation and emissions reduction in China-Progressand prospective, Renew. Sust. Energ. Rev., 15, 4334–4347,doi:10.1016/j.rser.2011.07.117, 2011.
Zhang, C. Y.: Studies on Present and Future Emissions of PM, SO2,NOx, M.S. thesis, Department of Environmental Science and En-gineering, Tsinghua University, Beijing, 147 pp., 2008 (in Chi-nese).
Zhang, Q.: Study on Regional Fine PM Emissions and Modelingin China, Ph.D. thesis, Department of Environmental Scienceand Engineering, Tsinghua University, Beijing, 185 pp., 2005 (inChinese).
Zhang, Q., Streets, D. G., He, K., Wang, Y., Richter, A., Bur-rows, J. P., Uno, I., Jang, C. J., Chen, D., Yao, Z., and Lei, Y.:NOx emission trends for China, 1995–2004: The view from theground and the view from space, J. Geophys. Res.-Atmos., 112,doi:10.1029/2007jd008684, 2007.
Zhang, Q., Streets, D. G., Carmichael, G. R., He, K. B., Huo, H.,Kannari, A., Klimont, Z., Park, I. S., Reddy, S., Fu, J. S., Chen,D., Duan, L., Lei, Y., Wang, L. T., and Yao, Z. L.: Asian emis-sions in 2006 for the NASA INTEX-B mission, Atmos. Chem.Phys., 9, 5131–5153, doi:10.5194/acp-9-5131-2009, 2009.
Zhang, Q., Geng, G. N., Wang, S. W., Richter, A., and He, K.B.: Satellite remote sensing of changes in NOx emissions overChina during 1996–2010, Chinese. Sci. Bull., 57, 2857–2864,doi:10.1007/s11434-012-5015-4, 2012.
Zhao, B., Xu, J. Y., and Hao, J. M.: Impact of energy structure ad-justment on air quality: a case study in Beijing, China, Front.Environ. Sci. En., 5, 378–390, doi:10.1007/s11783-011-0357-8,2011.
Zhao, Y., Wang, S. X., Duan, L., and Lei, Y.: Primary air pollutantemissions of coal-fired power plants in China: Current status andfuture prediction, Atmos. Environ., 42, 8442–8452, 2008.
Zhao, Y., Duan, L., Xing, J., Larssen, T., Nielsen, C. P., andHao, J. M.: Soil Acidification in China: Is Controlling SO(2)Emissions Enough?, Environ. Sci. Technol., 43, 8021–8026,doi:10.1021/Es901430n, 2009.
Zhao, Y., Wang, S. X., Nielsen, C. P., Li, X. H., and Hao, J. M.:Establishment of a database of emission factors for atmosphericpollutants from Chinese coal-fired power plants, Atmos. Envi-ron., 44, 1515–1523, doi:10.1016/j.atmosenv.2010.01.017, 2010.
Zhao, Y., Zhang, J., and Nielsen, C. P.: The effects of recent con-trol policies on trends in emissions of anthropogenic atmosphericpollutants and CO2 in China, Atmos. Chem. Phys., 13, 487–508,doi:10.5194/acp-13-487-2013, 2013.
www.atmos-chem-phys.net/13/9869/2013/ Atmos. Chem. Phys., 13, 9869–9897, 2013