Embed Size (px)
Citation preview
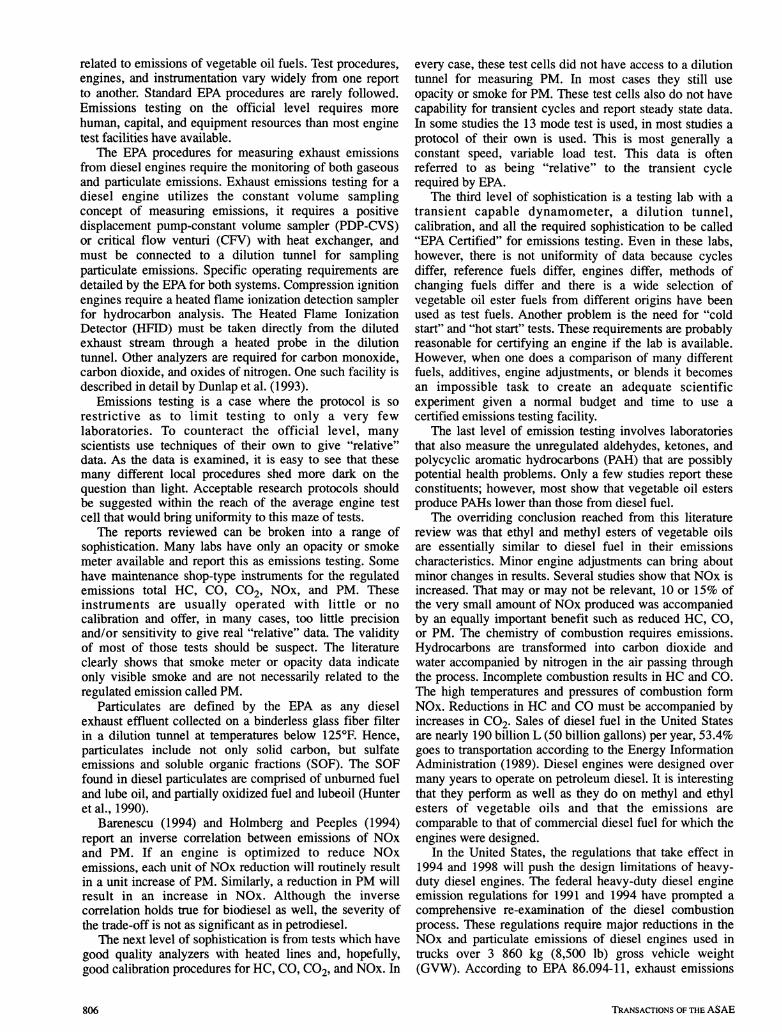
EMISSIONS CHARACTERISTICS OF ETHYL AND METHYL ESTER OF
RAPESEED OIL COMPARED WITH LOW SULFUR DIESEL CONTROL FUEL
IN A CHASSIS DYNAMOMETER TEST OF A PICKUP TRUCK
C. Peterson, D. Reece
ABSTRACT. Comprehensive tests were performed on an on-road vehicle in cooperation with the Los Angeles County Metropolitan Transit Authority emissions test facility. All tests were with a transient chassis dynamometer. Tests included both a double arterial cycle of 768 s duration and an EPA heavy duty vehicle cycle of 1,060 s duration. The test vehicle was a 1994 pickup truck with a 5.9-L turbocharged and intercooled, direct injection diesel engine. Rapeseed methyl (RME) and ethyl esters (REE) and blends were compared with low sulfur diesel control fuel. Emissions data includes all regulated emissions: hydrocarbons (HC), carbon monoxide (CO), carbon dioxide (CO2), oxides of nitrogen (NOx), and particulate matter (PM). In these tests the average of 100% RME and 100% REE reduced HC (52.4%), CO (47.6%), NOx (10.0%), and increases in CO2 (0.9%) and PM (9.9%) compared to the diesel control fuel. Also, 100% REE reduced HC (8.7%), CO (4.3%), and NOx (3.4%) compared to 100% RME. Keywords. Emissions, Rapeseed oil, Diesel fuel, Biodiesel
University of Idaho personnel have been researching the use of vegetable oils as a fuel since 1979. The first tests were with raw vegetable oils of various types and then with
methyl and ethyl esters of rapeseed oil. Vegetable oil esters, sometimes called biodiesel, have been shown to be very good fuels for compression ignition engines. Many tests have shown these fuels to have characteristics as good as, or superior to, common diesel fuel. In spite of these excellent fuel characteristics many hurdles remain before these fuels will be available for general use.
This research has shown that transesterification is necessary before oils and fats can be used in most diesel engines. Transesterification is the process of using an alcohol, usually methanol, in the presence of a catalyst, such as sodium hydroxide or potassium hydroxide, to chemically break the molecule of the oil or fat into esters and glycerol. Recently, recipes for using ethanol as the reacting agent with the rapeseed oil to form ethyl ester have been successfully carried out. Fuel characterization and short- and long-term engine tests have shown the ethyl ester of rapeseed oil (REE) to be equivalent, or superior to, the methyl ester of rapeseed oil (RME).
The Clean Air Act (CAA) forms the legislative base for fuel, engine, and emissions standards. The Environmental
Article was submitted for publication in April 1995; reviewed and approved for publication by the Power and Machinery Div. of ASAE in December 1995. Presented as ASAE Paper No. 94-6532.
Approved as Paper No. 95302 of the Idaho Agricultural Experiment Station.
The authors are Charles Peterson, ASAE Fellow Engineer, Professor, and Daryl Reece, Engineering Specialist Dept. Agricultural Engineering, University of Idaho, Moscow. Corresponding author: Charles L. Peterson, Room 81, J. W. Martin Laboaratory, Dept. of Agricultural Engineering, University of Idaho, Moscow, ID 83844-2060; telephone: 208-885-7906; e-mail: <[email protected]>.
Note: EPA suggests grams per mile abbreviated gpm be used in reporting emissions data. Because of the possible confusion with gallons per mile the abbreviations chosen in this article are those used by Dunlap et al. (1993) and Dunlap (1994) gm/mile to clearly indicate grams per mile.
Protection Agency (EPA) has set emissions standards. This has resulted in engine manufacturers and refinery operations spending billions of dollars each year to meet the requirements. Electronic engine control, advanced fuel systems, engine oil control methods, and combustion chamber design are making engines more sensitive to changes in physical and chemical properties of fuel. Biodiesel presents an attractive solution to environmental problems in many circumstances.
Vegetable oil esters have been reported to be cleaner burning than diesel fuel in a typical compression ignition (CI) engine. Feldman (1991) reported smoke opacities reduced by as much as 70% for methyl ester of rapeseed oil as compared to commercial diesel fuel.
This article reports on a cooperative test of gaseous emissions from vegetable oil fuels using the Emissions Test Facility (ETF) of the Los Angeles Metropolitan Transit Authority and vegetable oil ester fuels produced in the biofuels lab in the Agricultural Engineering Department at the University of Idaho.
OBJECTIVES The objectives of this experiment were to: • Compare regulated emissions data including total
hydrocarbons (HC), carbon monoxide (CO), carbon dioxide (CO2), nitrogen oxides (NOx), and particulate matter (PM), for ethyl ester of rapeseed oil, methyl ester of rapeseed oil, and diesel control fuel. Obtain emissions data for blends of REE and RME with diesel control fuel at the 20 and 50% levels.
LITERATURE REVIEW One of the critical issues to be resolved for vegetable oil
fuels as they seek status as replacements for petroleum diesel fuel is how they affect emissions from a standard diesel engine. This literature review examines many of the tests that have been conducted in the past several years
VOL.39(3):805-816
Transactions of the ASAE
© 1996 American Society of Agricultural Engineers 0001-2351 / 96 / 3903-0805 805
related to emissions of vegetable oil fuels. Test procedures, engines, and instrumentation vary widely from one report to another. Standard EPA procedures are rarely followed. Emissions testing on the official level requires more human, capital, and equipment resources than most engine test facilities have available.
The EPA procedures for measuring exhaust emissions from diesel engines require the monitoring of both gaseous and particulate emissions. Exhaust emissions testing for a diesel engine utilizes the constant volume sampling concept of measuring emissions, it requires a positive displacement pump-constant volume sampler (PDP-CVS) or critical flow venturi (CFV) with heat exchanger, and must be connected to a dilution tunnel for sampling particulate emissions. Specific operating requirements are detailed by the EPA for both systems. Compression ignition engines require a heated flame ionization detection sampler for hydrocarbon analysis. The Heated Flame Ionization Detector (HFID) must be taken directly from the diluted exhaust stream through a heated probe in the dilution tunnel. Other analyzers are required for carbon monoxide, carbon dioxide, and oxides of nitrogen. One such facility is described in detail by Dunlap et al. (1993).
Emissions testing is a case where the protocol is so restrictive as to limit testing to only a very few laboratories. To counteract the official level, many scientists use techniques of their own to give "relative" data. As the data is examined, it is easy to see that these many different local procedures shed more dark on the question than light. Acceptable research protocols should be suggested within the reach of the average engine test cell that would bring uniformity to this maze of tests.
The reports reviewed can be broken into a range of sophistication. Many labs have only an opacity or smoke meter available and report this as emissions testing. Some have maintenance shop-type instruments for the regulated emissions total HC, CO, CO2, NOx, and PM. These instruments are usually operated with little or no calibration and offer, in many cases, too little precision and/or sensitivity to give real "relative" data. The validity of most of those tests should be suspect. The literature clearly shows that smoke meter or opacity data indicate only visible smoke and are not necessarily related to the regulated emission called PM.
Particulates are defined by the EPA as any diesel exhaust effluent collected on a binderless glass fiber filter in a dilution tunnel at temperatures below 125°F. Hence, particulates include not only solid carbon, but sulfate emissions and soluble organic fractions (SOF). The SOF found in diesel particulates are comprised of unbumed fuel and lube oil, and partially oxidized fuel and lubeoil (Hunter etal., 1990).
Barenescu (1994) and Holmberg and Peeples (1994) report an inverse correlation between emissions of NOx and PM. If an engine is optimized to reduce NOx emissions, each unit of NOx reduction will routinely result in a unit increase of PM. Similarly, a reduction in PM will result in an increase in NOx. Although the inverse correlation holds true for biodiesel as well, the severity of the trade-off is not as significant as in petrodiesel.
The next level of sophistication is from tests which have good quality analyzers with heated lines and, hopefully, good calibration procedures for HC, CO, CO2, and NOx. In
every case, these test cells did not have access to a dilution tunnel for measuring PM. In most cases they still use opacity or smoke for PM. These test cells also do not have capability for transient cycles and report steady state data. In some studies the 13 mode test is used, in most studies a protocol of their own is used. This is most generally a constant speed, variable load test. This data is often referred to as being "relative" to the transient cycle required by EPA.
The third level of sophistication is a testing lab with a transient capable dynamometer, a dilution tunnel, calibration, and all the required sophistication to be called "EPA Certified" for emissions testing. Even in these labs, however, there is not uniformity of data because cycles differ, reference fuels differ, engines differ, methods of changing fuels differ and there is a wide selection of vegetable oil ester fuels from different origins have been used as test fuels. Another problem is the need for "cold start" and "hot start" tests. These requirements are probably reasonable for certifying an engine if the lab is available. However, when one does a comparison of many different fiiels, additives, engine adjustments, or blends it becomes an impossible task to create an adequate scientific experiment given a normal budget and time to use a certified emissions testing facility.
The last level of emission testing involves laboratories that also measure the unregulated aldehydes, ketones, and polycyclic aromatic hydrocarbons (PAH) that are possibly potential health problems. Only a few studies report these constituents; however, most show that vegetable oil esters produce PAHs lower than those from diesel fuel.
The overriding conclusion reached from this literature review was that ethyl and methyl esters of vegetable oils are essentially similar to diesel fuel in their emissions characteristics. Minor engine adjustments can bring about minor changes in results. Several studies show that NOx is increased. That may or may not be relevant, 10 or 15% of the very small amount of NOx produced was accompanied by an equally important benefit such as reduced HC, CO, or PM. The chemistry of combustion requires emissions. Hydrocarbons are transformed into carbon dioxide and water accompanied by nitrogen in the air passing through the process. Incomplete combustion results in HC and CO. The high temperatures and pressures of combustion form NOx. Reductions in HC and CO must be accompanied by increases in CO2. Sales of diesel fuel in the United States are nearly 190 billion L (50 billion gallons) per year, 53.4% goes to transportation according to the Energy Information Administration (1989). Diesel engines were designed over many years to operate on petroleum diesel. It is interesting that they perform as well as they do on methyl and ethyl esters of vegetable oils and that the emissions are comparable to that of commercial diesel fuel for which the engines were designed.
In the United States, the regulations that take effect in 1994 and 1998 will push the design limitations of heavy-duty diesel engines. The federal heavy-duty diesel engine emission regulations for 1991 and 1994 have prompted a comprehensive re-examination of the diesel combustion process. These regulations require major reductions in the NOx and particulate emissions of diesel engines used in trucks over 3 860 kg (8,500 lb) gross vehicle weight (GVW). According to EPA 86.094-11, exhaust emissions
806 TRANSACTIONS OF THE ASAE
from new 1994 and later model year diesel heavy-duty engines shall not exceed the following: HC 1.3 g/bhp-h; CO 15.5 g/bhp-h; NOx 5.0 g/bhp-h; PM for diesel engines to be used in urban buses 0.07 g/bhp-h; PM for all other diesel engines 0.10 g/bhp-h. The opacity of smoke emissions shall not exceed the following: 20% during the acceleration mode; 15% during the lugging mode; 50% during the peaks in either mode.
Zhang et al. (1988) in two replicates of 200-h tests reported that "based on evaluations of engine performance, wear and combustion chamber component condition as indicators of engine durability, winter rape methyl ester appears to be equivalent to number 2 diesel".
Schumacher et al. (1994) reported on tests with two 5.9-L Cummins engines in on-road vehicles that the black exhaust smoke normally observed when a diesel engine accelerates was reduced by as much as 86% when the diesel engine was fueled with 100% soy diesel.
Humke and Barsic (1981) in tests with degummed crude soybean oil and crude soybean oil found that nozzle deposit formation after 10 h caused engine performance to decrease and emissions to increase.
Schumacher et al. (1993) studied engine exhaust from four farm tractors using portable exhaust emission testing equipment. As fuel changed from diesel to methyl soyate, CO dropped from 0.67 to 0.04%, CO2 exhibited no clear trends, NOx increased from 843 to 1,006 ppm, while opacity decreased from 15.6 to 8.0%. NOx exhaust emissions tended to be lower when the engines were fueled with 10 to 40% soydiesel/diesel blends as compared to 100% diesel or 100% soydiesel.
Zubik et al. (1984) used a Case 188D, four cylinder, naturally aspirated, four-stroke diesel engine to study exhaust emissions of diesel fuel, a blend of 25% sunflower oil in diesel fuel and 100% sunflower oil methyl ester. Emissions were measured with continuous flow, heated line analyzing instruments. Particulates were measured with a smoke meter. At a constant speed of 1,800 rpm, CO and NOx emissions were essentially the same for all three fuels. Smoke was the lowest for the methyl ester and highest for pure diesel fuel. Throughout the operating range the pure diesel fuel gave the lowest HC values, however, at the lightest loads HC from diesel was above the methyl ester and blend values.
Ishii and Takeuchi (1987) used a one cylinder, Yanmar indirect injection engine to compare emissions for diesel and transesterified curcas oils. They used steady state measurements at 2,400 rpm and different load settings. Both HC and CO were higher at light loads and lower at full load for the ester compared to diesel fuel. NOx was essentially unchanged. There was a slight reduction in black smoke concentration when operating on the transesterified curcas oils compared to diesel.
Muryama et al. (1984) compared rapeseed and palm oils and their methyl esters with diesel fuel for performance, emissions, and carbon deposits in a one cylinder, direct injected (DI) diesel engine. It was found that shortening the combustion duration was effective in reducing smoke regardless of fuel.
Reece and Peterson (1993) measured smoke opacity using the snap idle test with a 1992 Dodge with a Cummins 5.9-L, DI, turbocharged and intercooled engine comparing methyl ester of rapeseed oil and diesel fuel. They found a
decrease in opacity of 63%, and 9% reduction in horsepower for the RME when compared with diesel.
Geyer et al. (1984) operated a single cylinder, 0.36-L, DI Diesel engine on certified no. 2 diesel, cottonseed oil, sunflower seed oil, methyl ester of cottonseed oil, and methyl ester of sunflower seed oil to compare performance and emission data. A primary objective was to assess aldehyde emissions and the potential health effects of particulate emissions when operating a diesel engine with vegetable oils. The engine was operated at 2,400 rpm and load conditions of 1/3, 2/3, and full rack. They collected data for CO, HC, NOx, and total aldehydes, as well as individual aldehyde concentrations from formaldehyde through heptaldehyde. They found that the gas phase emissions were slightly higher for the vegetable oils. NOx was significantly higher for the methyl esters at all rack settings. They found that total aldehydes increased dramatically with the vegetable oil when compared to diesel; the averages for the methyl esters were slightly higher than the neat oils. The amount of formaldehyde increased with rack setting and was consistently higher for the methyl esters than for diesel. The diesel had a large increase in aldehydes with rack settings while the vegetable oils did not. Overall, the aldehydes averaged 12% for diesel and 31% for the vegetable oils. They indicate significant variability in data and "this may indicate some problem in the collection or extraction methods".
Wagner et al. (1985) reported that all regulated emission levels for the ester fuels were similar to diesel fuel except for NOx. They state, "Smoke was definitely less visible under full rack conditions for the methyl and ethyl esters compared to diesel fuel, but the butyl ester was greater...". Esters tested were purchased from Emery industries and an additive package purchased from Ethyl Corporation was added. The test engine was a John Deere 4239TF. Emissions measurements were steady state and no PM equipment was available. Carbon dioxide, carbon monoxide, and oxygen emissions were very similar for all four fuels at both the 2,200 and 1,500 rpm speed settings. The NOx emissions for the esters measured two to five times that of the diesel fuel. The methyl ester produced the highest levels, the butyl esters the next highest, with the ethyl ester producing the lowest levels of NOx emissions at botti engine speed settings. Visible smoke was less for the methyl and ethyl esters at full rack compared to diesel fuel.
Clark et al. (1984) used a 3.9-L, John Deere 4239TF, four-cylinder, DI, turbocharged, CI diesel engine on a stationary dynamometer equipped with a constant speed or constant load mode of automatic control to study emissions from both methyl and ethyl esters. Exhaust gas measurements for HC, CO, CO2, NOx, and O2 were made according to SAE J1003. They found that CO was very low, with no differences between fuels; however, the CO emissions were too low to be reliable on their instrumentation. Soyates had slightly lower HC levels than the reference diesel fuel. Methyl and ethyl soyates had consistently higher levels of NOx than the reference fuel. Ethyl esters were lower in NOx than methyl esters.
Alfuso et al. (1993) used a DI, CI diesel engine for emissions tests with the ECE 15, a nonstandard STOP and GO test cycle, and the European 13 mode test procedure. Fuel tested was RME. Tests indicated that RME promoted a rise in NOx, decreased HC and CO, and reduced smoke.
VOL.39(3):805-816 807
Particulate matter produced by RME in transient cycles was higher than that obtained with diesel fuel. They also measured PAH by taking a sample of diluted exhaust through a glass-fiber filter and then two cold traps in series that were at 0 and 20®C, respectively. The PAH measured with three or four rings, that at ambient temperature are still in the gas phase, were collected into cold traps. The PAH with five rings or more were mainly collected on the filter. The volume of extract from the filter and the condensed phase were reduced by rotary evaporation and then analyzed by GC-MS equipment. This technique allows for the analysis of more than 20 compounds. They observed that NOx was increased, smoke was lower for the RME, and in effect increased with load. It is well known that PM emissions may not follow the trend of smoke because of the contribution of SOP. Particulate matter is composed of dry soot and a condensed phase. At low loads the contribution of SOP is higher. At light loads RME produced more SOP and PM than the diesel fuel, while in proximity of full load the trend was the opposite. Hydrocarbons for diesel was higher at light loads and less at high loads. Carbon monoxide was about the same for light and high loads with diesel, but was reduced with RME. Nitrogen oxide production was generally higher for the biofiiel, but this effect was more important for the 13-mode cycle than for the transient one. It can be observed that dangerous PAHs did not show significant differences in ECE 15 tests, while they were lower for biofuel on the STOP and GO tests.
Vander Griend et al. (1990) used a laboratory and modeling study with the KIVA combustion model to study combustion of vegetable oil fuels. They reported that "The RME appeared to be an ideal fuel under the conditions tested; it displays short ignition delay, sufficient charge for an extensive premixed bum, and a smooth diffusion bum stage. Therefore, there exists an opportunity for the optimization of parameters such as injector timing and swirl. Advanced timing should result in a slightly earlier and more vigorous premixed bum. Since RME shows signs of a vapor rich core during injection, increased swirl should result in some increase in the amount of premixed bum and in an enhanced rate of diffusion bum".
ShoU and Sorenson (1993), in tests with SME, found that HC emissions were 50% less than those of the reference diesel fuel; smoke for SME was generally lower than for the diesel reference fuel. They used a four-cylinder, four-stroke, normally aspirated, DI diesel engine. TTiey only had 3.8 L (1 gal of each fuel available) and took their data over 100 consecutive engine cycles at 1,800 rpms and 50, 150, 300,450, and 600 kPa BMER At all loads the HC emissions from SME were about one-half of those from diesel fuel. Carbon dioxide emissions were slightly lower than for SME except for the very lightest loads, where they were slightly higher. Nitrogen oxide was essentially unchanged. Conditions which have the highest peak pressures and rate of pressure rise at a given load and timing tended to have the highest NOx. ShoU and Sorenson show that the differences in NOx emissions are attributable to changes in ignition delay and buming rate only. This study showed reduced NOx at equal BMEP, and more reduction at 5° retarded timing with SME compared to diesel. Bosch smoke numbers were lower for SME, but when using a small injector nozzle at retarded timing, the
two fuels gave equal results. They state that "the correlation between smoke number and particulate emissions is tenuous at best. . . ". Their conclusions were, "In terms of combustion behavior and exhaust emission characteristics, soybean oil methyl ester can basically be regarded as interchangeable with diesel fuel". Nitrogen oxide emissions for the two fuels are comparable (but slightly lower for SME) and are related to the peak rate of pressure rise which occurs during the initial portion of the combustion process. Smoke numbers for the soybean oil methyl esters were lower than those for the diesel fuel.
Xiao (1993) tested emissions in a Detroit Diesel 6V-92 engine rated at 207 bkw (277 BHP) at 2,100 rpm. Fuels used were house number 1 diesel (DPI) and number 2 diesel (DF2), both low sulfur fuels. They found that 100% SME reduced baseline DPI and DF2 total particulates by 35%, linear with percentage of SME in the fuel. Volatile particulate portions remained at a constant level so particulate reduction was mainly due to the reduction in soot (up to 65% with 100% SME). Nitrogen oxide was increased by up to 8.5% for DF2 blend and 19% for DPI blends. The emission effects of 20% SME blends were small.
Mittelbach and Tritthart (1988), in tests with methyl esters of used frying oil, reported slightly lower HC and CO emissions, but increased NOx. Particulate emissions were significantly reduced, especially the insoluble portion. These two researchers say that the reduction of particulate emissions can be explained by the oxygen content of the used frying oil fuel. They reported that PAH emissions are, in general, slightly higher than those from DF2, but that the differences are within tolerance limits.
Hemmerlein et al. (1991), in tests with neat rapeseed oil, reported increased HC (up to 290%), increased carbon monoxide (up to 100%), lower nitrogen oxides (up to 25%), lower soot emissions (reduced Bosch number of 0.1 to 0.4 depending on engine type), and particulate emissions reduced 30 to 50% with "divided" chamber and increased 90 to 140% with a DI engine. The soluble organic fraction of particulate emissions increased by up to 15% when rapeseed oil was used. They found that total emissions of aldehyde and ketones were 30 to 330% higher with rapeseed oil; emissions of aromatic hydrocarbons were significantly higher with rapeseed oil. Emission profiles of particulate bound PAH emissions showed anthracene and phenanthrene had the highest concentrations followed by pyrene, chrysene, and fluoranthene. Polycyclic aromatic hydrocarbon emissions "were reduced to about one-third with big pre-combustion and swirl chamber engines. They increased with rapeseed oil in DI engines and the small swirl chamber engines by 10 to 140% compared with diesel fuel.
Marshall (1993) reported using methyl esters in a stationary Cummins L-lOE engine and a Cummins 5.9 L in a Dodge pickup tested on a chassis dynamometer. The L-lOE engine was tested using the 13-mode emissions test and the pickup with a transient Federal Test Procedure test. They reported "Emission trends were very similar to those reported for other heavy duty diesel engines. That is, emission levels of HC, CO, and PM decreased significantly for the SoyDiesel blends compared to the diesel fuel. The decrease from the base fuel for these three components was about 5% per 10% incremental addition of methyl soy ate to
808 TRANSACTIONS OF THE ASAE
the fuel. Nitrogen oxide emissions tended to increase linearly with the level of methyl soyate in the fuel— approximately 1.4% per 10% incremental addition of methyl soyate". They hypothesized that the increase in NOx was associated with cetane number or ignition delay characteristics. They reported that fuels with very high cetane numbers are associated with very high NOx emissions. They further comment that there is much information in the technical literature associating increased NOx emissions with lower cetane fuels. However, they say the low cetane number was created by increasing the aromatics content, which was not done in their study.
Marshall (1993) found the following for the pickup truck. There was no regular, systematic effect of soyate level on HC and NOx, particulates increased with the content of methyl soyate and reached 70% above the low sulfur diesel, and CO decreased with increasing soyate level. They reported quite high NOx—6 gm/mile whereas the EPA standard for vehicles of this weight class is 1.7 gm/mile. Emission levels of HC, CO, and PM were at or below the EPA standards. In this study, 5% by volume methyl soyate resulted in a 1% increase in BSFC, 18% reduction in HC, 8% reduction in CO, 0.7% reduction in NOx, and a 4.5% decrease in PM.
Marshall (1993) reported that there did not appear to be any fuel effect on aldehyde emissions. The levels with the 5.9-L Cummins engine were quite high for all three fuels— approximately 90 mg per mile (mgpm) compared to levels of 3 to 10 mgpm for spark ignition vehicles. One possible reason is the difference in the test procedures for light and heavy duty vehicles.
Mittelbach et al. (1985) used a 2.3-L turbocharged, four-cylinder, four-stroke, DI prototype diesel engine with exhaust gas recirculation (EGR) under transient operating conditions on a chassis dynamometer for emissions tests with RME and unrefined (URME) rapeseed oil. Two U.S. diesel fuels and an Austrian diesel fuel were used for controls. They state, "It is common knowledge that by heating fats and oils various volatile compounds like aldehydes and ketones are produced". When using rape oil and RME as diesel fuels, the typical smell of burnt fat can be detected, which could originate from unsaturated aldehyde like acrolein. They determined 10 polycyclic aromatic hydrocarbon compounds. For all fuels, the tests showed high formaldehyde (40%) and very low acetaldehyde. For the sum of C-3 aldehydes, URME was highest and RME was similar to U.S. fuel B, whereas U.S. fuel A and Austrian diesel fuel were lowest. The transformation of rapeseed oil into the methyl ester at least reduces the emissions of C-3 aldehydes significantly. In these tests, HC was reduced, CO unchanged, and NOx increased. Nitrogen oxide of the ester fuels was 0.56 to 0.62 gm/km while NOx of the diesel fuels was 0.47 to 0.5 gm/mile. They conclude, "rapeseed oil methyl esters do not lead to irregular PAH-emissions".
Recenriy, completed tests by ORTECH (Goetz, 1993) using a 20% blend of biodiesel and 80% diesel fuel showed that a 3° timing change decreased NOx by 4.6%, HC by 14.5%, CO by 9.8%, and PM by 17.2% compared to diesel with no timing changes.
Humphrey and Schumacher (1994) reported on emissions testing conducted by Cummins Engine Company in an EPA-certified testing laboratory. Cummins tested a
5.9-L, turbocharged, intercooled, DI diesel engine. The engine was fueled on biodiesel and reference diesel fuel. The tests revealed the following significant results: 1) reduction in smoke up to 83%; 2) reduction in hydrocarbons by 48%; 3) a decrease of CO by 1%; 4) an increase in NOx by 14%; and 5) a reduction in particulate emissions by 20%. Additional emissions testing by the University of Missouri with automobile inspection emissions analysis equipment on a 1991 Dodge pickup equipped with a 5.9-L turbocharged, intercooled DI Cummins diesel engine revealed slightly lower CO, C02^ and HC emission levels. There are very little sulfur emissions due to the absence of sulfur in plant oils.
Manicom et al. (1993) reports that tests were conducted on a 1991, DDC 6V-92 TA engine using the EPA Heavy-Duty Transient Test Cycle. They tested blends of 10, 20, 30, and 40% methyl soyate in comparison with a diesel control fuel. The diesel control fuel used was ESSO Diesel No. 1. One cold start transient test and four hot start transient tests were completed on each fuel. The results showed nearly linear changes with percent fuel. The 40% blend of methyl soyate had the following results: HC down 39.5%; CO down 29.1%; NOx up 15.0%; PM down 17.8%. Increased blend levels increased NOx while reducing PM. Proportionately, PM reductions were slightly more than the increase in NOx. The reduction in PM was attributed to the oxygen in the fuel. Total particulates for a 20% blend are reduced by 11.1%, but the soluble fraction increases from 40 to 51%.
Manicom et al. (1993) reported that "the addition of methyl soyate to diesel fuel had the effect of lowering particulates, hydrocarbons, and carbon monoxide emissions while increasing NOx emissions. The optimum blend of methyl soyate and diesel, based on the trade-off of particulates decrease with NOx increase, was 20% methyl soyate in diesel. Due to the increase in NOx emissions in parallel with decreased exhaust temperatures, it is postulated that the methyl soyate is acting as a fuel cetane improver. This improvement in cetane is resulting in a reduced ignition delay time and thus an effective advance in injector timing".
Mills and Howard (1983) conducted an investigation of polynuclear aromatic hydrocarbon emissions with unmodified sunflower, rapeseed and soybean oils, and modified ethyl ester of sunflower vegetable oils. Three engine load/speed conditions were assessed for each fuel and emission levels were determined for 20 PAH compounds. Samples were generated using a probe in the exhaust pipe. The side stream of exhaust was first filtered to collect particulate bound PAH. Following filtration, the exhaust was transferred to two identical condensation traps for the removal of the vapor phase PAH. Polycyclic aromatic hydrocarbon profiles were strongly influenced by combustion conditions for all fuels tested. Polycyclic aromatic hydrocarbon profiles from the ethyl ester of sunflower oil (SEE) exhaust extracts showed similarities with diesel, but were lower in total quantity. At 1,500 rpm and no load, total PAH emissions (microgram/m^) for SEE were 289 |Lig/m^ compared to 3 344 iig/m^ for "gas oil" and at 2,350 rpm and full load 560 jiig/m^ for SEE and 2 405 |xg/m^ for "gas oil". This work was conducted on a Petter BA2, DI diesel engine. Instruments were available for CO, CO2, and Bosch smoke number. Only 4 L of each
VOL. 39(3): 805-816 809
fuel was available which restricted the number of test conditions. Test conditions used were 1,500 rpm - no load; 2,350 rpm - half load; and 2,350 rpm - full load.
Liotta and Montalvo (1992) used a 1991 prototype Detroit Diesel Series 60 engine installed in a transient capable test cell to study the effect of eight oxygenates, one of which was methyl soy ate. They showed that PM emissions were directly related to the concentration of oxygen in the fuel; higher oxygen results in lower PM. Particulate matter reductions were accompanied by small increases in NOx emissions. Addition of the oxygenate to the fuel reduced CO and HC emissions; nonregulated aldehyde and ketone emissions were also reduced with the addition of an oxygenate. The composition of the PM from the 11 oxygenated fuels was compared with the reference fuel. The composition remained essentially unchanged. Volatile aldehydes and ketones found in the engine exhaust were measured for each of the fuels. The aldehydes that were speciated and measured include formaldehyde, acctaldehyde, accolein, propionaldehyde, crontonaldehyde, hexanolaldehyde, isobutyraldehyde, and benzaldehyde. Two ketones, acetone, and methyl ethyl ketone also were measured. All of the oxygenated fuels, except for the fuel containing the aliphatic alcohol, had lower aldehyde and ketone emissions. Typically, total aldehydes and ketones were decreased 10 to 25%. Unfortunately, in this study no data aldehyde and ketone data were taken for the methyl soyate.
This review of literature on emissions test results with vegetable oil fuels brings one to the conclusion that ethyl and methyl esters of vegetable oils are essentially similar to diesel fuel in their emissions characteristics. In some studies, HC is reduced as much as 50%; CO is reduced by as much as 10%; NOx and PM are related and tend to change inversely with each other, differing from diesel by at most 10 to 15%. Generally, NOx was found to be slighdy higher than diesel and PM slightly lower than diesel, although this differs with particular conditions. In this case, NOx was about 0.56 gm/mile for biodiesel and 0.48 gm/mile for diesel. Of the approximately 20 articles reviewed, no two used exactly the same protocol so as to be directly comparable.
MATERIALS AND METHODS The emissions tests were conducted at the Los Angeles
Metropolitan Transit Authority (MTA) Emissions Testing Facility (ETF) located in Los Angeles, California. This facility has instrumentation to measure the regulated emissions (total HC, CO, NOx, and PM) and CO2. The ETF provides quality assurance test results and calibrations in accordance with California Air Resources Board (CARB) quality assurance recommendations. (Dunlap, 1994).
CHASSIS DYNAMOMETER
The ETF is equipped with a Schenck Pegasus transient chassis dynamometer driven by a 447-kW (600-hp) DC motor, a computerized control room, sophisticated emissions recovery capability, measurement and recording equipment, and various testing stations. The chassis dynamometer comprised a 1 829-mm (72-in.) diameter roller assembly connected to a DC motor and planetary
gear box assembly. The complete assembly was suspended on flexible supports, facilitating measurement of the torque on the rollers.
TEST CYCLES
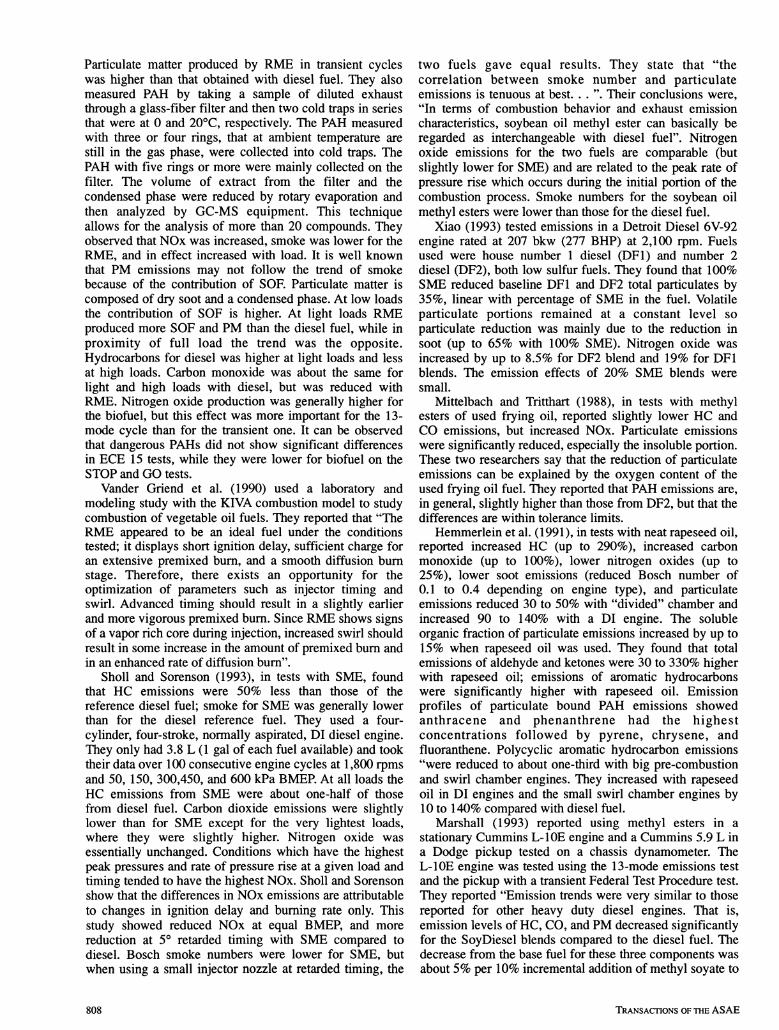
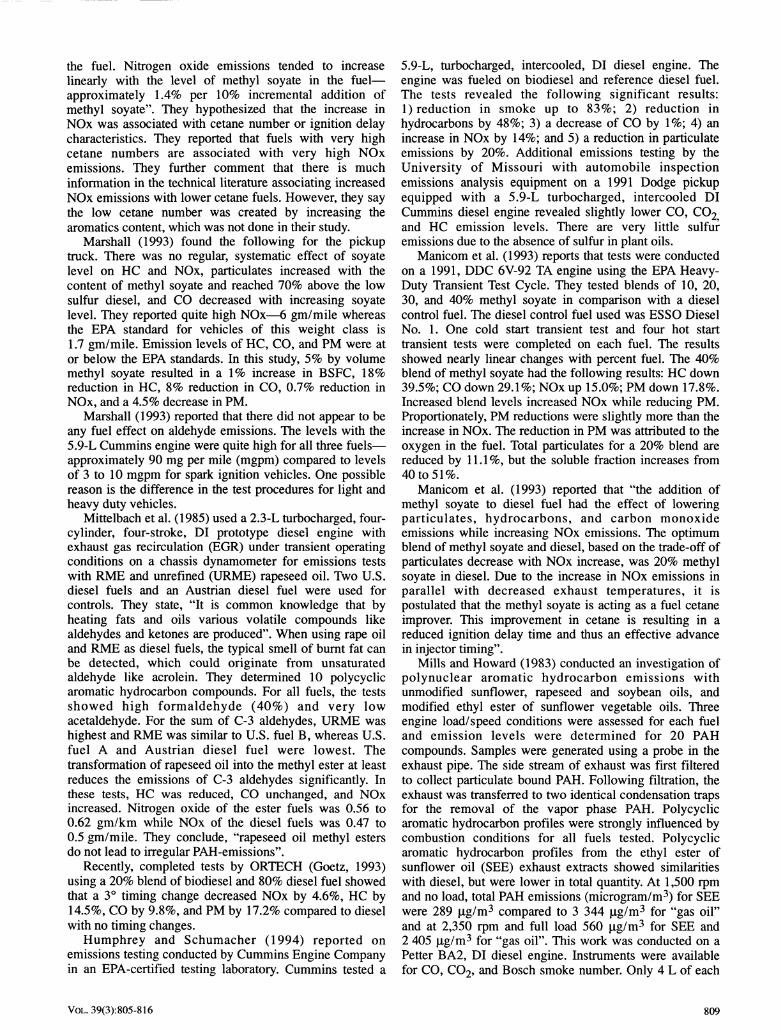
Two test cycles were utilized for this test program. The first was a modified arterial cycle (arterial). The standard form event cycle was doubled, creating a 758-s, eight-event cycle. The arterial cycle, as used, has eight repetitions of accelerating to 64 km/h (40 mph) and decelerating to 0 km/h (0 mph) (fig. 1). The second was the EPA Dynamometer Driving Schedule for Heavy-Duty Vehicles (Code of Federal Regulations 40, Part 86, Appendix I, Cycle D) (fig. 2). The EPA cycle has a total time of 1,060 s.
ROAD LOAD SIMULATION
In order to measure the emissions of a vehicle during operation, the actual driving conditions of the vehicle on the road must be simulated on the dynamometer. The dynamometer control system must simulate the force that would act on the vehicle if the vehicle were travelling on the road. This force, or Road Load (RL), is defined by the equation below (Dunlap, 1994):
RL = FQ + Fj V + F2Vn + I(dv/dt) + mg sin (grad)
where RL Fo
Fl
F2 n V
km/h
= road load (force at roller surface) = coefficient of friction force - independent of
velocity = coefficient of friction force - dependent on
velocity = coefficient of windage force (drag coefficient) = velocity exponent « velocity at the roller surface
0 60 120 180 240 300 360 420 480 540 600 660 Time (seconds)
Figure 1-Modified arterial cycle.
720
"0 126 240 360 480 600 720 840 960 Time (seconds)
Figure 2-EPA cycle for heavy duty vehicles.
810 TRANSACTIONS OF THE ASAE
I = vehicle inertia (dyno inertia plus appropriate amount of inertia as simulated by the control system)
(dv/dt)= acceleration m = vehicle mass g = acceleration due to gravity grad =« gradient in % The EPA and arterial test cycles do not include any
gradients (uphill or downhill) therefore, the RL equation becomes:
RL = Fo 4- Fj V + F2Vn + I(dv/dt)
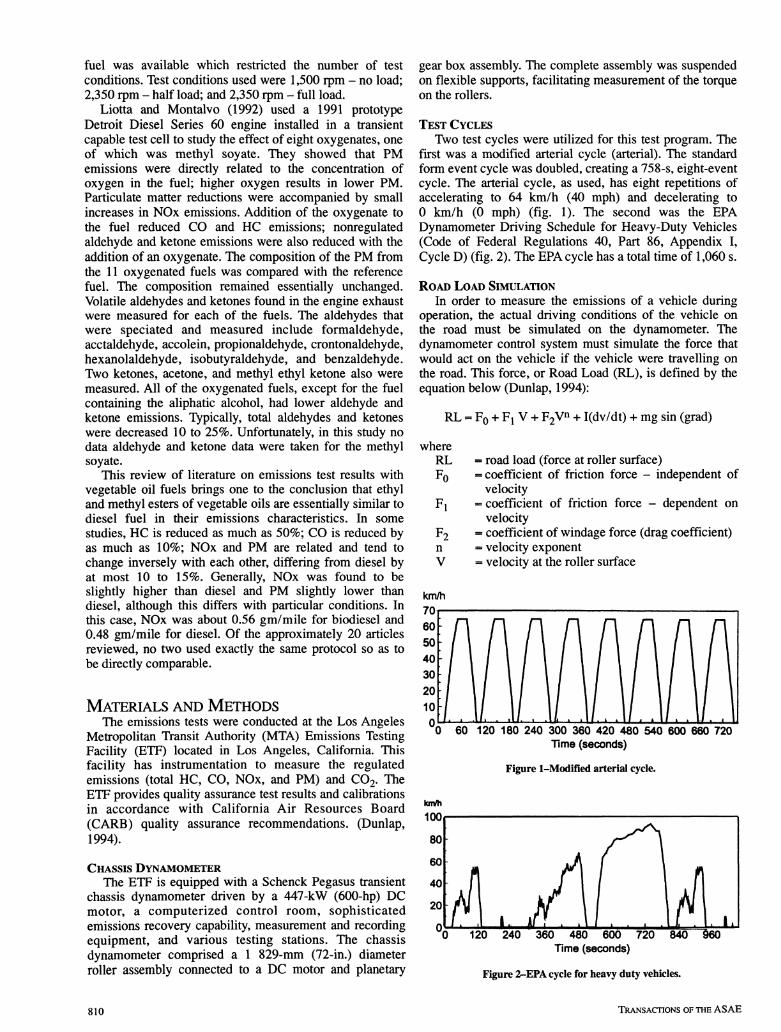
To aid in the development of a set of coefficients. University of Idaho personnel conducted a coast down evaluation of the test vehicle in Idaho prior to the scheduled ETF test date (fig. 3). The coast down test involves accelerating the vehicle to 96 km/h (60 mph) and then letting it coast (decelerate) while recording the time for each speed until the truck comes to a stop. Based on the coast down data, LA-MTA personnel developed a set of coefficients as a starting point for RL model development. Once the vehicle was installed on the dynamometer, coast downs were conducted and the model was refined to match the average on-road data. This refinement process was necessary to "factor out" the internal dynamometer resistance. The coefficients developed for tihis program were FQ = 22.7 kg (50 lb), Fj - 0.237 kg/km (0.84 Ib/mph), F2 = 0.000025 kg/km^ (0.00009 lb/mph2) and I = 3 583 kg (7,900 lb).
FUELS TESTED Fuels tested included:
1.
2. 3. 4. 5. 6. 7. 8.
Phillips D2 low-sulfur diesel control fuel (DIESEL) 100% rape methyl ester (lOORME) 100% rape ethyl ester (lOOREE) 50% RME - 50% diesel (50RME) 50% REE - 50% diesel (50REE) 20% RME - 80% diesel (20RME) 20% REE - 80% diesel (20REE) An ethyl ester of waste hydrogenated soybean oil (HySee) A blend of 80% diesel, 10% REE, and 10% ethanol (3-CEE)
140
Speed (km/h)
Figure 3-Coasting data for the 1994 Dodge pickup, 3 057 kg (6,7401b) curb weight with driver, 3 583 kg (7,900 lb) weight as tested. The truck was accelerated to 96 km/h (60 mph) and allowed to coast to a stop.
10. A blend of 90% REE and 10% ARCO DTBG additive
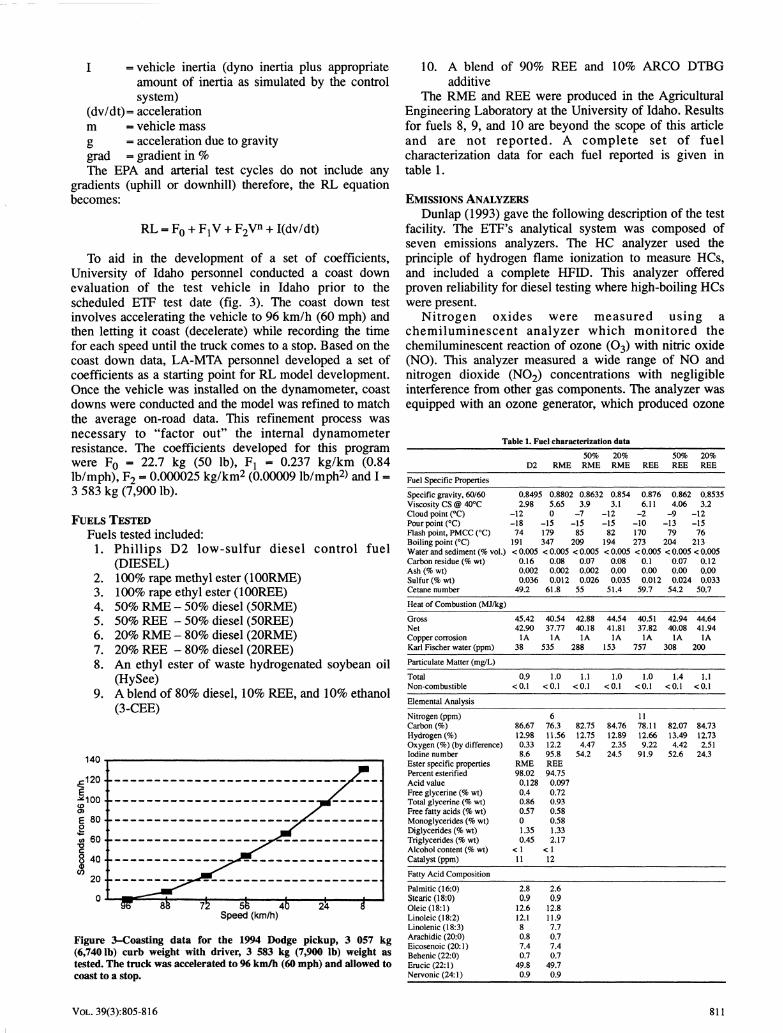
The RME and REE were produced in the Agricultural Engineering Laboratory at the University of Idaho. Results for fuels 8, 9, and 10 are beyond the scope of this article and are not reported. A complete set of fuel characterization data for each fuel reported is given in table 1.
EMISSIONS ANALYZERS Dunlap (1993) gave the following description of the test
facility. The ETF's analytical system was composed of seven emissions analyzers. The HC analyzer used the principle of hydrogen flame ionization to measure HCs, and included a complete HFID. This analyzer offered proven reliability for diesel testing where high-boiling HCs were present.
Nitrogen oxides were measured using a chemiluminescent analyzer which monitored the chemiluminescent reaction of ozone (O3) with nitric oxide (NO). This analyzer measured a wide range of NO and nitrogen dioxide (NO2) concentrations with negligible interference from other gas components. The analyzer was equipped with an ozone generator, which produced ozone
Table 1. Fuel characterization data
D2 RME 50% RME
20% RME REE
50% REE
20% REE
Fuel Specific Properties
Specific gravity, 60/60 Viscosity CS @ 40''C Cloud point (°C) Pour point (°C) Flash point, PMCC (°C) Boiling point (°C) Water and sediment (% vol.) Carbon residue (% wt) Ash (% wt) Sulfur (% wt) Cetane number
0.8495 0.8802 0.8632 2.98
-12 -18
74 191 < 0.005
0.16 0.002 0.036
49.2
5.65 0
-15 179 347 < 0.005
0.08 0.002 0.012
61.8
3.9 - 7
-15 85
209 < 0.005
0.07 0.002 0.026
55
, 0.854 3.1
-12 -15
82 194 < 0.005
0.08 0.00 0.035
51.4
0.876 6.11
- 2 -10 170 273 < 0.005
0.1 0.00 0.012
59.7
0.862 4.06
- 9 -13
79 204 < 0.005
0.07 0.00 0.024
54.2
0.8535 3.2
-12 -15
76 213 < 0.005
0.12 0.00 0.033
50.7
Heat of Combustion (MJ/kg)
Gross Net Copper corrosion Karl Fischer water (ppm)
45.42 42.90
lA 38
40.54 37.77
lA 535
42.88 40.18
lA 288
44.54 41.81
lA 153
40.51 37.82
lA 757
42.94 40.08
lA 308
44.64 41.94
lA 200
Particulate Matter (mg/L)
Total Non-combustible
0.9 <0.1
1.0 <0.1
1.1 <0.1
1.0 <0.1
1.0 <0.1
1.4 <0.1
1.1 <0.1
Elemental Analysis
Nitrogen (ppm) Carbon (%) Hydrogen (%) Oxygen (%) (by difference) Iodine number Ester specific properties Percent esterified Acid value Free glycerine (% wt) Total glycerine (% wt) Free fatty acids (% wt) Monoglycerides (% wt) Diglycerides (% wt) Triglycerides (% wt) Alcohol content (% wt) Catalyst (ppm)
86.67 12.98 0.33 8.6
RME 98.02
0.128 0.4 0.86 0.57 0 1.35 0.45
< 1 11
6 76.3 11.56 12.2 95.8 REE 94.75
0.097 0.72 0.93 0.58 0.58 1.33 2.17
< 1 12
82.75 12.75 4.47
54.2
84.76 12.89 2.35
24.5
11 78.11 12.66 9.22
91.9
82.07 13.49 4.42
52.6
84.73 12.73 2.51
24.3
Fatty Acid Composition
Palmitic (16:0) Stearic (18:0) Oleic (18:1) Linoleic(18:2) Linolenic(18:3) Arachidic (20:0) Eicosenoic (20:1) Behenic (22:0) Erucic(22:l) Nervonic(24:l)
2.8 0.9
12.6 12.1 8 0.8 7.4 0.7
49.8 0.9
2.6 0.9
12.8 11.9 7.7 0.7 7.4 0.7
49.7 0.9
VOL.39(3):805-816 811
for the reactions (O3) from oxygen, or air using an ultraviolet ozone generating method.
Carbon monoxide and CO2 were measured using non-dispersive infrared (NDIR) detection. The ETF analytical bench was equipped with a total of four NDIR analyzers and was therefore able to measure both low and high concentrations of CO and CO2. The analyzer that measured low CO concentrations incorporated a unique dual-detector optical bent to obtain high sensitivity and accuracy, even in the presence of water vapor, CO2, and other interfering gases, eliminating the need for chemical reagents and gas dryers to remove water vapor and CO2 from the sample for analysis.
Oxygen (O2) concentrations were measured during raw, or nondilute, testing using a magnetopneumatic sensing method. The analyzer provided an accurate and continuous determination of O2 with negligible interference from other gaseous components. Since current CARB testing protocol emphasizes dilute bag results, no raw testing was done on this test vehicle. (Dunlop, 1994)
TEST VEHICLE
The vehicle tested was a 1994 Dodge pickup with a DI, turbocharged and intercooled, 5.9-L Cummins diesel engine. The vehicle had accumulated 2414 km (1,500 mile) on diesel and 3 860 km (2,400 mile) on rape ethyl ester at the time of this test. The vehicle was driven from Moscow, Idaho, to Los Angeles, California, on 100% REE fuel for testing. Weight used during the test and for coast down was 3 590 kg (7,900 lb).
The engine was not modified in any way for use with the vegetable oil fuels. The fuel delivery system was modified for convenience of changing fuels between test runs. Fuel delivery and fuel return lines were broken and three-way, manually operated valves were installed so that stub lines with quick couplers could be installed on one part of the three-way valves. Individual 19-L (5-gal) fuel tanks were modified with fuel filter and flexible lines which could be connected to the three-way valves. During normal operation, fuel was delivered and returned to the vehicle tank. During testing the valves were switched to the external lines to which the correct test fuel was connected. For the tests, the fuel filter assembly mounted on the engine was removed and replaced with an aluminum block with internal connecting ports. This change was necessary to minimize the amount of fuel in the system when a fuel switch was required. Fuel filters were provided on each fuel delivery tank.
Timed practice sessions with fuels of different colors showed that a minimum of 20 s was required for the return lines to be clear of the previous fuel. During actual testing, the return line was directed to a waste fuel tank while the engine was operated for 50 s, at which time the return line was directed back into the test fuel tank. The low standard deviations in emissions data between tests of the same fuel were indicative of the success of the procedure for changing fuels.
VEHICLE INSTALLATION
The test vehicle was installed on the chassis dynamometer in accordance with typical ETF practice. A total of seven sensors were installed, but the fuel pressure sensor was not utilized due to a problem that occurred with
the fitting. The test sensor locations were at the oil filter adapter housing, boost pressure at manifold, exhaust temperature at tailpipe adapter, fuel pressure at pump inlet, coolant temperature, and inlet air temperature.
FUEL MASS FLOW RATE
Fuel use was determined by direct weighing. The fuel containers were placed on an electric scale. Weight of fuel was read at the start and end of each test. In practice, this method had considerable error due to vibrations set up by running the truck because of the direct connection between the fuel tank on the scales, the fuel delivery and return lines, and engine connections.
TEST DESIGN
Two problems had to be overcome in developing a test design. The first was that the potential number of test runs was unpredictable. The test facility was scheduled for one week during which time all testing had to be completed. The second problem was a tendency for emissions to vary with ambient conditions. A randomized block design with unequal sample numbers was developed. In this design, the main fuels were randomized and tested first and tests of fuel blends were included in later tests in each block. The fuel test procedure is shown in table 2. As it turned out, sufficient time was available to test each fuel and desired blend.
A Fisher's Protected LSD analysis using SAS (Statistical Analysis System) was carried out on the data.
TEST PROCEDURE
The test procedure was as follows: 1. The test fuel delivery tube was connected to the
input lines and the return line was connected to the waste tank. The engine was started and run for 50 s.
2. The engine was stopped and the return line was connected to the test fuel tank.
3. The engine was restarted and idled for approximately 10 min until the MTA technicians were ready to run the test.
4. The vehicle was operated under load until the operating temperatures stabilized.
5. TTie test was started and the cycle completed.
Table 2. Test plan for emissions tests
Arterial Cycle
Block 1: Block 2: Block 3:
Block 4:
Block 5:
100% REE 100% diesel 20% REE 50% REE 100% diesel 100% diesel 100% REE 20% REE FuelB 50% RME
100% diesel 100% REE 20% RME Fuel A
100% RME 100% REE 100% diesel FuelB 100% diesel
100% RME 100% RME 50% RME Fuel A
100% RME
20% RME 50% REE
EPA Cycle
Block 6:
Block 7:
100% REE 100% REE 100% RME 20% RME 100% diesel
100% diesel 100% RME
20% REE FuelC
100% RME 100% diesel
100% REE 50% REE
812 TRANSACTIONS OF THE ASAE
6. While the technicians were taking data, weighing particulate filters, and doing span gas tests, the fuel was switched to the next fuel to be tested.
Tests were conducted on 14 to 18 March 1994. Twenty-six modified arterial cycles and 13 EPA test cycles were completed. On one day, a shortage of gas for the flame ionization detector caused some delay and a need to replicate one run. Otherwise, the tests proceeded very smoothly and with very good repeatability.
RESULTS Since a large amount of data was collected, only
summary data is reported in this article. It is anticipated that additional articles will be presented as modal summaries or correlations between test variables are completed. Modal data were archived every 1 s during the test. Average and total values were calculated for cycles, phases, and overall. Thus the potential exists for additional analysis of test data.
Summaries of these data are shown in three ways. First, averages by arterial and EPA cycle for each fuel and for
each of the regulated exhaust emissions were computed using Fisher's Protected LSD. This procedure makes adjustments for the unequal sample numbers. Statistical significance is indicated in each of the summary tables. The statistical analysis for days of tests showed that the EPA cycle was significantly different from the arterial cycle for all parameters measured (not shown). All of the measured emissions were higher for the EPA cycle than for the arterial cycle. This was probably due to the increased idling time and nonrepetitive nature of the EPA
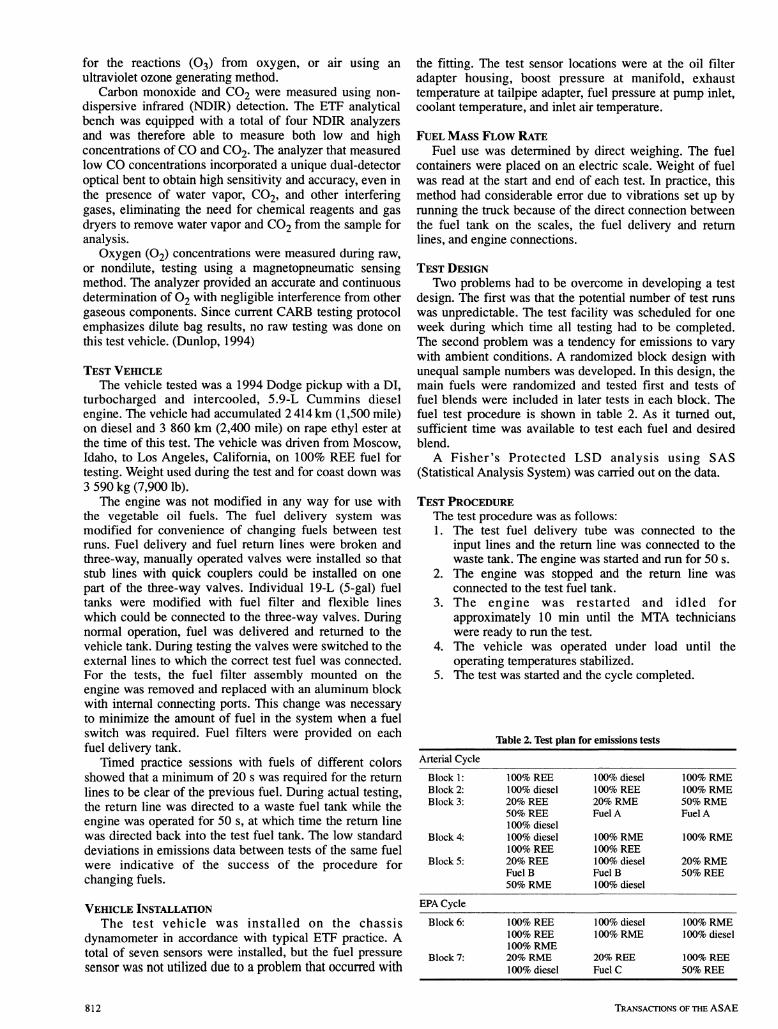
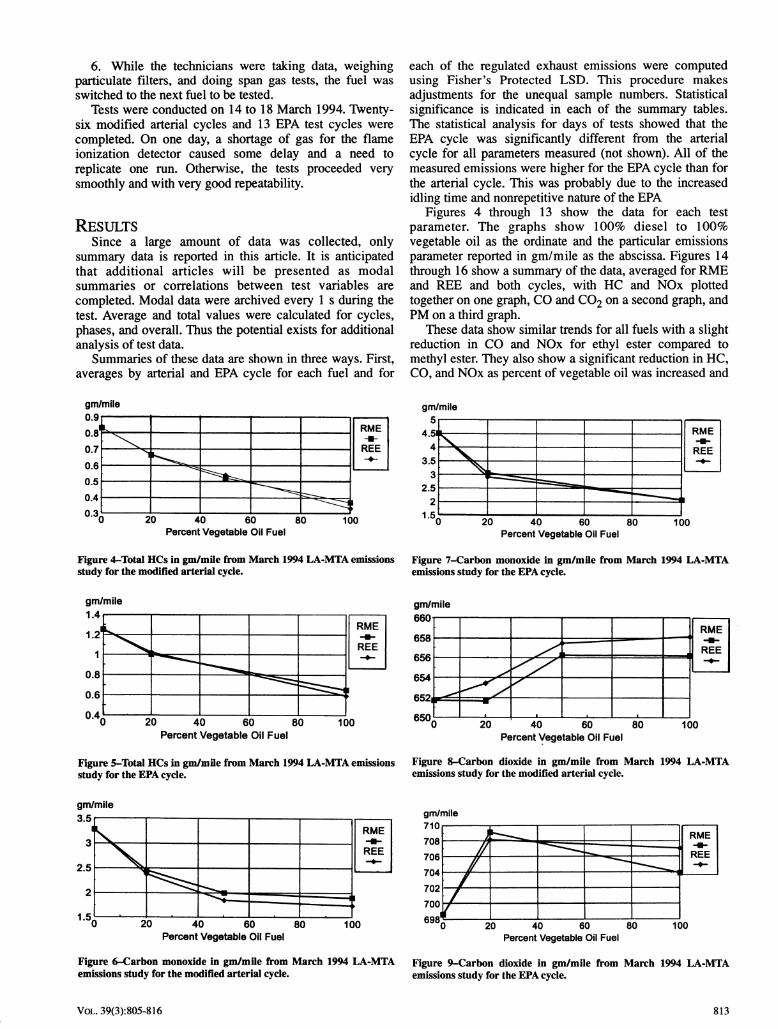
Figures 4 through 13 show the data for each test parameter. The graphs show 100% diesel to 100% vegetable oil as the ordinate and the particular emissions parameter reported in gm/mile as the abscissa. Figures 14 through 16 show a summary of the data, averaged for RME and REE and both cycles, with HC and NOx plotted together on one graph, CO and CO2 on a second graph, and PM on a third graph.
These data show similar trends for all fuels with a slight reduction in CO and NOx for ethyl ester compared to methyl ester. They also show a significant reduction in HC, CO, and NOx as percent of vegetable oil was increased and
gm/mile 0.9
0.8'
0.7
0.6
0.5
0.4
0.3,
t RME
REE
20 40 60 80 Percent Vegetable Oil Fuel
100
gm/mile
5 A ^l
3.5 3
2.5 2
1 1;
V \ .
> ,
1 RME
REE
20 40 60 80 Percent Vegetable Oil Fuel
100
Figure 4-Total HCs in gm/mile from March 1994 LA-MTA emissions study for the modified arterial cycle.
Figure 7-Carbon monoxide in gm/mile from March 1994 LA-MTA emissions study for the EPA cycle.
gm/mile 1.4
1.2'
1
0.8
0.6
0.4
*-
[ l-[
1 RME
REE
20 40 60 80 Percent Vegetable Oil Fuel
100
Figure 5-Total HCs in gm/mile from March 1994 LA-MTA emissions study for the EPA cycle.
gm/mile
660
20 40 60 80 Percent Vegetable Oil Fuel
100
Figure 8-Carbon dioxide in gm/mile from March 1994 LA-MTA emissions study for the modified arterial cycle.
gm/mile 3.5
2.5
1.5,
.
PN ̂ = ^ ; _
" —~—-̂
RME
REE
1
20 40 60 80 Percent Vegetable Oil Fuel
100
Figure 6-Carbon monoxide in gm/mile from March 1994 LA-MTA emissions study for the modified arterial cycle.
gm/mile
710
708
706
704
702
700
698'
Ji / r/ r/̂
/ r
b - ^ . — — — i - .
^̂ '*̂ ^
1 RME
1 REE
1 1
20 40 60 80 Percent Vegetable Oil Fuel
100
Figure 9-Carbon dioxide in gm/mile from March 1994 LA-MTA emissions study for the EPA cycle.
VOL.39(3):805-816 813
gm/mile 6.4
6.2'
6
5.8
5.6
5.4
HC (gm/mlle) NOX (gm/mlle)
1
1 RME
REE
20 40 60 80 Percent Vegetable Oil Fuel
100
Figure 10-Nitrogen oxide in gm/mile from Marcli 1994 LA-MTA emissions study for the modified arterial cycle.
gm/mile
6.6
6.4
6.2
6
5.8
L
r ^ \ N •*.—
1
RMEI
REE
20 40 60 80 Percent Vegetable Oil Fuel
100
Figure 11-Nitrogen oxide in gm/mile from March 1994 LA-MTA emissions study for the EPA cycle.
gm/mile 0.36
0.34
0.32
0.3"
0.28
0.26
t>vc i
/
1
1 RME
1̂ 1
20 40 60 80 Percent Vegetable Oil Fuel
100
Figure 12-Particulate matter in gm/mile from March 1994 LA-MTA emissions study for the modified arterial cycle. Differences are nonsignificant according to Fisher's protected LSD comparison.
gm/mile 0.55
0.5
0.45
0.4'
0.35
0.3,
^ JRME 1 j REE
20 40 60 80 Percent Vegetable Oil Fuel
100
Figure 13-Particulate matter in gm/mile from March 1994 LA-MTA emissions study for the EPA cycle. Differences are nonsignificant according to Fisher's protected LSD comparison.
a nonsignificant increase in PM. The PM data had the most variability of the data and an examination of the raw data showed that there was scatter sufficient to neutralize differences.
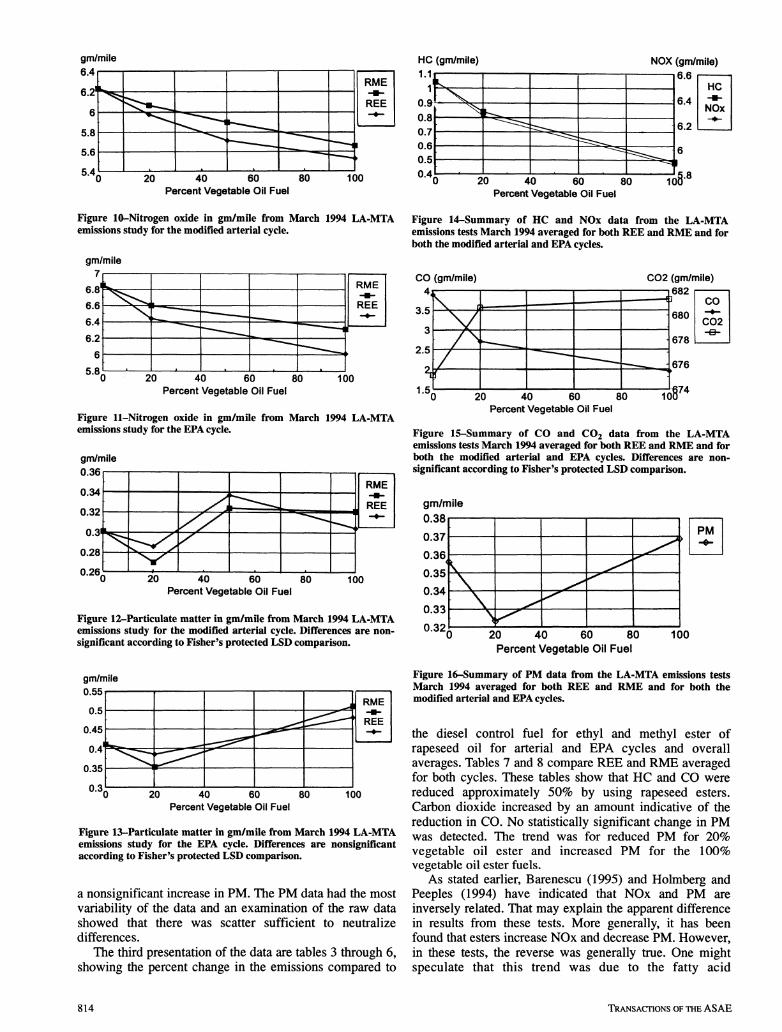
The third presentation of the data are tables 3 through 6, showing the percent change in the emissions compared to
20 40 60 80 Percent Vegetable Oil Fuel
Figure 14-Summary of HC and NOx data from the LA-MTA emissions tests March 1994 averaged for both REE and RME and for both the modified arterial and EPA cycles.
CO (gm/mile) 4
C02 (gm/mile) 682
20 40 60 80 Percent Vegetable Oil Fuel
Figure 15-Summary of CO and CO2 data from the LA-MTA emissions tests March 1994 averaged for both REE and RME and for both the modified arterial and EPA cycles. Differences are nonsignificant according to Fisher's protected LSD comparison.
gm/mile
20 40 60 80 Percent Vegetable Oil Fuel
Figure 16-Summary of PM data from the LA-MTA emissions tests March 1994 averaged for both REE and RME and for both the modified arterial and EPA cycles.
the diesel control fuel for ethyl and methyl ester of rapeseed oil for arterial and EPA cycles and overall averages. Tables 7 and 8 compare REE and RME averaged for both cycles. These tables show that HC and CO were reduced approximately 50% by using rapeseed esters. Carbon dioxide increased by an amount indicative of the reduction in CO. No statistically significant change in PM was detected. The trend was for reduced PM for 20% vegetable oil ester and increased PM for the 100% vegetable oil ester fuels.
As stated earlier, Barenescu (1995) and Holmberg and Peeples (1994) have indicated that NOx and PM are inversely related. That may explain the apparent difference in results from these tests. More generally, it has been found that esters increase NOx and decrease PM. However, in these tests, the reverse was generally true. One might speculate that this trend was due to the fatty acid
814 TRANSACTIONS OF THE AS A E
Table 3. Emissions percent increase (+) or decrease (-) for blends of REE compared to diesel control fuel arterial cycle
Volume Percent of REE in Diesel Control Fuel
50%
HC CO NOx CO2 PM
-19.7* -27.6*
-4 .1* +0.3 -5.0
-35.1* -43.7*
-8.2* +0.9
+ 12.1
* Significantly different from diesel (p < 0.05).
100%
-60.1* -47.1* -11.3* + 1.0* + 1.3
Table 6. Emissions percent increase (+) or decrease (-) for blends of RME compared to diesel control fiiel EPA cycle
Volume Percent of RME in Diesel Control Fuel
HC CO NOx CO2 PM
20% 50%
-18.0* -31.3* -4 .1* +1.6 +7.6
Significantly different from diesel (p < 0.05).
100%
-49.5* -54.0*
-7.6* +0.7
+21.2*
Table 4. Emissions percent increase (+) or decrease (-) for blends of RME compared to diesel control fiiel arterial cycle
Volume Percent of REE in Diesel Control Fuel
50%
HC CO NOx CO2 PM
-20.2* -25.3*
-2.6* 0
-10.4
-37.2* -39.1*
-5.3* + 0.7 +7.6
Significantly different from diesel (p < 0.05).
100%
-55.6* -42.2*
-9.1* +0.7* +6.8
Table 7. Emissions percent increase (+) or decrease (-) for the ethyl ester of rapeseed oil averaged for arterial and EPA cycles
compared to diesel control fuel
Volume Percent of REE in Diesel Control Fuel
50%
HC CO NOx CO2 PM
-18.0* -30.0* -4.6* +0.5 -1.3
-32.3* -45.5*
-7.9* +0.6 +1.2
Significantly different from diesel (p < 0.05).
100%
-54.6* -48.8* -11.6* +1.1 +8.0
Table 5. Emissions percent increase (+) or decrease (-) for blends of REE compared to diesel control fuel EPA cycle
Table 8. Emissions percent increase (+) or decrease (-) for the methyl ester of rapeseed oil averaged for arterial and EPA cycles
HC HC CO NOx CO2 PM
Volume Percent of REE in ]
20%
-20.2* -16.5* -34.6*
-6.5* +1.5 -0.4
50%
-37.2* -31.5* -50.0* -8.4* +0.1
+10.8
Diesel Control Fuel
100%
-55.6* -53.1* -53.2* -12.2* + 1.2
+ 17.2
HC CO NOx CO2 PM
compared to diesel control fiiel
Volume Percent of REE in Diesel Cor
20%
-18.8* -27.4*
-2.9* +0.5 -7.3
50%
-33.2* -39.4*
-5.3* +0.7 +9.7
itrol Fuel
100%
-50.3* -46.5*
-8.5* +0.7
+11.8
Significantly different from diesel (p < 0.05). Significantly different from diesel (p < 0.05).
constituents of rapeseed esters tested or that it was a characteristic of this particular engine. In either case, the result was consistent for both methyl and ethyl ester and for both cycles tested. Ethyl ester at the 100 and 50% level were lower in NOx than methyl ester.
Repeatability for HC, CO, CO2, and NOx was very good. In these experiments, setting up the test procedure was extremely critical because of the limited number of possible runs in the available time. It may have been more desirable to have replicated each fuel two or three times in succession and to have randomly replicated each fuel in time. However, as a compromise, each fuel was tested in random order and then, during one block, fuels were tested in succession. The data show that the test procedure was successful in preventing mixing of fuels and that the choice of previous fuel did not affect the emissions measured for the succeeding fuel.
CONCLUSIONS Specific conclusions of this study were as follows: • Hydrocarbon was reduced by 52.4% when 100%
vegetable oil fuel was compared to low sulfur diesel control fuel.
• Carbon monoxide was reduced by 47.6% when 100% vegetable oil fuel was compared to low sulfur diesel control fuel.
Carbon dioxide increased by 0.9% when 100% vegetable oil fuel was compared to low sulfur diesel control fuel. Nitrogen oxide was reduced by 10.0% when 100% vegetable oil fuel was compared to low sulfur diesel control fuel. Particulate matter increased by 9.9% when 100% vegetable oil fuel was compared to low sulfur diesel control fuel (however, this difference was statistically nonsignificant. Particulate matter was the lone parameter that had variations sufficient to make differences nonsignificant. The result was in harmony with the literature, which reported a tradeoff between PM and NOx). One hundred percent REE reduced HC (8.7%), CO (4.3%), and NOx (3.4%) compared to 100% RME. Absolute values of emissions data were higher for the EPA cycle than for the arterial cycle. Hydrocarbons increased from 0.57 to 0.87 g/mile; CO from 2.34 to 2.865 g/mile; CO2 from 657.8 to 703.8 g/mile; NOx from 5.88 to 6.41 g/mile, and PM from 0.305 to 0.44 g/mile. Acceptable research protocols for exhaust emissions testing should be developed and standards written that are within the reach of the budgets of the average research facility. This would bring more uniformity to test procedures used by the various
VOL. 39(3): 805-816 815
laboratories and institutions that do not have facilities necessary to meet the criteria for EPA official tests.
ACKNOWLEDGMENTS. The authors acknowledge the cooperation of Lauren Dunlap, Ray Wilson, and Harvey Porter at the LA-MTA who actually conducted the emissions tests and Craig Chase, a consultant to DOE and the PNW and Alaska Regional Bioenergy Program for his encouragement during this work and for finding the financial support. Work on this project was supported in part by the PNW and Alaska Regional Bioenergy Project, Project Number DE-B179-93BP09233, The Idaho Department of Water Resources, Energy Division, Project No. DWR92-03-81-102-6, and USDA-ARS Specific Cooperative Agreement 58-6602-2-014.
REFERENCES Alfuso, S., M. Auriemman, G. Police and M. Vittoria. 1993. The
effect of methyl-ester of rapeseed oil on combustion and emissions of DI diesel engines. SAE Technical Paper Series 932801. Warrendale, Pa.: SAE.
Barenescu, R. 1994. Engine warranty policy. In Commercialization ofBiodiesel: Establishment of Engine Warranties. Moscow, Idaho: Nat. Center for Advanced Transportation, Univ. of Idaho.
Clark, S. J., L. Wagner, M. D. Schrock and R G. Piennar. 1984. Methyl and ethyl soybean esters and renewable fuels for diesel engines. 7AOC5 61(10): 1632-1638.
Dunlap, L. S., V. Pellegrin, R. Ikeda, R. Wilson, S. Stanley and H. Porter. 1993. Chassis dynamometer emissions testing results for diesel and altemative-fueled transit buses. SAE Technical Paper Series 931783. Warrendale, Pa.: SAE.
Dunlap, L. 1994. Final report to University of Idaho for emissions testing conducted on biodiesel fueled pickup truck. Los Angeles, Calif.: Los Angeles County Metropolitan Transit Authority Emissions Testing Facility.
Energy Information Administration. 1989. Sales of Fuel Oil and Kerosene in 1989. Washington, D.C.: EDOE/EIA.
Feldman, M. 1991. Optimization of a direct injection diesel engine for operation on winter rape methyl ester. Unpub. M.S. thesis, Univ. of Idaho, Moscow.
Geyer, S. M., M. J. Jacobus and S. S. Lestz. 1984. Comparison of diesel engine performance and emissions from neat and transesterified vegetable oils. Transactions oftheASAE 27(2):375-381.
Goetz, W. 1993. Evaluation of methyl soyate/diesel blend in a DDC 6V-92TA engine: Optimization of NOx emissions. Addendum to Final Report 93-E14-21. Mississauga, Ontario, Canada: Ortech Int.
Hemmerlein, N, Volker K. and H. Richter. 1991. Performance, exhaust emissions and durability of modem diesel engines running on rapeseed oil. SAE Technical Paper No. 910848. Warrendale, Pa.: SAE.
Holmberg, W. C. and J. E. Peeples. 1994. Biodiesel, A Technology, Performance and Regulatory Overview. Jefferson City, Mo.: Nat. Soydiesel Development Board.
Huehn, W and J. E. Sauerteig. 1989. The new Deutz particulate trap system for trucks and buses. SAE Technical Paper Series No. 902075. Warrendale, Pa.: SAE.
Humke, A. L. and N. J. Barsic. 1981. Performance and emissions characteristics of a naturally aspirated diesel engine with vegetable oil fuels - Part 2. SAE Technical Paper 810955. Warrendale, Pa.: SAE.
Humphrey, J. K. and L. G. Schumacher. 1994. Review of literature related to fueling used engines with methyl ester of soybean oil. Project Report. St. Louis, Mo.: Am. Soybean Assoc.
Hunter, C. E. T. P. Gardner and C. E. Zakrajsek. 1990. Simultaneous optimization of diesel engine parameters for low emissions using Taguchi methods. SAE Tech. Paper No. 902075. Wanrendale, Pa.: SAE.
Ishii, Y. and R. Takeuchi. 1987. Transesterified curcas oil blends for farm diesel engines. Transactions ofASAE 30(3):605-609.
Liotta Jr., F. J. and D. M. Montalvo. 1992. The effect of oxygenated fuels on emissions from a modem heavy-duty diesel engine. SAE Technical Paper 932734. Warrendale, Pa.: SAE.
Manicom, B., C. Green and W. Goetz. 1993. Methyl soyate evaluation of various diesel blends in a DDC 6V-92 TA engine. Final Report No. 93-E 14-21. Mississauga. Ontario, Canada: Fosseen Manufacturing and Development, Ortech Int.
Marshall, W F. 1993. Biodiesel, Commercialization of a renewable fuel. Technical Report No. 1 prepared for the U.S. DOE and NSDB. Bartlesville, Okla.: Nat. Inst, for Petroleum and Energy Research.
Mills, G. A. and A. G. Howard. 1983. Preliminary investigation of polynuclear aromatic hydrocarbon emissions from a diesel engine operating on vegetable oil-based altemative fuels.
Mittelbach, M., P. Tritthart and H. Junek. 1985. Diesel fuel derived from vegetable oils. II: Emission tests using rape oil methyl ester. Energy in Agriculture 4:207-215.
Mittelbach, M. and P. Tritthart. 1988. Diesel fuel derived from vegetable oils. II. Emission tests using methyl esters of used frying oil. JAOCS 65(7): 1185-1187.
Muryama, T, Y.-T. Oh, N. Miyamoto, T. Chikahisa, N. Takagi and K. Itow. 1984. Low carbon flower buildup, low smoke and efficient diesel operation with vegetable oils by conversion to mono-esters and blending with diesel oil or alcohols. SAE Technical Paper 841161. Warrendale, Pa.: SAE.
Reece, D. L. and C. L. Peterson. 1993. A report on the Idaho on-road vehicle test with RME and neat rapeseed oil as an altemative to diesel fuel. ASAE Paper No. 93-5018. St. Joseph, Mich.: ASAE.
Sholl, K. W and S. C. Sorenson. 1993. Combustion of soybean oil methyl ester in a direct injection diesel engine. SAE Technical Paper 930934. Warrendale, Pa.: SAE.
Schumacher, L. G., S. C. Borgelt, W. G. Hines, C. Spurling, J. K. Humphrey and J. Fink. 1993. Fueling diesel engines with esterified soybean oil - Project update. ASAE Paper No. MC93-101. St. Joseph, Mich.: ASAE.
Schumacher, L. G., W G. Hines and S. C. Borgelt. 1994. Fueling diesel engine with methyl-ester of soybean oil. Columbia, Mo.: Dept. of Agricultural Engineering, Univ. of Missouri.
Stansvaag, J.-M. and C N. Oren. 1993. Clean Air Act: Law and Practice.
Vander Griend, L., M. Feldman and C. L. Peterson. 1990. Modeling combustion of altemate fuels in a DI diesel engine using KIVA. Transactions oftheASAE 33(2):342-350.
Wagner, L. E., S. J. Clark and M. D. Schrock. 1985. Effects of soybean oil ester on the performance, lubricating oil and wear of diesel engines. SAE Technical Paper 841385. Warrendale, Pa.: SAE.
Xiao, Y. 1993. Report. Jefferson City, Mo.: Nat. SoyDiesel Development Board.
Zhang, Q., M. Feldman and C. L. Peterson. 1988. Diesel engine durability when fueled with methyl ester of winter rapeseed oil. ASAE Paper No. 88-1562. St. Joseph, Mich.: ASAE.
Zubik, J., S. C. Sorenson and C. E. Goering. 1984. Diesel engine combustion of sunflower oil fuels. Transactions oftheASAE 27(5): 1252-1256.
816 TRANSACTIONS OF THE ASAE