Embed Size (px)
Citation preview
,'"
.
International Symposium
TowardsZeroEmissionsThe Challengefor Hydrocarbons
ROME (Italy)March 11-13, 1999
~
Reproduced with pennission from Eni!~.~~~
Symposium Proceedings
-~ ElnuTeclnol<ogieGROUP
,"--"-"o.""-~--"~~'--
~
.International Symposium
' ""'--"-~f Towards Zero Emissions
t The Challenge for Hydrocarbons1 j
I; I
i ii
!1 j,. I ~'" 'r" ',C\\ "y."".~ ,"--" ."i) C';' l..1 I .0 ,:I*,~: J :t; ~ U 'I b I -:;j ~: ~ ~~ i """ci:~, "iJ'!,,;, " ,:;,_coo
.f. l-~...,...,---,,--, :_~, I
The limited availability of natural resources, a still rapidly rising worldpopulation combined with overall economic growth will be stretching theEarth's carrying capacity beyond its limit, unless a suitable strategy is set inplace. This scenario renders the concept of Zero Emissions all the more relevant,
, stressing as it does that the problem of environmental pollution cannot be
; effectively solved simply by reducing the production of wastes.
In practical terms Zero Emissions can be conceived along similar lines to alreadyestablish corporate programs aiming to achieve zero accidents. Although no one
; claims that accidents are never going to occur, unless a clear objective isestablished, systems will not evolve in that direction.
The target of Zero Emissions is therefore to move towards achieving the highestpossible level of material productivity and energy efficiency.
Considering how the hydrocarbon industry could become ever more engaged inapplying the concept of Zero Emissions, and what in practice this means, cantherefore play an important role in defining an appropriate innovation policy,and promoting long term corporate competitiveness. .
!
I
V)
! .
0,-
,
Under the Patronage of~ ~ , ~-,-
the Italian Prime Minister
the Ministry of Foreign Mairs
the Ministry of University and Scientific and Technological Research (MURST)
the Ministry of Environment
the Municipality of Rome, Environmental and Agricultural Policiesthe United Nations University/IAS
Italian Association for Industrial Research (AIRI)
, "f vc JI'"! (1' '~.\J
) JI.J';JlJOJ ~ili! ~n!
""'f l Jl'rri "-1: \ r~(r ') ' ;' 'I]"" L\.~I, .1, .!j,j ..1.) "
,"" " ! "'-,.m ' I"" ! ';J"' ( ' l o f ' ('- r r I O" !",""'r.)y\;- "o'!."'~jl'\J,j\.,,
8
-
..
.I: ..; Steerl ng Com m Ittee
.~ ~ , ---~ .~ ~ ,, I
Sergio Carra (Politecnico di Milano, Italy)
Pierre Castillon (Elf Aquitaine, France)
, Umberto Colombo, Chairman (Fondazione Eni Enrico Mattei, Italy)
,Fabrizio d'Adda (Eni, Italy)
Tarcisio Della Senta (The United Nations University I lAS, Japan)
Peter Eyerer (Fraunhofer Institut fur Chemische Technologie, Germany)
Paolo Maria Fasella (MURST, Italy)
Richard L. Florida (Carnegie Mellon University, U.S.A.)
Franco Forlani, Secretary (EniTecnologie, Italy)
Carl-Goran Heden (The Biofocus Foundation, Sweden)
Keto Mshigeni (University of Namibia, Namibia)
, Eiji Nakanishi (Osaka Gas Co. Ltd., Japan)
Gunter Pauli (ZERI Foundation, Switzerland)
Renato Ugo (AIRI, Italy)
Francesco Zofrea (EniTecnologie, Italy)
0-
, "-
.!
i')';:i';'i :r j CONTENTS
,,)!:Ic;t ~\ OPE:\'ING SESSIO:\'
,'d 98i;q Chairman: Umberto Colombo -Fondazione Eni Enrico !\i[arrei, [ra(l'',£;;) 1, liO
'(S:!\.II10"". ,~ ~ \\ Opening Speech page IUmberto Colombo -Fondazione Eni Enrico fv[arrei. [ra(v
:1UJAv .?T:)l!(j.OR'i ail.) Y; Welcome and Presentation page 3
Guglielmo Moscato -Chairman of Eni, Italy"i" J' !""'~",", -J¥,-'f].J,"Why a Symposium on Zero Emissions page 9
1I)'l:Irn",';) :rJi\~1.lj~l!~\ ,j\i)l\:'~--" in Hydrocarbon Industry?""!'l)!ti",,;j l":)l\!);ij1ri;:!\\ ,t\Cf\,rI,..,;1-". .Francesco Zofrea -Chairman of EniTecnologie, fra(v
:;, ~;:".~ ~9.!~(,j'j(;i~ KEYNOTE ADDRESSES
"The Zero Emission Revolution" page \3Richard L Florida -Carnegie Mellon University. U.S.A.
;-8 ,;,~$q""t~, "Towards Zero Emissions in the Hydrocarbon Industry" page \6
Bernard J. Bulkin -BP Amoco Corp.. U.K.
:\, ~~j':'i "Towards Zero Emissions: Automotive and Environment" page 2\
Paolo Scolari -FIAT Auro. Italyr,~~'
"Zero Emissions Perspectives: page 37\iJ; ~f!;(;q "i!il1,l:}~~ I, Research, Projects and Business Initiatives"
Gunter Pauli -ZERI Foundation, SLvirzerland".\.~\\ .t.;!\\"J1\ 9In~\dmi1\
RESOURCE~IANAGEMENT\"!; ~tq Chairman: Sergio Carra -Politecnico di /\Ililano. Italy
'(i:..!l if\!)E~l\o(l.;) "Towards Zero Emissions in Exploration and Production" page-!l
Pierre Castillon -Elf Aquiraine. France
~'A' J;~f;(j "m$1i1v;; ."Oil Refineries and Biore~neries as Agents" page -!6
for Change towards Sustainable DevelopmentCarl-Goran Heden -The Biofocus Foundation. SLvedenJanis Gravitis -United Nations University, Japan
." , "Feasible Industrial Zero Emissions Systems page 53:'it",. \..f'~. for Resource Recovery and Energy Production"
ifJ:;!f Hiroyuki Fujimura -EBARA Corporation, Japan,
U PSTREAI'.'l
Co-chairman: Ferruccio Trifin) -University of Bolognp, [ta(v
';!'l~q "Subsurface Srorage of CO,: page 5;"Current Initiatives and Future Potential"Niels Peter Christensen -GEUS, Denmark
8
.
~'.:~
"Improvement through Innovation: page 61from Gushers to Zero Emission"Giuseppe Libri -ENI-Diu. AGIP. Italy
"Towards Zero Emissions: page 65the Offshore Challenge for Oil & Gas"Peter A. Read -Kuaerner Oil & Gas. Norway
1\1AKING MOST OF ENERGY A""D PRODUCTS VALUEFROM H\'DROCARBONS
DOWNSTREAM FOR FUELS, CHEMICALSAND MATERlAlSChairman: Peter Eyerer -Fraunhofer InstitutelIC1; GermanyCo-chairman: Thomas Hirth -Fraunhofer InstitutellC1; Germany
"Optimising Hydrotreating Technologies page 72for Environmental Protection"Edouard Freund -IFP; France
"Biotechnology from Crude page 85to Fuel Processing: Facts and Perspectives"Andrea Robertiello -EniTecnologie. Italy
"Can Biomass Replace Oil Fuels page 95and Petrochemicals?"Janis Gravitis -United Nations University. Japan
"life Cycle Assessment Methodology and Applications" page 107
Paolo Frankl -INSEAD. FranceMartin Menard -IstitU1O di Ricerche Ambiente Italia. Italy
"The Polymer Industry Contribution page 117to Zero Emissions"Paolo Cortesi -EniChemllstituto G. Donegani. ItalyUgo Romano -EniChem. Italy
"Biodegradable Polymers page 126in an Integrated Waste Management System"Catia Bastion -Nouamont. Italy
;; '}fii UTlUSATlON~ Co-chairman: Konrad Saur -PE Product Engineering GmbH, Germany
"Energy Vectors and Zero Wastes page 137, by Integrated Management of Municipal Solid Waste"
, , Ezio D'Addario -EniTecnologie. Italy"'., c,''...'" ."~, ..
:f !f,l-i "Automotive Fuel Cell Technologies: pagt: 147Threats and Opportunities for the Oil Industry"W. Peter Teagan -Arthur D. Little. U.S.A.
.-~-~"C~-~---" "
~
"
'"!)i
"Future Energies and Advanced Vehicles page 153Towards the 21st Century"Noboru Sato -Honda. Japan
"The Sustainab!eUse of Hydrocarbons to Approach page 166the Zero Emission Target for Mobility Applications"Konrad Saur -PE Product Engineering GmbH. GermanyPeter Eyerer -Fraunhofer InstitutllC7; Germany -
Marc-Andree Wolf -Fraunhofer InstitutllC7; GermanyJorg Woidasky -Fraunhofer InstitutllC7; Germany -
"The Evolurion of Electric Power Generation page 193towards Higher Efficiency and Zero Emissions"Giandomenico Testi and H. Markus Bayegan -ABB
"To~vards Zero Emissions for Coal: page 212Roles for Inorganic ~1embranes"Robert H. Williams -Princeton University. U.S.A.
THE FUTURE OF ZERO EMISSIONS
Chairman: Renato Ugo -AIRI, ItalyCo-chairman: Keto Mshigeni -University of Namibia. iVamibia
"Chemical Industry Reduces Emissions: page 2-13from Production to the Consumer"Herbert Hugl- Bayer; Germany
"Abundant Fossil Resources page 2-17and Zero Emissions: lViutually Exclusiveor New Business Opportunities?"
Hans-Holger Rogner -£4£4. Austria
"Towards Zero Emissions: page 256the Challenge of Governments"Corrado Clini -Nlinistry of Environment, Italy
ROUNDTABLE page 266
Participants:Renato Ugo (Chairman)Pierre CastillonRichard L FloridaHiroyuki FujimuraGunter PauliHans-Holger RognerPaolo Scolari
CLOSING SESSION,"Natural Gas: a Bridge to Future Energy Sources" page 283Giuseppe Santamaria Amato -Eni,ltaly
,Closing Remarks page 286Pierre Valette -EU DG ,'(II. Belgium
18---~---
.~~ ,-,~
,..., International Symposium
, i'1:~..!; « .To\vards Zero Emissions~ The Challenge for Hydrocarbons
.
IITOWARD ZERO EMISSIONS FOR COAL:ROLES FOR INORGANIC MEMBRANES"
Robert H. WILLIAMSPrinceton University, U.S.A.
There are good prospects that advanced inorganic membrane technologies will make it feasibleto produce hydrogen (H2) from coal, typically at a cost lower than the cost of making H2 fromany other feedstock. Such a development, considered together with: (i) growing concerns aboutair pollution and climate change, (ii) parallel technological developments relating to fuel cellsfor transportation, and (iii) the growing scientific confidence that opportunities forunderground storage of carbon dioxide (CO2) are vast, have profound implications for energy,environmental, and climate change policy worldwide. As will be argued here. these factorsconsidered together provide a good basis for thinking that Hz derived from abundant sourcesof coal could come to play major roles as an energy carrier for both transportation andstationary power generation with near-zero emissions of both air pollutants and greenhousegases. This outlook indicates the importance of pursuing research and development activitiesaimed at bringing this advanced H2 production and related systems technologies to market.
Advanced membrane technologies would probably make it possible to reduce substantially thecapital cost of making H2 from any carbonaceous feedstock and to transform the conversionprocess from one that requires substantial external electricity inputs into one that producessignificant quantities of byproduct electricity. These improvements in conversion technologywill tend to make feedstock costs more prominent in the overall H2 production economics andto favor low-cost feedstocks such as coal.
This paper explores these issues. It begins by highlighting relative cost trends for coal andnatural gas. It then turns to a discussion of air pollution and climate concerns as drivers in aquest for zero or near zero emission technologies for fossil energy conversion. This is followedby discussions of the prospects: (i) for achieving zero or near zero air pollution emissions intransportation using H2 fuel cell vehicles, and (ii) for extending the zero or near zero emissiontechnology quest to CO2 emissions as well. The latter involves showing that the cost of disposalin geological reservoirs is modest for the COz generated as a byproduct of Hz production. and
i then discussing why scientists are beginning to believe that the potential for secure COz,." sequestration in such reservoirs is vast. Then calculations are presented showing the potential~~~ for producing Hz at low cost from coal using advanced ceramic membranes. And finally, it is'!( pointed out that there are several alternative advanced inorganic membrane technologies
offering reason{lbly good prospects for making H2 at low cost that warrant intensive R&D aimedat their commercialization.
e
--~'~j .
# International Symposium..Towards Zero Emissions
lflO ~'The Challenge for Hydrncarbonsen
Trends in Coal and Natural Gas Prices.Subsrantial productivity gains are being made in the coal industry, as illustrated for coalproduced in both United States (see figure 1) and Australia (see figure 2). Such gains can beexpected in other regions as well, after ongoing energy-sector market reforms are put into placearound the world. The impact of such productivity gains on coal prices in relation to natural gasprices for electric generators in the United States is illustrated in figure 3, which shows that theaverage coal price has fallen in real terms by a factor of two since the early 1980s. Over the nexttwo decades a 20% rise in the price of natural gas and a further 30% drop in the price of coal areexpected (EIA, 1998a), leading to a price ratio that grows to 31/2 from 2 today. As will be shown,this feedstock price advantage for coal might make it feasible with advanced membrane
\ technologies to produce H2 from coal at a cost that is comparable to the natural gas price. Thisprospect together with considerations of the global abundance of coal resources compared toconventional oil and gas resources (IPCC, 1996) and of demand factors favoring theintroduction of H2 as an energy carrier, could change the outlook for coal, transforming it fromits present status as a dirty energy source, the use of which countries evolve away from as theydevelop (most growth in the demand for coal at present is expected to be in China -see table1), into an attractive option for providing abundant clean energy.
A Zero Emissions Imperative?The risk of climate change is generally regarded as the most daunting challenge posed byburning fossil fuels and is leading to growing interest in advancing various zero or near-zerogreenhouse gas-emitting energy technologies (PCAST Energy R&D Panel, 1997; PCAST ICERD3Panel, 1999). Recent scientific findings relating to the health impacts of air pollution suggestthat health impacts of air pollution might also be serious enough to warrant a quest for zero ornear-zero emissions technology for air pollutants as well.
The health impacts of uncontrolled pollution emissions from fuel burning in developingcountries is probably the most pressing environmental problem the world faces today, and coalis responsible for much of these air pollution damages. Consider China. There coal, the dirtiestfossil fuel, is widely used and its use is expected to grow rapidly in the decades immediatelyahead (see table 1), and effective pollution controls are not in wide use. A recent World Bankstudy (World Bank, 1997) assessing the costs of local/regional air pollution damages in China(mainly from coal) estimated total costs to be about $ 48 billion in 1995 (7% of GDP), includingimpacts of acid deposition as well as health effects from outdoor and indoor air pollution. Thestudy found that the dominant cost was associated with the health impacts of air pollution onurban residents, some $ 32 billion in 1995 (5% of GDP). Moreover, the Bank projected thatunder "business-as-usual" conditions (with a 2.7-fold increase in coal consumption, 1995-2020) health damages to urban residents would increase to $ 98 billion by 2020, at currentincome levels, or $ 390 billion (13% of GDP) with adjustment for growth in income. (Theestimated cost of health impacts increases with income because the World Bank estimatedcosts on the basis of the "willingness to pay" principle). If these costs were assigned to the fuelsthat cause the damage, the costs per GJ of fuel would tend to be greater than the market fuelprices. The health damage cost estimates are so high by 2020 that the value of carbon fromfossil fuel consumption in China in 2020 (when CO2 emissions from fossil fuel burning areexpected to be 1.9 GtC, compared to 0.7 GtC in 1996) would have to be -$ 200/tC for climatechange to be as important in strictly economic terms as the health impacts of air pollution onurban residents.
0
~!,;;k:1;'
"",!, ~ Inlernational Symposium.'i,,: ';im;~i «" Towards Zero Emissions
,!",JJ"" ~'-" The(:h,ulel1gefl1rl-lydrocarbons
Estimated health damage costs for China are high in large part because of the relatively low levelsof pollution control. However, even in countries with relatively high levels of pollution control,health damage costs can be high. Recent studies carried out for the ExternE Program of theEuropean Commission aimed at quantifying the external social costs of pollution under typicalEuropean conditions found that these costs are dominated by health impacts and estimated thatthe costs of health impacts due to fine particle air pollution are especially high [Rabl and Dreicer(1999); Spadaro and Rabl (1998); Spadaro et al. (1998)]. In these studies both median estimates ofcosts and geometric standard deviations were developed. For aggregated morbidity andmortality, a geometric standard deviation of about 4 was found in these studies, so that the 68%confidence interval for costs is the range 1/4 to 4 times the median cost (Rabl and Spadaro, 1999).These economic calculations reflect recent epidemiological studies indicating that: (i) seriouschronic health effects (especially life-shortening) are strongly correlated with fine particles (PM2.:;particles, with diameters less than 2.5 microns) in the air which can penetrate deeply into thelungs, and (ii) the dose-response functions for health impacts are approximately linear, with noevidence of a threshold (Pope et al., 1995; Wilson and Spengler, 1996). Most fine particle airpollution is caused by fossil fuel burning -both direct emissions of fine particles and sulfate andnitrate particles formed in the atmosphere from gaseous emissions of SO:! and NOx. The lattertend to dominate estimated health costs for power plants, while direct fine particle emissionstend to dominate health impacts of automobiles, especially in urban areas.
For coal power plants equipped with best-available pollution control technologies and variouspower plant sittings, the median estimate of the health impacts cost has been estimated to becomparable to or greater than the direct cost of electricity production (compare tables 2 and 3).Most of the high cost is associated with chronic life shortening from long-term exposure to fineparticulates. Even though the life-shortening is typically only a few months, the exposedpopulation is large (because fine particles can often be transported long distances from wherethey are emitted), and, in high-income countries, the "willingness to pay" to avoid such healthdamages is high. The economic significance of the estimated health impacts costs presented intable 2 can be appreciated by supposing that the economic cost of climate change is the sameand deriving from this assumption the price of avoided CO:! emissions that would bring about
': this equality. For the typical power plant siting case shown in table 2, the cost of avoided CO2;, emissions for typical new steam-electric plants would have to be about $ 200/tC to make
climate change an issue of economic importance equal to that for air pollution emissions.Similarly, very high equivalent avoided CO2 emissions costs are associated with the findings ofthese ExtremE studies for automotive air pollution'. Of course, these cost estimates are specificto European conditions. In general, costs would vary with the size of the exposed populations(e.g., costs would be lower in regions with lower population densities); moreover, the"willingness to pay", and hence health cost levels, increase with per capita income levels.The persistence of high estimated health impacts costs even for plants in Europe with substantialpollution controls in place arises because there appears to be no threshold below which thepollution levels are safe, and because reductions in emissions achieved via the use of pollutioncontrol equipment can be more than offset by the combined effects of the increased pollution
1 for g"solil1e internal combustiol1 ~ngine car,; e4uipp~d with :!-way c'llmytic col1v~rt~rs. th~ medi,," estimate of th~ he,uth impacts cost has be~nestimated ro b~ -60 Ct/lir~r or gasolin~ tor urban Paris driving (av~rag~ ~xposed population density -7.500/km') and -:{() Ct/lit~r tor inter-urban
"1 r driving (I'uris ro Lyon trip. with average ~XPO$ed pnpulalion d~nsity -400/km') (Spadaro and Rabl. 1998; Spadilro et al.. 1 998)-cl1$l$ rhilt ar~ gr~at~r., " than rerilil gilsolin~ pric~s (~xcluding r~tail ra.'(e,;); in th~s~ cas~,;. the vmue of CO, ~mi$$ions avoided would hav~ to b~ about $ ~)()()/tC and S 4(}()/t(:
i;<~ for llrban and rural driv~ng cl1nditions. respecti\"~ly. to milke climate change an i,;sue of e4ual econo.nic imporlanc~ to health impact,;.
0--
-~--'[:,;;," ,. " .. m...' : Inlemallonal Symposium
~.ftoi?~ifTt ' ..Towards Zero Emissions
"""'!j ~ The Challenge for Hydrocarbons
arising from increased energy consumption levels and an increased "willingness to pay" foravoiding pollution damages as incomes rise. As a result, the challenge of meeting air-quality goalsby continually ratcheting up the required levels of end-of-pipe controls becomes very costly. Thisapproach is costly in part because the cost of reducing emissions by the next increment, tends toincrease sharply with the level of emissions reduction. In addition, the continual technologicalchange required to keep up with changing regulatory goals can be very costly when there is notenough time between regulatory changes to recover the cost for the last incremental improvementbefore the next incremental improvement must be made. To illustrate the dimensions of thechallenge of addressing air-quality goals as economies evolve, consider a simple model of ahypothetical "average" developing country that evolves from its "1990 state" in which per capitaGDP is $ 2,300 (1990 $, PPP basis-the average for all developing countries in 1990) and there areno air pollutant emission controls in place, to a future state where per capita GDP is 7.2-fold higher,or $ 16,400, the average for OECD countries in 1990. (This could be realized in 100 years with asustained per capita GDP growth rate of 2% per year). Suppose also that in this period per capita'consumption of coal plus oil also increases 7.3-fold, from the actual average level in 1990 fordeveloping countries to the 1990 level for ,OECD countries. And suppose, for simplicity, thatwithout controls, pollutant emissions increase in proportion to coal plus oil consumption levels.Without pollution controls and taking into account an expected doubling of population in thisperiod, health damage costs would increase about 100-fold (2 x 7.2 x 7.3) in this period (assuming,as economists do, that the "willingness to pay" to avoid pollution damages increases in proportionto per capita GDP). Thus end-of-pipe controls that reduce emissions by 100*(1 -1/100) = 99%would be required to keep damage costs in dollar terms to a level no greater than in 1990.
The apparent linearity of the dose-response relationship for small particle air pollution and thepractical difficulties of achieving high levels of pollution emissions control via the use of end-of-pipe control approaches and continual ratchetingup of levels of mandatory controls in theregulatory process highlight the importance of giving serious attention to the alternative ofpursuing entirely new technologies that are characterized by zero or near-zero emissions.
Progress Toward Zero Air Pollutant Emissions in Transportation.Recognizing the value of a zero emission vehicle (ZEV) technology-forcing policy as a strategyfor meeting its air quality goals, the State of California has a policy mandating that 10% of allnew cars sold in the State must be ZEVs by the year 2003. Initially, this policy focused on thebattery-powered electric car as the zero-emission technology that would be deployed to meetthis policy objective. Although efforts to develop this ZEV technology have led to somesignificant advances (e.g., in electric drive-train technology), the battery-powered electric car isno longer the central focus of ZEV developmental efforts, because the technological challengesof overcoming the problems of long battery recharging times, modest vehicle ranges betweenrecharging, and high costs have proved to be formidable.
But the California ZEV mandate has been catalytic in stimulating industrial interest in the fuelcell car as an alternative technology that offers good prospects for addressing effectively all theshortcomings of the battery- powered ZEV and that might eventually become fully competitivewith the gasoline-powered internal combustion engine car (Steinbugler and Williams, 1998).
The fuel cell-gowered car has become one of the leading contenders for next-generation cars.Intensive efforts are underway in the automotive industry worldwide to develop fuel cell-
O"
-
Ii International Symposium...'~ " Towards Zero Emissions
::;;~~ ~~ The Challenge for Hydrocarbons
powered automobiles; several automakers have set goals to introduce this technology into theautomotive market in the period 2004-2010. The successful development and commercializationof the fuel cell car could eventually lead to its becoming a lEv; because the fuel cell engine"prefers" to be fueled with Hz, and the only byproduct of operating a Hz fuel cell car is water vapor.
With Hz fueling, the fuel cost per km for a fuel cell car would typically be less than for a gasolineinternal combustion engine car of comparable performance. Although the Hz might be morecostly per unit of energy than gasoline or Diesel fuel -even when using the least-costlycommercial Hz production technology (Hz derived from natural gas) -the fuel cost per kmwould typically be less for the fuel cell car, because the Hz fuel cell car would be 2.5 to 3 timesmore fuel efficient than a conventional gasoline internal combustion engine car of comparableperformance. This efficiency gain arises because, while the efficiency of a internal combustionengine declines with decreasing load [so that the efficiency of driving a car, averaged over alldriving conditions, is modest (- 15%»), the efficiency of a fuel cell increases as the loaddecreases [so that the efficiency at average part-load conditions is high (- 50%)].
Because a Hz fuel infrastructure is not in place and because a new liquid fuel such as methanolcan be introduced more easily than a gaseous fuel such as Hz, the fuel cell car may well beintroduced using methanol or a liquid hydrocarbon fuel that is converted onboard the car into aHz-rich gaseous fuel the fuel cell can utilize. However, ultimately, if fuel cell cars are successfullylaunched in the market, an internal market dynamic would assist a shift to Hz fueling, because Hzfuel cell cars will be easier to maintain and less costly to own and operate than liquid-fueled fuelcell cars that require the use of onboard fuel processors (Steinbugler and Williams, 1998).
The strongest competitor for the fuel cell car is likely to be a hybrid internal combustionengine/battery car, which is also capable of high fuel economy, and which, like a fuel cell car,would have an electric drive train. It is too early in the development process to predict thewinner in this competition on the basis of estimated direct economic costs for mass-producedvehicles. However, if relative pollutant emission characteristics prove to be a majordeterminant, the Hz fuel cell car, a true zero-emission vehicle, could emerge the winner,thereby providing the technological basis for wide use of Hz in the transport sector.
Toward Zero COz Emissions from the Transport Sector.If the fuel cell car were successfully launched in the market, it would make possible not onlynear-zero emissions of air pollutants, but also, at relatively low incremental cost, near-zerolife cycle emissions of COz emissions from the Hz production system.
This prospect arises from the fact that when Hz is produced from a carbonaceous feedstock astream of nearly pure COz can be produced as a byproduct-virtually "free". In a world whereclimate change is not a significant concern this COz would probably be vented to the
2 Health costs of air pollutants from hybrids might be significant even with stringent controls. Consider the compression-ignition. direct-injectioninternal combustion engine/electric hybrid vehicle-the leading competitor tn the fuel cell vehicle in the race to develop the .car of the future" underthe Partnership for a New Generation of Vehicles (P~GV). a US government/industry-sponsored competition to develop 80 mpg (34 km/liter) cars by2001 (NRC. 1998).. Suppose such hybrid vehicles are developed and can meet ~he most stringent emissions requirements in the US-the Super-Ultra-Low- Emission Vehicle (SULEV) standard for a rising fraction of vehicles sold in California after 2003.. Considering only NOx and PM.. SULEV standards(O..012 and 0.006 gr/km. respectively). assuming that 86% of PM.. emissions are from PM" particles. and valuing health impacts for NOx and PM"emissions following Spadaro and Rabl (1998), the median estimate of the health cost would be 1..5 Q:/km (50 t/titer of Diesel fuel) for urban drivingand 0.13 (/km (4.5 Q:/liter) for rural driving; the corresponding value ofCa, emissions avoided \vould have to be about S 700/tC and $ GO/tC. to makeclimate change an issue of equal economic importance to health impacts. for urban and rural driving conditions, respectively..
0
.#'f International SymposiumC:i Towards Zero Emissions~' The Challenge for Hydrocarbons
mosphere. But in a C02-emissions-constrained world, consideration might be given toquestering this separated CO2 (e.g., in an appropriate geological storage reservoir).the fuel cell car powered by Hz produced from a fossil fuel with venting of the byproduct CO2ere to become the least -costly means of providing automotive services (e.g., if the H2 fuel cell carlder these conditions were fully competitive with gasoline internal combustion engine cars onlifecycle cost as well as on a fuel cost per krn basis), the cost of avoiding CO2 emissions to the:mosphere would approach the cost of CO2 disposal, when costs are measured on a $/tC basis.litially, H2 is likely to be introduced as an energy carrier for transportation by producing it fromatural gas at refueling stations for fuel cell vehicles (Ogden et al., 1998). For such configurationsIe cost of CO2 disposal would be prohibitively large, because the costs for the small pipes that,ould be required for transporting COz from refueling stations to disposal sites would be very high.Iowever, as a H2 infrastructure grows, it would become feasible over time to expand ~ production:) centralized facilities from which H2 would be transported by pipelines to refueling stations.
)ne way that a shift to centralized Hz production for fuel cell vehicles might take place is in:onjunction with the introduction of H2 manufacture for central-station power generation. A;trategy for producing Hz from coal for use in large (- 800 MWe) central-station power plants isjescribed below (see Applications of the Ceramic HSD to Central-Station Power Generation).fhese power plants might be appropriate sites for producing the extra H2 needed for supportingfuel cell cars that are used in the vicinity. Assuming that the number of cars supported by apower plant is determined by the average ratio of driving to electricity generation in the UnitedStates (1.0 krn per kWh), enough extra H2 would be produced at each 800 Mwe power plant tosupport about 340,000 cars in its vicinity -a number that would require increasing H2 productionabout 12% beyond what is required to meet the H2 needs for the power station3.When Hz is manufactured from coal at such large scales, the byproduct COz is generated at sucha high rate (- 800 tonnes per hour) that CO2 disposal costs become relatively modest, as isillustrated by the calculation presented in Table 44. There costs are presented for compressingthe COz byproduct of Hz production from near atmospheric pressure to a supercritical state at110 bar, for transporting the CO2 by pipeline up to 500 krn to a disposal site, and for injectingthe COz into a deep saline aquifer where it is sequestered. The cost of disposing of COz inaquifers 500 krn from the CO2 generation site might turn out to be a reasonable estimate of aceiling cost for CO2 disposal, at least for the United States, because all thermal power plants inthe United States are within 500 krn of a geological disposal site (US DOE, 1999)5, and because
3 The Hz production level needed to suppon 340.000 fuel cell cars at each 800 MW power plant is about 5 PI per year. assuming that fuel cell cars aredriven 18,000 kin per year (the average amount of driving for light-duly vehicles in the United States) and consume H, at a rate of2.22 liters of gasoline-equivalent fuel per 100 kin (106 miles per gallon of gasoline-equivalent fuel)-an estimated fuel consumption rate for H, fuel cell cars that is consistentwith the load characteristics and performance requirements of cars being developed in the United States under the Pannership for a New Generation ofVehicles (Ogden et aI., 1998). For comparison. the annual Hz requirements for fueling an 800 MWe power plant would be 40 PI/year (see table 7).
manufacture of Hz from coal for central-station power applications. Imagine that at 1996 activily levels, all coal-fired power plants in the United States wereconvened to Hz. that extra Hz was produced at these power plants to suppon fuel cell cars at a rate of 1 kin per kWh, and that the Co, generated as abyproduct of producing Hz from coal was sequestered. Under these conditions. about half of the US fleet of light-duly vehicles would have been supponedwith coal-derived Hz, US Co, emissions would have been 40% less. US oil use would have been 20% less, and US coal use would have been 7.5% more.
4 The calculations presented in table 4 are for a CO, removal rate of706 tonnes/hour, a value appropriate for a H, production facility providing fuelfor a 800 MW combined cycle power plant that uses a Frame 7H gas turbine (see table 7). If enough extra H, were also produced at the facility tosupport a fleet of 340,000 fuel cell cars. the CO, removal rate would be increased to about 800 tonnes per hour. and the costs of Co, disposal wouldbe 3-4% less per ton of Co, than indicated in table 4, as a result of scale economies for CO, pipeline transport.
5 Of course, not every reservoir will be suitable for disposal of large quantities of CO,. so that transport distances longer than 500 km mightultimately be needed for some H, production plants. However. the incremental cost for transpon to a more remote but more favorable disposal sitewould be modest, because of the scale economies achievable with large pipes. For example, if transpon beyond 500 kin were via pipes that combinethe output of 10 H, producti.9n plants each generating about 5 Ylt Co, per year, the incremental cost per 100 km would be $ 3.1 per tC for onshorepiping or $ 2.3 per tC for offshore piping (see table 4).
0
-
~"'" International Symposium. ..;1" Towards Zero EmIssIons~~~ The Challenge For Hydrocarbons
deep aquifer disposal will tend to be the most costly option for disposal. [Unlike the alternativegeological disposal options (depleted oil or gas fields or deep beds of un mixable coal), disposalin deep saline aquifers does not provide the opportunity for enhanced oil or natural gasrecovery to help defray COz disposal costs.} The calculation presented in table 4 for disposal at500 km thus suggests that the ceiling cost for COz disposal might well be about $ 50 per tC. Ifthe Hz produced without COz sequestration could competitively support a fleet of fuel cell cars,a carbon tax of this magnitude would induce the Hz producer to sequester the separated CO2.Such a carbon tax would increase the gasoline price faced by competing gasoline internalcombustion engine cars by about $ 0.03 per liter.
This calculation suggests that fuel cell cars could be operated on fossil fuel-derived Hz with nearzero air pollutant and greenhouse gas emissions, with only a modest cost penalty foreliminating greenhouse gas emissions. The calculation is for the case where Hz fuel cell cars(without COz sequestration) are fully competitive with gasoline internal combustion enginecars. At present, fuel cell cars are not competitive, so that the cost of COz emissions avoided byshifting to fuel cell cars would be far greater than the COz disposal cost. Bringing the avoidedCO2 emissions cost down to the COz disposal cost level requires launching fuel cell technologyin automotive markets in a sufficiently large number of cars that the technology's cost can be"bought down" to levels where fuel cell cars can compete with gasoline internal combustionengine cars6. Also, of course, geological storage capacities must be adequate to make such astrategy for reducing greenhouse gas emissions viable at large scale.
The Outlook for CO2 Disposal.Although the deep ocean is the most-discussed option for COz disposal (Herzog et al., 1997),much more research is needed to better understand the security of various ocean disposalschemes and their environmental impacts (Turkenburg, 1992). In recent years increasingattention has been given to geological (underground) storage of COz: in depleted oil andnatural gas fields (including storage in conjunction with enhanced oil and natural gasrecovery), in deep coal beds [in conjunction with coal bed methane (CBM) recovery), and indeep saline aquifers.
In the near term, COz injection for enhanced oil recovery (Blunt et al., 1993), for natural gasrecovery (Blok et al., 1997), and for enhanced methane recovery from deep coal beds (Byrer andGuthrie, 1998; Gunter et al., 1997; Stevens et al., 1999; Williams, 1999) might become foci ofinitial efforts to sequester CO2 in profitable ways.
Sequestration in depleted oil and gas fields is generally thought to be a secure option if theoriginal reservoir pressure is not exceeded (van der Burgt et al., 1992; Summerfield et al., 1993).One estimate of the prospective global sequestering capacity of such reservoirs associated withpast production plus proven reserves plus estimated undiscovered conventional resources(most of which will be used up during the next century) is 100 GtC for oil fields and 400 GtC fornatural gas fields (Hendriks, 1994); other estimates of the oil and gas field sequestering capacity
6 For a technology amenable to the economies of mass production. costs tend to decline as a function of cumulative production as the technologymoves along its learning curve-typically at a cost reduction rate in the range 10 to 30% for each cumulative doubling of production. The level towhich costs can ultimately fall is limited by materials costs. For fuel cells. the only inherently very costly material is the noble metal catalyst requiredto drive the reactions at the electrodes. Recent technological advances have led to reductions in the catalyst loading for the proton exchangemembrane {PEM)-fuel cells being targeted for automotive applications to levels where catalyst costs will not prevent fuel cell costs from falling tolevels where fuel cells can ultimately compete in automotive applications.
0,..,
""'~ International Symposium..:J '; Towards Zero Emissions::::~ The Challenge for Hydrocarbons
are as low as 40 GtC for depleted oil fields plus 20 GtC associated with enhanced oil recoveryplus 90 GtC for depleted natural gas fields (lPCC, 1996). (For comparison, global CO2 emissionsfrom fossil fuel burning totaled 6.0 GtC in 1990). There is a wide range of estimates of potentialstorage capacity in depleted oil and gas fields because reservoir properties vary greatly in theirsuitability for storage, and because the recovery of oil and gas from these reservoirs may havealtered the formations and affected reservoir integrity. Much of the prospective sequesteringcapacity will not be available until these fields are nearly depleted of oil and gas.
Deep aquifers are much more widely available than oil or gas fields; such aquifers underlie mostsedimentary basins, which account for nearly half of the land area of the inhabited continents.To achieve high storage densities, CO2 should be stored at supercritical pressures (i.e., atpressures in excess of74 bar), which typically requires storage at depths greater than about 800m. The aquifers at such depths are typically saline and not connected to the much shallower(typically < 300 m) "sweetwater" aquifers used by people. If aquifer storage is limited to closedaquifers with structural traps, the potential global sequestering capacity is relatively limited,some 50 GtC (Hendriks, 1994), equivalent to less than 10 years of global CO2 production fromfossil fuel burning at the current rate. However, if structural traps are not required for securestorage, the storage capacity of aquifers might be huge-some 14,000 GtC (Hendriks, 1994),equivalent to more than 2,000 years of CO2 emissions from fossil fuel burning at the currentglobal rate. A growing body of knowledge indicates that many large horizontal open aquifersmight provide secure storage if the CO2 is injected far from the reservoir boundaries. The notionthat large horizontal aquifers can provide secure sequestration is a relatively new idea that hasled to an increase in confidence that long-term sequestration of a significant fraction of the nextseveral centuries of global CO2 production from human activities might be feasible (Holloway,1996; Socolow, 1997; PCAST Energy R&D Panel, 1997).
Experience with aquifer disposal will be provided by two projects involving injection intonearby aquifers of CO2 separated from natural gas recovered from CO2-rich gas reservoirs. Oneis a Statoil project begun in 1996 to recover 1 million tonnes of COz per year from the SleipnerVest offshore natural gas field in Norway (Kaarstad, 1992). The second, which will commencein about a decade, will involve the recovery of over 100 million tonnes per year (equivalent toabout 0.5 percent of total global emissions from fossil fuel burning) from the Natuna naturalgas field in the South China Sea (71 % of the reservoir gas is CO2) (lEA, 1996).
More research, field testing, monitoring, and modeling are needed to narrow the considerablerange of uncertainty regarding the regional and global capacities for secure CO2 storage inalternative geological reservoirs.
The Challenge of Making Hydrogen for Central-Station Power Generation.Although current a production technology might be adequate to enable a to compete eventuallyin fuel cell veh~cle markets, new a production technology is needed to enable a to become anoption for baseload central-station power generation with low avoided CO2 emissions costs. Incontrast to the situation with cars, which operate, under average conditions, at a small fraction ofpeak engine output and thus at low efficiency for internal combustion engines, baseload stationarypower plants typically operate near their rated output. Thus, for baseload stationary powerapplications the market does not put such a high value on H2 as it does in automotive markets,where use of the fuel cell leads to a large efficiency gain relative to the internal combustion engine.
e
--~..~ --
~ Inlemalional SymposiumL .~ Towards Zero Emissions
~ The (;hallenge for Hydrocarbnns
A review of conventional H2 production technology is useful background for understanding thepotential for advanced H2 production technology based on the use of inorganic membranes.The technology for producing Hz is well established if not mature. Although Hz is not currentlya widely distributed energy carrier. it is routinely produced for applications in the chemical andpetroleum refining industries.
The dominant commercial Hz production technology is via steam reforming of natural gas.Hydrogen can also be made via gasification of any carbonaceous feedstock (Williams et al.,1995a; 1995b), including coal. heavy oils. biomass. or municipal solid waste (Larson et al., 1996).or via electrolysis of water using renewable (e.g., hydro, wind or solar) or other power sources.Until fossil fuel prices are much higher than at present, electrolytic approaches for producing Hzusing renewable electricity sources will be much more costly than making Hz from natural gas.even when the added costs of CO2 sequestration are taken into account (Williams, 1998).
The process of making Hz from natural gas begins with steam reforming of the natural gas toproduce synthesis gas [a gaseous mixture consisting mainly of carbon monoxide (CO) and Hz]at a relatively high temperature (- 900 UC). Assuming natural gas is methane (the maincomponent), the highly endothermic steam reforming process can be represented as:
CH4 + HzO(gJ--7CO + 3H2, t:,.H = + 206.2 MJ/kmol. (1)
Reforming is followed by cooling the produced synthesis gas and reacting the contained COwi°th more steam ("water gas") to produce a H2-rich gas:
CO + H20(gj--7COZ + Hz, t:,.H = -41.2 MJ/kmol. (2)
Because this "water-gas-shift reaction" is slightly exothermic, low temperatures are needed todrive the reaction strongly .to the right. Typically the shift reaction is carried out in two stages:first in an adiabatic shift reactor (gases introduced at -350 uC) and then in an isothermal shiftreactor at a lower temperature (- 230 DC). The heat released in the water-gas-shift reaction isalmost exactly equal to the latent heat of water:
HzO11J ~HzOIgj, t:,. H = + 44.0 MJ /kmol. (3)
so that the combination of the water-gas-shift reaction and this phase change is approximatelyauto thermic, with little net change in the overall energy balance. Thus, in effect, the energycontent of the original CO is "shifted" to Hz -hence the reaction's name. The summary reactionfor the production of Hz from CH.. is:
CH4 + 2HzO(gJ ~ COz + 4Hz. (4)
If pressure swing adsorption (PSA) technology is used to separate the Hz from the gaseous mixtureemerging from the shift reactors, Hz can be provided at high purity. For the summary reaction, thetheoretical value of ER, the ratio of the energy content (HHV basis) of the produced H2 to theenergy content of the original methane, is ER= 1.28. This theoretical energy ratio is greater thanunity because heat absorbed in steam-reforming reaction is converted into chemical energy. Ifthis heat were provided by burning some extra CH.. the energy ratio would be less.
e
""'; International Symposium,..;~ ~; Towards Zero Emissions'~;;#ii' The Challenge for Hydrocarbons
A more meaningful index of performance for the conversion process is the overall thermalefficiencYl1, the ratio of the H2 energy output to the total fuel input (HHV basis), including thefuel consumed to provide external electricity requirements for the overall process. Taking intoaccount the various parasitic energy requirements yields values of 11 that are less than ER7 withcommercially available technology. For an energy-efficient, heat-integrated plant design, ER =0.90 and 11 = 0.84 can be achieved with commercially available technology for 99.999% pure H2provided at a pressure of 75 bar (Williams et al., 1995a; 1995b).
Hydrogen can be made from coal with commercial technology via a process that begins withoxygen-blown coal gasification. Assuming Illinois No.6 coal (which can be representedapproximately as CHosOoos). the coal gasification process can be summarized as:
CHo.sOo.os + 0.46 02-7CO + 0.4 H2, L\ H = -92.9 MJ/krnol, (5)
followed by synthesis gas cooling, the water gas shift reaction, and H2/ CO2 separation, as in the caseof natural gas. The overall summary reaction for producing ffi from coal can be represented as:
CHosOoos + 0.46 02 + H20!gJ -7C02 + 1.4 H2. (6)
For the summary reaction, the theoretical ER = 0.82. In a practical system that provides 99.999%pure H2 at 75 bar, ER = 0.77 and 11 = 0.64 (Williams et al., 1995a; 1995b).
Conventional H2 conversion and separation technology is costly in large part because of thehigh capital costs for heat exchangers associated with the need to cool the synthesis gas to thelow temperatures needed for driving the water-gas-shift reaction strongly to the right, andbecause of the need downstream of the water-gas-shift reactors for capital- and energy-intensive gaseous separation technologies such as pressure swing adsorption.
Advanced inorganic membrane technologies might make it possible to reduce significantly the costof making ffi from fossil fuels by substituting membrane reactors for the water-gas-shift reactorsand the conventional technologies used to separate the ffi from CO2 and other trace gases.
Prospects for Advanced Ceramic Membranes in Hydrogen Manufacture.A promising class of advanced inorganic membranes is porous ceramic membranes made fromAb03 or another ceramic material that is permeable to the flow of small molecules like H2 butinhibits the flow of CO2 and other larger molecules. One version of such a membrane is underdevelopment at the Oak Ridge National Laboratory (ORNL), as a variant of a membrane thathas long been utilized for uranium enrichment via gaseous diffusion.
The value of such membranes in separating H2 from CO2 and other gases has been recognizedfor a number years (Johnson and Schulman, 1993), but only recently has the technology beengiven attention as an advanced technology option for plants that would manufacture H2 fromfossil fuels (Parsons I&TG, 1998). Here the potential performance and economics of a H2separation device (HSD) that uses this membrane technology in the production ofH2 from coalare described for HSD applications in central-station power generation, based on a preliminary
7 The denominator in the energy ratio ER does not include the fue! required to provide the external electricity needed for the process.
8
.I'; Inlernalional Symposium« Towards Zero Emissions,-,: The Challen!(e for Hydrocarbons
I
assessment of the technology for making H2 from coal by the Parsons Infrastructure andTechnology Group (Parsons I&TG, 1998).
The process for making Hz from coal using this new HSD, as described by Parsons I&TG (1998),is illustrated in figure 4. The process begins with oxygen-blown coal gasification to produce ahot, pressurized synthesis gas (1040 "C, 70 bar). Steam is added to the gas to provide the basisfor the downstream water-gas-shift reaction and to cool moderately the gas, from whichparticulate matter in the fly ash is then removed in high-tern perature-tolerant ceramic candlefilters. The rest of the ash is recovered in the gasifier as slag, which falls into a water bath and iscooled and shattered to become an inert frit.
The filtered hot, pressurized gas (790 "C, 65.5 bar) is then delivered to the HSD, where H2 isremoved from the synthesis gas via the ceramic membrane. Hydrogen separation in the HSD isdriven by a large H2 partial pressure drop across the membrane. In Parsons I&TG (1998) it isargued that the ceramic membrane in a HSD would make it possible to drive the water-gas-shiftreaction strongly to the right, even at high temperatures, while simultaneously separating theproduced H2 from CO2 and other gases, because the membrane removes H~ from the reactor asit is produced. The recovered H2 primary product would be cooled and made available at 1.4 bar.
The gases exiting the HSD on the high-pressure side of the membrane contain 5% of theheating value of the original fuel gas in the forms of CO, Hz, and H2S. This gas is burnedcatalytically in oxygen", water is injected into the combustor and evaporated, and thecombustion product/steam mixture is expanded to 1.4 bar, producing byproduct electricity ina turbine expander / generator. About half of the produced electricity is needed for onsite needs;the remainder is available for export. The turbine exhaust gases are cooled, the water iscondensed, recovered and recycled, and the S02 in the cooled gases is removed in wetlimestone forced oxidation flue gas desulfurization (FGD) unit. After sulfur removal, the streamof relatively pure CO2 at 1.4 bar is available for underground sequestration.
The performance characteristics and Hz production cost for the system modeled by ParsonsTG&I are summarized in table 5. Although ER = 0.75 for this system, a value slightly less thanvalue with conventional technology, the thermal efficiency would be higher than forconventional technology, as a result of the byproduct power generation. Credit for byproductpower can be taken by defining an "effective efficiency" Tjeff for producing H2 from coal as theratio of the energy content of the produced Hz to the net coal input, with the net coal inputdefined as the gross coal input minus the coal consumption avoided by not having to generatethe byproduct electricity in a stand-alone power plant. Assuming that this electricity wouldalternatively be produced at an efficiency 11 = 0.355, the efficiency of a modern coal steam-electric plant with flue gas desulfurization (see table 3), the effective efficiency for thistechnology would be lleff = 0.914 (see table 5). This is not the appropriate value for making acomparison with the conventional technology presented in table 5, because in the ParsonsI&TG design for the HSD involves providing H2 at a pressure of 1.4 bar compared to 75 bar forthe conventional technology. However, if a compressor is added to the Parsons TG&I design. theresulting Tjeff = 0.816, which is still much higher than the corresponding Tjeff = 0.635 for theconventional technology (see table 5).
K C:"laIYlic combusti{)n is needed because oflhe low healing value of the ~as (0.59 MJ/Nm'-aboul 1.5'J1, of the healing value ofnalural gas!.
e"
,1': International Symposium'Ii; «~Towards Zero Emissions
'-""""" The (:hallen~e for Hydrocarbons
In the cost comparison shown in table 5 for the HSD and conventional H:: productiontechnologies, costs for the HSD system are presented in two ways: in parentheses costs arepresented for the original Parsons I&TG plant design, which provides H2 at 1.4 bar. The otherset of values includes costs for Hz compression to 75 bar to make the comparison withconventional technology meaningful. When costs are thus compared on the same basis, thecost per GJ of H2 is less than 60% of the cost with conventional technology, in a plant that hasless than half the output capacity (see table 5).
The ceramic membrane in the HSD is the core technology that makes possible the productionof H2 from coal at low cost. Inorganic membranes are generally more expensive than polymermembranes. For the system considered in table 5 the membrane is expected to cost -$ 1,000per m2. The total estimated HSD cost per unit area of membrane is much higher, -$ 6,000 perm2 (Parsons I&TG, 1998)-quite a high cost for a material, on a $/m2 basis.But membrane cost per unit area is not a measure of performance; a useful performancemeasure is the cost relative to the rate of separating H2. The Parsons I&TG design is for a HSDthat is characterized by a "membrane coefficient" of 192 kW of H2 per m2, when the H2 partialpressure drop across the membrane is from 27.5 to 1.4 bar. Thus the HSD cost relative to the H2recovery rate is low, some $ 30 per kW. Thus, despite its importance to the H2 productionprocess, the HSD contributes only modestly to the system cost. In the system modeled byParsons I&TG, the HSD capital cost is only about 1/4 as large as the capital cost for the airseparation unit (the single most costly item in the system) and is comparable to the capital costof the flue gas desulfurization unit.
Applications of the Ceramic HSD to Central-Station Power Generation.In what follows, the analysis of Parsons I&TG (1998) is extended to considerations of using theproduced H2 (at near atmospheric pressure) at the same site for electricity generation in acentral-station power plant. Cost estimates for H2 production for these applications, bothwithout and with sequestration of the separated CO2, are summarized in table 6 for a plant withan output that is 2.6 times the output of the plant originally designed by Parsons I&TG (seetable 5), using the costs for CO2 disposal developed in table 4.
One candidate technology for making electricity from the produced H2 is a gas turbine/steamturbine combined cycle power plant. Hydrogen can be burned in combined-cycle power plantsoriginally designed for natural gas use, with relatively modest modifications of the combustor-i.e., no technical breakthroughs are required (Foster Wheeler, 1998).
When the separated CO2 is sequestered, a combined cycle plant fired with coal-derived H2 wouldprovide electricity with near-zero lifecycle CO2 emissions. Emissions of S02 and particulates wouldalso be virtually zero, but there would be NOx emissions from "thermal NOx" produced fromnitrogen in the air when fI2 is burned at high temperature. However, thermal NOx emissions couldbe reduced to extremely low levels by injecting steam into the combustor to reduce peak flametemperatures. Steam injection has been used for NOx control with natural gas-fired gas turbines,but with natural gas this NOx emissions control strategy is constrained by the fact that emissionsof another pollutant, carbon monoxide, increase rapidly as the ratio of steam-to-fuel injected intothe combustor increases; because there is no such constraint for H2, NOx emissions can becontrolled this way to extremely low levels, making the H2-fueled combined cycle a near-zero-
emissions system for both CO2 and air-pollutant emissions.
0
.'~ Inlemalional Symposium
.« :} , Towards Zero Emissions::::~ The (:hallenge for Hydrocarbons
Two General Electric (GE) combined cycle systems are considered. One system consists ofthret253 MW. units that use the commercially available Frame 7F gas turbine, for which the Lffiefficiency = 55.8%; the other consists of two 400 MW. units based on the Frame 7H gas turbinefor which the LHV efficiency = 60.0%. Estimated performance characteristics and electrici~costs for these combined cycles fired with natural gas (NGCC units) and with coal [via coaintegrated gasification combined cycle (CIGCC) units], assuming natural gas and coal price:prajected for 2020, are presented in table 3.The Frame 7H involves a higher turbine inlet temperature (1430 DC vs. 1300 DC), a highejpressure ratio (23 vs. 15), and steam cooling instead of air cooling of the gas turbine bladesFrame 7H machines are expected to be commercially available for use in NGCC units by thtyear 2000 and for use in CIGCC units shortly thereafter (Todd and Stoll, 1997). It is assumecthat: (i) with Hz provided at a pressure that is 1.2 times the pressure of the gas turbintcombustor the combined cycle efficiency will be the same as when operated on natural ga!(LHV basis)9, and (ii) the unit capital costs and O&M costs with Hz operation (exclusive of th~costs for Hz compression) are the same as with natural gas operation.
Taking into account the power requirements for Hz compression, the overall net efficiencyof converting coal into electricity (HHV basis) with these combined cycle plants withoutCOz sequestration is in the range 40-42% (see table 7). The electricity requirements for CO,compression reduce the overall net electric generating efficiency with COz sequestration toabout 93% of its value without sequestration. But even with sequestration electricitygeneration would require about 10% less coal input per kWh in the Frame 7H case than fOIa new coal steam-electric plant equipped with flue gas desulfurization (compare tables 7and 3).
Electricity generation costs for these systems are presented in table 71°. Even though theestimated cost of producing Hz without COz sequestration shown in table 6 is about 10% lessthan the natural gas price assumed for the systems described in table 3, the estimated cost ofelectricity generation is about 10% higher with Hz than with natural gas for the Frame 7Fcombined cycle and about 15% higher for the Frame 7Hll, because of Hz compressionrequirements.
The cost of COz disposal for the case where the COz disposal site is 500 km from the power plant(see table 4) adds about 1 cent per kWh to the electricity cost without COz disposal (see table 7).The total cost penalty for shifting to this near-zero emissions technology is greater than thisbecause the Hz-fired combined cycle without sequestration is not the least-costly option forproviding electricity. .
A shift to the near-zero emissions Hz system could be induced by a tax on COz emissions equalto the cost of COz emissions avoided by shifting to the H2 system. This avoided cost AC (in $ pertC) is given by:
9 The HHV of H, = 285.8 Ml/kmol. and me LHV = 0.846'HHv:
10 Assuming coal prices equal 10 (hose assumed for conventional power generalion systems in lable 3.
II Allhough eleClricily generalion from H. is less cosily for Ihe Frame 7H syslem Ihan for Ihe Frame 7F syslem. Ihe COSI is grealer relalive (0 naluralgas for the Frame 7H syslem than for the Frame 7F system. because H. compression requirements are greater for the Frame 7H syslem \vith ils higherpressure ralio.
0
-
",; International Symposium«.: Towards Zero Emissions~"'" The Challenge for Hydrocarbons
AC = (CHCC -CRt:F -AQBHcc) 1 (EREI' -EHCC). (7)
where:CHCC = cost of electricity for the least costly Hz combined cycle with COz sequestration (in
$/kWh);CREF = cost of electricity from the "reference" fossil fuel power plant-the least-costly fossil fuel
option;EREF = COz emissions from the reference power plant (in tonnes C per kWh);EHCC = COz emissions from the Hz combined cycle system with COz sequestration;AQBHCC = air quality benefit associated with shifting from the reference to the zero-emission
power plant.
In calculating the avoided cost. two questions are key: "What is the reference power system beingdisplaced? And what air quality benefits are being credited to the zero emissions Hz power system?"
By the time sequestration strategies are undertaken (assumed here to be -2020), Frame 7H levels ofgas turbine technology should be fully established in the market for natural gas, coal gasification, andHz applications. Thus. from table 3. an CIGCC plant based on the Frame 7H gas turbine is assumedfor the reference power plant. and, from table 7, a Hz combined cycle plant based on the Frame 7Hgas turbine is assumed to be the least costly system for making electricity from coal-derived Hz.
Even though CIGCC technology can provide electricity with much lower air pollutantemissions than is feasible for pulverized coal steam-electric (PCSE) plants equipped with bestavailable control technologies, the air quality benefits realized in shifting from CIGCCtechnology to Hz combined cycle technology can still be significant. because the estimatedhealth costs caused by small particles are so large, and the effects appear to be linear functionsof the dose and thus emissions levels (Wilson and Spengler, 1996). Here it is assumed that theCIGCC air pollutant emissions are at levels that were proven in the Coolwater CIGCCdemonstration facility in the 1980s (CWCGP and Radian Corp. 1990)IZ. Assuming thevaluations of these emissions for typical power plant sittings in Europe presented in table 2.the economic value of avoiding these emissions is AQBHCC = 0.62 11:1 kWh-about 14% of the
health cost of air pollution from a PCSE plant equipped with best available control technology
(see table 2).
Thus:CHCC = $ 0.0452/kWh (from table 7, for case where COz is disposed of at a site 500 km from the
.power plant);CREF = $ 0.0302/kWh (from table 3. for the Frame 7H-based CIGCC);EREF = 0.000201 tC/kWh (from table 3);EHCC = 0;AQBHcc = $ 0.0062/kWh.
12 Emission rates of 27.1 grams Df NOx and 4.0 grams of particulates per GJ of coal are assumed-levels that were proven at the CoolwaterCIGCC demonstration project. For SO,. it is assumed that 99% S recovery is achieved with the CIGCC. since the feasibility of 99% S recovery wasalso demonstrated at Coolwater. When such technology is used with typical bituminous coal containing 3.3% S from Illinois (EPRI. 1993) in theheart of the U.S. "coal power belt: the So, emission rate would be 25.7 grams per GJ. If coal were burned in a Frame 7H-based CIGCC plant theemission rates per kWh of electricity produced would be 0.21 grams for SO,. 0.22 grams for NOx. and 0.033 grams for PM". These emission ratesare. respectively. 21%. II %. and 17% of the SO" NOx. and PM., emission rates for PCSE plants equipped with "best available controltechnologies" (see table 2)
0
"":'::
..1:" International Symposium..~. Towards Zero Emissions~"" The Challenge for Hydrocarbons
SO that the cost of avoiding CO2 emissions is AC = $ 44 per tC -which is essentially the same asthe COz disposal cost for this case (see table 4).
There are of course many uncertainties underlying this calculation. Especially important arethe uncertainties regarding the Hz production cost -since HSD technology is not a commercialproduct. Such technological uncertainties are discussed in the next section. In addition, thereare uncertainties about the valuation of the air quality benefits offered by an electric generationtechnology having zero air pollutant emissions. (As noted earlier the 68% confidence intervalfor costs presented in table 2 is the range 1/4 to 4 times the median cost estimate, and costs canvary substantially with the conditions at the power plant site and its surroundingenvironment). But even in the extreme case where no credit is taken for the air quality benefitsof the zero emissions technology, the cost of avoiding CO2 emissions would be only $ 75/tC -acost that is far below the $ 200/tC that global change modelists typically assume as the marginalcost for a "backstop" technology that is capable of making major contributions to energysupply with zero or very low emissions of COz (Manne et al., 1995).
Uncertainties Relating to Ceramic Membranes and Alternative Options.Various technical issues must be resolved before the HSD technology proposed by ParsonsI&TG could become a commercial product.
One set of concerns relates to the ceramic candle filters used to clean the synthesis gas before thegas is delivered to the HSD. The reliability of such filters has not yet been proven for the hightemperatures assumed in the Parsons TG&I plant design. Moreover, it is inevitable that someparticles will escape capture by the membranes. Will such "fugitive" particles damage the HSD?Developers of the ORNL ceramic membrane claim that as long as the particles to not "slag" (i.e.,melt), which is possible as they pass over the membranel3, escaped particles can be periodicallycleaned off the membranes; however, the membrane can be degraded if the particles slag andthereby stick to the ceramic membrane (private communication from Rod Judkins, December1998). The slagging problem can be avoided by choosing coals that will not slag at the operatingtemperature of the HSD.
The system advanced by Parsons I&TG also requires that the membrane material have the tensilestrength to withstand a high-pressure differential (- 64 bar) across the membrane. If a high totalpressure differential poses membrane structural integrity problems, steam might be injected onthe Hz recovery side to equalize total pressures on the two sides of the membrane, whilemaintaining the high partial pressure differential for Hz. Subsequently, the water could beseparated out by condensation as a result of cooling the gaseous mixture.
Perhaps the most fundamental concern about the Parsons I&TG system design relates to water-gas-shift catalysis. In this design, it is assumed that the water-gas-shift reaction will be drivenstrongly to the right as the Hz is removed via the membrane and that equilibrium will be quicklyestablished. At sufficiently high temperatures, equilibrium will indeed be established quickly.but whether or not the proposed design operating temperatures are high enough must beverified by kinetic modeling and/or experiment.
13 Siagging is possible because the water-gas-shift reaction is exothermic. so that the gas temperature will increase as the gases pass over themembrane if the reactor is insulated-,;ee figure-1.
e
-
~... International Symposium«i" Towards Zero Emissions~""'" The Challen~e for Hydrocarbons
If it should turn out that catalysis is needed at the proposed operating temperatures,alternatives to the Parson's design will be needed, because there are no commercially available"sour-gas-tolerant" (i.e., tolerant of H2S) catalysts for the water-gas-shift reaction at these hightemperatures. One possibility would be to remove the sulfur (mainly in the form of H2S) fromthe synthesis gas before it is delivered to the HSD. But "hot gas" sulfur removal technology is atan embryonic development stage.
Another possibility for dealing with these challenges would be to cool the synthesis gasbefore it is delivered to the HSD to temperature levels where commercially available "sour-gas-tolerant" water-gas-shift catalysts can be used. Doing so would reduce system efficiencysomewhat. However, modest efficiency losses should not result in large economic penalties.One of the effects of an efficiency penalty would be to increase coal costs. But the coal costpenalty would not be significant at the low coal prices assumed for this analysis'4. The othermain effect would be to increase the CO2 sequestration penalty, because more CO2 wouldhave to be disposed of per kWh generated. But this penalty would also not be large becausethe cost of CO2 disposal accounts for only about 1/5 of the electricity cost (see table 7)15.Moreover, operating the system at lower temperatures would make the overall system designless challenging technologically (e.g., gas cleanup would be less challenging) and might evenlead to reduced capital or O&M costs for some system components that would help offset thecoal cost and CO2 sequestration penalties arising from operation at lower temperatures.
If technical concerns about the HSD can be resolved satisfactorily with further R&D, it shouldbe feasible to scale up to manufacturing capability relatively quickly, since large-scalemanufacturing technology is well established for inorganic ceramic membranes that have beenused in gaseous diffusion-based uranium-enrichment technology. (The manufacturingtechnology for these membranes is currently classified because of this link to uraniumenrichment technology, even though the H2 permeable membranes could not be used foruranium enrichment purposes.)
But all would not be lost if these technological challenges prove to be too formidable to bring thisceramic membrane technology to market. Operation at lower temperatures than those for theParsons I&TG design increases the technological choices for membranes that can simultaneouslydrive the water-gas-shift reaction to the right and separate H2 from CO2 and other gases.
One set of promising alternative technologies being rapidly developed is metallicmembranes. As in the case of ceramic membranes, large reductions in the cost of making H2from coal are also expected to be feasible with metallic membranes (D.]. Edlund and M.H.Henry, 1995). Some of these metallic membranes are non-porous. For these, H2 separation isachieved by exploiting the fact that atomic hydrogen (H) migrates thro\Jgh the metalliccrystal lattice when a H2 partial pressure differential is maintained across the membrane.These non-porous membranes can provide pure H2. One interesting subgroup is composite
14 For example. if the overall coal-to.electricity conversion efficiency were reduced to 90% of the 39.2~ value for [he Frame 7H case presented intable 7. the increased cost of coal would add 0.09 ~ (less than a 2% increase) to the cost of generating a kWh.
J 5 For example. if the overall coal-to.electricity conversion efficiency were reduced to 90% of the 39.2% value for the Frame 7H case presented in[able 7. the Co, disposal rate for an 821 MW, plant would increase from 706 to 784 [onnes per hour. but the cost of disposing of a ton of Co, would bereduced from $ 43.3 to $ 42.4 per tC (because of the scale economies in Co, pipeline transport). The net effect is that the cost for disposing ofadditional quantities of Co, increases the cost of generating a kWh of electricity by 0.08 ~
e
~;t~i~;;(;;;:, -"'i International Symposium
.; Towards Zero Emissions-::::~ The Challenge for Hydrocarbons
membranes that involve Group V-B body-centered cubic metal (e.g., vanadium) layers(which have high Hz permeance) coated with thin layers of metals such as palladiuml6 (Mossand Dye, 1996; 1997)1\ A key concern for coal-based Hz production systems is that that themetallic membranes not be degraded by exposure to HzS, which will be a major contaminantof coal-derived synthesis gasl8.
Still another potentially important class of membranes for which development is moreembryonic is non-porous ceramic membranes that conduct both hydrogen ions and electrons(Balachandran, Guan, and Dorris, 1998). As in the case of nonporous metal membranes, thesemembranes provide pure Hz.
For Hz applications involving the proton exchange membrane (PEM) fuel cell (which is beingdeveloped for transportation and other Hz fuel cell applications), the nonporous metallic andceramic membranes that provide pure Hz would be probably be preferable to porous ceramicmembranes for Hz production, because the PEM fuel cell is poisoned by carbon monoxidelevels in the Hz product at levels in excess of about 10 ppm.
Can Coal-Based Hz Technologies Become Backstop Technologies for Climate Change
Mitigation?The near-zero COz emitting energy system described here offers the potential of becoming a"backstop" technology for climate change mitigation purposes. Coal is abundant on a timescale of a few centuries and can be readily delivered to most locations on earth at relatively lowcosts. If large, open aquifers with good top seals prove to be secure COz storage reservoirs,opportunities for geological storage would also be widely available for centuries. And if fuel cellvehicles and advanced membrane technologies for Hz production can be successfullydeveloped and deployed, the cost penalties for COz emissions avoided are not likely to beprohibitive when the COz produced as a byproduct of Hz manufacture is sequestered in suchaquifers. Moreover, if credit can be taken for the reduced adverse air pollution impacts of theconventional energy technologies that coal-derived Hz systems would replace, the cost ofavoided COz emissions could approach the COz disposal cost, which is modest.
Where Will the Needed Technological Innovation Take Place?The cluster of technologies discussed in this paper that would make it possible to provide energyfrom coal with near-zero emissions at attractive costs would be applicable worldwide. But thesetechnologies would be especially important for coal-rich developing countries such as China-because of rapid expected growth there in the use of coal in conventional power generatingsystems (see table 1) and the fact that once such systems are put in place they will "lock in" formany decades an "air-polluting capacity" that will be very environmentally damaging.
16 The purpose of the thin paUadium coatings is both [0 prevent the formation ofan oxide layer on the vanadium surface that inhibits H permeance and tocatalyze dissociation of H. molecules into H atoms on the feed side and recombination of H atoms into H, molecules on the permeate side of the membrane.
17 Metal costs for these membranes are not limiting. The cost of the metals for a composite metal membrane under development at Los AlamosNational Laboratory (Moss and Dye. 1996; 1997) consisting of a 40 I' layer of vanadium coated by a 0.5 I' layer of paUadium on each side would cost -S 200/m'. But a l)'Pical permeance for such a membrane \vould be -200 kW ofH, throughput. so that the cost of metal per unit ofH, throughput wouldbe trivial (-Sl/kWofH,).
18 Metal membranes made of palladium. nickel. and iron. as examples. undergo rapid irre\ersible chemicai reaction \vith H,S that results in adramatic decrease in membrane permeability and/or physical destruction of the membrane. However. membranes do exist that are H,S-tolerant. Forone such membrane. an alloy made up of 60% palladium and 40% copper. no degradation in H, permeance was observed with 350 hours of exposureto H,S at a level of 1000 ppm and a temperature of 500 "C. and no permanent poisoning by H,S was found with up [0 10% H,S (0./. Edlund and M.H.Henry. 1995).
8
--
"" International S~mposium« Towards Zero Emissions..::::~ The Challenge for Hydrocarbons
n light of the needs for such environrnent- and climate-friendly fossil-energy technologies and theong lead times inherent in the innovation process, there is an urgency to pursue the technologicalnnovation activities required to convert the technological vision described here into a commercialeality. Unfortunately, under business-as-usual conditions, the industrialized countries are poorheaters for innovation because the demand for coal power systems is stagnant there. In the United;tates, for example, electric utilities are planning to add only 4.2 GW of new coal capacity, 1997-~O 1 0, which corresponds to a capacity growth rate of only 0.10% per year (EIA, 1998a). Moreover,llthoUgh most of the existing coal-generating capacity in the United States will reach the'nominal" retirement age (- 40 years) over the next couple of decades, most power companies areJlanning to refurbish these old plants and try to extend their useful lives to 60 and even 70 years.
Nhile their rapid coal demand growth makes developing countries prospectively better:heaters for innovation, much of the needed technology is under development in theindustrialized countries. This situation underscores the need for international collaborativeictivities relating to research, development, demonstration, and deployment in this areainvolving companies that have the capability to bring these technologies into the marketplace(PCAST ICERDJ Panel, 1999).
But it will be difficult to bring such technology to market in developing countries withoutsubstantial supporting markets in industrialized countries. This dilemma might be resolved ifthe public health problems caused by the present generation of coal power plants prove to beas large as indicated in table 2. If so, new regulations might be considered that would make itdifficult for electric companies to extend the lives of old coal plants, or, alternatively,policymakers might offer new incentives that would make it more attractive to pursue a "scrap-and-build" strategy that would involve replacing old fossil fuel power plants with new cleantechnologies. Under a policy conducive to a scrap-and-build strategy, the coal-based energysystem in industrialized countries might evolve from steam-electric power generation to onewhere Hz is produced from coal at the same sites for both stationary power and transportationapplications, shifting to Hz production at the time of normal plant turnover. Such activity couldfacilitate a transition to coal-derived Hz in the developing world.
References.1. Balachandran U., Guan J. and Dorris S.E., 1998: Development of proton-conducting
membranes for hydrogen separation. Invited paper presented at the Advanced Coal-BasedPower and Environmental Systems '98 Conference, Morgantown, WV; July 21-23, 1998.
2. Blok K., Williams R.H., Katofsky R.E. and Hendriks C.A., 1997: Hydrogen production fromnatural gas, sequestration of recovered COz in depleted gas wells and enhanced natural gasrecovery. Energy, 22 (2-3), pp. 161-168.
3. Blunt M., Fayers FJ. and OrrJr. EM., 1993:'Carbon dioxide in enhanced oil recovery. EnergyConversion and Management, 34 (9-11), pp. 1197-1204.
4. Byrer C. and Guthrie H. (Federal Energy Technology Center, U.S. Department of Energy),1998: Carbon dioxide storage potential in coal beds: a near-term consideration for the fossilfuel industry. Proceedings of the 23rd International Technical Conference on CoalUtilization & Fuel Systems. Clearwater, FLA, March 9-13, pp. 593-600.
5. Chiesa P. and Consonni S. (Dipartimento di Energetica, Politecnico di Milano, Milan, Italy),1998: Shift reactors and physical absorption for low COz emission IGCCs. Paper presentedat the ASME Turbo Expo 98.
e
~ },- International Symposium; ". Towards Zero Emissions~ ~,~ The Challenge for Hydrocarbons
6. CWCGP (Cool Water Coal Gasification Program) and Radian Corporation, 1990: Cool WaterCoal Gasification Program: Final Report, EPRI Report GS-6806, Electric Power ResearchInstitute, Palo Alto, CA, December.
7. Edlund D.J. and Henry M.H., 1995: A Catalytic Membrane Reactor for Facilitating the WaterGas Shift Reaction at High Temperatures. Phase II Final Report to the US Department ofEnergy on Contract No. DE-FG03-91-ER81229, November 30.
8. EIA (Energy Information Administration), 1995: Coal Data: A Reference, DOE/EIA-0064(93), U.S. Department of Energy, Washington, DC, February.
9. EIA (Energy Information Administration), 1998a: Annual Energy Outlook 1999, withProjections to 2020, DOE/EIA-0383 (99), U.S. Department of Energy, Washington, DC,December.
10. EIA (Energy Information Administration), 1998a: Coal Industry Annual 1997, DOE/EIA-0584 (97), U.S. Department of Energy, Washington, DC.
11. EIA (Energy Information Administration), 1999a: International Energy Outlook 1999, withProjections Through 2020, DOE/EIA-0484 (99), Washington, DC, March.
12. EIA (Energy Information Administration), 1999b: Monthly Energy Review, DOE/EIA-003.:
(99/04), April.13. EPRI (Electric Power Research Institute), 1993: Technical Assessment Guide. Electricit)
Supply-1993. EPRI TR-I02275- VIR7, Electric Power Research Institute, Palo Alto, CA, June14. FosterWheeler, 1998: Precombustion Decarbonization, Report Number PH2/19, preparec
, for the lEA Greenhouse Gas R&D Program, June.':") ..15. GunterW., GentzixT., Rottenfusser B. and Richardson R., 1997: Deep coalbed methane ir;: ;[;~! Alberta, Canada: a fuel resource with the potential of zero greenhouse emissions. Ener~, Converso Mgmt., 38 (Suppl.): S217-S222.
!:"Jut:;\'Ii) 16. Hendriks C.A., 1994: Carbon Dioxide Removal from Coal-Fired Power Plants. Ph. D. thesis,':~.i:I;S),;~\t Department of Science, Technology and Society, Utrecht University, Utrecht, ThE,'I(j",!!~)A Netherlands.r: 17. Herzog H.J., Drake E. and Adams E. eds., 1997: CO2 Capture, Reuse and StoragE, Technologies for Mitigating Global Climate Change. DOE Order No. DE-AF22-96PCO1257
;1,~,:!, Energy Laboratory, Massachusetts Institute of Technology, Cambridge, MA, January.(v ., 18. Holloway S. (British Geological Survey), ed., 1996: The Underground Storage of CarboI
Dioxide. Report prepared for the Joule II Program (DG XII) of the Commission of thlIf European Communities, Contract No. JOU2 CT92-0031, Brussels, February.
19. lEA (International Energy Agency), 1996: CO2 capture and storage in the Natuna N(project. Greenhouse Issues, 22, p. 1.
20. IPCC (Intergovernmental Panel on Climate Change), 1996: Energy supply options. Chapte19 in: Climate Change 1995-Impacts, Adaptations, and Mitigation of Climate ChangeScientific-Technical Analyses. [Watson R.T., Zinyowera M.C. and Moss R.H. (eds.)]Cambridge University Press, Cambridge and New York.
21. Johnson H.E. and Schulman B.L. (SFA Pacific, Mountain View, CA), 1993: Assessment of th,Potential for Refinery Applications of Inorganic Membrane Technology-an IdentificatioJand Screening Analysis, Report DOE/FE-61680 prepared for the Office of AdvancetResearch, Fossil Energy, U.S. Department of Energy, May.
22. Kaarstad 0.,1992: Emission-free fossil energy from Norway. Energy Converso Mgmt, 33 (58): 781-786.
23. Katofsky R.E., 1993: The Production of Fluid Fuels from Biomass. MSE Thesis, Mechaniccand Aerospace Engineering Dept., Princeton University, Princeton, NJ. Available a
8"'~-'--
,.; International Symposium..';c Towards Zero Emissions~ The Challenge for Hydrocarbons
PU/CEES Report No. 279, June 1993.24. Larson E.D., Worrell E. and Chen J.S., 1996: Clean fuels from municipal solid waste for fuel
cell buses in metropolitan areas, Resources, Conservation and Recycling, 17: 273-298.25. Manne A., Mendelson R. and Richels R., 1995: A model for evaluating regional and global
effects of GHG reduction policies, Energy Policy, 23: 17-34.26. Moss T.S. and Dye R.C., 1996: Engineering materials for hydrogen separation. Paper
presented at Hydrogen and the Materials of a Sustainable Energy Future, Los Alamos, NM,October 29.
27. Moss T.S. and Dye R.C., 1997. Composite metal membranes for hydrogen separation.Proceedings of the 8th Annual Meeting of the National Hydrogen Association, Alexandria, VA,March 11-13.
28. NRC (National Research Council), 1998: Review of the Partnership for a New Generation ofVehicles. Fourth Report. Prepared by the Standing Committee to Review the ResearchProgram of the Partnership for a New Generation of Vehicles. National Academy Press,Washington, DC.
29. Ogden J.M., Kreutz T.G. and Steinbugler M., 1998: Fuels for fuel cell vehicles: vehicle designand infrastructure issues, Paper 982500, SAE Technical Paper Series, prepared for theInternational Fall Fuels and Lubricants Meeting and Exposition, San Francisco, CA,October 19-22.
30. Parsons I&TG (Parsons Infrastructure and Technology Group, Inc., Reading, PA), 1998:Decarbonized fuel plants utilizing inorganic membranes for hydrogen separation. Paperpresented at the 12th Annual Conference on Fossil Fuel Materials, Knoxville, TN, May 12-14.
31. PCAST Energy R&D Panel (Panel on Energy Research and Development of the President'sCommittee of Advisors on Science and Technology), 1997: Energy Research andDevelopment for the Challenges of the Twenty- First Century. Washington, DC, November.
32. PCAST ICERDJ Panel (Panel on International Co-operation in Energy Research,Development, Demonstration and Deployment of the President's Committee of Advisorson Science and Technology), 1999: Powerful Partnerships: The Federal Role inInternational Co-operation on Energy Innovation. Washington, DC, May.
33. Pope CA., Thun M,J., Namboodri M.M., Dockery D.W., Evans J.S., Speizer EE. and HeathC. W., 1995: Particulate air pollution as a predictor of mortality in a prospective study of USadults, AmericanJ. of Resp. Critical Care Med., 151: 669-674.
34. Rabl A. (Centre d'Energetique, Ecole des Mines, Paris) and Dreicer M. (EnvironmentalAssessments, Washington, DC), 1999: Health and environmental impacts of energysystems. International Journal of Global Energy Issues (in press).
35. Rabl A. and Spadaro J.V:, 1999: Environmental damages and costs: an analysis ofuncertainties. Environmental International, 25: 29-46.
36. Socolow R.H., ed., 1997: Fuels Decarbonization and Carbon Sequestration: Report of aWorkshop by the Members of the Report Committee. PU / CEES Report No. 302, Center forEnergy and Environmental Studies, Princeton University, Princeton, NJ, September. Thisreport is available on the World Wide Web at http://www.princeton.edu/-ceesdoe.
u~ 37. Spadaro J.V: Rabl A., Jourdain E. and Coussy P., 1998: External costs of air pollution: casestudy and results for transport between Paris and Lyon. International Journal of Vehicle
.CJ f:: Design, 20: 274-282.38. Spadaro J.V and Rabl A. (Centre d'Energetique, Ecole des Mines, Paris), 1998: Social Costs
h:Jinsrj and Environmental Burdens of Transport: an Analysis Using Two Case Studies in France,;,:t.; 91dfl unpublished manuscript, October.
8-
International SymposiumTowards Zero EmissionsThe Challenge for Hydrocarbons
39. Steinbugler M.M. and Williams R.H., 1998: Beyond combustion. Fuel cell cars for the 21stcentury. Forum for Applied Research and Public Policy, Winter, pp. 102-107.
40. Stevens S.H., Kuuskra VA., Spector D. and Riemer P., 1999: CO2 sequestration in deep coalseams: pilot results and worldwide potential, pp. 175-180, in: Proceedings of the 4thInternational Conference on GHG Control Technologies, Interlaken, Switzerland, Aug. 30 -Sept. 2, Eliasson B., Riemer P., Wokaun A., eds. Pergamon, Amsterdam, p. 205.
41. Summerfield I.R., Goldhorpe S.H. [British Coal Corporation, Coal Research Establishment],Wllliams N. and SheikhA. [Bechtel, Ltd.], 1993: Costs of CO2 disposal options. Paper presentedat lEA Carbon Dioxide Disposal Symposium, Christchurch College, Oxford, England, March29-31.
42. Todd D.M. and Stoll H. (G.E. Power Systems, Schenectady, NY), 1997: Integratedgasification ~ombined cycle-the preferred power technology for a variety of applications.Paper presented at Power -Gen. Europe '97, Madrid, Spain, June.
43. Turkenburg W.C., 1992: CO2 removal: some conclusions. In: Proceedings of the FirstInternational Conference on Carbon Dioxide Removal. [Blok K., Turkenburg W., HendriksC. and Steinberg M., (eds.)]. Energy Conversion and Management, 33 (5-8), PergamonPress, Oxford, pp. 819-823.
44. US DOE (U.S. Department of Energy), 1999: Working Paper on Carbon SequestrationScience and Technology, Office of Science and Office of Fossil Energy, February (draft).
45. Van der Burgt M.}., Cantle J. and Boutkan \ZK., 1992: Carbon dioxide disposal from coal-based IGCCs in depleted gas fields. In: Proceedings of the First International Conference onCarbon Dioxide Removal. [Blok K., Turkenburg W., Hendriks C. and Steinberg M., (eds.)].Energy Conversion and Management, 33 (5-8), Pergamon Press, Oxford, pp. 603-610.
46. Weatherburn H., 1994: Coal Developments, Group Planning, Shell International Petroleum
i Company., 47. Williams R.H., 1998: "Fuel decarbonization for fuel cell applications and sequestration of! the separated CO2," in Eco-Restructuring: Implications for Sustainable Development, R.
Ayres (ed.), United Nations University Press, Tokyo, pp. 180-222.48. Williams R.H., 1999: Hydrogen production from coal and coal bed methane, using
byproduct CO2 for enhanced methane recovery and sequestering the CO2 in the coal bed,pp. 799-804, in: Proceedings of the 4th International Conference on GHG ControlTechnologies, Interlaken, Switzerland, Aug. 30 -Sept. 2, Eliasson B., Riemer P., Wokaun A.,eds. Pergamon, Amsterdam, p.1205.
49. Williams R.H., Larson E.D., Katofsky R.E. and Chen J., 1995a: Methanol and Hydrogen fromBiomass for Transportation, with Comparisons to Methanol and Hydrogen from NaturalGas and Coal. PU/CEES Report No. 292, Center for Energy and Environmental Studies,Princeton University, Princeton, NJ, July.
50 Williams R.H., Larson E.D., Katofsky R.E. and Chen J., 1995b: Methanol and hydrogen frombiomass for transportation. Energy for Sustainable Development, 1 (5), pp. 18-34.
51. Wilson R. and Spengler J.,. eds., 1996: Particles in Our Air: Concentrations and HealthEffects, Harvard University Press, Cambridge.
52. World Bank, 1997: Clear Water, Blue Skies: China's Environment in the New Century.Washington, D.C.
8
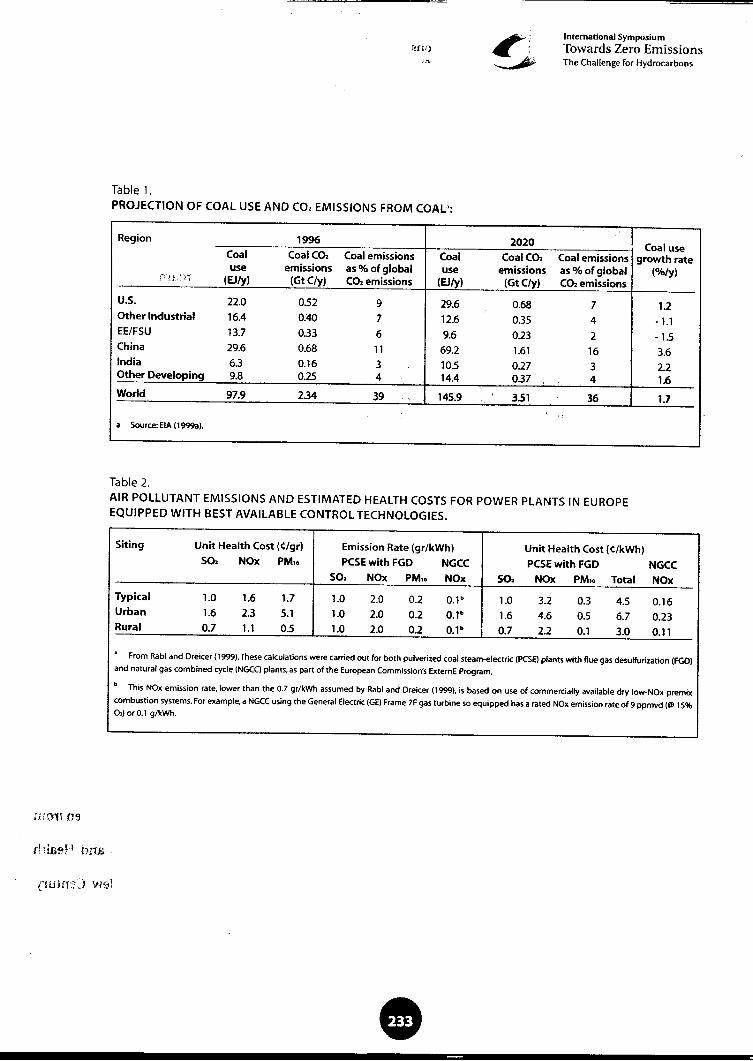
1-'; International Symposiumi!fli,) «: Towards Zero Emissions
.", ~ The Challenge for Hydrocarbons
Table 1.PROJECTION OF COAL USE AND CO, EMISSIONS FROM COAL':
Region 1996 2020 Coal useCoal Coal Co. Coal emissions Coal Coal Co. Coal emissions growth rate
..use emissions as % of global use emissions as % of global (%/y)r It'' \1 (EJ/y) (Gt C/y) Co. emissions (EJ/y) (Gt C/y) Co. emissions
U.S. 220 0.52 9 29.6 0.68 7 1.2Other Industrial 16.4 0:40 7 12.6 0.35 4 -1.1
EE/FSU 13.7 0.33 6 9.6 0.23 2 -15China 29.6 0.68 11 69.2 1.61 16 3.6India 6.3 0.16 3 105 0.27 3 2.2Other Developing 9.8 0.25 4 14.4 0.37 4 1.6
World 97.9 234 39.. 145.9" 3.51 36 1.7
a Source: EIA (l999a).
Table 2.AIR POLLUTANT EMISSIONS AND ESTIMATED HEALTH COSTS FOR POWER PLANTS IN EUROPE
EQUIPPED WITH BEST AVAILABLE CONTROL TECHNOLOGIES.
Siting Unit Health Cost ((/gr) Emission Rate (gr/kWh) Unit Health Cost ((/kWh)SO, NOx PM,. PCSE with FGD NGCC PCSE with FGD NGCC
so. NOx PM,. NOx So. NOx PM,. Total NOx
Typical 1.0 1.6 1.7 1.0 2.0 0.2 0.1" 1.0 3.2 0.3 4.5 0.16Urban 1.6 2.3 5.1 1.0 20 0.2 0.1" 1.6 4.6 0.5 6.7 0.23Rural 0.7 1.1 0.5 1.0 2.0 0.2 0.1" 0.7 2.2 0.1 3.0 0.11
.From Rabl and Dreicer (1999). These calculations were carried out for both pulverized coal steam-electric (PCSEJ plants with flue gas desulfurization (FGD)
and natural gas combined cycle (NGCC) plants, as part of the European Commission's ExternE Program.
" This NOx emission rate. lower than the 0.7 gr/kWh assumed by Rabl and Dreicer (1999), is based on use of commercially available dry low-NOx premix
combustion systems. For example, a NGCC using the General Electric (GE) Frame 7F gas turbine so equipped has a rated NOx emission rate of 9 ppmvd (@ 1 S%
0,) or 0.1 g/kWh
ilia!:! n~
ri : iD9 r.j bill::
(fUlfi:::) \01'31
e
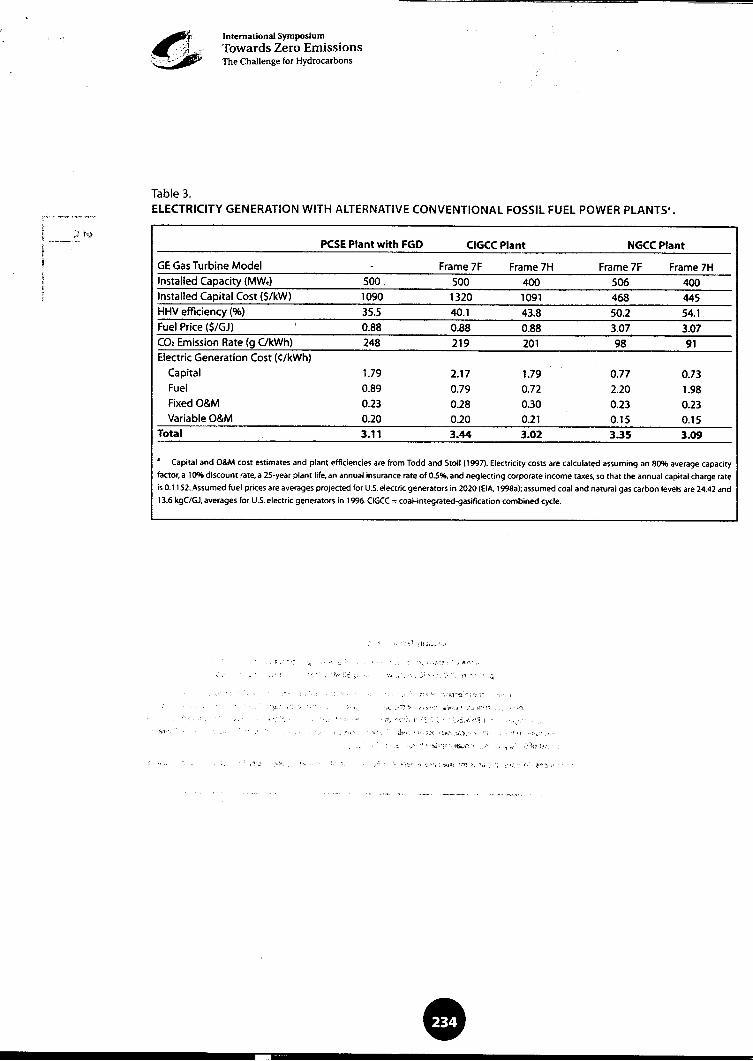
~ Intemadonal Symposium,« :~~;. Towards Zero Emissions,~~ The Challenge for Hydrocarbons
Table 3.ELECTRICITY GENERATION WITH ALTERNATIVE CONVENTIONAL FOSSIL FUEL POWER PLANTS'.
r- cl
I ) t1l)i ~ PCSE Plant with FGD ClGCC Plant NGCC Plant
! GE Gas Turbine Model Frame 7F Frame 7H Frame 7F Frame 7H
! Installed Capacity (MW.) 500 ! 500 400 506 400.i Installed Capital Cost ($/kW) 1090 1320 1091 468 445
HHV efficiency ('!EI) 35.5 40.1 43.8 50.2 54.1Fuel Price ($/GJ) , 0.88 0.88 0.88 3.07 3.07
CO, Emission Rate (9 C/kWh) 248 219 201 98 91Electric Generation Cost (C:/kWh)
Capital 1.79 2.17 1.79 0.77 0.73Fuel 0.89 0.79 0.72 2.20 1.98Fixed O&M 0.23 0.28 0.30 0.23 0.23VariableO&M 0.20 0.20 0.21 0.15 0.15
Total 3.11 3.44 3.02 3.35 3.09
.Capital and O&M cost estimates and plant efficiencies are from Todd and Stoll (1997)- Electricity costs are calculated assuming an 80% average capacity
factor, a 10% discount rate, a 2S-year plant life, an annual insurance rate of O.S%, and neglecting corporate income taxes, so that the annual capital charge rate
is 0.1152.Assumed fuel prices are averages projected for U.s. electric generators in 2020 (EIA, 1998a);assumed coal and natural gas carbon levels are 2442 and
13.6 kgCJGJ, averages for U.S. electric generators in 1996.ClGCC = coal-integrated-gasification combined cycle.
,Ji,'.c;C;'
""" ,ro"'"
i'!' c'r~",,( ,.,;", ""'.;';-:, ,;
j, l "", '" 1.
"i ",. '" ,,'- "",0,)',-;cc'W",
cC ..~o ",-'C"""i""C"""";';1c,.c~r)
.-,-., --,"_c ., ~.-.
e
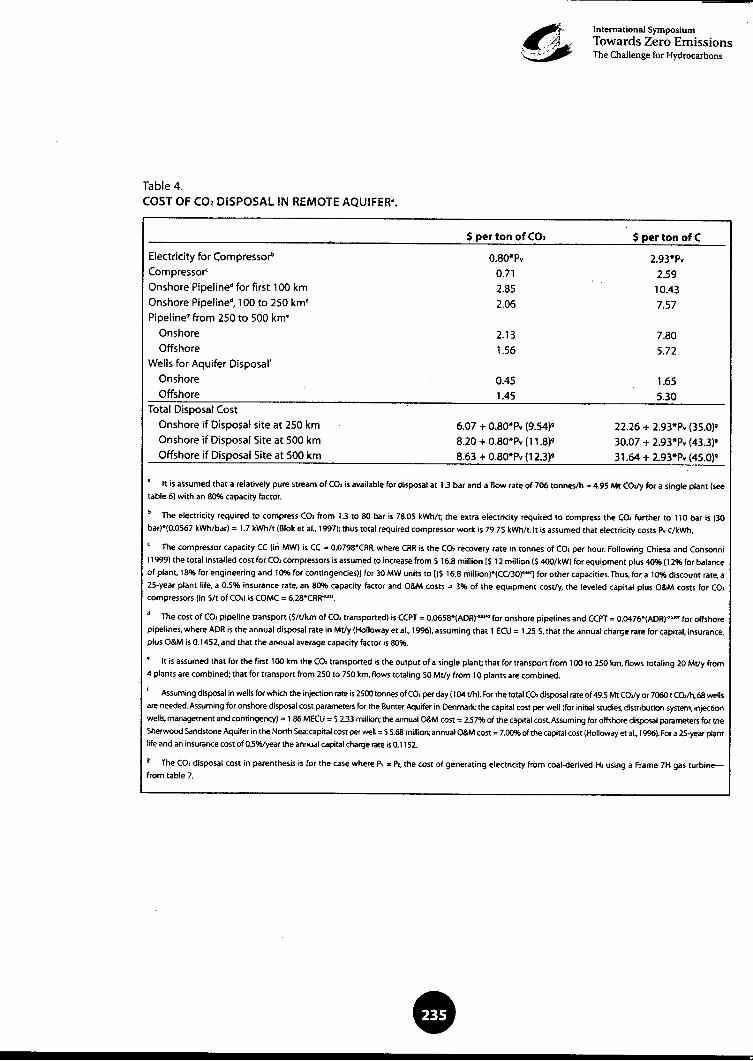
~ International Symposium...~1Z'~ Towards Zero Emissions,~~ The Challenge for Hydrocarbons
Table 4.COST OF CO2 DiSPOSAL IN REMOTE AQUIFER'.
$ per ton of CO, $ per ton of C-.Electricity for Compressor" 0.80*Pv 2.93*Pv
Compressor 0.71 2.59Onshore Pipeline" for first 100 km 2.85 10.43Onshore Pipeline", 100 to 250 km' 2.06 7.57
Pipeline" from 250 to 500 km'Onshore 2. 13 7.80Offshore 1.56 5.72
Wells for Aquifer Disposal'
Onshore 0.45 1.65Offshore 1.45 5.30
Total Disposal CostOnshore if Disposal site at 250 km 6.07 + 0.80*Pv (9.54)9 22.26 + 2.93*Pv (35.0)9
Onshore if Disposal Site at 500 km 8.20 + 0.80*Pv (11.8)9 30.07 + 2.93*Pv (43.3)"Offshore if Disposal Site at 500 km 8.63 + 0.80*Pv (12.3)9 31.64+ 2.93*Pv (45.0)".
, It is assumed that a relatively pure stream of CO. is available for disposal at 1.3 bar and a flow rate of 706 tonnes/h = 4.9S Mt COJy for a single plant (see
table 6) with an 80% capacity factor.
b The electricity required to compress CO, from 1.3 to 80 bar is 78.0S kWh/t; the extra electricity required to compress the CO, further to 110 bar is (30
bar)*(0.0567 kWh/bar) = 1.7 kWh/t (Blok et al., 1997); thus total required compressor work is 7975 kWh/t.lt is assumed that electricity costs Pv C/kWh.
, The compressor capacity CC (in MW) is CC = 0.0798*CRR, where CRR is the CO, recovery rate in tonnes of co. per hour Following Chiesa and Consonni
(1999) the total installed cost for CO. compressors is assumed to increase from S 16.8 million [S 12 million (S 4OO/kW) for equipment plus 40% (12% for balance
of plant. 18% for engineering and 10% for contingencies)] for 30 MW units to [(S 16.8 million)*(CC/30)"M'] for other capacities. Thus, for a 10% discount rate, a
25-year plant life, a 0.5% insurance rate, an 80% capacity factor and O&M costs = 3% of the equipment costly, the leveled capital plus O&M costs for CO,compressors (in SIt of Co,) is COMC = 6.28*CRR""'.
" The cost of CO, pipeline transport (S/tlkm of CO, transported) is CCPT = 0.0658*(ADR)""" for onshore pipelines and CCPT = 0.0476.(ADR)."" for offshore
pipelines, where ADR is the annual disposal rate in Mtly (Holloway et al.. 1996), assuming that 1 ECU = 125 S. that the annual charge rate for capital, insurance,
plus O&M is 0.1452, and that the annual average capacity factor is 80%.
, It is assumed that for the first 100 km the CO, transported is the output of a single plant; that for transport from 100 to 250 km, flows totaling 20 Mtly from
4 plants are combined; that for transport from 250 to 750 km, flows totaling 50 Mtly from 10 plants are combined.
f Assuming disposal in wells for whkh the injection rate is 2500 tonnes of CO. per day (104 t/h). For the total Co, disposal rate of 49.5 Mt COJy or 7060 t Co,/h,68 wells
are needed. Assuming for onshore disposal cost parameters for the 8unter Aquifer in Denmark: the capital cost per well (for initial studies, distribution system. injection
wells, management and contingency) = 186 MECU = S 233 million; the annual O&M cost = 257% of the capital cost Assuming for offshore disposal parameters for the
Sherwood Sandstone Aquifer in the North Sea: capital cost per well = S 5.68 million; annual O&M cost = 7.00% of the capital cost (Holloway et al. 1996). For a 25-year plant
life and an insurance cost of 05%1year the annual capital charge rate is 0.1152.
9 The CO, disposal cost in parenthesis is for the case where Pv = Po, the cost of generating electricity from coal-derived H, using a Frame 7H gas turbine-
from table 7.
e
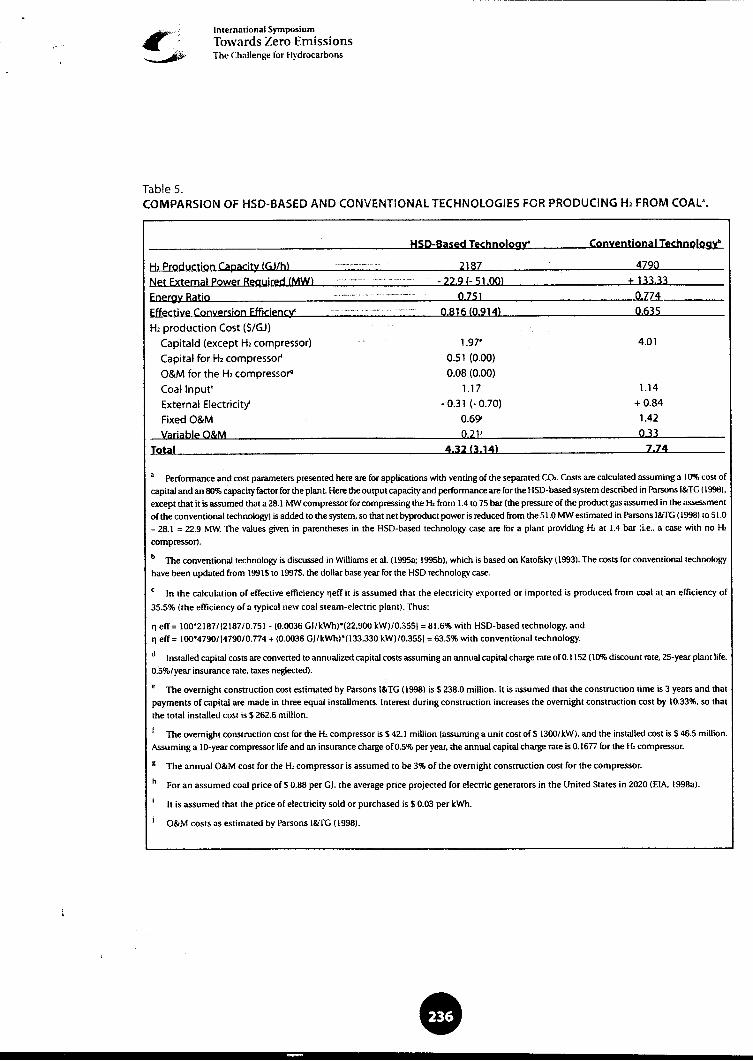
-~
..". ~ Inlernalional Symposium...Towards Zero Emissions~, The Challenge for Hydrocarbons
Table 5.COMPARSION OF HSD-BASED AND CONVENTIONAL TECHNOLOGIES FOR PRODUCING H2 FROM COAL'.
HSD-Based Technoloav- Conventional Technolog~
H, Production Capaci~ (GJ/h) " 2187 4790
1
H2 production Cost ($/GJ)
Capitald (except H2 compressor) 1.97' 4.01
Capital for H2 compressor' 0.51 (0.00)
O&M for the H, compressor" 0.08 (0.00)
Coallnputh 1.17 1.14
External Electricity' -0.31 (- 0.70) + 0.84
Fixed O&M 0.69 1.42
Variablp O&M 021' 0.33
Total 4_32/3.14\ 7.74
a Performance and COSI paramelers presented here are for applications with venling of me separnled co,. CoSIS are calculated assuming a I o"f. cost of
capital and an 80% capacity factor for me plan I. Here me OUlpUI capacity and performance are for me HSD-based syslem described in Parsons 1& TG (1998).exceplmat il is assumed that a 28.1 MW compressor for compressing me H, from 1.41075 bar (me pressure of me product gas assumed in Ihe assessmentof the conventional technology) is added to me system. so mat nel byproduct power is reduced from me 51.0 MW estimaled in Parsons l&'rG (1998) (051.0-28.1 = 22.9 MW: The values given in parenmeses in the HSD-based technology case are for a plant providing H, at 1.4 bar (i.e.. a case wilh no H,
compressor).b The convemionallechnology is discussed in Williams el aI. (1995a; 1995b), which is based on Katofsky (1993). The COSIS for convemionallechnology
have been updated from 1991$10 1997S, the dollar base year for Ihe HSD lechnology case.
C In the calculation of effeclive efficiency Ileff il is assumed Ihal the eleclricity exported or imported is produced from coal at an efficiency of
35.5% (Ihe efficiency of a typical new coal sleam-electric plam). Thus:
11 eff= 100"2187/12187/0.751 -(0.0036 GJ/kWh)"(22.900 kW)/0.3551 = 81.6% wilh HSD-based technology. and11 err = 100"4790/14790/0.774 + (0.0036 GJ/kWh)"(133.330 kW)/0.3551 = 63.5% wilh convemional technology.
d Installed capital COSIS are converted to annualized capital COSIS assuming an annual capilal charge rare of 0.1 152 (1O"f. discoum rare, 25-year plamlife.
O.S%/year insurance rare. laxes neglected).
.The overnight construction COSI estimated by Parsons I&TG (1998) is $ 238.0 million. It is assumed that the construction time is 3 years and thatpayments of capital are made in three equal installmems. Imerest during construction increases the overnight construction cost by 10.33%, so thatthe total installed cost is $ 262.6 million.
r The overnight construction cost for me H, compressor is $ 42.1 million (assuming a unit cost of$ 1300/kW). and the installed cost is $ 46.5 million.
Assuming a 10-year compressor life and an insurance charge of 0.5% per year, the annual capital charge rate is 0.1677 for me H, compressor.
g The annual O&M cost for the H, compressor is assumed to be 3% of the overnight construction cost for the compressor.
h For an assumed coal price ofS 0.88 per GJ. the average price projected for electric generators in the United States in 2020 (ElA, 1998a).
i It is assumed that the price of electricity sold or purchased is S 0.03 per kWh.
j O&M costs as estimated by Parsons I&TG (1998).
!
8
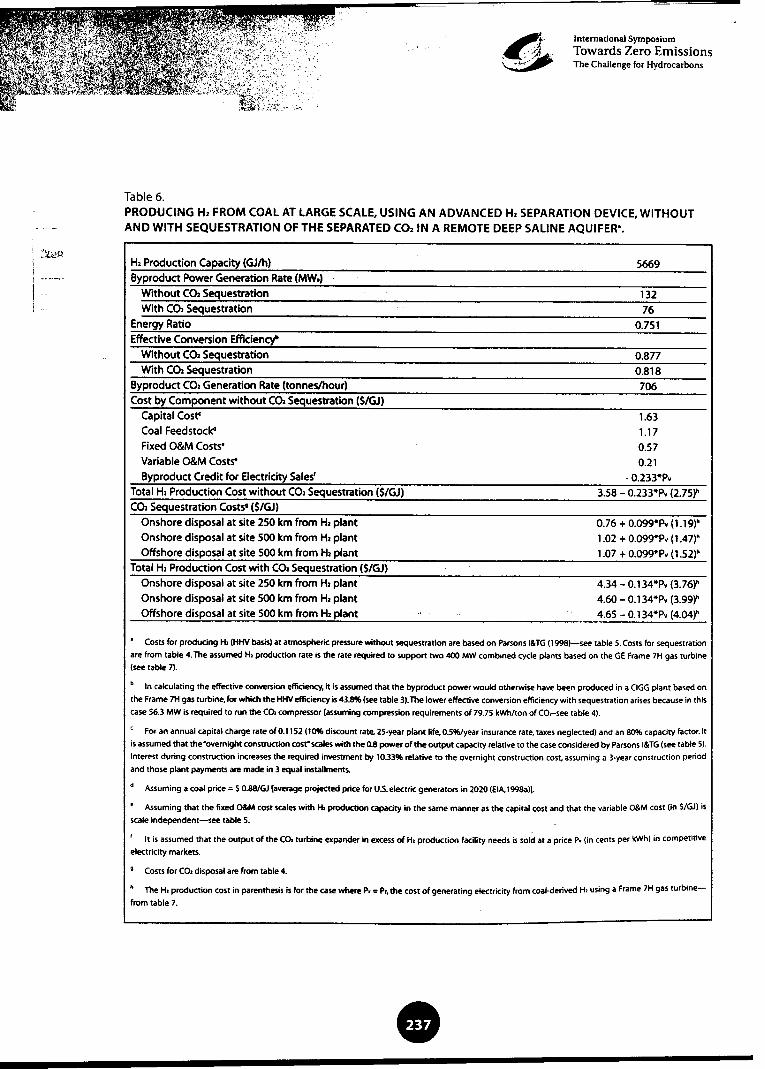
~r International Symposium.,,~ Towards Zero Emissions,~~ The Challenge for Hydrocarbons
Table 6.PRODUCING H, FROM COAL AT LARGE SCALE, USING AN ADVANCED H, SEPARATION DEVICE, WITHOUTAND WITH SEQUESTRATION OF THE SEPARATED CO, IN A REMOTE DEEP SALINE AQUIFER'.
H, Production Capacity (GJ/h) 5669
Byproduct Power Generation Rate (MW.)Without CO, Sequestration 132With Co, Sequestration 76
Energy Ratio 0.751
Effective Conversion Efficiency"Without Co, Sequestration 0.877With CO, Sequestration 0.818
j Byproduct CO, Generation Rate (tonnes/hour) 706
Cost by Component without Co, Sequestration ($/GJ)Capital Cost< 1.63Coal Feedstock" 1.17
i Fixed O&M Costs' 0.57
Variable O&M Costs' 0.21
Byproduct Credit for Electricity Sales' -0.233*P.Total H, Production Cost without CO, Sequestration ($/GJ) 3.58 -0.233*Pv (2.75)"
CO, Sequestration Costs' ($/GJ)Onshore disposal at site 250 km from H, plant 0.76 + O.099*P. (1.19)"Onshore disposal at site 500 km from H, plant 1.02 + 0.099*P. (1.47)"Offshore disposal at site 500 km from H, plant 1.07 + 0.099*P. (1.52)"
Total H, Production Cost with CO, Sequestration ($/GJ)Onshore disposal at site 250 km from H, plant 4.34 -0.134*P. (3.76)"Onshore disposal at site 500 km from H, plant 4.60 -0.134*P. (3.99)"Offshore disposal at site 500 km from H, plant 4.65 -0.134*P. (4.04)"
, Costs for producing H, (HHV basis) at atmospheric pressure without sequestration are based on Parsons IBoTG (1998)-see table 5. Costs for sequestration
are from table 4. The assumed H, production rate is the rate required to support two 400 MW combined cycle plants based on the GE Frame 7H gas turbine
(see table 7).
.In calculating the effective con.ersion efficiency, it is assumed that the byproduct power would otherwise have been produced in a ClGG plant based on
the Frame 7H gas turbine, for which the HHV efficiency is 43.8% (see table 3). The lower effective conversion efficiency with sequestration arises because in this
case 56.3 MW is required to run the Co, compressor (assuming compression requirements of 79.75 kWh/ton of CO,-see table 4).
, For an annual capital charge rate of 0.1152 (10% discount rate, 25-year plant life, 0.5%/year insurance rate, taxes neglected) and an 80% capacity factor. It
is assumed that the .overnight construction cost. scales with the 0.8 power of the output capacity relative to the case considered by Parsons IBoTG (see table 5).
Interest during construction increases the required investment by 10.33% relative to the overnight construction cost. assuming a 3-year construction period
and those plant payments are made in 3 equal installments.
d Assuming a coal price = S 0.88/GJ [average projected price for U.S electric generators in 2020 (EIA.1998a)].
.Assuming that the fixed OBoM cost scales with H, production capacity in the same manner as the capital cost and that the variable OBoM cost (in S/GJ) is
scale independent-see table 5.
I It is assumed that the output of the CO, turbine expander in excess of H. production facility needs is sold at a price p, (in cents per kWh) in competitive
electricity markets.
.Costs for CO, disposal are from table 4.
" The H, production cost in parenthesis is for the case where P, = Po, the cost of generating electricity from coal-derived H, using a Frame 7H gas turbine-
from table 7.
0
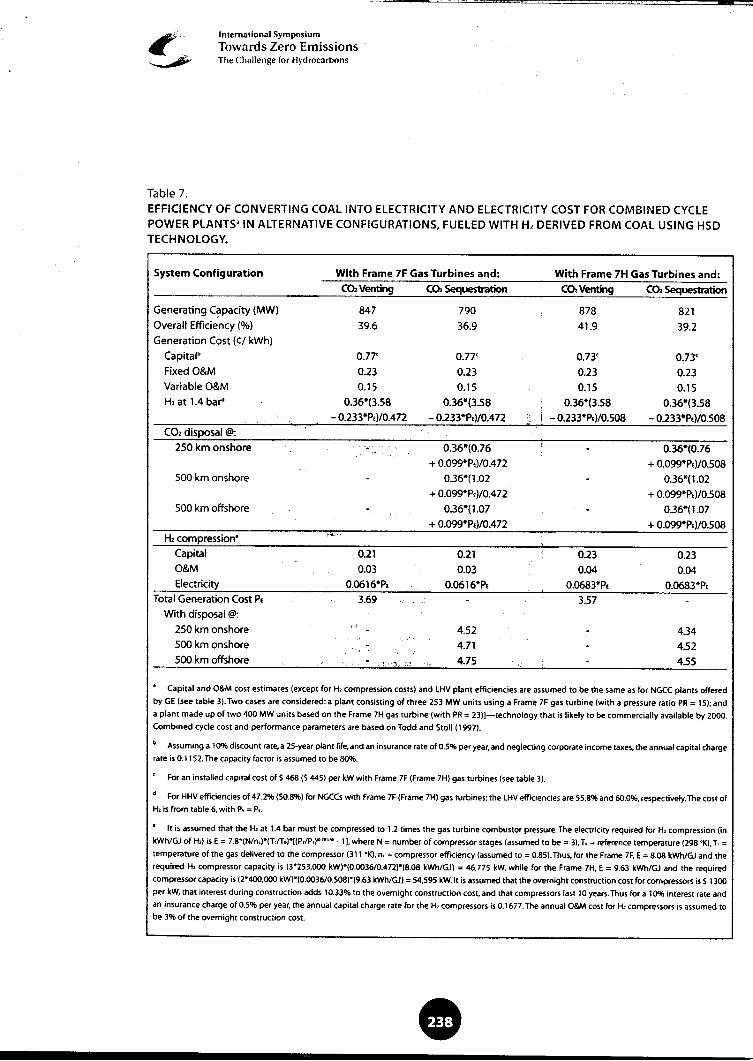
I' International Symposium
« Towards Zero Emissions~ The Challenge tor Hydrocarbnns
Table 7.EFFICIENCY OF CONVERTING COAL INTO ELECTRICITY AND ELECTRICITY COST FOR COMBINED CYCLE
POWER PLANTS' IN ALTERNATIVE CONFIGURATIONS, FUELED WITH H, DERIVED FROM COAL USING HSD
TECHNOLOGY.
System Configuration With Frame 7F Gas Turbines and: With Frame 7H Gas Turbines and:
Co, Venting Co, Sequestration Co, Venting Co, Sequestration
Generating C~pacity (MW) 847 790 878 821
Overall Efficiency (%) 39.6 36.9 41.9 39.2
Generation Cost (C:/ kWh)
Capital" 0.77' 0.77' 0.73' 0.73'
Fixed O&M 0.23 0.23 0.23 0.23
Variable O&M 0.15 0.15 0.15 0.15
H, at 1.4 bar" 0.36*(3.58 0.36*(3.58 0.36*(3.58 0.36*(3.58
-0.233*P,)/0.472 -0.233*P,)/0.472 ;: I -0.233*P,)/0.508 -0.233*P,)/0.508CO, disposal @: C
250 km onshore ---0.36*(0.76 : -0.36*(0.76
+ 0.099*P,)/0.472 + 0.099*P,)/0.508
500 km onshore -0.36*(1.02 -036*(1.02
+ 0.099*P,)/0.472 + 0.O99*P,)/0.508
500 km offshore -036*(1.07 -0.36*(1.07
+ 0.099*P,)/0.472; + 0.099*P,)/0.508...v"'H .,.. , compression" ,....
Capital 0.21 0.21 ! 0.23 0.23
O&M 0.03 0.03 0.04 0..04
Electricity 0.0616*P, 0.0616*P. 0.0683*P. 0.0683*P,.Total Generation Cost P, 3.69 -3.57
With disposal @:250 km onshore i) -4.52 -4.34
500 km onshore -4.71 .4.52
500 km offshore C". -';0",: 1, 4.75 ,.., -455
.Capital and O&M cost estimates (except for H, compression costs) and LHV plant efficiencies are assumed to be the same as for NGCC plants offered
by GE (see table 3).. Two cases are considered: a plant consisting of three 2S3 MW units using a Frame 7F gas turbine (with a pressure ratio PR = 1 s); and
a plant made up of two 400 MW units based on the Frame 7H gas turbine (with PR = 23)]-technology that is likely to be commercially available by 2000
Combined cycle cost and performance parameters are based on Todd and 5toll (1997).
" Assuming a 10% discount rate, a 25-year plant life, and an insurance rate of 0.5% per year, and neglecting corporate income taxes, the annual capital charge
rate is 0.1152. The capacity factor is assumed to be 80%.
, For an installed capital cost of $ 468 ($ 445) per kW with Frame 7F (Frame 7H) gas turbines (see table 3).
d For HHV efficiencies of 47.2% (508%) for NGCCs with Frame 7F (Frame 7H) gas turbines; the LHV efficiencies are 55.8% and 60.0%, respectively. The cost of
H, is from table 6, with P, = Po.
" It is assumed that the H, at 1.4 bar must be compressed to 12 times the gas turbine combustor pressure. The electricity required for H, compression (in
kWh/GJ of H,) is E = 7.8*(N/n,)*(T,IT.)*[(P,/P,)"""M -1]. where N = number of compressor stages (assumed to be = 3), T, = reference temperature (298 'K), T =
temperature of the gas delivered to the compressor (311 'K), n. = compressor efficiency (assumed to = 0..85). Thus, for the Frame 7F, E = 8.OB kWh/GJ and the
required H, compressor capacity is (3*253,000 kW)*(0.0036/0.472)*(8.08 kWh/GJ) = 46,775 kW, while for the Frame 7H, E = 9.63 kWh/GJ and the required
compressor capacity is (2*400,000 kW)*(0.0036/0..5OB)*(9.63 kWh/GJ) = S4,595 kW.lt is assumed that the overnight construction cost for compressors is $ 1300
per kW, that interest during construction adds 10.33% to the overnight construction cost, and [hat compressors last 10 years. Thus for a 10% interest rate and
an insurance charge of 0..5% per year, [he annual ~api[al charge rate for the H, compressors is 0.1677 The annual O&M cost for H, compressors is assumed to
be 3% of the overnight construc:ion cost.
e
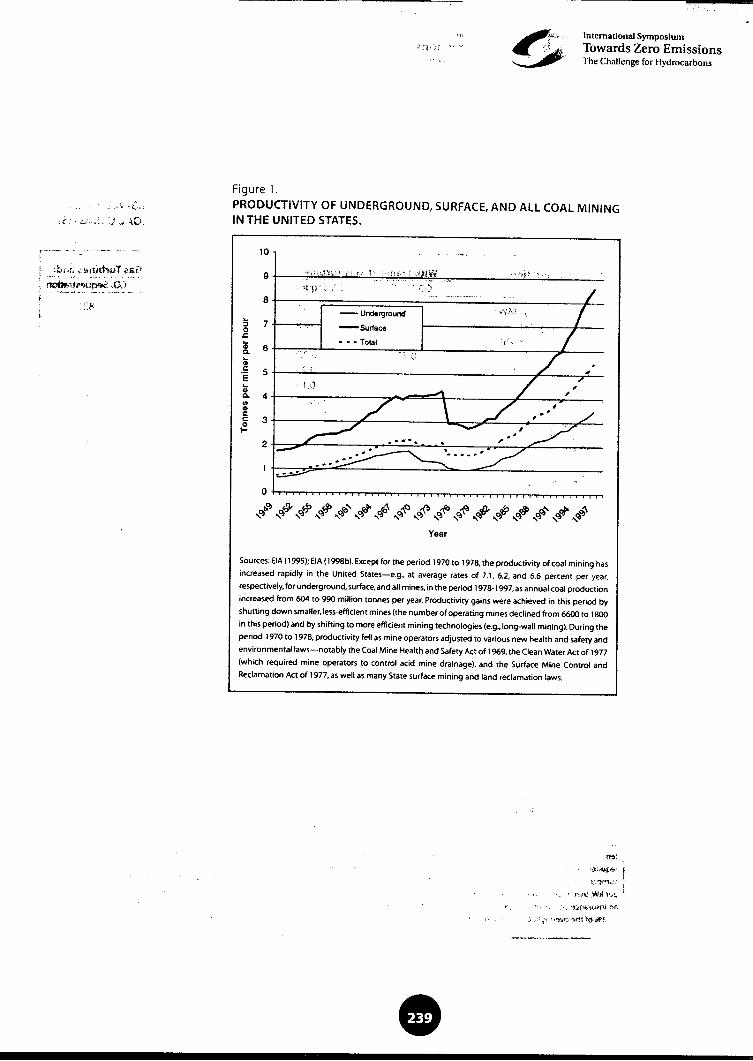
-
." -""!:"" International Symposium
"~1,i ..~~. Towards Zero Emissions~ The Challenge for Hydrocarbons
Figure 1.
,'.. ,f, PRODUCTIVITY OF UNDERGROUND, SURFACE, AND ALL COAL MINING.,'. ...:,! .,~O IN THE UNITED STATES.
c"-- --"- -10 --i
-=~::~: ,"l1~~I!T ,,~i1 9 ,':,i'~:~~~::!?:\
8'~1'g 7 -Surface.c~ ...Total
! 6 ;
; ,So 5EiCo 4co.Cc 30
I-
2
1
0
q~ q~ q~ q~ q~' q~ q~ q~~ q~ ~~~ ~~ ~~ ~~ ~~ ~q' ~~ ~~" " " " " " " " " ,." ,." ,." ,," ,-.. ,'" ,." ,,"Year
Sources:EIA (I99S);EIA (1998b).Excepl for the period 1970 10 1978,Ihe productivily of coal mining has
increased rapidly in the United Slates-eg.. at average rates of 7.1, 6.2, and 6.6 percent per year.
respectively, for underground, surface. and all mines, in the period 1978" 1997. as annual coal production
increased from 604 10 990 million tonnes per year. Productivily gains were achieved in this period by
shutting down smaller, less-efficient mines (the number of operating mines declined from 6600 to 1800
in this period) and by shifting 10 more efficient mining technologies (e.g., long-wall mining). During the
period 1970 to 1978,produclivily fell as mine operators adjusted to various new health and safely and
environmental laws-notably the Coal Mine Health and Safely Act of 1969, the Clean Water Act of 1977
(which required mine operators to control acid mine drainage), and the Surface Mine Control and
Reclamation Act of 1977, as well as many Slate surface mining and land reclamation laws.
M1 ,""""1:"" I,"'~""'(:, :
,"'n) Wj ""~ '
c S;;f'ii""'" '"
;"!;;",,,""",""llo,'!'f.
e
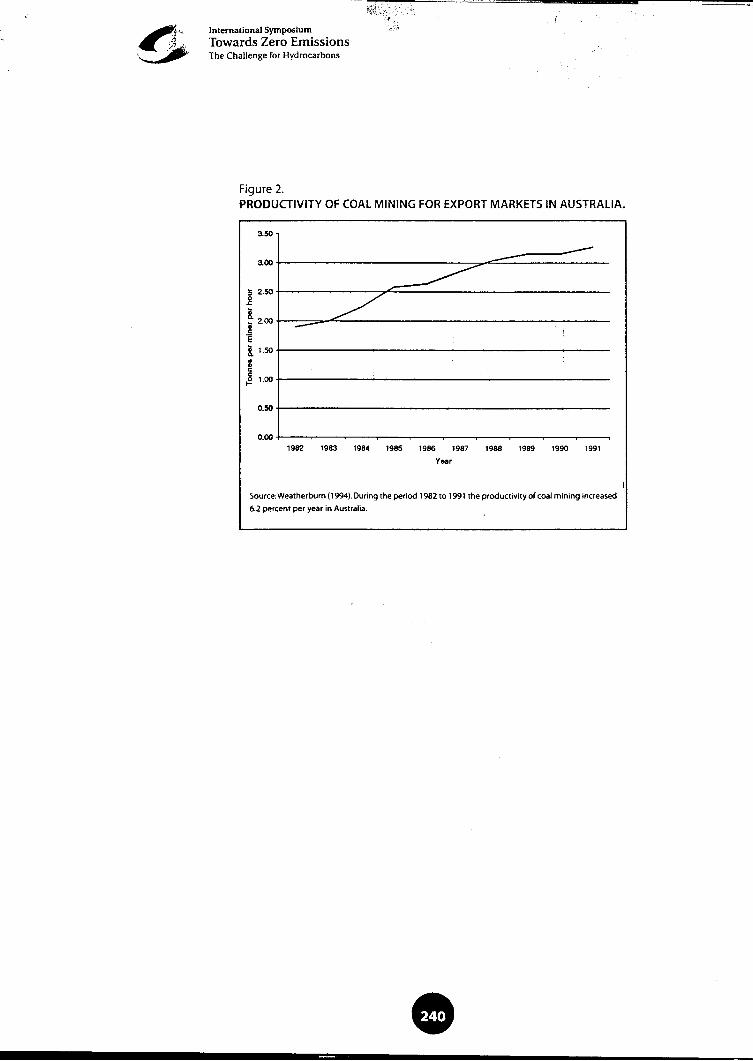
-i~~~ I ---~
~,~ International Symposium c
,. .~2 Towards Zero Emissions::::::~c The Challenge for Hydrocarbons
Figure 2.PRODUCTIVITY OF COAL MINING FOR EXPORT MARKETS IN AUSTRALIA.
3.50
3.00
~ 2.500J:
!.~ 2.00~cE!. 150~~cc
~ 1.00
0.50
0.001982 1983 1984 1985 1986 1987 1988 1989 1990 1991
Year
ISource:Weatherburn (1994).During the period 1982 to 1991 the productivity of coal mining increased
6.2 percent per year in Australia.
e
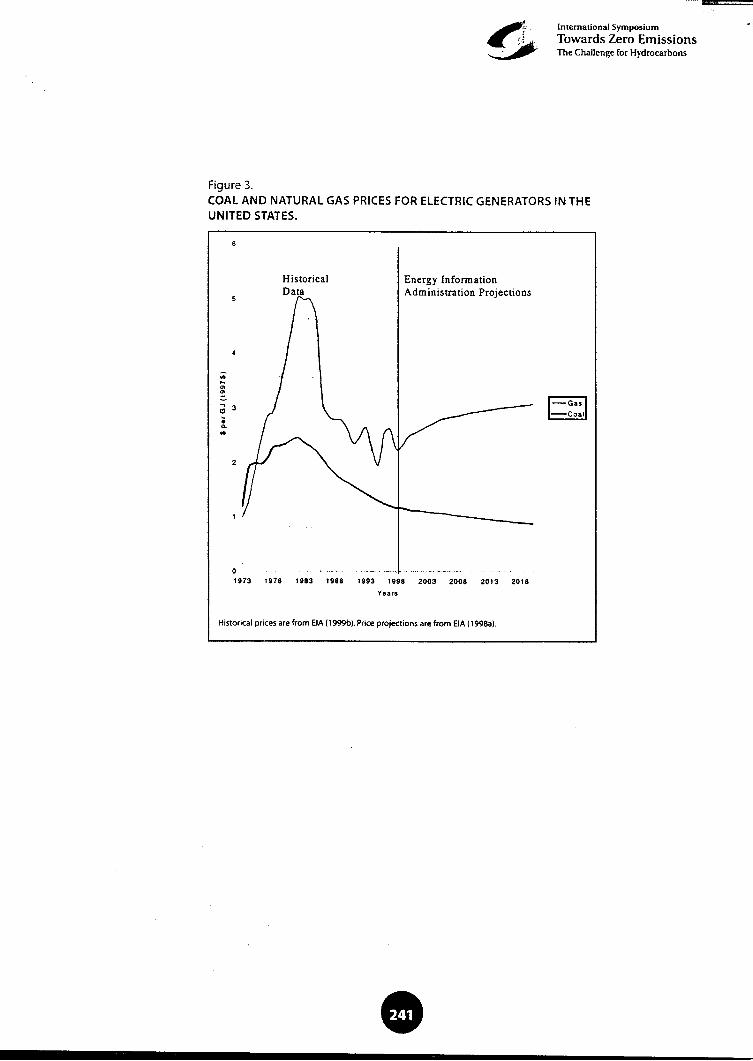
~o International Symposium .« ;1, Towards Zero Emissions~~ The Challenge for Hydrocarbons
Figure 3.COAL AND NATURAL GAS PRICES FOR ELECTRIC GENERATORS IN THE
UNITED STATES.
6
Historical Energy InformationData Administration Projections
5
4
~
:;~
:;- 3 I-G.. I': I-Coall.~~
2
1
0 1973 1978 1983 1988 1993 1998 2003 2008 2013 2018
Voa..
Historical prices are from EIA (1999b). Price projections are from EIA (1998a).
18
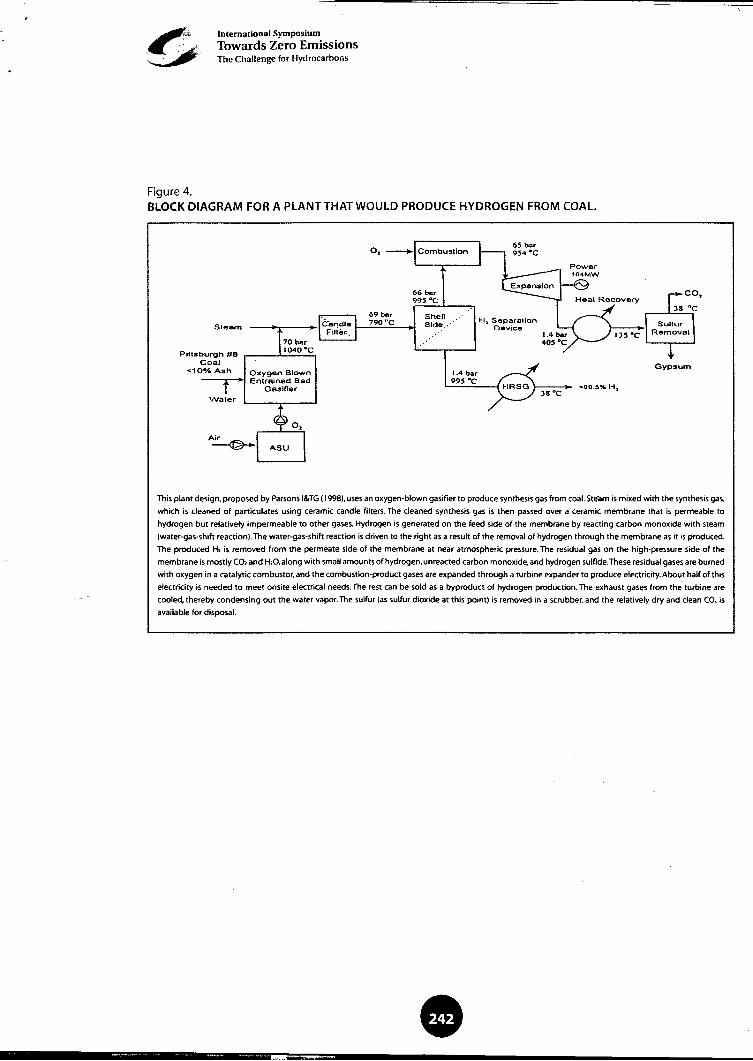
~ -~-,
~,,;;.c International Symposium. ....~ t Towards Zero Emissions::::., The Challenge for Hydrocarbol1s
Figure 4.BLOCK DIAGRAM FOR A PLANT THAT WOULD PRODUCE HYDROGEN FROM COAL.
0.-1;$10 . 38 .C
69 hnr790"CSteam Sulf"lr
Removal
Pittsburgh #8Coal.GYPs"lm<10VoAsh Oxygen Blown
Enlrained BedGasifier >00.5% 1-1.
Water
A~
This plant design, proposed by Parsons I&TG (1998), uses an oxygen-blown gasifier to produce synthesis gas from coal.Ste-am is mixed with the synthesis gas,
which is cleaned of particulates using ceramic candle filters. The cleaned synthesis gas is then passed over a ceramic membrane that is permeable to
hydrogen but relatively impermeable to other gases. Hydrogen is generated on the feed side of the membrane by reacting carbon monoxide with steam
(water-gas-shift reaction). The water-gas-shift reaction is driven to the right as a result of the removal of hydrogen through the membrane as it is produced.
The produced H, is removed from the permeate side of the membrane at near atmospheric pressure. The residual gas on the high-pressure side of the
membrane is mostly CO, and H,O, along with small amounts of hydrogen, unreacted carbon monoxide, and hydrogen sulfide. These residual gases are burned
with oxygen in a catalytic combustor, and the combustion-product gases are expanded through a turbine expander to produce electricity. About half of this
electricity is needed to meetonsite electrical needs. The rest can be sold as a byproduct of hydrogen production. The exhaust gases from the turbine are
cooled, thereby condensing out the water vapor. The sulfur (as sulfur dioxide at this point) is removed in a scrubber. and the relatively dry and clean CO, is
available for disposal.
e~"""-