Embed Size (px)
Citation preview

© 2015, Carbon Counts
Emissions accounting for CO2-EOR
Paul Zakkour Carbon Counts
7th IEA CCS Regulators Network Meeting, Paris, 23.04.2015
© 2015, Carbon Counts
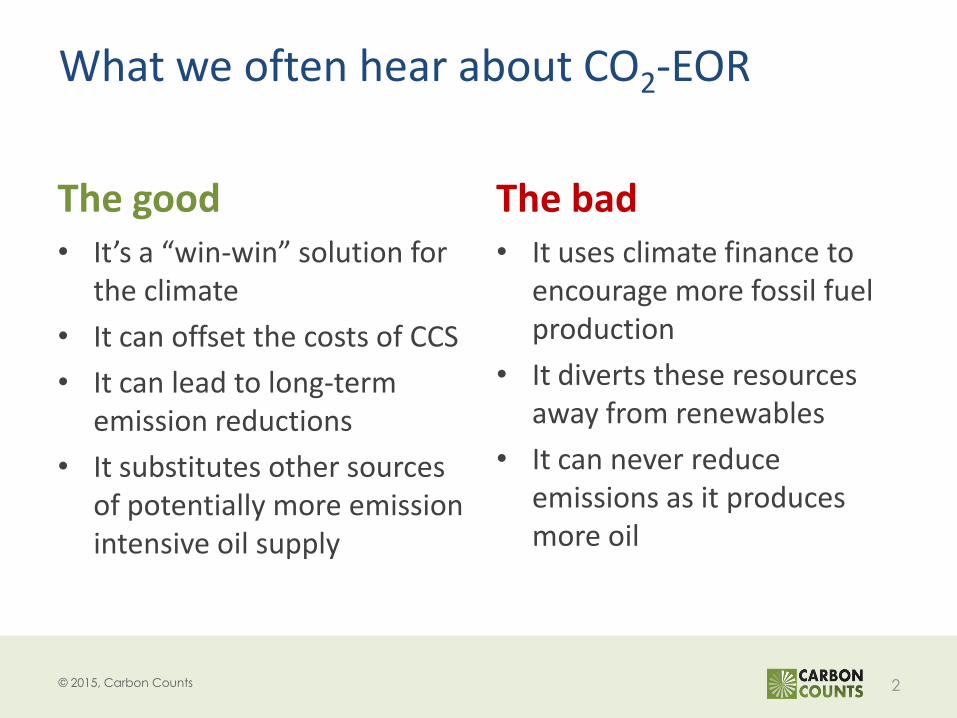
What we often hear about CO2-EOR
The good • It’s a “win-win” solution for
the climate
• It can offset the costs of CCS
• It can lead to long-term emission reductions
• It substitutes other sources of potentially more emission intensive oil supply
The bad • It uses climate finance to
encourage more fossil fuel production
• It diverts these resources away from renewables
• It can never reduce emissions as it produces more oil
2
© 2015, Carbon Counts
How can we address these questions?
• Greenhouse gas emission accounting
– Provides an objective basis for measuring net CO2 emission reductions arising from operations
• Accounting issues for EOR:
– Site level emissions
– Subsurface monitoring
– Incrementally produced crude oil
3

© 2015, Carbon Counts
How can we account?
Life cycle analysis
• Ex ante estimate of full chain emissions
• Usually based on scenarios and estimates
• Boundaries and assumptions are critical factors
• Rubbish in, rubbish out
Measurement, reporting and verification (MRV or MMV) • Ex post measurement of
emissions
• Based on performance of actual operations
• Boundaries and measurement approach determined by scheme rules
4
Both approaches are relevant:
• MRV provides guidance and rules in order to measure effectiveness of GHG policies and targets
• Essential part of carbon price incentives e.g. C-Tax or ETSs
• LCA can reveal whether CO2-EOR delivers net emission reductions, and therefore validity as an emission reduction technology
• Can be useful for e.g. EIA of projects

© 2015, Carbon Counts
What needs to be measured?
5
CO2
pipeline
Variable
shipping
methods
and
distances
Variable
product
slate
Variable
grade
crude /
refining
required
Midstream
CO2 CO2
Topping
Hydroskimming
Cracking Coking
Variable
end uses
Downstream
CO2
Variable
shipping
methods
and
distances
CO2
CO2 storage + EOR
reservoir EOR and
CO2 storage
oil recovery
& break-through CO2
CO2
injection
injection
wells
production wells
CO2
recycle
reception,
pumping
& distribution
CO2
separation
CO2
Range of emission
sources
Ve
nt/
fla
re
dissolved
CO2
Upstream
CO2
Emissions from fuel
supply (mining, natural
gas production etc.)
© 2015, Carbon Counts
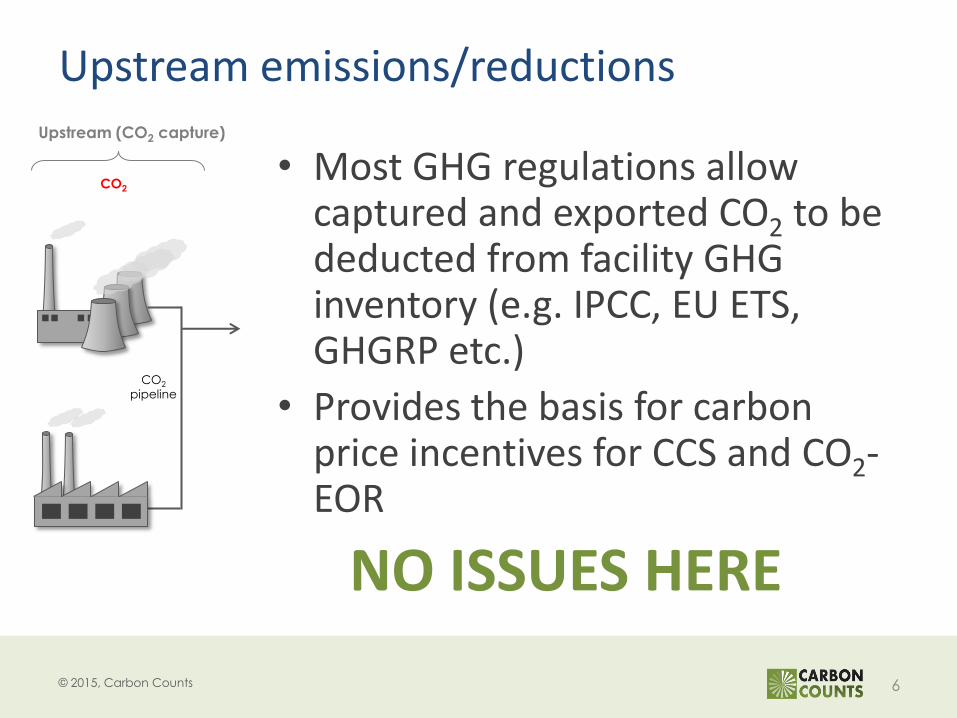
Upstream emissions/reductions
• Most GHG regulations allow captured and exported CO2 to be deducted from facility GHG inventory (e.g. IPCC, EU ETS, GHGRP etc.)
• Provides the basis for carbon price incentives for CCS and CO2-EOR
NO ISSUES HERE
6
CO2
pipeline
Upstream (CO2 capture)
CO2

© 2015, Carbon Counts
Site-level emissions
7
CO2 storage + EOR
reservoir EOR and
CO2 storage
oil recovery
& break-through CO2
CO2
injection
injection
wells
production wells
CO2
recycle
reception,
pumping
& distribution
CO2
separation
CO2
Range of emission
sources
Ve
nt/
fla
re
dissolved
CO2
• All GHG policies supporting CCS require monitoring of storage site emissions (e.g. IPCC, EU ETS, GHGRP etc.). Including CO2-EOR: – Surface energy use
– Vents, flares and other fugitives
– Reservoir seepage monitoring
• Emissions added to overall CCS inventory to give net reductions within scheme boundary
NO ISSUES HERE
© 2015, Carbon Counts
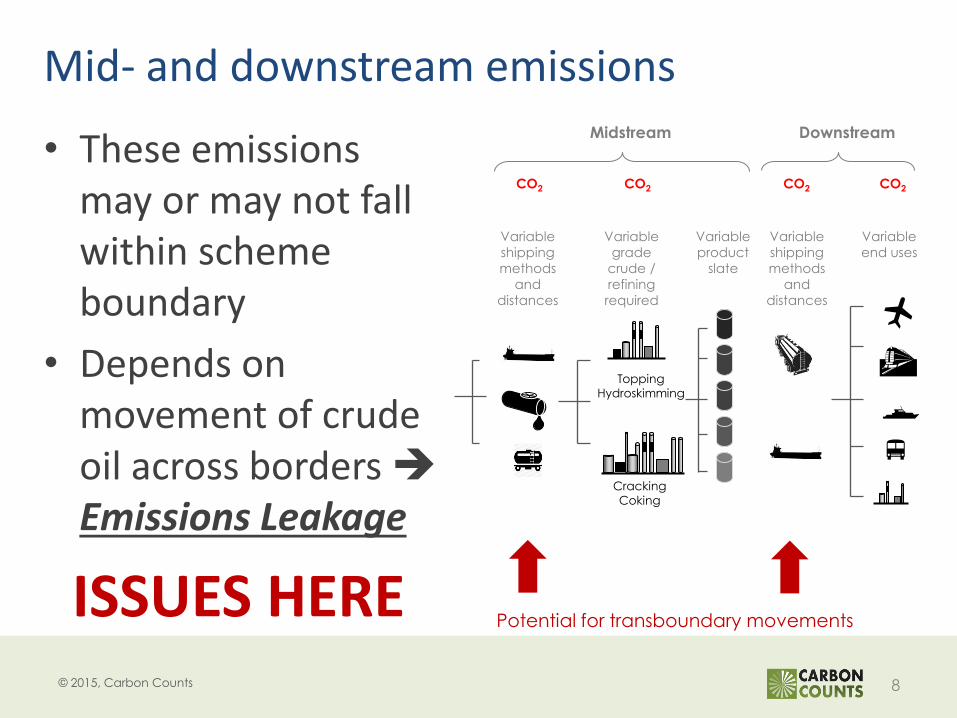
Mid- and downstream emissions
8
Potential for transboundary movements
Variable
shipping
methods
and
distances
Variable
product
slate
Variable
grade
crude /
refining
required
Midstream
CO2 CO2
Topping
Hydroskimming
Cracking Coking
Variable
end uses
Downstream
CO2
Variable
shipping
methods
and
distances
CO2
• These emissions may or may not fall within scheme boundary
• Depends on movement of crude oil across borders Emissions Leakage
ISSUES HERE

© 2015, Carbon Counts
Emissions leakage
• Defined as: – “potential for net changes in emissions to occur
outside the boundaries and operational control of a particular policy and/or activity, but arising as a consequence of the policy and/or activity”
• Scope to affect environmental integrity of scheme incentivising CO2 storage via EOR
• Risk where asymmetry in GHG policies and measures (PAMs) between (a) where capture and EOR occurs; and
(b) where crude is refined and used
9

© 2015, Carbon Counts
Nature of leakage risk
Substitution Addition
10
Average cost ($/bbl)
Consumption (Mbbl/day)
EOR
su
pp
ly
Restrained consumption Low risk of emissions leakage
Average cost ($/bbl)
Consumption (Mbbl/day)
EOR
su
pp
ly
Unrestrained consumption Risk of emissions leakage
Sup
ply
dis
pla
ced
Co
nsu
mp
tio
n in
crea
sed

© 2015, Carbon Counts
GHG PAMs can indicate risk of leakage
Low risk
• Refining subject to emission controls e.g. EU ETS, GHGRP
• End-use subject to constraints e.g. – Portfolio standards for
vehicles
– Portfolio standards for fuel suppliers
– Aviation sector controls
Substitution
High risk
• Weak policies and/ or no controls in place
• Scope for unconstrained increase in fossil fuel use
• Subsidies on fossil fuel consumption can actually encourage growth
Addition
11

© 2015, Carbon Counts
But not the perfect measure of risk
• Wide range of other factors at play:
– Oil price dynamics
– Subsidies on production and consumption
– Political interventions e.g. quotas, etc.
• Variations in stringency of GHG PAMs:
– Variation in Kyoto Protocol and INDC “targets”
– Variations in national PAMs e.g.
EU vehicle std: 130 gCO2/km (2014) 95/gCO2 km (2020)
US vehicle std: 140 gCO2/km (2016) 113/gCO2 km (2020)
12

© 2015, Carbon Counts
Leakage effect also difficult to measure
13
Average emissions (tCO2/bbl)
Consumption (Mbbl/day)
EOR
su
pp
ly
Actual emissions intensity?
Market marginal supply emissions intensity?
Market average supply emissions intensity?
Many factors to consider in selecting the appropriate measure

© 2015, Carbon Counts
Discussion of these issues forthcoming in IEA GHG report:
Paul Zakkour Director, Carbon Counts E: [email protected] W: www.carbon-counts.com T: +44 20 8870 3330 / +44 20 3603 8146 / +44 7834 161016