Embed Size (px)
Citation preview

Environmental Management (2021) 68:860–881https://doi.org/10.1007/s00267-021-01534-2
Emission, Transport, and Deposition of visible Plastics in an Estuaryand the Baltic Sea—a Monitoring and Modeling Approach
Gerald Schernewski 1,2● Hagen Radtke1 ● Esther Robbe1,2 ● Mirco Haseler1,2 ● Rahel Hauk3 ● Lisa Meyer1 ●
Sarah Piehl1 ● Joana Riedel1 ● Matthias Labrenz1
Received: 23 June 2021 / Accepted: 26 August 2021 / Published online: 10 September 2021© The Author(s) 2021
AbstractAim was to assess whether a comprehensive approach linking existing knowledge with monitoring and modeling canprovide an improved insight into coastal and marine plastics pollution. We focused on large micro- and mesoplastic(1–25 mm) and selected macroplastic items. Emission calculations, samplings in the Warnow river and estuary (water bodyand bottom sediments) and a flood accumulation zone monitoring served as basis for model simulations on transport andbehavior in the entire Baltic Sea. Considered were the most important pathways, sewage overflow and stormwater. Thecoastline monitoring together with calculations allowed estimating plastics emissions for Rostock city and the Warnowcatchment. Average concentrations at the Warnow river mouth were 0.016 particles/m³ and in the estuary 0.14 particles/m³(300 μm net). The estuary and nearby Baltic Sea beaches were hot-spots for plastic accumulation with 6–31 particles/m².With increasing distance from the estuary, the concentrations dropped to 0.3 particles/m². This spatial pattern, the plasticpollution gradients and the observed annual accumulation values were consistent with the model results. Indicator items forsewer overflow and stormwater emissions exist, but were only found at low numbers in the environment. The consideredvisible plastics alone can hardly serve as indicator for microplastic pollution (<1 mm). The use of up-scaled emission data asinput for Baltic Sea model simulations provided information on large scale emission, transport and deposition patterns ofvisible plastics. The results underline the importance of plastic retention in rivers and estuaries.
Keywords Stormwater ● Sanitary sewer overflow ● Pollution ● Monitoring ● Microplastic ● Cigarette butts
Introduction
The Baltic Sea is one of the largest brackish water bodies inthe world and, despite all efforts, a pollution hot-spot(HELCOM 2018a). The Baltic Sea catchment is about fourtimes larger than its surface area (420,000 km2) and it isinhabited by about 85 million people living in nine countries.Due to the humid climate, the mean annual riverine runoff tothe Baltic Sea is with 14,425m³/s (HELCOM 2018b) com-parably high. Since human activities are the source of
microplastics, wastewater is considered as a major emissionpathway (e.g., Mintenig et al. 2016; Ziajahromi et al. 2016;Kay et al. 2018; Prata 2018). In the Baltic Sea region, thevast majority of sewage water undergoes a treatment.Depending on the quality of wastewater treatment, Bareseland Olshammar (2019) assume a microplastics retentionbetween 85 and 98%. This efficient sewage treatment is oneexplanation for the relatively low estimated microplasticemissions to the Baltic Sea (Siegfried et al., 2017). Plasticsabove 1 mm in size are practically fully kept back duringwaste water treatment. On the other hand, microplasticemissions with sewer overflow water, e.g., after heavy rains,seem to be an underestimated pathway. Sewer overflowwater consists of stormwater and untreated wastewater. In theBaltic, overflow events happen rarely. Despite that, Bareseland Olshammar (2019) conclude that the annual discharge ofmicroplastics from sewer overflows can be in the samemagnitude as the emissions with all treated wastewater.Therefore, for plastics above 1 mm in size, large micro-,meso-, and some macroplastics, sewer overflows and
* Gerald [email protected]
1 Leibniz Institute for Baltic Sea Research, Rostock, Germany2 Marine Research Institute, Klaipėda University,
Klaipėda, Lithuania3 Hydrology and Quantitative Water Management Group,
Wageningen University, Wageningen, The Netherlands
1234
5678
90();,:
1234567890();,:

stormwater are very likely by far the most important emissionpathway in the Baltic region.
Existing calculations of microplastic emissions to theBaltic Sea by Siegfried et al. (2017) or Bollmann et al.(2019) are conceptual, utilize only limited and aggregateddata, and possess a very high uncertainty. Further, thesevalues differ strongly from each other and they focus onmass calculations. Baresel and Olshammar (2019) providecomprehensive data on urban waste water and its treatment,covering the entire Baltic Sea region. Schernewski et al.(2020) use this data to estimate the annual emission ofdifferent microplastics size-fractions and plastic polymers tothe entire Baltic Sea. This approach provides detailed spatialemission patterns, taking into account all relevant cities andrivers. Additionally, the seasonality of sewage overflowincluding stormwater is assessed. This data is used to carryout 3D-model simulations on transport, behavior anddeposition in the Baltic Sea environment. In a follow-upmodel study, Schernewski et al. (2021) expand the approachto a wider spectrum of microplastic polymers, coveringmost plastics emitted to the environment. The simulationssuggest average annual microplastic concentrations forvarious sea areas that correspond to the rare existing data(Setälä et al. 2016; Tamminga et al. 2018).
Model simulations show high concentrations near rivermouths as well as in enclosed and semi-enclosed coastalwaters (Schernewski et al. 2020). These findings are sup-ported by literature, as well: Gewert et al. (2017) found anearly ten times higher abundance of plastics in surface waternear central Stockholm than in offshore areas. Yonkos et al.(2014) reported the highest microplastics concentrations neardensely populated areas of Chesapeake Bay and comparableresults exist for other estuaries and lagoons (Gray et al. 2018;McEachern et al. 2019; Song et al. 2015; Vermeiren et al.2016; Vianello et al. 2013). However, the existing field datafrom surface waters is not sufficient to validate model resultsfrom the Baltic Sea. Due to high costs for microplasticssampling and analyzing in the sea, it is not likely that suffi-cient data will be available in the near future. Therefore, newapproaches are required to get a reliable, validated, spatio-temporal pattern of marine (micro)plastics pollution.
The simulations of Schernewski et al. (2020) indicate, thatmicroplastic fractions have an average residence time of onlyabout 14 days in the Baltic Sea. The model approach assumesan efficient beaching of particles nearshore, in the wave zone.According to these results, shorelines serve as major sink andtrap for microplastics. As a consequence, microplasticssampling could focus on the tidal accumulation zone ofbeaches for obtaining a better insight into marine micro-plastics pollution. Sampling microplastics at beaches iscomplicated, especially in micro-tidal seas such as the BalticSea, standardized methods still do not exist and the samplepreparation and analysis is expensive. Therefore, we follow
an alternative approach and focus on larger plastic fractionsfor which suitable methods exist (e.g., Haseler et al. 2019).The idea is that coastal pollution pattern of large micro- andmesoplastic as well as specific litter items may serve asindicator for the pollution of smaller microplastic fractions.
Overall aim of our study is to assess, whether a com-prehensive approach linking existing knowledge withmonitoring and modeling can provide an improved insightinto the plastics pollution problem in the coastal and marineenvironment. Detailed objectives are to (a) combine fielddata with literature data and calculate the annual emissionsresulting from urban sources, (b) extrapolate the results toreceive emission data for wastewater related urban path-ways in the entire Baltic Sea region as model input, c)perform 3D-model simulations on transport, behavior anddeposition of larger micro- and mesoplastics as well ascotton sticks and cigarette butts in the Baltic Sea environ-ment, (d) validate the model results with data from beachtidal zone monitoring at the southern Baltic Sea, (e) assessthe role of plastic retention in river basins and the estuaryand f) discuss the role of plastic items and meso-plastics asindicator for microplastic in the aquatic environment.
The work shall provide a better insight into emission,transport and behavior of meso- and large micro-plastics inthe marine environment. This shall (a) enable steps towardsan improved, cost-effective monitoring considering plasticsize fractions as well as sampling locations and frequency;(b) support decisions on mitigation measures and (c) pointout gaps in our understanding of the plastic problem in thecoastal and marine environment.
Study Site and Methods
Study Site
The Baltic Sea has a surface area of about 420,000 km2.With an average depth of 55 m it is relatively shallow andhas a long coastline of about 8,000 km. Strong salinitygradients maintain an estuarine circulation and a waterexchange with the North Sea. As a sheltered brackish sea,the tidal range is below 0.2 m and tidal currents play only aminor role for transport processes. All our field studiesfocus on the German southern Baltic Sea coast and espe-cially the Warnow Estuary. The southern Baltic Sea coast isformed by dunes, soft cliffs and long sandy beaches andtourism is a major economic factor. Several estuaries withlarger cities form the economic centers of the German BalticSea region, such as the Flensburger Förde, the Kieler Förde,the Trave Estuary, the Oder Estuary, or the WarnowEstuary.
The Warnow Estuary, surrounded by the city ofRostock (about 209,000 inhabitants), can be regarded as a
Environmental Management (2021) 68:860–881 861

representative southern Baltic estuary (Fig. 1). 74% of theinner shoreline are occupied by commercial and sport boatharbors, shipbuilding industry and hard structures pro-tecting urban areas. The remaining shoreline is covered byreed belts, artificial stony shore and few beaches. Theestuary has a length of about 14 km, a surface area of12 km2 and an average depth of 5.6 m. The entire estuaryis used for shipping and the channel has a maximum depthof 4 m in the city harbor in the south and 16 m betweenBaltic Sea and the industrial harbor in the north. Near theWarnow river entrance, the bottom salinity in the estuaryis below 5 PSU compared to 18 PSU close to the BalticSea. These gradients are sufficient to maintain an estuar-ine circulation. The transport of surface water towards theBaltic Sea is additionally supported by the dominatingwestern to south-western winds. The average waterexchange time of the estuary is about 30 days (Lange et al.2020). Twenty four small tributaries and the WarnowRiver discharge into the estuary.
The nearly 150 km long Warnow River drains a catch-ment with a population of about 200.000 inhabitants and asurface area of 3280 km2. It enters the estuary in the southand has an average annual discharge of 16.5 m3/s.
We focused on the large micro- and mesoplastic sizeclass (1–25 mm) and in the following call this class “visibleplastics”. In addition, we considered selected macroplasticitems, which are supposed to provide an insight into therelevance of single emission pathways, and are thereforecalled “indicator items”. The monitoring at the Warnowriver mouth together with emission calculations fromRostock City area provided information on the total emis-sions from urban sources to the Warnow Estuary (Fig. 2).Compared to agricultural sources, urban sources can beconsidered as major pathway in the Warnow river, as well(Tagg, pers. com.). This complied emissions data wasvalidated by a coastline, waterbody and sediment monitor-ing in the estuary. Since each single approach was too weakto provide a full picture of the role of visible plastics and
Fig. 1 a The Baltic Sea Region, its catchment and the location ofWaste Water Treatment Plants (WWTPs) as well as emission points tothe Baltic Sea; b The Warnow Estuary (surrounded by the city of
Rostock) with coastline structures and potential plastic emissionpoints: WWTPs, combined sewer overflow (CSO) and stormwater(rain water discharge) outlets
862 Environmental Management (2021) 68:860–881

indicator items in the estuary, all approaches were com-bined. The resulting information on visible plastics andindicator item emissions served as input for the model. Themodel covers the entire Baltic Sea and requires emissioninput data covering the entire Baltic Sea region. Therefore,the information about specific visible plastics and indicatoritem emissions of the Warnow Estuary were complementedby literature information and combined with data on was-tewater amounts (stormwater, sewer overflow and untreatedwastewater) for the entire Baltic Sea catchment. Theresulting emissions data on visible plastics and indicatoritems allowed Baltic-wide model simulations on plasticstransport, behavior and deposition. The monitoring at BalticSea beaches served for validating the model results andassessing retention of plastics in the estuary.
Emission Calculations for Rostock city: amounts andIndicator items
Plastic litter in the environment consists of a wide spectrumof size classes, types, shapes and properties. Further, thecomposition of particles varies between pathways and loca-tions. To reduce uncertainties, to enable reproducible emis-sion calculations, and to allow concrete model simulations ontransport and behavior in the sea, we focused on definedplastic litter items. Criteria for the choice were supra-regionaland policy relevance, quantity in the environment, repre-sentation in monitoring programs and databases, the alloca-tion to and representation of defined pathways and diversematerial properties. Cigarette butts (cellulose acetate, CA,1.3 g/cm3), lolly sticks, cotton buds (polyethylene, PE/poly-propylene, PP; 0.89–0.97 g/cm³ density) and bristles fromstreet cleaning equipment (polyvinylchloride, PVC;1.3–1.45 g/cm³ density) turned out to be suitable (Fig. 3).
Rostock city center is connected to a combined sewersystem (storm- and wastewater combined), while most ofthe 181.4 km2 city catchment area are connected to aseparate sewer system (storm- and wastewater separated).Rostock’s wastewater is treated in the central wastewatertreatment plant (WWTP), which includes a mechanical andan activated sludge treatment, followed by a two-stepnitrification and denitrification. In the estuary, a total of 167wastewater outlets were identified including the WWTPoutlet, 11 combined sewer outlets and 155 stormwateroutlets. As soon as heavy rain exceeds the hydraulic capa-city of the combined sewer system, storm- and wastewaterare entering the estuary largely without treatment. Accord-ing to Piehl et al. (2021), the total annual amounts emittedto the estuary were about 41 million m³ stormwater,107,065 m³ combined sewer overflow water and 16.5 mil-lion m³ treated wastewater.
Our emission calculations for large micro-, meso- andmacroplastics utilized the data on pathways in Piehl et al.Fig. 2 The conceptual approach
Fig. 3 Sampling locations andmethods. a Schnatermann, bIGA-Park, c Ottos Steine as wellas examples of most commonlyfound items
Environmental Management (2021) 68:860–881 863

(2021). In the sewer system of Rostock, no traps or sinks formicro- or meso-litter are implemented. Emissions viacombined sewer overflows considered the toilet flushingbehavior of litter items in general and item specific emis-sions (Elliott and Elliott 2018). In addition, diffuse anddirect emissions by human activities to the estuary weretaken into account. Major sources of information were lit-erature, official statistical data and local expert knowledge.First assumptions and calculations were reassessed by anexpert group. This group consisted of 11 experts with localknowledge, different backgrounds (biology, physics, eco-nomics, ecology, coastal management), different experienceand knowledge levels (master degree, PhD, professorship).The expert assessments made use of a Mentimeter polling(https://www.mentimeter.com). Mentimeter is an onlineinteractive presentation software and allows for anonymousand real time voting as well as commenting (Little 2016). Ina first step, data, assumptions and calculations were pre-sented online. Afterwards the experts could provide theirview online, and assess whether, and if so, to which degree,they considered the emission as under- or overestimated. Ifjustified, the assumptions emission calculations were mod-ified accordingly.
Cigarette butts: for calculating the total emission into theenvironment per year for the sealed city area of Rostock, weassumed that items emitted within one km buffer around theestuary shoreline (21.77 km² area) eventually end up in theestuary via wind or storm water transport. We took intoaccount the population of the city above an age of 15 yearsof 180,000 (HRO Statistics 2019), the smoking rate of theGerman population of 23.4% and an average daily con-sumption of cigarettes by smokers of 9.7 (Seitz et al. 2019).We assumed that 50% of the cigarettes were smoked out-side and that 56% of these were littered to the environment(Miller and Burbach 2017; Rath et al. 2012; Green et al.2014).
In a second step, depending on the entrance point, weseparated between emissions via combined sewer over-flows, via storm water runoff, and directly into the estu-ary. Emissions via storm water runoff assumed areduction factor due to street cleanings, traps in gulliesetc. and considered only butts emitted within a 100 mzone to the shore. The calculations resulted in the fol-lowing annual numbers: about 150 million cigarettes aresmoked in Rostock; 41 million cigarette butts are emittedto the environment in the whole city area (28%) andabout 3.6% of the total number are emitted within 1 km tothe coastline.
Lolly sticks: similar to cigarette butts, emissions viacombined sewer overflows, storm water runoff and directlyinto the estuary were taken into account and the calculationsfollowed the same principle. It was assumed that the youngpopulation (60,000 inhabitants) consumed 18 lollies per
year which resulted in a total annual consumption inRostock of about 1 million sticks.
Cotton buds are mainly used for ear cleaning andmakeup. Elliott and Elliott (2018) estimated an annualconsumption of 150 cotton buds per capita, which equals aconsumption of 27 million buds per year in Rostock. Weassumed that they enter the estuary exclusively via com-bined sewer overflow. We assumed a 4% share of thepopulation that flushes cotton sticks the toilet and thequantitative role of overflow.
Cleaning bristles: Only wash off from sealed city areas(within 1 km from the shoreline) and emissions via stormwaterinlets were considered. We assumed that 12 cleaning bristlesper square kilometer were emitted by cleaning operations,taking place on 261 days per year and that 30% of the bristlesfrom street cleaning equipment were emitted to the estuary.
Warnow River and Estuary Surface Monitoring
To quantify the riverine emissions, we carried out a mon-itoring at the river mouth. On 13 dates between July andSeptember 2017, a monitoring of large micro and mesolittertook place at a total of 9 locations along the Warnow river.In Rostock, at the entrance of the river into the estuary (Fig.1), samplings took place on 10 days. Depending on thelocation, we used different net types, a conical 200 μmplankton net, as well as 300 μm and 1000 μm rectangulardrift nets, which varied in opening size. The nets wereemployed to collect plastics drifting on the surface and inthe upper water body. Three test samplings with nets fixedon the river bottom were carried out to sample plasticstransported on the sediment surface. The exposition timevaried between 15 min and 12 h, depending on the meshsize and the amount of organic material in the river. Thewater flow near the river mouth varied between 0.05 and0.46 m³/s and, in total, about 2800 m³ of river water werefiltered by the nets during the samplings. Water dischargewas measured with a CTD and is based on gauge data ofStALU MM/WM. The surface water of the estuary wassampled once close to the city center, close to the rivermouth, using the same equipment. The net was attached to acrane and dragged beside the boat over 12 min at a speed of3.8 knots. Nearly 100 m³ water were filtered.
Since focus was on particles above 1 mm, the sampleswere filtered through a cascade of 1000 and 500 μm metalsieves. The 500 μm limit marks the size of particles stilladequately visually and mechanically detectable. Largerfractions of organic matter were rinsed with clean water toflush off attached plastic particles and sorted out. After-wards, the sieves were visually analyzed, first with nakedeye and then under binocular microscope. Potential plasticparticles were sorted out using a metal tweezer and placedon a glass Petri dish or slides. The type of plastic material
864 Environmental Management (2021) 68:860–881

was analyzed with the mobile near infrared spectrometer(microPHAZIR RX). Recovery experiments with 500 μmand 1000 μm sized particles of different colors were carriedout to ensure reliable results. The average recovery rate was90%. Samples analyzed for microplastics below 500 μmwere treated with 30% H2O2 and incubated about 50 h at50 °C to remove organic material.
Warnow Estuary Sediment Screening
Besides the coastline, the estuary sediments can potentiallybe a sink and accumulation areas for plastics. This isespecially true for the shipping channels which act as trapfor muddy organic rich material. In 2018, harbor authoritiesremoved about 44,661 m³ sediments from the channel in thesouthern, city part of the estuary and dumped it on a nearbypolder. The muddy sediment contained about 75% waterand our monitoring took place in September 2019 on thedumping site when most water had been drained off. Thesediment surface area was separated into transects and about3.8% of the total area was screened visually with bare eyemethod (Haseler et al. 2019) for plastic pieces. The pieceswere classified using the OSPAR item protocol and ana-lyzed with the mobile near infrared spectrometer (micro-PHAZIR RX). For the allocation of the plastic sources, theMatrix Scoring Technique (Tudor & Williams 2004;Haseler et al. 2019) was used.
Flood Accumulation zone and Estuary CoastlineMonitoring
The Warnow estuary and Baltic coastline monitoringformed the core of our data collection activities. Between2014 and 2017, altogether 34 samplings at five Baltic Seabeaches took place. In addition, ten samplings withoutsieving were carried out at beaches, especially after stormand high-water level events. For sampling visible plasticsand indicator items in flood accumulation zones of beaches,a 10 m long and 1 m wide transect of the tidal accumulationzone was spatially defined. Beach wrack (or tidewrack)within this area was collected first, washed with water andanalyzed for plastic pieces by bare eye. Afterwards, a 3 cmsand surface layer was removed and washed through a2 mm mesh-size metal sieve. The particles remaining in thesieve were identified and collected by bare eye. If possible,the collected particles were analyzed with a mobile nearinfrared spectrometer (microPHAZIR RX) afterwards. Fordetails about the method see Haseler et al. (2019).
Between 2015 and 2017, this flood accumulation zonemonitoring method was applied to the five existing beachesin the estuary, as well. Altogether 10 samplings took placeat Schnatermann (54.173 N, 12.142 E), IGA Park(54.139 N, 12.087 E), Oldendorfer Tannen/Gehlsdorf Fähre
II (54.100 N, 12.114 E), Hundsburg (54.131 N, 12.090 E)and Ostbreitling (54.163 N, 12.137 E).
To get a more complete picture of plastics accumulatedat the coast, four other accumulation areas including stonyhard structures were sampled by bare eye for visible plas-tics: Ottos Steine (54.094 N, 12.113 E), Warnow Hotel(54.096 N, 12.152 E), Gehlsdorf Fähre I (54.099 N, 12.114E), Holzhalbinsel (54.094 N, 12.150 E). Altogether12 samplings were carried out, mostly one or a few daysafter heavy rain events with sewer overflows. Since theestuary monitoring included the flood accumulation zonemonitoring and additional simplified approaches, we call itestuary coastline monitoring.
Based on the estuary coastline monitoring, the totalannual shoreline pollution in the estuary with large micro-and mesoplastics as well as special items was estimated. Ina first step, average concentrations per meter coastline foritems and plastic size classes were calculated. Beside hardstructures (e.g., quays and walls) that do not allow accu-mulations, the estuary shoreline is covered by 15 km reedbelts, 4 km of stony areas, and 2.4 km beaches. The averageplastics concentration for each shoreline type was multi-plied with its shoreline length. For reed belts, we assumedthe same accumulation behavior as for beaches.
In Rostock in 2016/2017, local heavy rain events withsewer overflow took place on 72 days per year (dataprovided by EURAWASSER, pers. com.) and causedraw sewage water emissions to the estuary (at least) atone out of the 11 combined sewer outlets. We assumedthat the accumulation at the coast takes place only duringheavy wind events with increased water levels and thatre-suspended plastic material and deposits are found indefined high water accumulation zones. According toDWD weather and water level statistics, in 2017 eventswith lasting wind above 10 m/s took place 10 timesper year.
Baltic Wide Emissions Scenarios: quantity, location,and items
Model simulations about the transport, behavior anddeposition of plastics in the aquatic environment require theconcentrations of plastics in and the amount of dischargewater as model input. Combined sewer systems, which arecommon in urban areas of the Baltic Sea region, collectsurface water runoff, domestic sewage and industrial was-tewater. Baresel and Olshammar (2019) compiled dataabout and quantified the amount of sewage water for 3525WWTPs in the Baltic Sea region. Different to modelsimulations in Schernewski et al. (2020, 2021) we assumedthat large microplastics and mesoplastics are fully kept backin WWTPs. As a consequence, treated wastewater was notconsidered as a pollution pathway.
Environmental Management (2021) 68:860–881 865

In combined sewer systems, sanitary sewer overflowstake place, where untreated wastewater together withstormwater is discharged into the aquatic environment.Usually this happens due to a temporary insufficienthydraulic capacity after heavy precipitation. Baresel andOlshammar (2019) assumed that in the Baltic Sea region,weather related sanitary sewer overflow without treatmentin a WTTPs, accounts for 1.5% of the total WWTP inflow.This value was applied and for seasonal overflow calcula-tions, we assumed that this is equivalent to 1.5% of the timeof the year. We assumed that sanitary sewer overflowsresulting from technical problems are included in the 1.5%.Separated sewer systems collect storm water and waste-water in separated systems. In these systems, stormwater isalways released directly to the aquatic environment usuallywithout treatment. For the Baltic Sea region, reliable num-bers about the water discharge from separated sewer sys-tems are lacking. We assumed that separated sewer systemshave a share of 50% in the Baltic Sea region. In our modelsimulations we combined separated and combined sewersystems. Therefore, only two pathways are considered:stormwater together with sewer overflow and untreatedwastewater.
The density of plastics (artificial polymers) is animportant parameter that determines its transport, behaviorand deposition in the aquatic environment. According to thedensity, we separate floating and sinking polymer types.The group of floating polymers includes low and highdensity polyethylene (PE, 0.915–0.97 g/cm³ density) andpolypropylene (PP, 0.89–0.92 g/cm³ density). The group ofsinking polymers covers rigid polyvinyl chloride (PVC,1.3–1.45 g/cm³ density), cellulose acetate (CA, 1.3 g/cm3),and polyethylene terephthalate (PET, 1.38 g/cm³ density).The most common polyester fibers are made of PET.Acrylic and polyamide fibers have a density of only 1.18 g/cm³ resp. 1.14 g/cm³. According to Sun et al. (2019), PP,PE, and PET are the most abundant polymers in WWTPs.
Previous model simulation studies (Schernewski et al.2020, 2021) did show that the separation into two densityclasses is sufficient to reflect the behavior of the vastmajority of plastics in the marine environment. Besidedensity, floating and sinking behavior of microplastics isinfluenced by particle size, shape and processing. We didnot take into account particle size and shape, but withrespect to cigarette butts the processing had to beconsidered.
Because of the high air content, cigarette filters, usuallymade of cellulose acetate fiber, are floating. To assesscigarette butt behavior in water, we carried out simpleexperiments. We put cigarette butts, consisting of the filter,paper (cellulose) and residual tobacco in glass cylindersfilled with Baltic Sea water and exposed them for one weekto sunlight under daily stirring. After six days, only four out
of 17 cigarette butts were still floating, while the restfragmented to its components and sunk to the bottom. Thesinking of the soaked pure cigarette filters was tested inlarge glass cylinders and resulted in relatively high sinkingvelocities between 0.03 and 0.07 m/s.
Model Approach and Simulations
The modeling approach followed Osinski and Radtke(2020a). We used the UERRA high-resolution atmosphericreconstruction, provided by SMHI, to drive both a third-generation wave model (WAVEWATCH 3) and a hydro-dynamic model for the Baltic Sea (GETM). Both modelshave a horizontal resolution of one nautical mile. Amicroplastics transport module was added followingOsinski et al. (2020b). The hydrodynamic model providedthe current field used for the passive transport of the parti-cles, which are represented in a Eulerian framework as aconcentration per grid cell. The size, density and shape ofthe particles determined the vertical velocity relative to theambient water and the critical shear stress for the resus-pension. The actual shear stress at each time step was cal-culated from the bottom current velocity and the significantwave height which was provided from the wave model.Settled particles were re-suspended when the actual shearstress exceeds the critical value.
The shape is a factor that determines the behavior ofparticles in the aquatic environment (e.g., Kooi and Koel-mans 2019; Kowalski et al. 2016). However, we did notdistinguish between fragments, beads, spheres, flakes andfilms but partly separate fiber. Our previous study (Scher-newski et al. 2020) did show that differences in shape andsize only have a limited effect on our simulation results.This is only true for our the chosen temporal and spatialresolution of our model approach. Sinking velocities weredetermined from the Stokes parameterization assuming aspherical shape. For each size class, we used the lower sizelimit as the particle diameter assumed for the Stokes for-mula, since (a) smaller particles typically have a higherabundance and (b) deviations of larger particles from thespherical shape would cause a reduction in the verticalvelocity, such that they would behave like smaller sphericalones in this sense. The critical shear stress was calculatedfrom the Shields curve (Shields 1936). For fibers we tookthe empirically determined parameterizations by Walds-chläger and Schüttrumpf (2019a) for the sinking velocityand Waldschläger and Schüttrumpf (2019b) for the criticalshear stress. The vertical model resolution and the calcu-lation time steps did not allow the correct representation ofheavy, fast sinking particles. Because of our choice ofparticle size classes and items, this problem was negligible.
Particles entering a grid cell adjacent to a land cell wereimmediately removed from the model and counted as
866 Environmental Management (2021) 68:860–881

beached. The beached particles were accumulated over ayear to provide numbers of the total amount of particleswashed ashore. An exception were those grid cells acting asa source, such as rivers, here we did not assume a beachaccumulation. A possible resuspension and further transportof the particles was neglected. The model simulationsaltogether covered two years. The period from March 2016until February 2017 was used for calculating annual values.
Our model approach allows a scaling of the MP con-centrations in the environment, by post processing thesimulation results. This means the absolute concentrationsemitted via each pathway and size class potentially can beadjusted if new insights or better field data are available.This is possible as long as the relative spatio-temporalemission pattern remains the same.
Results
Rostock city Plastic item Emissions to the WarnowEstuary
Emissions of microplastic with waste- and stormwater fromthe city are addressed and documented in Piehl et al. (2021).The emission of visible plastics via these pathways canhardly be estimated based on literature and calculations,because visible plastics can have multiple sources and canstem from fragmentation. Here we focus on emission esti-mations for the indicator items cigarette butts, lolly sticks,cotton buds, and cleaning bristles. The annual cigarette budemission rates to the estuary were: 534,000 direct emis-sions, 961,000 via stormwater runoff and 368,000 viacombined sewer overflows. The resulting estimates forRostock were that about 1,860,000 cigarette butts end-up inthe estuary annually or 1.25% of the annually smokedcigarettes.
About 3900 lolly sticks were calculated to be emitteddirectly to the estuary, 7000 enter via stormwater and 1100via combined sewer overflow. In total about 12,000 sticksor 1% of the consumed lolly sticks were assumed to enterthe estuary. With respect to cotton sticks we received anemission to the estuary of about 11,000 or 0.04% of theannually consumed cotton buds in Rostock. With respect tocleaning bristles we calculated a total emission to theestuary of about 20,000 bristles per year.
Warnow River Plastic Emissions to the Estuary
The Warnow river is the only major river discharging to theWarnow Estuary. All minor riverine systems are part of theRostock city drainage system. Piehl et al. (2021) analyzedmicroplastics emissions to the Warnow Estuary (based onvery few data) and assumed that more than 1/3 of the total
emissions enter with the river. This means that the riverpotentially can be an important source for large micro- andmesoplastics, as well. In the Warnow river, altogether 36phytoplankton-net samplings using mesh-sizes of 200, 300,and 1000 μm were carried out. Above 100m³ estuary waterwere filtered using the 300 μm drift net. The discharge of theWarnow river at the mouth was about 15m³/s and in 2017 inaverage and varied seasonally between 7 and 25m³/s.
In about 70 m³ river water passing the 200 μm net, 23potential plastic particles were found, resulting in a con-centration of 0.32 particles/m3. Our methodology did notallow to verify that these were plastic particles because theywere too small for the analysis with the mobile infrared-spectrometer. Large amounts of organic material and theclogging of the nets allowed only exposure times below 1 hand caused problems in sample treatment. With the 300 μmand 1000 μm nets about 1000 m³ river water were filteredwith each net. The obtained numbers of particles were 18(300 μm net) and 7 (1000 μm net). The resulting con-centrations of potential plastic particles at the river mouthwere 0.016 resp. 0.006 particles/m³. Only less than 50% ofthe particles could, without doubt, be identified as plasticsusing the mobile infrared spectrometer. The dominatingplastic type was polyethylene followed by polypropylene.About 70% of all particles were smaller than 1 mm, 25%between 1 and 5 mm, and 5% larger than 5 mm. The dataobtained from samplings at locations upstream was quan-titatively not sufficient for an analysis.
Based on the results from the 300 μm net, the calculatedannual plastics discharge of the Warnow river were about 3million plastic particles. Including the unidentified, poten-tial plastic particles, the annual discharge was 7.7 millionplastic particles. For the size class between 1 and 25 mm,the annual load was 3 million potential plastic particles,including about 1 million identified PE and PP particles.This weak data basis and the fact that none of the indicatoritems (cigarette butts, lolly sticks, cotton buds, and cleaningbristles) were found, did not allow for reliable and trans-ferable assumptions on the role of the river as pathways forlarge micro- and mesoplastics and the selected items.
Plastics in the Warnow Estuary: water body
We carried out a monitoring in the estuary, covering thewater body and the coastline. One major aim was to assesswhether the monitoring results match to and verify ouremission calculations for the indicator items. Further, wewanted to get an impression of type, size, form and quantityof other visible plastics items in the estuary.
The water surface was sampled once with a 300 μm netdragged aside a boat. A total of 15 potential plastic particleswere found in nearly 100 m³ water. Six particles could bereliably identified as plastics, mainly polyethylene and
Environmental Management (2021) 68:860–881 867

polystyrene. The concentration in estuary water was 0.14potential plastics particle per m³ and 0.05 identified plasticparticles per m³. Indicator items were not found. The rela-tively low number of particles found, the restriction tofloating plastics and the relatively high effort point out theweaknesses of this method for our purpose. As a con-sequence, the method was not further applied.
Plastics in the Warnow Estuary: Sediments
Sediments can serve as a sink for plastics and potentiallycan provide some insight with respect to plastic types andpathways. Altogether, 1371 plastic pieces were found on1723 m² on the dumping site for dredged muddy channelsediments. The most abundant were plastic fragments(32.6%), followed by flat pieces of plastic (strapping bands,20%), cups and cup lids (6.3%), corrugated plastic (5.9%),food containers incl. fast food containers (5.6%), andsanitary towels/panty liners/backing strips (4.7%). The mainpolymer types of the identifiable 804 items, were polyvinylchloride (24.4%); polypropylene (15%), polyethylene(10%); polystyrene (7.8%), and polyamide (6.1%). With theexpert-based Tudor Matrix Scoring System (Tudor & Wil-liams 2004), residents and tourists were assigned to be thesource of 26% of the litter, followed by Combined SewerOverflow emerges with (19%), shipping (15%), angling andfishing (15%), construction (14%), and industry (11%).
By far most particles found in the sediments belonged tothe macroplastic fraction (>25 mm) and the method did notallow for a quantification of the sediments as sink forplastics below 25 mm. Despite that, several relevant con-clusions can be drawn: Stormwater and sewer overflow isone of the most important plastic pathway, the organicchannel sediments serve as important sinks for plastics andnot only for sinking items with a density above 1 g/cm². Thehigh share of PP and PE particles indicates that biofilms,microorganisms, algae and detritus settled on plastics,increase the specific weight and enable an accumulation oforiginally buoyant plastics in the sediment. The muddycharacter of the sediments indicates that deeper channel areprotected from wave induced resuspension. Otherwise thesesediments including plastics would have been accumulatedat the shore or washed into the Baltic Sea.
Plastics in the Warnow Estuary: Coastline
Results in Schernewski et al. (2020, 2021) indicate thatplastic particles with a density between 0.8 and 1.4 g/cm³,which constitute the vast majority of all plastics in theenvironment, are washed ashore within days after emissionto the Baltic Sea. Consequently, our monitoring focusedmore on the coastline, instead of water column and sedi-ments. This ensured that a wide range of plastic types and
size classes could be monitored at many locations in a cost-and time-efficient way. However, the coastline structure didnot allow the application of one consistent method.
Table 1 provides a full overview about the coastlinemonitoring. Altogether over 2300 items were found. With411 pieces (18% resp. 1.7 items/m²) cigarette butts weremost abundant, followed by 278 plastic pieces (unidentifi-able fragments) between 5 and 25 mm (12% resp. 1.0 item/m2) and 231 larger plastic pieces between 25 and 500 mm.The average number of particles per m² was 0.7. Theindicator items, cleaning bristles (6%) cotton buds (3%),and lolly sticks (0.7%), had much lower shares. 133cleaning bristles were found at Schnatermann during onesampling, but rarely at other locations. Therefore, this itemwas not further considered as suitable indicator item forpollution.
Total Plastics Emissions to the Warnow Estuary
Based on the data in Table 1 and the information oncoastline length and structure in the estuary, the total annualaccumulation at the coastline was estimated to allow acomparison with emission calculations. For cigarette buttswe received a total annual coastal accumulation of 1.35million compared to 1.9 million estimated emitted cigarettebutts. The calculated annual coastal accumulation for cottonbuds is 79,000 and for lolly sticks 82,000. This is aboutseven times higher compared to the estimated annualemitted numbers (12,000 resp. 11,000).
We can summarize that items such as cigarette butts,cotton buds and lolly sticks may serve as indicators forsewage and stormwater related plastic inputs, the emissionscan be estimated and a coastline monitoring allows to esti-mate the annual coastal accumulation within the estuary.However, the emission calculations are based on severalassumptions and have a high uncertainty. The coastal mon-itoring methodology has several weaknesses and incon-sistencies (e.g., application of different methods) and the datashows a strong spatial and temporal variability. The extra-polation to annual data for the entire estuary adds severaluncertainties. Despite that, the comparison of the annualemission and accumulation data for each item is in the sameorder of magnitude. The data is hardly reliable, but it seemsthat we met the dimension of the pollution with these items.
The general agreement between emission estimates andcoastal accumulation data for the indicator items allows theassumption that the coastline monitoring can give an insightinto the emission of other items and plastic size classes,specified in Table 1, as well. The annual emissions to theestuary for plastic size classes and other items cannot beestimated directly, similar to the approach used for the indi-cator items. This would mean, for example, that the calculatedannual number of visible plastic particles between 5 and
868 Environmental Management (2021) 68:860–881

Table1Partly
aggregated
Warno
wEstuary
coastline
mon
itoring
data
Sam
plingspot
Southernstones
Southernbeaches
Otto
sSteine
Schnater-mann
Schnater-mann
Schnater-mann
IGA
Park
IGA
Park
AlterStrom
Marina
Sam
plingmethod
bare
eye
bare
eye
bare
eye
bare
eye
bare
eye
sieve
sieve
bare
eye
bare
eye
bare
eye
Num
berof
samplings
33
41
23
11
11
Water
level(above
MWL)
96cm
96cm
0–30
cm15
cm96
cm15–94
cm7–95
cm153cm
153cm
153cm
Average
OSPAR
item
name
%(items/m
2 )%
/m2
Cigarette
butts
andfilters
16.3
(0.47)
37(2.83)
12(0.22)
7.3(4.6)
6.4(1.1)
4(0.43)
27.1
(1.17)
6.6(0.6)
14.1
(5.1)
1.2(0.3)
17.8
1.68
Plastic
pieces
5–25
mm
11.6
(0.33)
3.5(0.27)
7.7(0.14)
0(0)
2.9(0.5)
23.4
(2.53)
8.5(0.37)
38.5
(3.5)
5.5(2)
2(0.5)
12.1
1.01
Plastic
pieces
25–50
0mm
0(0)
2.2(0.17)
5.7(0.11)
14(8.8)
1.7(0.3)
13.2
(1.43)
6.2(0.27)
13.2
(1.2)
8.9(3.2)
2(0.5)
10.0
1.60
Firew
orks
plastic
pieces
2.3(0.07)
0.9(0.07)
3.5(0.06)
11.1
(7)
0.6(0.1)
0(0)
0.8(0.03)
2.2(0.2)
26.9
(9.7)
1.2(0.3)
8.2
1.95
Polystyrene
pieces
25–50
0mm
5.8(0.17)
6.1(0.47)
0.8(0.01)
0(0)
24(4.15)
0(0)
0(0)
0(0)
1.7(0.6)
49.6
(12.5)
10.5
2.56
Plastic
pieces
<5mm
0(0)
0(0)
0(0)
0(0)
0(0)
12.9
(1.4)
19.4
(0.83)
0(0)
0(0)
0(0)
2.9
0.32
Indu
strial
pellets
0(0)
5.2(0.4)
0.6(0.01)
0(0)
0(0)
7.1(0.77)
5.4(0.23)
0(0)
0(0)
0(0)
2.2
0.20
Crisp
packets/sw
eet
wrapp
ers
9.3(0.27)
5.7(0.43)
5.7(0.11)
0.3(0.2)
5.5(0.95)
2.2(0.23)
0.8(0.03)
6.6(0.6)
4.7(1.7)
5.2(1.3)
7.0
0.58
Bagsincl.Pieces(all)
2.3(0.07)
0.4(0.03)
0.4(0.01)
0(0)
0(1)
8(0.87)
3.1(0.13)
0(0)
5(1.8)
2(0.5)
2.6
0.44
Foam
spon
ge0(0)
0.4(0.03)
0.7(0.01)
0(0)
0(0)
1.8(0.2)
0.8(0.03)
3.3(0.3)
0(0)
13.9
(3.5)
2.4
0.45
Plastic
caps
andlid
s(all)
0(0)
0.9(0.07)
3(0.06)
0(0)
1.4(0.25)
0.6(0.07)
0(0)
0(0)
5.3(1.9)
4(1)
3.4
0.33
Foilwrapp
ers,
alum
inum
foil
0(0)
1.7(0.13)
1(0.02)
2.2(1.4)
0.3(0.05)
1.5(0.17)
3.9(0.17)
5.5(0.5)
0.6(0.2)
2(0.5)
2.0
0.31
String&
cord
(diam.
<10
mm)
1.2(0.03)
1.7(0.13)
1.2(0.02)
0.3(0.2)
0(0)
1.8(0.2)
2.3(0.1)
1.1(0.1)
0.6(0.2)
0(0)
1.5
0.11
Foo
dcontaimerse.g.,
fastfood
4.7(0.13)
0(0)
2.8(0.05)
0(0)
0(0)
0(0)
0.8(0.03)
3.3(0.3)
0.3(0.1)
7.9(2)
2.9
0.29
Bottle
caps,lid
s,&
pulltabs
0(0)
0(0)
0.9(0.02)
0.3(0.2)
0(0)
0.9(0.1)
0.8(0.03)
2.2(0.2)
0.8(0.3)
1.6(0.4)
1.1
0.13
Lolly
sticks
1.2(0.03)
0.4(0.03)
0.3(0.01)
0(0)
0(0)
0.3(0.03)
0(0)
6.6(0.6)
0.8(0.3)
0(0)
0.7
0.10
Cup
sandcuplid
s2.3(0.07)
0(0)
0.2(0)
3.2(2)
0(0)
0(0)
0(0)
0(0)
1.4(0.5)
0(0)
0.9
0.26
Cleaningbristles
0(0)
0(0)
0.1(0)
42.2
(26.6)
0.3(0.05)
0(0)
0(0)
0(0)
0(0)
0(0)
5.9
2.67
Cottonbu
ds4.7(0.13)
1.3(0.1)
4.4(0.08)
0(0)
0(0)
0(0)
0(0)
0(0)
0(0)
0(0)
2.9
0.03
Other
sanitary
items
2.3(0.07)
0.4(0.03)
3.3(0.06)
1(0.6)
0(0)
0(0)
0(0)
0(0)
0(0)
0(0)
2.2
0.08
Medical
Item
s0(0)
0(0)
1.1(0.02)
0.3(0.2)
1.7(0.3)
0(0)
0(0)
0(0)
0(0)
0(0)
1.0
0.05
“Sou
thernston
es”includ
eGehlsdo
rfFähre,Warno
wHotel
andHolzhalbinsel.Sou
thernbeachescoverthesamplingspotsOldendo
rfer
TannenandGehlsdo
rfFähre
Environmental Management (2021) 68:860–881 869

25mm accumulated at the coastline of about 2.5 millionpieces meets the dimension of the annual emissions. Togetherwith the plastic fraction below 5mm, we would get an annualemission above 3 million plastic pieces.
The catchment of the Warnow river has a similar popu-lation as Rostock city and the sewage and stormwatermanagement is comparable. As a consequence, the emissionof plastics via the river should be similar compared to theemissions from Rostock city, as long as no particles areretained in the river. No indicator items were found duringriver sampling, but it remains unclear if this results fromretention in the river or from the weak data basis and lownumber of particles found. Assuming that the few data forvisible plastics at the river mouth allows an extrapolation,the plastic input with the river of about 3 million particles/awould be comparable to annual amount accumulated at theestuary coastline of 2.5 million pieces. On the other hand,the plastic concentrations at the river mouth were with0.016 particles/m³ compared to 0.14 particles/m³ in theestuary much lower. Our weak data basis cannot settle thequestion whether and to what degree retention of visibleplastic particles takes place in the river.
The data on visible plastics and indicator items in theriver, emission from the city and accumulation at thecoastline was compiled and spatially up-scaled for themodel simulations. Because of the uncertainties with respectto plastic retention in the Warnow river, the model approachneglected retention. This approach is supported by Labrenz(2020) who reports an increasing microplastic concentrationfrom the upper Warnow river towards the mouth.
Plastic Accumulation at Baltic Sea Coasts
While the data from the estuary served as model input, themicro- and mesoplastic monitoring at beaches located in thesurrounding of the Warnow Estuary but facing the openBaltic Sea served the spatial model validation. Previousmodel simulations on small microplastics indicated thatmost coastal accumulation takes place close to the emissionspot with a strong decline of concentrations with increasingdistance, but the results were not validated by data(Schernewski et al. 2020, 2021). Therefore, the samplingspots were chosen to catch potential accumulation hot-spotsas well as the spatial gradients along the coast. Drivingquestions were: is the estuary a major source for largemicro- and mesoplastics, if yes, is it true that it is washedashore shortly after the emission and close to the plasticsemission points and do strong spatial gradients exist?
The Baltic Sea beach monitoring data (Table 2) showsthe highest density of particles per sampling for Warne-münde beach (7–31 particles/m²), followed by Hohe Düne(6–17 particles/m²), both located close to the estuary mouth.For all other, more remote locations the numbers are much
lower Markgrafenheide (1.2 particles/m²) and Kägsdorf,Nienhagen and Darss (0.3 particles/m²). These numberstake into account all visible items in Table 2. The con-centrations at beaches within the estuary, that were sampledwith similar methods, was 3–8 particles/m², so lower thanWarnemünde and Hohe Düne. Indicator items, such as lollysticks, were only found in Warnemünde and Hohe Düneand at comparable concentration like within the estuary.Similar to the locations within the estuary, cigarette buttsand plastic pieces (5–25 mm) were the quantitatively mostimportant item groups. The concentrations of cigarette buttswithin the estuary and at Baltic Sea beaches near the mouthwere highly variable, but above 20 butts/m² at severallocations. In average, the share and quantity of plasticpieces (5–25 mm) was higher at Baltic Sea beaches.
The data for selected items are visualized in Fig. 4. Itemssuch as lolly sticks and cigarette butts did show locationswith increased concentration in and outside the estuary.Clear gradients within the estuary, between the city centerand Baltic Sea, were not obvious. The same was true formesoplastic (1–25 mm), which shows high concentrationsin and around the estuary compared to more remote BalticSea beaches. Only cotton buds, the most specific indicatorfor sewage overflow, was found exclusively near the citycenter and hardly at other locations.
Altogether we can summarize that the estuary and nearbyBaltic Sea beaches are hot-spots for plastic pollution andaccumulation. It is likely that urban water-related emissionplays an important role, but local pollution from tourismmay play an important role, as well. Items such as cottonbutts indicate that sewage overflow are relevant pollutionevents in the Warnow Estuary, too. However, no plasticitem or item class is suitable to provide a consistent spatialpicture of the transport, behavior and deposition of plasticswithin the estuary and between estuary and Baltic Sea.Whether the estuary serves as important plastic pollutionsource for the Baltic Sea cannot settled based on the data.The strong accumulation of plastics at coastlines within theestuary clearly indicates that the estuary coastline serves asa sink for plastics and reduces the load to the Baltic Sea, butthis cannot be quantified.
Emission, behavior, and Coastal Accumulation ofvisible Plastics in the Baltic Sea
The estuary monitoring data served as model input and theBaltic Sea coast data was meant for model validation. Here,we focus on visible plastics (1–25 mm). Aim of the modelsimulations was to explain large visible plastic transport,behavior and deposition as well as to address the question ofplastic retention in coastal systems. Planned was a two-stepmodeling approach with a spatially high resolved hydro-dynamic model (below 100 m grid cells) in the estuary,
870 Environmental Management (2021) 68:860–881

Table2Partly
aggregated
Baltic
Sea
beachmon
itoring
data.The
locatio
nsareindicatedin
Fig.4
Sam
plingspot
Nien-hagen
Kägsdorf
Warne-m
ünde
Warne-m
ünde
Hoh
eDün
eHoh
eDün
eMarkg
ra-fenheide
Darss
Sam
plingmetho
dsieve
sieve
sieve
bare
eye
sieve
bare
eye
sieve
sieve
Num
berof
samplings
14
74
73
13
Water
level(abo
veMWL)
26cm
16–41
cm15–95
cm15
3cm
15–95
cm15
3cm
26cm
14–24
cm
OSPAR
item
names
%(items/m
2 )
Cigarette
butts
andfilters
66.7
(0.2)
11.6
(0.1)
56.8
(5.2)
37.6
(17.4)
17.3
(1.5)
14(2.5)
8.3(0.1)
22.2
(0.1)
Plastic
pieces
5–25
mm
33.3
(0.1)
4.7(0.05)
5(0.44)
0.3(0.15)
17.6
(1.5)
20.8
(3.8)
16.7
(0.2)
0(0)
Plastic
pieces
25–50
0mm
0(0)
0(0)
1.6(0.14)
0.7(0.33)
9.7(0.84)
30(5.43)
0(0)
0(0)
Firew
orks
plastic
pieces
0(0)
0(0)
6.4(0.59)
21.2
(9.8)
1.9(0.16)
0.2(0.03)
0(0)
0(0)
Polystyrene
pieces
25–50
0mm
0(0)
0(0)
0.2(0.01)
0.5(0.25)
0(0)
0(0)
8.3(0.1)
0(0)
Plastic
pieces
<5mm
0(0)
2.3(0.03)
0.2(0.01)
0.2(0.08)
7.6(0.66)
0(0)
0(0)
0(0)
Indu
strial
pellets
0(0)
2.3(0.03)
1.7(0.16)
0(0)
0.3(0.03)
23.5
(4.3)
8.3(0.1)
0(0)
Crisp
packets/sw
eetwrapp
ers
0(0)
0(0)
1.2(0.11)
1.6(0.75)
3.3(0.3)
3.5(0.6)
8.3(0.1)
0(0)
Bagsincl.Pieces(all)
0(0)
2.3(0.03)
0.5(0.04)
0.9(0.43)
3(0.26)
0.2(0.03)
8.3(0.1)
0(0)
Foam
spon
ge0(0)
0(0)
0.5(0.04)
0(0)
0.3(0.03)
0.7(0.13)
0(0)
0(0)
Plastic
caps
andlid
s(all)
0(0)
2.3(0.03)
0.5(0.04)
2.4(1.13)
3(0.26)
1.1(0.2)
0(0)
0(0)
Foilwrapp
ers,alum
inum
foil
0(0)
0(0)
0.8(0.07)
0(0)
0(0)
0.7(0.13)
0(0)
0(0)
String&
cord
(diam.<10
mm)
0(0)
2.3(0.03)
0.9(0.09)
0.1(0.03)
5.2(0.45)
0.6(0.1)
41.7
(0.5)
27.8
(0.17)
Foo
dcontaimerse.g.,fastfood
0(0)
0(0)
0(0)
0.2(0.08)
0(0)
0(0)
0(0)
0(0)
Bottle
caps,lid
s&
pulltabs
0(0)
2.3(0.03)
3.3(0.3)
0.4(0.18)
0.6(0.05)
0.2(0.03)
0(0)
0(0)
Lolly
sticks
0(0)
0(0)
0.3(0.03)
0.5(0.23)
0.3(0.03)
0(0)
0(0)
0(0)
Cup
sandcuplid
s0(0)
0(0)
0(0)
0.3(0.15)
0(0)
0(0)
0(0)
0(0)
Sum
visibleplastics/m²
0.3
0.3
7.3
30.9
6.1
17.3
1.2
0.3
Environmental Management (2021) 68:860–881 871

linked to a the spatially less refined model covering theentire Baltic Sea. The modeling approach in the estuaryfailed. As consequence all following results are based on theBaltic Sea model only. The Baltic Sea model with a grid of1 nautical mile did not sufficiently resolve the estuary.
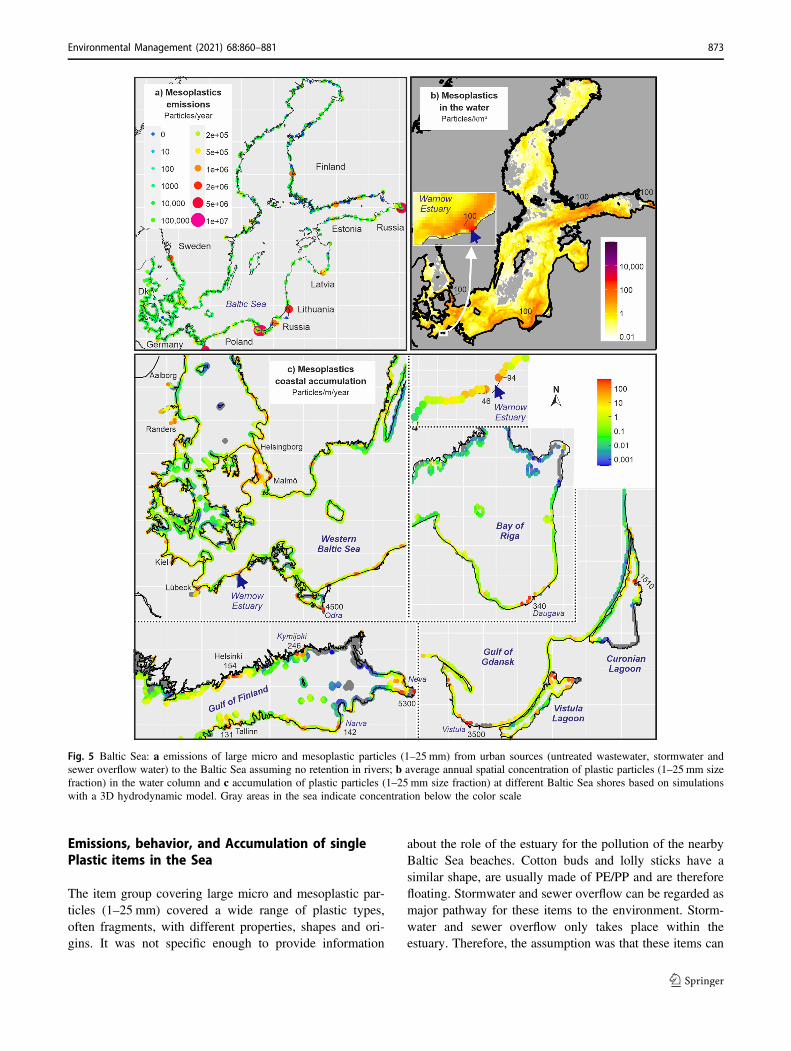
In most areas of the Baltic Sea, the concentration ofvisible plastics was below 1 particle per km² sea surface(Fig. 5). Only in the surrounding of major emission spots,
usually major river or cities, the model suggested muchhigher concentrations in larger areas. Examples were areasnear Helsinki, St. Petersburg, Gdansk or the Danish Straitswere concentrations above 100 visible plastic particles/km²occurred (Fig. 5b). Near the Warnow Estuary, concentra-tions above 100 particles/km² were restricted to an area ofabout two kilometers diameter around the mouth. Thecoastal Baltic Sea is shallow and wave induced turbulencedoes not allow a permanent settling of plastics with adensity above 1 g/cm³ on the predominantly sandy sedi-ments close to the coast. We considered only commonplastics with densities between 0.9 and 1.4, which con-stitutes the vast majority of plastics in the environment.Depending on the plastic density, the residence times ofparticles in the Baltic Sea differed, but, in average, wasbelow two weeks. A consequence of this short residencetime was, that emissions and deposition were balancedalready within a few months and stable concentration pat-tern in the sea were established. Changes in the amount andlocation of emissions caused modified spatial distributionpatterns in the sea, but according to our model, emissionscannot cause an ongoing accumulation of large micro- andmesoplastics in the sea.
The vast majority of emitted plastic particles werewashed ashore within days and usually close to the emissionspot (Fig. 5c). As a consequence, the model suggested veryhigh annual plastic accumulations near major cities andrivers. Examples were the Odra mouth (Poland) with 4500visible plastic particles/m coastline per year, St. Petersburg(Russia) with 5300 particles/m/year, the Vistula mouth(Poland) with 3500 particles/m/year or the Nemunas(Lithuania) with 1510 particles/m/year.
For the Warnow Estuary, the model suggested 46 visibleplastic particles/m/year (1–25mm size class in Warnemünde)resp. 94 particles/m/year (Hohe Düne), next to the modelemission cell and strongly decreasing concentrations withincreasing distance to the estuary mouth. This spatial patternwas consistent with the pattern obtained from monitoring datafor this size class (Table 2). Higher accumulations at HoheDüne compared to Warnemünde were supported by themodel and even the absolute numbers were fairly in agree-ment. This was true, if we assumed that a beach monitoringwas carried out every two weeks (the common samplinginterval for assessments within the EU Water FrameworkDirective) and would have always deliver plastic concentra-tions at the locations as documented in Table 2. However, thedirect comparison of monitoring and model data is linked tomany uncertainties. The model did not take into accountretention in rivers and in the estuary, but to conclude that ifmodel and data match, retention ddid not play a role is cer-tainly misleading. The pollution at the beaches can have localreasons, such as tourism, and was not necessarily resultingfrom plastics carried by estuarine water.
Fig. 4 Results of the coastline monitoring for selected items an itemgroups in the Warnow Estuary and nearby southern Baltic Sea beachesbased on data in Tables 1 and 2
872 Environmental Management (2021) 68:860–881
Emissions, behavior, and Accumulation of singlePlastic items in the Sea
The item group covering large micro and mesoplastic par-ticles (1–25 mm) covered a wide range of plastic types,often fragments, with different properties, shapes and ori-gins. It was not specific enough to provide information
about the role of the estuary for the pollution of the nearbyBaltic Sea beaches. Cotton buds and lolly sticks have asimilar shape, are usually made of PE/PP and are thereforefloating. Stormwater and sewer overflow can be regarded asmajor pathway for these items to the environment. Storm-water and sewer overflow only takes place within theestuary. Therefore, the assumption was that these items can
Fig. 5 Baltic Sea: a emissions of large micro and mesoplastic particles (1–25 mm) from urban sources (untreated wastewater, stormwater andsewer overflow water) to the Baltic Sea assuming no retention in rivers; b average annual spatial concentration of plastic particles (1–25 mm sizefraction) in the water column and c accumulation of plastic particles (1–25 mm size fraction) at different Baltic Sea shores based on simulationswith a 3D hydrodynamic model. Gray areas in the sea indicate concentration below the color scale
Environmental Management (2021) 68:860–881 873

serve as reasonable indicator for beach pollution resultingfrom the estuary. Because of low numbers, data on cottonbuds and lolly sticks of both is aggregated in the following.
Again rivers and large cities were major emission spotsand the model suggested concentrations above 1 particle/km² in the sea areas close to the emission spots (Fig. 6a,b).In the Warnow estuary plume, a few kilometers off the coastthe model suggested annual average concentrations of9 sticks/km² (cotton buds and lolly sticks). For coastlinesclose to the major emission spots, the model suggestedannual accumulations that could, in single cases, exceed100 sticks/m coastline per year. Examples were the Vistula(Poland) with 280 and the Neva/St. Petersburg (Russia)with 443 sticks/m coastline per year. Higher concentrationsin eastern Baltic locations resulted from a combination ofhigh population and, compared to northern and westernBaltic Sea states, a higher discharge of untreatedwastewater.
At Warnemünde and Hohe Düne, beaches next to theWarnow estuary, the model suggested annual accumula-tions of 3.5–7.5 sticks/m coastline. If we again assume thata beach monitoring is carried out every two weeks andwould always deliver plastic concentrations at the locationsas documented in Fig. 4, the model results fairly matchedthe data. However, this statement is based on only few lollysticks found during the monitoring. Cotton buds werehardly found.
We need to conclude that in areas where larger amountsof untreated sewage water enter the coastal sea, the mon-itoring of indicator items may be a useful approach to assessthe role of urban waste- and stormwater on coastal pollu-tion. For the Warnow Estuary, the number of emitted cottonbuds and lolly sticks was too low. The few found sticks atsurrounding Baltic Sea beaches can hardly serve as indi-cator for pollution resulting from urban waste- andstormwater.
Retention of Plastic items in Rivers and Estuaries
Cigarette butts and filters are, within the estuary and at theBaltic Sea beaches, the quantitatively most important singleplastic litter item. We can assume a direct relationshipbetween number of cigarette butts emitted to the environ-ment and the human population (modified by social andbehavioral factors). The German Baltic Sea coast is char-acterized by intensive summer tourism. We can assume thatdirect local emissions by tourists and local population aswell as urban wastewater related emissions were dominat-ing and caused the pollution intensity and pattern observedin the monitoring data. Since our model approach addressedonly one of these pathways, we cannot expect a closerelationship between model results and monitoring data.However, the quantitative importance of cigarette butts and
their special character justified specific model simulations.When entering the water, cigarette butts face a much fasterdecay than other plastic items (the reason why OSPARoriginally counted it under paper) and change their prop-erties from floating to sinking. As a consequence, it is likelythat the retention of cigarette butts during transport in wateris higher compared to other plastics.
Figure 7 shows the emission of cigarette butts to theBaltic Sea and the resulting accumulation at the coastlinebased on our extrapolated emission calculations. Figure 8uses the same emission data, but assumed that during thetransport in rivers, a retention of the cigarette butts of 10%/km took place. The comparison of Figs. 7a and 8a showsthe consequences on emissions to the Baltic Sea. In caseswhere the emission took place in large coastal cities, such asHelsinki, Stockholm or Copenhagen the difference wasminor. Spots where large rivers, such as Daugava (Latvia)and Nemunas (Lithuania), enter the Baltic Sea, the simu-lation applying a 10% retention/km showed stronglyreduced emissions of cigarette butts and subsequently muchlower concentrations in the sea and at beaches. Most buttswere kept back during the riverine transport.
The assumption of a retention in the Warnow river (andpartly in the Warnow Estuary) strongly changed the accu-mulation at the beaches (Figs. 7b and 8b). Without reten-tion, we got an annual accumulation of 406 cigarette butts/m coastline compared to 109 cigarette butts/m coastlineassuming retention of 10%/km. This clearly indicates thatthe present lack of reliable information about retention ofitems in the river and the estuary is a serious shortcomingand limits the reliability of our model results.
Discussion
The model approach and the simulations of emission,transport and deposition of large micro- and mesolittercontain many assumptions and simplifications. For thesimulation of microplastics with a size below 500 μm andsingle plastic types (PE/PP and PET) as well as plasticsclasses with densities between 0.8 and 1.4 g/cm³, this isdiscussed in detail in Schernewski et al. (2020, 2021).During these earlier studies, we learnt that differences inplastic particle shape and size do not play an important rolefor our model simulation results, at least not when takinginto account our temporal and spatial model resolution. Inour approach, we do not assume that plastic particles (apartfrom cigarette butts) change their properties during therelatively short time residence of a few weeks in the marineenvironment. The high share of PP and PE particles in thesediments of the Warnow Estuary indicate that, when theresidence time of plastics in the marine environmentexceeds weeks, particles can change their buoyancy. This
874 Environmental Management (2021) 68:860–881

Fig. 6 Baltic Sea: a emissions of cotton buds and lolly sticks from urban sources (untreated wastewater, stormwater and sewer overflow water) tothe Baltic Sea assuming no retention in rivers; b average annual spatial concentration of cotton buds and lolly sticks in the water column and (c)accumulation of these items at different Baltic Sea shores based on simulations with a 3D hydrodynamic model. Gray areas in the sea indicateconcentration below the color scale
Environmental Management (2021) 68:860–881 875

happens, for example, when particles are temporarily trap-ped in reed belts and organism settlement on plastics takesplace. It is likely that the properties of plastics changestowards the properties of natural organic material with adensity slightly above the density of water. As a con-sequence, differences in plastic size, shape and densityshould play a decreasing role on its behavior in the sea thelonger the model simulation period lasts. This would sim-plify model approaches.
Our approach to calculate the emission of plastic items,such as cigarette butts/filters, cleaning bristles, cotton budsand lolly sticks, for the city of Rostock very much dependson assumptions as well as social and behavioral factors andseems transferable within the Baltic Sea region but noteasily beyond. The emissions to the sea further depend on
environmental factors such as climate (e.g., likelihood ofheavy rains) as well as the type and quality of the urbanwastewater system (e.g., combined or separated sewersystem). Being aware of the weaknesses we follow analternative approach to calculate item emissions, based oncoastline monitoring within the estuary with a subsequentspatial and temporal extrapolation to get annual emissiondata. The results of both approaches were consistent andtogether indicate, that we met the right order of magnitudewith respect to our annual item emission data.
The observed plastic concentrations in the Warnow riverof 0.32 (200 μm net), 0.016 (300 μm net), and 0.019 plasticparticles/m³ (1000 μm net) are low. Applying 300–333 μmnets, Baldwin et al. (2016) report concentrations in GreatLakes tributaries of 0.05–32 particles/m³ and Yonkos et al.
Fig. 7 Baltic Sea: a emissions ofcigarette butts and filters fromurban sources (untreatedwastewater, stormwater andsewer overflow water) to theBaltic Sea assuming no retentionin rivers; b accumulation ofthese items at Baltic Sea shoresbased on simulations with a 3Dhydrodynamic model
876 Environmental Management (2021) 68:860–881

(2014) found concentration between 0.27 and 1 particles/m³in four rivers in the USA. In more urban rivers the con-centrations are higher, e.g., 2.4–5.7 particles/m³ (McCor-mick et al. 2014) and 5 particles/m³ (Mani et al. 2015) or 7particles/m³ (Faure et al. 2015). Reasons for low con-centrations in the Warnow can be the low population den-sity in the catchment and well established sewage treatmentsystems with a very high connection degree. The con-centrations in the estuary of 0.14 particles/m³ (300 μm net)are in the range of existing data. With a similar approach,Setälä et al. (2016) found 0.3–2.1 particles/m³ in the Gulf ofFinland and Tamminga et al. (2018) 0.04–0.09 particles/m³in the South Funen Archipelago. Our model simulatedconcentrations of large micro- and mesolitter in the waterbody of the Baltic Sea cannot be sufficiently validated with
our field data. To our knowledge, suitable and comparablepublications are lacking.
Our data shows that the estuary and nearby Baltic Seabeaches are hot-spots for plastic pollution and accumula-tion. The highest density of large micro and mesoplasticparticles per sampling are observed at Warnemünde (7–31particles/m²), followed by Hohe Düne (6–17 particles/m²) inflood accumulation zones of beaches. Both beaches arelocated close to the estuary mouth. At more distant andremote beaches, the numbers are much lower Mark-grafenheide (1.2 particles/m²) and Kägsdorf, Nienhagen andDarss (0.3 particles/m²). International literature on macrolitter is abundant and shows a wide spectrum of plasticitems at Baltic beaches (MARLIN 2013, Schernewski et al.2018). The same is true for mesolitter (Haseler et al. 2020).
Fig. 8 Baltic Sea: a emissions ofcigarette butts and filters fromurban sources (untreatedwastewater, stormwater andsewer overflow water) to theBaltic Sea assuming a retentionof 10%/km in rivers; baccumulation of these items atBaltic Sea shores based onsimulations with a 3Dhydrodynamic model
Environmental Management (2021) 68:860–881 877
However, common beach monitoring methods are hardlysuitable to indicate plastics that is washed ashore. For thispurpose, the flood accumulation zone method is much moresuitable. But it has serious weaknesses, for example, itdepends on unpredictable high water level events and canhardly be applied strictly at defined dates, the available timewindow for carrying out the monitoring after a flood is onlya few days, before the accumulation zone is destroyed. For acomparison of methods see (Haseler et al. 2019).
The field data for Baltic Sea beaches and model results areconsistent. This is true for the spatial pattern, gradientsbetween locations and the annual absolute amounts of selecteditems and the meso-plastics item group. However, the absoluteannual amounts of visible plastics accumulated at the coast arehighly uncertain and depend on the method. Here, we assumeda bi-weekly monitoring in agreement with the EU WaterFramework Directive. Another approach would have resultedin different values. Further, we do not know how much of theplastics was already at the beach and was just re-suspendedand re-accumulated in the flood edge. The model resultsdepend on the used calculated emission scenarios as modelinput. Because of these uncertainties we cannot, with respectto the annual amounts, speak of a reliable model validation.
We combine emission calculations, field monitoring inthe estuary and at sea beaches as well as modeling but thecombination of all data does not allow us to provide reliableinformation on visible plastics retention in the Warnowriver or in the Warnow Estuary. We can assume that,because of a comparable population in the Warnow rivercatchment, the plastics emissions are similar to our calcu-lations for the city of Rostock, but the low number ofparticles found in the river mouth monitoring is too weak toallow retention calculations. Data in Piehl et al. (2021) andLabrenz (2020) indicate no permanent microplastics reten-tion in the Warnow river, but make obvious that thattransport and processes in rivers are still poorly understood.Our two model simulations on cigarette butts, which assumeno retention as well as a retention of 10%/km in rivers,clearly indicate the high importance of retention on itemsconcentrations in the sea and on coastal item accumulation.Hoellein et al. (2019) conclude that current models ofmicroplastic transport underestimate microplastic retentionin rivers. This view is supported by results of Besselinget al. (2017) who carried out scenario studies with ahydrological model and conclude that in 40 km river prac-tically all particles (>100 μm spherical polystyrene) are keptback. Our assumed retention of 10%/km for cigarette buttsis comparable and means a retention of 98.5% over 40 riverkilometers. The problem of retention in rivers with a focuson microplastics emissions to the Baltic Sea is discussed indetail in Schernewski et al. (2021).
The retention of visible plastics in the estuary cannot bequantified, as well. Model approaches are promising, butour spatial model resolution is not sufficient and the data isnot consistent. The large amounts of large micro- andmesoplastics found at the estuary shorelines and the abun-dancy of plastics in estuary sediments clearly indicate thatthe estuary serves as a sink. However, how much of theemissions, entering with the Warnow river and the city ofRostock, are kept back and how much is exported to theBaltic Sea is uncertain. Piehl et al. (2021) estimate amicroplastic retention in the estuary of 50%-90%, but pointout the high uncertainty.
Our idea was to use large micro- and mesolitter plastics,which can easily and at low cost be monitored in the field,as an indicator for the plastic pollution in general and to usespecific items as indicators for selected pollution sourcesand/or pathways. We assume stormwater and sewer over-flow as major urban pathways for plastics of all size classesin the Baltic Sea region (Schernewski et al. 2020). This isespecially true for large micro- and mesolitter. As soon assewage water passes a Waste Water Treatment Plant, atleast 80% of all microplastics is kept back and the retentionin modern WWTPs, with at least three treatment stages, isabove 95% (Baresel & Olshammar, 2019). Larger plasticfractions are practical fully kept back. Therefore, we focuson stormwater and sewer overflow and considered cleaningbristles, cigarette butts, lolly sticks and cotton buds as sui-table indicators for emissions via these pathways. They areeasy to monitor in the field, but, apart from cigarette butts,the numbers emitted to the environment are too low thatthese items can serve as general sewage and stormwaterindicators. Cleaning bristles were found only at a fewlocations. Cotton buds are very specific for this emissionpathway but found only in the southern part of the estuary,very close to likely emission spots. Lolly sticks and cigar-ette butts are not specific enough and can have other pol-lution sources, e.g., direct emission by tourists. However,cotton butts indicate that sewage overflow are importantpollution events in the Warnow Estuary. A weakness is thatthese items, apart from cigarette butts, are not specified incommon beach monitoring protocols. As a consequence,existing beach data does not provide comparable data.
Conclusions and Recommendations
The Warnow Estuary area, with Rostock city and theWarnow river, is an emission and pollution hot-spots formicro- and mesoplastics. This area can be regarded astypical and representative for several estuaries at thesouthern Baltic coast and the results seem transferable
878 Environmental Management (2021) 68:860–881

within the Baltic region. Cities and rivers in the Baltic areimportant emission hot-spots for visible plastics.
The accumulation of visible plastics at the coastline inthe near surrounding of the emission spots is confirmed byour model simulations. Especially in coastal waters, theresidence time of plastic items in the water is only days. Theshort residence time, relatively low plastic concentrationsand vertical gradients resulting from different buoyancies,make a sampling in the water body not recommendable.Instead, large micro- and mesoplastics monitoring shouldfocus on final sinks, the beaches. The sampling should catchthe spatial gradients from the potential emission hot-spot(e.g., river mouth). For the development of a spatial sam-pling strategy, spatial high resolved hydrodynamic modelsare very suitable tools. On beaches, the sampling shouldfocus on the flotsam and be carried out during high waterlevel events. This ensures a sufficient number of particlesand that the accumulated items are seaborne. The lack ofmethods for assessing microplastic fractions below 1 mm atbeaches is an existing shortcoming.
The plastics pollution of the Warnow Estuary sedimentsindicates that sediment studies in areas where organicmaterial accumulates are a suitable complementation to geta full picture of all relevant plastic sinks in coastal systems.Relatively low concentrations of plastics and fluffy organicsediments make the sampling from a boat methodologicallydifficult. Therefore, we recommend to utilize channeldredging events to assess the plastic composition andabundancy in sediments. However, this requires furthermethodological developments.
The retention of plastics in rivers (and estuaries)depending on size, form and density is still largelyunknown. A better knowledge of emission, retention andloads of visible plastics in rivers is a core requirement forimproving the reliability of 3D-hydrodynamic modelsimulation approaches. Further, much of our plastics accu-mulated in the estuary sediments was originally floating, butovergrowth with algae and bacteria increased the densityand cause a deposition at the bottom. This process seems toplay an important, but still insufficiently known, role for theplastic behavior in the marine environment.
Large micro- and meso-plastic emissions from urbansources, especially during sewer overflows and stormwaterseem to be of highest importance in the Warnow Estuary. Aconsequence is that pollution mitigation or reduction measuresshould preferably focus on urban areas. High emissions cantake place during short events, often lasting less than hours.Therefore, the sampling needs to be event-based. However,the quantification of plastic emissions during stormwaterevents remains a methodological challenge. A general lessonlearnt is that traditional sampling programs with definedlocations and fixed sampling intervals alone are not sufficientto provide the necessary data for a successful plastics
monitoring and management. These approaches need to becomplemented by event-based sampling strategies andmethods.
The combination of simple beach monitoring withemissions calculation and modeling approaches, in general,are promising for improving our understanding of plasticspollution in time and space. Each of the single appliedmethod has short-comings and uncertainties and the com-bination of all methods stabilize the results. However, nei-ther large micro- and mesoplastics, as a size class, nor singleitems are suitable to provide a consistent spatial picture oftransport, behavior and deposition of plastics within theestuary and between estuary and the sea or could serve asgeneral pollution indicator for seaborne plastics. A specifi-cation of these items in common monitoring protocols,would improve the data basis.
Microplastics emissions in the entire Baltic, too, largelyresult from wastewater, stormwater and sewer overflow.Neither our selected items nor item classes in the sizefraction above 1 mm sufficiently indicate pollution fromthese pathways. Further, visible plastics in the coastalenvironment often results from direct and local sources,such as tourism. As a consequence, items or item classesabove 1 mm can hardly serve as indicator for the pollutionwith small microplastics below 1 mm. However, they mayserve as an indicator in itself.
Acknowledgements The sampling and item analysis was supported byseveral students and guest scientists. We especially like to thank MikeKörber, Jona Mathias, Maike Reichel and Amina Baccar Chabaane.Further, we thank Julia Hinrichs for data visualization. This researchwas funded by the German Federal Ministry of Education andResearch (BMBF) project MicroCatch_Balt (03F0788A) and theBONUS MICROPOLL project. The latter was supported by BONUS(Art 185), funded jointly by the European Union and BMBF(03F0775A). Additional minor support came from ERA.Net RUS Plusproject BalticLitter, funded by the German Federal Ministry forEducation and Research (01DJ19001, RFBR 18-55-76001).
Funding Open Access funding enabled and organized byProjekt DEAL.
Publisher’s note Springer Nature remains neutral with regard tojurisdictional claims in published maps and institutional affiliations.
Open Access This article is licensed under a Creative CommonsAttribution 4.0 International License, which permits use, sharing,adaptation, distribution and reproduction in any medium or format, aslong as you give appropriate credit to the original author(s) and thesource, provide a link to the Creative Commons license, and indicate ifchanges were made. The images or other third party material in thisarticle are included in the article’s Creative Commons license, unlessindicated otherwise in a credit line to the material. If material is notincluded in the article’s Creative Commons license and your intendeduse is not permitted by statutory regulation or exceeds the permitteduse, you will need to obtain permission directly from the copyrightholder. To view a copy of this license, visit http://creativecommons.org/licenses/by/4.0/.
Environmental Management (2021) 68:860–881 879

References
Baldwin AK, Corsi SR, Mason SA (2016) Plastic debris in 29 greatlakes tributaries. Relations to 853 watershed attributes andhydrology. Environ Sci Technol 50:10377–10385
Baresel C, Olshammar M (2019) On the importance of sanitary seweroverflow on the total discharge of microplastics from sewagewater. J Environ Prot 10:1105–1118. https://doi.org/10.4236/jep.2019.109065
Besseling E, Quik JTK, Sun M, Koelmans AA (2017) Fate of nano-and microplastic in freshwater systems: a modeling study. ICES JMar Sci 220:540–548
Bollmann UE, Simon M, Vollertsen J, Bester K (2019) Assessment ofinput of organic micropollutants and microplastics into the BalticSea by urban waters. Mar Pollut Bull 148:149–155
Elliott, T & L Elliott (2018) A plastic future plastics consumption andwaste management in the UK. Plastic consumption and Wastemanagement. Report for WWF. Prepared by Eunomia Reserachand Consulting Ltd. www.eunomia.co.uk
Faure F, Demars C, Wieser O, Kunz M, Alencastro LF (2015) Plasticpollution in Swiss surface waters. Nature and concentrations,interaction with pollutants. Environ Chem 12(5):582. https://doi.org/10.1071/EN14218
Gewert B, Ogonowski M, Barth A, MacLeod M (2017) Abundanceand composition of near surface microplastics and plastic debrisin the Stockholm Archipelago, Baltic Sea. Mar Pollut Bull 120(1–2):292–302
Gray AD, Wertz H, Leads RR, Weinstein JE (2018) Microplastic intwo South Carolina Estuaries: occurrence, distribution, andcomposition. Mar Pollut Bull 128:223–233
Green ALR, Putschew A, Nehls T (2014) Littered cigarette butts as asource of nicotine in urban waters. J Hydrol 519:3466–3474
Haseler, M, Balciunas, A, Hauk, R, Sabaliauskaite, V, Chubarenko, I,Ershova, A, Schernewski, G (2020) Marine litter pollution inBaltic Sea beaches—application of the sand rake method. FrontEnviron Sci 8:599978
Haseler, M, Weder, C, Buschbeck, L, Schernewski, G (2019) Cost-effective monitoring of large micro- and meso-litter in tidal andflood accumulation zones at south-western Baltic Sea beaches.Mar Pollut Bull 149. https://doi.org/10.1016/j.marpolbul.2019.110544
HELCOM, (2018a): State of the Baltic Sea—Second HELCOM hol-istic assessment 2011–2016. Baltic Sea Environ Proc 155
HELCOM, (2018b): Total and regional runoff to the Baltic Sea BalticSea Environment Fact Sheet 2016. https://helcom.fi/baltic-sea-trends/environment-fact-sheets/hydrography/total-and-regional-runoff-to-the-baltic-sea/
Hoellein TJ, Shogren AJ, Tank JL et al. (2019) Microplastic deposi-tion velocity in streams follows patterns for naturally occurringallochthonous particles. Sci Rep 9:3740. https://doi.org/10.1038/s41598-019-40126-3
HRO Statistics 2019: Rostock in Zahlen. https://rathaus.rostock.de/de/rathaus/rostock_in_zahlen/ausgewaehlte_eckdaten/bevoelkerung/bevoelkerung_nach_altersgruppen/276726
Kay P, Hiscoe R, Moberley I, Bajic L, McKenna N (2018) Wastewatertreatment plants as a source of microplastics in river catchments.Environ Sci Pollut Res 25:20264–20267. https://doi.org/10.1007/s11356-018-2070-7
Kooi, M, and Koelmans, AA (2019) Simplifying microplastic viacontinuous probability distributions for size, shape, and density.Environ Sci Technol Lett. https://doi.org/10.1021/acs.estlett.9b00379
Kowalski N, Reichardt AM, Waniek JJ (2016) Sinking rates ofmicroplastics and potential implications of their alteration by
physical, biological, and chemical factors. Mar Pollut Bull 109(1):310–319. https://doi.org/10.1016/j.marpolbul.2016.05.064
Labrenz, M (2020) Mikroplastik in aquatischen Systemen: gegen-wärtige und (potentielle) zukünftige Belastungen. SchriftenreiheUmweltingenieurwesen Band 95, 19. Dialog AbfallwirtschaftMV S. 471-474
Lange X, Klingbeil K, Burchard H (2020) Inversions of estuarinecirculation are frequent in a weakly tidal estuary with variablewind forcing and seaward salinity fluctuations. J Geophys ResOcean 125:1–18. https://doi.org/10.1029/2019JC015789
Little C (2016) Technological review: mentimeter smartphone studentresponse system compass. J Learn Teach 9:64–66
Mani T, Hauk A, Walter U, Burkhardt-Holm P (2015) Microplasticsprofile along the Rhine River. Sci Rep 5:17988. https://doi.org/10.1038/srep17988
MARLIN (2013) Final Report of Baltic Marine Litter Project MAR-LIN—litter monitoring and raising awareness. Online August2014. http://www.hsr.se/sites/default/files/marlin-baltic-marine-litter-report.pdf
McCormick A, Hoellein TJ, Mason SA, Schluep J, Kelly JJ (2014)Microplastic is an abundant and distinct microbial habitat in anurban river. Environ Sci Technol 48:11863–11871
McEachern K, Alegria H, Kalagher AL, Hansen C, Morrison S,Hastings D (2019) Microplastics in Tampa Bay, Florida: abun-dance and variability in estuarine waters and sediments. MarPollut Bull 148:97–106
Miller, MR & Burbach, ME (2017) Understanding cigarette butt lit-tering behavior on public beaches: a case study of Jekyll Island,Georgia
Mintenig SM, Int-Veen I, Löder MGJ, Primpke S, Gerdts G (2016)Identification of microplastic in effluents of waste water treatmentplants using focal plane array-based micro-fourier-transforminfrared imaging. Water Res 108:365–372
Osinski, RD, Enders, K, Gräwe, U, Klingbeil, K, and Radtke, H(2020b) Model uncertainties of a storm and their influence onmicroplastics/sediment transport in the Baltic Sea, Ocean SciDiscuss. https://doi.org/10.5194/os-2020-28
Osinski RD, Radtke H (2020a) Ensemble hindcasting of wind andwave conditions with WRF and Wavewatch III® driven by ERA5.Ocean Sci 16:355–371. https://doi.org/10.5194/os-16-355-2020
Piehl, S, Hauk, R, Robbe, E, Richter, B, Kachholz, F, Schilling, J,Lenz, R, Fischer, D, Fischer, F, Labrenz, M, Schernewski, G(2021) Combined approaches to predict microplastic emissionswithin an urbanized estuary (Warnow, southwestern Baltic Sea).Front Environ Sci 616765. https://doi.org/10.3389/fenvs.2021.616765
Prata JC (2018) Microplastics in wastewater: state of the knowledge onsources, fate and solutions. Mar Pollut Bull 129:262–265
Rath JM, Rubenstein RA, Curry LE, Shank SE, Cartwright JC (2012)Cigarette litter: smokers’ attitudes and behaviors. Int J EnvironRes Public Health 9(6):2189–2203
Schernewski G, Balciunas A, Gräwe D, Gräwe U, Klesse K, SchulzM, Wesnigk S, Fleet D, Haseler M, Möllman N, Werner S (2018)Beach macro-litter monitoring on southern Baltic beaches:Results, experiences and recommendations. J Coast Conserv 22(1):5–25. https://doi.org/10.1007/s11852-016-0489-x
Schernewski G, Radtke H, Hauk R, Baresel C, Olshammar M,Oberbeckmann S (2021) Urban microplastics emissions: effec-tiveness of retention measures and consequences for the BalticSea. Front Mar Sci 8:594415. https://doi.org/10.3389/fmars.2021.594415
Schernewski G, Radtke H, Hauk R, Baresel C, Olshammar M, OsinskiR, Oberbeckmann S (2020) Transport and behavior of micro-plastics emissions from urban sources in the Baltic Sea. FrontMar Sci 8:579361. https://doi.org/10.3389/fenvs.2020.579361
880 Environmental Management (2021) 68:860–881
Seitz, N-N, John, L, Atzendorf, J, Rauschert, C & Kraus, L (2019)Kurzbericht Epidemi-ologischer Suchtsurvey 2018. Tabellen-band: Tabakkonsum und Hinweise auf Konsumabhängigkeitnach Geschlecht und Alter im Jahr 2018. München: IFT Institutfür Therapieforschung
Setälä O, Magnusson K, Lehtiniemi M, Norén F (2016) Distributionand abundance of surface water microlitter in the Baltic Sea: acomparison of two sampling methods. Mar Pollut Bull110:177–183
Shields, AR (1936) Application of similarity principles and turbulenceresearch to bed-load movement. Mitteilungen der PreussischenVersuchsanstalt für Wasserbau und Schiffbau
Siegfried M, Koelmans AA, Besseling E, Kroeze C (2017) Export ofmicroplastics from land to sea. A modelling approach. Water Res127:249–257
Song YK, Hong SH, Jang M, Han GM, Shim WJ (2015) Occurrenceand distribution of microplastics in the sea surface microlayer inJinhae Bay, South Korea. Arch Environ Contam Toxicol 69(3):279–287
Sun J, Dai X, Wang Q, van Loosdrecht MCM, Ni B-J (2019)Microplastics in wastewater treatment plants: detection, occur-rence and removal. Water Res 152:21–37
Tamminga M, Hengstmann E, Fischer EK (2018) Microplastic ana-lysis in the South Funen Archipelago, Baltic Sea. Mar Pollut Bull208:601–608
Tudor DT, Williams AT (2004) Development of a ‘Matrix ScoringTechnique’ to determine litter sources at a Bristol Channel beach.J Coast Conserv 10:119–127
Vermeiren P, Muñoz CC, Ikejima K (2016) Sources and sinks ofplastic debris in estuaries: a conceptual model integrating biolo-gical, physical and chemical distribution mechanisms. Mar PollutBull 113(1–2):7–16
Vianello A, Boldrin A, Guerriero P, Moschino V, Rella R, Sturaro A,Da Ros L (2013) Microplastic particles in sediments of Lagoon ofVenice, Italy: first observations on occurrence, spatial patternsand identification. Estuar, Coast Shelf Sci 130:54–61. https://doi.org/10.1016/j.ecss.2013.03.022
Waldschläger K, Schüttrumpf H (2019a) Effects of particle propertieson the settling and rise velocities of microplastics in freshwaterunder laboratory conditions. Environ Sci Technol 53:1958–1966
Waldschläger, K.and Schüttrumpf, H (2019b). Erosion behavior ofdifferent microplastic particles in comparison to natural sediments.Environ Sci Technol. https://doi.org/10.1021/acs.est.9b05394
Yonkos LT, Friedel EA, Perez-Reyes AC, Ghosal S, Arthur CD(2014) Microplastics in four estuarine rivers in the ChesapeakeBay U.S.A. Env Sci Technol 48:14195–14202
Ziajahromi S, Neale PA, Leusch FDL (2016) Wastewater treatmentplant effluent as a source of microplastics: review of the fate,chemical interactions and potential risks to aquatic organisms.Water Sci Technol 74:2253–2269
Environmental Management (2021) 68:860–881 881


![Deposition of Visible Light Active Photocatalytic Bismuth ... of Visible Light Activ… · 1969 [1], the number of publications describing photocatalytic materials increases annually](https://img.pdfslide.us/doc/110x75/605ac8ffba5aa21f9c1655d3/deposition-of-visible-light-active-photocatalytic-bismuth-of-visible-light-activ.jpg)