Embed Size (px)
Citation preview
Jump to first page
CO2 EMISSION TRADING
J. Clave / January 2015
A market economy instrument to curb global warming caused by human activity.
Jump to first page
CO2 EMISSION TRADING:
� Kyoto protocol in short� Emission trading schemes� Europe cap and trade ETS� France schemes� KYOTO schemes� What options at Paris COP 21?
Jump to first page
KYOTO in short� Protocol on greenhouse effect promoting gases,
”GHG”, signed in 1992, ratified in 2005.� It has allowed trading in order to meet these
targets, and has set two incentive for using low emitting technologies: CDM and JI.
� It ended in 2012.
Jump to first page
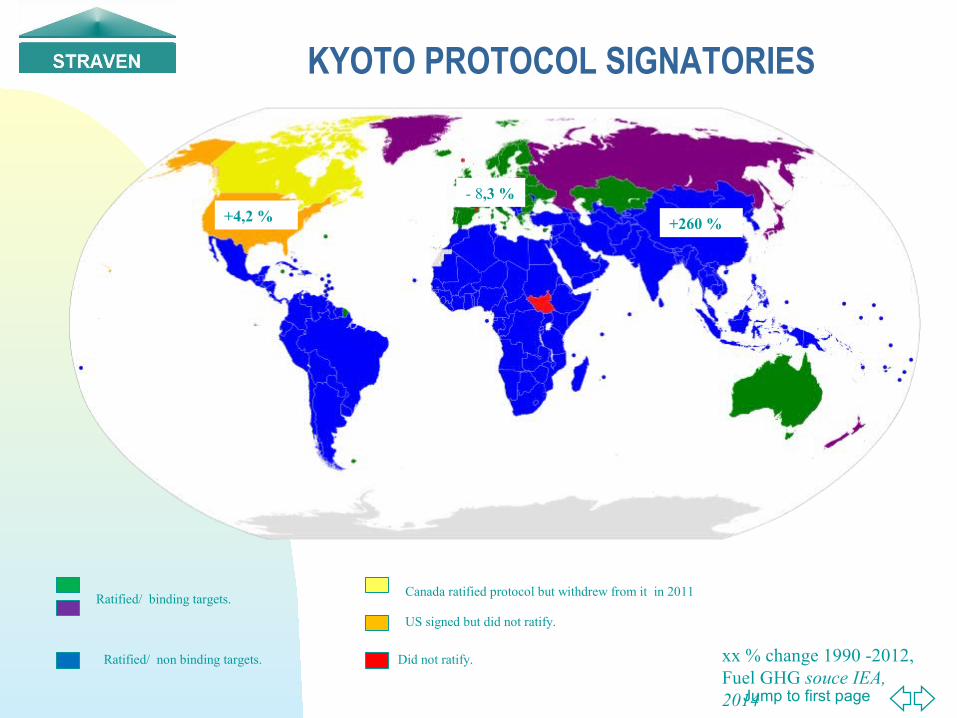
KYOTO PROTOCOL SIGNATORIES
Ratified/ binding targets.
Ratified/ non binding targets.
Canada ratified protocol but withdrew from it in 2011
US signed but did not ratify.
Did not ratify. xx % change 1990 -2012,Fuel GHG souce IEA, 2014
- 8,3 %
+4,2 % +260 %
Jump to first page
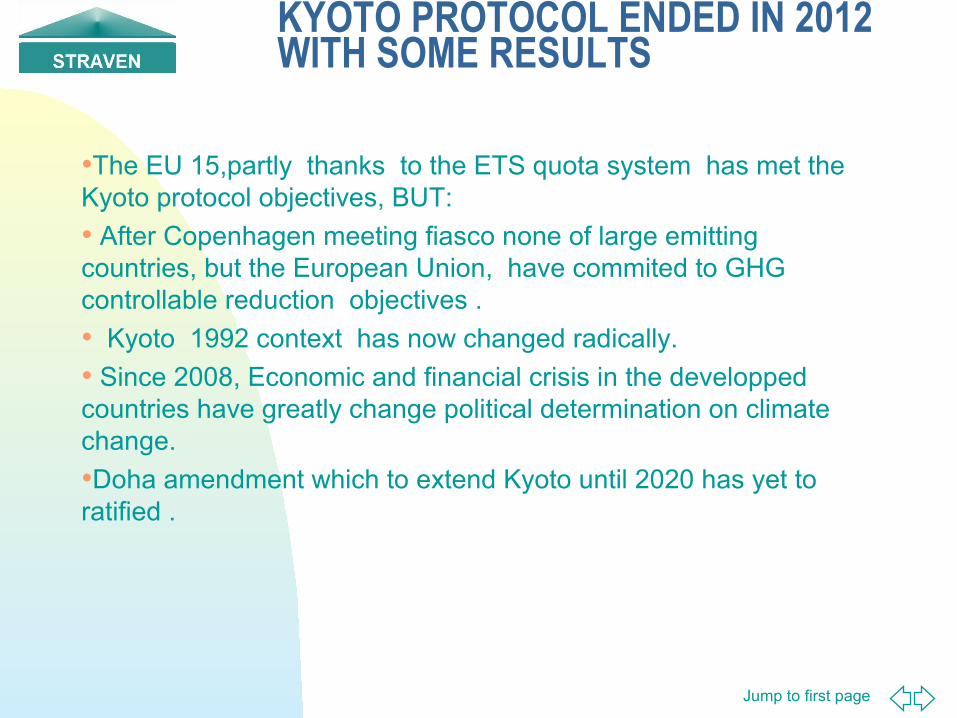
KYOTO PROTOCOL ENDED IN 2012 WITH SOME RESULTS
•The EU 15,partly thanks to the ETS quota system has met the Kyoto protocol objectives, BUT:
• After Copenhagen meeting fiasco none of large emitting countries, but the European Union, have commited to GHG controllable reduction objectives .
• Kyoto 1992 context has now changed radically.
• Since 2008, Economic and financial crisis in the developped countries have greatly change political determination on climate change.
•Doha amendment which to extend Kyoto until 2020 has yet to ratified .
Jump to first page
EMISSION TRADING MARKETS
Jump to first page
Main emission trading schemes in place
� Global mechanisms under Kyoto protocol: � Europe cap and trade ETS� Clean Development mechanism (CDM)� Joint Implementation for East Europe, Ukraine.� Australia ( merged with EU ETS)
� US regional cap and trade(RGGI): did not generate significative volumes and prices are quite low.
� Other local markets: Japan, China just started � non traded white certificates system for
spearheading energy savings initiatives
Jump to first page
Europe cap and trade ETS: a brief sumary of the three phases.
� Jan 1st,2005: Emission trading system (EU ETS) created: 1st periode till 2008.
� Its second phase 2008-2012 tightened : but economic crisis takes off 10 % of the 2050 Mt demand initially anticipated. Additionnally 1410 Mt of CDM credit are generated and can be purchased to meet quotas further depressing the EU market.
� Third phase(2013-2020): free quotas reduced by more than 2 (848 Mt in 2013), auctioned quotas volumes also reduced. Market policies now set on a yearly basis.
Jump to first page
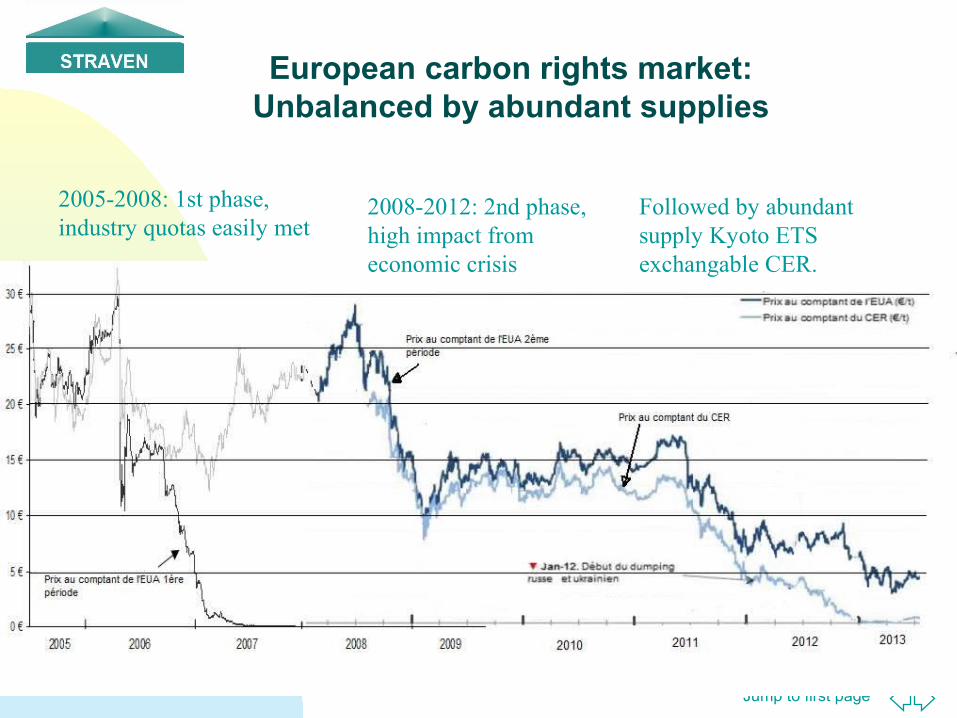
European carbon rights market: Unbalanced by abundant supplies
2005-2008: 1st phase, industry quotas easily met
2008-2012: 2nd phase, high impact from economic crisis
Followed by abundant supply Kyoto ETS exchangable CER.
Jump to first page
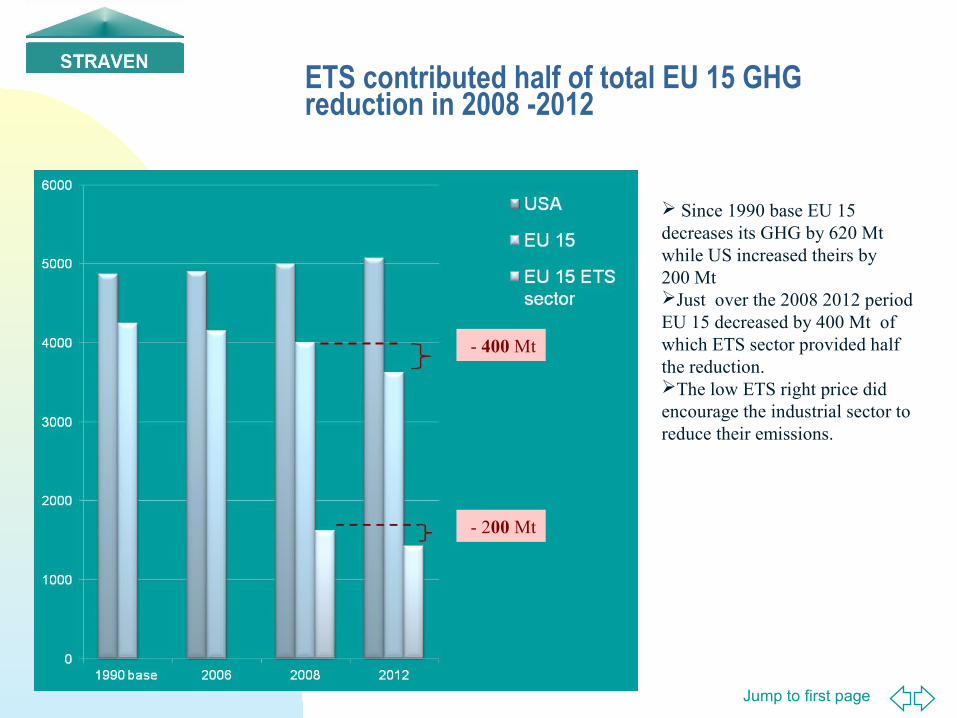
ETS contributed half of total EU 15 GHG reduction in 2008 -2012
- 400 Mt
- 200 Mt
Since 1990 base EU 15 decreases its GHG by 620 Mt while US increased theirs by 200 MtJust over the 2008 2012 period EU 15 decreased by 400 Mt of which ETS sector provided half the reduction.The low ETS right price did encourage the industrial sector to reduce their emissions.

Jump to first page
LESSONS FROM THE ETS RIGHT SYSTEM (2005 -2012)
� Overall agreement that it has been effective in generating a large part of the GHG reduction obtained by the EU
� The amount of reduction has been obtained at much lower costs than all other GHG reduction measures.
� The low price of the CO2 right reflects the market conditions:� Economic crisis which has decreased the demand of
emission rights � Huge amount of Kyoto rights have been generated with
EU ETS being the only significant market left to absorb them .
Jump to first page
France has initiated several CO²emission reduction
programs
� EU ETS participation, first issued in May 2007 covering about 1000 industrial sites.
� Energy certificates program: CEE , second phase with increased volumes ,starting in 2011.
� Renewables energy garanteed prices.� Other “Grenelle” programs .� Car Bonus/malus
Jump to first page
France Energy saving Certificates (C.E.E.)
� Established by July 13th, 2005 ”loi de programmation “� Adresses a list of energy suppliers ( electricity, nat gas,
LPG, fuel oil).� Set a non compliance penalty of 20 €/MWh � First phase objective: 54TeraWh� Second phase: 345 TeraWh ended in 2014; but actual
CEE volume generated reached 561 TWh.� Third phase (2015-2017): 700 TeraWh.� OTC market has established CEE value at 3 to 4
€/MWh in 2014.� Audited in 2013 by “Cour des comptes”: it is a very low
cost mechanism that contributed to significant energy savings in the house heating sector.
Jump to first page
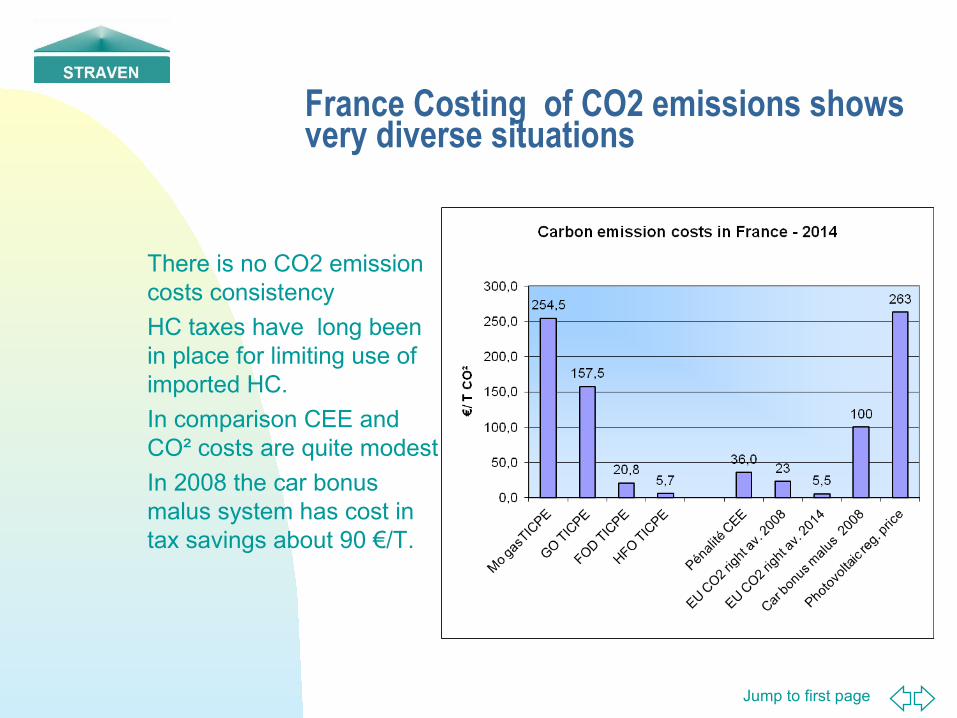
France Costing of CO2 emissions shows very diverse situations
� There is no CO2 emission costs consistency
� HC taxes have long been in place for limiting use of imported HC.
� In comparison CEE and CO² costs are quite modest
� In 2008 the car bonus malus system has cost in tax savings about 90 €/T.
Jump to first page
KYOTO Clean Development Mechanism(CDM)
� CDM scheme ( set by Kyoto) encourages listed developping nations to use low GHG emission technology in their development.
� It is managed by the United Nations (UNFCCC), which issue Certified Emission Reductions (C.E.R.) for projects and verify the GHG emission cuts.
� These CER can be traded on carbon markets. � HFC 23 usage projects and NO² abatment in adipic acid plant
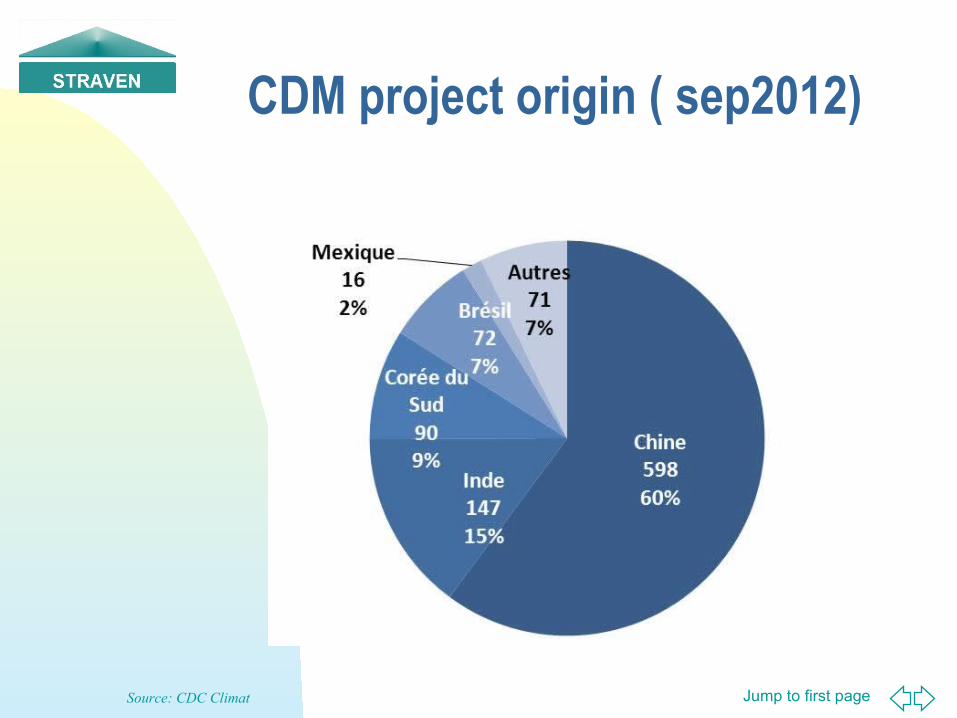
provided more than half the CER.� China is the largest issuer of CER� Buyers can be government seeking to comply with their Kyoto
commitments, companies operating in developped countries or providing their customer « carbon neutral » products.

Jump to first page
CDM project type ( Sep 2012)
Source: CDC Climat
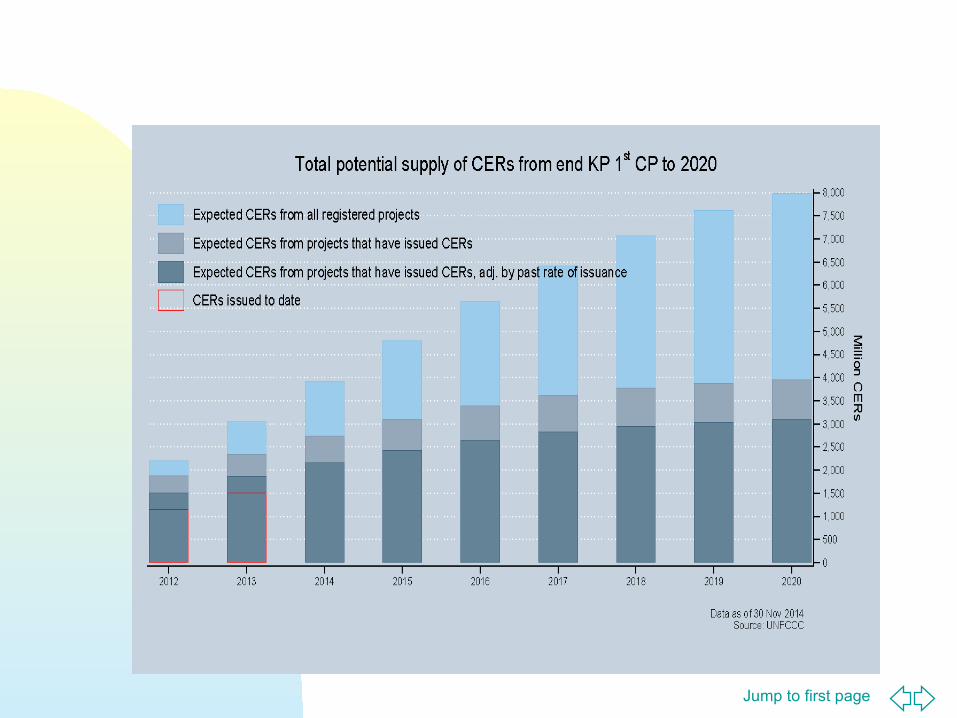
In 2014: CDM rights have reached 1,500 Mt.
Jump to first page
CDM project origin ( sep2012)
Source: CDC Climat
Jump to first page
Jump to first page
Have international emission rights some
future at Paris COP21 ?
Jump to first page
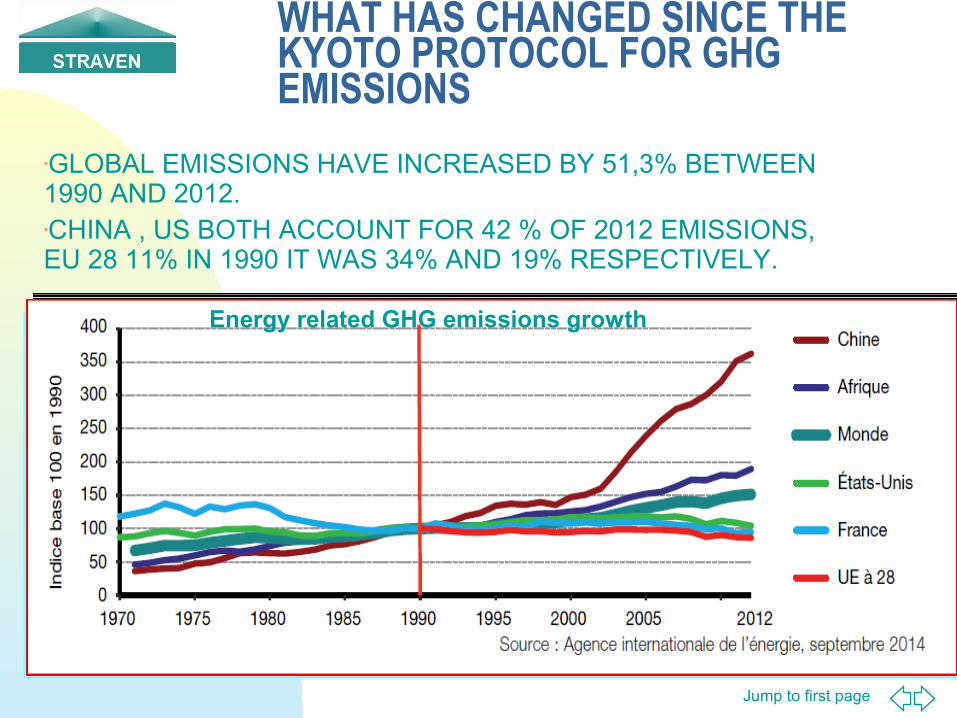
WHAT HAS CHANGED SINCE THE KYOTO PROTOCOL FOR GHG EMISSIONS
•GLOBAL EMISSIONS HAVE INCREASED BY 51,3% BETWEEN 1990 AND 2012.•CHINA , US BOTH ACCOUNT FOR 42 % OF 2012 EMISSIONS, EU 28 11% IN 1990 IT WAS 34% AND 19% RESPECTIVELY.
•. Energy related GHG emissions growth
Jump to first page
not only ,GHG emission have changed drastically since Kyoto:
Developped countries had to face the 2008 financial crisis impact.
UN climate programs management and governance are widely criticized
And end of 2014, crude prices collapse (again).
2015 COP 21 GHG EMISSION SCENE
Jump to first page
� E.U. proposed ClimatePackage has ETS right use as a key policy instrument but:
� EU Climate package have unoptimized and overlapping objectives: energy savings, GHG emission and renewables.
� US current political situation makes it unlikely that the broad cap and trade system which has been approved by the lower House will pass the Senate.
� China is contemplating the development of isolated, regional cap and trade systems.
� UN rights management need much stricter MRV procédures.� Overall the CO2 rights experiences demonstrate that there is a
huge offer for low cost GHG emission rights.� Finally current crude price 50% drop convert into a CO2
premium of 50 $/T CO2 for a fuel burner.
CURRENT CHALLENGES FOR CO2 RIGHT MARKETS

Jump to first page
And in order to know more or to get assisted on specific projects just contact :