Embed Size (px)
Citation preview
AEDC-TR-73-132 0CT5 1973 JÄH .1 9 1388
EMISSION MEASUREMENTS OF A J93 TURBOJET ENGINE
D. L. Davidson and A. F. Domal
ARO, Inc.
September 1973
Approved for public release; distribution unlimited.
Property of U. S. Air Poroa AEDC LIBRARY
F40600-74-C-0001T
ENGINE TEST FACILITY
ARNOLD ENGINEERING DEVELOPMENT CENTER
AIR FORCE SYSTEMS COMMAND
ARNOLD AIR FORCE STATION, TENNESSEE
mim When \\. S. Government drawing!» specifications, or other cala, are used for any purpose other than a definitely related Government procurement operation, the Government llierrljy incurs no responsibility nor any obligation whatsoever, and the fact lh.it the Government may have formulated, furnished, or in any way supplied the said drawings, specifications, 01 other data, is not to be regarded by implication or otherwise, or in any mannet licensing the holder or any other person or corporation, or conveying any rights or permission to ntanufacttiie, use, or sell any patented invention that may in any way be related thereto.
Qualified users may obtain copies of this report from the Defense Documentation Center.
References to named commercial products in this report arc not to be considered in any sense as an endorsement of the product by the United States Air Force or the Government.

AEDC-TR-73-132
EMISSION MEASUREMENTS OF A J93 TURBOJET ENGINE
D. L. Davidson and A. F. Domal ARO, Inc.
Approved for public release; distribution unlimited.

AEDC-TR-73-132
FOREWORD
The test program reported herein was conducted at the Arnold Engineering Development Center (AEDC), under sponsorship of the Department of Transportation (DOT), Office of the Secretary, under Interagency Agreement DOT-AS-20024, Program Element 92IK. The test engine and engine support equipment were supplied by the Air Force Aero-Propulsion Laboratory. The program was accomplished with project management liaison by Mr. A. K. Forney of the DOT Federal Aviation Administration and technical liaison by Mr. A J. Broderick and Mr. M. J. Scotto of the DOT Transportation Systems Center.
The test results were obtained by ARO, Inc. (a subsidiary of Sverdrup & Parcel and Associates, Inc.), contract operator of the AEDC, Air Force Systems Command, Arnold Air Force Station, Tennessee. The test was conducted in Propulsion Development Test Cell (J-2) of the Engine Test Facility under ARO Project RA109 between June 8 and July 31, 1972. The manuscript was submitted for publication on AprU 18, 1973.
The authors wish to express their appreciation to the General Electric Company (GE) for the use of essential test equipment during the test program, to Mr. R. S. Sowell of GE at Evendale, Ohio, for providing technical information and advice concerning operation of the test engine, and to Pratt & Whitney Aircraft at East Hartford, Connecticut, for providing information used in test systems design for the program. The authors also wish to express their appreciation to W. K. McGregor, J. D. Few, and B. L. Sieber of ARO, Inc., who obtained the spectroscopic data which are discussed in detail in Appendix III.
This report will also be published by the Department of Transportation as FAA-RD-73-66.
This technical report has been reviewed and is approved.
CHAUNCEY D. SMITH, JR. FRANK J. PASSARELLO Lt Colonel, USAF Colonel, USAF Chief Air Force Test Director, ETF Director of Test Directorate of Test

AEDC-TR-73-132
ABSTRACT
Exhaust gas emission measurements were made at the nozzle exit of a J93 turbojet engine at simulated flight conditions from sea-level static to Mach 2.0 at 75,000 ft and Mach 2.6 at 65,000 ft. Real time measurements of CO, C02, CxHy, NO, and NOx were taken over a range of afterburning and nonafterburning engine power settings using a gas sampling system designed to adhere to SAE ARP 1256 specifications. In addition, NO and OH were measured in situ by a narrow-line UV spectral absorption technique. Batch-type measurements of particulates and other trace constituents of the exhaust gas were also made. Major results of the test were that emissions vary significantly with combustor inlet pressure and temperature and, therefore, with Mach number and altitude. Specifically, NOx increased with the square root of the combustor inlet pressure and the 2.5 power of the combustor inlet temperature. Differences between the gas sampling and spectroscopic data on NO indicate the need for verification of sampling techniques.
m

AEDC-TR-73-132
CONTENTS
Page
ABSTRACT iii NOMENCLATURE vi
I. INTRODUCTION 1 II. APPARATUS 2
III. PROCEDURE 6 IV. RESULTS AND DISCUSSION 8 V. SUMMARY OF RESULTS 15
REFERENCES 16
APPENDIXES
I. ILLUSTRATIONS
Figure
1. Environmental Interactions of Turbojet Emissions 21 2. Test Conditions 22 3. J93 Engine 23 4. J93 Installation 29 5. Emission Measurement System 30 6. Sample Probe 31 7. Sample Rake and Traversing System 32 8. Exhaust Gas Analyzer 33 9. Exhaust Jet Profile at Mach 2.0, 65,000 ft, and Military Power 34
10. Exhaust Jet Profiles at Mach 2.0, 65,000 ft, and Afterburning Power 37
11. J93 Exhaust Emissions 40 12. Main Combustor Conditions , 44 13. Afterburner Combustion Conditions 45 14. Effect of Power Setting on J93 Exhaust Emission 46 15. Effect of Combustion Zone Inlet Pressure on J93 Exhaust Emission 48 16. Effect of Combustion Zone Inlet Temperature on J93 Exhaust
Emission 50 17. Empirical Prediction of NOx Production by High-Pressure Ratio
Turbojets 52 18. NO and NOx Exhaust Profiles in Afterburning 53 19. Spectroscopic OH Data 54 20. Comparison of Measured OH with Theoretical Equilibrium 55 21. Spectroscopic NO Data 56 22. Comparison of Spectroscopic NO with Emission Measurement
System Values 57 23. J93 Exhaust Particulates Size Distribution 58

AEDC-TR-73-132
Page
II. TABLES
I. Test Summary 59 II. Emission Measurements 60
III. J93 Exhaust Emission Data 61 IV. Gravimetric Particulate Data 62 V. AEDC Wet Chemistry Analysis of J93 Exhaust Gas 63
VI. BuMines J93 Exhaust Gas Analysis 64 VII. AEDC Analysis of Hydrocarbons in J93 Exhaust Gas 65
VIII. JP5 Fuel Specifications and Analysis 66 IX. JP5 Fuel Trace Metal Analysis 67 X. Emission Measurement System Verification Data 68
III. SPECTROSCOPIC DATA 69
NOMENCLATURE
A/B Afterburning
Ax Emission index conversion constant for specie X
f/a Fuel to air mass ratio
h Altitude, ft
M Mach number
P Pressure, psia
r Jet radius, in.
R Physical radius, in.
T Temperature, °R
Wx Emission index of specie X, lbm per lbm of fuel
w Mass flow, lbm/sec
(X) Concentration of specie X, ppm or percent
a Molecular ratio of hydrogen to carbon in fuel
VI

AEDC-TR-73-132
0 Equivalence ratio or ratio of engine overall f/a to stoichiometric f/a
0m Local equivalence ratio calculated from measured gas composition
SUBSCRIPTS
a Air
f Fuel
s Static
n Nozzle
t Total
3,5,7,9 Engine stations (see Fig. 3b)
Vll

AEDC-TR-73-132
SECTION I INTRODUCTION
1.1 BACKGROUND
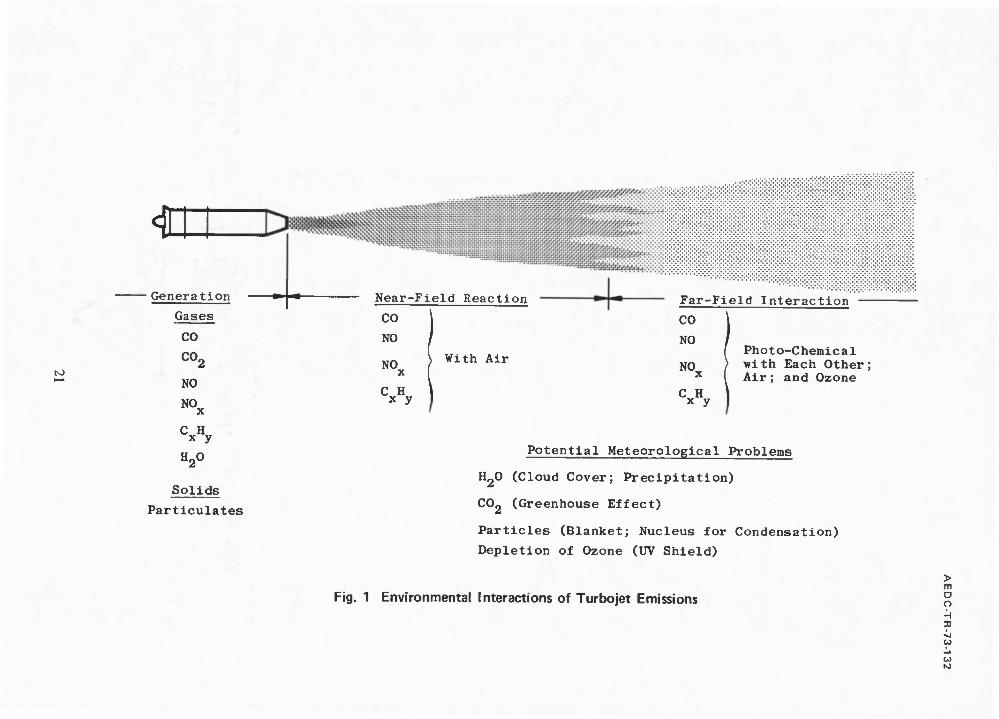
According to the December 1968 report from the Secretary of Health, Education, and Welfare to the Congress, "Nature and Control of Aircraft Engine Exhaust Emissions," pursuant to PL 90-148, The Air Quality Act of 1967, commercial jet aircraft contribute only about 1 percent of the greater than 200 million tons of pollution dumped into the atmosphere over the United States each year. However, atmospheric pollution by the exhaust gases of turbojet engines is a problem because of the localized nature of their emission. Most of the engine-on time of a turbojet-powered aircraft is spent either at the airport during takeoff, climbout, approach, landing, and taxiing and at high altitudes during cruise. Therefore, two problem areas can be defined for potential turbojet pollution of the atmosphere. The first, the airport problem, has been the subject of several studies and will not be discussed in this report. The second, the high-altitude problem, is potentially more severe because of possible long-term residual effects in the stratosphere. Turbojet emission into the atmosphere at altitudes up to approximately 35,000 ft have a short mean residence time because of the motion induced by vertical convection in this region. However, in the stratosphere, a region from approximately 35,000 to 165,000 ft generally characterized by a positive temperature gradient, vertical motion is greatly reduced and no strong mechanism for removal of any emission in this region exists. As a result, there has been much speculation about the potential meteorological problems associated with aircraft operation in the stratosphere (Fig. 1, Appendix I). The need for evaluating this problem has been emphasized by the introduction of supersonic transports (SST's), which will operate almost exclusively in the stratosphere.
The Department of Transportation is aware of this problem and the need for its evaluation and, in 1971, instigated the Climatic Impact Assessment Program (CIAP). The objective of this program is to assess, by 1974, the impact of the environmental and meteorological changes due to the world wide high-altitude aircraft fleet as projected to 1990 (Ref. 1). The world aircraft fleet includes not only future SST's but also the subsonic jets that presently cruise in the low stratosphere and any other vehicle that would emit potential pollutants into the stratosphere.
The CIAP program is divided into the elements listed below:
1. Nature of stratosphere
2. Nature of propulsion effluents
3. Perturbed stratosphere
4. Perturbed troposphere
5. Physio-bio-botanical effects

AEDC-TR-73-132
6. Economic measures
7. Reporting
In 1971, the Department of Transportation contracted, under an interagency funding agreement, with the Arnold Engineering Development Center (AEDC), Air Force Systems Command, to contribute, with two separate studies, to the second element of the CIAP program. The first study was the simulated altitude testing of a J93 turbojet engine to evaluate the generation of effluents during stratospheric flight and is the subject of this report. The second study was the testing of a J8S turbojet engine in the AEDC's Propulsion Wind Tunnel to evaluate both the generation and the near-field reactions of engine effluents during supersonic stratospheric flight and will be the subject of a subsequent report.
1.2 SCOPE OF INVESTIGATION
The J93 test program was conducted during June and July 1972 in Propulsion Engine Development Test Cell (J-2) of the AEDC to determine the nature of effluents in the exhaust of an SST-type turbojet engine over a wide range of typical SST operating conditions from takeoff to high-altitude supersonic cruise. The engine was tested in a direct-connect installation, which allowed simulation of engine inlet pressures and temperatures and free-stream static pressures that are encountered in actual flight. Simulated flight conditions at which emission data were obtained varied from sea-level static to Mach 2.0 at 75,000 ft and Mach 2.6 at 65,000 ft and included both afterburning and nonafterburning engine power settings (Fig. 2). Emission measurements were taken at the nozzle exit using a gas sampling system designed to adhere to the Society of Automotive Engineer's Aerospace Recommended Practice 1256 (Ref. 2). Real-time measurements of CO, CO2, CxHy, NO, and NOx were made. In addition, NO and OH were measured in situ by a narrow-line UV spectral absorption technique. Batch-type measurements of particulates and other trace constituents of the exhaust gas were also made.
During the test program, some 169 data points were obtained at 8 flight conditions and are presented herein. To obtain these data, the engine was operated for a total of 65 hr including 12 hr in afterburning (Table I, Appendix II).
SECTION II APPARATUS
2.1 J93 ENGINE
The General Electric YJ93-GE-3 engine (Refs. 3 and 4) was designed to power the XB-70, a Mach 3 bomber of the early 1960's. Although it does not represent current technology in all respects (primarily maximum cycle temperature), it was an available engine which would operate over the wide range of altitude and Mach number for which data were desired and is quite similar, except for size, to the General Electric GE4/JP5 engine

AEDC-TR-73-132
that was under development for the U.S. SST. It is representative of much of the engine technology that is flying today.
The engine (Fig. 3) is a single-spool turbojet engine with afterburner, having a maximum sea-level static thrust rating of 28,000 lb, maximum flight speed of Mach 3.2, and maximum altitude capability of 95,000 ft. The engine consists of the following major components: an 11-stage compressor section, a combustion section, a 2-stage turbine section, a high-augmentation afterburner section, a variable-area-ejector nozzle, and a control and accessory pod.
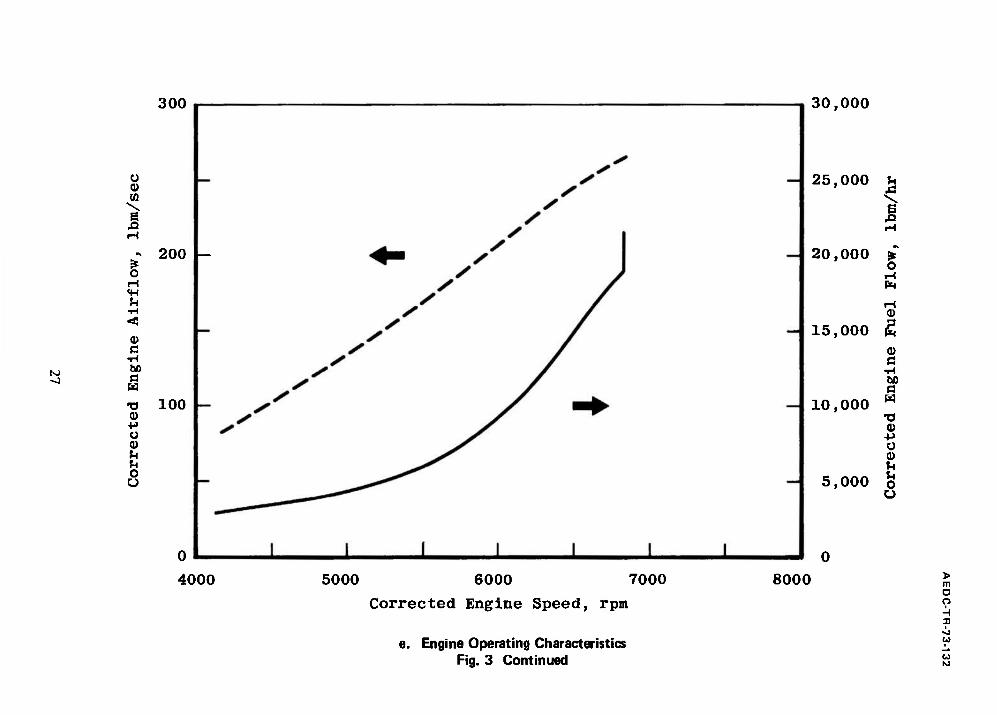
The engine compressor is an 11-stage unit having an 8.75:1 design pressure ratio at sea-level static. Engine airflow is 261 lb/sec at a 100-percent speed of 6825 rpm. The main combustor is a fully annular type, with 32 fuel nozzles and a dual energy ignition system; one for normal ground starts and the other for air starts. The turbine is a 2-stage, air-cooled unit with a conical drive shaft, supported both front and rear by bearings. The exhaust section consists of an afterburner and a guided expansion converging-diverging exhaust nozzle of fully variable area. The primary nozzle operates independently from the secondary nozzle. The fully throttlable afterburner (Fig. 3d) incorporates 32 radially oriented fuel nozzles and a circumferential flameholder containing 3 V-gutter rings and 6 catalytic igniters. Each of the fuel nozzles is supplied by two separate fuel supply systems. The local system is actuated first and is designed to promote smooth afterburner ignition; the fill system is actuated after the local system and is designed to provide as uniform afterburner fuel distribution as possible. The use of two systems also allows better control of fuel nozzle pressure for spray atomization than that possible with a single system.
Secondary airflow is directed aft between the engine shell and the air vehicle shroud (Fig. 3b), providing a layer of cooling air around the engine. The primary function of this air is to cool the engine compartment and the jet nozzle components. Flow equivalent to 7 percent of the engine primary airflow is required at maximum afterburner operation. At certain nonstandard operating conditions, the secondary airflow may exceed the 7 percent required for cooling. To provide aircraft inlet duct matching, the flow may reach as high as 20 percent of the primary flow.
The engine control system is hydro-mechanical, with an electrical temperature override. Engine controls and accessories are enclosed in an insulated pod below the compressor for environmental, assembly, and maintenance purposes.
2.2 TEST CELL
The test program was conducted in Propulsion Development Test Cell (J-2) of the AEDC's Engine Test Facility. The cell is 20 ft in diameter and 55 ft long. In it, propulsion devices may be tested over a wide range of simulated flight altitudes and velocities. The J93 was installed in the cell in a direct-connect type of installation (Fig. 4). This type of installation allows precise control of both the engine inlet total pressure and temperature associated with the flight altitude, Mach number, and inlet recovery and

AEOC-TR-73-132
the free-stream static pressure associated with the flight altitude being simulated. In this manner, the internal combustion and aerodynamic performance of the engine during flight, and therefore the exhaust gas composition at the nozzle exit, are reproduced in the test cell.
2.3 MEASUREMENTS
Instrumentation was provided to measure both the composition of the J93 exhaust gas and pertinent parameters controlling both the operation and the operational environments of the J93 engine. Gas composition measurements for engine emissions included both real-time sampling using process gas type instruments and in-situ absorption spectroscopy. Batch-type samples of engine exhaust gas and fuel were also taken for subsequent laboratory analysis.
2.3.1 Emission Measurements
The Society of Automotive .Engineers E-31 Committee has established guidelines for the design of sample systems and testing approaches to the acquisition of emissions data on turbojet engines. These are contained in Aerospace Recommended Practice (ARP) 1256 (Ref. 2). Although this standard does not address some of the problems associated with the acquisition of data behind an afterburning engine, or from an engine in an altitude test cell, it was used for guidance in the design of the AEDC emission measurements system (Fig. 5).
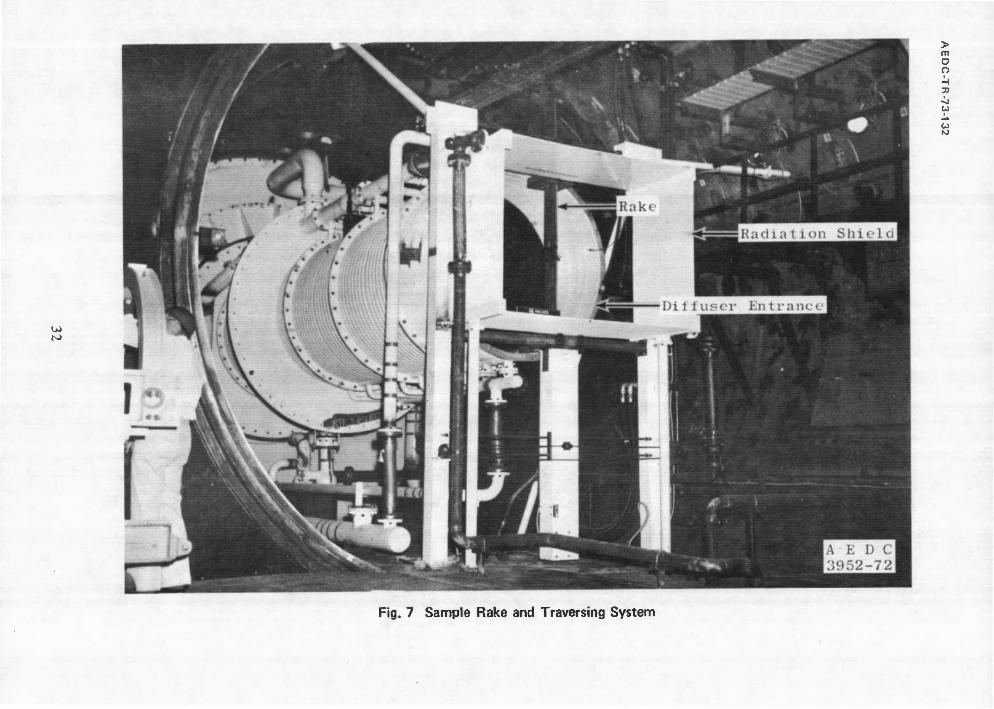
Continuous flow samples of the exhaust were taken in a plane approximately 4 in. downstream of the nozzle exit using a single, movable probe. The sample probe was also used for pitot pressure measurements by closing the system sample valve (Fig. 5). A shielded iridium/iridium-rhodium thermocouple was used to determine exhaust gas temperature. The probe and thermocouple were mounted on a single vertical rake (Fig. 6). Remotely controlled rake actuators (Fig. 7) provided the capability to place the sample probe or the thermocouple mounted 2 in. above it at any point in the sample plane.
The gas was transported from the probe to an exhaust gas analyzer located outside the test cell approximately 60 ft from the probe tip. The gas was cooled to 300°F from total temperatures as high as 3100°F and maintained at that temperature in the gas transport line to prevent CxHy and H2O condensation by a hot water thermal conditioning system. This system counterflowed in adjacent or coaxial lines the entire length of the sample transport line from the gas analyzer to the sample probe tip. Additional heating to overcome heat loss in certain areas was provided by electric heater tape. Transport time of the gas to the exhaust analyzer was 2.1 sec. All surfaces in the gas transport line that could contact the sample gas prior to analysis were made of either Teflon® or stainless steel (primarily type 316).
The pressure of the exhaust flow at the sample probe tip varied from 3.5 to 37 psia. As the gas had to be delivered to the gas analyzer at IS psia for proper operation

AEDC-TR-73-132
of the sensing instruments, four metal bellows pumps were arranged just upstream of the analyzer so that they could be operated in a variety of series and/or parallel configurations to boost the sample gas pressure as needed; control valves were installed to dump excess gas when the pressure was too high. With one exception, the portion of the sample gas to be analyzed for particulates bypasses these pumps to prevent possible particle trapping or agglomeration. The exception was the piezoelectric particulate density sensor which, like the gas sensing instruments, required essentially atmospheric pressure for proper operation.
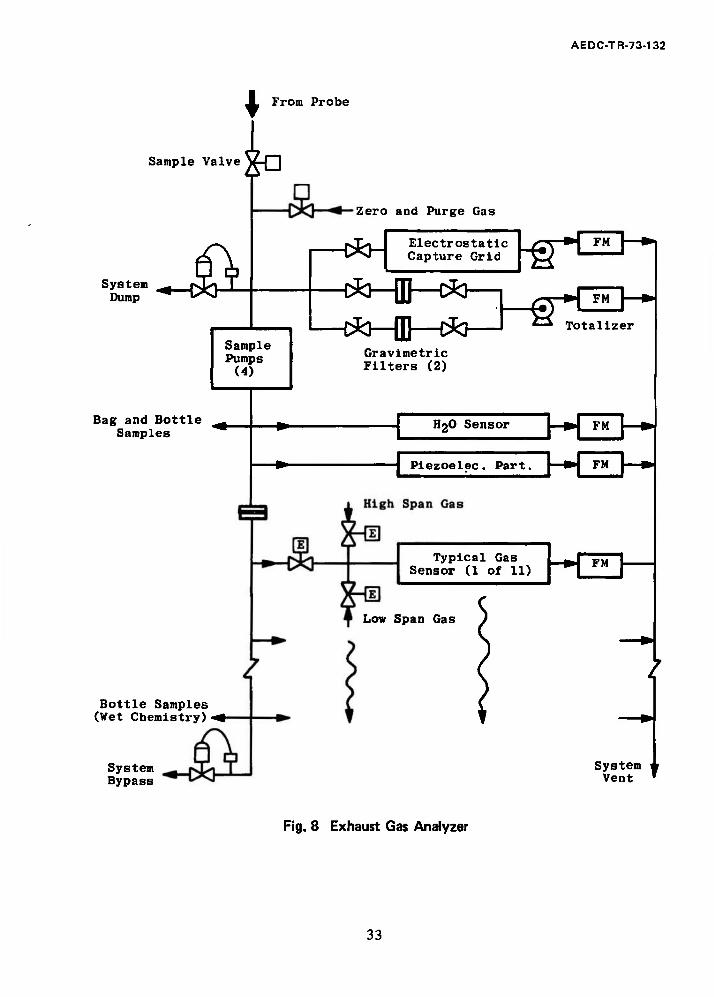
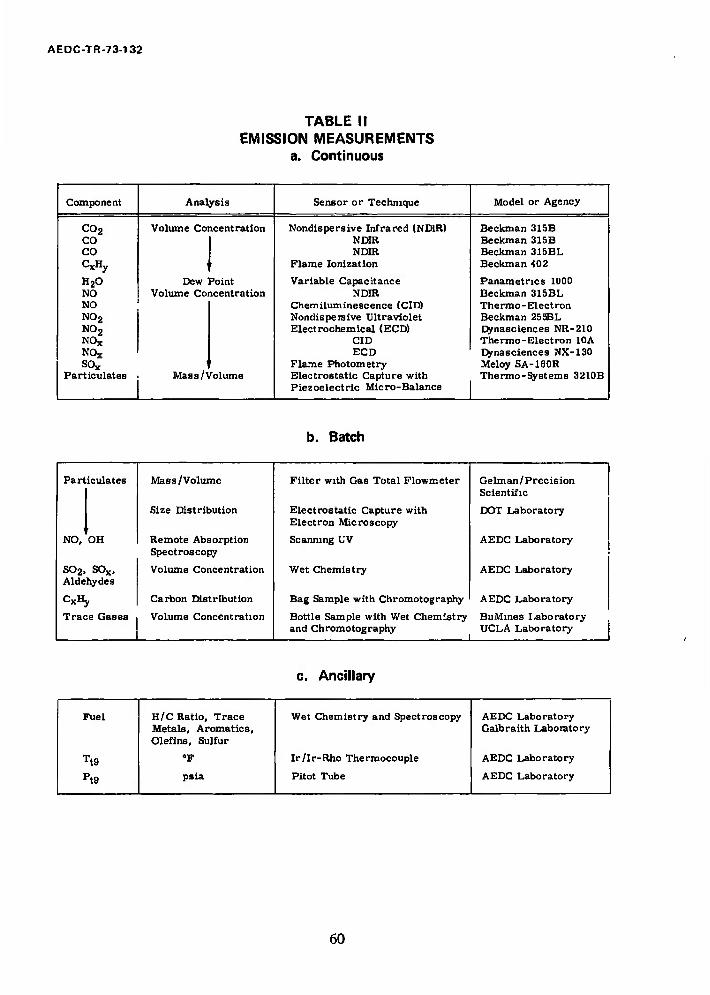
The exhaust gas analyzer (Fig. 8) was designed to permit continuous sampling of 8 gases plus particulate density. This sampling required 13 different instruments (Table II). The analyzer had additional provisions both for taking bag and bottle samples of the gas and capturing exhaust gas particulates (Table lib). One particulate capture method was the electrostatic capture of particulates on electron microscope grids using a device furnished by the DOT Transportation Systems Center (TSC). The other particulate capture method used standard, pre-weighed, gravimetric capture filters in conjunction with a positive displacement wet test meter to determine particulate density of the exhaust gas.
The analyzer's instruments were calibrated inplace using certified calibration gases. A zero gas (dry nitrogen with zero concentrations of emission gases) and a minimum of two different span gases were used in the calibrations. Temperature conditioning was provided within the analyzer to prevent sample gas condensation; standard pressure and temperature instrumentation were used to ensure proper operation of both the analyzer and the rest of the emission measurement system. Ancillary measurements (Table He) of both exhaust gas state conditions and fuel properties were also made to afford a complete analysis of the exhaust gas composition. A more complete description of the emission measurement system and the performance of the system and its components is found in Ref. 5.
2.3.2 Spectroscopy
A new and promising technique for in-situ measurement of exhaust gas composition was used to measure both NO and OH in the J-93 exhaust. This technique consists of passing a light beam through the exhaust and measuring the optical absorptivity of the gas at specific optical wavelengths. The technique is very attractive because it avoids the flow disturbances of a sample rake and line. Additionally, it permits, by the proper optical wavelength selections, the measurement of a wide variety of exhaust gas constituents. Details of the operation and performance of this technique are presented in Appendix III.
2.3.3 Engine
Standard measurement techniques were used to determine engine and test cell pressures, temperatures, flows, speed, and vibrations to permit correlation with emission measurements and to allow safe and efficient conduct of the test program.

AEOC-TR-73-132
SECTION III PROCEDURE
3.1 TEST
The instruments were calibrated in place by the use of standard zero and span gases before and after each test, and, additionally, every 2 to 3 hr during tests which were of four hours duration or longer. After calibration, the engine was started, and test conditions were set. The rake was moved into position, the gas pumps and pressure control valves were adjusted to establish the proper flow through the instruments, and the test cell, engine, and gas sensor instrumentation output levels were recorded by a digital data acquisition system. An analog display from each gas analysis instrument was monitored to ensure that the output levels were stabilized prior to recording the data point. After the data points were acquired, the probe was then moved to a new location in the stream, and the acquisition procedure was repeated. At each point, engine and test cell data were also recorded. Data were also acquired through a probe at the front of the engine during each test to ensure that no significant particulate, gaseous, or liquid contaminants were present in the air entering the engine.
ARP 1256 requires at least 12 samples be taken in the plane being surveyed. In the initial plans for the program, it was decided that 13 measurements would be made, one on the centerline and three on the centroid of equal areas in each of the four quadrants. After several tests it was determined that, within the objectives of this program, more useful data would be obtained with fewer points in a shorter time by obtaining more than three points along a single radius to better define the profiles.
At some times, it was desired to obtain data where something other than flight conditions was the variable. To permit rapid acquisition of data from such a parametric investigation, a single measurement was made by leaving the probe at a fixed point and varying the parameter under investigation.
Electrostatic particulate grids were obtained at each probe location. Single gravimetric filters, bag CxHy samples, and wet chemistry samples were obtained at each test condition because of the gas volume required for sufficient analysis resolution. At selected test conditions, sample bottles were filled with exhaust gas for subsequent analysis at the Bureau of Mines (BuMine) and the University of California at Los Angeles (UCLA). After test, the grids were shipped to the DOT Transportation System Center (TSC) for analysis using both scanning and transmission electron microscopes. The gravimetric, bag, and wet chemistry samples were analyzed at the AEDC chemical laboratory. Fuel samples were taken prior to each test and analyzed by the AEDC laboratory except for hydrogen/carbon ratio. This last analysis was accomplished by the Galbraith Laboratory in Knoxville, Tennessee.
Engine inlet pressure and temperature settings during the test program were determined from the geopotential altitude values from the U.S. 1962 Standard Atmosphere

AEDC-TR-73-132
and standard aerodynamic relationships. Engine inlet pressure at supersonic flight conditions was reduced to account for inlet recovery based on MIL-E5008C. JP-5 fuel which is quite similar to Jet A-l was used throughout the test program.
After completion of the test program, a verification of the emission measurement system was made using a commercial calibration gas cross-reference service.
3.2 DATA REDUCTION
All digital data from test cell, engine, and gas sensor instrumentation recorded during a test were reduced to engineering units by a digital computer. All emission indices and the fuel/air ratio calculated from the gas composition were determined by the methods detailed in ARP 1256 (Ref. 2). These methods are based on a carbon mass balance of a CxH2X-air reaction and use the following general equations:
W AX(X)
—- + CO, + — io4 l 10'1
and
c° co. C"">' '2
f.'a 104 ' 104
W" 207- 2l^-.\— C02
where
Wy = Mass emission rate of X, lbm'1000 lbm of fuel
Ay = Constant, function of molecular weight of X
(X) = Concentration of X, ppm
CO, C02. CJ1 = Concentrations in ppm, percent, and ppm, respectively,
f/a = Fuel to air mass ratio
All exhaust components with the exception of NO were measured on a wet basis. The sample stream for NO measurement was dried prior to analysis by a column of indicating calcium sulfate. The NO measurement was converted to a wet basis by accounting for the absorbed water by the method detailed in ARP 1256.
All other calculated parameters were determined in accordance with accepted aero-thermodynamic and turbojet cycle calculation procedures. Engine net thrust and other predicted parameters were determined from J93 cycle performance tables (Ref. 6) provided by the General Electric Company. Batch analyses were conducted using accepted standard laboratory techniques.

AEDC-TR-73-132
SECTION IV RESULTS AND DISCUSSION
Exhaust emission data were obtained at the nozzle exit of a J93 turbojet engine at 8 simulated flight conditions from takeoff to high altitude supersonic cruise (Fig. 2). Parametric variables investigated include flight Mach number, flight altitude, and engine power setting. Although thirteen continuous gas sensing instruments (Table II) were used to analyze the engine exhaust gas, some of these instruments provided unusable or only marginally usable data (Ref. 5). As a result, only the continuous sampling data from the instruments shown below for each gaseous constituent will be presented in this report.
CO - Beckman 315B
C02 - Beckman 315B
CH, - Beckman 402 x y
NO - Thermo-Electron 10A
NOx - Thermo-Electron 10A
The piezoelectric participate instrument provided no usable continuous data during the test. No significant concentration of any gaseous or particulate emission constituent was found in the engine inlet air during the test program.
4.1 EXHAUST JET PROFILE
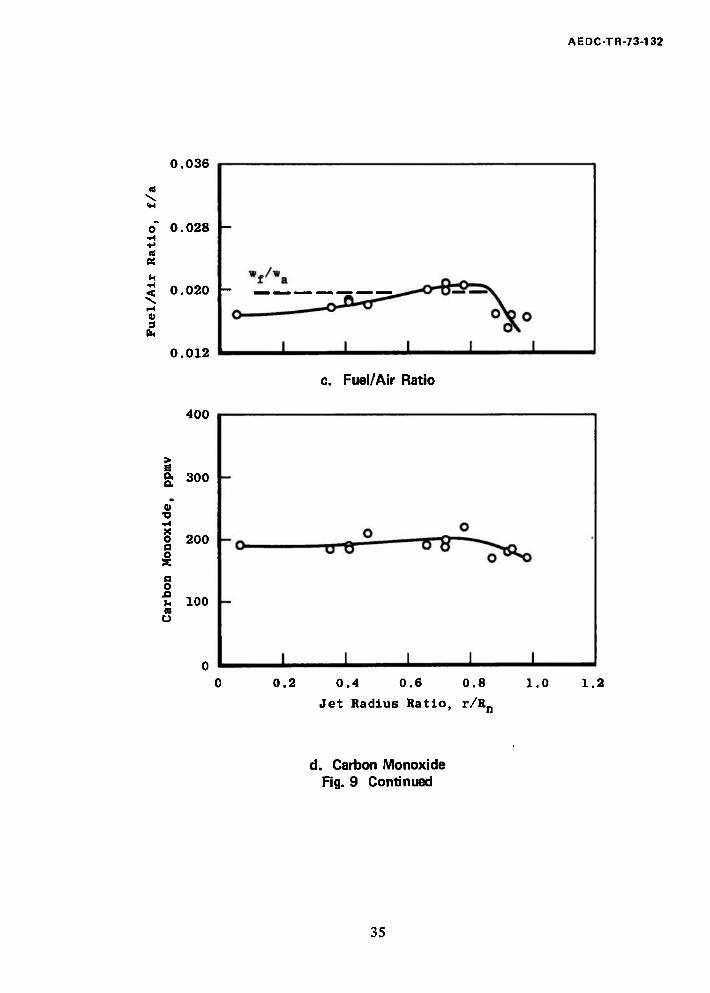
An examination of the exhaust gas pressure and total temperature profiles (Fig. 9) at 'military or maximum nonafterbuming power indicates that gas flow and gas state properties are fairly uniform across the nozzle exit until, at a radius ratio of approximately 0.8, mixing of primary nozzle flow with peripheral secondary air begins. This conclusion is substantiated by the fuel/air ratio, CO, CxHy, and NOx profiles. Both the fuel/air ratio and NOx profiles show the slightly increasing radial influence of exhaust gas temperature; the CO and CxHy data are flatter indicating little or no localized influence of gas temperature. Agreement of measured gas temperatures at the turbine discharge and at the nozzle exit is good. Agreement of measured and calculated fuel/air ratio is also good.
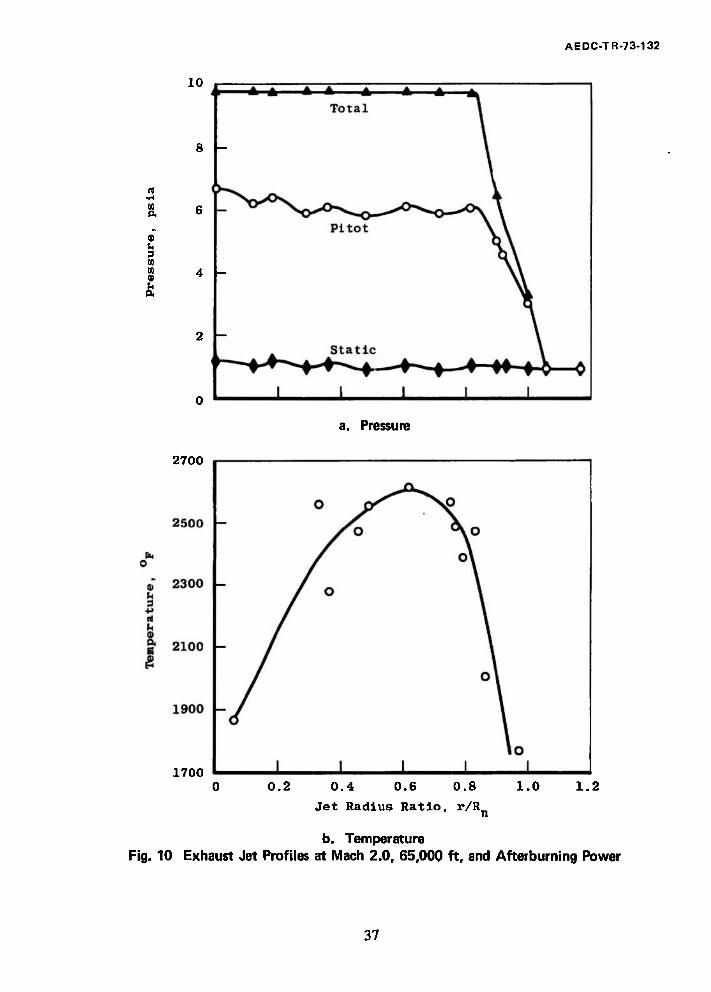
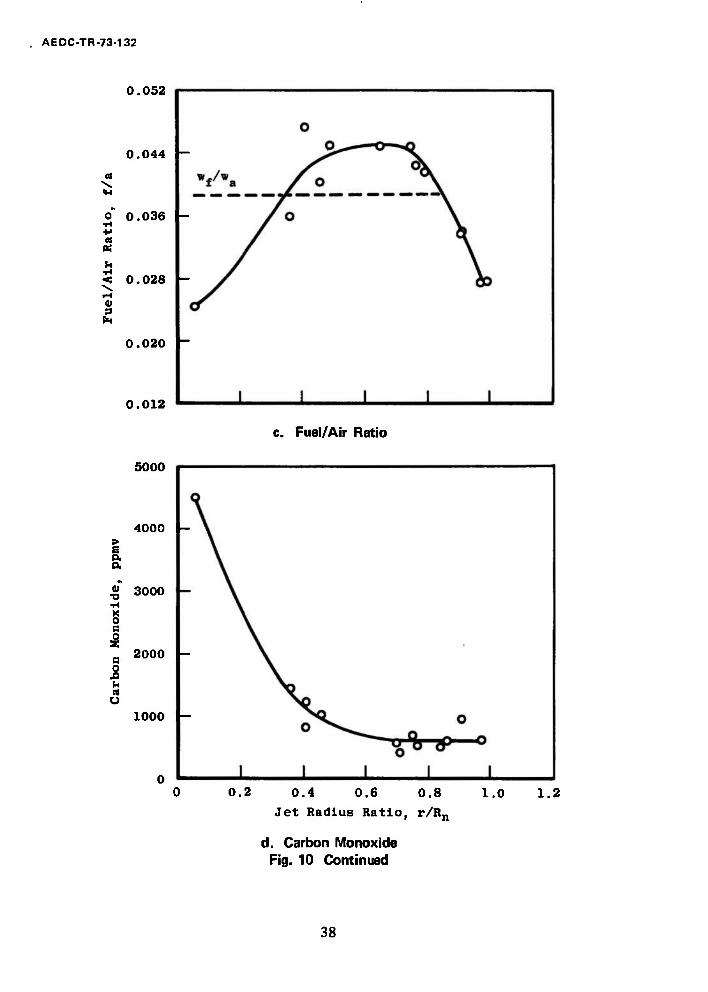
Exhaust gas profiles in afterburning (Fig. 10) are not as uniform because of the zone burning characteristic of the J93 afterburner and the lack of combustion time and mixing length between the afterburner flame holders and the nozzle exit. The pressure profile in afterburning, as expected, remains essentially flat, whereas the gas temperature has a strong radially increasing profile prior to mixing with the secondary air. Temperature at the centerline of the nozzle exit flow is only approximately 300°F higher than turbine exit temperature indicating a zone of poor fuel distribution and/or poor combustion about the centerline. This conclusion is substantiated by the fuel/air ratio, CO, and CxHy data with the fuel/air ratio being low and the CO and CxHy levels being very high near the centerline. The NOx profile shows the same dependence on exhaust gas temperature present
:in the military power profiles and, as a result, is low near the centerline.

AEDC-TR-73-132
An understanding of this strong radial profile in afterburning is related to the geometry of the afterburner fuel distribution. The turbine discharge flow of the J93, like most turbojets, is strongly annular in nature. To ensure adequate local fuel/air ratios in the afterburner combustion zone for proper ignition and continued burning, the fuel distribution is, as shown in Fig. 3d, also strongly annular. This arrangement results in a centerline zone behind the turbine cone in which local fuel/air ratios are dependent primarily on the limited radially inward mixing in the flow aft of the flameholder.
The strong radial exhaust gas profiles present in afterburning create a problem in comparative parametric analysis of the emission data. The military data are uniform enough to obtain, with use of the exhaust gas pressure and temperature data, an average emission index mass-weighted over the nozzle exit. However, in afterburning, a combination of the strong radial profile and a limited number of samples makes determining a meaningful mass-weighted average most difficult. Also, the suggestion of a significant circumferential profile near the center indicated in the data from four quadrants near a radius ratio of 0.4, together with the strong possibility that combustion near the centerline is not complete at the nozzle exit, further complicates this problem. Therefore, for the purpose of this report, data for the parametric comparisons that follow were taken from actual profile data points where the nearest calculated-to-measured fuel/air ratio match was obtained. This selection criterion generally meant that the data at radius ratios of 0.4 to 0.7 were chosen for the comparisons.
The data presented in Figs. 9 and 10 were from only one flight condition; however, these data are typical of the profiles from the remaining seven flight conditions.
4.2 CONTINUOUS EMISSION DATA
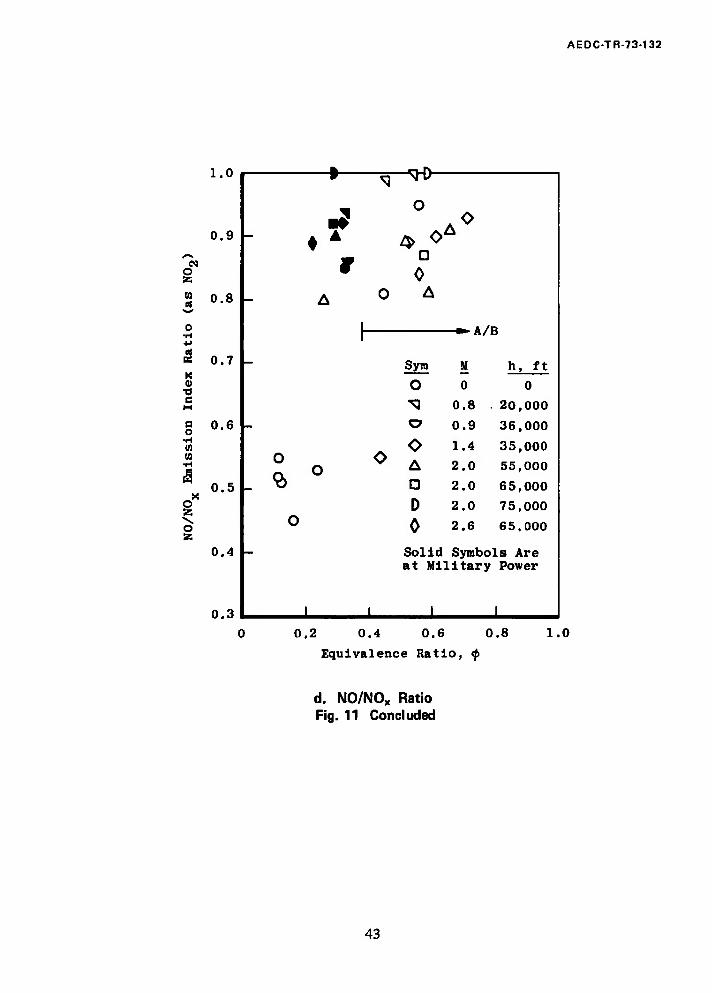
The emission data selected for parametric comparison by the method outlined above were converted to emission indices and equivalence ratios (0) and tabulated (Table III). Data were obtained at Mach numbers from 0 to 2.6, at altitudes from 0 to 75,000 ft, and at power settings from idle (0 = 0.12) to military (0 = 0.22 to 0.33) and to afterburning (0 = 0.4 to 0.7). A comparison of these data (Fig. 11) shows that the concentrations of CO, CxHy, and NOx all vary significantly with all three external variables. For example, CO and CxHy at military power vary about an order of magnitude, and NOx varies about 300 percent over the range of flight conditions investigated. Similar variances are present in the afterburning data. NO/NOx ratios vary approximately 20 percent except for the lower ratios present at sub-military power and near-minimum afterburning power settings. Average NO/NOx index ratio excluding these low values was approximately 0.9.
Other agencies have obtained data having similar or worse scatter (Ref. 7) and have concluded that there was no effect of either simulated flight altitude or Mach number on engine emissions. However, an understanding of the seemingly wide scatter of emission data is linked to the internal parameters that control the combustion processes inside a turbojet engine. Some of these parameters are combustion zone pressure, combustion zone inlet temperature, and overall equivalence ratio. Combustion pressure and temperature

AEDC-TR-73-132
are controlled both by flight conditions and engine power setting; combustion zone equivalence ratio is controlled by the engine power setting and, to a lesser extent, by flight velocity.
An afterburning turbojet such as the J93 has two combustion zones: the main combustor and the afterburner. Conditions at the inlet to the main combustor of the J93 varied from 670 to 1470°R and from 19 to 120 psia (Fig. 12); overall equivalence ratio in the main combustor varied from 0.12 to 0.33. Conditions at the inlet to the afterburner varied from 1920 to 2000°R and from 11 to 43 psia (Fig. 13); overall afterburner equivalence ratio varied from 0.45 to 0.71. It should be noted that, at military power (Fig. 12), emission data were obtained over a range of combustion zone pressures at constant inlet temperatures of approximately 1050 and 1220°R. Also, emission data were obtained at an essentially constant combustion zone pressure of 55 psia over a range of inlet temperature from 950 to 1460°R. These constant temperature and pressure lines made the analyses in Sections 4.2.2 and 4.2.3 of this report possible.
4.2.1 Effect of Engine Power Setting
Data obtained over a range of engine power settings at three flight conditions yielded consistently similar trends in emission indices versus engine power setting (Fig. 14). In nonafterburning, increasing power from idle (0 = 0.12) to cruise (0 = 0.23) and to military (# = 0.3) decreased both the CO and CxHy emission indices and increased the NOx index. Going from military to minimum afterburning increased CO and CxHy and decreased NOx. Increasing afterburning power decreased the CO and CxHy while the NOx remained essentially constant. The increase in CO and CxHy going into afterburning can be explained -by the fact that afterburning efficiencies, particularly at minimum afterburning, are lower than main combustor efficiencies. The subsequent decrease in these two indices is probably associated with both afterburning efficiency and the afterburning profile problem; as more fuel is used in afterburning, the local manifold is pressurized higher and flow is initiated to the fill manifold. As a result, exhaust gas profiles are more uniform, and overall afterburning efficiency is higher.
The decrease in NOx going from military to afterburning can be explained by combustion zone dwell times. NOx production is related to both the peak temperature in the combustion zone and the time gas flow spends at this peak temperature. The primary combustion zone of the main combustor (Fig. 3c) is a zone near the head of the combustor where both fuel flow and airflow are regulated to provide a near stoichiometric combustion at a relatively low velocity. The high temperature products of this combustion are cooled and diluted subsequently by controlled air bleeds in the side of the combustor. The overall flow arrangement of the main combustor provides a controlled high-efficiency burning to obtain the highest heat release possible without compromising thermal limits of engine components. This arrangement results in a low concentration of unreacted combustion products; however, because of the primary zone dwell time necessary for high burning efficiency, a significant amount of nitrogen is disassociated and reacts with available free oxygen to form nitrogen oxides. In the afterburner the combustion is much less controlled
10

AEDC-TR-73-132
and occurs at a somewhat higher velocity than in the main combustor. The fuel is injected into engine total airflow, and as a result, the afterburner combustion zone fuel/air ratio is generally lower than stoichiometric. Also, dilution of the combustion products is not controlled and occurs almost instantaneously. Thus, both the peak temperature and the time at peak temperature are lower in the afterburner than in the primary combustor. Therefore, the primary effect of the afterburner combustion, although it does produce some NOx, is to dilute the NOx produced by the main combustor.
The NO/NOx ratio (Fig. 14b) generally increases from idle to cruise to military, decreases going into afterburning, and again increases as afterburning power is increased. This trend is essentially the opposite of the trend of the CO and CxHy indices with engine power setting; this apparent inverse correlation between either CO and CxHy and NO/NOx
ratio is present in other data that will be discussed later.
The data in Fig. 14 are plotted versus equivalence ratio. Although this parameter is controlled directly by engine power setting, it should be realized that increasing power from idle to military increases both main combustor pressure and temperature. The data trends of Fig. 14 include the effect of these variables and not just the effect of equivalence ratio. Conversely, in afterburning, both the main combustor and the afterburner inlet conditions are essentially constant; the primary effects on data trends are those of equivalence ratio and overall afterburner efficiency as discussed above.
4.2.2 Effect of Combustion Zone Inlet Pressure
Military power data (Fig. 15) taken at essentially constant combustor inlet temperatures indicate that the CxHy emission indices decrease with increasing combustion zone pressure while the NOx indices increase. The CO indices increase with pressure at pressures below approximately 60 psia; no trend with pressure was found above approximately 80 psia.
Detailed evaluation of the NOx data indicates that the NOx index increases approximately with the square root of the combustion zone pressure. Also a consistent trend of decreasing NO/NOx index ratio with pressure was indicated by the data (Fig. 15b).
4.2.3 Effect of Combustion Zone Inlet Temperature
Military power data (Fig. 16) taken at essentially constant combustor inlet pressure indicate that the CO emission indices decrease with increasing combustion zone inlet temperature. Conversely, the NOx indices increase with increasing temperature. No significant trend of CxHy or NO/NOx ratio with temperature was found.
Detailed evaluation of the NOx data indicates that the NOx index increases approximately with the 2.5 power of the combustor inlet temperature.
11

AEDC-TR-73-132
4.2.4 Trend Evaluation
The trends of decreasing CO and CxHy emission indices with increasing combustion zone pressure and temperature are consistent with combustion efficiency trends predicted by currently accepted combustor technology. The increase and subsequent decrease of these indices in afterburning can be explained as previously discussed by overall afterburner efficiency.
The increase in NOx with combustion zone inlet temperature is caused by the associated increase in peak flame temperatures that permit additional dissociation of nitrogen in the combustion flow. No definite cause of the increase of NOx with combustion zone pressure is known.
An empirical relationship for the J93 NOx data at military power was developed and is shown below:
WN0X = ! x 10-8(PS3)°-5(T13>2-5
Maximum deviation of the calculated values of the NOx from measured values for the military power settings and two cruise settings at the eight flight conditions investigated was approximately 20 percent; average deviation was 10 percent. An attempt to use this relationship for idle power settings gave worse agreement, indicating that another variable, possibly dwell time at peak flame temperatures, should be included in the relationship. However, isolation of this variable was not possible.
A comparison of published NOx emission data (Ref. 8) for higher pressure ratio engines with values predicted by the J93 empirical relationship gave fair agreement in both level and trend (Fig. 17). A deviation of 33 percent of the predicted value from the measured value at military power suggests again the presence of another variable. However, the probable variable, dwell time, is controlled directly by combustor geometry and it would be coincidental if engines of different sizes and cycles such as those involved in this comparison had the same dwell time.
■ No explanation for the decrease of NO/NOx emission indices ratio with increasing combustion zone pressure is known. However, the increase of the NO/NOx ratio with engine power setting discussed in Section 4.2.1 is probably caused by oxidation of the NO to NO2 or other nitrogen oxide compounds by either CO orCxHy. This hypothesis is supported by the afterburning profile data (Fig. 18). Near the periphery of the primary exhaust flow (r/R„ = 0.7) where exhaust gas temperature and local fuel/air ratio is high (see Fig. 10), the NO/NOx ratio is high. At the same location, both CO and CxHy are low. As exhaust gas temperature and fuel/air ratio drop toward the center, both CO and CxHy rise and the NO index falls. On the centerline, CO and CxHy are quite high and the NO essentially disappears. Comparison of the NO, CO, and CxHy profiles suggest a stronger inverse NO/CxHy relationship, but this observation is not considered conclusive. The data in Fig. 18 are from only one test condition but are typical of all afterburning data obtained during the test program.
12

AEDC-TR-73-132
4.3 SPECTROSCOPIC DATA
Spectroscopic OH data were obtained at six flight conditions at both military and afterburning power settings. The OH values (Fig. 19) varied significantly with both flight conditions and engine power setting. However, comparison of the measured values with those predicted by equilibrium chemistry indicate that the variations can be explained by variations in state conditions of the engine exhaust gas (Fig. 20). The close agreement of the measured and calculated values also indicate that OH in the exhaust jet can be effectively calculated using equilibrium chemistry.
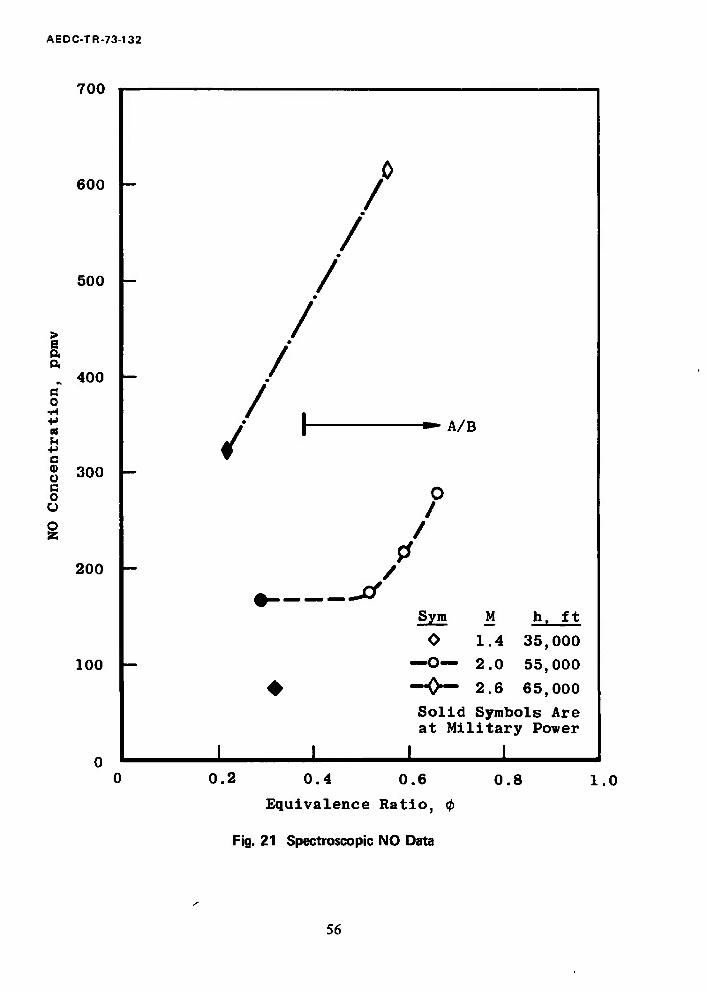
Spectroscopic NO data obtained at three flight conditions at both military and afterburning power settings (Fig. 21) also varied significantly with both flight condition and engine power setting in generally the same direction as the NO data from the emission measurement system. However, the spectroscopic NO data are significantly higher than the values obtained from the sampling system (Fig. 22). No explanation of this disagreement is known; the disagreement is greater than the estimated uncertainty, 28 percent (1 sigma), of the comparison. The measurement system accuracy (excluding transport line effects) is estimated to be 12 percent; the spectroscopic measurements are estimated to be accurate within 25 percent. If both the spectroscopic analysis and the sample system measurements are correct, there exists an inherent problem in the basic method of sampling by a probe and gas transport line to a sensing instrument. The possibility of continuing reactions in the transport line is raised, particularly in light of the NO/CxHy relationship suggested in the afterburning data. Certainly, the question raised is an important one, and one that needs early resolution.
Additional spectroscopic data and details of operation and performance of the spectroscopic technique used are given in Appendix III.
4.4 BATCH ANALYSIS DATA
Gravimetric filter data (Table IV) were obtained at all eight flight conditions investigated. No noticeable trend with flight condition was apparent in the data; however, the data scatter unavoidable in this type of analysis may have masked any trend. Also, the data at Mach 2 and 55,000 ft and above are not directly comparable with the lower altitude and higher Mach number data because of the large filter pore size necessitated by low engine exhaust pressures at these conditions. There is a suggestion of a trend for particulate density to increase from idle to cruise and to decrease from cruise to military engine power. Going into afterburning from military seems to increase particulate density; increasing afterburning power decreases particulate density. These possible trends are in general agreement with reported J85 smoke data (Ref. 9). Preliminary analysis of the particulate size data (Refs. 10 and 11) by TSC indicates that mean particle size is approximately 0.04 microns (Fig. 23). Agreement of the particle size data with previously reported TF30 data (Ref. 7) is not good. However, adjusting the J93 data to the resolution limit of the TF30 analysis' yields better agreement. The J93 analysis is preliminary and incomplete at the time of this report; a detailed analysis for all flight conditions will be reported by TSC when completed.
13

AEDC-TR-73-132
The AEDC wet chemistry analysis of jthe oxides of sulfur and total aldehydes is shown in Table V. The concentrations of aldehydes are generally low except at engine idle. The concentration of the oxides of sulfur is higher and increases as expected with equivalence ratio. The data unexpectedly indicate that the predominant constituent of these oxides is SO3. However, the analysis method used for SOx is also responsive to H2SO4, and an SO2/H2O reaction in the sample line may have occurred.
A preliminary analysis (Ref. 10) of the sample bottles of exhaust gas by the Bureau of Mines is shown in Table VI. Agreement of the gas concentrations with AEDC continuous and batch data is good with two exceptions. The BuMines NOx values are significantly lower than AEDC values. However, this disagreement is not unexpected because of the probability of reactions of the nitrogen compounds in the bottles prior to analysis; agreement of the summed total of the BuMines nitrogen compounds, including nitrites and nitrates, with AEDC's NOx values is quite good. The other exception is that the BuMines hydrocarbon levels at the Mach 2.6 conditions are two to three times higher than AEDC continuous values. Similar disagreement exists between AEDC's very limited batch samples (Table VII) and the voluminous continuous data obtained with the emission sample system. However, no confirmation of these disagreements is possible; the AEDC continuous data agreed well with the BuMines data at the Mach 2.0 conditions, and the continuous hydrocarbon analyzer performed well during posttest certifications (see Section 4.5).
The AEDC analysis of CxHy distribution in the exhaust gas (Table VII) showed a trend of increasing carbon number with overall engine equivalence ratio. This trend, from very limited data, was unexpected and is somewhat contradictory to trends reported by the BuMines on sea-level static tests of a TF33 engine (Ref. 12).
The JP5 fuel used for the test program was within the MIL-T-5624G specifications in all significant respects (Table VIII). Sulfur content of the fuel was 0.054 percent by weight. Hydrogen/carbon ratio was approximately 1.9 as opposed to the 2.0 value assumed by ARP 1256. Trace metal concentration in the fuel (Table IX) was quite low with the expected exception of iron.
A comparison was made of the SOx emission index at military power determined by wet chemistry analysis of the exhaust gas and by fuel analysis. The exhaust gas value of 0.6 lbm/1000 lbm of fuel is lower than the fuel analysis value of 1.1 suggesting that a significant portion of the total exhaust sulfur content may be as sulfate or sulfur particulates.
The UCLA analysis of the exhaust gas sample bottles is not available at this time and will be reported by that organization when completed.
4.5 EMISSION MEASUREMENT SYSTEM VERIFICATION AND ACCURACY
A commercial calibration gas cross-reference service was used to verify overall operation of the emission measurement system. This service provided gases having the
14
AEDC-TR-73-132
same concentrations of CO, CO2, NO, and CxHy to each of its users; the certified values of the concentrations are not given with the gases. The users measure the concentrations using their respective measurement systems and calibrations gases and report the results to the supplier who statistically summarizes and reports the combined results. The results of the AEDC participation in this service (Table X) show that acceptable agreement with both the supplier and the remaining users was obtained.
The data shown in Table X allows a good assessment on total system accuracy of emission measurement systems of which the AEDC system is typical. Combined system accuracies (1 sigma) for individual concentration measurements are estimated to be 10 percent for NO and NOx; CO, CO2, and CxHy concentrations accuracies are estimated to be S percent. Accuracies of the emission indices presented herein are estimated to be approximately 12 percent for the various oxides of nitrogen and 6 percent for the remaining gases. This evaluation does not include uncertainties introduced by interactions or reactions in the sample gas transport system, if any; such an evaluation is beyond the scope of this report.
4.6 MISCELLANEOUS
Water concentration in the exhaust gas was not measured because of unacceptable sensitivity shifts of the sensing instrument included in the emission measurement system. However, this concentration can be adequately determined on an overall basis using the equation
W 9008a H2° 12.01 + 1.008a
where a = the hydrogen/carbon ratio of the fuel. Values of the overall emission index from this equation are 1,284 and 1,234 lbm/1000 lbm of fuel based on the ARP 1256 value of 2.0 for a and the JP5 fuel average value of 1.9, respectively.
SECTION V SUMMARY OF RESULTS
Exhaust emission data were obtained at the nozzle exit of an afterburning J93 turbojet engine at eight simulated flight conditions from takeoff to high-altitude supersonic cruise. Parametric variables investigated include flight Mach number, flight altitude, and engine power setting. The major results of the test program are summarized as follows:
1. Exhaust emission indices vary significantly with flight condition and engine power settings. The primary influencing parameters are the pressure and temperature at the entrance to the engine combustion zones.
2. The NOx production of the J93 at maximum nonafterburning power varied directly with the 0.5 power of the combustor inlet pressure and the 2.5 power of the combustor inlet temperature. Extrapolation of this relationship to operating conditions of higher pressure ratio engines suggests the presence of another variable, perhaps combustor dwell time.
15

AEDC-TR-73-132
3. Successful in-situ spectroscopic measurements of both NO and OH concentrations in the exhaust gases were made. However, spectrographic values of NO were significantly higher than values from conventional, continuous flow, gas capture analysis. Resolution of this difference, although possibly associated with continuing reaction in the gas transport line used in the conventional analysis, is necessary before the spectrographic technique, a potentially valuable and versatile measurement tool, can be fully accepted.
REFERENCES
1. Department of Transportation. "Proceedings of the Climatic Impact Assessment Program Survey Conference." DOT-TSC-OST-72-13, September 1972.
2. Society of Automotive Engineers. "Procedures for the Continuous Sampling and Measurement of Gaseous Emissions from Aircraft Turbine Engines." ARP 1256, October 1971.
3. General Electric Company. "Operating and Service Instructions - J93." September 1971.
4. NASA Flight Research Center. "Technical Manual, Field Maintenance and Replacement, XJ93-GE-3." NASA-T.D. 2J-J93-GA, December 1967.
5. Grissom, J.L. "Instrumentation and Measurement for Determination of Emission from Jet Engines in Altitude Test Cells." AIAA Paper 72-108. Presented at the AIAA/SAE Eighth Joint Propulsion Specialist Conference, November-December 1972.
6. Allen, D. and Lewis, R. "YJ93-3 PFRT Cycle Review." General Electric Company Report R63FPD366, November 1963.
7. Plaeza, J.L. "Study of Altitude and Mach Number Effect on Exhaust Gas Emissions of an Afterburning Turbofan Engine." DOT Report No. FAA-RD-72-31, December 1971.
8. Lipfert, F.W. "Correlation of Gas Turbine Emissions Data." ASME Paper 72-GT-60, March 1972.
9. Gearhart, J.W. and Benek, J.A. "Measurments of Pollutant Emissions from an Afterburning Turbojet Engine at Ground Level, Part I. Particulate Emissions." AEDC-TR-72-64 (AD744048), June 1972.
1.6

AEDC-TR-73-132
10. Forney, Ken. "Engine Exhaust Emission Levels." AIAA Paper 73-98, January 1973.
11. Broderick, Scotto, and Strum. "Particulates in Jet Aircraft Exhaust: Instrumentation and Initial Results." Paper presented at the 65th Annual AICE Meeting, November 1972.
12. Chase, Jim and Hum, Dick. "Measuring Gaseous Emissions from an Aircraft Turbine Engine." SAE Paper 700249, April 1970.
13. Scott Research Laboratories, Inc. "Nitric Oxide Cross Reference Service, Report No. 2, 1972." October 1972.
14. Scott Research Laboratories, Inc. "Diesel Cross Reference Service, Report No. 2, 1972." October 1972.
15. Barrington, A.E., Editor. Proceedings of the Survey Conference, Climatic Impact Assessment Program, February 15 to 16, 1972, DOT-TSC-OST-72-13.
16. Mitchel, A.C.G. and Zemansky, M.W. Resonance Radiation and Excited Atoms, the McMillan Co., New York, 1934.
17. Kaskan, W.E. "Hydroxyl Concentrations in Rich Hydrogen-Air Flames Held on Porous Burners." Combustion and Flame;, Vol. 2, p. 229, 1958.
18. Houghton, W.M. and Jachimowski, C.J. "An Absorption Technique for Measuring OH Concentrations in Shock Tubes." Applied Optics, Vol. 9, p. 329, 1970.
19. Davis, M.G., McGregor, W.K., and Mason, A.A. "Determination of the Excitation Reaction of the OH Radical in H2-02 Combustion." AEDC-TR-69-95, October 1969.
20. Nadler, M. and Kaskan, W.E. "Collisional Broadening of OH 2 £ - 2 ir Lines in Flames." Journal of Quantitative Spectroscopy and Radiative Transfer, Vol. 10, p. 25, 1970.
21. Thorson, W.R. and Badger, R.M. "On the Pressure Broadening in the Gamma Bands of Nitric Oxide." Journal of Chemical Physics, Vol. 27, p. 609, 1957.
22. Dieke, S.H. and Crosswhite, H.M. "The Ultraviolet Bands of OH." Journal of Quantitative Spectroscopy and Radiative Transfer, Vol. 2, p. 97, 1962.
23. Learner, R.C.M. "The Influence of Vibration-Rotation Interaction on Intensities in the Electronic Spectra of Diatomic Molecules." Proceedings of the Royal Society of London, A269, p. 311, 1962.
17
AEDC-TR-73-132
24. Perry-Thorne, A. and Banfield, F.P. "Absolute Oscillator Strength of the (0,0) Band of the Gamma System of Nitric Oxide by the Hook Method." Journal of Physics, B. 3, p. 1011, 1970.
25. Earls, L.T. "Rotational Strength Factors for Transition." Physical Review, Vol. 48, p. 423, 1935.
26. Osgerby, I.T. and Rhodes, R.P. "An Efficient Numerical Method for the Calculation of Chemical Equilibrium in the H/C/O/N/A System." AEDC-TR-71-256, April 1972.
27. Hoshizaki, H., Anderson, L.B., and Conti, R.J. "High Altitude Aircraft Wake Dynamics." Second Conference on the Climatic Impact Assessment Program, Cambridge, Massachusetts, November 14 to 17, 1972.
28. Brewer, L.E. and Limbaugh, C.C. "Infrared Band Model Technique for Combustion Diagnostics." Applied Optics, Vol. 11, p. 1200, 1972.
18

AEDC-TR-73-132
APPENDIXES I. ILLUSTRATIONS
II. TABLES III. SPECTROSCOPIC DATA
19
i.
N)
Generation
Gases
CO
co2
NO
NO
C H x y
H20
Solids
Particulates
Near-Field Reaction
CO
NO
NO
C H x y
With Air
Far-Fie Id In teraction CO \
NO /
NO / x 1
Photo-Chemical with Each Other; Air; and Ozone
C H \ x y
Potential Meteorological Problems
H20 (Cloud Cover; Precipitation)
CX>2 (Greenhouse Effect)
Particles (Blanket; Nucleus for Condensation)
Depletion of Ozone (UV Shield)
Fig. 1 Environmental Interactions of Turbojet Emissions
> m D o •H 30

■a
to to
uu,uuu
80,000
T
60,000
if D
o
40,000 o a
n m
)
]
>
Engine Power
20,000 u imiiiary HUU A/D
Military and A/B
Military Only
Operational Envelope 1 1 1 1 nl
o r>
w
u 1*0
Mach Number 2
Fig. 2 Test Conditions

to w Secondary Nozzle
Secondary Airflow Inlet
-Engine Accessory Pod
a. External Configuration Fig. 3 J93 Engine
> m o o -H 3) il CO

b. Internal Configuration Fig. 3 Continued
> m n
Secondary
Primary Air Stream
W

■Primary Combustion Zone (Approximately)
Cooling Air Bleed (Typical)
to
'-■^-Centerline of Engine
Combustion Secondary Airflow
| Compressor Discharge Airflow
Compressor Bleed Air, 8th Stage
Detail
1. First-Stage Turbine Nozzle Vane 2. First-Stage Turbine Rotor Blade 3. Second-Stage Turbine Nozzle Vane 4. Second-Stage Turbine Rotor Blade
c. Combustor and Turbine Fig. 3 Continued
> m o o H 3J
■ij V Ü

to ON
u
d. Afterburner Fig. 3 Continued
300
to -J
Ü a> m s
o
Ö ■H
Ö W
■o (1)
o ID u u o u
200 -
100
30,000
25 ,000 u
20 ,000 o
En
iH
15 ,000
ö bo
10 ,000 w "a a) -p Ü
u 5 ,000 u o o
4000 5000 6000 7000
Corrected Engine Speed, rpm
e. Engine Operating Characteristics Fig. 3 Continued
8000 > m O O
-H 3D
CO M
£
CM +> \ m
■p
> m O r> H 9
Tt5/Tt2
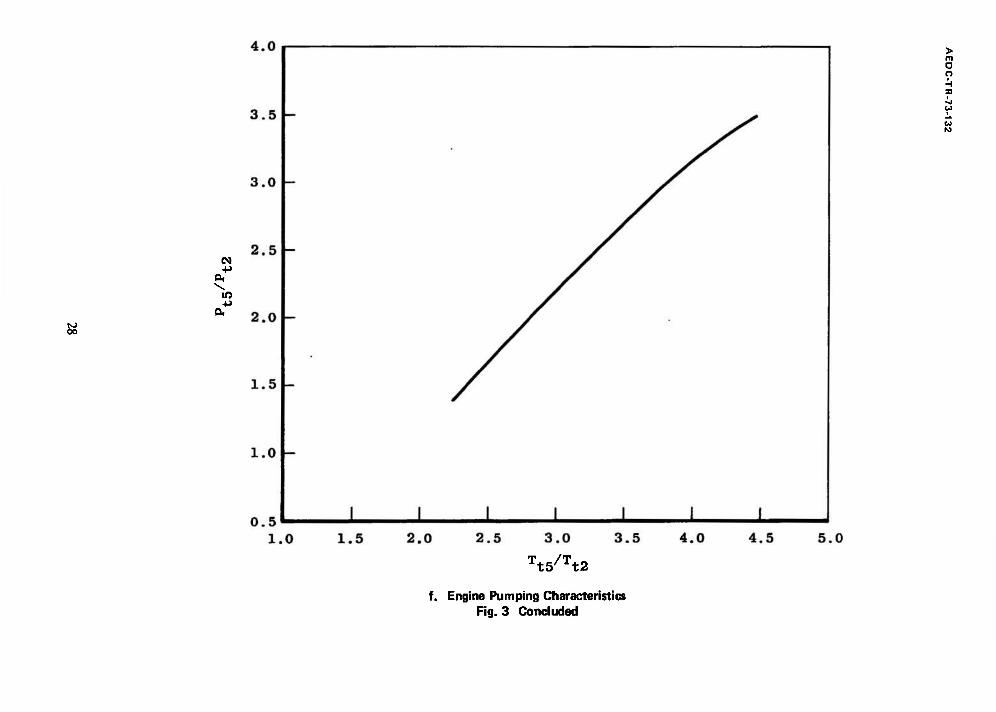
f. Engine Pumping Characteristics Fig. 3 Concluded

> m O O
Fig. 4 J93 Installation M

Not to Scale
o
"Ci_ Inlet Duct ^^W//////////?. €J5T?J93 Engin
zr i
Exhaust Diffuser
Inlet Air Sample Line
-Exhaust Sample Line
Exhaust Sample ValveVQ Bypass
T A Inlet Sample Valve □ I I [><J-i r 1 I
i ! rrXl Dump
— — —Temperature Conditioned to 300°
LJT1 LJT1 i i
Exhaust Gas
Analyzer
I I I I f f f f
Off-Line Batch Samples
Fig. 5 Emission Measurement System
On-Line Digital Data System
> m O o

OJ
o o
Fig. 6 Sample Probe
> m O o
Fig. 7 Sample Rake and Traversing System
AEDC-TR-73-132
From Probe
Sample Valve L
System Dump -•HXh^-
Zero and Purge Gas
Sample Pumps (4)
Bag and Bottle Samples
Electrostatic Capture Grid s* FM
-cfc}—Q]—&Q- —c*^—w—^—i ~f*rzn-+ f^) U] r^j 1 £S Totalizer
Bottle Samples (Vet Chemistry) -^
System Bypass
Gravimetric Filters (2)
-j H20 Sensor [—|J FM f—»
{ Piezoelec. Part. M FM
Low Span Gas
Typical Gas Sensor (1 of 11) —m\ FM I
System Vent
Fig. 8 Exhaust Gas Analyzer
33

AEDC-TR-73-132
in Q,
0> U 3
01
10
8 -
6 -
4 -
2 -
-
Total
-
Pitot
— Static
4
1 1. | •IffW V v
1 1
a. Pressure
1800
1600
o*
0)
3 1400 « u o> a E H 1200 -
1000
800
T5 (Ref.) °—«—°TT ö"o
0 1 , o
1 1 1 1 1 0.2 0.4 0.6 0.8
Jet Radius Ratio, r/R
1.0 1.2
b. Temperature Fig. 9 Exhaust Jet Profile at Mach 2.0, 65,000 ft, and Military Power
34
AEDC-TR-73-132
0.036
o" 0.028 -
(6 « U
-H <
0.012
c. Fuel/Air Ratio
400
> a
300
O ■a •H
3 B 0
200
SB a 0 a h 100 a U
0.2 0.4 0.6 0.8
Jet Radius Ratio, r/R,
1.0 1.2
d. Carbon Monoxide Fig. 9 Continued
35

AEDC-TR-73-132
e. Hydrocarbons
> E O. ft
B Q) cm o u
100
80 -
60 -
<H 0
V o> •H
O 20
40 -
0.2 0.4 0.6 0.8 1.0
Jet Radius Ratio, r/Rn
1.2
f. Oxides of Nitrogen Fig. 9 Concluded
36
AEDC-TR-73-132
10
8 -
et ■H
Q.
0) u 0) (0 4 -
2 -
2700
1700
a. Pressure
0.2 0.4 0.6 0.8 1.0 1.2
Jet Radius Ratio, r/R„
b. Temperature Fig. 10 Exhaust Jet Profiles at Mach 2.0, 65,000 ft, and Afterburning Power
37
AEDC-TR-73-132
0.052
0.044 -
O 0.036 -
es
< 0.028 -
01
0.020 ~
0.012
c. Fuel/Air Ratio
5000
4000 - > e a o.
v 3000
e 2000 -
1000 -
0.2 0.4 0.6 0.8
Jet Radius Ratio, r/Rn
d. Carbon Monoxide Fig. 10 Continued
1.0 1.2
38

AEDC-TR-73-132
5000
U 4000 - a Q.
3000 - to s 0 ,Q u (9 Ü o u x 2000 93 ■o ai c u s B 9
100
80 u E a a.
- 60
- 40
- 20
to B 0 U a
u ■a >< s •a i) a u
B P
e. Hydrocarbons
e o. 0.
B
o
o m 01 •a
100
80 -
60 -
40 -
20 -
0.2 0.4 0.6, 0.8 Jet Radius Ratio, r/Rn
f. Oxides of Nitrogen Fig. 10 Concluded
1.0 1.2
39

AEDC-TR-73-132
400
300
c o CO en
A
K O B O £
3 Ü
200 -
<u 100 3
<H
g 80 A i-H
o 60 o o
40 -
30 -
20 -
10
8
6 -
4 -
3 -
2 -
Sym M h, ft
Solid Symbols Are at Military Power
o 0 0
0.8 20,000
o 0.9 36,000
1.4 35,000
O o A D
2.0 55,000
2.0 65,000 — o D 2.0 75,000
— 0 2.6 65,000
— o
— 0 o D
o 1 — o
»
1
a
-
A ■ o
0 O
A
- ♦ O o
-
o 1 1 1 1
0.2 0.4 0.6 Equivalence Ratio, <t>
a. Carbon Monoxide Fig. 11 J93 Exhaust Emissions
0.8 1.0
40

AEDC-TR-73-132
3
o o o
0) T3 c
c o
■H <fl (0
■H E w c o h
X
■c 0) c u s c 3
100
60
40
20 -
10 -
6
4
2 U
1 -
0.6 -
0.4 -
0.2 -
0.1 -
0.06 -
0.04 -
0.02 I-
0.01
- - Sym M h, ft
- o O 0 0
^ 0.8 20,000 — o ^ 0.9 36,000
— o O 1.4 35,000
A 2.0 55,000
D 2.0 65,000
- o D 2.0 75,000
0 2.6 65,000
— Solid Symbols Are at Military Power
- 0
%
o
— A — 1 —
1 1
D
■■ ♦ ♦ « D
- s <*
0° A
—
|
•
1 1 1
0.2 0.4 0.6
Equivalence Ratio, <p
b. Hydrocarbons Fig. 11 Continued
0.8 1.0
41

AEDC-TR-73-132
14
12 -
X <0
"O c^ 10
eg O ■H (0 in ca
s C <H V bo e o a u <-*
■H O z o
o *H rH
s U) A
■a -H
8 -
6 -
4 -
2 -
Sym M h. ft
O 0 0
~ ♦ ^ 0.8 O 0.9
O 1.4
20,000
36,000
35,000
— A 2.0 a 2.o D 2.0
55,000
65,000
75,000
- 0 2.6
Solid Symbo
65,000
Is Are
-
o
i at Military Power
i 0
0 o o
«• ^ y>A°
" 0
0 i -i i ' 0.2 0.4 0.6 0.8
Equivalence Ratio, 0 1.0
c. Oxides of Nitrogen Fig. 11 Continued
42
AEDC-TR-73-132
1.0
0.9 -
o SB
> 0.8
0.7 -
0) ■a s
§ 0.6 u CO
g V. o s:
0.5 -
0.4 -
0.3
-*— ^ ^H>-
- ♦ r
o
& O 0
0
4°
- A 0 A
i
-
i
Sym
O M 0
0.8
h, ft 0
20,000 - o 0.9 36,000
0 o O o 1.4
2.0 35,000 55,000
<2> D D
2.0 2.0
65,000 75,000
o 0 2.6 65,000
1
Solid Symbols Are at Military Power
__._ 1 1 0.2 0.4 0.6 0.8
Equivalence Ratio, <p 1.0
d. N0/N0x Ratio Fig. 11 Concluded
43

AEDC-TR-73-132
140
120 -
n 100 w
to to
80 -
• 60 a
u o •p tu
I Ü
40 -
20 -
Solid Symbols Are at Military Power
Sym
0 M
0
h. ft
0
- m ^ 0.8 20,000
j o 0.9 36,000
1 O 1.4 35,000
1 A 2.0 55,000
j D 2.0 65,000
- 7 D 0
2.0
2.6
75,000
65,000
/
♦ / •
t / ■
— i
i i i I 1 600 800 1000 1200 1400 1600 1800
Combustor Inlet Temperature, T.g, 'R
Fig. 12 Main Combustor Conditions
44

AEDC-TR-73-132
03 ■H CD
0)
CD
u 4) a
.a (D
«H <!
50
40 -
30 -
10 -
Sym M h, ft
O 0 0 o ^] 0.8 20,000
O 1.4 35,000
A 2.0 55,000
^ D 2.0 65,000 — o D 2.0 75,000
0 2.6 65,000
— D
0
^~
I
a
l I 1
1800 1900 2000 2100 2200
Afterburner Inlet Temperature, T,-, "R
2300
Fig. 13 Afterburner Combustion Conditions
45

AEDC-TR-73-132
1000
100
u 3
I o o o
M
K
s
B o
10
0.1
0.02
Sym M h, ft Sym
Open 0 0 —O—
Solid 1.4 35,000 ~&-
Flagged 2.0 55,000 ..Q..
CO
CxHy N0_
Military
Idle
•\— A/B
I I
0.2 0.4 0.6
Equivalence Ratio, <t>
0.8 1.0
a. CO, CxHy, and NOx
Fig. 14 Effect of Power Setting on J93 Exhaust Emission
46

AEDC-TR-73-132
1 .0
0.9
o as
£ 0.8
0.7 - SI
o T3 S
5 0.6 o •H w
g o 55
0.5 -
0.4 -
0.3 1
Military
1.4 35,000
•A-" 2.0 55,000
1 I 0.2 0.4 0.6 0.8
Equivalence Ratio, <t>
1.0
b. N0/N0x Ratio Fig. 14 Concluded
47

AEDC-TR-73-132
100
10
a» 3
O o o
s ■a
c
s o ■H CQ ID •H s w
0.1
0.01
— Sym
-o-
■D.
CO
CxHy
NO_
Open Symbols: T t3 1230 to 1240UR
Closed Symbols: Tt3 = 1030 to 1070 R
O-^ ^
v n N
..•u X
Military Power 0 = 0.29
1 I
• n
1 20 40 60 80 100
Combustor Inlet Pressure, P „, psia
120
a. CO, CxHy, and NOx
Fig. 15 Effect of Combustion Zone Inlet Pressure on J93 Exhaust Emission
48

AEDC-TR-73-132
1.0
0.9
O 2 to at 0.8 >^ o
■H +J
s 0.7 X 0)
■o c
hH
c 0 0.6
■H CO u
■H
1 X 0.5
o 5 §
0.4
0.3
^
K xo
Open Symbols: Tt3 - 1200 to 1240 R
Closed Symbols:
Military Power
i = 0.29
Tt3 - 1030 to 1070UR
J. 1 1 I
20 40 60 80 100
Combuster Inlet Pressure, P -, psia
120
b. NO/NOx Ratio Fig. 15 Concluded
49

AEDC-TR-73-132
100
0>
£ 10
43 i-l
O o o H \ JS
0) •Ü o H 1 M x
a o
•H 09 03 •H
I
0.1 -
0.04
-
mm
\
— Military Power Sym
Ps3 = 49 to 56 psia _0_ co
-
<t> = 0.22 to 0.33 ^— C H x y
•*G" NO
_ *~-S -
1 1 1
800 1000 1200 1400 1600 Combuster Inlet Temperature, T.«, R
a. CO, CxHyr and NOx
Fig. 16 Effect of Combustion Zone Inlet Temperature on J93 Exhaust Emission
50

AEDC-TR-73-132
g to
o ■H ■p
«
X QJ
■O s
c o •H to (0
o \ o S5
l.U
0.9
0.8 —
0.7 —
0.6
Military Power
0.5 Pg3 = 49 to 58 psia
0 = 0.22 to 0.33
0.4
0.3
—
i i i 800 1000 1200 1400 1600
Combuster Inlet Temperature, T.3, °R
b. NO/NOx Ratio Fig. 16 Concluded
51

AEDC-TR-73-132
40
O S5
[Q cd
0> 3
e ja
o o o
10
I X!
■o C
a o •H CO (0
■i-l
i §
Sym
-A- JT3, JT8, JT9 Data (Ref. 7)
Calculated Values
(J93 Empirical Relationship)
I
600 800 1000 1200 1400 1600
Combustor Inlet Temperature, R
Fig. 17 Empirical Prediction of N0„ Production by High-Pressure Ratio Turbojets
52

AEDC-TR-73-132
100
3
s ,0
o o o
E
T3 c
c o
•H W U)
•iH E w
10 k
0.1
M = 0 h = 0 Afterburning (0 = 0.46)
0.01 0.2 0.4 0.6 0.8
Jet Radius Ratio, r/Rn
Fig. 18 NO and NOx Exhaust Profiles in Afterburning
1.0
53

AEDC-TR-73-132
1000
> E a a
c o ■H -M es u
+> c <u o c o u SB o
100
10
O
A/B
Sym M h. ft
O 0 0
^ 0.8 20,000 O 0.9 36,000
O 1.4 35,000
D 2.0 75,000
0 2.6 65,000
-L
Solid Symbols Are at Military Power
X 0.2 0.4 0.6
Equivalence Ratio, <£>
Fig. 19 Spectroscopic OH Data
0.8 1.0
54

AEDC-TR-73-132
2000
1000 -
> a ou 100
c o
TH +->
U +J a <u o c o u
o 10 -
§m —
Equi
*7>
librium Based on P?, and T?
__ Spec troscopic Values jy
— Solid Symbol Is at Military Power
//
— /I //
1
—
Y-'r 1
1
//
//
J 1 1
»- A/B
—
—
M = 1.4
— W
I h = 35,000 ft
— I
1 1 1 1 0.2 0.4 0.6
Equivalence Ratio, <j>
0.8 1.0
Fig. 20 Comparison of Measured OH with Theoretical Equilibrium
55
AEDC-TR-73-132
700
600 -
500 -
> 6 a ft
c o
•H -t-> et U -P c a> o c o
o 2
400 -
300
200 -
100 -
—
/ •
/
— / »
/
/
/ , i 1 •• A/B
f
—
o /
/
/
# tf Sym M h. ft
0 1.4 35,000 — —0— 2.0 55,000
4 —0— 2.6 65,000
Solid Symbols Are at Military Power
1 1 1 1
0.2 0.4 0.6
Equivalence Ratio, </>
Fig. 21 Spectroscopic NO Data
0.8 1.0
56

AEDC-TR-73-132
400
> s
a o
rt U
a QJ O S o u
s
300
200
100 -
O Spectroscopy
A Sample System
Solid Symbols Are at Military Power
/
^ Xf
A/B
M = 2.0
h = 55,000 ft
1 1 0.2 0.4 0.6
Equivalence Ratio, <j> 0.8 1.0
Fig. 22 Comparison of Spectroscopic NO with Emission Measurement System Values
57

AEDC-TR-73-132
0.6
c 0 u u
+■>
s a
0.1 -
0.01
- 0
0°
o° ■ o8°V
A
A
- o ■ ■ A
— ▲ Sym
- A O TF30 (Ref. 11)
- A ■ J93 > 0.08 micron
A J93
- A M = 1.4
h = 35,000 ft
Military Power
1 1 1 1 J .Al-l 1 I —1- 1 J__ I l_l 1—1—1
10 20 40 60 80 90 95 98 99 99.8 99.9 99.99
Percent Less than Indicated Diameter
Fig. 23 J93 Exhaust Particulates Size Distribution
58

TABLE I TEST SUMMARY
en
Test Total Engine Time Military Time Afterburner Time Remarks and.Problems
Number Date This Date Accumulated This Dato Accumulated This Date Accumulated
AA-01 6-8 0 0 0 0 0 0 Fuel leak prevented running engine
AA-02 6-9 0:09 0:09 0 0 0 0 Idle leak check; open hatch engine run
AA-03 G-13 1:58 2:07 0 0 0 0 Sea level; operation and leak checks
AA-04 6-16 0 2:07 0 0 0 0 Diffuser water supply valve inoperative
AA-05 fi-19 1:13 3:20 0 0 0 0 Sea-level static; engine checkout
AA-OG 6-23 4:31 7:51 1:06 1:06 0:07 0:07 Sea-level static; engine checkout
AB-07* fi-30 6:01 13:52 1:30 2:36 0 0:07 75,000 ft. Mach 2.0
AB-08 7-10 0 13:52 0 2:36 0 0:07 Diffuser water supply valve; plant fuel system inoperative
AB-09* 7-11 6:11 20:03 4:47 7:23 1:52 1:59 65,000 ft. Mach 2.0
AB-10* 7-13 0:21 28:24 7:04 14:27 3:28 5:27 75,000 ft. Mach 2.0
AB-11* 7-15 5:16 33:40 4:19 18:46 2:13 7:40 55,000 ft, Mach 2.0
AB-12 7-18 4:23 38:03 0:43 19:29 0:06 7:46 Cell water drain valve inoperative; erratic T5
AB-13 7-22 1:52 39:55 1:21 20:50 0 7:46 Instrumentation difficulties; engine lube oil leak
AB-14 7-24 0:38 40:33 0 20:50 0 7:46 Open hatch engine run; define oil leak
AB-15 7-25 0:19 40:52 0 20:50 0 7:46 Open hatch engine run, check oil leak repair
AB-16* 7-25 2:58 43:50 2:13 23:03 0:46 8:32 36,000 ft. Mach 1.4
AB-17* 7-27 9:31 53:21 5:07 28:10 1:52 10:24 65,000 ft. Mach 2.6 20,000 ft. Mach 0.8
AB-18* 7-29 5:22 58:43 3:27 31:37 0 10:24 Sea-level static 36,000 ft. Mach 0.9
AB-19* 7-31 5:58 64:41 3:35 35:12 1:54 12:18 Soa- level static
■(■Exhaust Gas Data Obtained CO
AEDC-TR-73-132
TABLE II EMISSION MEASUREMENTS
a. Continuous
Component Analysis Sensor or Technique Model or Agency
co2 Volume Concentration Nondispersive Infrared (ND1R) Beckman 315B CO I NDIR Beckman 315B CO NDIR Beckman 31SBL CxHy I Flame Ionization Beckman 402
H20 Dew Point Variable Capacitance Panametrics 1000 NO Volume Concentration NDIR Beckman 315BL NO Chemiluminescence (CID) Thermo-Electron N02 Nondispeisive Ultraviolet Beckman 255BL N02 Electrochemical (ECD) Dynasciences NR-210 NOx CID Thermo-Electron 10A NOx ECD Dynasciences NX-130 SOx Flame Photometry Meloy SA-160R
Participates Mass /Volume Electrostatic Capture with Piezoelectric Micro-Balance
Thermo-Systems 3210B
b. Batch
Part iculates Mass/Volume Filter with Gas Total Flowmeter Gelman /Precision Scientific
Size Distribution Electrostatic Capture with Electron Microscopy
DOT Laboratory
NO, OH Remote Absorption Spectroscopy
Scanning UV AEDC Laboratory
so2. SOx, Aldehydes
Volume Concentration Wet Chemistry AEDC Laboratory
CxHy Carbon Distribution Bag Sample with Chromotography AEDC Laboratory
Trace Gases Volume Concentration Bottle Sample with Wet Chemistry and Chromotography
BuMines Laboratory- UCLA Laboratory
c. Ancillary
Fuel H/C Ratio, Trace Metals, Aromatics, Olefins, Sulfur
Wet Chemistry and Spectroscopy AEDC Laboratory Galbraith Laboratory
Tt9 op Ir/lr-Rho Thermocouple AEDC Laboratory
Pt9 psia Pitot Tube AEDC Laboratory
60

AEDC-TR-73-132
TABLE III J93 EXHAUST EMISSION DATA
IW»
Em
^ >
Lssion Index, lbm/1000 Ibm Fuel M h. ft <i> ^m
0
CO CXHy NO (as N02) NOx (as N02)
0 0. 123 0.114 122.00 45.300 0.66 0.21 0. 113 0. 105 111.00 28.100 1.42 2. 73 0. 112 0. 101 94.40 17.400 1. 72 3. 11 0. 123 0. 114 66.00 7.270 1.81 3. 54 0. 163 0. 163 38. 80 1.980 2. 13 4. 72 0.237 0.231 26.30 1.260 2. 80 5.27 0.325* 0.315 7.58 0.030 4.93 5. 78 0.448 0.482 9.78 0.076 3.09 3.82 0.560 0.649 1. 34 0. 058 3.44 3. 61
0.8 20, 000 0.331* 0.341 6.49 0.068 4. 82 5. 12 0.454 0.521 5.01 0.071 3.57 3.59 0.546 0. 670 1. 64 0. 027 3.40 3. 36
0.9 36, 000 0.331* 0. 312 18.90 0. 117 3. 42 3.99
1.4 35, 000 0.226 0.222 19. 10 1.480 1. 88 3.91 0.318* 0.321 7.82 0. 169 4.23 4.60 0.436 0.478 37. 60 1. 780 1. 63 2.95 0.528 0.626 4.61 0.054 2.40 2. 70 0.613 0.723 3.24 0. 031 2. 61 2.90 0.713 0. 843 3. 33 2. 76 2.98
2. 0 55, 000 0.257 0.268 8. 36 0.818 5.21 6.49 0.294* 0. 294 4. 12 0. 077 6. 04 6. 70 0.521 0. 593 11.43 0.080 3.22 3.61 0.590 0.682 7.32 0. 039 3.07 3.79 0.659 0. 799 11. 12 0.049 3.40 3.72
2.0 65, 000 0.289* 0.282 10.00 0.291 5.05 5.50 0.575 0.642 14.00 0. 336 2.58 2.97
2.0 75, 000 0.290* 0.290 13.70 0.262 3.82 3.76 0.586 0. 634 38.70 0. 130 1.83 1.81
2. 6 65, 000 0.223* 0.225 3.41 0. 175 10.69 12. 03 0.560 0.742 5. 50 0.036 4.57 5.46
Military Power
61

AEDC-TR-73-132
TABLE IV GRAVIMETRIC PARTICULATE DATA
M h, ft 0 Filter Nominal Filter Participates, Type* Size, microns mg/M3
0 0 0. 123 M 0.45 0.5 0. 123 0. 25 5.1
0.2 to 0. 3 52.3 0.325 14.9 0. 325 21. 8 0.448 12.2 0. 448 20.5
>0. 45 5.7 >0. 45 ■ ' | 10. 7
0.8 20, 000 0.331 MX 0.45 1. 17 0.4 to 0. 6 MX 25. 03
0.9 36, 000 0.331 M 14.0
1.4 36, 000 0. 2 to 0. 3 0. 318
MX M
11. 16 5.42
0. 4 to 0. 7 M ■ 1
8.05
2.0 55,000 0. 294 ] D 10 (1.43) 0.590 (1.44)
2.0 65,000 0. 289 0.575
(0.67) (2.42)
2.0 75, 000 0.290 0. 290
(4. 24) (0.26)
0.586 ' ' ' (0.30)
2.6 65,000 0.223 M 0.45 17.7 0.560 MX 0.45 4.8
M - Small pore membrane filter P - Large pore polypropylene filter required because of
low engine exhaust pressure, experienced weep-through X - Broken filter required special analysis technique
62

TABLE V AEDC WET CHEMISTRY ANALYSIS OF J93 EXHAUST GAS
ON
M h, ft d> SO2, ppm SOx(As SO2), ppm Aldehydes(As CH2O), ppm
0 0 0. 123 4.47 0. 325 0.41 0.325 2.95 7.31 0.03 0.448 3. 84 14.26 0.39
0.8 20, 000 0. 331 4. 40 4.77
0.9 36, 000 0. 331 3. 30 6.23
1.4 35, 000 0.318 1.04 5.80 0.05
2.0 55,000 0.294 1. 18 4.49
0.590 0. 57 11.78 1. 18
2.0 65,000 0.289 2. 16 4. 86 0.07 0.575 0.01 3.81 1.34
2.0 75, 000 0. 290 0. 53 4.60 0. 11 0. 290 0. 08 6.20 0.29 0.586 0. 83 20.77 0.09
2.6 65, 000 0.223 1.47 5.50 0. 15 0. 560 0. 11 15.22 0.23 □
o
3J
CO

AEDC-TR-73-132
TABLE VI BUMINES J93 EXHAUST GAS ANALYSIS
M 2.0 2.0 2.0 2.0 2.6 2.6
h, ft 65.000 65,000 75,000 75, 000 65, 000 65,000
0 0.289 0.575 0.290 0.586 0.223 0.560
ANALYSIS* (Ref. 11):
C>2, percent 15.0 8.6 15.2 10.8 17.8 9.8
CO2» percent 3.6 8.9 3.7 5.9 2.7 9.0
CO, ppmv 156 673 260 1,860 35 220
H2» PPmv 1.5 42.7 3.2 114.6 0.9 7.7
CH^, ppmC 0.2 0.2. 0.5 0.5 0.5 0. 5
CxHy, ppmC 16.6 53.4 18.0 20.0 34. 5 43. 9
Total Aldehyde, ppmv 0.56 1. 49 1.96 4.10 0.24 0. 18
Formaldehyde, ppmv 0.53 0.89 0.25 0.42 0.02 0.17
H2O2, ppmv
N2O, ppmv 1.98 1.57 1.45 0.78 1.23 2.26
NO, ppmv 2.25 2.20 0.86 2. 13 1.63 2.33
NOx, ppmv 4.88 2.20 1.70 3.20 3.00 3.23
Nitrate, ppmv 6.7 5. 0 3.2 1.6 7.5 1.5
Nitrate, ppmv 62.4 71. 9 44. 8 38.2 72.2 132.6
Dash indicates not detectable, below 0. 01 ppm
64
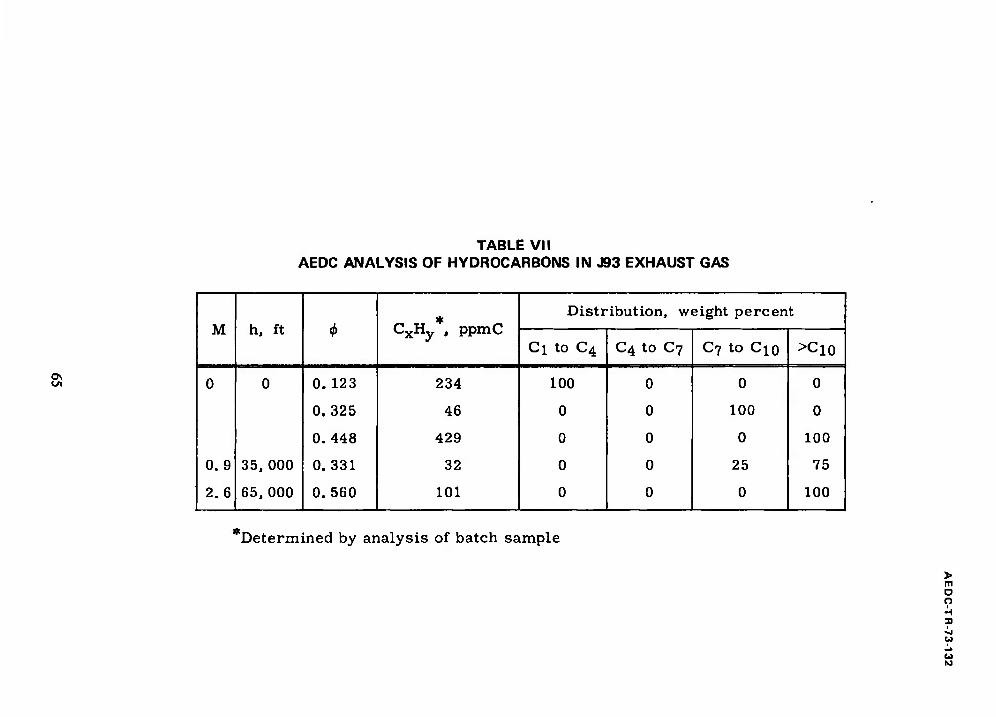
TABLE VII AEDC ANALYSIS OF HYDROCARBONS IN J93 EXHAUST GAS
M h, ft <t> *
CxHy , ppmC Distribution, weight percent
Ci to C4 C4 to C7 C7 to C10 >Cl0
0
0.9
2.6
0
35,000
65, 000
0.123
0.325
0.448
0.331
0.560
234
46
429
32
101
100
0
0
0
0
0
0
0
0
0
0
100
0
25
0
0
0
100
75
100
'Determined by analysis of batch sample
> m O O
U
10

TABLE VIII JP5 FUEL SPECIFICATIONS AND ANALYSIS D
O
Item Specified* Actual Deviation, One Sigma
No. of Samples
Net Heat and Combustion, Btu/lbm 18, 300 min 18,394 42 16
Hydrogen, weight percent 13.76 0.05 11
ASTM Distillation:
IBP, °F 320 22 14 10 percent min, °F 400 373 6 11 20 percent min, °F 386 4 11 50 percent min,—°F 410 3 11 90 percent min, °F 449 2 11 FBP Max, °F 550 481 1 11 Residue max, percent 1.5 1. 1 0.2 11 Loss max, percent 1.5 0. 1 0.2 11
Specific Gravity, T/°C at 40°F 0.817 0.005 14 at 100°F 0. 796 0. 001 16
Viscosity max, centistokes at -30°F 16.5 9. 39 0.37 11 Sulfur, weight percent 0.4 0.059 0.018 11 Aromatics max, volume percent 25.0 13.51 0. 74 11 Olefins max, volume percent 5.0 0.68 0.08 11 Smoke point min, mm 19.0 38.96 2.05 11 Flash point min, °F 140 122 13 14 Hydrogen/Carbon Ratio 1.909 0.023 13
"MIL-T-5624G

AEDC-TR-73-132
TABLE IX JP5 FUEL TRACE METAL ANALYSIS
Metal Analysis of 3 S< amples, jug/ml (±10 to 30 percent)
1 2 3
Ag 0. 003 0.001 0.0003 Al B Ba
0.003 0.002 0.004
Be Bi Ca
0.003 0.003 0.003 Cb
Cd
Co 0. 005 0. 005 0.004 Cr 0. 1 0. 2 0.1 Cu 0.002 0. 02 0.03 Fe 1.3 1.3 1. 1 Mg 0.002 0. 002 0.001 Mn 0. 02 0.02 0.01 Mo 0. 002 0. 001
Na
Ni P Si
0.05 0.05 0.05
0.02 0.01 0.01 Sn 0.005 0.01 0.04 Ti 0.002 0. 001
Zn
Pb 0.08 0.09 0.05 Total Ash 1.55 1. 67 (No analysis)
(1 liter sample)
Concentration values represented by dashes were not detectable
67

TABLE X EMISSION MEASUREMENT SYSTEM VERIFICATION DATA
o
u
oo
Cross Reference
Gas*
No. of Users
User Average Value
User Value Deviation
(one sigma)
Certified Value
AEDC Value
CO, ppm
CO2, percent
CxHy, ppm
NO, ppm
23
21
17
28
502
3.38
325
68
26
0.14
15
7
495
3.40
334
74
528
3.25
325
80
References 13 and 14

AEDC-TR-73-132
APPENDIX 111 SPECTROSCOPIC DATA
INTRODUCTION
A number of molecules produced during the combustion process within jet engines play roles in the chemical balance of the stratosphere (Ref. 15). Among these are nitric oxide (NO) and the hydroxyl radical (OH). To assess the impact of an additional source of these molecules, such as that from SST-like aircraft, on the chemical balance in the upper atmosphere, it is first necessary to determine their rate of emission from typical jet engines. The concentration of highly reactive species such as OH must be measured by an in situ technique, and it is also highly desirable to measure the more stable NO concentration in situ because of the uncertainty as to further chemical reactions within sampling probes and gas analyzer instruments. This appendix describes the application of a spectral absorption technique to the measurement of OH and NO concentrations in the exhaust plane of a YJ93-GE-3 engine operated at several simulated flight conditions.
The measurements were made as part of a program of exhaust emissions measurements on the YJ93-GE-3 engine at simulated flight conditions, conducted in Propulsion Development Test Cell (J-2) at the Arnold Engineering Development Center (AEDC). The engine was operated over a range of simulated Mach speeds from zero to Mach 2.6 and simulated altitudes from sea level to 75,000 ft at power settings from idle to maximum afterburning. Levels of emission of the constituents were primarily measured by sampling through a probe which could be positioned anywhere in the exhaust plane and by analyzing the gas using a variety of commercial process instruments. The results of the sampling measurements are described in the main body of this report.
The method used to make the in situ measurements of OH and NO concentrations is usually referred to as the "narrow line absorption" technique. In this method, the transmission from a narrow line source of radiation through a medium containing the species to be measured is determined and related, either through theoretical expressions or calibration, to the number of absorbing molecules along the absorbing path. The source of radiation is a discharge tube containing a fixed amount of the molecular species of interest. The essentials of the method are contained in the standard text by Mitchel and Zemansky (Ref. 16) and the application to OH in combustion gases has been described by many investigators, including Kaskan (Ref. 17) and Houghton and Jachimowski (Ref. 18). In the work described here, the resonance electronic bands of OH at 3064 Ä and NO at 2269 A were used. The details of the method used at AEDC are described by Davis, McGregor, and Mason (Ref. 19).
The main deterrent to such measurements is usually considered to be the harsh environment in which the laboratory-type instrumentation must be made to function. These hazards were overcome in this work, and a large amount of data were obtained.
69

AEDC-TR-73-132
DESCRIPTION OF THE METHOD
Theory
The narrow-line absorption technique is based on isolation of the measured absorption to the absorption at line center in order to take advantage of the relation:
l K ^D
„ " >J4Kn2 <.Kp(a2) erfc(a)
where kv is the absorption coefficient at wave number (v) defined by
K = r fc MV (HI-2)
with Io being the incident intensity, I the measured intensity, and L the path length in cm. The other symbols have the following definitions:
k = (1/L) fa(I0/I) , the absorption coefficient at the line center wave number, vQ o o
Ai/D = 2i/0V(2 fci2 KT)/MC2
, the Doppler width in cm"1
where
K = Boltzmann's constant, 1.38 x 10 ergs/°K
T = absolute temperature, °K
M = mass of absorbing molecule, gm
c = velocity of light, 3 x 10" cm/sec
a = yTn2 —r , where Av^ is the natural width
and Afc is the collisional width of the line.
In almost all cases, Av^ « Avc and may be neglected. For the OH molecule, several investigators have expressed "a" in terms of the pressure and temperature of the absorbing gas,
a = KCP/T) (III-3)
where K is an experimentally determined constant, P is the pressure in atmospheres, and T the temperature in °K. Houghton and Jachimowski (Ref. 18) list several determinations of K by different investigators but the latest and most thorough work is by Nadler and Kaskan (Ref. 20), who show that K depends on which line of the (0,0) OH band is being used. Their value (K = 585), appropriate for the R2 (3) line, will be used in this work.
70

AEDC-TR-73-132
For the NO molecule, Thorson and Badger (Ref. 21) have shown that collisional broadening is much less than Doppler broadening so that "a" is small and
exp (a2) erfc (a) ~ 1
The absorption coefficient of a single line is expressed in terms of properties of the absorbing gas as follows:
/ k,> = — N v»j »r v. v «j -j „ (m.4) o mc
where:
e = Electron charge, 4.8 x 10" esu no
m = Electron mass, 9.11 x 10 gm
fiv**.f = Number density of molecules in the rotational level (J ") of the vibrational level (v") of the ground electronic state, cm
v'v"J'J" = Oscillator strength for the transition from the v'J'level of the upper electronic state to the v"J" level of the ground electronic state.
Now, for Boltzmann equilibrium,
exp[-G(v")/KT] (2J"*He«P[-FtJ")/«cT]N0
"V'J" = Se.p[-G(y")/icT] * 2(2J"+l)e«pl-F(j")/«Tl ("1-5) J"
where G (v") is the vibrational energy of the v" level, F(J") is the rotational energy of the J" rotational level, and the summations are the vibrational and rotational partition functions. The oscillator strength for OH, as given by Houghton and Jachimowski (Ref. 18) is 8.45 x 10"4 and the rotational line strength as given by Dieke and Crosswhite (Ref. 22) with Learner's (Ref. 23) correction, will be used. By combining Eqs. (III-l), (III-4), and (III-5) and using the definitions given, the numerical equation for the number density of OH is given as follows:
NOH = 7^ x I«15 wSr^?;(rVKTJ- K0 e--8 (in-6)
The partition functions (Qv and Qr), as defined by the summations in Eq. (III-5), are easily calculable, and W, defined as
W = V'4fr 2/7T exp (a2) erfc (a) (III-7)
71
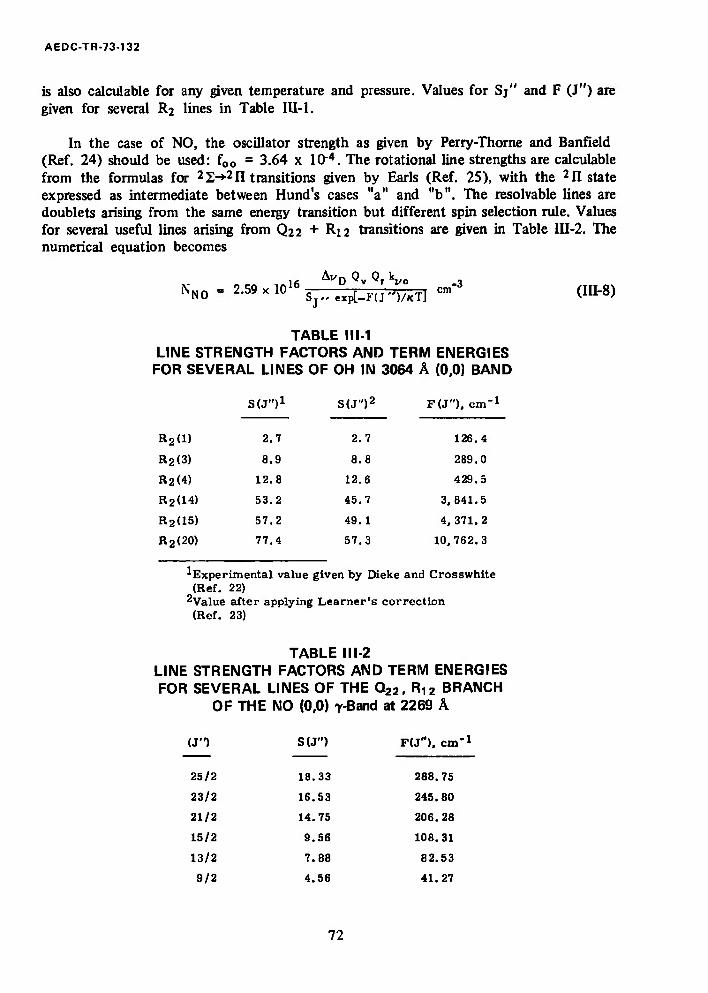
AEDC-TR-73-132
is also calculable for any given temperature and pressure. Values for Sj" and F (J") are given for several R2 lines in Table III-1.
In the case of NO, the oscillator strength as given by Perry-Thorne and Banfield (Ref. 24) should be used: f00
= 3.64 x 10"4. The rotational line strengths are calculable from the formulas for 22-»-2n transitions given by Earls (Ref. 25), with the 2II state expressed as intermediate between Hund's cases "a" and "b". The resolvable lines are doublets arising from the same energy transition but different spin selection rule. Values for several useful lines arising from Q22 + R12 transitions are given in Table III-2. The numerical equation becomes
Ifi A"D Qv Qr ki/o Q NN0 = 2.59 , 10" g—[=JTr^rf] cm (IM)
TABLE 111-1 LINE STRENGTH FACTORS AND TERM ENERGIES FOR SEVERAL LINES OF OH IN 3064 Ä (0,0) BAND
SU")1 S(J")2 F(J"), cm'1
R2(I) 2.7 2.7 126.4
H2(3) 8.9 8.8 289.0
R2<4) 12.8 12.6 429.5
R2(14) 53.2 45.7 3, 841.5
R2(15) 57.2 49.1 4,371.2
R2(20) 77.4 57.3 10,762.3
1 Experimental value given by Dieke and Crosswhite (Ref. 22)
^Value after applying Learner's correction (Ref. 23)
TABLE 111-2 LINE STRENGTH FACTORS AND TERM ENERGIES FOR SEVERAL LINES OF THE Q22, R1 2 BRANCH
OF THE NO (0,0) 7-Band at 2269 A
(J") SU") F(J"). cm"1
25/2 18.33 288.75
23/2 16.53 245.80
21/2 14.75 206.28
15/2 9.56 108.31
13/2 7.88 82.53
9/2 4.56 41.27
72

AEDC-TR-73-132
The lines of the NO gamma bands are much more closely spaced than those of OH so that they are not always resolvable with field-type instruments. This was the case for the measurements reported herein. In this case, one can write (Ref. 18):
Gf - £ .-4L + j£ e-k2L + _ . _ + li e-kjL (HI-9)
where (I/I0)£b is the transmissivity measured in the wave number interval v\> - va, Ii ti i are the incident intensities of the individual lines within the interval, ki(2, i is the absorption coefficient of each of the lines, and IT is the sum of all the incident individual line intensities from the source. In principle, Eq. (III-9) can be solved for the density of a species if the temperature is known, but it is generally easier to resort to a laboratory calibration. In the work reported here, a laboratory calibration was performed for the NO molecule, and the method of data reduction when using the calibration is described in the next section.
When the source line width is not much narrower than the absorption line width a correction is necessary which adjusts the measured transmissivity to line center transmissivity. Mitchel and Zemansky (Ref. 17) show that, for Doppler line shapes, the measured transmissivity [(I/I0)m] of a line is related to the transmissivity at line center [(Vh)v0] by the integral relation:
j exp [-(to/a) ] exp[-k„oL exp (-<a2)]d(i>
(r„)„ - = (UW0) J exp [-((u/a)^tku
where
K0 = -£MI/I0)„
AI^Q (source)
Avn (absorber)
Hv-Vn) A ■ - VET2
This correction is applicable for OH when "a" is small as it was in most cases under consideration in this work.
Experimental
The essential ingredients for application of the narrow-line absorption technique are a radiation source, optics for beaming the source radiation through the absorbing gas, a wavelength selective receiver (spectrometer), and a stable detector and signal conditioning
73

AEDC-TR-132
system. The arrangement of this hardware is illustrated in Fig. Ill-1. The most unique requirement is that the source emit only radiation at the line center of the absorbing gas. The most convenient way at present of ensuring this condition is to create a gaseous discharge at low pressure and temperature in which the only radiation in the wavelength band of interest is the resonance radiation of the molecule to be studied. Several techniques are available for providing such a source, and the one used here will be described in the next section. The potential of tunable dye lasers in the ultraviolet is recognized, but stability and line width limitations do not currently make this device a contender.
Line Source Absorbing Gas Spectrometer
Fig. 111—1 Physical Arrangement for Spectral Line Absorption Measurements
It has been assumed in the development of the equation for the narrow-line absorption method that the absorbing path was uniform in both temperature and concentration. When this is not the case, inversion techniques can be employed for certain simple geometries. For axisymmetric streams such as jet engine exhausts, the Abel inversion can be applied. This follows by writing the fundamental absorption equation in the form:
rv^V Ul(y)/l0)v = -} k„nU)dx
-v^-7 (iii-ii)
where the appropriate geometry is illustrated in Fig. III-2. This is the form of an Abel integral transformation:
WO ■ =/ ^=^^ dy ?/ y^w (III-12)
Many routines are available for performing this inversion, and it is possible to obtain both local temperature and concentration from an axisymmetric source by its use. Unfortunately, a very rigid traversing platform is required for either the instruments or the engine (or else, many instrument stations located in the plane of measurement) in order to obtain (I(y)Ao) as a function of the distance from the centerline. Thus, the inversion could not be employed in this work, and it was necessary to assume a uniform path at some average temperature and concentration.
74

AEDC-TR-132
Fig. III-2 Abel Inversion of Measured Absorption Coefficient
DESCRIPTION OF APPARATUS
Engine and Test Facility
The YJ93-GE-3 turbojet engine and the characteristics of the J-2 test cell are fully described in the main body of this report. It suffices to say here that the test was a direct-connect test in which ram air was supplied to the engine inlet at the temperature and pressure corresponding to a given airspeed and altitude and that the static pressure at the engine exit was maintained at the pressure corresponding to the given altitude. The engine could be operated at any power setting, but spectral absorption data were taken only at military power and several afterburner power settings.
The conversion of the spectral absorption measurements to an absolute average number density of the species in question requires knowledge of the static gas pressure and temperature along the path. The concentration in parts per million requires also the gas density, which is found from knowledge of the static pressure and temperature. In order to be consistent, since measurements of total pressure and temperature were not available for every condition that absorption data were obtained, the YJ93-GE-3 PFRT Cycle Review (Ref. 6) was used. The other engine variable required in the absorption measurements is the optical path length, or diameter of the engine exhaust stream. At the station 12 in. downstream of the nozzle exit where the optical path intercepted the gas stream, it was found that the total pressure survey provided the best indication of the diameter of the stream, and this value was used as the path length.
Radiation Source
The source of narrow-line radiation was provided by a gas discharge tube of special design shown schematically in Fig. III-3. A discharge is maintained through the capillary
75

AEDC-TR-132
tube by two electrodes at either end which are connected to a 2800-v power supply. Gas flows continually through the tube, and the pressure is adjusted to a value between 1 and 10 torr which appears to give the most stable operation. The tube is water cooled to remove the heat transferred to the Pyrex® walls and keep the gas as cool as possible in order to minimize Doppler broadening of the spectral lines. Fused silica windows are mounted at either end of the tube to allow transmission of ultraviolet radiation. A monitoring photomultiplier tube with an interference filter is used at one window to record any drift in the radiative output that might occur.
Cooling Water
-Water-Cooling Jacket '"M
Fused Silica Wndow
Electrode 2 Capillary Tube
Drain
Power Suppl
Gas Mixture
rrn Inlet—»»r~
Fused Silica Window
Electrode
a. Diagram
b. Photograph Fig. Ill -3 Discharge Tube Used to Produce
Narrow-Line Radiation
76

AEDC-TR-132
Experience has led to the use of special gas mixtures to provide spectra which are intense and unperturbed by bands from other molecules. To produce intense, narrow-line OH resonance radiation, argon is bubbled through water at atmospheric pressure and then passes through a control valve, the discharge tube, and a vacuum pump. The argon evidently causes a selective excitation of the OH, producing the intense 3064 A band shown in Fig. III-4, which was obtained with a 1/2-meter JACO spectrometer having a 2360 groove/mm grating.
3100 3110
wavelength. A
Fig. 111-4 Line Spectrum of the (0,0) OH Band at 3064 Ä Produced by a Discharge through Flowing Argon with Entrained Water Vapor
The NO 7-band radiation was found to be most intense when a 12:3:1 mixture of Ar:N2:02 at a pressure of about 5 torr was used. The (0,0) band gf the y-system of NO is shown in Fig. III-5 as obtained in second order using a 1-meter Jarrell-Ash instrument having a 1180 groove/mm grating. The lines of the T^band are too closely spaced to be resolvable using the 1/2-meter instrument which had to be used in the test cell installation, so that an integrated band spectra as shown in Fig. III-6 had to be used. However, the principles of the narrow-line absorption method are still applicable since the source does emit narrow lines.
Fig. 111-5 Line Spectrum of the (0,0) 7-Band of NO from a Discharge through a 12:3:1 Mixture of Ar:N2:02
77

AEDC-TR-132
Fig. 111-6 Integrated Band Spectra of NO Obtained from Discharge Tube as Mounted in Propulsion Development Test Cell (J-2)
Receiver Unit
The receiver was a 1/2-meter Jarrell-Ash grating spectrometer having curved, adjustable slits, and a 2360 groove/mm grating blazed for maximum reflection at 3000 A. The wavelength selector was operated remotely by a selsyn motor/servo pair. The wavelength position was transmitted by the signal from a 10-turn potentiometer, which served as the x-input for the x-y plotter used to record the data. The detector was a Hamamatsu type R-106 photomultiplier tube with S-19 spectral response. The source radiation was modulated at a frequency of 400 Hz, using an American Time Products Company tuning fork chopper. The ac signal from the detector passed through a Philbric Mod 1003 preamplifier located within the spectrometer enclosure and to a Princeton Applied Research lock-in amplifier located in the instrument control room some 100 ft away. The data were recorded on both an x-y plotter and a strip chart recorder. The instrumentation system is shown in Fig. III-7.
For the OH measurements, a 30-micron slit width was used (resolution about 0.2 A), whereas for the NO measurements, a 200-micron slit (1.6 A bandpass) was used.
78

AEDC-TR-132
Test Cell •* Control Room
Discharge Tube Power
Chopper Signal Monitor Signal
X-Y Recorder
Test Cell *• Control Room
Fig. 111-7 Circuitry for Spectral Absorption Data Recording System
Installation
The orientation of the components of the measurement system with respect to the engine is diagrammed in Fig. III-8 and shown pictorially in Fig. HI-9. In each case, the view is toward the rear of the engine. Two f-4.4 fused silica lenses of 10-cm focal length were placed at one focal distance from the source and spectrometer, respectively, so that a parallel beam of light was projected through a diameter of the engine exhaust at a point approximately 12 in. downstream of the nozzle exit plane. The distance from source unit to spectrometer was approximately 12 ft. The optical system was aligned by use of a small helium-neon laser placed at the centerline of the engine exhaust. The alignment did not have to be repeated during the 4-week test program.
79

AEDC-TR-132
Spectrometer
Test Cell Diffuser
Fig. Ill-8 Diagram of Installation of Spectral Absorption Apparatus in Propulsion Development Test Cell (J-2)
Fig. Ill-9 Photograph of Installation of Spectral Absorption Apparatus in Propulsion Development Test Cell (J-2)
The source unit and spectrometer were housed in insulated, water-cooled, aluminum enclosures mounted to the cell walls as shown in Fig. III-9. The enclosures were purged at atmospheric pressure with dry nitrogen. The source and spectrometer were attached to 1-in.-thick steel plates which were set on vibration isolation mounts attached to the base of the enclosures. No effect of vibration was detected during the testing. Thermocouples located inside the enclosures indicated that the temperature never exceeded approximately 100°F, and no adverse temperature effects were observed. The fused silica
80

AEDC-TR-132
windows through which the beam passed became coated with an oily-like substance during the tests even though a stream of nitrogen was aimed at them at all times. The degradation of the signal due to window-coating did not seriously affect the measured results although the data reduction procedure was made more difficult, as will be discussed in the following section.
DESCRIPTION OF DATA
OH Data
An example pair of OH spectra obtained during the test is shown in Fig. Ill-10. The upper spectra was obtained before the engine was started, and the lower spectra was obtained some 3 hours later during an afterburning data point. The magnitude of the absorption is notable as well as the reduction in the reference intensity as evidenced by the two spurious nitrogen bands and the lines from large rotational quantum number states (note particularly R2(15)). The method of data reduction is outlined as follows:
1. Determine a reference value for the line to be measured using the R.2(15) line—10
2. Determine the transmissivity of the line, (I/I0)m
C s i
OH Spectra Taken before Engine Ignition In 1-2
OH Spectra Taken during Afterburner Data Point In 1-2
i "i i i i1
3070 3080 3090 3100 3110 3120 3130 3140 Wavelength, A
Fig. 111-10 OH Spectra Taken before YJ93-GE-3 Engine Ignition and during Afterburning
81

AEDC-TR-132
3. Correct the transmissivity to line center transmissivity using Eq. (Ill-10) and the given exhaust gas temperature. (A plot of measured transmissivity versus line center transmissivity for different values of a was determined from Eq. (111-10) and used for correction to line center transmissivity.)
4. Determine the number density using Eq. (1II-6) at the appropriate gas pressure, temperature, and stream diameter and the constants of Table III-l.
The data reduction was carried out only for the R2(3) and R2(4) lines for this report.
NO Data
An example pair of NO spectra obtained during the test is shown in Fig. III-l 1. The upper trace is the reference spectra, and the lower trace is for an afterburner data point. In this case, the (1,1).and (2,2) bands from the source are also included in the spectral scans. The intensity of the (2,2) bandheads provides a convenient source of correction for source degradation since they experience very little absorption at the temperatures encountered in the exhaust stream.
(010) 12
10
8
6
4
2 & 2 -
I S
NO Spectra Taken before Engine Ignition
0 12
10
8
6
4
2
0
Fig.
NO Spectra Taken during Afterburner Data Point
2200 ' 2210 ' 2220 ' 2230 ■ 2240 ' 2250 ■ 2260 ' 2270 Wavelenqth, A
111-11 NO Spectra Taken before YJ93-GE-3 Engine Ignition and during Afterburning
82

AEDC-TR-132
.A laboratory calibration was performed using an absorption tube of known length in which the pressure could be controlled. The spectra obtained in the laboratory at several different pressures are shown in Fig. Ill-12. The method of calibration selected was as follows: ■
1. Measure the transmissivity at the peak of the second bandhead.
2. Correct the measured transmissivity to line center, using Eq. (111-10).
3. Plot a calibration curve of N x L versus (I/I0) (Fig. HI-13).
The data reduction procedure was then straightforward and consisted of (1) correcting the reference intensity at the second bandhead using the (2,2) bandhead intensity, (2) measuring the, transmissivity at the second bandhead, (3) correcting to line center transmissivity, (4) determining the density from Fig. 111-13, using the path length given by the pitot pressure survey, and (5) correcting for the difference in temperature between the calibration cell and the engine exhaust.
This method of data reduction is subject to alteration to any number of schemes. The most scientific would be by use of Eq. (III-9), but difficulty arises in selecting a suitable wavelength increment in which the intensities of all the lines are measurable.
1 DC
NO Absorption Calibration Absorption Path Length * 44.1 cm Gas Temperature - 300°K Half Intensity Spectral Banopass ■ a4 A
Ref. Level-
Absorber Gas Pressure
2200 2210 ' 2220 T
2230 ' 2240 Wavelength, A
2250 2260 2270
Fig. 111-12 NO Absorption Calibration Data for the (0,0) 7-Band Obtained with Absorption Cell in the Laboratory
83

AEDC-TR-132
iow
o
\0: ,16
1 1 1 NO Density Calibration Curve
Density (N) times Path Length (L) versus Corrected Transmissivity
Second Bandhead Peak Height
1.0 ■br 3.0 4.0 5.0 6.0 7.0 8.0
<'o'"corr.
Fig. 111-13 Calibration Curve for NO Density Using Second Bandhead of the (0,0) 7-Band (N = Density of NO, cm3; L = Path Length, cm; {\0/\)v0 = Reciprocal of Transmissivity at Line Center)
RESULTS AND DISCUSSION
Results
The results of the emissions measurements on the YJ93-GE-3 engine using the data reduction procedures just described are given in Tables III-3 and III-4 and Figs. Ill-14 and 111-15. Examination of the tables leads to the following notable observations:
1. OH densities are strongly affected by afterburning, and values for the maximum afterburning power settings run in this series of tests are larger than values for the military power setting by about an order of magnitude.
2. OH densities are directly related to total fuel flow rate.
3. NO densities are not noticeably dependent on afterburning or total fuel flow rate, but remain about constant for all data points included.
4. NO concentrations measured by the in situ method are factors of from 1.5 to 5 larger than those measured by sampling and gas analyzers.
84

TABLE 111-3 CONCENTRATION OF OH IN EXHAUST OF YJ93-GE-3 ENGINE AT SIMULATED FLIGHT CONDITIONS
00 1^1
Simulated Flight Conditions Engine Power
Setting Total Fuel Flow
Rate, lbm/hr Average Total Density,
cm-3 x 10¹⁸ Average Hydroxyl
Density, cm-3 x 10*4 Average Hydroxyl
Concentration, ppm Mach Number
Altitude, ft x 10-3
0 0 Military 21, 200 11.3 0.50 4.4
0 0 A/B 29,100 6.90 0.49 7.1
0 0 A/B 36, 300 4.45 6.41 144.0
0.8 20 Military 15.600 4.26 0.50 11.7
0.8 20 A/B 25, 800 2.96 2.70 91.2
0.9 36 Military 9,040 2.43 0.17 7.0
1.4 35 Military 14. 300 2.65 0.15 5.7
1.4 35 A/B 19, 500 1.92 0.37 19.0
1.4 35 A/B 23, 600 1.61 1.50 93.0
1.4 35 A/B 24,000 1.54 1.87 121.0
1.4 35 A/B 27, 600 1.47 4.29 292.0
1.4 35 A/B 32,000 1.34 10.4 776.0
2.0 75 Military 3,000 0.48 0.20 41.7
2.0 75 A/B 6,200 0.39 1.77 454.0
2.6 65 Military 7", 100 0.70 0.16 22.9
2.6 65 A/B 17,900 0.35 2.08 594.0
o o
33
CO IO

> □ n H
CO M
TABLE 111-4 CONCENTRATION OF NO IN EXHAUST OF YJ93-GE-3 ENGINE AT SIMULATED FLIGHT CONDITIONS
00 OS
Simulated Flight Conditions Engine Power
Setting Total Fuel Flow Rate, lbm/hr
Average Total Density, cm-3x 10¹⁸
Average Nitric Oxide Density, cm"3xl0l4
Average Nitric Oxide Concentration, ppm Mach
Number Altitude, ft x 10-3
1.4 35 Military 14, 500 2.65 1.98 74.8
2.0 55 Military 8,470 0.96 1.58 165.0
2.0 55 A/B 14,900 0.81 1.42 175.0
2.0 55 A/B 17,000 0.65 1.42 219.0
2.0 55 A/B 18,950 0.55 1.53 278.0
2.6 65 Military 7,100 0.70 2.26 323.0
2.6 65 A/B 17,900 0.35 2.16 617.0

OHDinslty - Y
Fllom Ccngtjon _M urn ■-
ai
0.9
1.4
2.0
2.6
2D
37
I I 10« U)"«!-'
o
Y//y////////jv/////My///y///////////////,
AEDC-TR-132
Concentration Ippm)
Ms** Ion MtBuwmtnl
44 7.1
144
Equilibrium OlcuMkm it
StognMlon CmdltlM«
»J US
101
12 n
as es
7.0 0.4
S.7 19
776
0.4 12
HO
42 454
0,6 396
23 594
0.1 4S2
Military PoMr Mlnliiun Attarburntr Po*tr Mnbnun Afterburner PnMr
Fig. 111-14 Average OH Concentration in the Exhaust of a YJ93-GE-3 Engine Compared with Equilibrium Values Calculated at Combustion Conditions
NO Density -
Flight Condition JL MÜÜ
> I
2
i I
SxMr14«)"3
Cofjcgntrjpjjfln (ppmi
Absorption Measurement
Sampling Measurement
1.4
müSisättmä* m 165 175 278
70 80
110
2.6 fa W////////////M 3 617 100 1»
Military I Minimum Afterburner Power Maximum Afterburner Power
Fig. 15 Average NO Concentration in the Exhaust of a YJ93-GE-3 Engine; Comparison of Values Measured in situ by UV Absorption and Measured by Sampling
The uncertainty for these measurements is estimated to be about ±10 percent based on several repeated data points. The error in the absolute number densities cannot be estimated with any reliability since it depends on many factors. Among these are the true path length, the nonuniform distribution of concentration and temperature, static temperature errors, and variations of source intensity during a spectral scan. However, for purposes of determining total emissions of OH and NO, the average molecular densities are believed to be accurate within ±20 percent.
87

AEDC-TR-132
Comparison of OH Results with Theoretical Predictions
In Fig. 111-14, the density of OH is shown graphically for the flight conditions under which OH measurements were made and for the power settings of military, minimum afterburning, and the maximum afterburning power setting employed in these tests. At the right of the figure is shown the average measured concentration in parts per million and the equilibrium value calculated at the appropriate equivalence ratio and temperature corresponding to the afterburner combustion chamber. The theoretical value was obtained from the chemical equilibrium calculation procedure given by Osgerby and Rhodes (Ref. 26). It is to be noted that there is reasonable agreement between the calculated and measured values. However, the value measured in the exhaust stream from the afterburning runs is consistently greater than that calculated in the combustion chamber except for one point, the sea-level-static minimum afterburner run. The larger discrepancy between the measured and calculated values for the nonafterburning firings is not understood. The important point to be made-is that the OH concentration is apparently governed by the finite rate chemistry in the flow and is not altered very much in the millisecond or so between the two stations. The equilibrium value of [OH] at the static temperature and pressure existing at the measurement station is about two orders of magnitude less than the measured value. This observation is also supported by the modeling results reported by the Lockheed Research Group (Ref. 27).
Comparison of NO Results with Probe Measurements
Figure III-15 shows the NO molecular density results of Table III-4 in graphical form for the conditions run. Also, at the right of the figure are shown the concentrations determined by the absorption method and by the probe sampling method. The probe results were averaged [NO] data along the path taken from the data presented in the main body of this report. The total [NOx] data from the sampling measurements are only slightly larger than the [NO] values. If both measurements are assumed correct, it is apparent that some of the NO must have been converted to some species other than an oxide of nitrogen along the path from sample probe to the analyzer instrument. Further investigation is required to resolve this discrepancy.
At this point, it should also be noted that the rather constant NO molecular density means that the total rate of emission of NO is about constant since the exhaust velocity and area do not vary much with engine flight speed and altitude. This fact is hidden when the measurement is expressed in terms of volume concentration (ppm) or emission index (weight of emissions/weight of fuel). Some absorption measurements were also attempted at the engine idle power setting, but the attenuation was much less than for the military power setting. It is, therefore, suggested that the total rate of emission is a function only of the primary combustor temperature which is controlled by the equivalence ratio in the primary combustor.
Effect of Particulates on Absorption Measurements
One problem in making the UV transmission measurements that was anticipated never arose. It was predicted that the submicron soot particles in the engine exhausts would
88

AEDC-TR-132
introduce scattering of the UV beam that would have to be distinguished from the absorption by the species of interest. However, no apparent reduction in transmitted intensity was detected at the idle engine condition where the particulate loading is probably highest (Ref.. 9).
Further Possibilities for In Situ Measurements
The use of in situ techniques for measurement of the density of NO and OH has been demonstrated. It is possible to obtain concentrations of other minor species in the combustion gases such as NO, CH, SO, and CN using the same technique. Methods have also been developed at AEDC to determine concentration profiles of H20 and CO2 using measured infrared emission-absorption and band model parameters (Ref. 28). This iterative technique also provides perhaps the best method for obtaining static temperature profiles. The emission-absorption method may also be applied to CO in the infrared, although this has not been .done to date. Also, progress has recently been made in the detection of NO2 by absorption of continuum emission in the 2400 to 2600 Ä range. It thus appears that the only species of interest which do not lend themselves to spectral techniques are the unburned hydrocarbons and the particulates.
SUMMARY
The results of the effort reported here on the in situ measurement of hydroxyl and nitric oxide concentrations in the exhaust of the YJ93-GE-3 jet engine by the resonance line absorption technique may be summarized as follows:
1. Spectral absorption techniques were successfully used to determine jet engine emissions of OH and NO.
2. OH emission densities of the YJ93-GE-3 engine were much larger for the afterburning engine than for the nonafterburning engine and, for the afterburner cases, corresponded to levels computed at the afterburner combustor fuel/air ratio, stagnation pressure and stagnation temperature. The values ranged from 0.15 x 1014 cm-3 at Mach number 1.4, 35,000-ft altitude condition at military power, to a maximum of 10.4 x 1014 cm-3
at the Mach number 1.4, 35,000-ft, maximum afterburner power setting.
3. NO emission densities for the YJ93-GE-3 engine were independent of whether the engine is afterburning or not afterburning and changed only slightly with flight conditions at the military primary combustor fuel flow. Values ranged from a minimum of about 1.4 x 1014 cm-3 at the Mach number 2, 55,000-ft, minimum A/B condition to about 2.3 x 1014 cm"3
at the Mach number 2.6, 66,000-ft, military condition.
4. NO emission levels in ppm for the YJ93-GE-3 engine determined in situ by spectral absorption were larger by factors of from about 1.5 to 5 than those measured by sampling through gas analyzers.
89

UNCLASSIFIED Security Classification
DOCUMENT CONTROL DATA -R&D fS+curlty rl&Mslttcaiion at title, body of abstract and inditing annotation must be entered when the overall report Ja ctasaltted)
1 ORIGINATING ACTIVITY {Corporate author)
Arnold Engineering Development Center Arnold Air Force Station, Tennessee 37389
2a. REPORT SECURITY CLASS'FlC ATlOh
UNCLASSIFIED 26. GROUP
N/A
*EMl¥sTIONEMEASUREMENTS OF A J93 TURBOJET ENGINE
* DESCRIPTIVE NOTES (Type ol report and tncluaivtr dates)
June 8 to July 31, 1972—Final Report 5 IUTHORISI (Pint name, middle Initial, laal name)
D. L. Davidson and A. F. Domal
a REPORT DATE
September 1973 7a. TOTAL NO OF PAGES
96 7b. NO. OF REFS
28 »a- CONTRAC- OR GRANT NO
6. PROJECT NO
9a. ORIGINATOR'S REPORT NJMBERISI
AEDC-TR-73-132
c Program Element 921K Ob. OTHER REPORT NOtSl (Any other number» that may bo assigned this report)
ARO-ETF-TR-73-46 10 DISTRIBUTION STATEMENT
Approved for public release; distribution unlimited.
II SUPPLEMENTARY NOTES
Available in DDC
12 SPONSORING MIL'TA=?Y ACTIVITY
DOT - FAA 800 Independence Ave., S. W. Washington, D.C. 20590
3. ABSTRACT Exhaust gas emission measurements were made at the nozzle of a J93 turbojet engine at simulated flight conditions from sea-level static to Mach 2.0 at 75,000 ft and Mach 2.6 at 65,000 ft. Real time measure- ments of CO, CO2, CxHy, NO, and N0X were taken over a range of after- burning and nonafterburning engine power settings using a gas sampling system designed to adhere to SAE ARP 1256 specifications. In addition, NO and OH were measured in situ by a narrow-line UV spectral absorption technique. Batch-type measurements of particulates and other trace con- stituents of the exhaust gas were also made. Major results of the test were that emissions vary significantly with combustor inlet pressure and temperature and, therefore, with Mach number and altitude. Specifically, NOx increased with the square root of the combustor inlet pressure and the 2.5 power of the combustor inlet temperature. Differences between the gas sampling and spectroscopic data on NO indicate the need for verification of sampling techniques.
DD ,FN°ofiv\s1473 UNCLASSIFIED Sccuntv Classification

UNCLASSIFIED Security Classification
KCV WORD* «OLE ROLE WT
air pollution
exhaust gases
exhaust emissions
turbojet engines
altitude simulation
Mach number
sampling
spectroscoplc analysis
UNCLASSIFIED Security Classification