Embed Size (px)
Citation preview
Emission Factor Documentation for AP-42Section 11.7
CERAMIC PRODUCTS MANUFACTURING
Final Report
For U. S. Environmental Protection AgencyOffice of Air Quality Planning and Standards
Emission Factor and Inventory Group
EPA Contract 68-D2-0159Work Assignment No. III-01
MRI Project No. 4603-01
June 1996

Emission Factor Documentation for AP-42Section 11.7
CERAMIC PRODUCTS MANUFACTURING
Final Report
For U. S. Environmental Protection AgencyOffice of Air Quality Planning and Standards
Emission Factor and Inventory GroupResearch Triangle Park, NC 27711
Attn: Mr. Ron Myers (MD-14)Emission Factor and Inventory Group
EPA Contract 68-D2-0159Work Assignment No. III-01
MRI Project No. 4603-01
June 1996
NOTICE
The information in this document has been funded wholly or in part by the United StatesEnvironmental Protection Agency under Contract No. 68-D2-0159 to Midwest Research Institute. Ithas been reviewed by the Office of Air Quality Planning and Standards, U. S. EnvironmentalProtection Agency, and has been approved for publication. Mention of trade names or commercialproducts does not constitute endorsement or recommendation for use.
ii
PREFACE
This report was prepared by Midwest Research Institute (MRI) for the Office of Air Quality
Planning and Standards (OAQPS), U. S. Environmental Protection Agency (EPA), under Contract
No. 68-D2-0159, Work Assignment No. III-01. Mr. Ron Myers was the requester of the work.
Approved for:
MIDWEST RESEARCH INSTITUTE
Roy Neulicht
Program Manager
Environmental Engineering Department
Jeff Shular
Director, Environmental Engineering
Department
June, 1995
iii

iv
TABLE OF CONTENTS
Page
LIST OF FIGURES . . . . . . . . . . . . . . . . . . . . . . . . . . . . . . . . . . . . . . . . . . . . . . . . . . . . viiLIST OF TABLES . . . . . . . . . . . . . . . . . . . . . . . . . . . . . . . . . . . . . . . . . . . . . . . . . . . . vii
1. INTRODUCTION . . . . . . . . . . . . . . . . . . . . . . . . . . . . . . . . . . . . . . . . . . . . . . . . . . . 1-1
2. INDUSTRY DESCRIPTION . . . . . . . . . . . . . . . . . . . . . . . . . . . . . . . . . . . . . . . . . . . . 2-12.1 INDUSTRY CHARACTERIZATION . . . . . . . . . . . . . . . . . . . . . . . . . . . . . . . . . . 2-12.2 PROCESS DESCRIPTION . . . . . . . . . . . . . . . . . . . . . . . . . . . . . . . . . . . . . . . . . . 2-4
2.2.1 Raw Material Procurement . . . . . . . . . . . . . . . . . . . . . . . . . . . . . . . . . . . . 2-42.2.2 Beneficiation . . . . . . . . . . . . . . . . . . . . . . . . . . . . . . . . . . . . . . . . . . . . . 2-92.2.3 Mixing . . . . . . . . . . . . . . . . . . . . . . . . . . . . . . . . . . . . . . . . . . . . . . . . . . 2-102.2.4 Forming . . . . . . . . . . . . . . . . . . . . . . . . . . . . . . . . . . . . . . . . . . . . . . . . . 2-102.2.5 Green Machining . . . . . . . . . . . . . . . . . . . . . . . . . . . . . . . . . . . . . . . . . . . 2-112.2.6 Drying . . . . . . . . . . . . . . . . . . . . . . . . . . . . . . . . . . . . . . . . . . . . . . . . . . 2-112.2.7 Presinter Thermal Processing . . . . . . . . . . . . . . . . . . . . . . . . . . . . . . . . . . 2-122.2.8 Glazing . . . . . . . . . . . . . . . . . . . . . . . . . . . . . . . . . . . . . . . . . . . . . . . . . 2-122.2.9 Firing . . . . . . . . . . . . . . . . . . . . . . . . . . . . . . . . . . . . . . . . . . . . . . . . . . . 2-122.2.10 Final Processing . . . . . . . . . . . . . . . . . . . . . . . . . . . . . . . . . . . . . . . . . . . 2-15
2.3 EMISSIONS . . . . . . . . . . . . . . . . . . . . . . . . . . . . . . . . . . . . . . . . . . . . . . . . . . . . 2-162.4 EMISSION CONTROL TECHNOLOGY . . . . . . . . . . . . . . . . . . . . . . . . . . . . . . . . 2-16
3. GENERAL DATA REVIEW AND ANALYSIS PROCEDURES . . . . . . . . . . . . . . . . . . . 3-13.1 LITERATURE SEARCH AND SCREENING . . . . . . . . . . . . . . . . . . . . . . . . . . . . . 3-13.2 DATA QUALITY RATING SYSTEM . . . . . . . . . . . . . . . . . . . . . . . . . . . . . . . . . . 3-23.3 EMISSION FACTOR QUALITY RATING SYSTEM . . . . . . . . . . . . . . . . . . . . . . . 3-3
4. AP-42 SECTION DEVELOPMENT . . . . . . . . . . . . . . . . . . . . . . . . . . . . . . . . . . . . . . . 4-14.1 INTRODUCTION . . . . . . . . . . . . . . . . . . . . . . . . . . . . . . . . . . . . . . . . . . . . . . . . 4-14.2 REVIEW OF SPECIFIC DATA SETS . . . . . . . . . . . . . . . . . . . . . . . . . . . . . . . . . . 4-1
4.2.1 Reference 1 . . . . . . . . . . . . . . . . . . . . . . . . . . . . . . . . . . . . . . . . . . . . . . 4-14.2.2 Reference 2 . . . . . . . . . . . . . . . . . . . . . . . . . . . . . . . . . . . . . . . . . . . . . . 4-14.2.3 Reference 3 . . . . . . . . . . . . . . . . . . . . . . . . . . . . . . . . . . . . . . . . . . . . . . 4-34.2.4 Reference 4 . . . . . . . . . . . . . . . . . . . . . . . . . . . . . . . . . . . . . . . . . . . . . . 4-34.2.5 Reference 5 . . . . . . . . . . . . . . . . . . . . . . . . . . . . . . . . . . . . . . . . . . . . . . 4-44.2.6 Reference 6 . . . . . . . . . . . . . . . . . . . . . . . . . . . . . . . . . . . . . . . . . . . . . . 4-44.2.7 Reference 7 . . . . . . . . . . . . . . . . . . . . . . . . . . . . . . . . . . . . . . . . . . . . . . 4-54.2.8 Reference 8 . . . . . . . . . . . . . . . . . . . . . . . . . . . . . . . . . . . . . . . . . . . . . . 4-54.2.9 Reference 9 . . . . . . . . . . . . . . . . . . . . . . . . . . . . . . . . . . . . . . . . . . . . . . 4-54.2.10 Reference 10 . . . . . . . . . . . . . . . . . . . . . . . . . . . . . . . . . . . . . . . . . . . . . 4-64.2.11 Reference 11 . . . . . . . . . . . . . . . . . . . . . . . . . . . . . . . . . . . . . . . . . . . . . 4-64.2.12 Reference 12 . . . . . . . . . . . . . . . . . . . . . . . . . . . . . . . . . . . . . . . . . . . . . 4-74.2.13 Reference 13 . . . . . . . . . . . . . . . . . . . . . . . . . . . . . . . . . . . . . . . . . . . . . 4-74.2.14 Reference 15 . . . . . . . . . . . . . . . . . . . . . . . . . . . . . . . . . . . . . . . . . . . . . 4-84.2.15 Reference 16 . . . . . . . . . . . . . . . . . . . . . . . . . . . . . . . . . . . . . . . . . . . . . 4-8
v
TABLE OF CONTENTS (continued)
Page
4.2.16 Reference 17 . . . . . . . . . . . . . . . . . . . . . . . . . . . . . . . . . . . . . . . . . . . . . 4-84.2.17 Reference 18 . . . . . . . . . . . . . . . . . . . . . . . . . . . . . . . . . . . . . . . . . . . . . 4-84.2.18 Reference 19 . . . . . . . . . . . . . . . . . . . . . . . . . . . . . . . . . . . . . . . . . . . . . 4-84.2.19 Reference 20 . . . . . . . . . . . . . . . . . . . . . . . . . . . . . . . . . . . . . . . . . . . . . 4-94.2.20 Reference 21 . . . . . . . . . . . . . . . . . . . . . . . . . . . . . . . . . . . . . . . . . . . . . 4-94.2.21 Reference 22 . . . . . . . . . . . . . . . . . . . . . . . . . . . . . . . . . . . . . . . . . . . . . 4-94.2.22 Reference 23 . . . . . . . . . . . . . . . . . . . . . . . . . . . . . . . . . . . . . . . . . . . . . 4-94.2.23 Reference 24 . . . . . . . . . . . . . . . . . . . . . . . . . . . . . . . . . . . . . . . . . . . . . 4-104.2.24 Reference 25 . . . . . . . . . . . . . . . . . . . . . . . . . . . . . . . . . . . . . . . . . . . . . 4-104.2.25 Reference 26 . . . . . . . . . . . . . . . . . . . . . . . . . . . . . . . . . . . . . . . . . . . . . 4-104.2.26 Reference 27 . . . . . . . . . . . . . . . . . . . . . . . . . . . . . . . . . . . . . . . . . . . . . 4-104.2.27 Reference 28 . . . . . . . . . . . . . . . . . . . . . . . . . . . . . . . . . . . . . . . . . . . . . 4-11
4.3 DEVELOPMENT OF CANDIDATE EMISSION FACTORS . . . . . . . . . . . . . . . . . . 4-114.3.1 Filterable PM . . . . . . . . . . . . . . . . . . . . . . . . . . . . . . . . . . . . . . . . . . . . . 4-114.3.2 Volatile Organic Compounds . . . . . . . . . . . . . . . . . . . . . . . . . . . . . . . . . . 4-194.3.3 Carbon Monoxide . . . . . . . . . . . . . . . . . . . . . . . . . . . . . . . . . . . . . . . . . . 4-194.3.4 Carbon Dioxide . . . . . . . . . . . . . . . . . . . . . . . . . . . . . . . . . . . . . . . . . . . . 4-194.3.5 Nitrogen Oxides . . . . . . . . . . . . . . . . . . . . . . . . . . . . . . . . . . . . . . . . . . . 4-204.3.6 Sulfur Dioxide . . . . . . . . . . . . . . . . . . . . . . . . . . . . . . . . . . . . . . . . . . . . 4-204.3.7 Hydrogen Fluoride . . . . . . . . . . . . . . . . . . . . . . . . . . . . . . . . . . . . . . . . . 4-204.3.8 Fluoride . . . . . . . . . . . . . . . . . . . . . . . . . . . . . . . . . . . . . . . . . . . . . . . . . 4-204.3.9 Lead . . . . . . . . . . . . . . . . . . . . . . . . . . . . . . . . . . . . . . . . . . . . . . . . . . . 4-21
4.4 SUMMARY OF CHANGES TO AP-42 SECTION . . . . . . . . . . . . . . . . . . . . . . . . . 4-214.4.1 Section Narrative . . . . . . . . . . . . . . . . . . . . . . . . . . . . . . . . . . . . . . . . . . . 4-214.4.2 Emission Factors . . . . . . . . . . . . . . . . . . . . . . . . . . . . . . . . . . . . . . . . . . . 4-21
5. PROPOSED AP-42 SECTION 11.7 . . . . . . . . . . . . . . . . . . . . . . . . . . . . . . . . . . . . . . . 5-1
vi
LIST OF FIGURES
Figure Page
2-1 Process flow diagram for ceramic products manufacturing . . . . . . . . . . . . . . . . . . . 2-52-2 Miscellaneous ceramic products manufacturing processes and equipment . . . . . . . . 2-6
LIST OF TABLES
Table Page
2-1 STANDARD INDUSTRIAL CLASSIFICATION CODES FOR CERAMICPRODUCTS MANUFACTURING . . . . . . . . . . . . . . . . . . . . . . . . . . . . . . . . . . . 2-1
2-2 LOCATION OF CERAMIC MANUFACTURERS IN 1987 . . . . . . . . . . . . . . . . . 2-22-3 LOCATION OF CERAMIC MANUFACTURERS IN 1987 WITH 20
OR MORE EMPLOYEES . . . . . . . . . . . . . . . . . . . . . . . . . . . . . . . . . . . . . . . . . 2-32-4 COMPOSITIONS OF COMMERCIAL GLAZES . . . . . . . . . . . . . . . . . . . . . . . . . 2-132-5 TYPICAL FIRING TEMPERATURES OF CERAMICS . . . . . . . . . . . . . . . . . . . . 2-142-6 FACTORS THAT REDUCE HF EMISSIONS . . . . . . . . . . . . . . . . . . . . . . . . . . . 2-174-1 SUMMARY OF EMISSION FACTORS FROM REFERENCE 1 . . . . . . . . . . . . . 4-24-2 SUMMARY OF TEST DATA FOR CERAMIC KILNS . . . . . . . . . . . . . . . . . . . . 4-124-3 SUMMARY OF TEST DATA FOR OTHER CERAMIC PRODUCTS
MANUFACTURING SOURCES . . . . . . . . . . . . . . . . . . . . . . . . . . . . . . . . . . . . 4-144-4 EMISSION FACTOR SUMMARY FOR NATURAL GAS-FIRED CERAMIC KILNS 4-164-5 EMISSION FACTOR SUMMARY FOR MISCELLANEOUS CERAMIC
PRODUCTS MANUFACTURING SOURCES . . . . . . . . . . . . . . . . . . . . . . . . . . 4-17
vii
EMISSION FACTOR DOCUMENTATION FOR AP-42 SECTION 11.7Ceramic Products Manufacturing
1. INTRODUCTION
The document Compilation of Air Pollutant Emission Factors (AP-42) has been published bythe U. S. Environmental Protection Agency (EPA) since 1972. Supplements to AP-42 have beenroutinely published to add new emission source categories and to update existing emission factors.AP-42 is routinely updated by EPA to respond to new emission factor needs of EPA, State and localair pollution control programs, and industry.
An emission factor is a representative value that attempts to relate the quantity of a pollutantreleased to the atmosphere with an activity associated with the release of that pollutant. Emissionfactors usually are expressed as the weight of pollutant divided by the unit weight, volume, distance,or duration of the activity that emits the pollutant. The emission factors presented in AP-42 may beappropriate to use in a number of situations, such as making source-specific emission estimates forareawide inventories for dispersion modeling, developing control strategies, screening sources forcompliance purposes, establishing operating permit fees, and making permit applicabilitydeterminations. The purpose of this report is to provide background information from test reports andother information to support revisions to AP-42 Section 8.7, Ceramic Clay Manufacturing.
This background report consists of five sections. Section 1 includes the introduction to thereport. Section 2 gives a description of the ceramic clay manufacturing industry. It includes acharacterization of the industry, a description of the different process operations, a characterization ofemission sources and pollutants emitted, and a description of the technology used to control emissionsresulting from these sources. Section 3 is a review of emission data collection (and emissionmeasurement) procedures. It describes the literature search, the screening of emission data reports, andthe quality rating system for both emission data and emission factors. Section 4 details how therevised AP-42 section was developed. It includes the review of specific data sets, a description ofhow candidate emission factors were developed, and a summary of changes to the AP-42 section.Section 5 presents the AP-42 Section 11.7, Ceramic Products Manufacturing.
1-1
2. INDUSTRY DESCRIPTION
2.1 INDUSTRY CHARACTERIZATION1-3
Ceramics are defined as a class of inorganic, nonmetallic solids that are subject to hightemperature in manufacture and/or use. The most common ceramics are composed of oxides, carbides,and nitrides. Silicides, borides, phosphides, tellurides, and selenides also comprise ceramics. Ceramicprocessing generally involves high temperatures, and the resulting materials are heat resistant orrefractory.
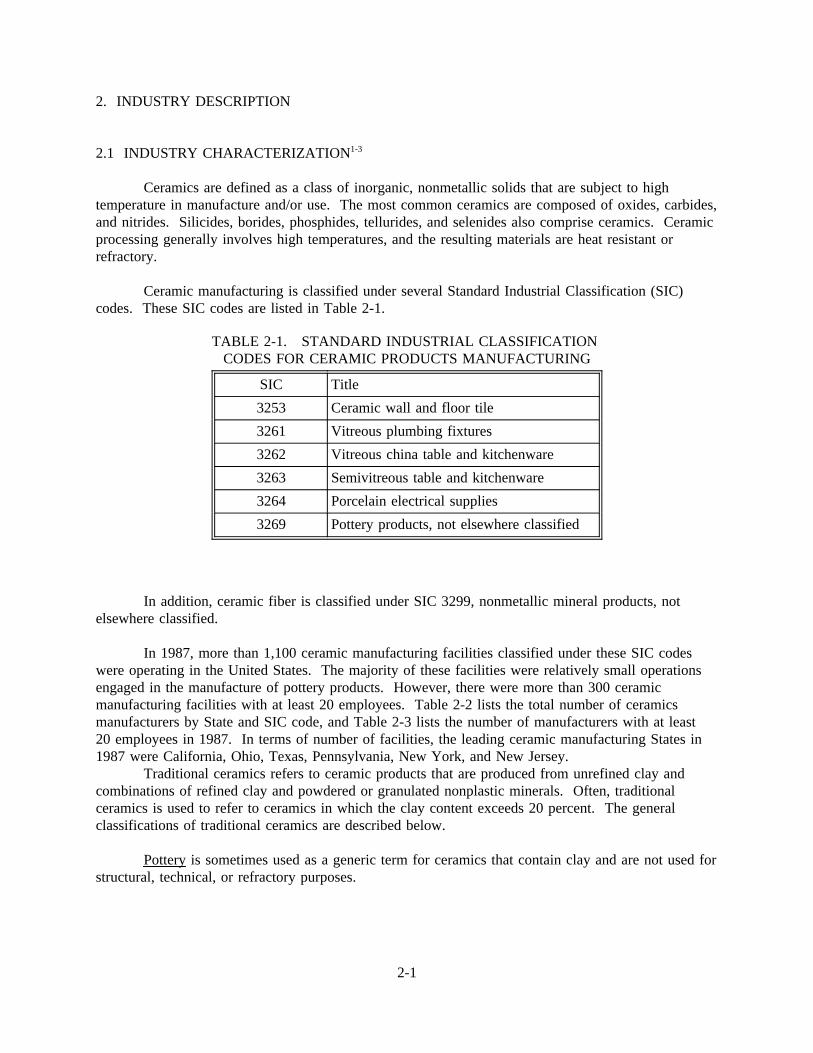
Ceramic manufacturing is classified under several Standard Industrial Classification (SIC)codes. These SIC codes are listed in Table 2-1.
In addition, ceramic fiber is classified under SIC 3299, nonmetallic mineral products, not
TABLE 2-1. STANDARD INDUSTRIAL CLASSIFICATIONCODES FOR CERAMIC PRODUCTS MANUFACTURING
SIC Title
3253 Ceramic wall and floor tile
3261 Vitreous plumbing fixtures
3262 Vitreous china table and kitchenware
3263 Semivitreous table and kitchenware
3264 Porcelain electrical supplies
3269 Pottery products, not elsewhere classified
elsewhere classified.
In 1987, more than 1,100 ceramic manufacturing facilities classified under these SIC codeswere operating in the United States. The majority of these facilities were relatively small operationsengaged in the manufacture of pottery products. However, there were more than 300 ceramicmanufacturing facilities with at least 20 employees. Table 2-2 lists the total number of ceramicsmanufacturers by State and SIC code, and Table 2-3 lists the number of manufacturers with at least20 employees in 1987. In terms of number of facilities, the leading ceramic manufacturing States in1987 were California, Ohio, Texas, Pennsylvania, New York, and New Jersey.
Traditional ceramics refers to ceramic products that are produced from unrefined clay andcombinations of refined clay and powdered or granulated nonplastic minerals. Often, traditionalceramics is used to refer to ceramics in which the clay content exceeds 20 percent. The generalclassifications of traditional ceramics are described below.
Pottery is sometimes used as a generic term for ceramics that contain clay and are not used forstructural, technical, or refractory purposes.
2-1
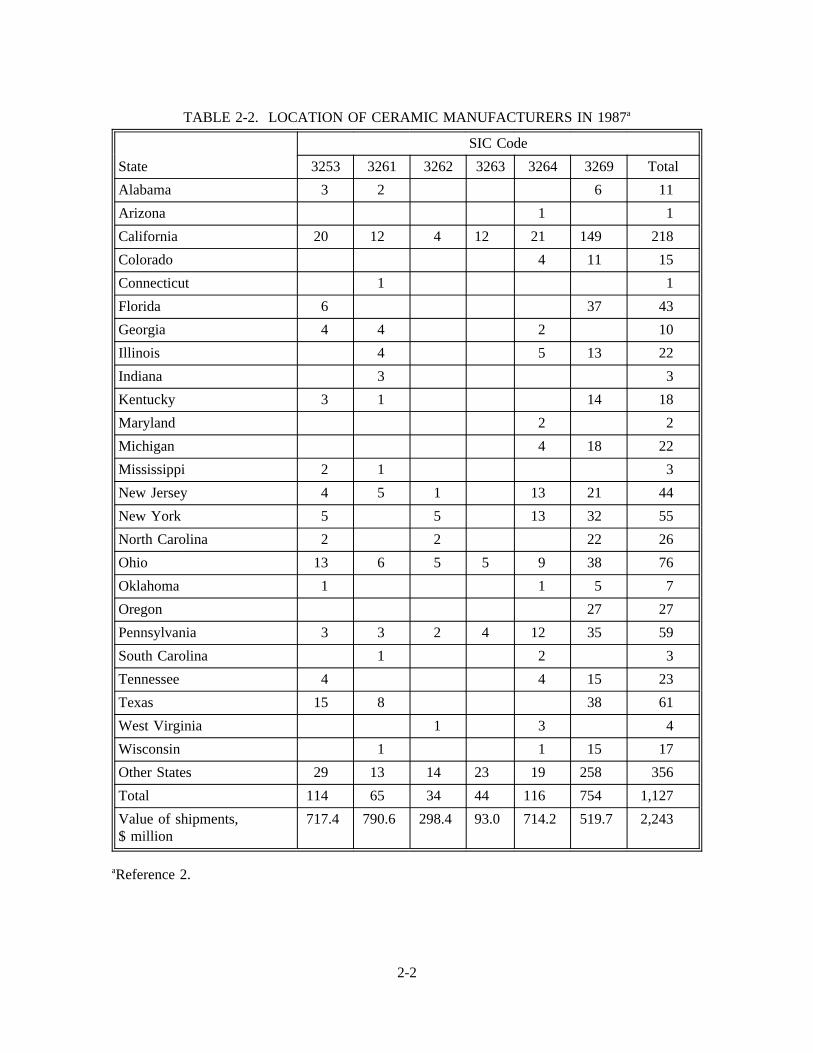
TABLE 2-2. LOCATION OF CERAMIC MANUFACTURERS IN 1987a
State
SIC Code
3253 3261 3262 3263 3264 3269 Total
Alabama 3 2 6 11
Arizona 1 1
California 20 12 4 12 21 149 218
Colorado 4 11 15
Connecticut 1 1
Florida 6 37 43
Georgia 4 4 2 10
Illinois 4 5 13 22
Indiana 3 3
Kentucky 3 1 14 18
Maryland 2 2
Michigan 4 18 22
Mississippi 2 1 3
New Jersey 4 5 1 13 21 44
New York 5 5 13 32 55
North Carolina 2 2 22 26
Ohio 13 6 5 5 9 38 76
Oklahoma 1 1 5 7
Oregon 27 27
Pennsylvania 3 3 2 4 12 35 59
South Carolina 1 2 3
Tennessee 4 4 15 23
Texas 15 8 38 61
West Virginia 1 3 4
Wisconsin 1 1 15 17
Other States 29 13 14 23 19 258 356
Total 114 65 34 44 116 754 1,127
Value of shipments,$ million
717.4 790.6 298.4 93.0 714.2 519.7 2,243
aReference 2.
2-2
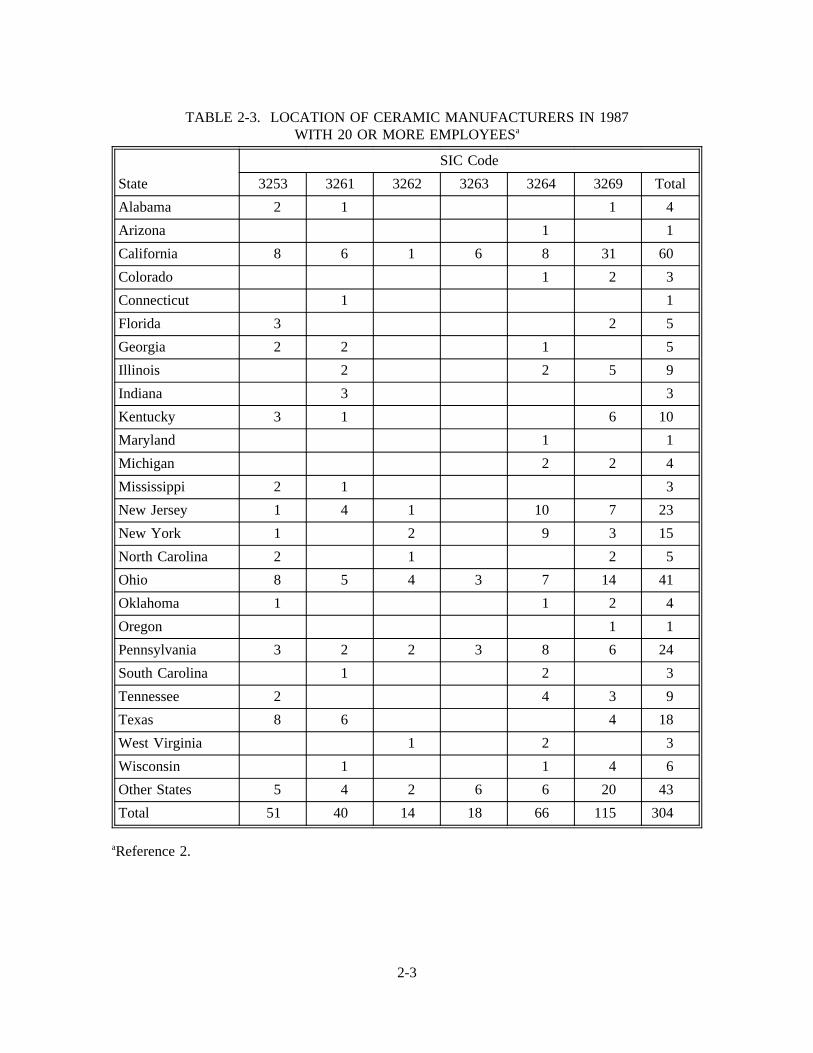
TABLE 2-3. LOCATION OF CERAMIC MANUFACTURERS IN 1987WITH 20 OR MORE EMPLOYEESa
State
SIC Code
3253 3261 3262 3263 3264 3269 Total
Alabama 2 1 1 4
Arizona 1 1
California 8 6 1 6 8 31 60
Colorado 1 2 3
Connecticut 1 1
Florida 3 2 5
Georgia 2 2 1 5
Illinois 2 2 5 9
Indiana 3 3
Kentucky 3 1 6 10
Maryland 1 1
Michigan 2 2 4
Mississippi 2 1 3
New Jersey 1 4 1 10 7 23
New York 1 2 9 3 15
North Carolina 2 1 2 5
Ohio 8 5 4 3 7 14 41
Oklahoma 1 1 2 4
Oregon 1 1
Pennsylvania 3 2 2 3 8 6 24
South Carolina 1 2 3
Tennessee 2 4 3 9
Texas 8 6 4 18
West Virginia 1 2 3
Wisconsin 1 1 4 6
Other States 5 4 2 6 6 20 43
Total 51 40 14 18 66 115 304
aReference 2.
2-3
Whiteware refers to ceramic ware that is white, ivory, or light gray in color after firing.Whiteware is further classified as earthenware, stoneware, chinaware, porcelain, and technicalceramics.
Earthenware is defined as glazed or unglazed nonvitreous (porous) clay-based ceramic ware.Applications for earthenware include artware, kitchenware, ovenware, tableware, and tile.
Stoneware is vitreous or semivitreous ceramic ware of fine texture, made primarily fromnonrefractory fire clay or some combination of clays, fluxes, and silica that, when fired, has propertiessimilar to stoneware made from fire clay. Applications for stoneware include artware, chemicalware,cookware, drainpipe, kitchenware, tableware, and tile.
Chinaware is vitreous ceramic ware of zero or low absorption after firing that is used fornontechnical applications. Applications for chinaware include artware, ovenware, sanitaryware, andtableware.
Porcelain is defined as glazed or unglazed vitreous ceramic ware used primarily for technicalpurposes. Applications for porcelain include artware, ballmill balls, ballmill liners, chemicalware,insulators, and tableware.
Technical ceramics include vitreous ceramic whiteware used for such products as electricalinsulation, or for chemical, mechanical, structural, or thermal applications.
Ceramic products that are made from highly refined natural or synthetic compositions anddesigned to have special properties are referred to as advanced ceramics. Advance ceramics can beclassified according to application as electrical, magnetic, optical, chemical, thermal, mechanical,biological, and nuclear.
Most ceramic products are clay-based and are made from a single clay or one or more claysmixed with mineral modifiers such as quartz and feldspar. The types of commercial clays used forceramics are primarily kaolin and ball clay.
2.2 PROCESS DESCRIPTION1,3-5
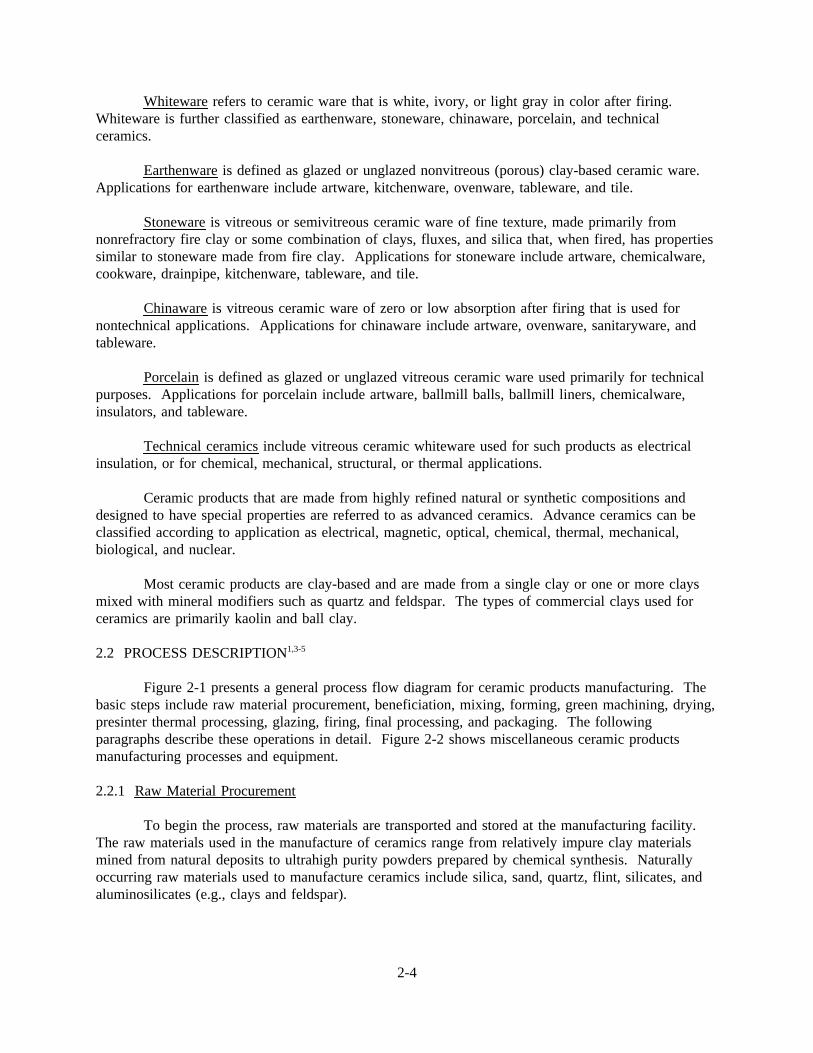
Figure 2-1 presents a general process flow diagram for ceramic products manufacturing. Thebasic steps include raw material procurement, beneficiation, mixing, forming, green machining, drying,presinter thermal processing, glazing, firing, final processing, and packaging. The followingparagraphs describe these operations in detail. Figure 2-2 shows miscellaneous ceramic productsmanufacturing processes and equipment.
2.2.1 Raw Material Procurement
To begin the process, raw materials are transported and stored at the manufacturing facility.The raw materials used in the manufacture of ceramics range from relatively impure clay materialsmined from natural deposits to ultrahigh purity powders prepared by chemical synthesis. Naturallyoccurring raw materials used to manufacture ceramics include silica, sand, quartz, flint, silicates, andaluminosilicates (e.g., clays and feldspar).
2-4
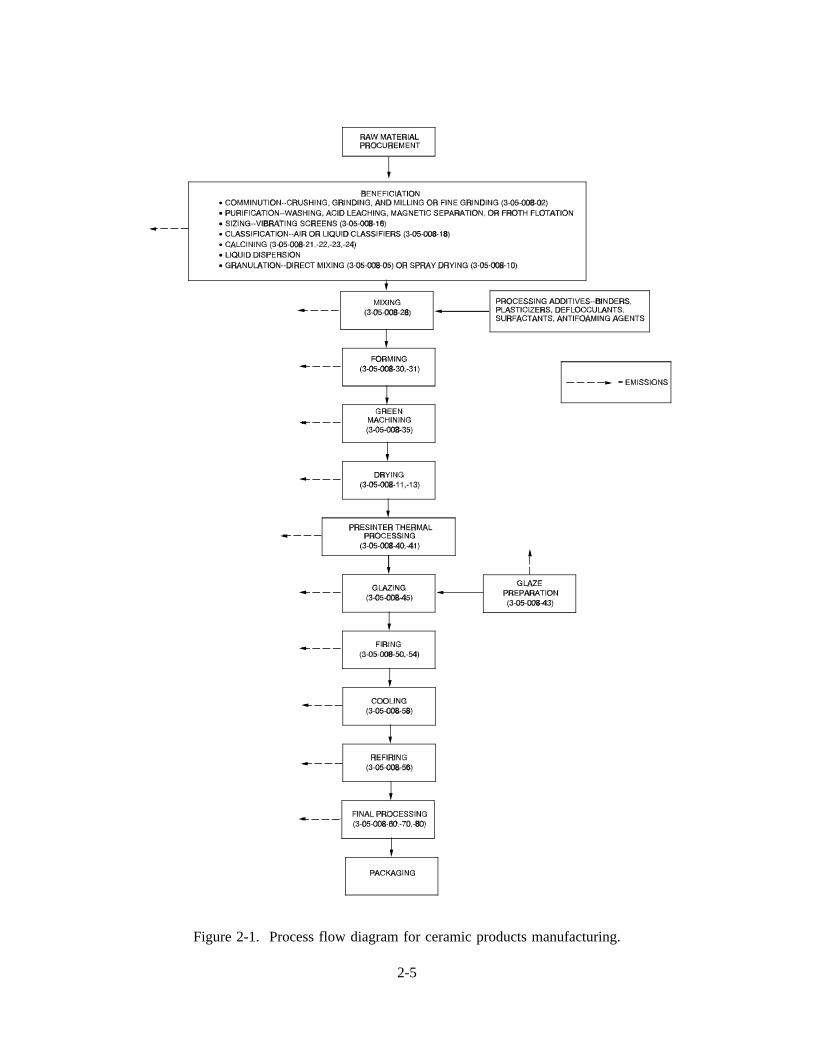
Figure 2-1. Process flow diagram for ceramic products manufacturing.
2-5
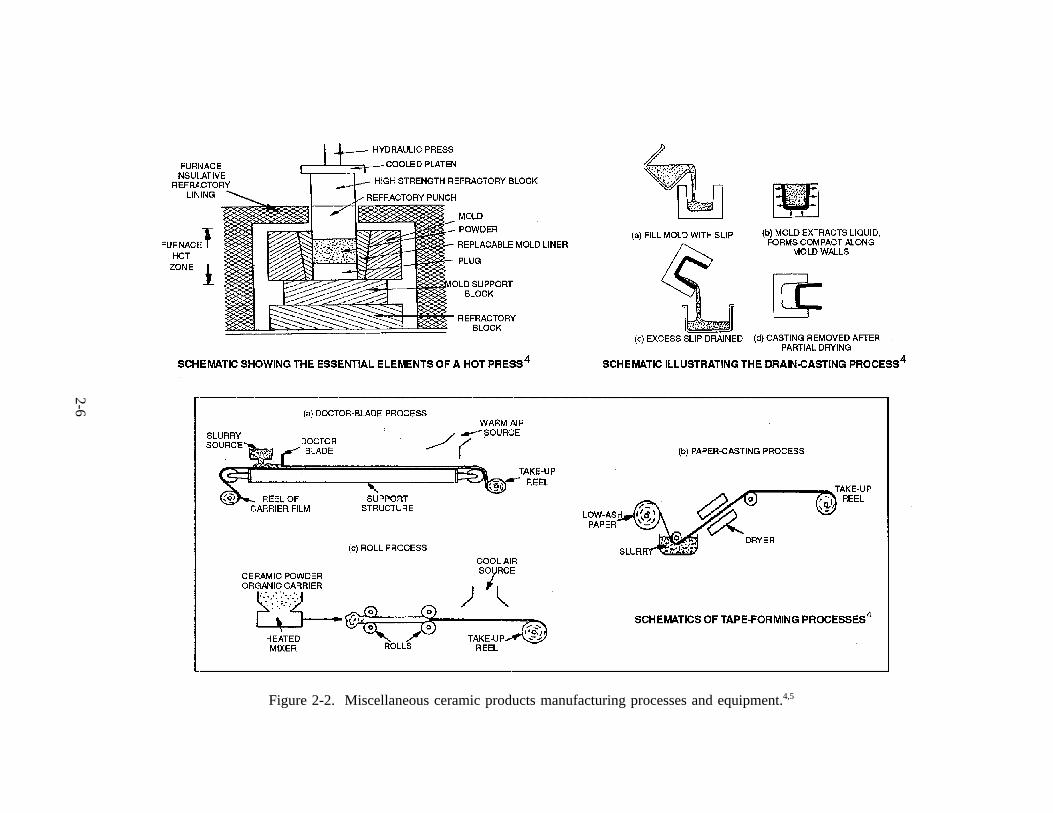
Figure 2-2. Miscellaneous ceramic products manufacturing processes and equipment.4,5
2-6
Figure 2-2. (continued)
2-7
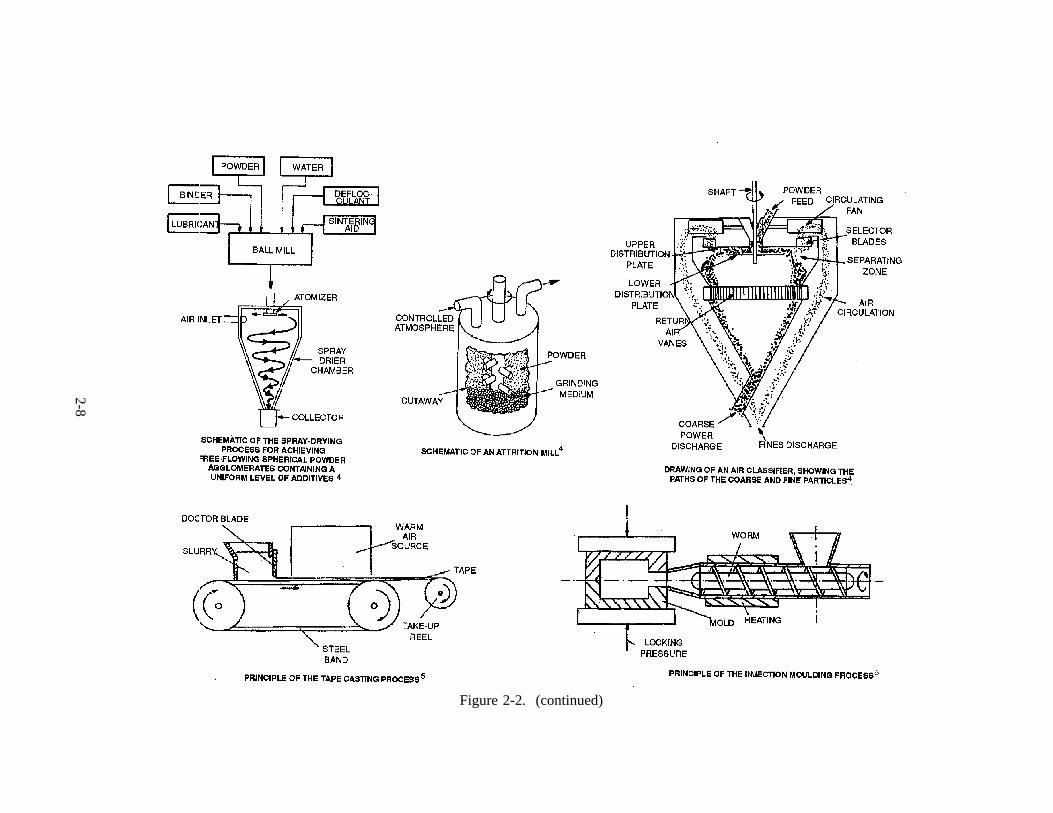
Figure 2-2. (continued)
2-8
2.2.2 Beneficiation
The next step in the process is beneficiation. Although chemically synthesized ceramicpowders also require some beneficiation, the focus of this discussion is on the processes forbeneficiating naturally occurring raw materials. The basic beneficiation processes includecomminution, purification, sizing, classification, calcination, liquid dispersion, and granulation.Naturally occurring raw materials often undergo some beneficiation at the mining site or at anintermediate processing facility prior to being transported to the ceramic manufacturing facility.
Comminution entails reducing the particle size of the raw material by crushing, grinding, andmilling or fine grinding. The purpose of comminution is to liberate impurities, break up aggregates,modify particle morphology and size distribution, facilitate mixing and forming, and produce a morereactive material for sintering. Primary crushing generally reduces material up to 0.3 meter (m)(1 foot [ft]) in diameter down to 1 centimeter (cm) (0.40 inch [in.]) in diameter. Secondary crushingreduces particle size down to approximately 1 millimeter (mm) (0.04 in.) in diameter. Fine grindingor milling reduces the particle size down to as low as 1.0 micrometer (µm) (4 x 10⁻⁵ in.) in diameter.Ball mills are the most commonly used piece of equipment for milling. However, vibratory mills,attrition mills, and fluid energy mills also are used. Ball mills consist of closed containers that arefilled with grinding media and rotated to induce a cascading action of the media. Attrition mills arefixed, closed containers filled with grinding media that is agitated by rotating arms. Vibratory millsconsist of fixed containers lined with a flexible material and filled with grinding media that is vibrated.Fluid energy mills uses a high velocity fluid such as air, water, or superheated steam to cause thematerial particles to impact one another. Crushing and grinding typically are dry processes; millingmay be wet or dry processes. In wet milling, water or alcohol are commonly used as the millingliquid.
Several procedures are used to purify the ceramic material. Water soluble impurities can beremoved by washing with deionized or distilled water and filtering, and organic solvents may be usedfor removing water-insoluble impurities. Acid leaching is sometimes employed to remove metalcontaminants. Magnetic separation is used to extract magnetic impurities from either dry powders orwet slurries. Froth flotation also is used to separate undesirable materials.
Sizing and classification separate the material into size ranges. Sizing is most oftenaccomplished using fixed or vibrating screens. Dry screening can be used to sizes down to 44 µm(0.0017 in., 325 mesh). Dry forced-air sieving and sonic sizing can be used to size dry powders downto 37 µm (0.0015 in., 400 mesh), and wet sieving can be used for particles down to 25 µm(0.00098 in., 500 mesh). Classification processes use differences in how particles settle in a liquid(elutriation) or moving gas stream to separate coarse and fine fractions of ceramic powders. Airclassifiers generally are effective in the range of 420 µm to 37 µm (0.0165 to 0.0015 in., 40 to400 mesh). However, special air classifiers are available for isolating particles down to 10 µm(0.00039 in.).
Calcining consists of heating a ceramic material to a temperature well below its melting pointto liberate undesirable gases or other material and to bring about structural transformation to producethe desired composition and phase product. Calcining typically is carried out in rotary calciners,heated fluidized beds, or by heating a static bed of ceramic powder in a refractory crucible.
2-9
Liquid dispersion of ceramic powders sometimes is used to make slurries. Slurry processingfacilitates mixing and minimizes particle agglomeration. The primary disadvantage of slurryprocessing is that the liquid must be removed prior to firing the ceramic.
Dry powders often are granulated to improve flow, handling, packing, and compaction.Granulation is accomplished by direct mixing, which consists of introducing a binder solution duringpowder mixing, or by spray drying. In spray drying, the ceramic powder in the form of a slurry isatomized by means of a pressure nozzle or rotary atomizer and sprayed toward the top of the dryingchamber. A descending stream of heated air flowing countercurrent to the spray dries the slurry asdense, homogeneous, spherical granules, which are collected at the base of the dryer. Spray dryersgenerally are gas-fired and operate at temperatures of 110° to 130°C (230° to 270°F).
2.2.3 Mixing
The purpose of mixing or blunging is to combine the constituents of a ceramic powder toproduce a more chemically and physically homogenous material for forming. Pug mills often are usedfor mixing ceramic materials. Several processing aids may be added to the ceramic mix during themixing stage. Binders and plasticizers are used in dry powder and plastic forming; in slurryprocessing, deflocculants, surfactants, and antifoaming agents are added to improve processing.Liquids also are added in plastic and slurry processing.
Binders are polymers or colloids that are used to impart strength to green or unfired ceramicbodies. For dry forming and extrusion, binders amount to 3 percent by weight of the ceramic mixture.Some examples of binders are polyvinyl alcohol and polyethylene glycol.
Plasticizers and lubricants are used with some types of binders. Plasticizers increase theflexibility of the ceramic mix. Examples include adsorbed water, ethylene glycol, stearic acid, oleicacid, and glycerine. Lubricants, such as stearic acid and oleic acid, lower frictional forces betweenparticles and reduce wear on equipment.
Water is the most commonly used liquid in plastic and slurry processing. Organic liquids suchas alcohols may also be used in some cases. Deflocculants also are used in slurry processing toimprove dispersion and dispersion stability. Some examples of deflocculants are monovalent cationsfor clay-water slurries or slips, ammonium salts for polar liquids, acids and bases to control pH, andoleic acid, tartaric acid, benzoic acid, stearic acid, and trichloroacetic acid for oxide powders innonpolar liquids. Surfactants are used in slurry processing to aid dispersion, and antifoams are used toremove trapped gas bubbles from the slurry.
2.2.4 Forming
In the forming step, dry powders, plastic bodies, pastes, or slurries are consolidated andmolded to produce a cohesive body of the desired shape and size. Dry forming consists of thesimultaneous compacting and shaping of dry ceramic powders in a rigid die or flexible mold. Dryforming can be accomplished by dry pressing, isostatic compaction, and vibratory compaction. In drypressing, which is used for forming products that are of relatively uniform thickness and axiallysymmetric, ceramic powder with a moisture content of 5 to 15 percent is compacted between plungersin a die cavity. In isostatic compaction, ceramic powder with a moisture content of 0 to 15 percent isplaced inside a flexible mold, which is then deaired, sealed, and placed in a gas- or liquid-filledpressurized chamber. Isostatic compaction is used to produce complex shapes such as spark plugs and
2-10
larger shapes that are not easily dry pressed. Vibratory compaction is used for producing irregularshapes from ungranulated powders.
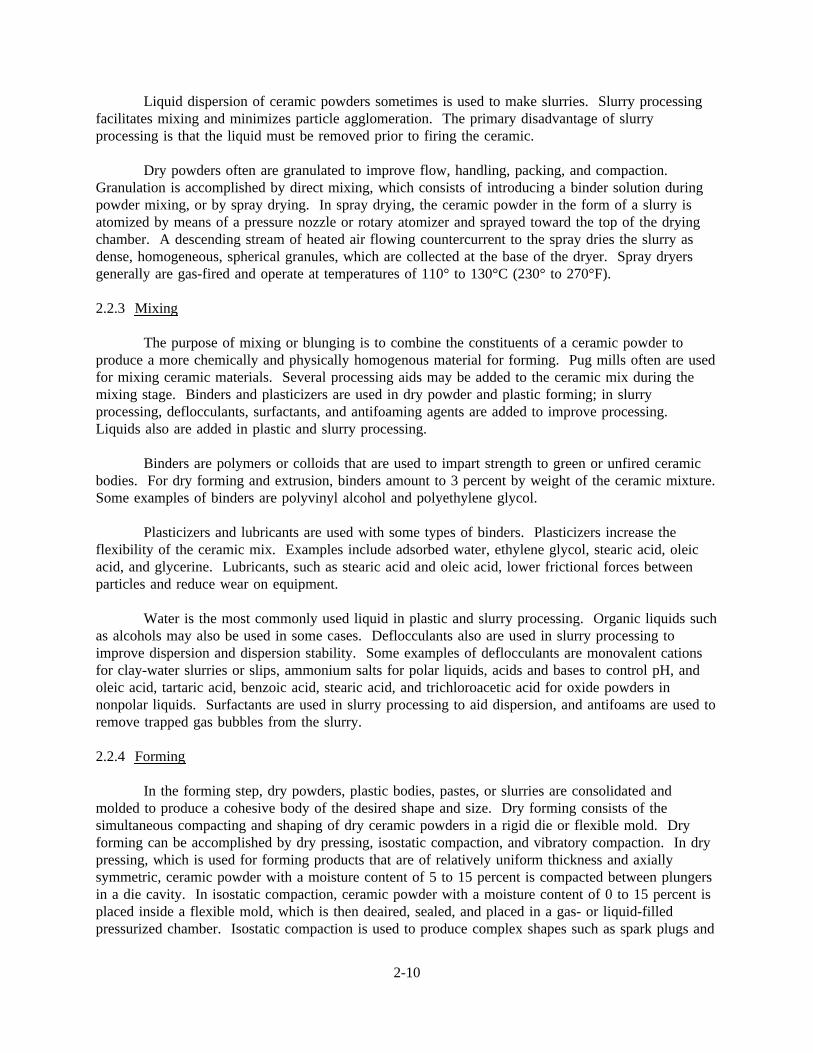
Plastic molding is accomplished by extrusion, jiggering, or powder injection molding.Extrusion, which generally is preceded by mixing in a pugmill and deairing in a vacuum chamber,consists of consolidating plastic material with a moisture content of 12 to 20 percent, forcing itthrough a forming die, and ejecting the formed body. Extrusion is used in manufacturing structuralclay products and some refractory products. Jiggering involves shaping a plastic clay body on aspinning porous plaster mold using a water mist or steam lubricated shaping tool. Jiggering is widelyused in the manufacture of small, simple, axially symmetrical whiteware ceramic such as cookware,fine china, and electrical porcelain. In powder injection molding, a hot ceramic and binder mixture isinjected into a cooler die, extracted, and deburred. This method is used for making small complexshapes.
Paste forming consists of applying a thick film of ceramic paste on a substrate. Ceramicpastes are used for decorating ceramic tableware, and forming capacitors and dielectric layers on rigidsubstrates for microelectronics.
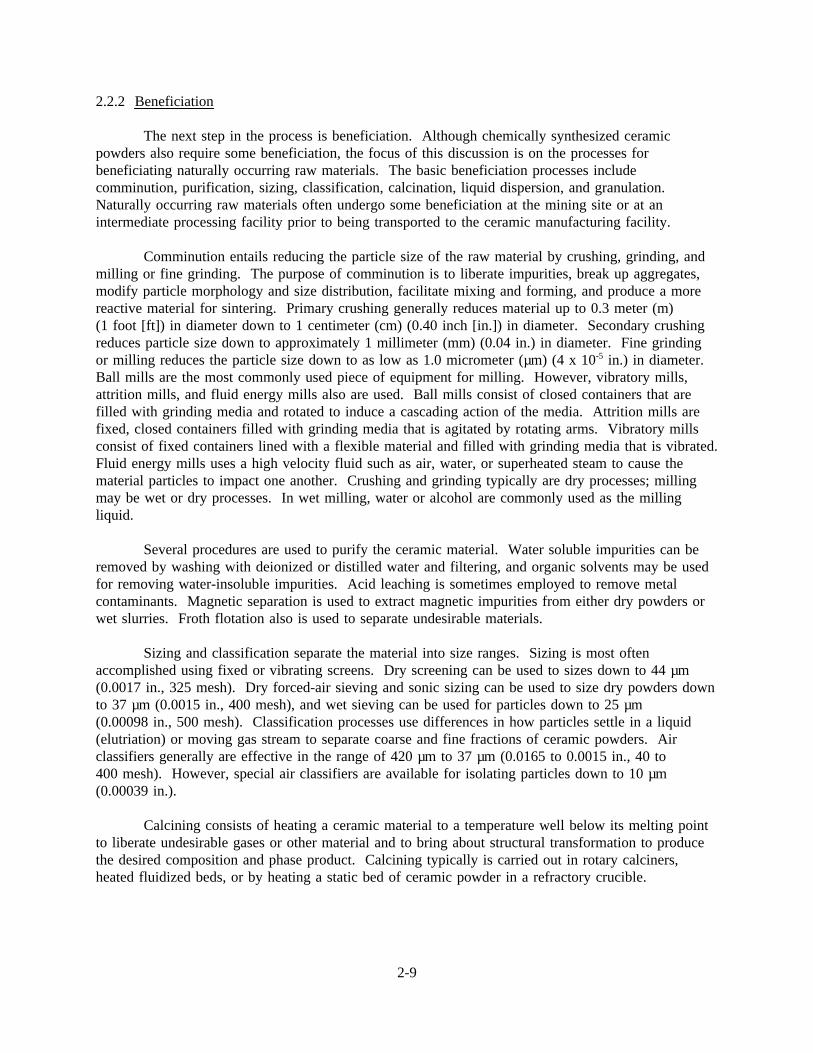
Slurry forming of ceramics generally is accomplished using slip casting, gelcasting, or tapecasting. In slip casting, a ceramic slurry, which has a moisture content of 20 to 35 percent, is pouredinto a porous mold. Capillary suction of the mold draws the liquid from the mold, therebyconsolidating the cast ceramic material. After a fixed time, the excess slurry is drained, and the cast isdried. The casting rate can be increased by vacuum casting, heating, or centrifugal casting. Slipcasting is widely used in the manufacture of sinks and other sanitaryware, figurines, porous thermalinsulation, fine china, and structural ceramics with complex shapes. Gelcasting uses in situpolymerization of organic monomers to produce a gel that binds ceramic particles together intocomplex shapes such as turbine rotors. Tape casting consists of forming a thin film of ceramic slurryof controlled thickness onto a support surface using a knife edge. Tape casting is used to produce thinceramic sheets or tape, which can be cut and stacked to form multilayer ceramics for capacitors anddielectric insulator substrates.
2.2.5 Green Machining
After forming, the ceramic shape often is machined to eliminate rough surfaces and seams orto modify the shape. The methods used to machine green ceramics include surface grinding to smoothsurfaces, blanking and punching to cut the shape and create holes or cavities, and laminating formultilayer ceramics.
2.2.6 Drying
After forming, ceramics must be dried. Drying must be carefully controlled to strike a balancebetween minimizing drying time and avoiding differential shrinkage, warping, and distortion. Themost commonly used method of drying ceramics is by convection, in which heated air is circulatedaround the ceramics. Air drying often is performed in tunnel kilns, which are long furnaces withdrying, firing, and cooling zones. In tunnel kilns, the drying zone typically uses heat recovered fromthe cooling zone. Periodic kilns or dryers operating in batch mode also are used. Convection dryingalso is carried out in divided tunnel dryers, which include separate sections with independenttemperature and humidity controls. An alternative to air drying is radiation drying in whichmicrowave or infrared radiation is used to enhance drying.
2-11
2.2.7 Presinter Thermal Processing
Prior to firing, ceramics are often heat-treated at temperatures well below firing temperatures.The purpose of this thermal processing is to provide additional drying, to vaporize or decomposeorganic additives and other impurities, and to remove residual, crystalline, and chemically boundwater. Presinter thermal processing can be applied as a separate step, which is referred to as bisquefiring, or by gradually raising and holding the temperature in several stages.
Organic "burnout" typically occurs at a temperature of approximately half the firingtemperature. Removal of residual liquid is attained at a temperature of approximately 200°C (392°F),water of crystallization is liberated at approximately 700°C (1290°F), and chemically bound water iseliminated at approximately 1000°C (1830°F).
2.2.8 Glazing
For traditional ceramics, glaze coatings often are applied to dried or bisque-fired ceramic wareprior to firing. Glazes, which resemble glass in structure and texture, provide a smooth, shiny surfacethat seals the ceramic body. Glazes consist primarily of oxides and can be classified as raw glazes orfrit glazes. In raw glazes, the oxides are in the form of minerals or compounds that melt readily andact as solvents for the other ingredients. Some of the more commonly used raw materials for glazesare quartz, feldspars, carbonates, borates, and zircon. A frit is a prereacted glass. Frit manufacturingis addressed in AP-42 Section 11.14.
To prepare glazes, the raw materials are ground in a ball mill or attrition mill. Glazesgenerally are applied by spraying or dipping. Depending on their constituents, glazes mature attemperatures of 600° to 1500°C (1110° to 2730°F). Table 2-4 lists the compositions of severalcommercial glazes.
2.2.9 Firing
Firing is the process by which ceramics are thermally consolidated into a dense, cohesive bodycomposed of fine, uniform grains. This process also is referred to as sintering or densification. Thecharacteristics of unfired ceramics that most affect firing are particle size, density, and particle shape.In general: (1) ceramics with fine particle size fire quickly and require lower firing temperatures;(2) dense unfired ceramics fire quickly and remain dense after firing with lower shrinkage; and(3) irregular shaped ceramics fire quickly. Other material properties that affect firing include materialsurface energy, diffusion coefficients, fluid viscosity, and bond strength.
Parameters that affect firing include firing temperature, time, pressure, and atmosphere.Ceramics generally are fired at 50 to 75 percent of the absolute melting temperature of the material.Table 2-5 lists typical firing temperatures for several ceramic products. Firing occurs faster at highertemperatures, but so does coarsening. A short firing time results in a product that is porous and has alow density; short to intermediate firing time results in fine-grained (i.e., having particles not largerthan 0.2 millimeters), high-strength products; and long firing times result in a coarse-grained productsthat are more creep resistant. Applying pressure decreases firing time and makes it possible to firematerials that are difficult to fire using conventional methods. Oxidizing or inert atmospheres are usedto fire oxide ceramics to avoid reducing transition metals and degrading the finish of the product.
2-12
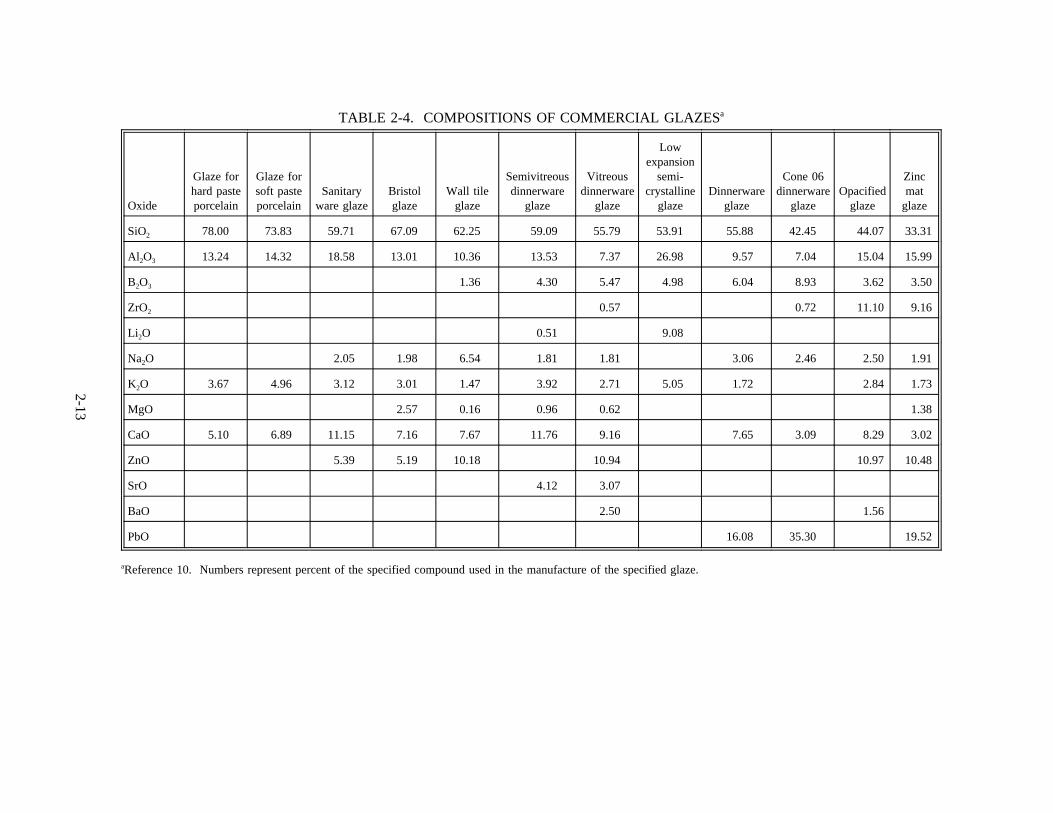
TABLE 2-4. COMPOSITIONS OF COMMERCIAL GLAZESa
Oxide
Glaze forhard pasteporcelain
Glaze forsoft pasteporcelain
Sanitaryware glaze
Bristolglaze
Wall tileglaze
Semivitreousdinnerware
glaze
Vitreousdinnerware
glaze
Lowexpansion
semi-crystalline
glazeDinnerware
glaze
Cone 06dinnerware
glazeOpacified
glaze
Zincmat
glaze
SiO2 78.00 73.83 59.71 67.09 62.25 59.09 55.79 53.91 55.88 42.45 44.07 33.31
Al2O3 13.24 14.32 18.58 13.01 10.36 13.53 7.37 26.98 9.57 7.04 15.04 15.99
B2O3 1.36 4.30 5.47 4.98 6.04 8.93 3.62 3.50
ZrO2 0.57 0.72 11.10 9.16
Li2O 0.51 9.08
Na2O 2.05 1.98 6.54 1.81 1.81 3.06 2.46 2.50 1.91
K2O 3.67 4.96 3.12 3.01 1.47 3.92 2.71 5.05 1.72 2.84 1.73
MgO 2.57 0.16 0.96 0.62 1.38
CaO 5.10 6.89 11.15 7.16 7.67 11.76 9.16 7.65 3.09 8.29 3.02
ZnO 5.39 5.19 10.18 10.94 10.97 10.48
SrO 4.12 3.07
BaO 2.50 1.56
PbO 16.08 35.30 19.52
aReference 10. Numbers represent percent of the specified compound used in the manufacture of the specified glaze.
2-13
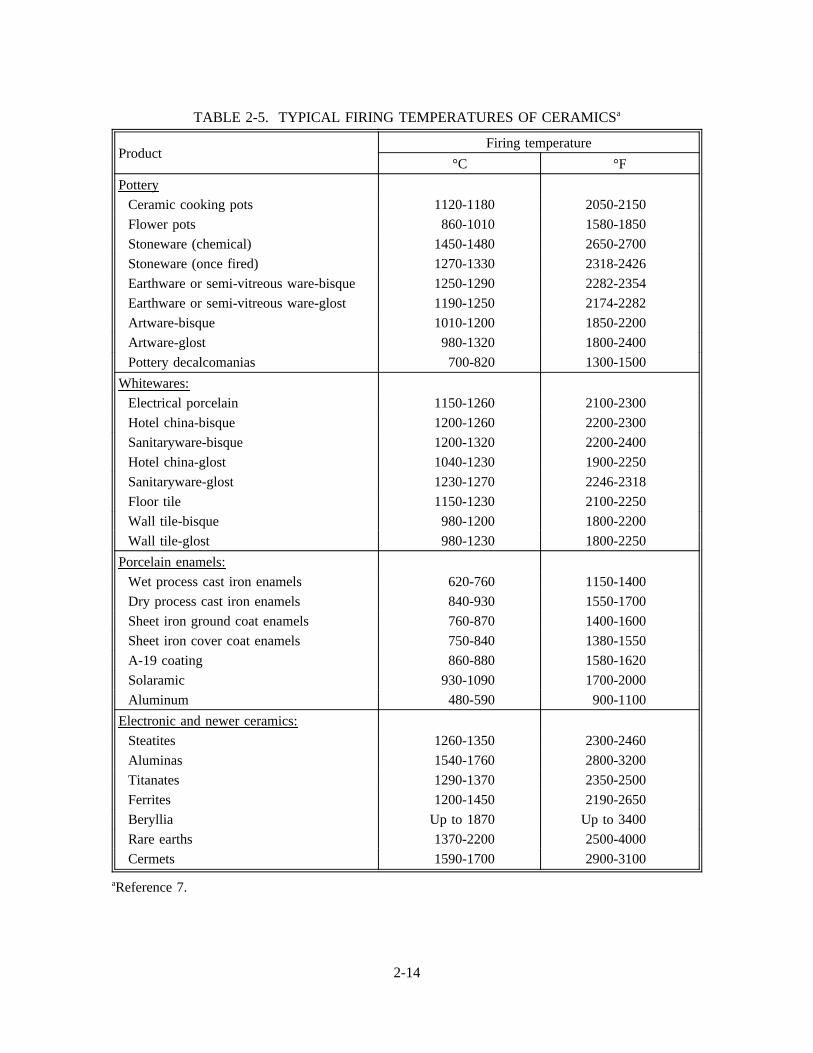
TABLE 2-5. TYPICAL FIRING TEMPERATURES OF CERAMICSa
ProductFiring temperature
°C °F
Pottery
Ceramic cooking pots 1120-1180 2050-2150
Flower pots 860-1010 1580-1850
Stoneware (chemical) 1450-1480 2650-2700
Stoneware (once fired) 1270-1330 2318-2426
Earthware or semi-vitreous ware-bisque 1250-1290 2282-2354
Earthware or semi-vitreous ware-glost 1190-1250 2174-2282
Artware-bisque 1010-1200 1850-2200
Artware-glost 980-1320 1800-2400
Pottery decalcomanias 700-820 1300-1500
Whitewares:
Electrical porcelain 1150-1260 2100-2300
Hotel china-bisque 1200-1260 2200-2300
Sanitaryware-bisque 1200-1320 2200-2400
Hotel china-glost 1040-1230 1900-2250
Sanitaryware-glost 1230-1270 2246-2318
Floor tile 1150-1230 2100-2250
Wall tile-bisque 980-1200 1800-2200
Wall tile-glost 980-1230 1800-2250
Porcelain enamels:
Wet process cast iron enamels 620-760 1150-1400
Dry process cast iron enamels 840-930 1550-1700
Sheet iron ground coat enamels 760-870 1400-1600
Sheet iron cover coat enamels 750-840 1380-1550
A-19 coating 860-880 1580-1620
Solaramic 930-1090 1700-2000
Aluminum 480-590 900-1100
Electronic and newer ceramics:
Steatites 1260-1350 2300-2460
Aluminas 1540-1760 2800-3200
Titanates 1290-1370 2350-2500
Ferrites 1200-1450 2190-2650
Beryllia Up to 1870 Up to 3400
Rare earths 1370-2200 2500-4000
Cermets 1590-1700 2900-3100
aReference 7.
2-14
In addition to conventional firing, other methods used include pressure firing, hot forging,plasma firing, microwave firing, and infrared firing. The following paragraphs describe conventionaland pressure firing, which are the methods used most often.
Conventional firing is accomplished by heating the green ceramic to approximately two-thirdsof the melting point of the material at ambient pressure and holding it for a specified time in a kiln.Kilns can be classified as periodic (intermittent) or tunnel (continuous). Periodic kilns are heated andcooled according to prescribed schedules. The heat for periodic kilns generally is provided byelectrical element or by firing with gas or oil. Periodic kilns can be classified as shuttle kilns, inwhich the kiln is fixed and the ceramics loaded on rails are run into the kiln for firing, and elevatorkilns, in which the kiln is lowered onto the kiln car or the kiln car is lowered into the kiln for firing.
Tunnel kilns are long refractory chambers with constant temperature zones through which kilncars are passed to provide the specified time-temperature cycle. Tunnel kilns generally have separatezones for cooling, firing, and preheating or drying. The kilns may be designed so that (1) the airheated in the cooling zone moves into the firing zone and the combustion gases in the firing zone areconveyed to the preheat/drying zone then exhausted, or (2) the air heated in the cooling zone isconveyed to the preheat/drying zone and the firing zone gases are exhausted separately. The mostcommonly used tunnel kiln design is the roller hearth (roller) kiln. In conventional firing, tunnel kilnsgenerally are fired with gas, oil, coal, or wood.
Advanced ceramics often are fired in electric resistance-heated furnaces with controlledatmospheres. For some products, separate furnaces may be needed to eliminate organic lubricants andbinders prior to firing.
Ceramic products also are manufactured by pressure firing, which is similar to the formingprocess of dry pressing except that the pressing is conducted at the firing temperature. The applicationof pressure enhances the densification of the ceramic during firing. Because of its higher costs,pressure firing is usually reserved for manufacturing ceramics that are difficult to fire to high densityby conventional firing. In hot pressing, hydraulic presses and graphite dies commonly are used. Inhot isostatic pressing, the pressing medium typically is a gas, such as argon or nitrogen.
2.2.10 Final Processing
Following firing, some ceramic products are processed further to enhance their characteristicsor to meet dimensional tolerances. Ceramics can be machined by abrasive grinding, chemicalpolishing, electrical discharge machining, or laser machining. Annealing at high temperature, followedby gradual cooling can relieve internal stresses within the ceramic and surface stresses due tomachining. Ceramics that are oxygen sensitive often are annealed in a controlled atmosphere toachieve the stoichiometry that optimizes properties. Oxidation can increase the strength of certain hot-pressed ceramics. Flame polishing is sometimes used to reduce surface flaws. In addition, surfacecoatings are applied to many fired ceramics. Surface coatings are applied to traditional clay ceramicsto create a stronger, impermeable surface and for decoration. Coatings also may be applied to improvestrength and resistance to abrasion and corrosion. Coatings can be applied dry, as slurries, byspraying, or by vapor deposition.
2-15
2.3 EMISSIONS1,3-5,12-13
The primary pollutants associated with raw material beneficiation are particulate matter (PM)and PM less than 10µm in aerodynamic diameter (PM-10). Particulate matter is emitted from rawmaterial crushing, grinding, screening, classifying, handling, transfer, and storage. In addition, rawmaterial calciners emit filterable and condensible PM, which may include metals and other inorganicpollutants. In addition, calciners emit products of combustion such as nitrogen oxides (NOx), sulfuroxides (SOx), carbon monoxide (CO), carbon dioxide (CO2), and volatile organic compounds (VOC).Emissions of SOx are a function of the sulfur content of the fuel used to fire the calciners and thesulfur content of the raw materials used to manufacture ceramics. Emissions of VOC result fromincomplete combustion and volatilization of the organic material in the raw material. Otherbeneficiation processes that are associated with emissions include acid leaching and granulation.Emissions of hydrochloric acid (HCl) or other acids may arise from leaching. In addition, products ofcombustion are emitted from spray dryers used for granulation.
Mixing generally is a wet process. However, VOC emissions from this step may arise fromthe volatilization of binders, plasticizers, and lubricants. Forming generally is performed in sealedcontainers and often is a wet process; emissions from this step in the process are likely to benegligible. For ceramic bodies that are dry-formed, PM is likely to be emitted from grinding,punching, and other green machining activities.
Particulate matter emissions consisting of metal and mineral oxides also arise from glazepreparation, which includes mixing and grinding. Emissions of PM from glaze application also arelikely, if the glaze is applied by spraying.
Emissions associated from green ceramic heat treating processes, which include drying,presinter thermal processing, and firing, include combustion products and filterable and condensiblePM. Particulate matter emissions consist, in part, of metals and the inorganic minerals associated withthe raw materials. Emissions of the products of combustion are a function of fuel type, raw materialconstituents, process temperature, and other operating parameters.
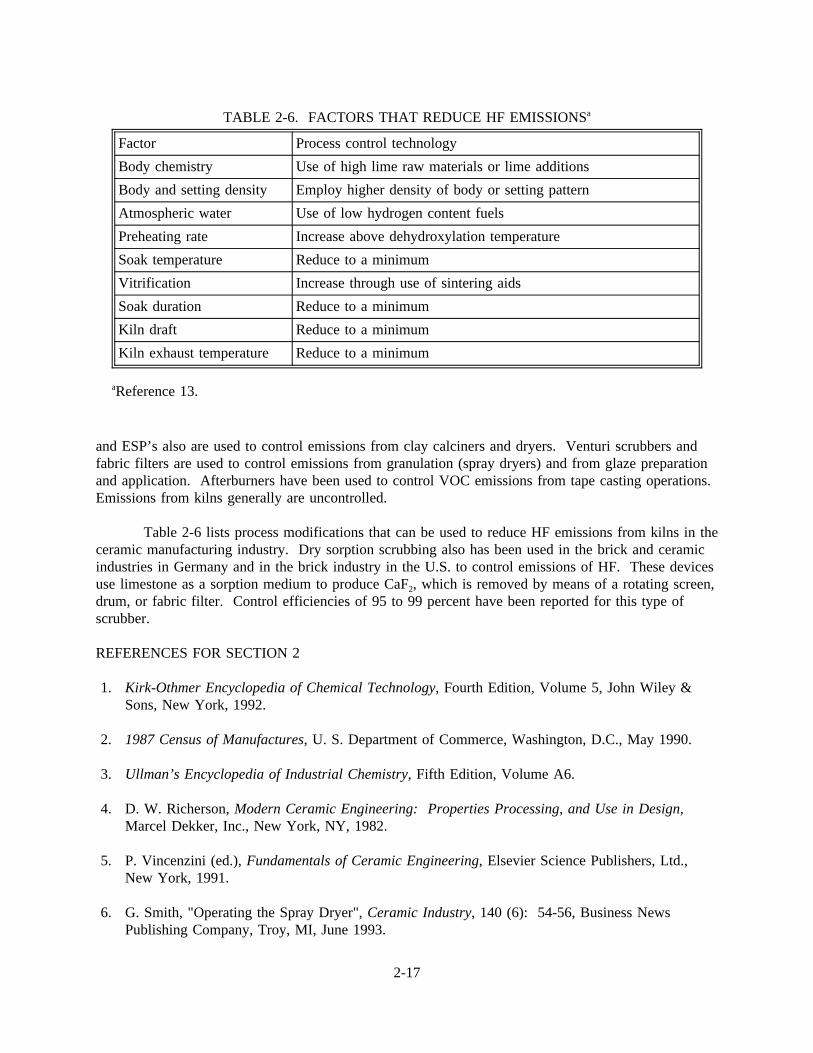
Emissions of fluorine compounds also are associated with firing. Fluorine is present inceramic raw materials in the range of 0.01 to 0.2 percent. As the temperature of the green ceramicbodies reaches 500° to 600°C (930° to 1110°F), the fluorine in the raw material forms hydrogenfluoride (HF) and other fluorine compounds such as silicon tetrafluoride. Much of the fluorine isreleased as HF. However, if lime is present in the ceramic body, HF reacts with the lime to formcalcium fluoride (CaF2), thereby reducing potential HF emissions. Other factors that reduce fluorineemissions from ceramic kilns are listed in Table 2-6.
Other emission sources associated with ceramics manufacturing include final processingoperations and fugitive dust sources. The final processing steps include grinding and polishing, whichcan emit PM and PM-10, and surface coating, annealing, and chemical treatment, which can emitVOC. Fugitive dust sources, which consist of vehicular traffic, wind erosion of storage piles, andmaterials handling and transfer, emit PM and PM-10.
2.4 EMISSION CONTROL TECHNOLOGY12-19
Several techniques have been used to control PM emissions from the mechanical processing ofceramic raw materials and finished products. Fabric filters are the commonly used control device, butwet scrubbers and electrostatic precipitators (ESP’s) also have been used. Fabric filters, wet scrubbers,
2-16
and ESP’s also are used to control emissions from clay calciners and dryers. Venturi scrubbers and
TABLE 2-6. FACTORS THAT REDUCE HF EMISSIONSa
Factor Process control technology
Body chemistry Use of high lime raw materials or lime additions
Body and setting density Employ higher density of body or setting pattern
Atmospheric water Use of low hydrogen content fuels
Preheating rate Increase above dehydroxylation temperature
Soak temperature Reduce to a minimum
Vitrification Increase through use of sintering aids
Soak duration Reduce to a minimum
Kiln draft Reduce to a minimum
Kiln exhaust temperature Reduce to a minimum
aReference 13.
fabric filters are used to control emissions from granulation (spray dryers) and from glaze preparationand application. Afterburners have been used to control VOC emissions from tape casting operations.Emissions from kilns generally are uncontrolled.
Table 2-6 lists process modifications that can be used to reduce HF emissions from kilns in theceramic manufacturing industry. Dry sorption scrubbing also has been used in the brick and ceramicindustries in Germany and in the brick industry in the U.S. to control emissions of HF. These devicesuse limestone as a sorption medium to produce CaF2, which is removed by means of a rotating screen,drum, or fabric filter. Control efficiencies of 95 to 99 percent have been reported for this type ofscrubber.
REFERENCES FOR SECTION 2
1. Kirk-Othmer Encyclopedia of Chemical Technology, Fourth Edition, Volume 5, John Wiley &Sons, New York, 1992.
2. 1987 Census of Manufactures, U. S. Department of Commerce, Washington, D.C., May 1990.
3. Ullman’s Encyclopedia of Industrial Chemistry, Fifth Edition, Volume A6.
4. D. W. Richerson, Modern Ceramic Engineering: Properties Processing, and Use in Design,Marcel Dekker, Inc., New York, NY, 1982.
5. P. Vincenzini (ed.), Fundamentals of Ceramic Engineering, Elsevier Science Publishers, Ltd.,New York, 1991.
6. G. Smith, "Operating the Spray Dryer", Ceramic Industry, 140 (6): 54-56, Business NewsPublishing Company, Troy, MI, June 1993.
2-17
7. A. Hall, "Drying Technology for Today’s Manufacturer", Ceramic Industry, 142 (5): 30-33,Business News Publishing Company, Troy, MI, May 1994.
8. H. J. Dowdle, "Grinding Glazes: A Comparison of Milling Methods", Ceramic Industry, 141 (4):67-69, Business News Publishing Company, Troy, MI, May 1994.
9. A. H. Burgess, "Processing Trends in Tile Manufacturing", Ceramic Industry, 142 (3): 47-50,Business News Publishing Company, Troy, MI, March 1994.
10. Ceramic Source 1990-1991, Volume 6, The American Ceramic Society, Westerville, OH, 1990.
11. Ceramic Industry 1994-95 Data Book & Buyers Guide Issue, Business News PublishingCompany, Troy, MI, July 15, 1994.
12. C. Palmonari and G. Timellini, Pollutant Emission Factors for the Ceramic Floor and Wall TileIndustry, Journal of the Air Pollution Control Association, Volume 32, No. 10, Pittsburgh, PA,October 1982.
13. D. Brosnan, "Technology and Regulatory Consequences of Fluorine Emissions in CeramicManufacturing", American Ceramic Industry Bulletin, 71 (12), pp 1798-1802, The AmericanCeramic Society, Westerville, OH, December 1992.
14. Particulate Emissions Test for American Olean Tile Company, Fayette, AL, Crushing andScreening Line #1, October 15, 1991, Pensacola POC, Inc, Pensacola, FL, October 1991.
15. Particulate Emissions Test for American Olean Tile Company, Fayette, AL, Crushing andScreening Line #2, October 16, 1991, Pensacola POC, Inc, Pensacola, FL, October 1991.
16. VOC Emission Test Report for GE Ceramics Tape Casters Fume Oxidizer, Chattanooga, TN,September 13-15, 1989, IT-Air Quality Services Group, Knoxville, TN, October, 1989.
17. Exhaust Emission Sampling for Norton Company, Soddy-Daisy, TN, April 19-20, 1994, ArmstrongEnvironmental, Inc., Dallas, TX, April 1994.
18. Particulate Emission Evaluation for Steward, Inc., Chattanooga, TN, March 30, 1993, FBTEngineering and Environmental Services, Chattanooga, TN, May 1993.
19. Calciners and Dryers in the Mineral Industries--Background Information for Proposed Standards,EPA-450/3-85-025a, U. S. Environmental Protection Agency, Research Triangle Park, NCOctober 1985.
2-18
3. GENERAL DATA REVIEW AND ANALYSIS PROCEDURES
3.1 LITERATURE SEARCH AND SCREENING
Data for this investigation were obtained from a number of sources within the Office of AirQuality Planning and Standards (OAQPS) and from outside organizations. The AP-42 backgroundfiles located in the Emission Factor and Inventory Group (EFIG) files were reviewed for informationon the industry, processes, and emissions. The Factor Information and Retrieval (FIRE),Crosswalk/Air Toxic Emission Factor Data Base Management System (XATEF), and VOC/PMSpeciation Data Base Management System (SPECIATE) data bases were searched by SCC code foridentification of the potential pollutants emitted and emission factors for those pollutants. A generalsearch of the Air CHIEF CD-ROM also was conducted to supplement the information from these databases.
Information on the industry, including number of plants, plant location, and annual productioncapacities, was obtained from the Census of Manufactures and other sources. The AerometricInformation Retrieval System (AIRS) data base also was searched for data on the number of plants,plant location, and estimated annual emissions of criteria pollutants. A number of sources ofinformation were investigated specifically for emission test reports and data. A search of the TestMethod Storage and Retrieval (TSAR) data base was conducted to identify test reports for sourceswithin the ceramic products manufacturing industry. Copies of these test reports were obtained fromthe files of the Emissions, Monitoring, and Analysis Division (EMAD). The EPA library wassearched for additional test reports. Using information obtained on plant locations, State and Regionaloffices were contacted about the availability of test reports. Publications lists from the Office ofResearch and Development (ORD) and Control Technology Center (CTC) were also searched forreports on emissions from the ceramic products manufacturing industry. In addition, representativetrade associations, including the Tile Council of America, the Ceramic Manufacturers’ Association,and the American Ceramic Society, were contacted for assistance in obtaining information about theindustry and emissions.
To screen out unusable test reports, documents, and information from which emission factorscould not be developed, the following general criteria were used:
1. Emission data must be from a primary reference:
a. Source testing must be from a referenced study that does not reiterate information fromprevious studies.
b. The document must constitute the original source of test data. For example, a technicalpaper was not included if the original study was contained in the previous document. If the exactsource of the data could not be determined, the document was eliminated.
2. The referenced study should contain test results based on more than one test run. If resultsfrom only one run are presented, the emission factors must be down rated.
3. The report must contain sufficient data to evaluate the testing procedures and sourceoperating conditions (e.g., one-page reports were generally rejected).
3-1
A final set of reference materials was compiled after a thorough review of the pertinentreports, documents, and information according to these criteria.
3.2 DATA QUALITY RATING SYSTEM1
As part of the analysis of the emission data, the quantity and quality of the informationcontained in the final set of reference documents were evaluated. The following data were excludedfrom consideration:
1. Test series averages reported in units that cannot be converted to the selected reportingunits;
2. Test series representing incompatible test methods (i.e., comparison of EPA Method 5 fronthalf with EPA Method 5 front and back half);
3. Test series of controlled emissions for which the control device is not specified;
4. Test series in which the source process is not clearly identified and described; and
5. Test series in which it is not clear whether the emissions were measured before or after thecontrol device.
Test data sets that were not excluded were assigned a quality rating. The rating system usedwas that specified by EFIG for preparing AP-42 sections. The data were rated as follows:
A—Multiple tests that were performed on the same source using sound methodology andreported in enough detail for adequate validation. These tests do not necessarily conform to themethodology specified in EPA reference test methods, although these methods were used as a guidefor the methodology actually used.
B—Tests that were performed by a generally sound methodology but lack enough detail foradequate validation.
C—Tests that were based on an untested or new methodology or that lacked a significantamount of background data.
D—Tests that were based on a generally unacceptable method but may provide an order-of-magnitude value for the source.
The following criteria were used to evaluate source test reports for sound methodology andadequate detail:
1. Source operation. The manner in which the source was operated is well documented in thereport. The source was operating within typical parameters during the test.
2. Sampling procedures. The sampling procedures conformed to a generally acceptablemethodology. If actual procedures deviated from accepted methods, the deviations are welldocumented. When this occurred, an evaluation was made of the extent to which such alternativeprocedures could influence the test results.
3-2
3. Sampling and process data. Adequate sampling and process data are documented in thereport, and any variations in the sampling and process operation are noted. If a large spread betweentest results cannot be explained by information contained in the test report, the data are suspect and aregiven a lower rating.
4. Analysis and calculations. The test reports contain original raw data sheets. Thenomenclature and equations used were compared to those (if any) specified by EPA to establishequivalency. The depth of review of the calculations was dictated by the reviewer’s confidence in theability and conscientiousness of the tester, which in turn was based on factors such as consistency ofresults and completeness of other areas of the test report.
3.3 EMISSION FACTOR QUALITY RATING SYSTEM1
The quality of the emission factors developed from analysis of the test data was rated usingthe following general criteria:
A—Excellent: Developed only from A-rated test data taken from many randomly chosenfacilities in the industry population. The source category is specific enough so that variability withinthe source category population may be minimized.
B—Above average: Developed only from A-rated test data from a reasonable number offacilities. Although no specific bias is evident, it is not clear if the facilities tested represent a randomsample of the industries. The source category is specific enough so that variability within the sourcecategory population may be minimized.
C—Average: Developed only from A- and B-rated test data from a reasonable number offacilities. Although no specific bias is evident, it is not clear if the facilities tested represent a randomsample of the industry. In addition, the source category is specific enough so that variability withinthe source category population may be minimized.
D—Below average: The emission factor was developed only from A- and B-rated test datafrom a small number of facilities, and there is reason to suspect that these facilities do not represent arandom sample of the industry. There also may be evidence of variability within the source categorypopulation. Limitations on the use of the emission factor are noted in the emission factor table.
E—Poor: The emission factor was developed from C- and D-rated test data, and there isreason to suspect that the facilities tested do not represent a random sample of the industry. Therealso may be evidence of variability within the source category population. Limitations on the use ofthese factors are footnoted.
The use of these criteria is somewhat subjective and depends to an extent upon the individualreviewer. Details of the rating of each candidate emission factor are provided in Section 4.
REFERENCE FOR SECTION 3
1. Technical Procedures for Developing AP-42 Emission Factors and Preparing AP-42 Sections,EPA-454/B-93-050, Office of Air Quality Planning and Standards, U. S. Environmental ProtectionAgency, Research Triangle Park, NC, October 1993.
3-3
4. AP-42 SECTION DEVELOPMENT
4.1 INTRODUCTION
This section describes how the revised AP-42 section on ceramic products manufacturing wasdeveloped. First, descriptions of data sets reviewed for this revision are presented, followed by adiscussion of how candidate emission factors were developed from the data. Finally, the proposedchanges to the existing AP-42 section on ceramic clay manufacturing are summarized.
4.2 REVIEW OF SPECIFIC DATA SETS
A total of 33 references were obtained for use in developing emission factors for ceramicproducts manufacturing. References 14, 29, and 30 through 33 were not used for emission factordevelopment. Reference 14 was not used because the process tested was a plastics manufacturingprocess rather than a ceramics process. Reference 29 was not used because it does not contain aprocess description or process data, and Reference 30 does not contain any original test data.References 31 through 33 were not used because they do not contain sufficient process data foremission factor development.
4.2.1 Reference 1
This reference consists of a technical journal article and includes a brief description of ceramicfloor and wall tile manufacturing, a discussion of emissions and controls, and a table of emissionfactors for several emission sources associated with the industry.
Emission factors are presented for uncontrolled and controlled emissions of PM, fluorine, andlead from raw material processing, glaze milling, and ceramic tile bisque-firing and firing. The articledoes not identify the type of control device on which the controlled emission factors are based.However, typical control devices are identified by source, and it is assumed that the controlled factorsrepresent emissions controlled with the typical control devices listed.
The article states that the emission factors are based on the results of "thousands ofmeasurements" over a 7-year period, but does not provide details on specific emission tests. Thefactors are presented in units of grams emitted per square meter (g/m2) of tile produced; the textexplains that 1 m2 of tile weighs 20 kilograms (kg). Using this conversion, the emission factors werecalculated in units of kg per megagram (kg/Mg) and pounds per ton (lb/ton). Table 4-1 summarizesthese emission factors from the article. Because this is a secondary reference with littledocumentation, the data are not rated for use in developing emission factors.
4.2.2 Reference 2
This report documents measurements of uncontrolled filterable PM and fluoride emissionsfrom a small natural gas-fired roller kiln used to refire ceramics after application of decals, paint, orink screenings. This type of kiln maintains low operating temperatures and short product residencetimes. The test was conducted in March 1989 to demonstrate compliance with State regulations.Process rates were provided on the basis of production.
4-1
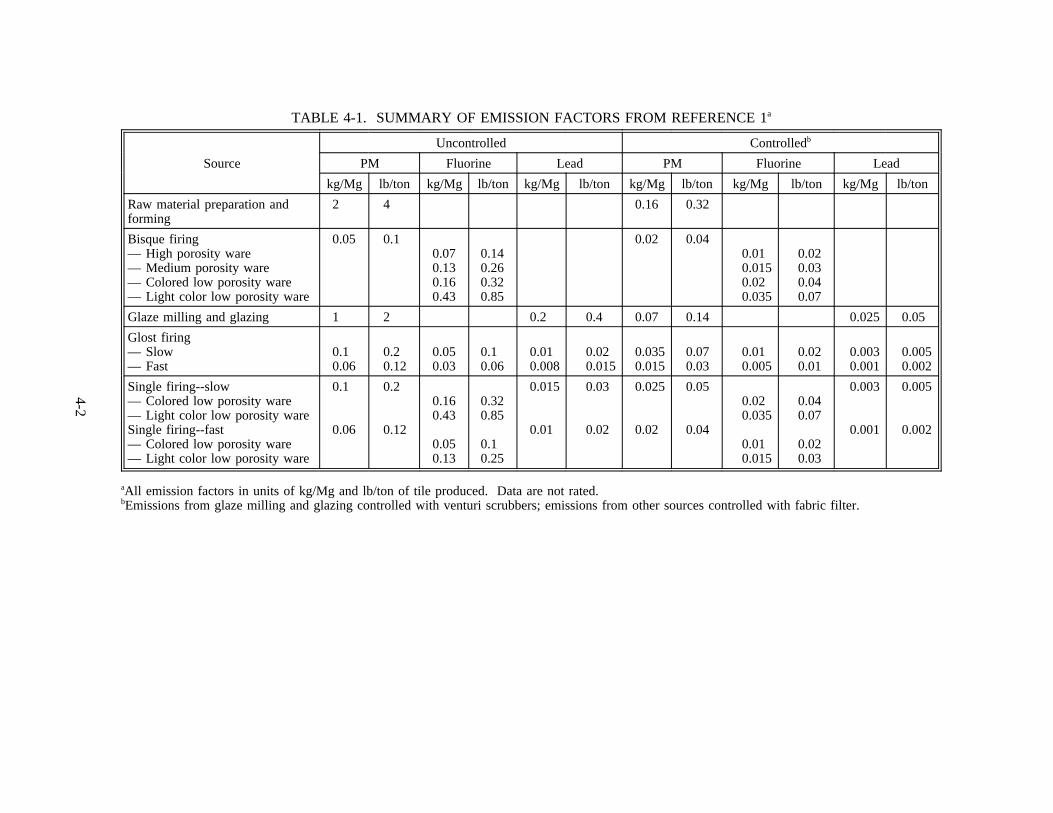
TABLE 4-1. SUMMARY OF EMISSION FACTORS FROM REFERENCE 1a
Source
Uncontrolled Controlledb
PM Fluorine Lead PM Fluorine Lead
kg/Mg lb/ton kg/Mg lb/ton kg/Mg lb/ton kg/Mg lb/ton kg/Mg lb/ton kg/Mg lb/ton
Raw material preparation andforming
2 4 0.16 0.32
Bisque firing— High porosity ware— Medium porosity ware— Colored low porosity ware— Light color low porosity ware
0.05 0.10.070.130.160.43
0.140.260.320.85
0.02 0.040.010.0150.020.035
0.020.030.040.07
Glaze milling and glazing 1 2 0.2 0.4 0.07 0.14 0.025 0.05
Glost firing— Slow— Fast
0.10.06
0.20.12
0.050.03
0.10.06
0.010.008
0.020.015
0.0350.015
0.070.03
0.010.005
0.020.01
0.0030.001
0.0050.002
Single firing--slow— Colored low porosity ware— Light color low porosity wareSingle firing--fast— Colored low porosity ware— Light color low porosity ware
0.1
0.06
0.2
0.12
0.160.43
0.050.13
0.320.85
0.10.25
0.015
0.01
0.03
0.02
0.025
0.02
0.05
0.04
0.020.035
0.010.015
0.040.07
0.020.03
0.003
0.001
0.005
0.002
aAll emission factors in units of kg/Mg and lb/ton of tile produced. Data are not rated.bEmissions from glaze milling and glazing controlled with venturi scrubbers; emissions from other sources controlled with fabric filter.
4-2
Filterable PM emissions were measured using Method 5, and fluoride emissions weremeasured using Kentucky Bureau of Environmental Protection Method 130, which is equivalent toEPA Method 13B. Three test runs were conducted. In addition, CO2 concentrations were measuredby Orsat and reported for the three test runs. Emission factors were developed for emissions offilterable PM, fluoride, and CO2 from the kiln. The emission data are rated B. The test methodologywas sound, and no problems were reported. However, because the report included no details on theprocess, and process rates were estimated rather than measured during the test, a higher rating is notwarranted.
4.2.3 Reference 3
This report documents measurements of uncontrolled filterable PM and fluoride emissionsfrom a natural gas-fired kiln used to manufacture ceramic tile. The test was conducted at the samefacility discussed in Reference 2, but was conducted on a different kiln. The test was performed inApril 1989 to demonstrate compliance with State regulations. Process rates were provided on the basisof production.
Filterable PM emissions were measured using Method 5, and fluoride emissions weremeasured using Kentucky Bureau of Environmental Protection Method 130. Three test runs wereconducted. Emission factors were developed for emissions of filterable PM and fluoride from the kiln.The emission data are rated B. The test methodology was sound, and no problems were reported.However, because the report included no details on the process, and process rates were estimatedrather than measured during the test, a higher rating is not warranted.
4.2.4 Reference 4
This report documents measurements of uncontrolled filterable PM, fluoride, and SO2
emissions from a gas-fired kiln used to manufacture ceramic bricks. The test was conducted inSeptember 1993 to demonstrate compliance with local regulations. Process rates were provided on thebasis of production.
The process consists of forming bricks from a clay blend, spraying a color pigment on theoutside surface, drying the bricks to a moisture content of 5 to 6 percent, then firing the bricks in atunnel kiln at a temperature of 1120°C (2050°F). A kiln cycle, the time for the bricks to exit the kilnfrom the time they enter kiln, was 73 hours.
Filterable PM emissions were measured using Method 5, fluoride emissions were measuredusing Method 13B, and Method 6 was used to measure SO2 emissions. Three test runs wereconducted. In addition, CO2 concentrations were measured by Orsat and reported for the three testruns. Emission factors were developed for emissions of filterable PM, fluoride, SO2, and CO2 fromthe kiln. The emission data are rated B. The test methodology was sound, and no problems werereported. However, these data are not used for emission factor development in this section becausethey are representative of structural clay product manufacturing, which is addressed in AP-42Section 11.3.
4-3
4.2.5 Reference 5
This report documents measurements of uncontrolled filterable PM, fluoride, SO2, and NOx
emissions from a gas-fired tunnel kiln. The test was conducted in November 1993 to demonstratecompliance with local regulations.
The facility operates three tunnel kilns and produces unglazed ceramic tile. During the test,the kiln sampled was firing tile composed of a mixture of 40 percent clay and 60 percent shale. Theaverage sulfur content of the unfired tile was 0.064 percent. Process rates were based on the averagerate of fired tile produced.
Filterable PM emissions were measured using Method 5, fluoride emissions were measuredusing Method 13A, SO2 emissions were measured using Method 6C, and NOx emissions werequantified using Method 7E. Three test runs were conducted. In addition, CO2 concentrations weremeasured by Orsat and reported for the three test runs. According to the observer from the local airpollution control agency, the SO2 measurements were not valid due to equipment problems during thetest. However, the major problem appears to be the way in which the post-test calibration wasconducted. Also, the test firm had difficulty with the pretest calibration.
Emission factors were developed for emissions of filterable PM, fluoride, NOx, and CO2 fromthe kiln. The emission data are rated B, except for the SO2 data, which are rated C because of thecalibration problems. The test methodology was sound, but the report lacked adequate details on theprocess to warrant a higher rating.
4.2.6 Reference 6
This report documents measurements of uncontrolled filterable PM, fluoride, and SO2
emissions from three gas-fired tunnel kilns ducted to a common stack. The test was conducted inMarch and April of 1994 to demonstrate compliance with local regulations.
The facility tested is the same plant for which an emission test was documented inReference 5. At the time of the test documented in Reference 5, the three kilns were ducted toseparate stacks. However, prior to the test documented in this reference, the exhausts for all threekilns were ducted to the same stack. During the test, two of the kilns were firing tile formed from100 percent clay, and the other kiln was firing tile composed of a mixture of 30 percent clay and70 percent shale. The average raw material sulfur content during the month of the test was0.11 percent. Process rates were based on the average rate of fired tile produced.
Filterable PM emissions were measured using Method 5, fluoride emissions were measuredusing Method 13A, and SO2 emissions were measured using Method 6. Three test runs wereconducted. In addition, CO2 concentrations were measured by Orsat and reported for six test runs.Emission factors were developed for emissions of filterable PM, fluoride, SO2, and CO2 from the kiln.The emission data are rated B. The test methodology was sound, and no problems were reported.However, the report lacked adequate details on the process to warrant a higher rating.
4-4
4.2.7 Reference 7
This report documents measurements of uncontrolled filterable PM, fluoride, SO2, and NOx
emissions from a gas-fired tunnel kiln. The test was conducted in August 1993 to demonstratecompliance with local regulations.
The kiln tested was a fast fire roller hearth design tunnel kiln. The kiln includes a preheatsection that uses excess heat from the kiln, a firing section, and a cooling section. Emissions from thepreheating and firing sections are ducted to one stack, and the emissions from the cooling section ofthe kiln are ducted to a separate stack. At the time of the test the facility was producing ceramic walltile. The materials used in the process included talc, clay, wollastonite, and pyrophyllite. The averageraw material sulfur content from May through June, 1993, was 0.0089 percent. Because the same typeof ceramic was produced during testing, this sulfur content is assumed to be similar to the averagesulfur content during testing. Process rates were based on the average rate of fired tile produced.
Filterable PM emissions were measured using Method 5, fluoride emissions were measuredusing Method 13A, SO2 emissions were measured using Method 6, and NOx emissions were quantifiedusing Method 7E. Three test runs were conducted. In addition, CO2 concentrations were measured byOrsat and reported for the three test runs.
Emission factors were developed for emissions of filterable PM, fluoride, SO2, NOx, and CO2
from the kiln. The emission data are rated B. The test methodology was sound, and no problemswere reported. However, the report lacked adequate details on the process to warrant a higher rating.
4.2.8 Reference 8
This report documents measurements of controlled filterable PM emissions from a firstcrushing and screening line used in the manufacture of ceramic tile. The test was conducted inOctober 1991 to demonstrate compliance with local regulations. Process rates were provided on thebasis of production.
The line tested processes raw material, and PM emissions generated from the process arecontrolled with a fabric filter. The exhaust from the fabric filter then is discharged to the atmospherethrough a stack.
Filterable PM emissions were measured using Method 5. Three 60-minute test runs wereconducted. Emission factors were developed for emissions of filterable PM from the process. Theemission data are rated B. The test method was sound, and no problems were reported. However,only average process rates were reported.
4.2.9 Reference 9
This report documents measurements of controlled filterable PM emissions from a crushingand screening line used in the manufacture of ceramic tile. The facility was the same facilitydiscussed in Reference 8, but a different processing line was sampled during this test. The test wasconducted in October 1991 to demonstrate compliance with local regulations. Process rates wereprovided on the basis of production.
4-5
The crushing and screening line processes both raw material and grog (calcined fire clay).Emissions from the line are controlled with two fabric filters, one for body material and one for grog.The exhaust from the fabric filters is then combined and discharged to the atmosphere through a singlestack. The test was conducted downstream from the point where the two exhaust streams combine.
Filterable PM emissions were measured using Method 5. Three 60-minute test runs wereconducted. Emission factors were developed for emissions of filterable PM from the process. Theemission data are rated B. The test method was sound, and no problems were reported. However,only average process rates were reported.
4.2.10 Reference 10
This report documents measurements of controlled TOC emissions from ceramic tape casters.The test was conducted in September 1989 to demonstrate compliance with local regulations.
The facility operates two tape casters, followed by a gas-fired fume oxidizer (incinerator) foremission control. Solvents used in the process include toluene and methyl isobutyl ketone. Thevapors are captured by a series of hoods and associated duct work and conveyed to the incinerator.Process rates were based on production.
Total organic compound (referred to as VOC in the summary data tables and in AP-42)emissions were measured using Method 25A. Five test runs were conducted, but the first was voiddue to an upset condition. Analysis of the samples collected during Run 2 indicated that the processmay not have reached steady state during the time of the test run. During Run 5, the process ratedropped considerably and the results of the run are questionable. Therefore, only runs 2 and 3 wereused for emission factor development. An emission factor was developed for emissions of VOC (aspropane). Because only two valid test runs were conducted, the emission data are assigned a ratingof B.
4.2.11 Reference 11
This report documents measurements of uncontrolled filterable PM, HF, SO2, NOx, CO, TOC(referred to as VOC in the summary data tables and in AP-42), and CO2 emissions from two gas-firedkilns, one dryer, and one cooler. The test was conducted in April 1994 to demonstrate compliancewith local regulations.
The facility tested operates two kilns and produces ceramic saddles and spheres (used inscrubbers) for the chemical industry. A clay/water mixture is extruded and cut, loaded into ceramic ormetal containers, and put onto pallets which are conveyed through a dryer operating at 127°C (260°F).After drying, the pallets are slowly passed through four zones of the kiln as the operating temperatureincreases from 704° to 1148°C (1300° to 2100°F). The total cure time varies from 24 to 37 hours.The finished product is then cooled and packaged for shipping.
The kiln exhaust flows through the dryer and the moist, warm gas exits the dryer at the rearthrough a stack. Emissions tests were performed on the main stacks for both kilns, the dryer exhaustfor Kiln No. 1, and the cooler exhaust for Kiln No. 2. Process rates were based on the feed rates tothe kilns.
4-6
Filterable PM emissions were measured using Method 5, HF emissions were measured usingMethod 13A, to measure SO2 emissions Method 6C was used, NOx emissions were quantified usingMethod 7E, CO emissions were measured using Method 10, and VOC (as propane) emissions weremeasured by Method 25A. In addition, CO2 concentrations were measured by Orsat and reported.Three test runs were conducted for each source tested.
Emission factors were developed for emissions of filterable PM, HF, NOx, SO2, CO, VOC (aspropane), and CO2 from the kilns. Emission factors were developed for emissions of filterable PMfrom the dryer and cooler. The emission data are rated B. The test methods were sound, and noproblems were reported. However, only average process rates were reported.
4.2.12 Reference 12
This report documents measurements of controlled TOC emissions from a ceramic furnace.The test was conducted in August 1993 to demonstrate compliance with local regulations.
The facility produces circuit board components that are made of multilayer ceramic sheets,which are cut from prefired ceramic tape, plated, pressed, and cured. The source tested was an electricfurnace that is used to cure the ceramic circuit parts. Organic binders, solvents, and plasticizers areused in the process.
A normal curing cycle lasts 24 hours and consists of four stages. Volatile organic compoundsand other evaporative substances volatilize during the first 5 hours (the binder burnout stage), as thetemperature in the furnace is gradually raised from 20° to 900°C (68° to (1652°F). During thesubsequent 7-hour period, the temperature in the furnace is gradually raised to 1350°C (2462°F), thenheld constant for another 7-hour period. Finally, the product is cooled for 5 hours. All of the exhaustgases vented through the stack are ignited with a natural gas flare.
The normal process weight is 12 lb/cycle. However, during the test a 36 lb charge was curedin the furnace.
Total organic compound emissions were measured using Method 25A, and three test runs wereconducted. The runs spanned three of the 5 hours of the binder burnout stage, but it is unclear whatportion of total VOC for the cycle was emitted during the 3-hour sampling period. During the firsttwo runs, the TOC concentrations fluctuated between 2.6 and 3.6 ppm as carbon. However, a spike inexhaust stream TOC concentrations (84 ppm as carbon) occurred near the end of the third run, and theTOC concentrations were still elevated (25 ppm as carbon) when the run ended.
Emission factors were developed for emissions of TOC from the process by assuming that allTOC were emitted over 5 hours at the average TOC emission rate for the three runs. Because theemission measurements were made over only a relatively small span of the entire kiln cycle, andbecause there is inadequate information for making an accurate estimate of total TOC emissions fromthe furnace cycle, the emission data are rated D.
4.2.13 Reference 13
This report documents measurements of controlled filterable PM emissions from a spray dryer.The test was conducted in March 1993 to demonstrate compliance with local regulations. Processrates were provided on the basis of production.
4-7
The facility manufacturers electronic ceramics, toner carrier for copier machines, and ceriumcarbonate. The source tested was the spray dryer on the electronic ceramics manufacturing line.Ferrite powder, organic binder, and water are mixed, pelletized, and calcined. After cooling, thematerial is wet-ground into a slurry, then dried in the spray dryer, which is heated by natural gas.Hot, moist air exiting the spray dryer passes through a cyclone and fabric filter for ferrite powderremoval. The exhaust from the fabric filter is then discharged to the atmosphere.
Filterable PM emissions were measured using Method 5. Three test runs were conducted andemission factors were developed for emissions of filterable PM from the process. The emission dataare rated A.
4.2.14 Reference 15
This reference is an inspection report made for the purpose of renewing the annual certificateof operation for the facility from Reference 12. Although the report is not a primary reference foremission data, it includes a process description and provides supplemental information on the facility.
4.2.15 Reference 16
This reference is an inspection report made for the purpose of renewing certificates ofoperation for the facility from Reference 13. Although the report is not a primary reference foremission data, it includes a process description and provides supplemental information on the facility.
4.2.16 Reference 17
This reference is an inspection report made for the purpose of renewing certificates ofoperation for the facility from Reference 11. Although the report is not a primary reference foremission data, it includes a process description and provides supplemental information on the facility.
4.2.17 Reference 18
This report documents measurements of filterable PM emissions from two spray booths used ina ceramic glaze line. Emissions from the spray booths were controlled with a wet scrubber. The testwas conducted in August 1992, to demonstrate compliance with State regulations. Filterable PMemissions were measured using Method 5, and three test runs were conducted. Correspondencereceived from the Ohio EPA provided the process rate as the average tons of glaze used per hour.
The emission data are rated B. The test methodology was sound, and no problems werereported. However, since the process rate was provided as a daily average, a higher rating is notwarranted.
4.2.18 Reference 19
This report documents measurements of filterable PM emissions from two spray booths used ina ceramic spray line. Emissions from the spray booths were controlled with a wet scrubber. The testwas conducted in August 1992, to demonstrate compliance with State regulations. Filterable PMemissions were measured using Method 5, and three test runs were conducted. Correspondencereceived from the Ohio EPA provided the process rate as the average tons of glaze used per hour.
4-8
The emission data are rated B. The test methodology was sound, and no problems werereported. However, since the process rate was provided as a daily average, a higher rating is notwarranted.
4.2.19 Reference 20
This report documents measurements of filterable PM emissions from two spray booths used ina ceramic glaze line. Emissions from the spray booths were controlled with a wet scrubber. The testwas conducted in February 1994, to demonstrate compliance with State regulations. Filterable PMemissions were measured using Method 5, and three test runs were conducted. The process rate wasprovided as the average tons of glaze used per hour.
The emission data are rated B. The test methodology was sound, and no problems werereported. However, since the process rate was provided as a daily average, a higher rating is notwarranted.
4.2.20 Reference 21
This report documents measurements of uncontrolled filterable PM and fluoride emissionsfrom a direct-, natural gas-fired roller kiln. The kiln was firing ceramic tile during the test program.The test was conducted in May 1994, to demonstrate compliance with State regulations. Process rateswere provided on the basis of production.
Filterable PM and total fluoride emissions were measured using a combined EPA Method 5and Method 13B sampling train. Three test runs were conducted and emission factors were developedfor emissions of filterable PM and total fluorides from the process. The emission data are rated A.
4.2.21 Reference 22
This reference (excerpts from a test report) documents measurements of uncontrolled filterablePM and fluoride emissions from a direct-, natural gas-fired roller kiln (same kiln as that described inReference 21). The kiln was firing ceramic tile during the test program. The test was conducted inJune 1993, to demonstrate compliance with State regulations. An average process rate was providedon the basis of production.
The test was conducted by the same firm that conducted the test described in Reference 21,and the procedures and test methods are assumed to be identical. Three test runs were conducted andemission factors were developed for emissions of filterable PM and fluorides from the process. Theemission data are rated C because only excerpts of the actual test report are available, and the processrate is a daily average.
4.2.22 Reference 23
This reference (excerpts from a test report) documents measurements of uncontrolled filterablePM and fluoride emissions from a direct-, natural gas-fired roller kiln (same kiln as that described inReference 21). The kiln was firing ceramic tile during the test program. The test was conducted inFebruary 1992, to demonstrate compliance with State regulations. An average process rate wasprovided on the basis of production.
4-9
The test was conducted by the same firm that conducted the test described in Reference 21,and the procedures and test methods are assumed to be identical. Three test runs were conducted andemission factors were developed for emissions of filterable PM and fluorides from the process. Theemission data are rated C because only excerpts of the actual test report are available and the processrate is a daily average.
4.2.23 Reference 24
This report documents measurements of venturi scrubber-controlled filterable PM emissionsfrom a natural gas-fired spray dryer. The dryer is part of a ceramic body preparation plant. The testwas conducted in October 1994, to demonstrate compliance with State regulations. An averageprocess rate was provided on the basis of production.
Filterable PM emissions were measured using EPA Method 5. Three test runs were conductedand emission factors were developed for emissions of filterable PM from the process. The emissiondata are rated B because scrubber operating parameters are not provided in the report.
4.2.24 Reference 25
This reference (excerpts from a test report) documents measurements of venturi scrubber-controlled filterable PM emissions from a natural gas-fired spray dryer (same dryer as that described inReference 24). The test was conducted in April 1994, to demonstrate compliance with Stateregulations. An average process rate was provided on the basis of production.
The test was conducted by the same firm that conducted the test described in Reference 24,and the procedures and test methods are assumed to be identical. Three test runs were conducted andemission factors were developed for emissions of filterable PM from the process. The emission dataare rated C because only excerpts of the actual test report are available, the process rate is a dailyaverage, and scrubber operating parameters are not provided.
4.2.25 Reference 26
This reference (excerpts from a test report) documents measurements of venturi scrubber-controlled filterable PM emissions from a natural gas-fired spray dryer (same dryer as that described inReference 24). The test was conducted in January 1993, to demonstrate compliance with Stateregulations. An average process rate was provided on the basis of production.
The test was conducted by the same firm that conducted the test described in Reference 24,and the procedures and test methods are assumed to be identical. Three test runs were conducted andemission factors were developed for emissions of filterable PM from the process. The emission dataare rated C because only excerpts of the actual test report are available, the process rate is a dailyaverage, and scrubber operating parameters are not provided.
4.2.26 Reference 27
This reference (excerpts from a test report) documents measurements of venturi scrubber-controlled filterable PM emissions from a natural gas-fired spray dryer (same dryer as that described inReference 24). The test was conducted in February 1992, to demonstrate compliance with Stateregulations. An average process rate was provided on the basis of production.
4-10
The test was conducted by the same firm that conducted the test described in Reference 24,and the procedures and test methods are assumed to be identical. Three test runs were conducted andemission factors were developed for emissions of filterable PM from the process. The emission dataare rated C because only excerpts of the actual test report are available, the process rate is a dailyaverage, and scrubber operating parameters are not provided.
4.2.27 Reference 28
This report documents measurements of uncontrolled filterable PM and lead emissions from aceramic spray booth. The spray booth used a lead-based glaze to coat ceramic tile during the testprogram. The test was conducted in September 1989, to demonstrate compliance with Stateregulations. An average process rate was provided on the basis of tons of glaze used per hour.
Filterable PM and lead emissions were measured using a combined EPA Method 5 andMethod 12 sampling train. Three test runs were conducted and emission factors were developed foremissions of filterable PM and lead from the process. The emission data are rated A.
4.3 DEVELOPMENT OF CANDIDATE EMISSION FACTORS
Tables 4-2 and 4-3 summarize the test data from References 1 through 13 and 18 through 28,and Tables 4-4 and 4-5 present the candidate emission factors for ceramic products manufacturing.Emission factors were developed for firing--natural gas-fired kiln, refiring--natural gas-fired kiln,comminution--raw material crushing and screening, forming--tape casting, dryers, coolers, granulation--natural gas-fired spray dryers, and ceramic glaze spray booths. The emission factors were developedby grouping data from similar combinations of source, pollutant, and control device, discarding theinferior data sets, and averaging the emission factors derived from each data set.
Emission data for natural gas-fired kilns were available for a variety of ceramic products andtypes of kilns. However, because most of the test reports include little information on raw materialcomposition and kiln operating parameters, there is little basis for grouping data sets according to howthese parameters affect emissions. Therefore, in most cases, data for different types of kilns andproducts are grouped together to develop average emission factors. For CO, CO2, and NOx, thisapproach appears reasonable because these emissions result primarily from fuel combustion. Forfilterable PM, this approach appears reasonable because the data for different products and kilnsoverlapped to a large extent. Fluoride and HF emissions are directly related to the raw materialfluorine content, but the test reports do not document the raw material fluorine content. Therefore, thefluoride data are averaged together, and the HF data are averaged together.
One data set was separated by raw material type. The emission factors for SO2 are separatedby raw material sulfur content (documented in three of the four test reports), which is a primary sourceof SO2 emissions from ceramic kilns. In addition, data for emissions from ceramic refiring kilns weregrouped separately because an industry representative indicated that these kilns are not similar to otherkilns used in the industry. The following paragraphs describe how the data presented in Tables 4-2and -3 were used to develop the emission factors presented in Tables 4-4 and -5.
4.3.1 Filterable PM
An emission factor for uncontrolled filterable PM emissions from natural gas-fired kilns wasdeveloped using A-rated data from one test, B-rated data from five tests, and C-rated data from three
4-11
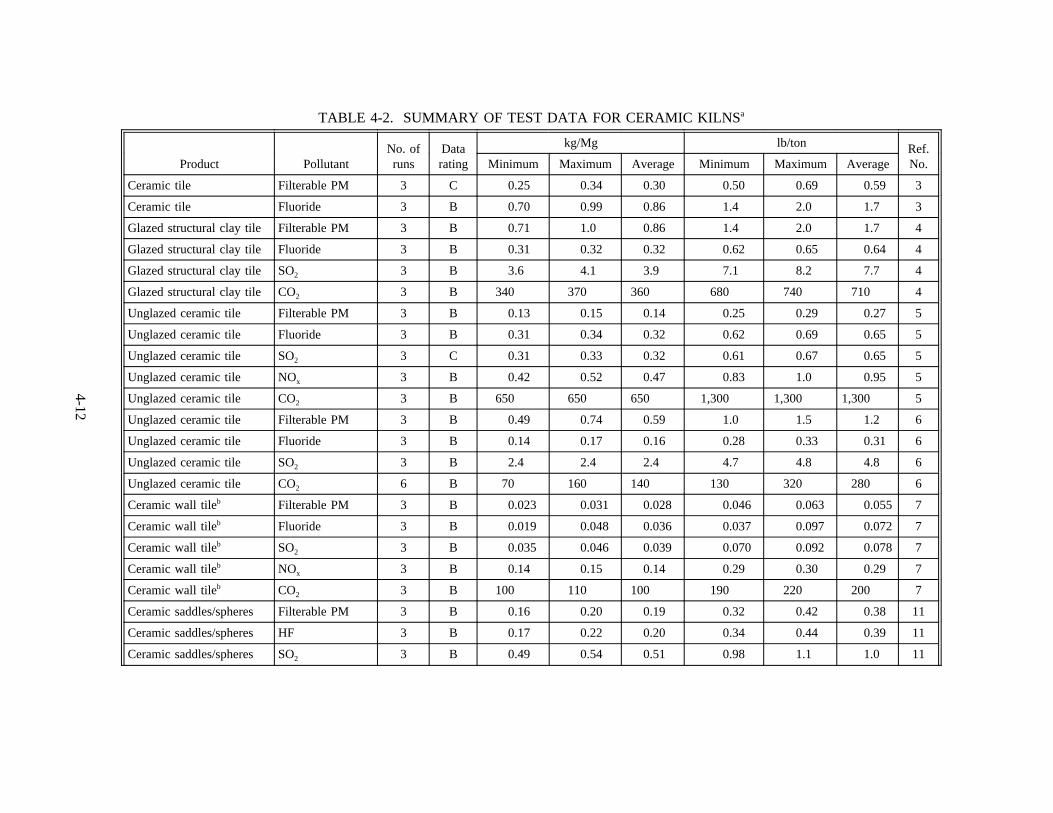
TABLE 4-2. SUMMARY OF TEST DATA FOR CERAMIC KILNSa
Product PollutantNo. ofruns
Datarating
kg/Mg lb/ton Ref.No.Minimum Maximum Average Minimum Maximum Average
Ceramic tile Filterable PM 3 C 0.25 0.34 0.30 0.50 0.69 0.59 3
Ceramic tile Fluoride 3 B 0.70 0.99 0.86 1.4 2.0 1.7 3
Glazed structural clay tile Filterable PM 3 B 0.71 1.0 0.86 1.4 2.0 1.7 4
Glazed structural clay tile Fluoride 3 B 0.31 0.32 0.32 0.62 0.65 0.64 4
Glazed structural clay tile SO2 3 B 3.6 4.1 3.9 7.1 8.2 7.7 4
Glazed structural clay tile CO2 3 B 340 370 360 680 740 710 4
Unglazed ceramic tile Filterable PM 3 B 0.13 0.15 0.14 0.25 0.29 0.27 5
Unglazed ceramic tile Fluoride 3 B 0.31 0.34 0.32 0.62 0.69 0.65 5
Unglazed ceramic tile SO2 3 C 0.31 0.33 0.32 0.61 0.67 0.65 5
Unglazed ceramic tile NOx 3 B 0.42 0.52 0.47 0.83 1.0 0.95 5
Unglazed ceramic tile CO2 3 B 650 650 650 1,300 1,300 1,300 5
Unglazed ceramic tile Filterable PM 3 B 0.49 0.74 0.59 1.0 1.5 1.2 6
Unglazed ceramic tile Fluoride 3 B 0.14 0.17 0.16 0.28 0.33 0.31 6
Unglazed ceramic tile SO2 3 B 2.4 2.4 2.4 4.7 4.8 4.8 6
Unglazed ceramic tile CO2 6 B 70 160 140 130 320 280 6
Ceramic wall tileb Filterable PM 3 B 0.023 0.031 0.028 0.046 0.063 0.055 7
Ceramic wall tileb Fluoride 3 B 0.019 0.048 0.036 0.037 0.097 0.072 7
Ceramic wall tileb SO2 3 B 0.035 0.046 0.039 0.070 0.092 0.078 7
Ceramic wall tileb NOx 3 B 0.14 0.15 0.14 0.29 0.30 0.29 7
Ceramic wall tileb CO2 3 B 100 110 100 190 220 200 7
Ceramic saddles/spheres Filterable PM 3 B 0.16 0.20 0.19 0.32 0.42 0.38 11
Ceramic saddles/spheres HF 3 B 0.17 0.22 0.20 0.34 0.44 0.39 11
Ceramic saddles/spheres SO2 3 B 0.49 0.54 0.51 0.98 1.1 1.0 11
4-12
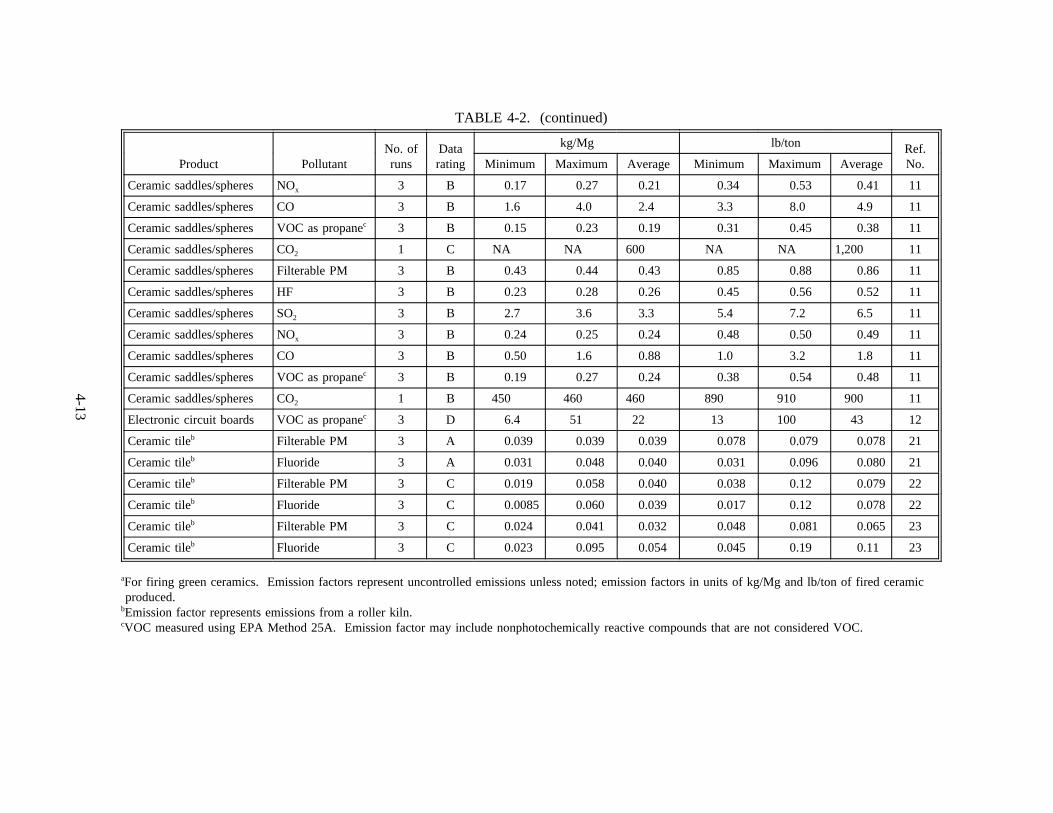
TABLE 4-2. (continued)
Product PollutantNo. ofruns
Datarating
kg/Mg lb/ton Ref.No.Minimum Maximum Average Minimum Maximum Average
Ceramic saddles/spheres NOx 3 B 0.17 0.27 0.21 0.34 0.53 0.41 11
Ceramic saddles/spheres CO 3 B 1.6 4.0 2.4 3.3 8.0 4.9 11
Ceramic saddles/spheres VOC as propanec 3 B 0.15 0.23 0.19 0.31 0.45 0.38 11
Ceramic saddles/spheres CO2 1 C NA NA 600 NA NA 1,200 11
Ceramic saddles/spheres Filterable PM 3 B 0.43 0.44 0.43 0.85 0.88 0.86 11
Ceramic saddles/spheres HF 3 B 0.23 0.28 0.26 0.45 0.56 0.52 11
Ceramic saddles/spheres SO2 3 B 2.7 3.6 3.3 5.4 7.2 6.5 11
Ceramic saddles/spheres NOx 3 B 0.24 0.25 0.24 0.48 0.50 0.49 11
Ceramic saddles/spheres CO 3 B 0.50 1.6 0.88 1.0 3.2 1.8 11
Ceramic saddles/spheres VOC as propanec 3 B 0.19 0.27 0.24 0.38 0.54 0.48 11
Ceramic saddles/spheres CO2 1 B 450 460 460 890 910 900 11
Electronic circuit boards VOC as propanec 3 D 6.4 51 22 13 100 43 12
Ceramic tileb Filterable PM 3 A 0.039 0.039 0.039 0.078 0.079 0.078 21
Ceramic tileb Fluoride 3 A 0.031 0.048 0.040 0.031 0.096 0.080 21
Ceramic tileb Filterable PM 3 C 0.019 0.058 0.040 0.038 0.12 0.079 22
Ceramic tileb Fluoride 3 C 0.0085 0.060 0.039 0.017 0.12 0.078 22
Ceramic tileb Filterable PM 3 C 0.024 0.041 0.032 0.048 0.081 0.065 23
Ceramic tileb Fluoride 3 C 0.023 0.095 0.054 0.045 0.19 0.11 23
aFor firing green ceramics. Emission factors represent uncontrolled emissions unless noted; emission factors in units of kg/Mg and lb/ton of fired ceramicproduced.
bEmission factor represents emissions from a roller kiln.cVOC measured using EPA Method 25A. Emission factor may include nonphotochemically reactive compounds that are not considered VOC.
4-13
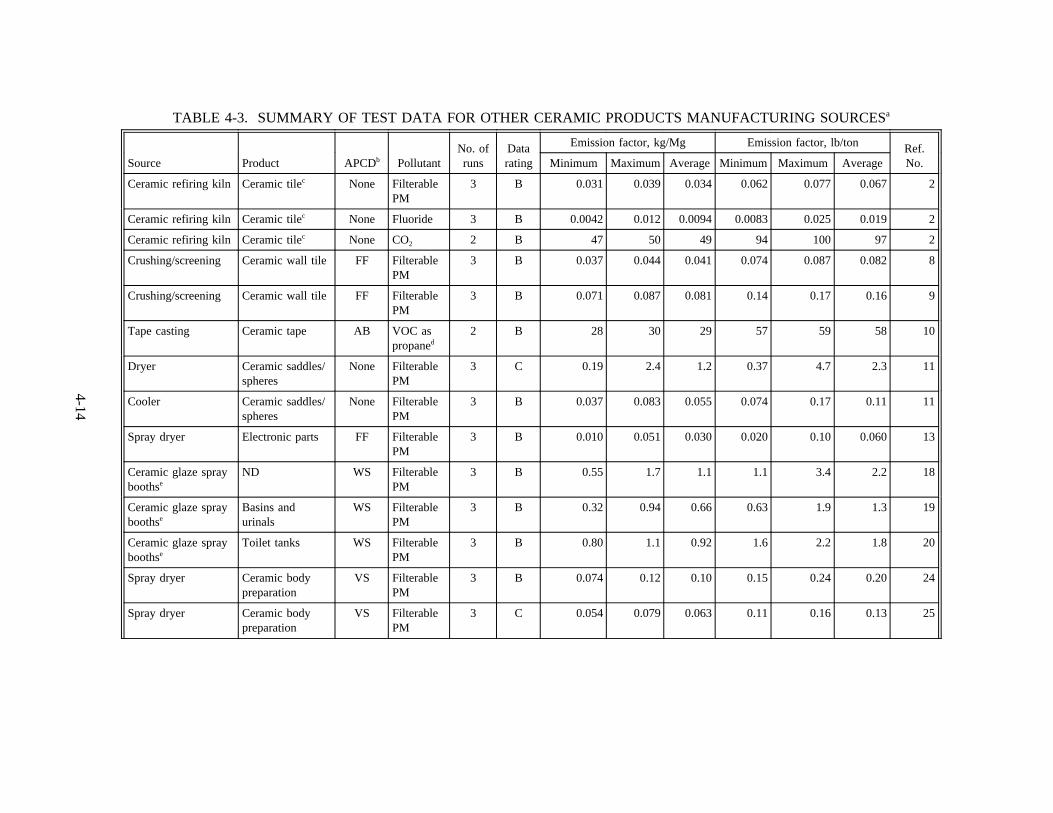
TABLE 4-3. SUMMARY OF TEST DATA FOR OTHER CERAMIC PRODUCTS MANUFACTURING SOURCESa
Source Product APCDb PollutantNo. ofruns
Datarating
Emission factor, kg/Mg Emission factor, lb/ton Ref.No.Minimum Maximum Average Minimum Maximum Average
Ceramic refiring kiln Ceramic tilec None FilterablePM
3 B 0.031 0.039 0.034 0.062 0.077 0.067 2
Ceramic refiring kiln Ceramic tilec None Fluoride 3 B 0.0042 0.012 0.0094 0.0083 0.025 0.019 2
Ceramic refiring kiln Ceramic tilec None CO2 2 B 47 50 49 94 100 97 2
Crushing/screening Ceramic wall tile FF FilterablePM
3 B 0.037 0.044 0.041 0.074 0.087 0.082 8
Crushing/screening Ceramic wall tile FF FilterablePM
3 B 0.071 0.087 0.081 0.14 0.17 0.16 9
Tape casting Ceramic tape AB VOC aspropaned
2 B 28 30 29 57 59 58 10
Dryer Ceramic saddles/spheres
None FilterablePM
3 C 0.19 2.4 1.2 0.37 4.7 2.3 11
Cooler Ceramic saddles/spheres
None FilterablePM
3 B 0.037 0.083 0.055 0.074 0.17 0.11 11
Spray dryer Electronic parts FF FilterablePM
3 B 0.010 0.051 0.030 0.020 0.10 0.060 13
Ceramic glaze sprayboothse
ND WS FilterablePM
3 B 0.55 1.7 1.1 1.1 3.4 2.2 18
Ceramic glaze sprayboothse
Basins andurinals
WS FilterablePM
3 B 0.32 0.94 0.66 0.63 1.9 1.3 19
Ceramic glaze sprayboothse
Toilet tanks WS FilterablePM
3 B 0.80 1.1 0.92 1.6 2.2 1.8 20
Spray dryer Ceramic bodypreparation
VS FilterablePM
3 B 0.074 0.12 0.10 0.15 0.24 0.20 24
Spray dryer Ceramic bodypreparation
VS FilterablePM
3 C 0.054 0.079 0.063 0.11 0.16 0.13 25
4-14
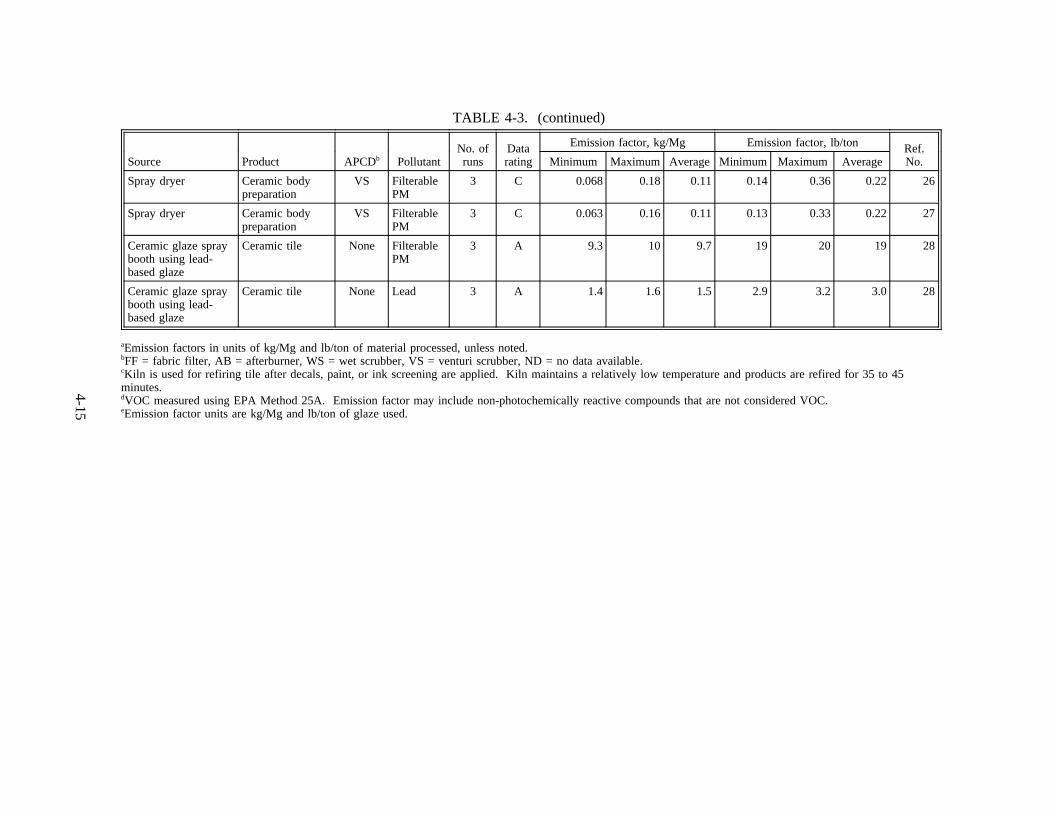
TABLE 4-3. (continued)
Source Product APCDb PollutantNo. ofruns
Datarating
Emission factor, kg/Mg Emission factor, lb/ton Ref.No.Minimum Maximum Average Minimum Maximum Average
Spray dryer Ceramic bodypreparation
VS FilterablePM
3 C 0.068 0.18 0.11 0.14 0.36 0.22 26
Spray dryer Ceramic bodypreparation
VS FilterablePM
3 C 0.063 0.16 0.11 0.13 0.33 0.22 27
Ceramic glaze spraybooth using lead-based glaze
Ceramic tile None FilterablePM
3 A 9.3 10 9.7 19 20 19 28
Ceramic glaze spraybooth using lead-based glaze
Ceramic tile None Lead 3 A 1.4 1.6 1.5 2.9 3.2 3.0 28
aEmission factors in units of kg/Mg and lb/ton of material processed, unless noted.bFF = fabric filter, AB = afterburner, WS = wet scrubber, VS = venturi scrubber, ND = no data available.cKiln is used for refiring tile after decals, paint, or ink screening are applied. Kiln maintains a relatively low temperature and products are refired for 35 to 45minutes.dVOC measured using EPA Method 25A. Emission factor may include non-photochemically reactive compounds that are not considered VOC.eEmission factor units are kg/Mg and lb/ton of glaze used.
4-15
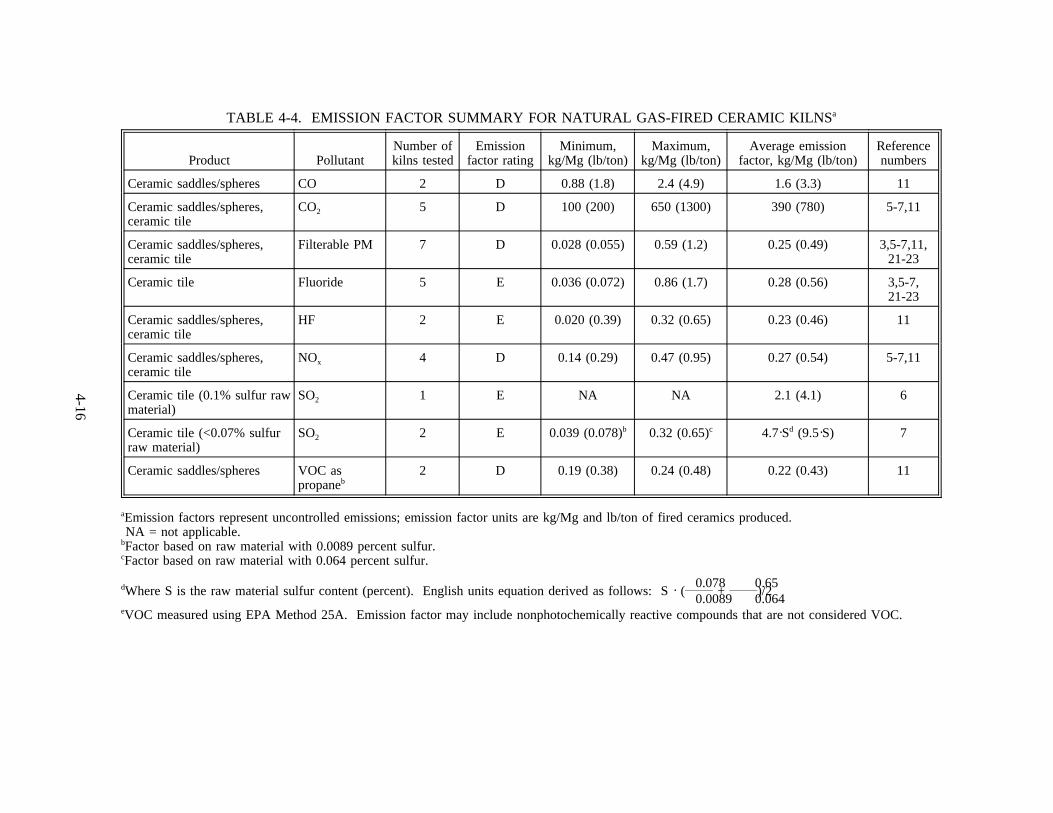
TABLE 4-4. EMISSION FACTOR SUMMARY FOR NATURAL GAS-FIRED CERAMIC KILNSa
Product PollutantNumber ofkilns tested
Emissionfactor rating
Minimum,kg/Mg (lb/ton)
Maximum,kg/Mg (lb/ton)
Average emissionfactor, kg/Mg (lb/ton)
Referencenumbers
Ceramic saddles/spheres CO 2 D 0.88 (1.8) 2.4 (4.9) 1.6 (3.3) 11
Ceramic saddles/spheres,ceramic tile
CO2 5 D 100 (200) 650 (1300) 390 (780) 5-7,11
Ceramic saddles/spheres,ceramic tile
Filterable PM 7 D 0.028 (0.055) 0.59 (1.2) 0.25 (0.49) 3,5-7,11,21-23
Ceramic tile Fluoride 5 E 0.036 (0.072) 0.86 (1.7) 0.28 (0.56) 3,5-7,21-23
Ceramic saddles/spheres,ceramic tile
HF 2 E 0.020 (0.39) 0.32 (0.65) 0.23 (0.46) 11
Ceramic saddles/spheres,ceramic tile
NOx 4 D 0.14 (0.29) 0.47 (0.95) 0.27 (0.54) 5-7,11
Ceramic tile (0.1% sulfur rawmaterial)
SO2 1 E NA NA 2.1 (4.1) 6
Ceramic tile (<0.07% sulfurraw material)
SO2 2 E 0.039 (0.078)b 0.32 (0.65)c 4.7 Sd (9.5 S) 7
Ceramic saddles/spheres VOC aspropaneb
2 D 0.19 (0.38) 0.24 (0.48) 0.22 (0.43) 11
aEmission factors represent uncontrolled emissions; emission factor units are kg/Mg and lb/ton of fired ceramics produced.NA = not applicable.
bFactor based on raw material with 0.0089 percent sulfur.cFactor based on raw material with 0.064 percent sulfur.
0.078 0.65dWhere S is the raw material sulfur content (percent). English units equation derived as follows: S (_______ + _______)/20.0089 0.064
eVOC measured using EPA Method 25A. Emission factor may include nonphotochemically reactive compounds that are not considered VOC.
4-16
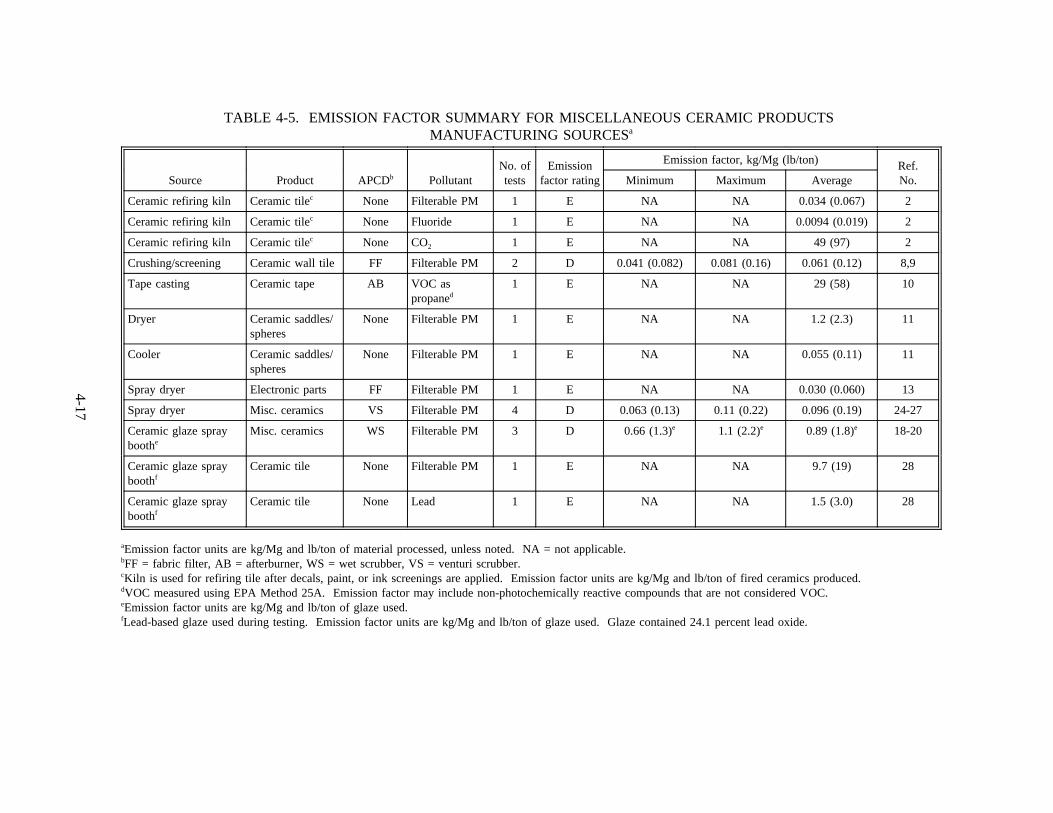
TABLE 4-5. EMISSION FACTOR SUMMARY FOR MISCELLANEOUS CERAMIC PRODUCTSMANUFACTURING SOURCESa
Source Product APCDb PollutantNo. oftests
Emissionfactor rating
Emission factor, kg/Mg (lb/ton) Ref.No.Minimum Maximum Average
Ceramic refiring kiln Ceramic tilec None Filterable PM 1 E NA NA 0.034 (0.067) 2
Ceramic refiring kiln Ceramic tilec None Fluoride 1 E NA NA 0.0094 (0.019) 2
Ceramic refiring kiln Ceramic tilec None CO2 1 E NA NA 49 (97) 2
Crushing/screening Ceramic wall tile FF Filterable PM 2 D 0.041 (0.082) 0.081 (0.16) 0.061 (0.12) 8,9
Tape casting Ceramic tape AB VOC aspropaned
1 E NA NA 29 (58) 10
Dryer Ceramic saddles/spheres
None Filterable PM 1 E NA NA 1.2 (2.3) 11
Cooler Ceramic saddles/spheres
None Filterable PM 1 E NA NA 0.055 (0.11) 11
Spray dryer Electronic parts FF Filterable PM 1 E NA NA 0.030 (0.060) 13
Spray dryer Misc. ceramics VS Filterable PM 4 D 0.063 (0.13) 0.11 (0.22) 0.096 (0.19) 24-27
Ceramic glaze sprayboothe
Misc. ceramics WS Filterable PM 3 D 0.66 (1.3)e 1.1 (2.2)e 0.89 (1.8)e 18-20
Ceramic glaze sprayboothf
Ceramic tile None Filterable PM 1 E NA NA 9.7 (19) 28
Ceramic glaze sprayboothf
Ceramic tile None Lead 1 E NA NA 1.5 (3.0) 28
aEmission factor units are kg/Mg and lb/ton of material processed, unless noted. NA = not applicable.bFF = fabric filter, AB = afterburner, WS = wet scrubber, VS = venturi scrubber.cKiln is used for refiring tile after decals, paint, or ink screenings are applied. Emission factor units are kg/Mg and lb/ton of fired ceramics produced.dVOC measured using EPA Method 25A. Emission factor may include non-photochemically reactive compounds that are not considered VOC.eEmission factor units are kg/Mg and lb/ton of glaze used.fLead-based glaze used during testing. Emission factor units are kg/Mg and lb/ton of glaze used. Glaze contained 24.1 percent lead oxide.
4-17
tests. The tests were conducted on seven kilns at six different facilities. The data from References 21through 23 (same kiln) were averaged first and then were averaged with the other data. The datarange from 0.028 to 0.59 kg/Mg (0.055 to 1.2 lb/ton) and average 0.25 kg/Mg (0.49 lb/ton). Thiscandidate emission factor is assigned a D rating because it was developed using data that range overan order of magnitude.
An emission factor for filterable PM emissions from a natural gas-fired ceramic refiring kilnwas developed using B-rated data from a single test. The emission factor is 0.034 kg/Mg(0.067 lb/ton). This candidate emission factor is assigned an E rating because it was developed usingdata from a single test.
An emission factor for filterable PM emissions from comminution (raw material crushing andscreening) was developed using B-rated data from two tests conducted on two crushing and screeninglines located at the same facility. Emissions from both lines were controlled by fabric filters. Thedata range from 0.041 to 0.081 kg/Mg (0.082 to 0.16 lb/ton) and average 0.061 kg/Mg (0.12 lb/ton).This candidate emission factor is assigned a D rating because it was developed using B-rated datafrom two tests conducted at the same facility.
An emission factor for uncontrolled filterable PM emissions from a dryer (heated with theexhaust from a natural gas-fired ceramic kiln firing ceramic saddles and spheres) was developed usingC-rated data from a single test. The emission factor is 1.2 kg/Mg (2.3 lb/ton). This candidateemission factor is assigned an E rating because it was developed from C-rated data.
An emission factor for uncontrolled filterable PM emissions from a cooler (following a naturalgas-fired ceramic kiln firing ceramic saddles and spheres) was developed using B-rated data from asingle test. The emission factor is 0.055 kg/Mg (0.11 lb/ton). This candidate emission factor isassigned an E rating because it is based on data from a single test.
An emission factor for filterable PM emissions from spray dryers was developed using B-rateddata from a single test. The spray dryer tested was controlled by a fabric filter. The emission factoris 0.030 kg/Mg (0.060 lb/ton). This candidate emission factor is assigned an E rating because it isbased on data from a single test.
An emission factor for filterable PM emissions from spray dryers controlled with venturiscrubbers was developed using B-rated data from one test and C-rated data from three tests conductedon the same dryer. The data range from 0.063 kg/Mg (0.13 lb/ton) to 0.11 kg/Mg (0.22 lb/ton) andaverage 0.096 kg/Mg (0.19 lb/ton). This candidate emission factor is assigned a D rating because itwas developed using data from a single dryer.
An emission factor for filterable PM emissions from ceramic glaze spray booths controlledwith wet scrubbers was developed using B-rated data from three tests conducted on three differentspray lines at the same facility. The emission factor units for these factors are kg/Mg (lb/ton) of glazeused. The data range from 0.66 kg/Mg (1.3 lb/ton) to 1.1 kg/Mg (2.2 lb/ton) and average 0.89 kg/Mg(1.8 lb/ton). This candidate emission factor is assigned a D rating because it was developed using datafrom a single facility.
An emission factor for filterable PM emissions from uncontrolled ceramic glaze spray boothswas developed using A-rated data from a single test. The spray booth tested was using a lead-basedglaze (24.1 percent lead oxide) during testing. The emission factor is 9.7 kg/Mg (19 lb/ton) of glaze
4-18
used. This candidate emission factor is assigned an E rating because it was developed using data froma single test.
4.3.2 Volatile Organic Compounds
The VOC emission factors described below are based on EPA Method 25A measurements.Therefore, these factors actually represent total organic compounds and may include non-photochemically reactive compounds that are not considered VOC.
An emission factor for uncontrolled VOC (as propane) emissions from natural gas-fired kilnswas developed using B-rated data from tests conducted on two kilns. The data range from 0.19 to0.24 kg/Mg (0.38 to 0.48 lb/ton) and average 0.22 kg/Mg (0.43 lb/ton). This candidate emission factoris assigned a D rating because it was developed using data from two kilns located at the same facility.
An emission factor for uncontrolled VOC (as propane) emissions from electric ceramicfurnaces (firing electronic circuit boards) was developed using the D-rated data presented inReference 12. However, this emission factor is not rated and is not proposed as a candidate emissionfactor for the following reasons. The process entailed the manufacture of a specialty product in verysmall quantities (36 lb per kiln cycle): the kiln was operating at three times the normal process weightrate; and because of the fluctuations in emissions for the process, the emissions sampled are not likelyrepresentative of an entire kiln cycle.
An emission factor for VOC (as propane) emissions from ceramic tape casters was developedusing B-rated data from a single test. The tape casters tested were controlled by an afterburner. Theemission factor is 29 kg/Mg (58 lb/ton). This candidate emission factor is assigned a E rating becauseit was developed using data from a single test.
4.3.3 Carbon Monoxide
An emission factor for uncontrolled CO emissions from natural gas-fired kilns was developedusing B-rated data from tests conducted on two kilns. The data range from 0.88 to 2.4 kg/Mg (1.8 to4.9 lb/ton) and average 1.6 kg/Mg (3.3 lb/ton). This candidate emission factor is assigned a D ratingbecause it was developed using data from two kilns located at the same facility.
4.3.4 Carbon Dioxide
An emission factor for uncontrolled CO2 emissions from natural gas-fired kilns was developedusing B-rated data from three tests and B- and C-rated data from two tests conducted at the samefacility. The data range from 100 kg/Mg (200 lb/ton) to 650 kg/Mg (1,300 lb/ton) and average300 kg/Mg (590 lb/ton). This candidate emission factor is assigned a D rating because it wasdeveloped using data from kilns located at only three facilities.
An emission factor for CO2 emissions from natural gas-fired ceramic refiring kilns wasdeveloped using B-rated data from a single test. The emission factor is 49 kg/Mg (97 lb/ton). Thiscandidate emission factor is assigned an E rating because it was developed using data from a singletest.
4-19
4.3.5 Nitrogen Oxides
An emission factor for uncontrolled NOx emissions from natural gas-fired kilns was developedusing B-rated data from four tests, two of which were conducted on kilns located at the same facility.The data range from 0.14 to 0.47 kg/Mg (0.29 to 0.95 lb/ton) and average 0.27 kg/Mg (0.54 lb/ton).This candidate emission factor is assigned a D rating because it was developed using data from kilnslocated at only two facilities.
4.3.6 Sulfur Dioxide
An emission factor for uncontrolled SO2 emissions from natural gas-fired kilns firing ceramicswith a raw material sulfur content of 0.11 percent was developed using B-rated data from a single test.The emission factor is 2.4 kg/Mg (4.8 lb/ton). In AP-42, this factor is presented as 22 S kg/Mg(44 S lb/ton), where S is the raw material sulfur content (percent). This factor is assumed to beapplicable to facilities using raw material with a sulfur content greater than 0.07 percent. Thiscandidate emission factor is assigned an E rating because it was developed using data from a singletest. Data from two B-rated tests (Reference 11) are not used because of several inconsistencies in thedocumented raw material sulfur analysis.
An emission factor for uncontrolled SO2 emissions from natural gas-fired kilns firing ceramicswith a raw material sulfur content of less than or equal to 0.07 percent was developed using data fromone B-rated test and one C-rated test. The emission factor, presented as an equation, is 4.7 S kg/Mg(9.5 S lb/ton), where S is the raw material sulfur content (percent). This factor is assumed to beapplicable to facilities using raw material with a sulfur content less than or equal to 0.07 percent. Thiscandidate emission factor is assigned an E rating because it was developed using B- and C-rated datafrom two tests.
4.3.7 Hydrogen Fluoride
An emission factor for uncontrolled HF emissions from natural gas-fired kilns was developedusing B-rated data from two tests conducted on two kilns located at a single facility. The data rangefrom 0.20 to 0.32 kg/Mg (0.39 to 0.65 lb/ton) and average 0.23 kg/Mg (0.46 lb/ton). This candidateemission factor is assigned an E rating because it was developed using data from a single facility, andHF emissions vary widely by facility.
4.3.8 Fluoride
An emission factor for fluoride emissions from natural gas-fired kilns was developed usingA-rated data from one test, B-rated data from four tests, and C-rated data from two tests. The A- andC-rated tests were conducted on the same kiln, and these data were averaged first and then wereaveraged with the B-rated data. The data range from 0.036 kg/Mg (0.072 lb/ton) to 0.86 kg/Mg(1.7 lb/ton) and average 0.28 kg/Mg (0.56 lb/ton). This candidate emission factor is assigned an Erating because it was developed using data that range over an order of magnitude.
An emission factor for fluoride emissions from a natural gas-fired ceramic refiring kiln wasdeveloped using B-rated data from a single test. The emission factor is 0.0094 kg/Mg (0.019 lb/ton).This candidate emission factor is assigned an E rating because it was developed using data from asingle test.
4-20
4.3.9 Lead
An emission factor for lead emissions from uncontrolled ceramic glaze spray booths wasdeveloped using A-rated data from a single test. The spray booth tested was using a lead-based glaze(24.1 percent lead oxide) during testing. The emission factor is 1.5 kg/Mg (3.0 lb/ton) of glaze used.This candidate emission factor is assigned an E rating because it was developed using data from asingle test.
4.4 SUMMARY OF CHANGES TO AP-42 SECTION
4.4.1 Section Narrative
The process description was revised to reflect current industry practices and was expanded topresent a more complete description of the ceramic products manufacturing industry. A process flowdiagram also was added to the section based on the revised process description. In addition, emissionsfrom ceramic product manufacturing operations and types of emission control systems currently in useare discussed. The previous version of this AP-42 section addressed the beneficiation of ceramic rawmaterials only. Because the revised section addresses the entire process of manufacturing ceramicproducts, the title of the AP-42 section also was changed to "Ceramic Products Manufacturing."
4.4.2 Emission Factors
The emission factors in the current AP-42 section are not presented in the revised sectionbecause the background file did not contain any of the old AP-42 references. However, thepublication dates (pre-1970) indicate that any data from these references are probably not useful foremission factor development. The candidate emission factors discussed in Section 4.3 of this reportare presented in the revised AP-42 section. Based on current guidelines for rating emission factors,the new emission factors are assigned lower ratings (mostly "D-rated") than the "A-rated" factorspreviously presented in AP-42. However, the new factors are based on more reliable andrepresentative test data. The SO2, fluoride, and HF emission factors are footnoted as being primarilydependent of the types of raw materials (and fuel for SO2) used at specific facilities.
REFERENCES FOR SECTION 4
1. C. Palmonari and G. Timellini, Pollutant Emission Factors for the Ceramic Floor and Wall TileIndustry, Journal of the Air Pollution Control Association, Volume 32, No. 10, Pittsburgh, PA,October 1982.
2. Particulate Emission Testing for Florida Tile Corporation, Lawrenceburg, Kentucky, March 7-8,1989, Air Systems Testing, Inc., Marietta, GA, April 1989.
3. Particulate Emission Testing for Florida Tile Corporation, Lawrenceburg, Kentucky, April 19,1989, Air Systems Testing, Inc., Marietta, GA, May 1989.
4. Source Emission Tests at Stark Ceramics, Inc., East Canton, Ohio, No. 3 Kiln Stack,September 16, 1993, Custom Stack Analysis Company, Alliance, OH, October 1993.
4-21
5. Metropolitan Ceramics, Canton, Ohio, Tunnel Kiln #3 Exhaust Stack, Particulate, SO2, NOx,Hydrofluoric Acid Emission Evaluation, Conducted - November 17-18, 1993, EnvisageEnvironmental Incorporated, Richfield, OH, December 16, 1993.
6. Metropolitan Ceramics, Inc., Canton, Ohio, TK1, TK2, TK3 Exhausts, Particulate, SulfurDioxides, & Fluorides Emission Evaluation, Conducted - March 30 & April 14, 1994, EnvisageEnvironmental Incorporated, Richfield, OH, May 9, 1994.
7. Source Evaluation Results, U. S. Ceramic Tile Company, East Sparta, Ohio, August 11, 1993,Envisage Environmental Incorporated, Richfield, OH, September 1, 1993.
8. Particulate Emissions Test for American Olean Tile Company, Fayette, AL, Crushing andScreening Line #1, October 15, 1991, Pensacola POC, Inc, Pensacola, FL, October 1991.
9. Particulate Emissions Test for American Olean Tile Company, Fayette, AL, Crushing andScreening Line #2, October 16, 1991, Pensacola POC, Inc, Pensacola, FL, October 1991.
10. VOC Emission Test Report for GE Ceramics Tape Casters Fume Oxidizer, Chattanooga, TN,September 13-15, 1989, IT-Air Quality Services Group, Knoxville, TN, October, 1989.
11. Exhaust Emission Sampling for Norton Company, Soddy-Daisy, TN, April 19-20, 1994, ArmstrongEnvironmental, Inc., Dallas, TX, April 1994.
12. Volatile Organic Compound Emission Testing, Golden Astro Furnace Exhaust, Coors ElectronicPackage Company, Chattanooga, TN, August 26, 1993, Analytical Testing Consultants, Inc.,Kannapolis, NC and Roswell, GA, September 1993.
13. Particulate Emission Evaluation for Steward, Inc., Chattanooga, TN, March 30, 1993, FBTEngineering and Environmental Services, Chattanooga, TN, May 1993.
14. Emission Test Report, Walking Vane Bakeout Oven, 3M Corporation, Chattanooga, TN, PedcoEnvironmental, Inc., Cincinnati, OH, May 1981.
15. Inspection Report, Coors Electronic Package Company, Chattanooga, TN, April 4, 1994,Chattanooga-Hamilton County Air Pollution Control Bureau, Chattanooga, TN, May 1994.
16. Inspection Report, Steward, Inc., Chattanooga, TN, May 19, 1994, Chattanooga-Hamilton CountyAir Pollution Control Bureau, Chattanooga, TN, August, 1994.
17. Inspection Report, Norton Company, Soddy-Daisy, TN, August 18, 1994, Chattanooga-HamiltonCounty Air Pollution Control Bureau, Chattanooga, TN, August, 1994.
18. Report to American Standard on Stack Particulate Samples Collected at Tiffin, OH (Test DateAugust 18, 1992), Affiliated Environmental Services, Inc., Sandusky, OH, August 24, 1992.
19. Report to American Standard on Stack Particulate Samples Collected at Tiffin, OH (Test DateAugust 19, 1992), Affiliated Environmental Services, Inc., Sandusky, OH, August 24, 1992.
4-22
20. Report to American Standard on Stack Particulate Samples Collected at Tiffin, OH (Test DateFebruary 8, 1994), Affiliated Environmental Services, Inc., Sandusky, OH, February 15, 1994.
21. Emission Test Report--Plant A, Roller Kiln, May 1994, Document No. 4602-01-02, ConfidentialBusiness Information Files, Contract No 68-D2-0159, Assignment No. 2-01, U. S. EnvironmentalProtection Agency, Research Triangle Park, NC, June 8, 1995.
22. Emission Test Report (Excerpts)--Plant A, Roller Kiln, June 1993, Document No. 4602-01-02,Confidential Business Information Files, Contract No 68-D2-0159, Assignment No. 2-01, U. S.Environmental Protection Agency, Research Triangle Park, NC, June 8, 1995.
23. Emission Test Report (Excerpts)--Plant A, Roller Kiln, February 1992, DocumentNo. 4602-01-02, Confidential Business Information Files, Contract No 68-D2-0159, AssignmentNo. 2-01, U. S. Environmental Protection Agency, Research Triangle Park, NC, June 8, 1995.
24. Emission Test Report--Plant A, Spray Dryer, October 1994, Document No. 4602-01-02,Confidential Business Information Files, Contract No 68-D2-0159, Assignment No. 2-01, U. S.Environmental Protection Agency, Research Triangle Park, NC, June 8, 1995.
25. Emission Test Report (Excerpts)--Plant A, Spray Dryer, April 1994, Document No. 4602-01-02,Confidential Business Information Files, Contract No 68-D2-0159, Assignment No. 2-01, U. S.Environmental Protection Agency, Research Triangle Park, NC, June 8, 1995.
26. Emission Test Report (Excerpts)--Plant A, Spray Dryer, January 1993, DocumentNo. 4602-01-02, Confidential Business Information Files, Contract No 68-D2-0159, AssignmentNo. 2-01, U. S. Environmental Protection Agency, Research Triangle Park, NC, June 8, 1995.
27. Emission Test Report (Excerpts)--Plant A, Spray Dryer, February 1992, DocumentNo. 4602-01-02, Confidential Business Information Files, Contract No 68-D2-0159, AssignmentNo. 2-01, U. S. Environmental Protection Agency, Research Triangle Park, NC, June 8, 1995.
28. Stationary Source Sampling Report Reference No. 6445, Lead and Particulate Emissions Testing,Spray Booth 2A Stack, Entropy Environmentalists, Inc., Research Triangle Park, NC,September 20, 1989.
29. Stack Emission Evaluation of Beryllium Oxide in a Specialty Ceramic Product Development andFormation Operation, Accredited Laboratories, Inc., Carteret, NJ, May 1988.
30. Evaluation of Estimated Particulate Emissions from Proposed Tunnel Kilns, Steward, Inc.,Chattanooga, TN, Chattanooga-Hamilton County Air Pollution Control Bureau, Chattanooga, TN,October 1994.
31. Test Report for the Determination of Organic Compound Destruction Efficiency from SRK Kilnsand Tokai Bakeout Ovens, Prepared for: Murata Erie North America, State College, PA, ScottEnvironmental Technology, Plumsteadville, PA, August 1992.
32. Ceramic Kiln Afterburner Testing, Murata Erie North America, State College, PA, HemeonAssociates, Inc., Pittsburgh, PA, October 23, 1991.
4-23
33. Hydrogen Cyanide Emission Testing, Foseco, Inc., Mt. Braddock Plant, Mt. Braddock, PA,Hemeon Associates, Inc., Pittsburgh, PA, April 16, 1990.
4-24
5. PROPOSED AP-42 SECTION 11.7
The proposed AP-42 Section 11.7, Ceramic Products Manufacturing, is presented on thefollowing pages as it would appear in the document.
5-1