Embed Size (px)
Citation preview

M. Amann, W. Asman, I. Bertok, J. Cofala, C. Heyes, Z. Klimont, W. Schöpp, F. Wagner
Emission control scenariosfor EU and non-EU countries
Meeting of the Task Force on Integrated Assessment ModellingPrague, May 2-4, 2007
Recent emission scenarios
• Scenarios for EU Member States
• Scenarios for non-EU countries
• Ship emissions
Changes in the GAINS databases for EU MSsince December 2006
For energy-related aspects:
• National energy scenarios for Greece, Lithuania and Switzerland implemented
• Revised emission factors, control strategies and other inputs for Belgium, Czech Rep., Germany, Greece, Hungary, Finland, Ireland, Lithuania, Malta, Netherlands, Switzerland, UK;
• Revised baseline emission control legislation on national sea traffic
For VOC:
• Country comments from Belgium, Greece, Romania
For NH3: • Comments from Denmark, Finland, Romania, Switzerland,
Bulgaria, Romania, Turkey, Malta, Switzerland
Target setting for the NEC analysis
• TSAP has established environmental targets for 2020
• In the meantime, methodology, data and boundary conditions have changed:
– Ecosystem-specific deposition for eutrophication– Multi-year meteorology– Extension to EU-27– Extension to Norway
• Current NEC analysis has applied TSAP percentage improvement targets to YOLLs, acidification and ozone. For eutrophication targets have been recalculated with ecosystem-specific deposition methodology.
Summary of the environmental targetsas applied in the NEC-3 report
• Health impacts for PM:– EU-27+N –wide reductions in YOLLs by 47%
• Acidification target:– EU-27+N –wide reduction in unprotected ecosystems area
by 74% for forests and 39% for water.– In each Member State, a 30% gap closure of accumulated
excess deposition between CLE and MRR
• Eutrophication target:– EU-27+N –wide reduction in unprotected ecosystems area by
31%.– In each Member State, gap closure of accumulated excess
deposition between CLE and MRR accumulated by 67% (national proj.) and 61% (PRIMES/CAPRI proj.)
• Ozone target:– EU-27+N –wide reduction in premature mortality by 10%

Two central cases
Cost-optimized emission reductions meeting the environmental TSAP objectives
• With Euro-VI measures in all countries (Package A of Commission proposal, from 2013/14 onwards)
• Assuming 2020 emissions in non-EU countries and ships
• For the – national activity projections and the – PRIMES €20 case
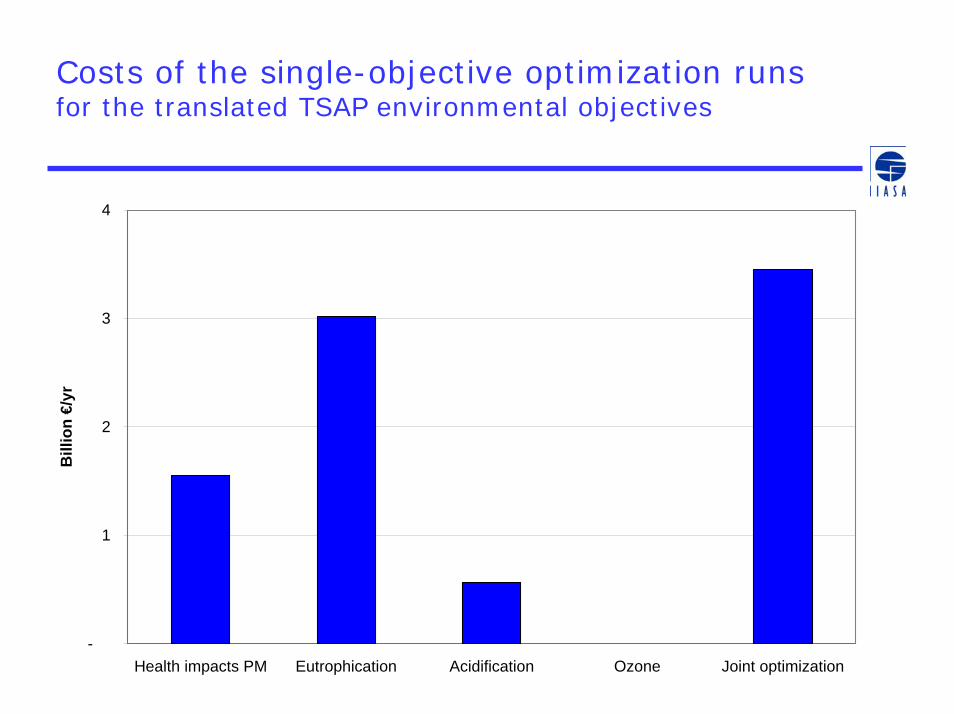
Costs of the single-objective optimization runsfor the translated TSAP environmental objectives
-
1
2
3
4
Health impacts PM Eutrophication Acidification Ozone Joint optimization
Bill
ion
€/yr
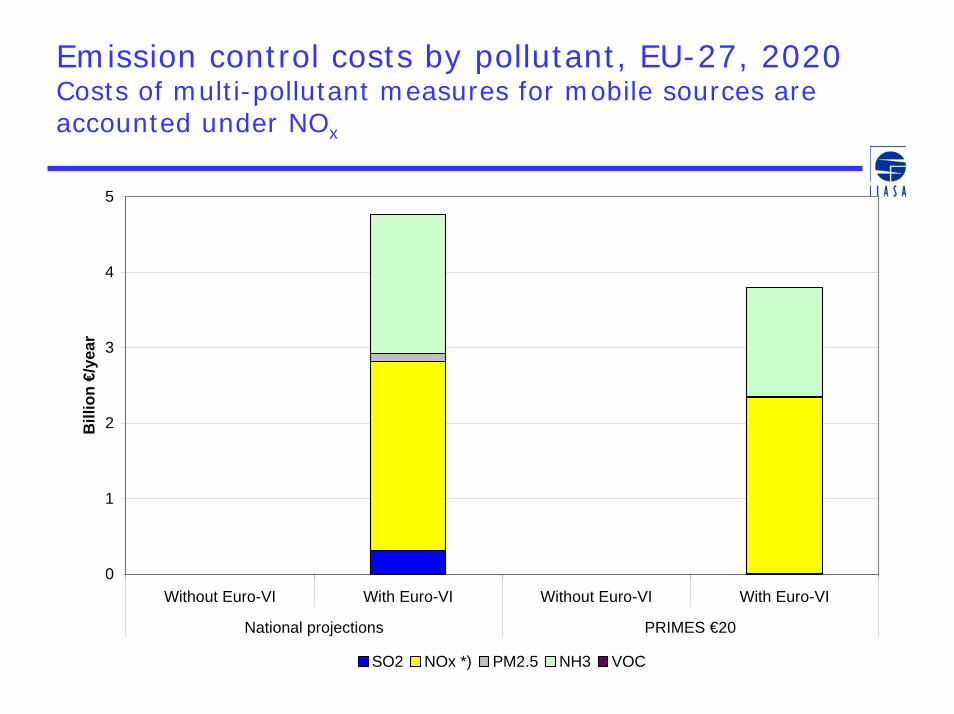
Emission control costs by pollutant, EU-27, 2020Costs of multi-pollutant measures for mobile sources are accounted under NOx
0
1
2
3
4
5
Without Euro-VI With Euro-VI Without Euro-VI With Euro-VI
National projections PRIMES €20
Bill
ion
€/ye
ar
SO2 NOx *) PM2.5 NH3 VOC
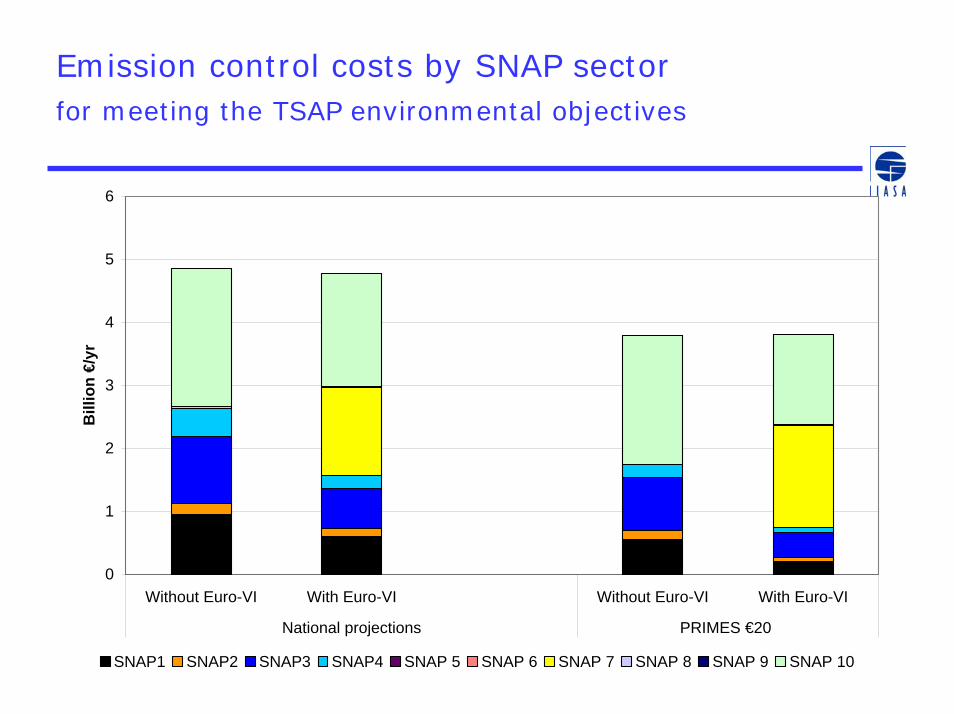
Emission control costs by SNAP sectorfor meeting the TSAP environmental objectives
0
1
2
3
4
5
6
Without Euro-VI With Euro-VI Without Euro-VI With Euro-VI
National projections PRIMES €20
Bill
ion
€/yr
SNAP1 SNAP2 SNAP3 SNAP4 SNAP 5 SNAP 6 SNAP 7 SNAP 8 SNAP 9 SNAP 10
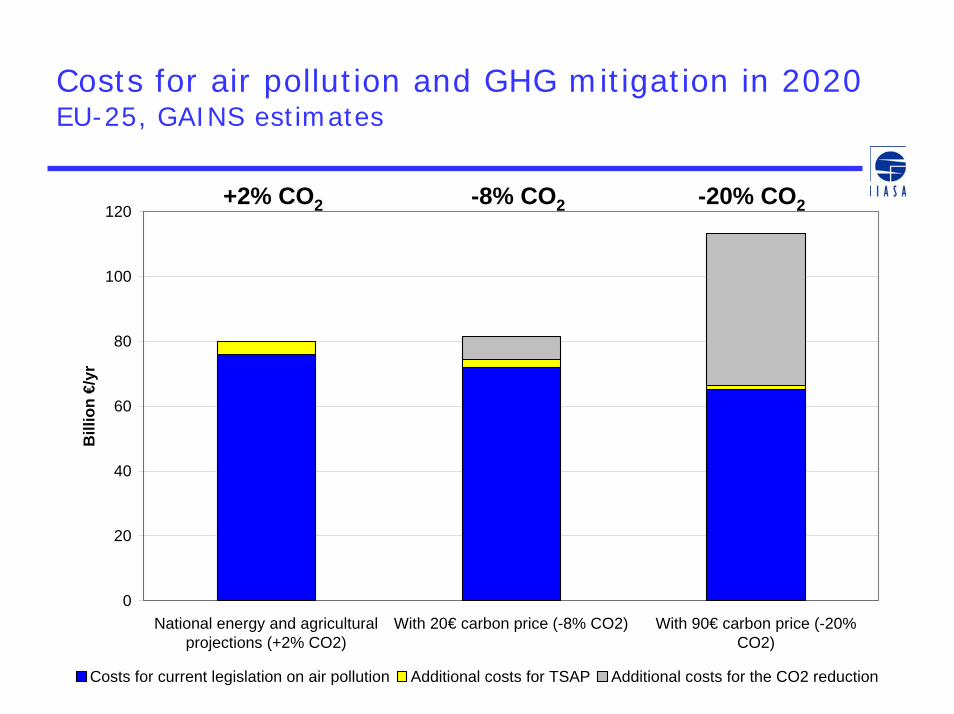
Costs for air pollution and GHG mitigation in 2020EU-25, GAINS estimates
0
20
40
60
80
100
120
National energy and agriculturalprojections (+2% CO2)
With 20€ carbon price (-8% CO2) With 90€ carbon price (-20%CO2)
Bill
ion
€/yr
Costs for current legislation on air pollution Additional costs for TSAP Additional costs for the CO2 reduction
+2% CO2 -8% CO2 -20% CO2

Impacts of uniform ELVs for large combustion plants
• How would EU-wide uniform emission limit values for large combustion plants influence total emissions?
• Reflecting the ranges of emission factors given in BREF notes
• For SO2, NOx and PM2.5 emissions
• Compared to– NEC baseline (with national interpretations of IPPC)– Optimized emission levels (without Euro-VI)
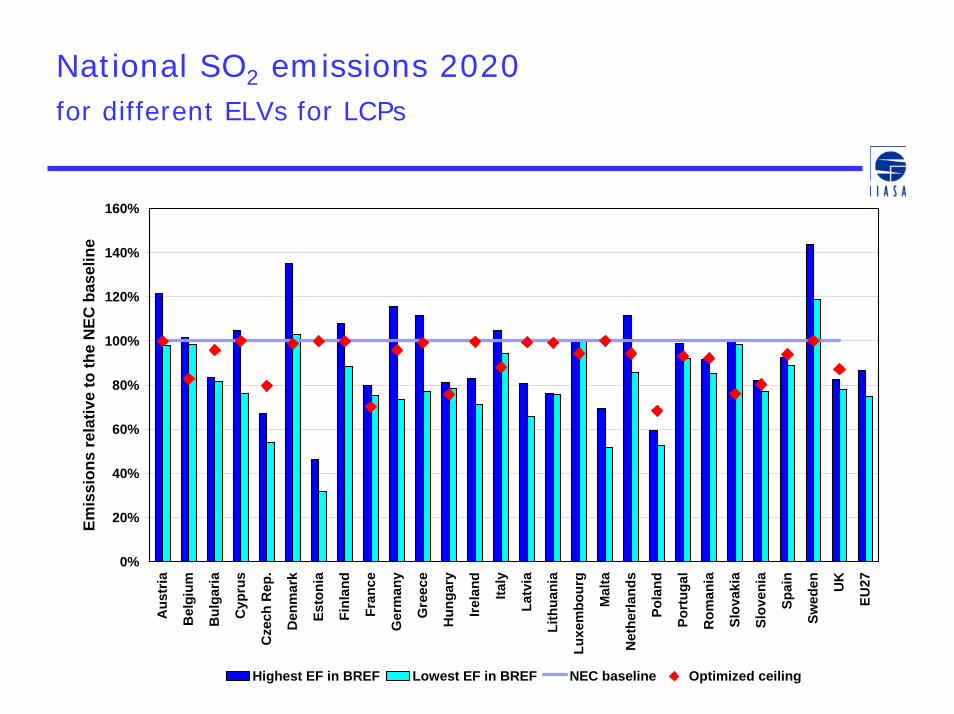
National SO2 emissions 2020 for different ELVs for LCPs
0%
20%
40%
60%
80%
100%
120%
140%
160%
Aus
tria
Bel
gium
Bul
garia
Cyp
rus
Cze
ch R
ep.
Den
mar
k
Esto
nia
Finl
and
Fran
ce
Ger
man
y
Gre
ece
Hun
gary
Irela
nd
Italy
Latv
ia
Lith
uani
a
Luxe
mbo
urg
Mal
ta
Net
herla
nds
Pola
nd
Port
ugal
Rom
ania
Slov
akia
Slov
enia
Spai
n
Swed
en UK
EU27
Emis
sion
s re
lativ
e to
the
NEC
bas
elin
e
Highest EF in BREF Lowest EF in BREF NEC baseline Optimized ceiling

National NOx emissions 2020 with different ELVs for LCPs
0%
20%
40%
60%
80%
100%
120%
Aus
tria
Bel
gium
Bul
garia
Cyp
rus
Cze
ch R
ep.
Den
mar
k
Esto
nia
Finl
and
Fran
ce
Ger
man
y
Gre
ece
Hun
gary
Irela
nd
Italy
Latv
ia
Lith
uani
a
Luxe
mbo
urg
Mal
ta
Net
herla
nds
Pola
nd
Port
ugal
Rom
ania
Slov
akia
Slov
enia
Spai
n
Swed
en UK
Em
issi
ons
rela
tive
to N
EC
bas
elin
e
Highest EF in BREF Lowest EF in BREF NEC baseline Optimized ceiling
Conclusions on scenarios for EU Member States
• Emission ceilings are currently under development
• Recent round of analysis put highest emphasis on eutrophication, and less on PM
• Euro-VI measures cost-effective means for achieving the environmental objectives
• Additional emission control costs are strongly influenced by assumptions on climate policy.
• Emission limit values for LCPs reflecting the emission factors indicated in the BREF-notes would lead to further emission reductions. In most cases these reductions are cost-effective.

Non-EU countries

Input data for non-EU countries
• National input received from Switzerland and Norway
• For all other countries, no new input received since EB 2006
• Compared to Gothenburg Protocol, modified energy projections have been received for Russia, Ukraine and Belarus, but not through official channels. For all other countries, no change in input data since the Gothenburg Protocol
• Bilateral consultations with Russia, Ukraine and Belarus held in 2006, but no follow-up
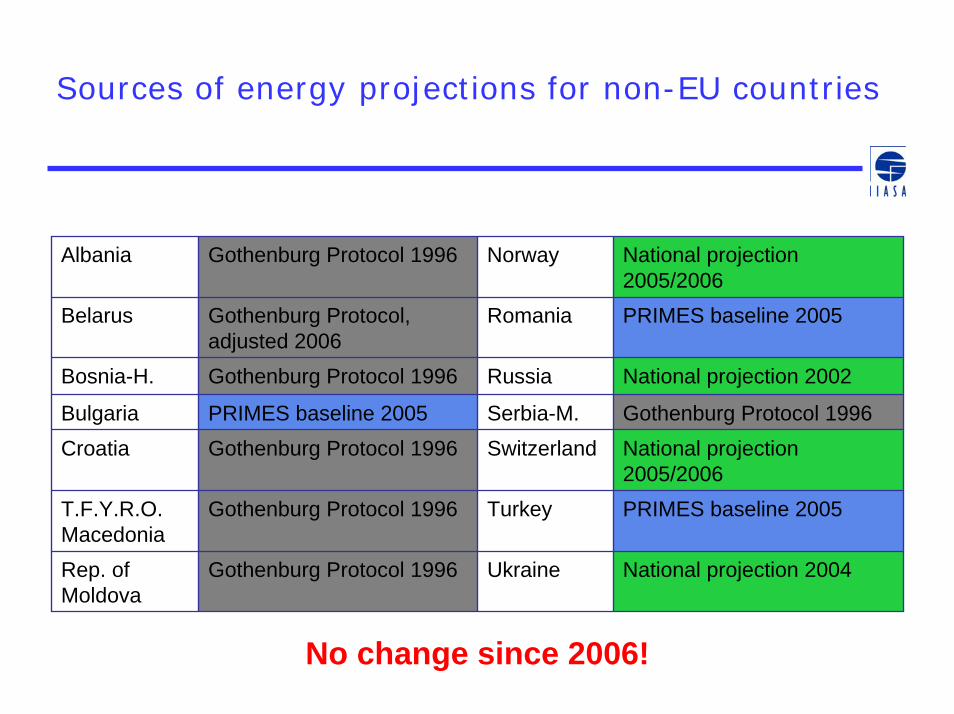
Sources of energy projections for non-EU countries
Albania Gothenburg Protocol 1996 Norway National projection 2005/2006
Belarus Gothenburg Protocol, adjusted 2006Gothenburg Protocol 1996
PRIMES baseline 2005Gothenburg Protocol 1996
Gothenburg Protocol 1996
Gothenburg Protocol 1996
PRIMES baseline 2005
Bosnia-H.
Romania
Russia
Serbia-M.Switzerland
Turkey
National projection 2002
Bulgaria Gothenburg Protocol 1996Croatia National projection
2005/2006T.F.Y.R.O. Macedonia
PRIMES baseline 2005
Rep. of Moldova
Ukraine National projection 2004
No change since 2006!
Case A for “Current legislation”
• SO2: Emission standards as laid down in national legislation. For new LCPs standards of the 2nd Sulfur Protocol
• NOx: Uncontrolled emissions, except for new LCPs where primary measures (combustion modifications) are assumed
• PM: Controls according to current practices. No enhanced replacement of boilers and stoves in the residential/ commercial sector.
• Successful implementation of EURO emission standards for road vehicles according to national legislation/plans
• Replacement of VOC-emitting products and production equipment according to historic trends/replacement rates
Case B for “Current legislation”
• SO2: Uncontrolled emissions
• NOx: Uncontrolled emissions, except new LCPs where primary measures (combustion modifications) are assumed
• PM: Controls according to current practices. Replacement of boilers and stoves in the residential/commercial sector follow a "natural' replacement rate
• Road vehicles: Uncontrolled emissions
• VOC: Uncontrolled emissions
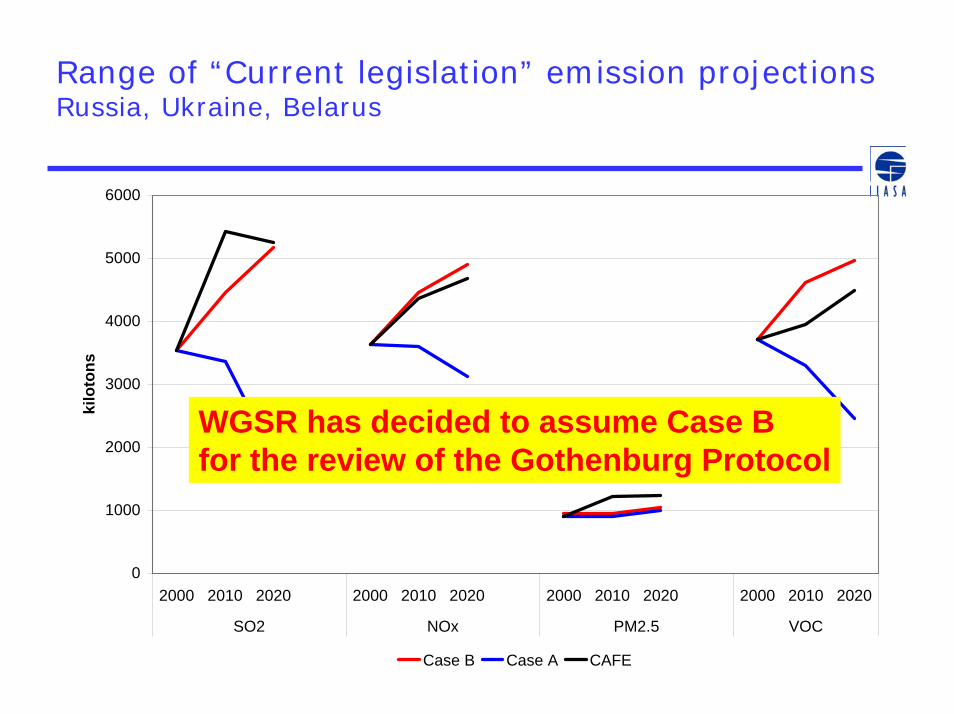
Range of “Current legislation” emission projectionsRussia, Ukraine, Belarus
0
1000
2000
3000
4000
5000
6000
2000 2010 2020 2000 2010 2020 2000 2010 2020 2000 2010 2020
SO2 NOx PM2.5 VOC
kilo
tons
Case B Case A CAFE
WGSR has decided to assume Case B for the review of the Gothenburg Protocol
Cost-effectiveness of ship emission controls
Cost-effectiveness of ship emission controls
Study for DG-ENV (IIASA/MSC-W/ENTEC):
• Updated emission projections for 2020
• New gridding of emissions
• Distinguishing ferries/freight vessels, 6 sea regions, in/outside of the 12 mile zones, EU/non-EU flags
• Cost-effectiveness of four packages of measures to achieve the TSAP targets in 2020
• Will be available on IIASA’s web site soon.

Packages of measures for ships (1)
BaselineSO2 Sulphur content as in the EU Marine Fuel Directive (OJ L 191/59,
2005): 1.5% S in residual oil for all ships in SECA (North Sea and Baltic Sea); 1.5% S fuel all passenger ships in other sea regions surrounding the European Union; 0.1% S fuel at berth in ports
NOx MARPOL NOx standards for ships built since 2000Ambition level 1 - all ships
SO2 As in the baselineNOx Slide valve retrofit on all slow-speed engines pre-2000
Internal engine modifications for all new engines post-2010
Ambition level 2 - all shipsSO2 0.5% S in residual oil or scrubbing equivalent (2g SO2/kWh) in SECA,
and for passenger vessels everywhere. Cargo vessels as in the baseline
NOx Slide valve retrofit on all slow-speed engines pre-2000Humid air motors for all new engines post-2010
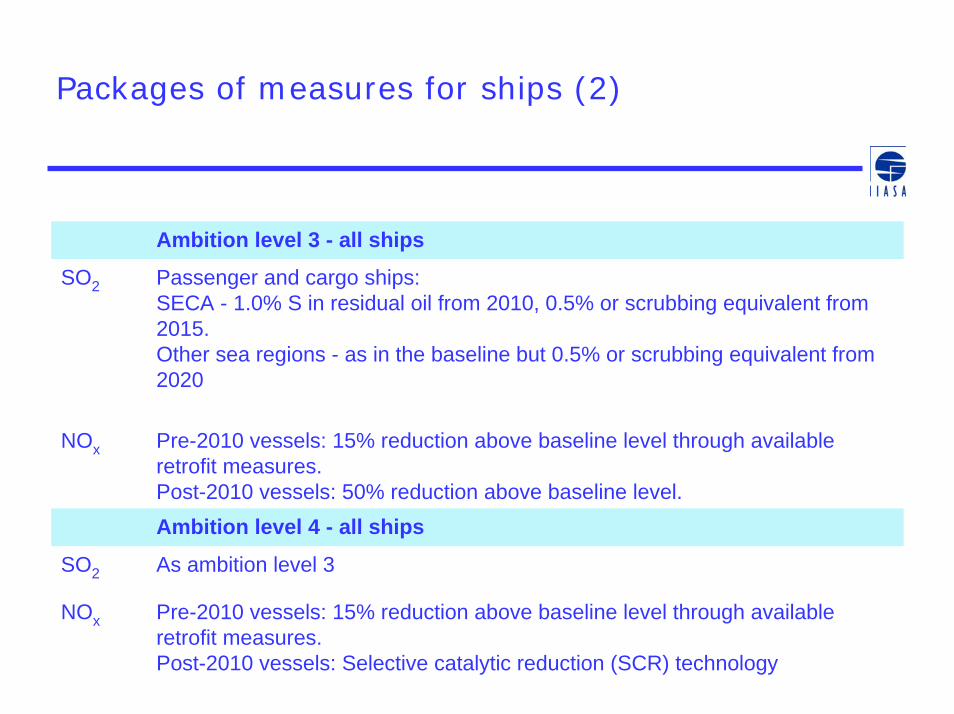
Packages of measures for ships (2)
Ambition level 3 - all ships
SO2 Passenger and cargo ships: SECA - 1.0% S in residual oil from 2010, 0.5% or scrubbing equivalent from 2015. Other sea regions - as in the baseline but 0.5% or scrubbing equivalent from 2020
NOx Pre-2010 vessels: 15% reduction above baseline level through available retrofit measures. Post-2010 vessels: 50% reduction above baseline level. Ambition level 4 - all ships
SO2 As ambition level 3
NOx Pre-2010 vessels: 15% reduction above baseline level through available retrofit measures. Post-2010 vessels: Selective catalytic reduction (SCR) technology
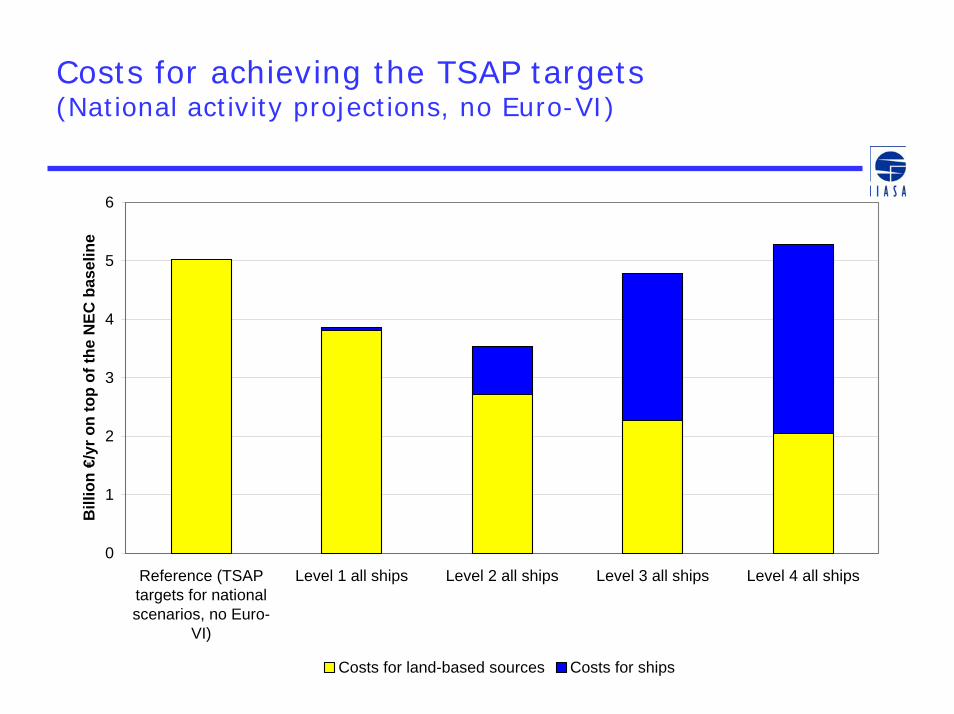
Costs for achieving the TSAP targets(National activity projections, no Euro-VI)
0
1
2
3
4
5
6
Reference (TSAPtargets for nationalscenarios, no Euro-
VI)
Level 1 all ships Level 2 all ships Level 3 all ships Level 4 all ships
Bill
ion
€/yr
on
top
of th
e N
EC b
asel
ine
Costs for land-based sources Costs for ships
Conclusions
For the integrated assessment modelling activities for the review of the Gothenburg Protocol:
• Choice of baseline assumptions on climate strategy and agricultural policy are most crucial for EU Member States.
• For non-EU countries, very sparse validated national information available. Assumptions on the implementation of existing regulations have strongest impact on results. WGSR has decided to assume Case B for the Gothenburg review.
• Control of international ship emissions appears as cost-effective.