Embed Size (px)
Citation preview
1
Alvanchi, A., Bajalan, Z. and Iravani, P. (2021), "Emission assessment of alternative dam 1 structure types, a novel approach to consider in new dam projects", Construction Innovation, 2 Vol. 21 No. 2, pp. 203-217. https://doi.org/10.1108/CI-08-2019-0074 3
4
Emission Assessment of Alternative Dam Structure Types, a Novel 5
Approach to Consider in New Dam Projects 6
7
Abstract 8
Purpose: Dams require high-volume of construction materials and operations over the life cycle. Selecting 9
a proper type of dam structure can significantly contribute to the sustainability of dam projects. 10
Methodology: This research proposes a complementary fuel consumption and carbon dioxide (CO2) 11
emission assessment method for the alternative dam structure types to assist decision-makers in selecting 12
sustainable choices. Related equations are developed for two common earthen and rock-fill dam structures 13
types in Iran. These equations are then successfully applied to two real dam project cases where the 14
significance of the achieved results are assessed and discussed. 15
Findings: The achieved results of the case studies demonstrate a high deviation of up to 41.3% in CO2 16
emissions comparing alternative dam structure scenarios of earthen and rock-fill dam structures. This high 17
deviation represents an important potential for CO2 emission reduction considering the high volume of the 18
emission in large dam projects. 19
Originality: The life cycle emission assessment of the alternative dam structures, proposed in this research 20
as a novel complementary factor, can be used in the decision-making process of dam projects. The results 21
in this research identify high potential sustainability improvement of dam projects as a result of the proposed 22
method. 23
24
Keywords: Dam structure; life cycle assessment; energy consumption; carbon dioxide emission; dam 25
construction; sustainability 26
This author accepted manuscript is deposited under a Creative Commons Attribution Non-commercial 4.0 International (CC BY-NC) licence. This means
that anyone may distribute, adapt, and build upon the work for non-commercial purposes, subject to full attribution. If you wish to use this manuscript
for commercial purposes, please contact [email protected].
2
1- INTRODUCTION 27
The expected benefits of many new dam construction projects have been challenged as s result of their 28
adverse impacts on sustainability. Environmental impacts of dam projects on air, land, and water are 29
subjects of many past studies. There is an extensive history of analyzing heavy metals concentration 30
increase in different dams in Turkey (e.g., Karadede and Unlü 2000; Öztürk et al. 2008; Özdemir et al. 31
2010; Uysal et al. 2010; Çiçek et al. 2013). Wei (2009) investigated the adverse impacts of dam construction 32
on the purification capacity of the water stream. Bako et al. (2014) reported soil degradation as a result of 33
the dams’ water penetration and heavy metal containment in areas around the Zobe dam in Nigeria. Air 34
pollution as a result of green gas emission of decomposable materials in the reservoir was investigated in 35
several research efforts conducted in past several years (Tremblay et al. 2004; IRN 2007; Mendonça et al. 36
2012; Deemer et al. 2016; Fearnside 2016; and Song et al. 2018). 37
In another perspective to the environmental sustainability caused by dam projects, the dam structure type 38
is an important component that can affect the sustainability over different phases of its life cycle. Various 39
types of materials, including concrete, soil, masonry, wood, and steel, have been used in the dam structures. 40
The use of masonry, wood, and steel materials in dam structures returns to the past centuries (Jansen, 1983; 41
Reynolds, 1989; Yang et al., 1999). Currently, dams are commonly made of concrete and soil materials 42
(Youdeowei, 2019; ASDSO 2020; TBDS 2020). According to the Association of State Dam Safety 43
Officials (ASDSO 2020), at the first level, dam structures can be categorized into the embankment dams 44
and the concrete dams. At the second level, the embankment dams are divided into the earthen dams and 45
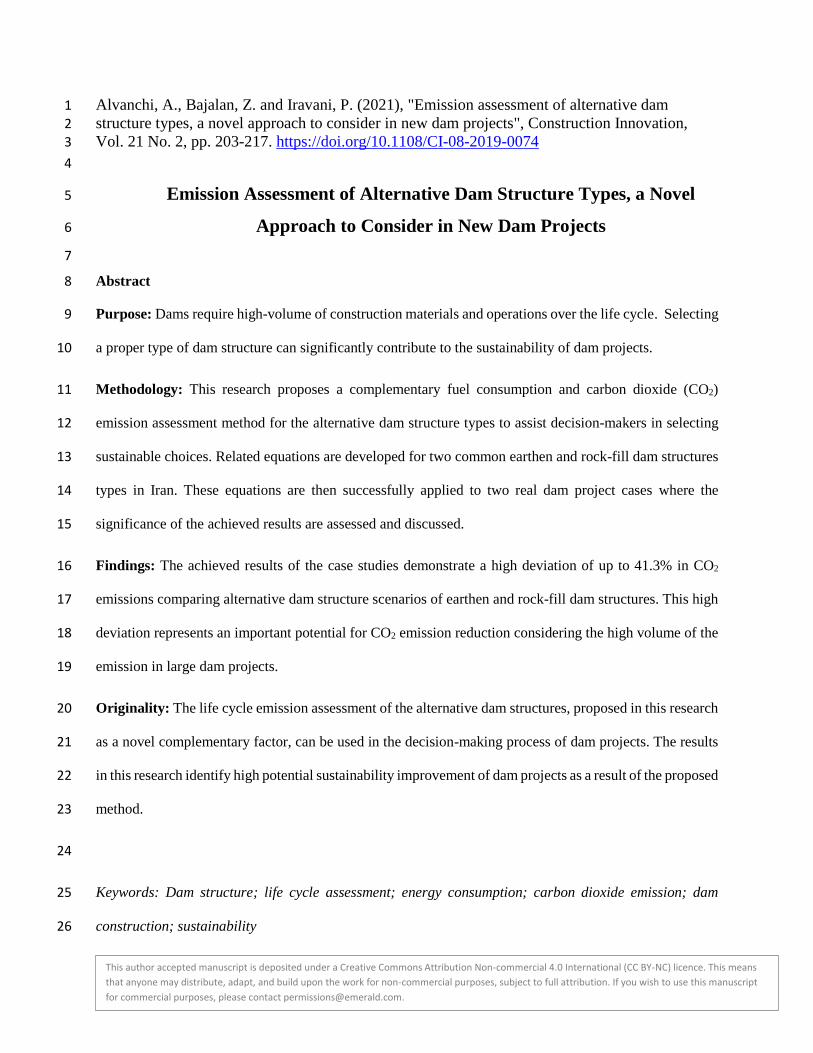
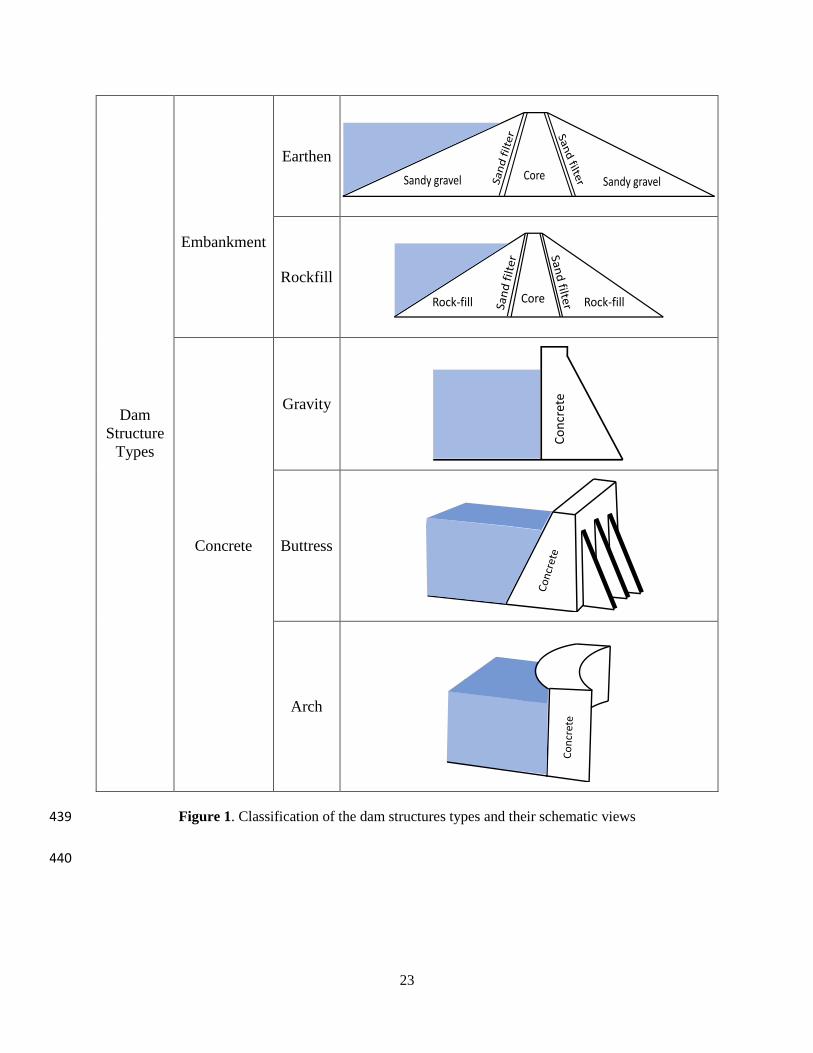
rockfill dams and the concrete dams are divided into gravity, buttress, and arch dams. Figure 1 illustrates 46
the classification of different dam structures and their typical schematic shapes. Only two studies were 47
found on the sustainability of dam structures, and both are performed in China. In a case study, Liu et al. 48
(2013) investigated life cycle emissions of rock-fill concrete and conventional concrete arch dam types. 49
The results indicated 55% of energy consumption and 64% of CO2 emission reduction in the rock-fill 50
concrete arch dam type compared to the conventional arch concrete dam type. Additionally, Zhang et al. 51
3
(2015) investigated CO2 emissions of rock-fill and concrete gravity dam types in the Nuozhadu 52
hydroelectric dam, China. The rock-fill dam resulted in a 24% less CO2 emission than the concrete gravity 53
dam. 54
[Insert Figure 1 here] 55
These case studies identified the dam structure type as the main contributor to the CO2 emission and energy 56
consumption over the life cycle. The achieved results put forward the importance of the selection of the 57
proper dam structure type as a contributor to the sustainable development of the dam projects. In many dam 58
project cases, project owners have choices for the dam structure type, while volume and types of materials 59
used in each dam structure type can significantly change. Therefore, different levels of sustainability are 60
expected during the life cycle when different types of dam structures are selected. Traditionally, dam 61
structure alternatives are compared according to their financial, economic, technical, and environmental 62
assessments. Past research has identified the significant impact of the adopted dam structure type on the 63
resulting emissions. This significant impact, however, motivates this research to propose emission 64
assessment of the alternative dam structures as a new complementary factor in the dam project decision-65
making process. Complementary information received from this assessment becomes an important 66
determinant especially when achieved values of the conventionally evaluated factors are relatively close. 67
Applicability and validity of the proposed approach are investigated in two dam project cases in Iran, where 68
emissions from two commonly used dam structure types are assessed. First, the widely used dam structure 69
types are identified in Iran. Then, life cycle energy consumption and CO2 emission evaluation equations 70
are developed for the defined dam structure types. Next, the developed equations are used for the life cycle 71
emission assessment of the dam project cases. Finally, the significance of the results achieved is discussed 72
in the research, and their correspondence is demonstrated with past research. 73
2- COMMON DAM STRUCTURES TYPES IN IRAN 74
4
The semi-arid climate and the limited available water resources have triggered the construction of many 75
new dam projects in Iran. According to Iran Water Resource Management Co. (IWRMC 2018), currently, 76
more than 100 large dams are under construction, and more than 500 new dam projects are under-study in 77
Iran. Embankment dams are the most common dam structures in these projects. Two embankment dam 78
structures types of earthen dams with a clay core and rock-fill dams with a clay core are the main alternative 79
dam structures. Therefore, the focus of this investigation was set on the emission assessment of these two 80
alternative dam types. 81
3- LIFE CYCLE EMISSION EVALUATION OF EMBANKMENT DAM STRUCTURES 82
Emissions from embankment dam structures are mainly results of various material handling and mechanical 83
operations performed on the dam materials over the life cycles. An overall emission of a dam structure can 84
be estimated as a summation of the emissions separately estimated in production, construction, 85
maintenance, and removal phases. Diesel fuel is the main source of energy used in various equipment 86
involved in processing embankment dam materials in different phases of the dam projects. Therefore, 87
equivalent diesel fuel consumption can be used for representing energy consumption. This equivalency, 88
however, is subject to the diesel fuel properties and the performance of the equipment used for processing 89
dam materials. Staffell (2011) presents nine different sources that report on different energy density for 90
diesel fuel with a limited deviation of 2%. The average diesel energy density value of 35.94 Megajoule per 91
liter (or MJ/liter) (Staffell, 2011) was accounted for the development of the emission estimation equations. 92
In cases that other fossil fuel types are also consumed, an equivalent energy density value of those fuel 93
types can be used instead. For example, according to Staffell (2011), the average equivalent energy density 94
value for natural gas is 35.22 Megajoule per cubic meter (or MJ/ m3), for gasoline is 32.70 (MJ / liter) and 95
for coal is 25.75 Megajoule per kilogram (or MJ/ kg). 96
It is assumed that the adopted dam structure type has a negligible impact on the formation of other parts of 97
the dam project, including the dam reservoir and the hydro-power plant. Therefore, the developed equations 98
in this study only target the life cycle assessment (LCA) of the emissions created directly from the dam 99
5
structure. Emissions from other parts of the dam project are assumed equal and non-determinant in the 100
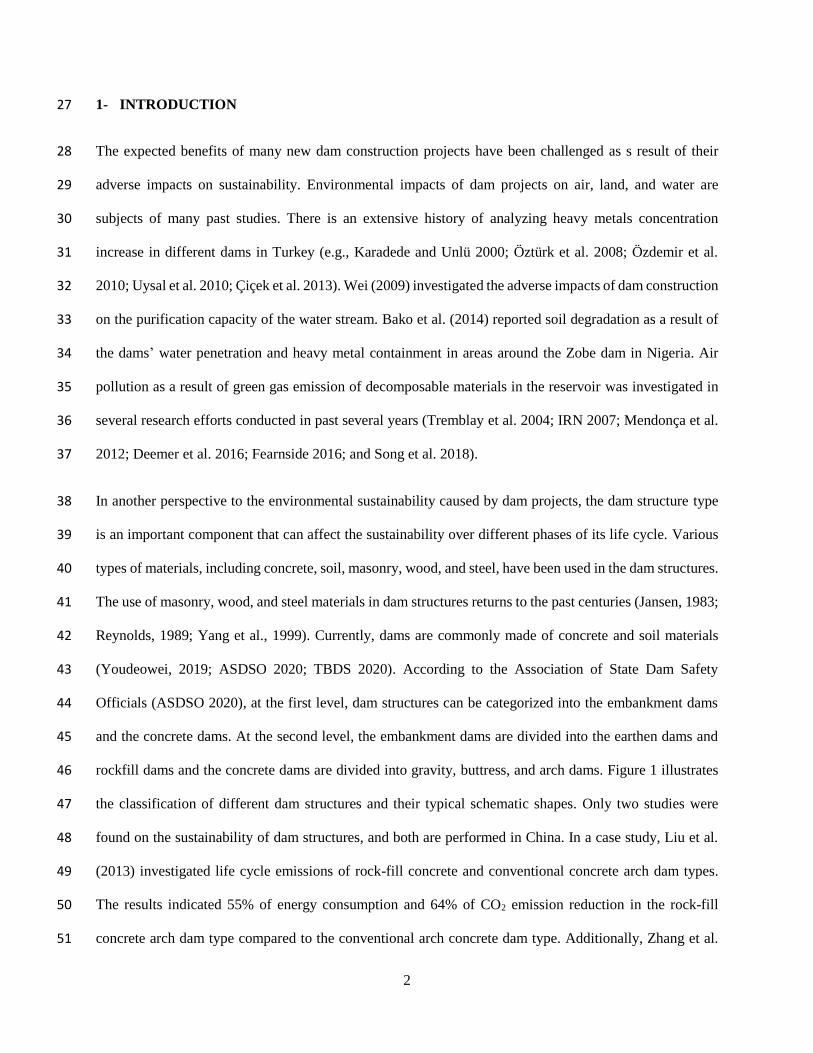
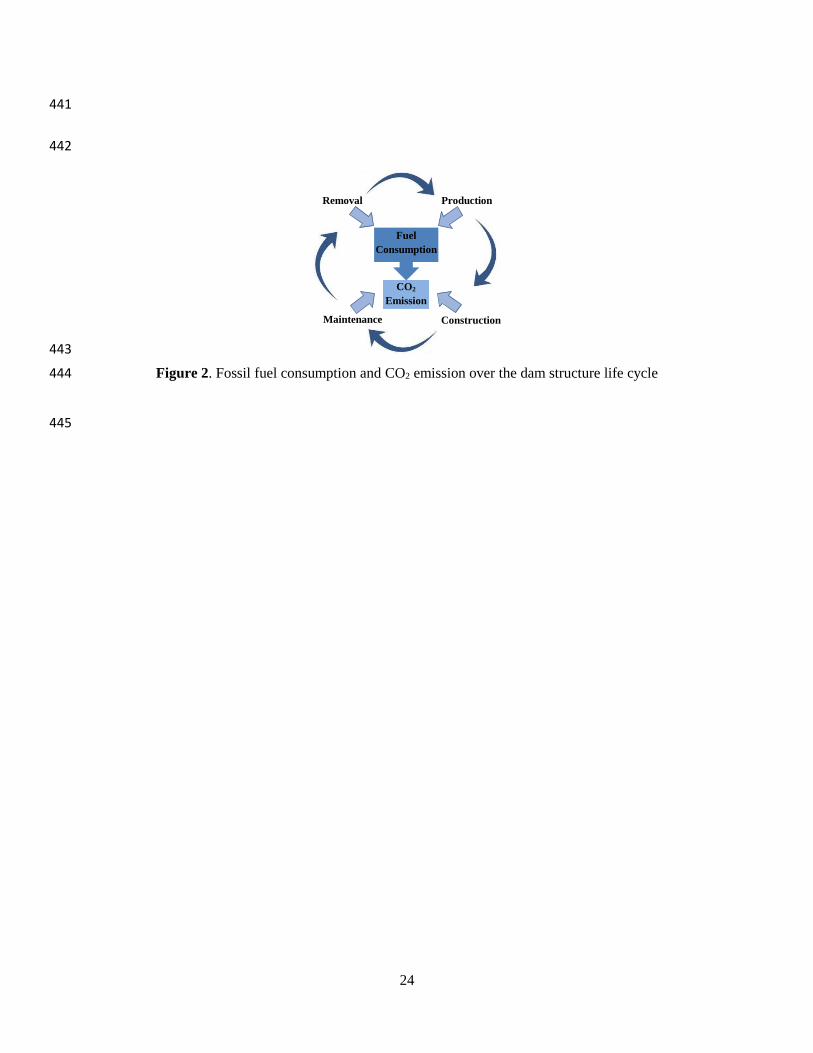
decision regarding the proper type of dam structure. Figure 2 represents the overall picture of the research 101
method. Further explanations about the emission estimation of the dam structure in different phases of a 102
dam project are provided in the rest of the section. 103
[Insert Figure 2 here] 104
3-1- Emission Estimation in the Production Phase 105
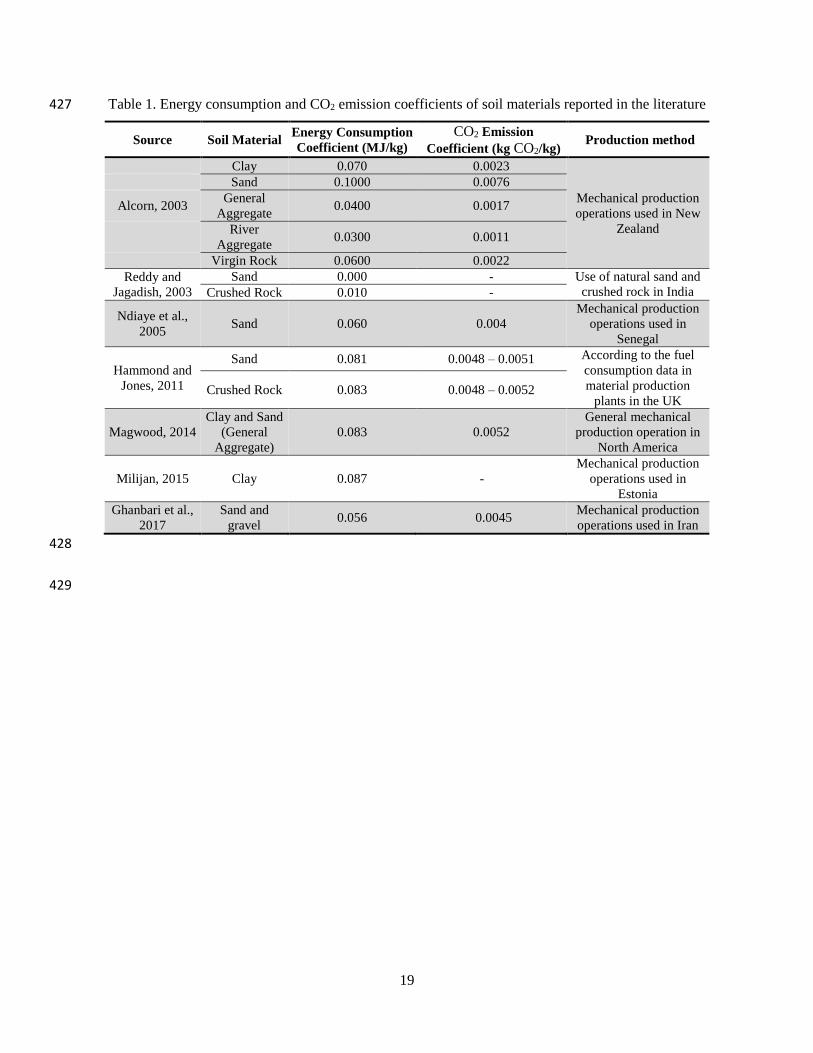
Clay, sand, and crushed rock are the main materials used in different types of embankment dams. Past 106
research efforts have estimated the emissions from the production of these materials according to the 107
regional conditions, as presented in Table 1. Emission coefficients of the construction materials, 108
representing the rate of emissions for the production of one kilogram of the material, is an output of these 109
research efforts. Table 1 presents energy consumption and CO2 emission coefficients estimated in these 110
research efforts conducted in different parts of the world. The energy consumption coefficients are 111
presented in the Megajoule of energy consumed per kilogram of materials produced (or MJ/kg). The CO2 112
emission coefficients are represented in kilograms of CO2 emission per kilogram of the materials produced 113
(or kg CO2/ kg). Expectedly, regional conditions, such as quarry material properties and production 114
methods, have contributed to the values achieved in the energy consumption coefficients. Value ranges are 115
seen for emission coefficients of similar construction materials as presented in Table 1. Here, especially 116
high deviation is seen between production emission coefficients of the naturally extracted aggregates and 117
mechanically produced aggregates. For example, Reddy and Jagadish (2003) reported zero energy 118
consumption for natural sand. However, the energy consumption coefficient of mechanically produced sand 119
material was reported up to 0.10 Megajoule per kilogram (Ndiaye, 2001). Limited deviations are, though, 120
observed for the emission coefficients of the aggregates produced by similar methods, e.g., the mechanical 121
operations. 122
[Insert Table 1 here] 123
6
Earthmoving equipment, such as shovels, loaders, and dozers, are involved in the material production 124
process of embankment dams. Currently, the prevalent fuel consumed in the earthmoving equipment is 125
diesel. However, other types of fuels might be consumed, such as natural gas and gasoline. Furthermore, 126
electrical equipment is also involved in the production processes of materials, such as electric motors and 127
pumps used in conveyors and crushers. It should be noted that electricity is not a primary source of energy. 128
According to IEA (2019), the majority source of electricity generation comes from fossil fuel, including 129
coal, natural gas, and oil. Since many mines are located in remote areas, far from main electricity lines, 130
many of them directly use diesel-generators on-site for generating electricity. In such cases, the consumed 131
diesel need to be estimated and added to the diesel fuel consumed in the other equipment. If electricity is 132
generated from other sources of energy, they also need to be accounted for. Equations 1 estimates diesel 133
consumption in the production phase according to the material weight, energy consumption coefficient for 134
the material production, and the diesel energy density value of 35.94 MJ / liter (Staffell, 2011). Similar 135
equations need to be used in cases that other fossil fuel types are consumed by replacing diesel energy 136
density value of 35.94 MJ/liter with the related fuel energy density values. Equation 2 estimates the CO2 137
emission of the material production based on the weight of the material and its CO2 emission coefficient in 138
the production phase. Adopting emission coefficients of each construction material from the coefficients 139
estimated based on the prevalent material production techniques in the region increases the accuracy of the 140
result. Average values need to be adopted in case emission coefficients are not available for the specific 141
region. 142
Diesel (liter) = 𝑀𝑎𝑡𝑒𝑟𝑖𝑎𝑙 𝑤𝑒𝑖𝑔ℎ𝑡 (𝑘𝑔) × 𝐸𝑛𝑒𝑟𝑔𝑦 𝑐𝑜𝑛𝑠𝑢𝑚𝑝𝑡𝑖𝑜𝑛 𝑐𝑜𝑒𝑓𝑓𝑖𝑐𝑖𝑒𝑛𝑡 𝑜𝑓 𝑡ℎ𝑒 𝑚𝑎𝑡𝑒𝑟𝑖𝑎𝑙 (
𝑀𝐽
𝑘𝑔 𝑜𝑓 𝑚𝑎𝑡𝑒𝑟𝑖𝑎𝑙)
35.94 (𝑀𝐽
𝑙𝑖𝑡𝑟𝑒 𝑜𝑓 𝑑𝑖𝑒𝑠𝑒𝑙)
(1) 143
CO2 (kg) = 𝑀𝑎𝑡𝑒𝑟𝑖𝑎𝑙 𝑤𝑒𝑖𝑔ℎ𝑡 (𝑘𝑔) × 𝐶𝑂2 𝑒𝑚𝑖𝑠𝑠𝑖𝑜𝑛 𝑐𝑜𝑒𝑓𝑓𝑖𝑐𝑖𝑒𝑛𝑡 𝑜𝑓 𝑡ℎ𝑒 𝑚𝑎𝑡𝑒𝑟𝑖𝑎𝑙 (𝑘𝑔 𝑜𝑓 𝐶𝑂2
𝑘𝑔 𝑜𝑓 𝑚𝑎𝑡𝑒𝑟𝑖𝑎𝑙) (2) 144
3-2- Emission Estimation in the Construction Phase 145
The massive material movement is the main source of emission in the construction phase. Various 146
operations done in this phase can be divided into three different parts, including 1) land preparation, 2) 147
7
material transportation, and 3) material placement. In the land preparation operation, land clearing and 148
excavation is done by different earthmoving equipment to reach the required depth. Then, loaders load 149
different dam materials on the hauling trucks and haul materials from material quarry sites to the dam site. 150
Spreading, watering, and compacting are major activities done by different construction equipment during 151
material placement operation. In this operation, various layers of earthen and rock-fill dam structures are 152
built such as core, shell, filter, and drain. The majority of the emission in the construction phase is the result 153
of diesel fuel combustion in the mobile earthmoving equipment engines. Therefore, first, the volume of 154
diesel fuel consumption in the construction equipment engines is estimated for estimating emission in the 155
construction phase. The resulting CO2 emission is then estimated based on the volume of the consumed 156
diesel fuel. 157
In regards to the fuel consumption estimation method, construction equipment can be divided into two 158
groups: material hauling trucks and on-site material handling equipment (RazaviAlavi 2010). While for the 159
hauling trucks rate of the diesel fuel consumption is estimated per kilometer of the hauling distance, the 160
rate of diesel fuel consumption for the on-site equipment is estimated based on the hours of operation. 161
Equation 3 presents the diesel consumption of the hauling trucks traveling between the dam construction 162
site and a specific source of the material. Here, diesel consumption is estimated based on the number and 163
distance of round trips between the material source and the dam site, and the average diesel consumption 164
rate of the hauling trucks. Overall, the diesel fuel consumption of the hauling trucks is estimated as the 165
summation of the estimated fuel consumption for different materials supplied from various sources. 166
Equation 4 presents the diesel consumption of on-site equipment, performing a specific type of material 167
handling activity. The total operating hours of specific equipment is estimated by dividing the volume of 168
the handled material over the hourly rate of the material handling operation of the equipment. Furthermore, 169
according to USEPA (2015), every liter of diesel fuel combustion in construction equipment emits 2.697 170
kg of CO2. This factor is used in Equation 5 for estimating equivalent CO2 emission of the diesel fuel 171
consumed in different on-site mobile construction equipment. 172
8
𝐷𝑖𝑒𝑠𝑒𝑙 𝐶𝑜𝑛𝑠𝑡𝑢𝑚𝑝𝑡𝑖𝑜𝑛 𝑜𝑓 𝑡ℎ𝑒 𝐻𝑎𝑢𝑙𝑖𝑛𝑔 𝑇𝑟𝑢𝑐𝑘𝑠 (𝑙𝑖𝑡𝑒𝑟) = 𝑁𝑢𝑚𝑏𝑒𝑟 𝑜𝑓 𝑇𝑟𝑖𝑝𝑠 × 𝑅𝑜𝑢𝑛𝑑 𝑇𝑟𝑖𝑝 𝐷𝑖𝑠𝑡𝑎𝑛𝑐𝑒 (𝑘𝑚) ×173
𝐴𝑣𝑒𝑟𝑎𝑔𝑒 𝐷𝑖𝑒𝑠𝑒𝑙 𝑐𝑜𝑛𝑠𝑢𝑚𝑝𝑡𝑖𝑜𝑛 𝑟𝑎𝑡𝑒 (𝑙𝑖𝑡𝑒𝑟
𝑘𝑚 ) (3) 174
𝐷𝑖𝑒𝑠𝑒𝑙 𝐶𝑜𝑛𝑠𝑡𝑢𝑚𝑝𝑡𝑖𝑜𝑛 𝑜𝑓𝑡ℎ𝑒 𝑂𝑛𝑠𝑖𝑡𝑒 𝑀𝑎𝑡𝑒𝑟𝑖𝑎𝑙 𝐻𝑎𝑛𝑑𝑙𝑖𝑛𝑔 𝐸𝑞𝑢𝑖𝑝𝑚𝑒𝑛𝑡 (𝑙𝑖𝑡𝑒𝑟) =𝑉𝑜𝑙𝑢𝑚𝑒 𝑜𝑓 𝑠𝑜𝑖𝑙(𝑚3)
𝐸𝑞𝑢𝑖𝑝𝑚𝑒𝑛𝑡 𝑜𝑝𝑒𝑟𝑎𝑡𝑖𝑜𝑛 𝑟𝑎𝑡𝑒 (𝑚3
ℎ)
×175
𝐷𝑖𝑒𝑠𝑒𝑙 𝑐𝑜𝑛𝑠𝑢𝑚𝑝𝑡𝑖𝑜𝑛 𝑟𝑎𝑡𝑒 (𝑙𝑖𝑡𝑒𝑟
ℎ𝑜𝑢𝑟) (4) 176
CO2 (kg) = 𝐷𝑖𝑒𝑠𝑒𝑙 𝑐𝑜𝑛𝑠𝑢𝑚𝑝𝑡𝑖𝑜𝑛 𝑖𝑛 𝑒𝑞𝑢𝑖𝑝𝑚𝑒𝑛𝑡 (𝑙𝑖𝑡𝑒𝑟) × 2.697 (𝑘𝑔 𝑜𝑓 𝐶𝑂2
𝑙𝑖𝑡𝑒𝑟 𝑜𝑓 𝑑𝑖𝑒𝑠𝑒𝑙) (5) 177
3-3- Emission Estimation in the Operation and Maintenance Phase 178
Various operation and maintenance activities are performed during the long life span of the dams. However, 179
the focus of this research is on the dam structure and only related operation and maintenance activities to 180
the dam structure are of concern. The majority of the operation and maintenance activities, such as the 181
reservoir’s dredging, the reservoir’s vegetation control, and the hydroelectric generator operation, are done 182
regardless of the dam structure type. Concerning the studied dam structure types, i.e., the embankment dam 183
types, control of vegetation is an activity required during the operation and maintenance phase. Control of 184
the vegetation requires special attention for the dams located on the humid climates with high annual rainfall 185
and dense vegetation coverage. In general, different techniques such as bowing and the use of herbicides 186
are used for controlling the vegetation. The volume of materials used and handled during these activities, 187
however, are quite low compared to the construction phase. Furthermore, the majority parts of Iran lies in 188
the semi-arid regions with low vegetation coverage. Therefore, limited care is expected to control the 189
vegetation coverage of the dams in the country. In another perspective, errors that occurred during the 190
design and construction can cause problems in the dam structure during the operation and maintenance 191
phase. Here, crack, erosion, and seepage issues are sample problems. In such cases, maintenance activities 192
might get quite extensive. This study, however, does not capture the risk of possible mistakes made during 193
the design and construction of dams. No corrective maintenance activities are considered in the research. 194
Therefore, the resulting emissions from the dam structure were considered relatively minimal in the 195
operation and maintenance phase compared to the production and construction phases. 196
9
3-4- Emission Estimation in the Removal Phase 197
Various dam removal strategies might be considered depending on the dam-site condition. Recycling 198
materials, using them in other construction projects (Mulder 2007), and using a portion of them for the 199
restoration of the dam area (USSD 2015) are among the options. Different removal strategies can create a 200
different volume of emissions. For embankment dams, however, if original borrow areas of dam materials 201
are available, they are usually the best choices to place dam removal materials (Hepler 2013; USSD 2015). 202
For the emission estimation, unless other strategies are indicated, it can be considered that materials 203
removed from a dam structure are placed into their original borrow locations. In such a case, dam materials 204
are excavated from the dam structure and loaded on the hauling trucks to be hauled to their original quarries. 205
Equations 3, 4, and 5 can be respectively used for estimating diesel fuel consumption of the hauling trucks, 206
the diesel fuel consumption of the on-site earthmoving equipment, and the resulting CO2 emissions. 207
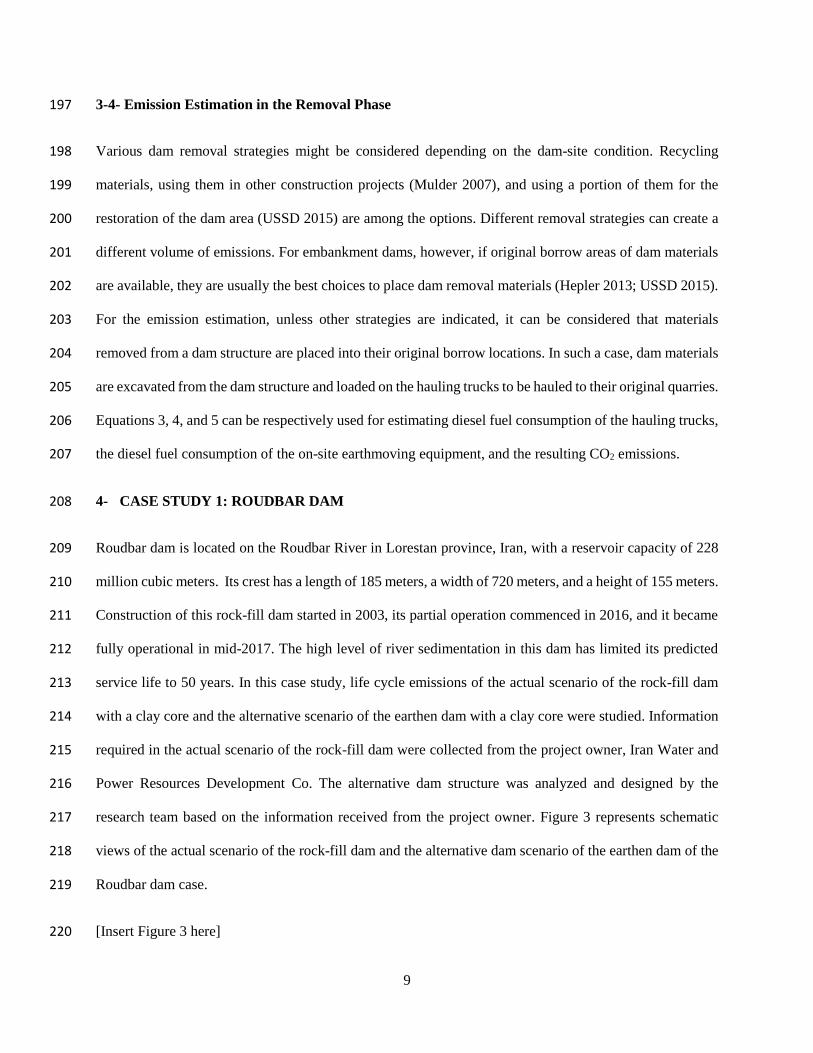
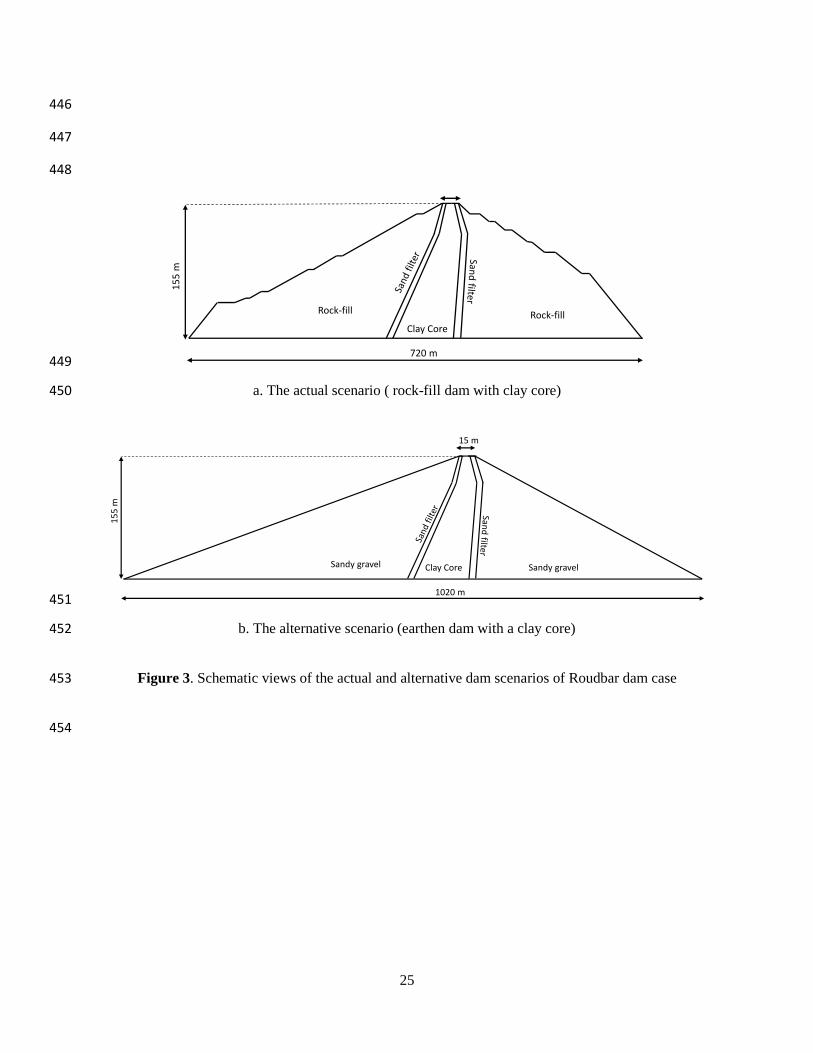
4- CASE STUDY 1: ROUDBAR DAM 208
Roudbar dam is located on the Roudbar River in Lorestan province, Iran, with a reservoir capacity of 228 209
million cubic meters. Its crest has a length of 185 meters, a width of 720 meters, and a height of 155 meters. 210
Construction of this rock-fill dam started in 2003, its partial operation commenced in 2016, and it became 211
fully operational in mid-2017. The high level of river sedimentation in this dam has limited its predicted 212
service life to 50 years. In this case study, life cycle emissions of the actual scenario of the rock-fill dam 213
with a clay core and the alternative scenario of the earthen dam with a clay core were studied. Information 214
required in the actual scenario of the rock-fill dam were collected from the project owner, Iran Water and 215
Power Resources Development Co. The alternative dam structure was analyzed and designed by the 216
research team based on the information received from the project owner. Figure 3 represents schematic 217
views of the actual scenario of the rock-fill dam and the alternative dam scenario of the earthen dam of the 218
Roudbar dam case. 219
[Insert Figure 3 here] 220
10
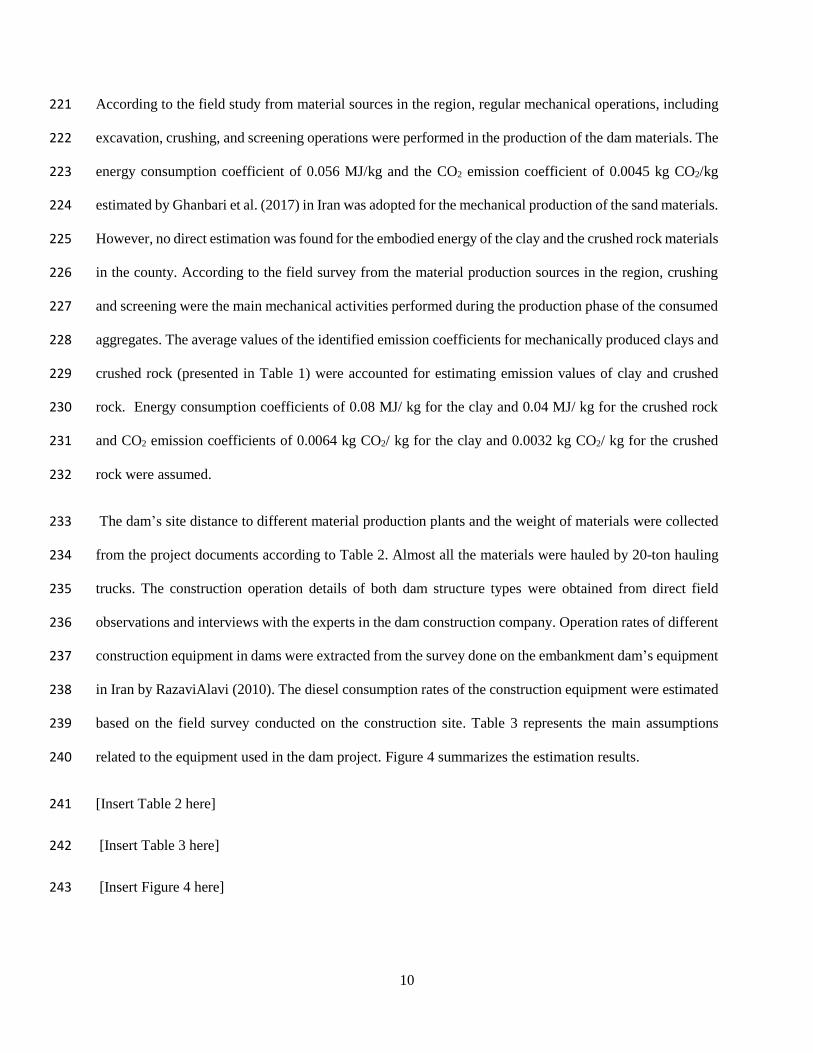
According to the field study from material sources in the region, regular mechanical operations, including 221
excavation, crushing, and screening operations were performed in the production of the dam materials. The 222
energy consumption coefficient of 0.056 MJ/kg and the CO2 emission coefficient of 0.0045 kg CO2/kg 223
estimated by Ghanbari et al. (2017) in Iran was adopted for the mechanical production of the sand materials. 224
However, no direct estimation was found for the embodied energy of the clay and the crushed rock materials 225
in the county. According to the field survey from the material production sources in the region, crushing 226
and screening were the main mechanical activities performed during the production phase of the consumed 227
aggregates. The average values of the identified emission coefficients for mechanically produced clays and 228
crushed rock (presented in Table 1) were accounted for estimating emission values of clay and crushed 229
rock. Energy consumption coefficients of 0.08 MJ/ kg for the clay and 0.04 MJ/ kg for the crushed rock 230
and CO2 emission coefficients of 0.0064 kg CO2/ kg for the clay and 0.0032 kg CO2/ kg for the crushed 231
rock were assumed. 232
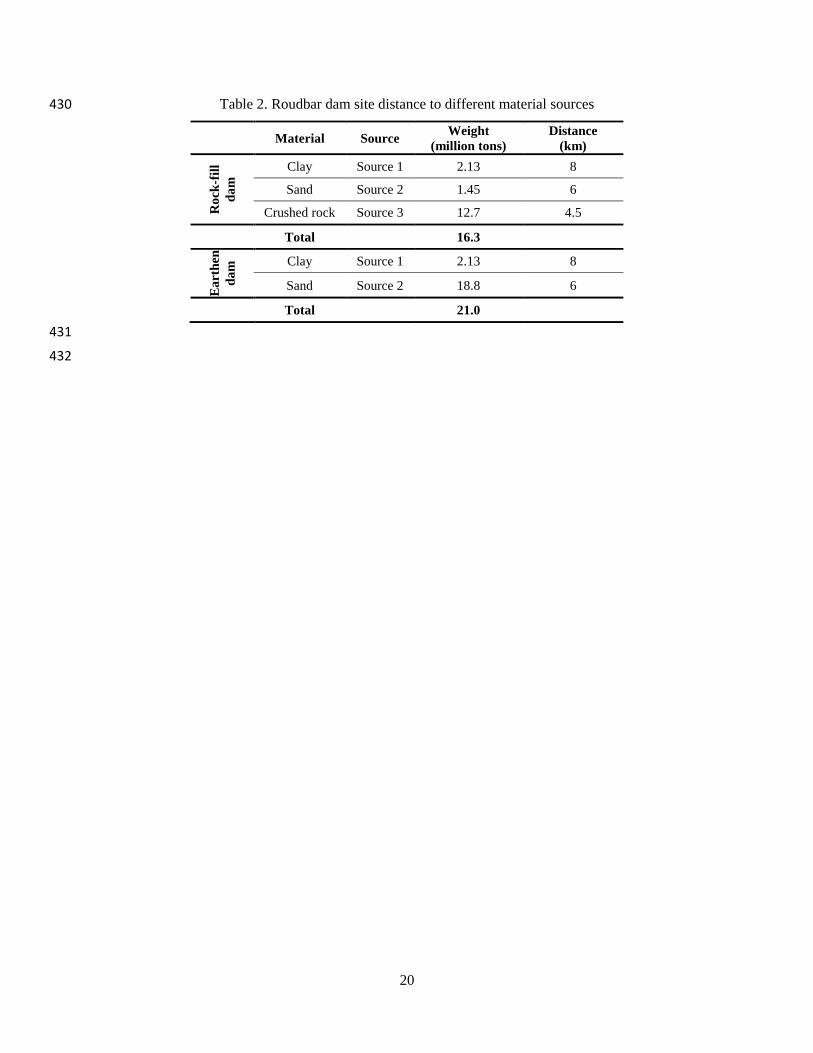
The dam’s site distance to different material production plants and the weight of materials were collected 233
from the project documents according to Table 2. Almost all the materials were hauled by 20-ton hauling 234
trucks. The construction operation details of both dam structure types were obtained from direct field 235
observations and interviews with the experts in the dam construction company. Operation rates of different 236
construction equipment in dams were extracted from the survey done on the embankment dam’s equipment 237
in Iran by RazaviAlavi (2010). The diesel consumption rates of the construction equipment were estimated 238
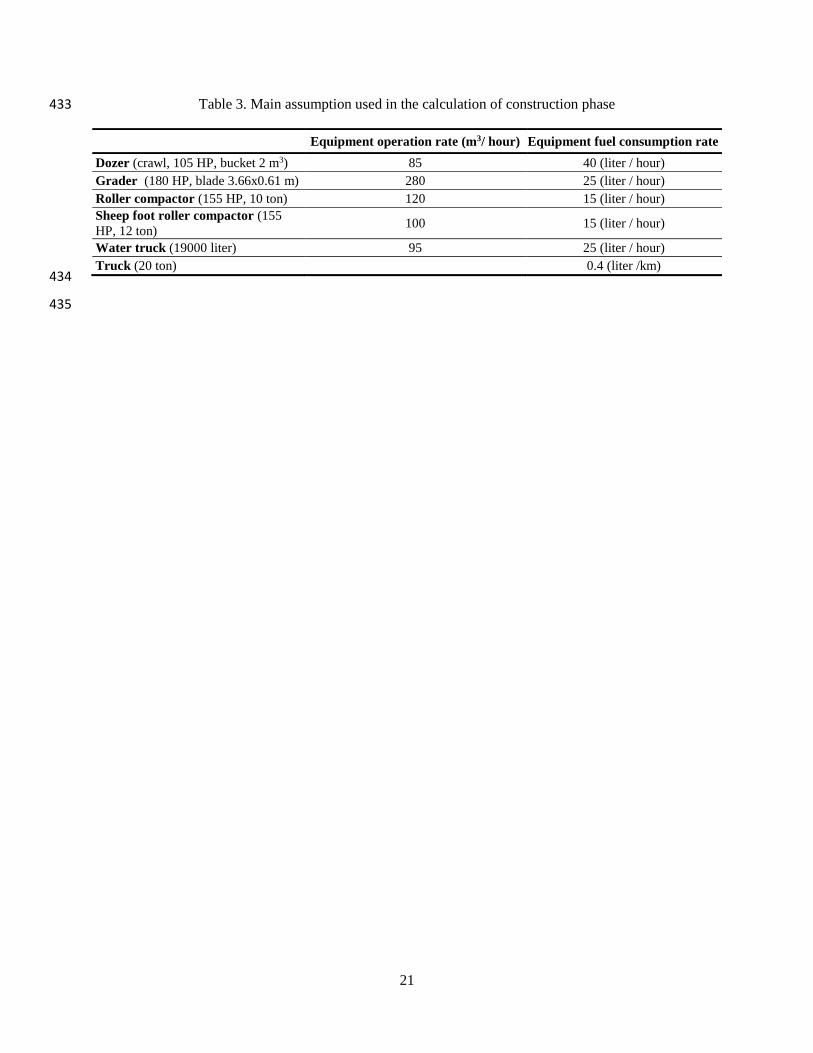
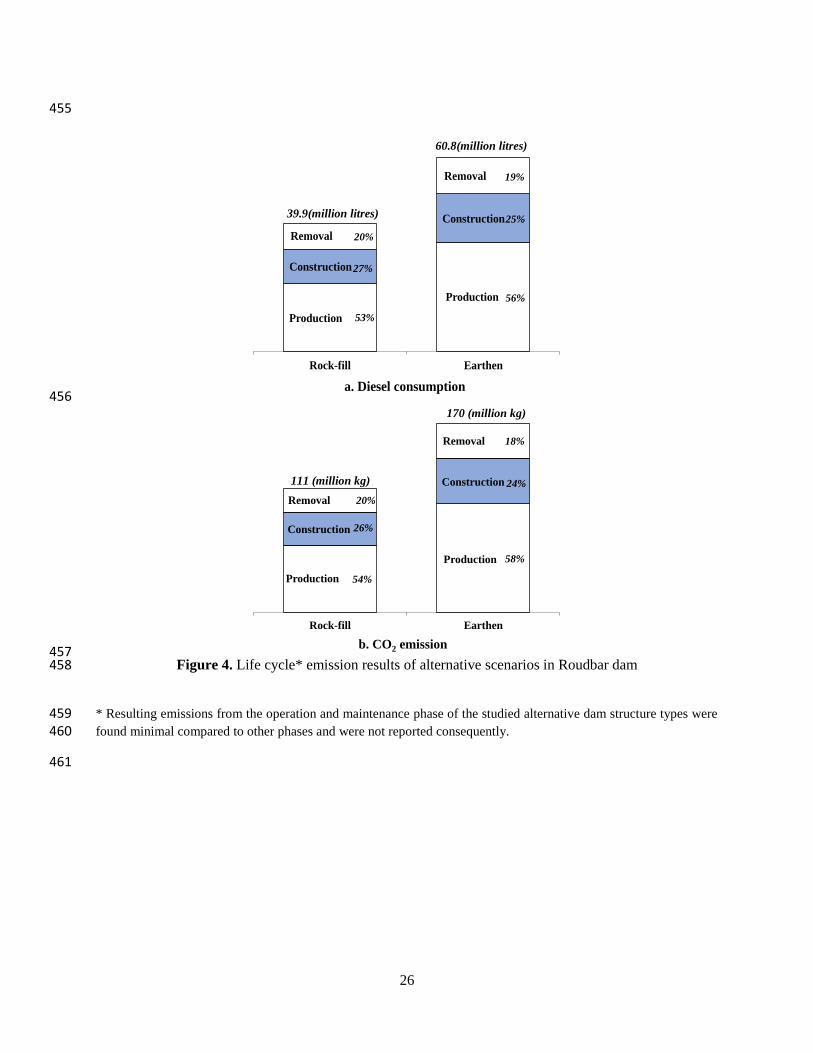
based on the field survey conducted on the construction site. Table 3 represents the main assumptions 239
related to the equipment used in the dam project. Figure 4 summarizes the estimation results. 240
[Insert Table 2 here] 241
[Insert Table 3 here] 242
[Insert Figure 4 here] 243
11
The achieved results suggest 34.3% fewer emissions in the actual scenario of the rock-fill dam than the 244
earthen dam. In both scenarios, material production is responsible for the majority of emissions followed 245
by the construction and removal phases. 246
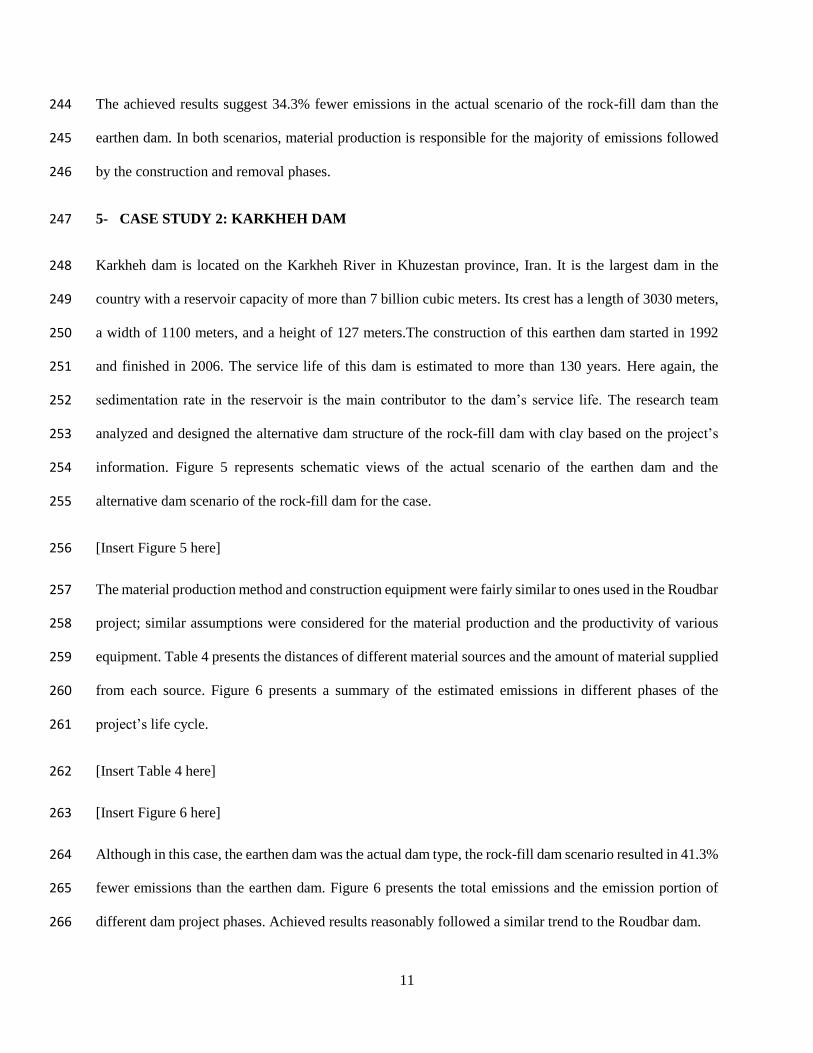
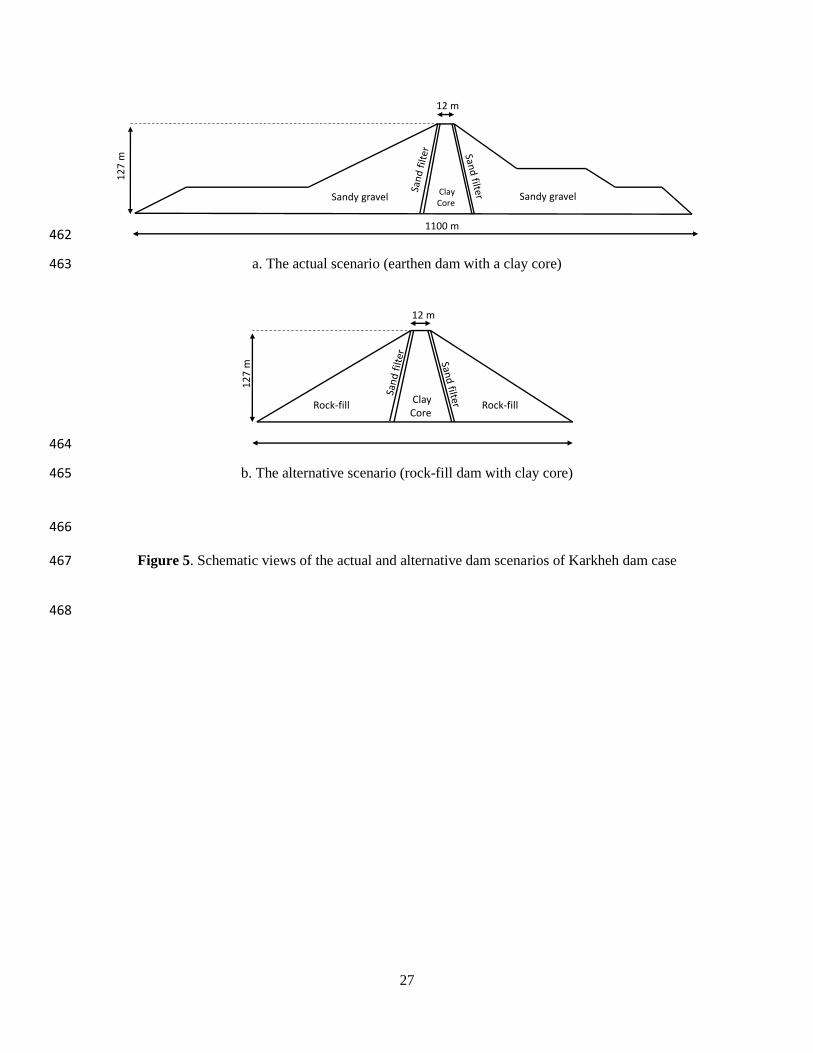
5- CASE STUDY 2: KARKHEH DAM 247
Karkheh dam is located on the Karkheh River in Khuzestan province, Iran. It is the largest dam in the 248
country with a reservoir capacity of more than 7 billion cubic meters. Its crest has a length of 3030 meters, 249
a width of 1100 meters, and a height of 127 meters.The construction of this earthen dam started in 1992 250
and finished in 2006. The service life of this dam is estimated to more than 130 years. Here again, the 251
sedimentation rate in the reservoir is the main contributor to the dam’s service life. The research team 252
analyzed and designed the alternative dam structure of the rock-fill dam with clay based on the project’s 253
information. Figure 5 represents schematic views of the actual scenario of the earthen dam and the 254
alternative dam scenario of the rock-fill dam for the case. 255
[Insert Figure 5 here] 256
The material production method and construction equipment were fairly similar to ones used in the Roudbar 257
project; similar assumptions were considered for the material production and the productivity of various 258
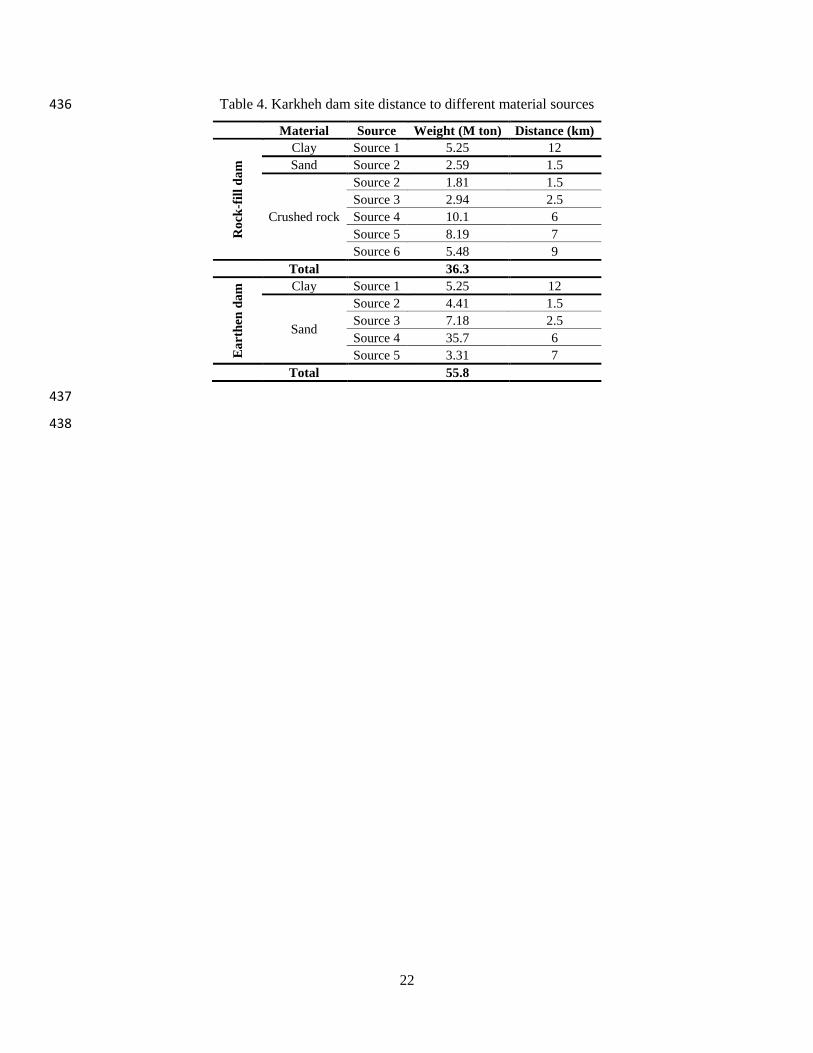
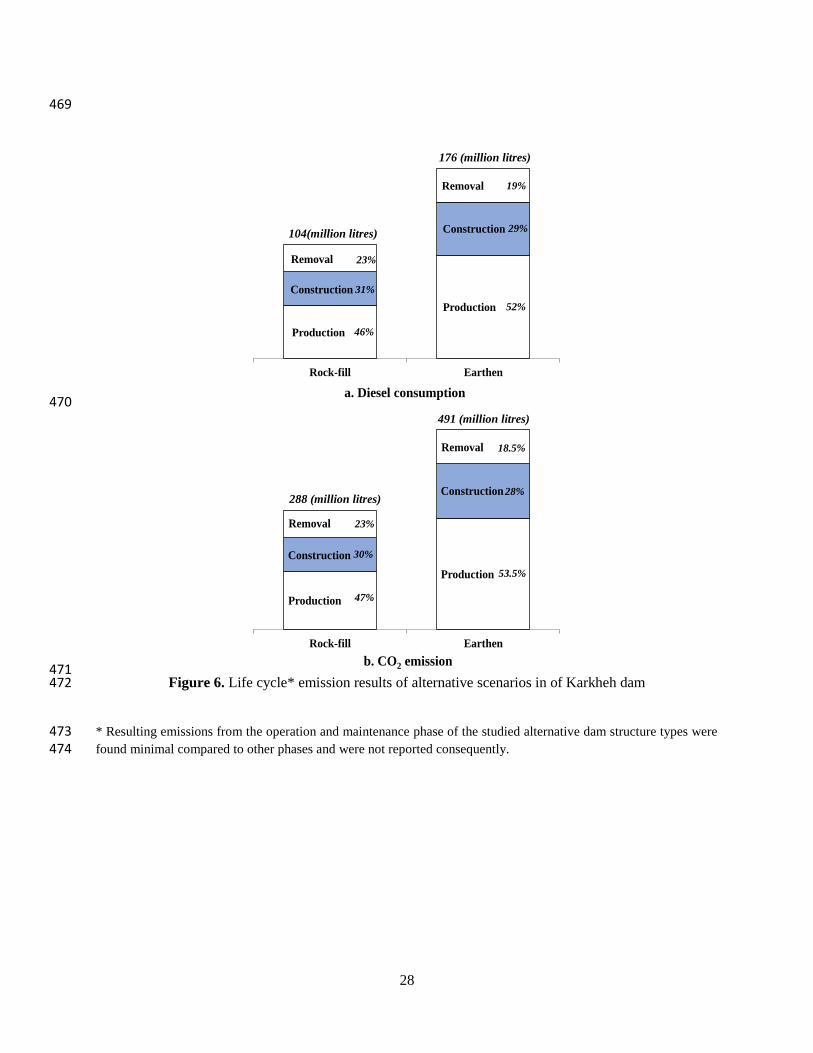
equipment. Table 4 presents the distances of different material sources and the amount of material supplied 259
from each source. Figure 6 presents a summary of the estimated emissions in different phases of the 260
project’s life cycle. 261
[Insert Table 4 here] 262
[Insert Figure 6 here] 263
Although in this case, the earthen dam was the actual dam type, the rock-fill dam scenario resulted in 41.3% 264
fewer emissions than the earthen dam. Figure 6 presents the total emissions and the emission portion of 265
different dam project phases. Achieved results reasonably followed a similar trend to the Roudbar dam. 266
12
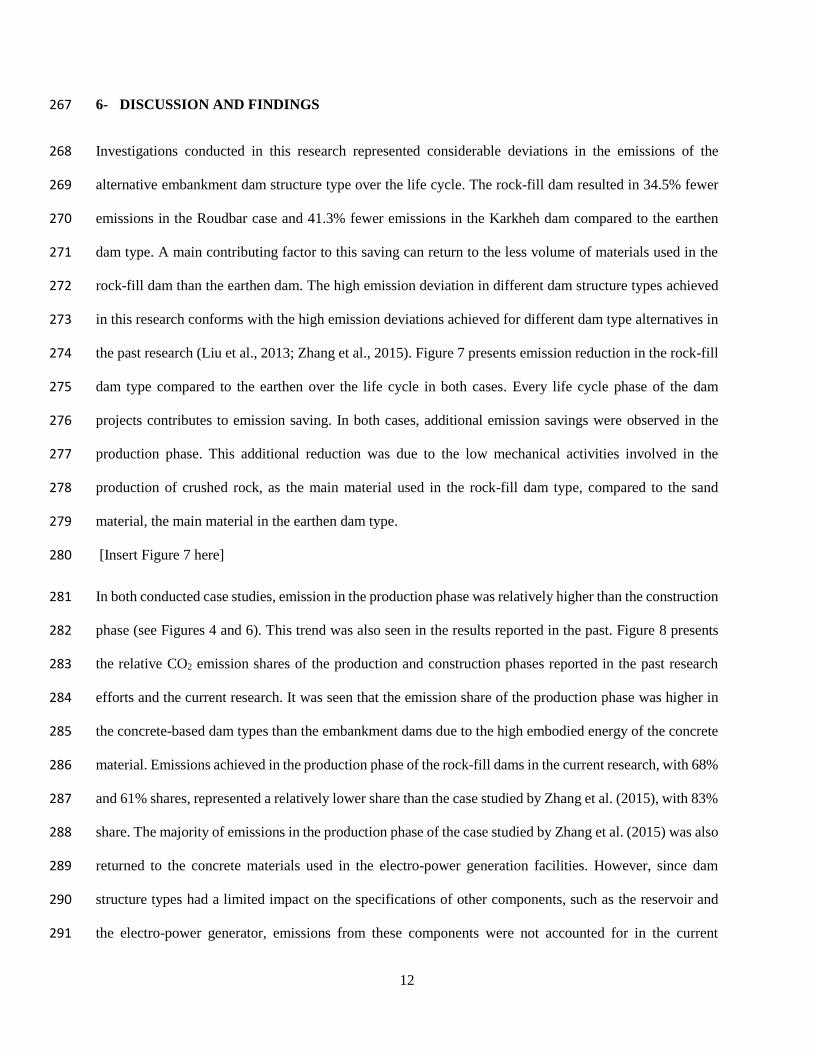
6- DISCUSSION AND FINDINGS 267
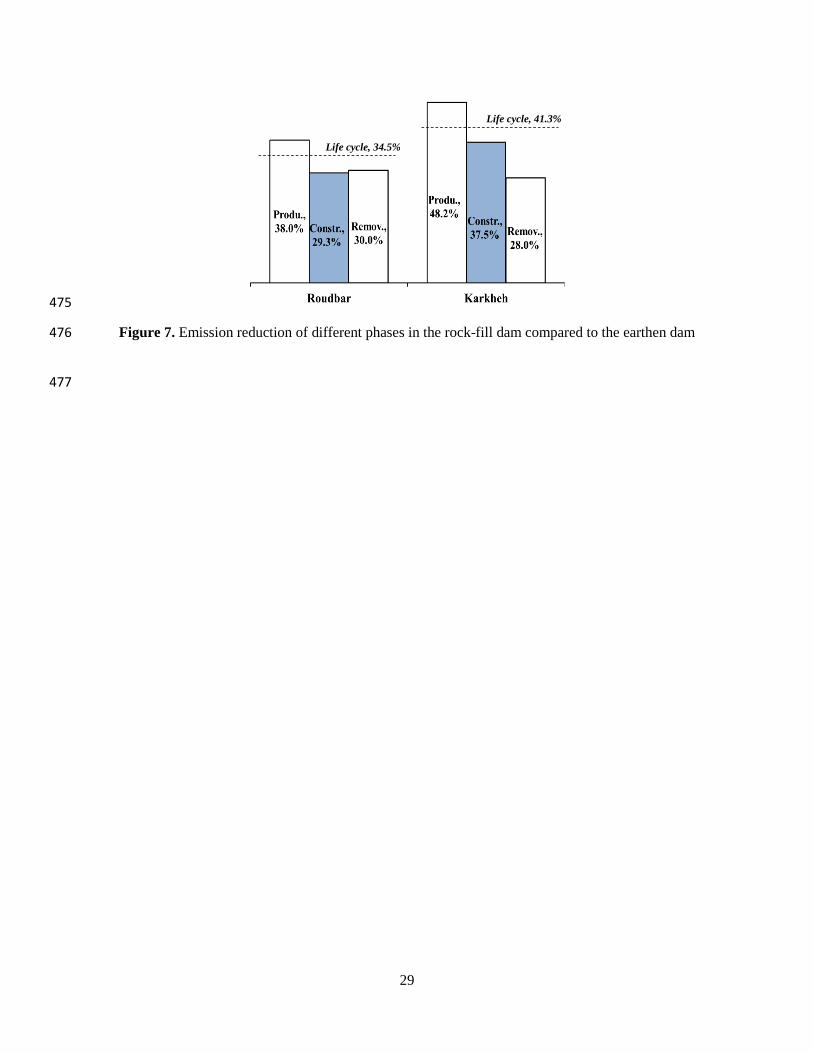
Investigations conducted in this research represented considerable deviations in the emissions of the 268
alternative embankment dam structure type over the life cycle. The rock-fill dam resulted in 34.5% fewer 269
emissions in the Roudbar case and 41.3% fewer emissions in the Karkheh dam compared to the earthen 270
dam type. A main contributing factor to this saving can return to the less volume of materials used in the 271
rock-fill dam than the earthen dam. The high emission deviation in different dam structure types achieved 272
in this research conforms with the high emission deviations achieved for different dam type alternatives in 273
the past research (Liu et al., 2013; Zhang et al., 2015). Figure 7 presents emission reduction in the rock-fill 274
dam type compared to the earthen over the life cycle in both cases. Every life cycle phase of the dam 275
projects contributes to emission saving. In both cases, additional emission savings were observed in the 276
production phase. This additional reduction was due to the low mechanical activities involved in the 277
production of crushed rock, as the main material used in the rock-fill dam type, compared to the sand 278
material, the main material in the earthen dam type. 279
[Insert Figure 7 here] 280
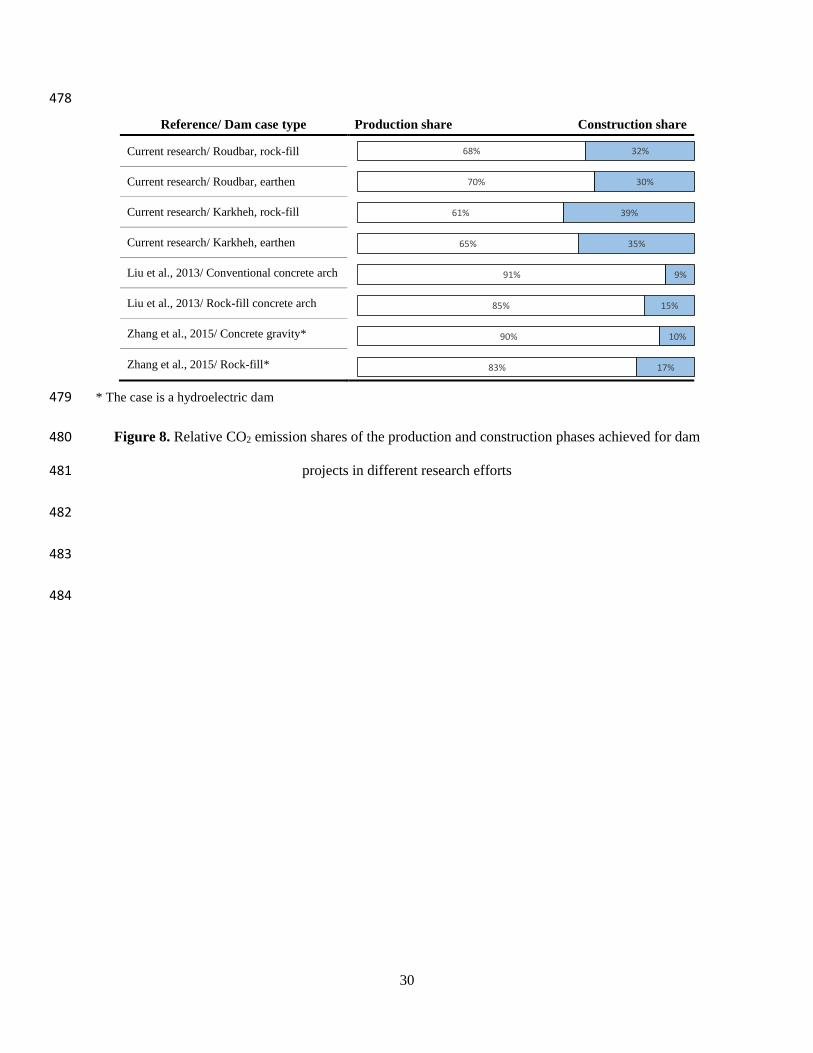
In both conducted case studies, emission in the production phase was relatively higher than the construction 281
phase (see Figures 4 and 6). This trend was also seen in the results reported in the past. Figure 8 presents 282
the relative CO2 emission shares of the production and construction phases reported in the past research 283
efforts and the current research. It was seen that the emission share of the production phase was higher in 284
the concrete-based dam types than the embankment dams due to the high embodied energy of the concrete 285
material. Emissions achieved in the production phase of the rock-fill dams in the current research, with 68% 286
and 61% shares, represented a relatively lower share than the case studied by Zhang et al. (2015), with 83% 287
share. The majority of emissions in the production phase of the case studied by Zhang et al. (2015) was also 288
returned to the concrete materials used in the electro-power generation facilities. However, since dam 289
structure types had a limited impact on the specifications of other components, such as the reservoir and 290
the electro-power generator, emissions from these components were not accounted for in the current 291
13
research. The achieved result highlighted the determinant role of material production in the overall 292
emission. 293
[Insert Figure 8 here] 294
7- SUMMARY AND CONCLUSION 295
Regardless of the significant impacts of dam structure types, emission assessment of dam structures is not 296
normally performed during the feasibility and initial planning stages of dam construction projects. This 297
research proposed the incorporation of the emission assessment of alternative dam structures in the 298
feasibility and planning stages of dam construction projects. Implementation of emission assessment for 299
two dam cases in Iran represented high deviations in the life cycle emission of alternative dam structures 300
types with the possible emission saving up to 41.3%. 301
This research introduced life cycle emissions of the dam structure type as a complementary decision factor 302
to the traditionally accounted factors such as financial, economic, technical, and environmental factors. 303
Extensive studies are performed in different aspects of the dams before the implementation of every large 304
dam project. The adopted dam structure type is one of the main outputs of these studies. High emission 305
deviations between alternative dam types can justify additional efforts required for the dam structure 306
emission assessments in cases that the alternative dam structure types are available. In this perspective, this 307
investigation aimed to raise awareness regarding how emission assessments of dam projects can improve 308
the dam’s sustainability without compromising the project objectives. The emission assessment results can 309
be analyzed in conjunction with the results of the technical and financial assessments to decide about the 310
most viable dam structure. In this research, only evaluation equations for earthen and rock-fill dam structure 311
types were developed. However, similar steps taken for these two dam types can be expanded to other 312
applicable dam structure types, such as conventional concrete, roller compacted concrete, and earth rock-313
fill. Although the proposed LCA method in the research was applied for dam construction projects in Iran, 314
14
no reservations were assumed in the developed evaluation method. Similar steps taken in this research can 315
be followed for the life cycle emission assessment of dam structure cases in other parts of the world. 316
ACKNOWLEDGMENT 317
We would like to express our appreciation to Dr. Hesam Fouladfar from Iran water and power resources 318
development Co. who supported us in collecting data on the case studies. We also thank Mr. Mohammad 319
Bisadi, who helped us during the initial data collection. 320
REFERENCES 321
Alcorn, A. (2003). Embodied energy and CO coefficients for NZ building materials. The Centre for 322
Building Performance Research, Victoria University of Wellington, ISBN 0-475-11099-4. 323
ASDSO (2020) Dams 101. Association of State Dam Safety Officials. Accessible from: 324
https://www.damsafety.org/dams101 325
Bako, S.P., Ezealor, A.U., and Tanimu, Y. (2014) Heavy metal deposition in soils and plants impacted by 326
anthropogenic modification of two sites in the sudan savanna of north western Nigeria, 327
environmental risk assessment of soil contamination. ISBN: 978-953-51-1235-8, InTech, DOI: 328
10.5772/57299. 329
Chang, Y., Ries, R. J., & Lei, S. (2012). The embodied energy and emissions of a high-rise education 330
building: A quantification using process-based hybrid life cycle inventory model. Energy and 331
Buildings, 55, 790-798. 332
Çiçek, A., Tokatlı, C., Emiroğlu, Ö., Köse, E., Başkurt, S. and Sülün, Ş. (2013) Macro and micro element 333
concentrations in water, sediment and commercial fishes of Çatören dam (Eskişehir). Journal of 334
Research in Ecology, Vol. 2, pp 91-99. 335
15
Deemer, B.R., Harrison, J.A., LI, S., Beaulieu, J.J., Delsontro, T., Barros, N., Bezerra-Neto, J.F., Powers, 336
S.M., Dos Santos, M.A. and Vonk, J.A. (2016) Greenhouse gas emissions from 337
reservoir water surfaces: a new global synthesis. Journal of BioScience, Vol. 66, No. 11, pp 1-16. 338
Fearnside, P.M. (2016) Greenhouse gas emissions from Brazil’s Amazonian hydroelectric dams. 339
Environmental Research Letters, Vol. 11. 340
Ghanbari, M., Abbasi, A. M., & Ravanshadnia, M. (2017). Production of natural and recycled aggregates: 341
the environmental impacts of energy consumption and CO2 emissions. Journal of Material Cycles 342
and Waste Management, 1-13. 343
Hammond, G. and Jones, C. (2011) Inventory of carbon & energy. Sustainable Energy Research Team, 344
Department of Mechanical Engineering, University of Bath, UK. 345
Hepler, T.E. (2013) Engineering considerations for large dam removals. Reviews in Engineering Geology 346
XXI, The Challenges of Dam Removal and River Restoration, Geological Society of America, 347
ISBN electronic: 9780813758213, pp 11–24. 348
IEA (2019) Key world energy statistics. International Energy Agency, Statistics, p. 30, Accessible from: 349
www.iea.org/statistics. 350
IPCC (2014). Mitigation of Climate Change. Contribution of Working Group III to the Fifth Assessment 351
Report of the Intergovernmental Panel on Climate Change. Cambridge University Press, 352
Cambridge, UK and New York, NY. 353
IRN (International Rivers Network) (2007) Frequently asked questions: greenhouse gas emissions from 354
dams. International Rivers Network, May 1, 2007, Accessible from: 355
https://www.internationalrivers.org/resources/greenhouse-gas-emissions-from-dams-faq-4064. 356
IWRMC (Iran Water Resource Management Co.) (2018) Country’s dam statistics. Iran’s water resource 357
management Co., Accessible from: http://daminfo.wrm.ir/fa/dam/stats. 358
16
Jansen, R. B. (1983). Dams and public safety. US Department of the Interior, Bureau of Reclamation. 359
Karadede, H. and Unlü, E. (2000) Concentrations of some heavy metals in water, sediment and fish species 360
from the Atatürk Dam Lake (Euphrates), Turkey, Chemosphere, Vol.41, Issue. 9, pp 1371-1376. 361
Keoleian, G. A., Kendall, A., Dettling, J. E., Smith, V. M., Chandler, R. F., Lepech, M. D., & Li, V. C. 362
(2005). Life-cycle cost model for evaluating the sustainability of bridge decks. Proceedings of 363
The 4th International Workshop on Life-Cycle Cost Analysis and Design of Civil Infrastructures 364
Systems, Proceedings of The 4th International Workshop on Life-Cycle Cost Analysis and 365
Design of Civil Infrastructures Systems, Cocoa Beach, Florida, May 8-11, pp143-150, 2005. 366
<http://hdl.handle.net/2027.42/84802> 367
Liu, C., Ahn, C. R., An, X., & Lee, S. (2013). Life-cycle assessment of concrete dam construction: 368
comparison of environmental impact of rock-filled and conventional concrete. Journal of 369
Construction Engineering and Management, 139(12), A4013009. 370
Magwood, C. (2014) Making Better Buildings: A Comparative Guide to Sustainable Construction for 371
Homeowners and Contractors. New Society Publishers. 372
Mendonça, R., Barros, N., Vidal, L.O., Pacheco, F., Kosten, S., Roland, F. (2012) Greenhouse gas 373
emissions from hydroelectric reservoirs: what knowledge do we have and what is lacking? 374
INTECH Open Access Publisher, ISBN: 9535103237, March, 2012. 375
Miljan, M., & Miljan, J. (2015). Thermal transmittance and the embodied energy of timber frame 376
lightweight walls insulated with straw and reed. In IOP Conference Series: Materials Science and 377
Engineering (Vol. 96, No. 1, p. 012076). IOP Publishing. 378
Mulder, E.T. (2007) Closed cycle construction: an integrated process for the separation and reuse of C&D 379
waste. Waste Management, Vol. 27, Issue. 10, pp 1408-1415. 380
17
Ndiaye, D. 2001, Optimisation de la conception des bâtiments en fonction de l’énergie utilisée sur toute la 381
durée de vie: application aux conditions économiques du Sénégal, Mémoire de maîtrise ès 382
Sciences appliquées, École Polytechnique de Montréal, Canada. 383
Ndiaye, D., Bernier, M. and Zmeureanu, R. (2005) evaluation of the embodied energy in building 384
materials and related carbon dioxide emissions in Senegal. The 2005 World Sustainable Building 385
Conference, Tokyo, 27-29 September 2005, pp. 1235-1242. 386
Özdemir, N., Yılmaz, F., Levent Tuna, A., Demirak, A. (2010) Heavy metal concentrations in fish 387
(Cyprinus carpio and Carassius carassius) sediment and water found in the Geyik Dam Lake, 388
Turkey. Fresenius Environmental Bulletin, 19(5), pp 798-804. 389
Öztürk, M., Özözen, G., Minareci, O. and Minareci, E. (2008) Determination of heavy metals in of fishes, 390
water and sediment from the Demirköprü dam lake (Turkey), Journal of Applied Biological 391
Sciences, Vol.2, pp 99-104. 392
RazaviAlavi, R. (2010) Productivity assessment of dam construction projects (In Farsi). Sharif University 393
of Technology, Department of Civil Engineering, M.Sc. Thesis, Defended on February 2010. 394
Reddy, B. V., & Jagadish, K. S. (2003). Embodied energy of common and alternative building materials 395
and technologies. Energy and buildings, 35(2), 129-137. 396
Reynolds, T. S. (1989). A Narrow Window of Opportunity: The Rise and Fall of the Fixed Steel Dam. IA. 397
The Journal of the Society for Industrial Archeology, 1-20. 398
Song, C., Gardner, K. H., Klein, S. J., Souza, S. P., & Mo, W. (2018). Cradle-to-grave greenhouse gas 399
emissions from dams in the United States of America. Renewable and Sustainable Energy Reviews, 400
90, 945-956. 401
Staffell, I., (2011) The energy and fuel data sheet. University of Birmingham, UK. March 2011. 402
18
TBDS (2020) Types of Dams. The British Dam Society. Accessible from: https://britishdams.org/about-403
dams/dam-information/types-of-dam/ 404
Tremblay, A., Varfalvy L., Roehm C. and Garneau M., (2004) The issue of greenhouse gases from 405
hydroelectric reservoirs: from boreal to tropical regions. United Nations Symposium on 406
Hydropower and sustainable development, Bejing, China. 407
(http://www.un.org/esa/sustdev/sdissues/energy/op/hydro_tremblaypaper.pdf). 408
USEPA (U.S. Enviromental Protection Agency) (2015) Emission factors for greenhouse gas inventories. 409
U.S. Enviromental Protection Agency, Center for Corporate Climate Leadership, Last Modified: 410
19 November 2015. 411
USSD (United States Society on Dam) (2015) Guidelines for dam decommissioning projects. USSD 412
Committee on Dam Decommissioning, July 2015. 413
Uysal, K., Özden, Y., Çiçek, A. and Köse, E. (2010) Bioaccumulation ratios of sediment-bound heavy 414
metals of Porsuk and Enne dam lakes (Kütahya/Turkey) to different tissues of common carp 415
(Cyprinus carpio). İstanbul University, Journal of Fisheries and Aquatic Sciences, Vol.25, pp 1-10. 416
Wei, G. Z. (2009) Impact of dam construction on water quality and water self-purification capacity of the 417
Lancang River, China, Water resources management, Vol.29, Issue.3, pp 1763-1780. 418
Yang, H., Haynes, M., Winzenread, S. and Okada K. (1999) The History of Dams. UCDavis, the Center 419
for Watershed Sciences, Accessible from: 420
https://watershed.ucdavis.edu/shed/lund/dams/Dam_History_Page/History.htm 421
Youdeowei, P. O., Nwankwoala, H. O., & Desai, D. D. (2019). Dam Structures And Types In Nigeria: 422
Sustainability And Effectiveness. Water Conservation & Management (WCM), 3(1), 20-26. 423
Zhang, S., Pang, B., & Zhang, Z. (2015). Carbon footprint analysis of two different types of hydropower 424
schemes: comparing earth-rockfill dams and concrete gravity dams using hybrid life cycle 425
assessment. Journal of Cleaner Production, 103, 854-862. 426
19
Table 1. Energy consumption and CO2 emission coefficients of soil materials reported in the literature 427
Source Soil Material Energy Consumption
Coefficient (MJ/kg)
CO2 Emission
Coefficient (kg CO2/kg) Production method
Clay 0.070 0.0023
Mechanical production
operations used in New
Zealand
Sand 0.1000 0.0076
Alcorn, 2003 General
Aggregate 0.0400 0.0017
River
Aggregate 0.0300 0.0011
Virgin Rock 0.0600 0.0022
Reddy and
Jagadish, 2003
Sand 0.000 - Use of natural sand and
crushed rock in India Crushed Rock 0.010 -
Ndiaye et al.,
2005 Sand 0.060 0.004
Mechanical production
operations used in
Senegal
Hammond and
Jones, 2011
Sand 0.081 0.0048 – 0.0051 According to the fuel
consumption data in
material production
plants in the UK Crushed Rock 0.083 0.0048 – 0.0052
Magwood, 2014
Clay and Sand
(General
Aggregate)
0.083 0.0052
General mechanical
production operation in
North America
Milijan, 2015 Clay 0.087 -
Mechanical production
operations used in
Estonia
Ghanbari et al.,
2017
Sand and
gravel 0.056 0.0045
Mechanical production
operations used in Iran
428
429
20
Table 2. Roudbar dam site distance to different material sources 430
Material Source Weight
(million tons)
Distance
(km)
Ro
ck-f
ill
da
m
Clay Source 1 2.13 8
Sand Source 2 1.45 6
Crushed rock Source 3 12.7 4.5 Total 16.3
Ea
rth
en
da
m Clay Source 1 2.13 8
Sand Source 2 18.8 6
Total 21.0
431
432
21
Table 3. Main assumption used in the calculation of construction phase 433
Equipment operation rate (m3/ hour) Equipment fuel consumption rate
Dozer (crawl, 105 HP, bucket 2 m3) 85 40 (liter / hour)
Grader (180 HP, blade 3.66x0.61 m) 280 25 (liter / hour)
Roller compactor (155 HP, 10 ton) 120 15 (liter / hour)
Sheep foot roller compactor (155
HP, 12 ton) 100 15 (liter / hour)
Water truck (19000 liter) 95 25 (liter / hour)
Truck (20 ton) 0.4 (liter /km) 434
435
22
Table 4. Karkheh dam site distance to different material sources 436
Material Source Weight (M ton) Distance (km)
Ro
ck-f
ill
da
m
Clay Source 1 5.25 12
Sand Source 2 2.59 1.5
Crushed rock
Source 2 1.81 1.5
Source 3 2.94 2.5
Source 4 10.1 6
Source 5 8.19 7
Source 6 5.48 9 Total 36.3
Ea
rth
en d
am
Clay Source 1 5.25 12
Sand
Source 2 4.41 1.5
Source 3 7.18 2.5
Source 4 35.7 6
Source 5 3.31 7
Total 55.8
437
438
23
Earthen
Embankment
Rockfill
Dam
Structure
Types
Gravity
Concrete Buttress
Arch
Figure 1. Classification of the dam structures types and their schematic views 439
440
CoreSandy gravel Sandy gravel
CoreRock-fill Rock-fill
Co
ncr
ete
24
441
442
443
Figure 2. Fossil fuel consumption and CO2 emission over the dam structure life cycle 444
445
CO2
Emission
Fuel
Consumption
Maintenance Construction
Production Removal
25
446
447
448
449
a. The actual scenario ( rock-fill dam with clay core) 450
451
b. The alternative scenario (earthen dam with a clay core) 452
Figure 3. Schematic views of the actual and alternative dam scenarios of Roudbar dam case 453
454
Clay Core
Rock-fill Rock-fill
15
5 m
720 m
Clay CoreSandy gravel Sandy gravel
15
5 m
15 m
1020 m
26
455
456
457 Figure 4. Life cycle* emission results of alternative scenarios in Roudbar dam 458
* Resulting emissions from the operation and maintenance phase of the studied alternative dam structure types were 459 found minimal compared to other phases and were not reported consequently. 460
461
Production
Production
Construction
Construction
Removal
Removal
Rock-fill Earthen
a. Diesel consumption
60.8(million litres)
39.9(million litres)
20%
27%
56%
25%
53%
19%
Production
Production
Construction
Construction
Removal
Removal
Rock-fill Earthen
b. CO2 emission
170 (million kg)
111 (million kg)
20%
26%
24%
18%
58%
54%
27
462
a. The actual scenario (earthen dam with a clay core) 463
464
b. The alternative scenario (rock-fill dam with clay core) 465
466
Figure 5. Schematic views of the actual and alternative dam scenarios of Karkheh dam case 467
468
Clay Core
Sandy gravelSandy gravel
12
7 m
12 m
1100 m
Clay Core
Rock-fill Rock-fill
12
7 m
12 m
28
469
470
471 Figure 6. Life cycle* emission results of alternative scenarios in of Karkheh dam 472
* Resulting emissions from the operation and maintenance phase of the studied alternative dam structure types were 473 found minimal compared to other phases and were not reported consequently. 474
Production
Production
Construction
Construction
Removal
Removal
Rock-fill Earthen
a. Diesel consumption
176 (million litres)
104(million litres)
23%
31%
52%
29%
46%
19%
Production
Production
Construction
Construction
Removal
Removal
Rock-fill Earthen
b. CO2 emission
491 (million litres)
288 (million litres)
23%
30%
53.5%
28%
47%
18.5%
29
475
Figure 7. Emission reduction of different phases in the rock-fill dam compared to the earthen dam 476
477
Life cycle, 41.3%
Life cycle, 34.5%
30
68%
70%
61%
65%
91%
85%
90%
83%
32%
30%
39%
35%
9%
15%
10%
17%
478
Reference/ Dam case type Production share Construction share
Current research/ Roudbar, rock-fill
Current research/ Roudbar, earthen
Current research/ Karkheh, rock-fill
Current research/ Karkheh, earthen
Liu et al., 2013/ Conventional concrete arch
Liu et al., 2013/ Rock-fill concrete arch
Zhang et al., 2015/ Concrete gravity*
Zhang et al., 2015/ Rock-fill*
* The case is a hydroelectric dam 479
Figure 8. Relative CO2 emission shares of the production and construction phases achieved for dam 480
projects in different research efforts 481
482
483
484