Embed Size (px)
Citation preview
1
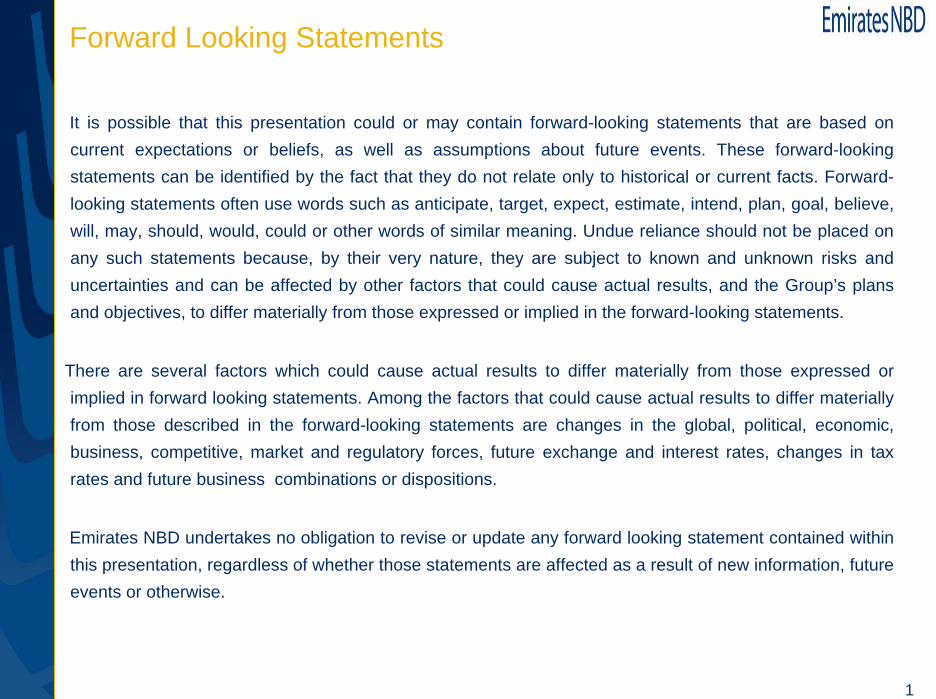
It is possible that this presentation could or may contain forward-looking statements that are based on current expectations or beliefs, as well as assumptions about future events. These forward-looking statements can be identified by the fact that they do not relate only to historical or current facts. Forward-looking statements often use words such as anticipate, target, expect, estimate, intend, plan, goal, believe, will, may, should, would, could or other words of similar meaning. Undue reliance should not be placed on any such statements because, by their very nature, they are subject to known and unknown risks and uncertainties and can be affected by other factors that could cause actual results, and the Group’s plans and objectives, to differ materially from those expressed or implied in the forward-looking statements.
There are several factors which could cause actual results to differ materially from those expressed or implied in forward looking statements. Among the factors that could cause actual results to differ materially from those described in the forward-looking statements are changes in the global, political, economic, business, competitive, market and regulatory forces, future exchange and interest rates, changes in tax rates and future business combinations or dispositions.
Emirates NBD undertakes no obligation to revise or update any forward looking statement contained within this presentation, regardless of whether those statements are affected as a result of new information, future events or otherwise.
Forward Looking Statements

2
Contents
The UAE banking opportunity
Emirates NBD: Banking Leader in middle east
Strategic Focus
First Half Year 2008: Financial Overview
Synergies
Integration Update

3
275
234
190163
132105
8071
389336
236
170
12010090
+31%
USD billion
+21%
032002 04 05 06 Q2 0807090807060504032002
Nominal GDP Banking assets
In line with the economy, the UAE banking sector has grown strongly
Source: Central Bank statistics. Source: Central Bank Statistics

4
4542
33
20
13
MarketShare 11% 12% 13%1975
1997
2002
2004
Dubai Islamic Bank
Abu Dhabi Islamic Bank
Sharjah Islamic Bank
Emirates Islamic Bank
2006 Al Noor Islamic Bank
2004
USD billion
2007 Dubai Bank convertedto Islamic
05 06 07 Q1 08
+47%
13%
2008 Al Hilal Bank
Islamic banks have increased their presence in the market
Source: Global Insight, Platts, Dubai Chamber of Commerce and Industry, team analysis
Islamic Banks AssetsTimeline of Islamic Banking in the UAE

5
CountryBanking assetsUSD billion
Assets/Nom. GDPPercent
336
287
125
82
44
27
Bahrain**
Oman
177
76
112
119
225
67
2007
Kuwait
Qatar
Saudi Arabia
UAE*
UAE is now the largest banking market in the GCC
*Includes Foreign Banks**Excludes off-shore banking unitsSource: Central Banks; Global Insight

6
Contents
The UAE banking opportunity
Emirates NBD: Banking Leader in middle east
Strategic Focus
First Half Year 2008: Financial Overview
Synergies
Integration Update
7
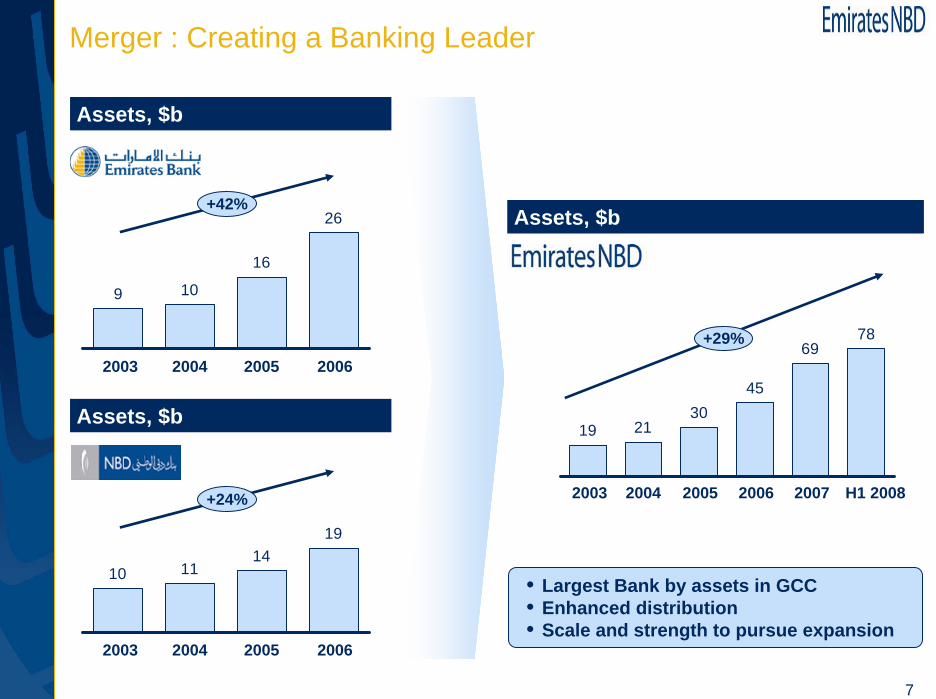
19 2130
7869
45
10 1114
19
9 10
16
26
2003 2004
Assets, $b
2003
+42%
2004 2005 2006
2005 2006 2007 H1 2008
Assets, $b
2003 2004 2005 2006
Merger : Creating a Banking Leader
Assets, $b
• Largest Bank by assets in GCC• Enhanced distribution• Scale and strength to pursue expansion
+24%
+29%
8
25.6Mashreq
24.9
First GulfBank
17.6Union Nat.Bank
9.3
DIB
Comm. Bk.of Dubai
Emirates NBD
45Nat. Bk. ofAbu Dhabi
35Abu DhabiComm. Bk.
25.7
3.2
3.7
2.9
3.1
2.8
1.9
1.3
511
404
294
319
207
154
Assets$b
Equity$b
Net profits$m
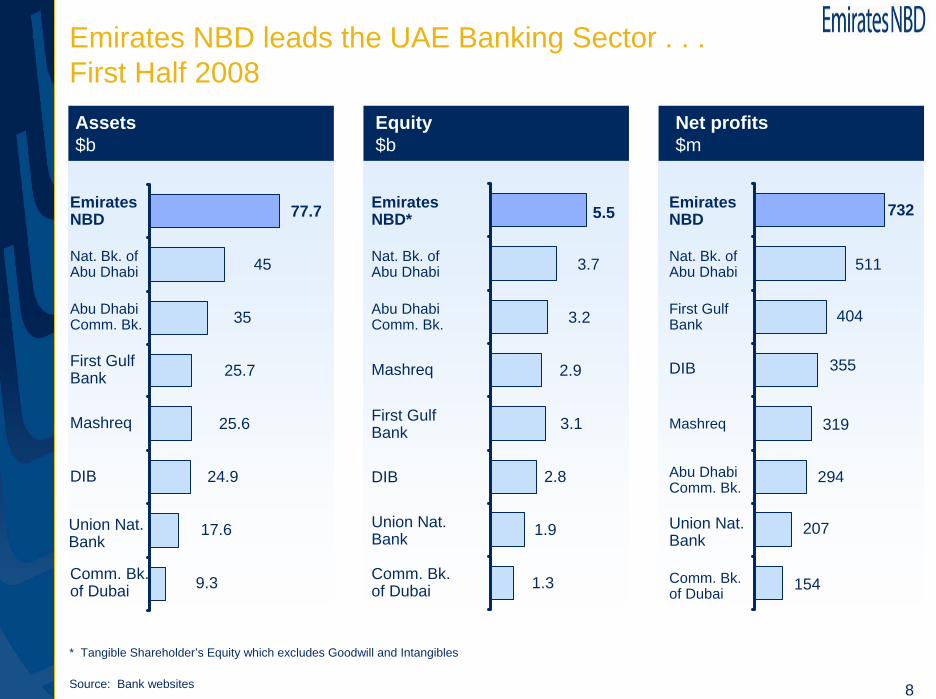
Emirates NBD leads the UAE Banking Sector . . .First Half 2008
Mashreq
First GulfBank
Union Nat.Bank
DIB
Comm. Bk.of Dubai
Emirates NBD*
Nat. Bk. ofAbu Dhabi
Abu DhabiComm. Bk.
Abu DhabiComm. Bk.
Mashreq
Union Nat.Bank
Comm. Bk.of Dubai
DIB
Emirates NBD
Nat. Bk. ofAbu Dhabi
First GulfBank
77.7 5.5 732
355
* Tangible Shareholder’s Equity which excludes Goodwill and Intangibles
Source: Bank websites

9
Banking
Emirates Islamic Bank
NBD Investment
Bank (DIFC)
Emirates Bank National Bank of Dubai
Emirates NBD(Parent Company)
BrokerageOther
Financial Services
Emirates Money
EIS Asset Management
(DIFC)
Emirates Int’l Securities
EIS, KSA
NBD Securities
Network International
Union Properties
National General
Insurance
E T F S
Processing Associates
Network Processing Co. (Egypt)
A comprehensive financial services group
NBD Trust Company
Jersey
Note: The chart reflects Primary Subsidiaries and Associates

10
Our Group Entities
• Emirates Bank & National Bank of Dubai are the primary companies of Emirates NBD group
• Provide services and products to Retail Customers, • Provides Wholesale & Treasury services.
• Emirates Islamic Bank is the fastest growing Islamic bank in UAE• Provides Sharia compliant products to Retail and Corporate Banking clients.• 99.8% owned by EmiratesNBD
• NBD Investment Bank was incorporated on 31 May 2006 in the DIFC. • NBD IB’s principal activity is Investment Banking.

11
Our Group Entities
• Emirates International Securities was established in 2001. • It is wholly owned brokerage arm of the Group.• The principal activity of the company is to act as intermediary in dealings in
stocks and equities which are listed on DFM and ADSM.• DFM Market share of 5.5% for the brokerage business as at the end of
August.
• Network International was established as a credit card services company in 1994. The company has since evolved into a leading credit card and payment services company.
• Business lines include, Merchant acquiring, Card hosting and transaction processing for the Group and 3rd Party clients like FGB, ADCB etc.
• The company offers Consumer Finance Solution Implementation to Third Party Banks and other services include ATM switches, Amex transaction, terminal rentals etc.
• Customer base of 37 financial institutions across MENA region.• Over 63% of UAE Acquiring Market Share• First Multi Application Smart Card Issuer in the Region.

12
Our Group Entities• Emirates Investment Services Limited was incorporated in DIFC in
August 2006.• Principal business activities are Investment Banking and Asset
Management.• Currently the company is more involved in providing Asset Management
Services only.• Assets Under Management – USD 2.4 billion
• Union Properties is an associate company [Ownership 47.8%] of Emirates Bank Group.
• It is one of the leading property development, investment and real estate services company in the UAE.
• The company has invested substantial resources to refine a superior and comprehensive range of property services. These include valuations and feasibility studies; project management; interior design and fit-out; property management and maintenance.
• Emirates Bank Group acquired a majority shareholding in National General Insurance Limited (N.G.I.), in 1995 [Ownership 36.7%]. After restructuring, the company is now poised to be a leader in the UAE's insurance industry.
• The company is active in providing insurance cover for Fire, Burglary, personal Accidents, Marine, Engineering, Public & Professional Liability; Workmen's Compensation and Motor Vehicle Risks, and Health Insurance.

13
Emirates NBD is the largest bank in GCC by assetsFirst Half 2008
Nat. Bank of Abu Dhabi
Al Rajhi Bank
Arab BankingCorp.
Riyad Bank
Kuwait FinanceHouse
Qatar National Bank
Emirates NBD
Nat. Comm.Bank
Nat. Bank of Kuwait
SAMBA
GCC ranking by assets $b
Equity$b
GCC ranking by profits $m
77.7
60.5
42.1
48.9
45.0
40.0
31.7
38.4
38.5
42.3
Emirates NBD *
Nat. Comm.Bank
Al Rajhi Bank
Nat. Bank of Kuwait
Kuwait FinanceHouse
SAMBA
Qatar National Bank
Riyad Bank
Nat. Bank of Abu DhabiAbu Dhabi Comm. Bank
Al Rajhi Bank
Nat. Comm.Bank
SAMBA
Kuwait FinanceHouse
Emirates NBD
Nat. Bank of Kuwait
Riyad Bank
Banque SaudiFransi
Qatar National BankNat. Bank of Abu Dhabi
503
7.1
6.2
5.5
5.8
4.8
5.3
6.8
3.2
3.7
8918.4
646
590
732
657
426
402
515
511
U.A.E. KSA Kuwait Qatar Bahrain
* Tangible Shareholder’s Equity which excludes Goodwill and IntangiblesSource: Bank websites

14
London, UKBranch (est. 1986)
JerseyChannel Islands
• Branch (est. 1990)• Subsidiary Trust Co. (est.
2001)
Riyadh, Saudi Arabia• Fully-fledged commercial
branch (est. 2004)• Investment Banking to go
live in April 2008 Doha, QatarQFC Branch(est. 2007)
Mumbai, IndiaRepresentative Office
(est. 2000)
Tehran, IranRepresentative Office
(est. 2002)
Singapore• Representative Office (est.
2006)• Currently upgrading to
branch licenseUAE
Cairo, EgyptCards Processing Center - NPC
(est. 2007)
Building a geographically diversified footprint

15
• A1 / P-1 • A1 / P-1
• A / Positive / A-1• A / Positive / A-1
• AA- • …
• AA-• AA-Capital Intelligence
Current Ratings
Moody´s¹
S&P²
Fitch³
Strong Credit Ratings
1 Moody’s Long-term rating / Short-term rating2 S&P Credit rating3 EBI’ s Long term Issuer Default rating is AA-; NBD has not been rated by Fitch. Support rating available by both EBI and NBD is ‘1’4 Capital Intelligence Foreign currency long term rating for EBI recently upgraded to AA-.

16
Contents
The UAE banking opportunity
Emirates NBD: Banking Leader in middle east
Strategic Focus
First Half Year 2008: Financial Overview
Synergies
Integration Update

17
Emirates NBD strategy
Integrate organizational resources to build a scalable platform7
Pursue profitable growth in Retail Banking1
Establish a distinctive Wealth Management offering2
Consolidate and enhance market position in Corporate Banking3
Develop a leading regional Investment Banking franchise4
Expand Islamic Banking5
Pursue expansion in the GCC and other key strategic markets6

18
Retail
Wealth Management
Significantly expand Groups’ branch network to under penetrated areas like Abu Dhabi and new developments in DubaiIncrease sales force performance through dedicated sales transformation program over the next 12 monthsRollout a new branch concept to increase focus on customer service and salesAccelerate roll-out/geographic expansion of separate Consumer Finance company (Emirates Money)
Launch new Private Banking offering Rollout a revamped priority banking offering building on the former Suhail and Al Shaheen offeringsExpand wealth management offering to other countries in the GCC region and selected off-shore locationsLeverage investment banking, asset management, structured product, real estate, trust and family office product capabilitiesIntegrate accounts of large corporates and institutional clients after legal mergerTailor credit processes for Mid Cap/SME customer base in order to provide distinctive customer experienceEnhance trade finance, cash management and treasury offering through joint account planningLeverage balance sheet and capital to win larger dealsExpand the financial institution business on an international basis
Corporate & SME
1
2
3
Emirates NBD Strategic Priorities

19
Investment Banking
Islamic Banking
Build upon the investment banking capabilities within the Group and leverage the existing customer franchise in the GCC Enhance cross-selling to the corporate and institutional clients base Leverage Dubai’s development as a regional financial centre
Expand Emirates Islamic Bank’s branch networkCross-sell Islamic Banking products through the conventional branch networkDevelop innovative Shariah compliant products
Strengthen presence in existing marketsExploit the financial strength and scale in the GCC and the wider regionPursue growth through strategic acquisitions in our chosen geographies
Strategic Expansion
Implement new core banking system (Finacle) for combined bankContinue to integrate the back-office operations of EBI and NBD Develop best-in-class risk management capabilities and systems
IT & Operations&
Risk
Emirates NBD Strategic Priorities (Cont’d)
4
5
6
7

20
Contents
The UAE banking opportunity
Emirates NBD: Banking Leader in middle east
Strategic Focus
First Half Year 2008: Financial Overview
Synergies
Integration Update

21
Earnings Per Share AED 0.52 / USD 0.142 41%
Total Income USD 1,274 m 49% Total Assets USD 78 bn 12%
Total Costs USD 476.7 m 48% Loans USD 51 bn 13%
Net Profit USD 731.8 m 41% Deposit USD 43 bn 13%
Cost Income Ratio 37.4% Return on Tangible Equity * 27.6% 2.1%
Key Performance Indicators H1 2008 vs. H1 2007
Key Performance Indicators Q2 2008 vs. FY 2007
Strong growth…….
0.1%

22
224368 402
519732
164 235293
404 413
578
152144
369 503 616856
1,274
292381
438554
679
295245
1,079
2002
+32%
Revenues, $m Costs, $m
Profitability, $m Sources of Operating Income2003 2004 2005 2006 2007 Q2 08
537676
807
1,0571,295
1,935
Fees, Comm and Others
Net Int Income
+29%
+49%
2002
+31%
2003 2004 2005 2006 2007 Q2 08
+29%
+41%
308387
517
772 815
1,097
321477
114149 138
205
271
225151136121104
419
2002
+29%
2003 2004 2005 2006 2007 Q2 08
+28%
+48%218
270 274356
496
740
45%44%44%45%39%31%
55%56%56%55%61%69%
2003 2004 2005 2006 2007 Q2 08
Delivered strong profit growth in recent yearsHalf Year
Full Year
1 Prior period 2002 – 2006 is the aggregation of EBI & NBD2 Year 2007 & H1 2008 excludes amortization of intangibles

23
* Q1 2006 includes exception IPO-linked income
2002 2003 2004 2005 2006 2007 H1 08
168 265472 514
1,097
732219
252
153
155
300 301
22.6%
19.2%
25.5%
13.0%
13.0%
18.0%
11.2%
20.2%
17.0%14.7%
27.6%25.1%
2.9
6.1
6.9
2.1
1.1 1.3 1.62.1
1.4 1.5 1.52.4
1.5
1.6
16.8%
18.3%
26.1%
29.8%34.1%
15.6%
22.4% 21.4%18.7%
16.3% 13.2% 12.8%
2002 2003 2004 2005 2006 2007 H1 08
EBI
ENBD
EBI Return on equity/ Capital Adequacy Ratio
ENBD Return on equity/ Capital Adequacy Ratio
NBD
Tier 2 Capital
NBD Return on equity/ Capital Adequacy Ratio
Robust returns and capitalization
36.5
38.1 38.3 38.2 38.3
37.4
37.638.939.0
31.3
2006 20082007
Q1 06
Q2 06
Q1 07
Q2 07
Q3 07
Q407
Q108
Q3 06
Q4 06
Q208
1.982.01
1.86
1.971.92 1.92
1.89
2.082.04
2.162006 20082007
Q1 06
Q2 06
Q1 07
Q2 07
Q3 07
Q407
Q108
Q3 06
Q4 06
Q208
Net Interest Margins
Capitalization (Capital $b)
Cost Income Ratio
Return on Equity (Profit $m)

24
3.0 3.0 3.1 3.6 4.15.2 5.5
Assets, $b
7869
4530
211917
2002 03 04 05 06 07
+27%
H1 08
Loans, $b
5145
30
1912108
+36%
Deposits, $b
4338
2619
141312
+23%
Equity, $b *
+13%
Delivered strong B/S growth in recent years
2002 03 04 05 06 07 H1 08
2002 03 04 05 06 07 H1 082002 03 04 05 06 07 H1 08
* Equity for 2007 & H1 2008 is Tangible Shareholder’s Equity which excludes Goodwill and IntangiblesSource: Newswires, Financial Statements, Aggregation of EBI and NBD results

25
Others20%
Manufacturing6% Construction
6%Trade
6%Transport and
Communications4%
Services13%Time Loans
62%
22%
Corp Personal 11%
Loan Portfolio by Type –H1 2008 Loan Portfolio by Sector – H1 2008
NPL Ratio Coverage Ratio
2.5%2.0%
1.4%1.0% 1.1% 1.1%
2003 2004 2005 2006 2007 H1 08
124%114%
93%102%97%122%
2003 2004 2005 2006 2007 H1 08
Revolving FacilitiesOverdrafts
31%
Others3%
Bills Discounted1%
Loans AgainstTrust Receipts
3%
Balanced Loan Portfolio with High Degree of Security
Sovereign22%
Retail Personal 12%
100% = $ 51b 100% = $ 51b
Source: Financial Statements, Aggregation of EBI and NBD results

26
Outstanding by Currency
HKD1%
SGD1%
EUR11%
CHF4%
JPY1%
A$3%
AED12%
THB1%
USD66%
Outstanding EMTNs & ECPs
EMTNs
• Diversified liability portfolio (Deposits/ ECP/ EMTN/ Repos)
• Active MTNs issuance under EMTN programme
• Diversified investor base.
• Diversified maturity profile.
100% = $ 8,482 m
66
1,4931,782
2,488
35059
886
1,358
2008 2011 20132012 20162015201420102009
Outstanding by Currency Maturity Profile : EMTNs
JPY2%
HKD1%
USD28%
EURO54%
GBP15%
ECPs
100% = $ 1,500 m
US$ m

27
60%
29%
11%
Wholesale*Islamic
Retail
80%11%
9%
Wholesale*Islamic
Retail
First Half Year 2008, %
100% = $ 78b 100% = $ 1,274m
Assets Revenues
Diversified Business mix with growth in all segments…
100% = $ 78 b 100% = $ 1,274 m
* Wholesale include Corporate Banking, Investment Banking, Investment management and Treasury; Also includes Associate’s revenue of USD 74mSource: 2nd Quarter 2008 Financial Statements

28
CAGR34.8
23.2
2006 2007
654
39.8
H1 2008
832 761
Highlights
Wholesale Bank continues to deliver strong performanceLoans $b
Revenues$m
+42%
+50%
17.5
23.9 22.5
Deposits $b +23%
Servicing Multinational, Large Local Corporate, Government linked institutions, Financial & Investment Institutions.
Product offering comprises mainly Lending, Deposits, Trade Finance, Syndications, Structuring, Treasury & Investment Banking solutions and Islamic products.
Major contributor to the growth of the bank with Corporate lending and deposits showing continued growth momentum.
Ranked as #1 Mandated Arranger for Syndicated corporate deals in the UAE with 10.58% market share (source: Reuters LPC/Dealscan)
Increasing emphasis on providing tailored Treasury and Investment Banking solutions and leveraging established relationships and capital deployed.
Source: financial results; Aggregation of EBI and NBD results for 2006; $1 = AED 3.67

29
6.0
3.55.0
5.9
9.6
12.5
2006
565
2007
376368
H1 2008
HighlightsCAGRLoans
$b Highlights
Deposits $b
Revenues$m
+43%
+45%
Retail Bank has the largest distribution network & dominant market share
+65%
Largest distribution network in UAE & highest market share in Loans and Deposits.
Investment in customer service has been a key focus and is expected to be a key differentiator.
Won numerous awards including Best Retail Bank and Best e-Banking awards in 2007.
Retail products include: Current and Savings Accounts, Credit Cards, Personal Loans, Auto Loans, Mortgages and Investment Products.
Dominant market shares in Liabilities (c.18%) and Personal Loans (c.22%).
Total of 115 branches and 486 ATMs. Plans to grow our distribution capability aggressively.
Source: financial results; Aggregation of EBI and NBD results for 2006; $1 = AED 3.67

30
Highlights
CAGR
Source: financial results; $1 = AED 3.67
Highlights
Emirates Islamic Bank : Fastest growth in UAE
4.9
1.83.9
2.5
4.0
6.1
2006
262
2007
151212
H1 2008
Financing Receivables $b
Customer Accounts $b
Revenues$m
+95%
+68%
+81%
Fastest growing Islamic bank in the UAE, since its inception in 2004.
The business has more than doubled assets & income every year and is rapidly increasing market share gain.
Grown to 24 branches currently compared to 10 branches in 2004. Significant opportunities to expand its Islamic footprint.
A broad product range on offer:
Retail: Vehicle & Goods Murabaha, Credit Cards, Home Finance, Investments & Deposit Accounts
Corporate: Murabaha, Ijarah, Real Estate Financing, Trade Finance, Secured Overdraft, Syndications, Sukuks & Investment Products
Innovation a key to success, enabled through leveraging wider Group resources: e.g. first Islamic Bank to launch Chip-based debit card.

31
Contents
The UAE banking opportunity
Emirates NBD: Banking Leader in middle east
Strategic Focus
First Half Year 2008: Financial Overview
Synergies
Integration Update

32
Target Synergies : USD 34m in 2008 & USD 101m by 2010
USD 94m of recurring annual synergies by the third year post merger, plus USD 7m of one-off synergies totalling USD 101m
The recurring synergies include:
Each will be delivered 33% in year 1 (2008), 66% in year 2 (2009) and fully by 2010.
Year 1 target therefore USD 34m (33% of USD 101m) of which, recurring synergies represent:
One-off synergy commitment in 2008 is USD 2.5m
Synergies (2010) Total, USD m Actual** Benchmark*** Actual
Revenue 53 10.5% 5–10% 4.1%Costs 43 22.2% 14– 26% 8.3%
% of Smaller Base1 % of Combined Base1
Synergies (2008) Total, USD m Actual** Benchmark*** Actual
Revenue 18 3.5% 1.7-3.3% 1.4%Costs 14 7.4% 4.6-8.6% 2.7%
% of Smaller Base1 % of Combined Base1
Note 1: Base used when computing synergy targets were 2006 financials, smaller base was NBD and combined was aggregated EBI and NBD

33
H1 2008 : Achieved Annualised Synergies of USD 55m –ahead of 2008 full year target by 61%
USD Millions
61%
Note 1: Base used when computing synergy targets were 2006 financials
Total Synergies
34
67
101
55
2008 2009 2010
Target Actual (H1'08)

34
Exceeded 2008 full year targets on all revenue, costs & one-off synergies
USD MillionsRevenue Synergies
Cost Synergies
One-off Synergies
Note 1: Base used when computing synergy targets were 2006 financials
34%
82%
144%
+61%
Total Synergies
34
67
101
55
2008 2009 2010
Target Actual (H1'08)
18
35
53
24
2008 2009 2010
14
27
41
25
2008 2009 2010
2.5
4.6
7.16
2008 2009 2010

35
On track to exceed targets even re-based with reference to 2007 financials proforma revenues & costs
27
20
24 25
Revenue synergies Cost synergies
USD Millions
124%88%
% achieved of re-based targets
Re-based targets based on 2007 proforma results
Annualised synergies achieved
• Rebased targets for revenues for 2008 FY, computed as 1.4% of 2007 ENBD proforma revenues of USD 1.9 billion• Rebased targets for cost for 2008 FY, computed as 2.7% of 2007 ENBD proforma cost of USD 740 million• @ 1.4% and 2.7% are 33% of 3 years targets of combined base of 4.1% and 8.3% respectively.

36
24
25
6
55
Total, %
Synergies achieved : Key drivers
• Largest distribution network of 115 branches & 486 ATMs• Focus on cross selling – e.g. mortgages >USD 27m loans• Enhanced market share/pricing advantages – e.g. FDs• Embedded Customer efficiency framework – e.g. Tafawouq has
tripled branch sales in Umm Suqeim & DCC
Key drivers of synergies achieved in H1’2008
• Single Head-office in place• Created efficiencies through unified business models• Combined marketing & advertisement activities
• Projects & initiatives discontinued due to merger, namely Islamic banking set up previously planned in NBD
Revenue
Costs
One offs
Total
11
48
41
Annualised synergies
USD millions
100

37
Key performance indicators : Cost-Income ratio
Cost Income ratio for H1-2008 is 37.4% (vs. 38.8% in H2-2007)
Before synergies H1-2008 cost-income ratio is 38.6%
Synergies contribute to 1.2% drop in cost-income ratio
Jaws of 4% achieved in H1-2008 vs. H2-2007 (before synergies 1%)
38.8%38.6%
37.4%
H2-2007 H1-2008 (beforesynergies)
H1-2008
Cost: Income ratio
Synergy Impact = 1.2%

38
Contents
The UAE banking opportunity
Emirates NBD: Banking Leader in middle east
Strategic Focus
First Half Year 2008: Financial Overview
Synergies
Integration Update

39
Integration Update
Defined future strategy, target business & operating model in 2007
Developed integration implementation plan till mid 2009
Formalized organization structure for the combined entity
Integration of staff into new organization structure completed
Co-location of teams from both banks well advanced
Leveraging extended product range across combined customer base, e.g. mortgage products or transaction banking capabilities
Established Emirates NBD Capital to combine our strengths across the Treasury and market units and our Investment Bank and to optimize balance sheet management
Launched Large Corporate Unit (LCU) to manage the large corporate accounts of the two merged banks through a dedicated highly-qualified team
Conducted change management program with a series of more than 100 culture workshops “My Bank, Our Values” and around 5,000 staff attending
New Core Banking system already in testing phase and rollout planned for first quarter 2009

40
Customer services improved significantly
Integrated ATM network with 488 ATMs – largest ATM network in the UAE; Roll-out of enhanced payment functionalities completed in September
Network of Smart Deposit Machines (SDMs) integrated: One platform of 92 SDMs across Emirates Bank, Emirates Islamic Bank & NBD
Integrated online and mobile banking in pilot phase. Combined enhanced payment functionalities and services available to all customers from October onwards
Existing best-practice sales & service improvement program rolled-out across branches :
Sales performance increased around 90% for credit card and personal loans sales and 230% for deposit gathering
Customer queue times in branches reduced by around 80% to ca. 5 minutes or less

41
Integration milestones going forward
Electronic Retail channels integrated Same functionalities across ATM network, mobile banking and Internet
11/08 04/0904/08 09/08
HR systems integratedAligned grading, rewards & benefits
Common corporate client management platform in place
Single Treasury system in placeCombined trading coverage to both bank’s customers
New Core Banking system online for combined entityIntegration of all support units completed
Rebranding across all branches completed – One bank across all channels
05/08
Integrated credit cards platform at Network International

Key Messages

43
Key Messages
UAE presents significant growth potential for financial services
EmiratesNBD : A regional financial powerhouse
Our strategy is clear & focused
Integration is on target & delivering value
Strong performance & growth across all businesses
Enhanced products & services for our customers
Creating sustainable shareholder value

Appendix

45
Emirates NBD was honored by H.H. Sheikh Mohamed Bin Rashid Al Maktoum, the Ruler of Dubai and Vice President & Prime Minister of the UAE, for its role in boosting investments and attracting businesses from around the world.
Rick Pudner, Chief Executive Officer of Emirates NBD was awarded the ‘Banker of the Year Award’ by The Banker Middle East.
Emirates NBD has been named as Best Emerging Market Bank & Best Foreign Exchange Bank in the UAE for the year 2008 by Global Finance Magazine.
Superbrands council honored Emirates NBD with three Superbrands awards for Group’s ‘Emirates Bank’, ‘National Bank of Dubai’ and ‘meBank’ brands at the Superbrands Tribute Event held in April 2008.
2008 : Awards

46
April 2008 DEWA
USD 2,200 Million
Syndicated Ijara Facility
Mandated Lead Arranger
February 2008 Emirates Aluminum
US$4,940 MillionProject Finance Facility
Mandated Lead Arranger, Sub-Underwriter and L/C Issuing Bank
March 2008
DEER FIELDS TOWN SQUARE PROJECT
AED 360,000,000 TERM LOAN FACILITY
Mandated Lead Arranger
March 2008
US$225,000,000 revolving multi-currency credit facility
Mandated Lead Arranger
March 2008
Saudi Bin Laden
SR 3,200 Million
Project Facilities
Mandated Lead Arranger
March 2008
Limitless LLC
USD $ 1.2 Billion (Dual currency AED/USD)
Syndicated Mudaraba Facility
Initial Mandated Lead Arranger, Underwriter & Bookrunner
April 2008 Borse Dubai
USD $ 5.8 Billion (Dual currency GBP/USD)
Syndicated Loan Facility
Initial Mandated Lead Arranger, Underwriter & Bookrunner
…..Large Deals Concluded 2008
April 2008 DEWA
AED 3.200 Million
Sukuk al Ijara
Mandated Lead Arranger & Bookrunner

47
June 2008 The Palm Vacation Club FZE(A Subsidiary of IFA Hotels &
Resorts KSCC)
AED 367,300,000
Corporate Term Loan Facility
Initial Mandated Lead Arranger, Underwriter y Bookrunner
June 2008 Axiom Telecom LLC
USD 400,000,000
Dual Currency (AED/USD)Import / Purchase Finance
(Islamic/Conventional) Facility
Initial Mandated Lead Arranger, Underwriter y Bookrunner
June 2008 Dubai World
USD 5,000,000,000
Term Loan and Revolving Credit Facilities
Mandated Lead Arranger, Underwriter & Bookrunner
… Large Deals Concluded 2008 Cont’d…