Embed Size (px)
Citation preview
June 4, 2015
EMFAC 2014 Training
Introduction Major Model Changes Project-Type Guidance Documentation Demonstration
– Installing EMFAC 2014 – Emissions Mode: Default Activity – Emissions Mode: Custom Activity – Emission Rates Mode: Project Level Assessment – EMFAC 2014 Web Databases
Outline
2

3
Introduction
Part I
Introduction – Purpose of EMFAC
Supports Air Quality Planning & SIPs – 2008 Ozone standard – PM2.5 plans
Supports Rulemaking – Rules to set emission standards for new vehicles – Programs to control in-use vehicle emissions
Supports Analyses that need to be Consistent with GHG inventory – New EMFAC “default” uses VMT estimates calculated
such that the associated fuel use matches historical fuel sales, similar to GHG inventory
4
June 2013 – Model Architecture – Methodologies
October 2013 – Changes made to light duty emission rates – Approach to reflect ACC and Truck & Bus Rule – Update to data inputs and methodology
November 2014 – Recent updates – VMT comparison – Emissions Comparison
5
Introduction – Previous Workshops

6
Changes Reflected in EMFAC2014
General Model Architecture Input Regulations Formulation
Part II
EMFAC2014 Publicly Released 12/31/14 One model with new programming architecture
– MySQL & Python Emission estimates through 2050 Integrated capability to change VMT and speed
profiles Fully integrated PL Tool that provides users
capability to calculate hourly emissions for project level assessments
7
EMFAC2014 – General Changes
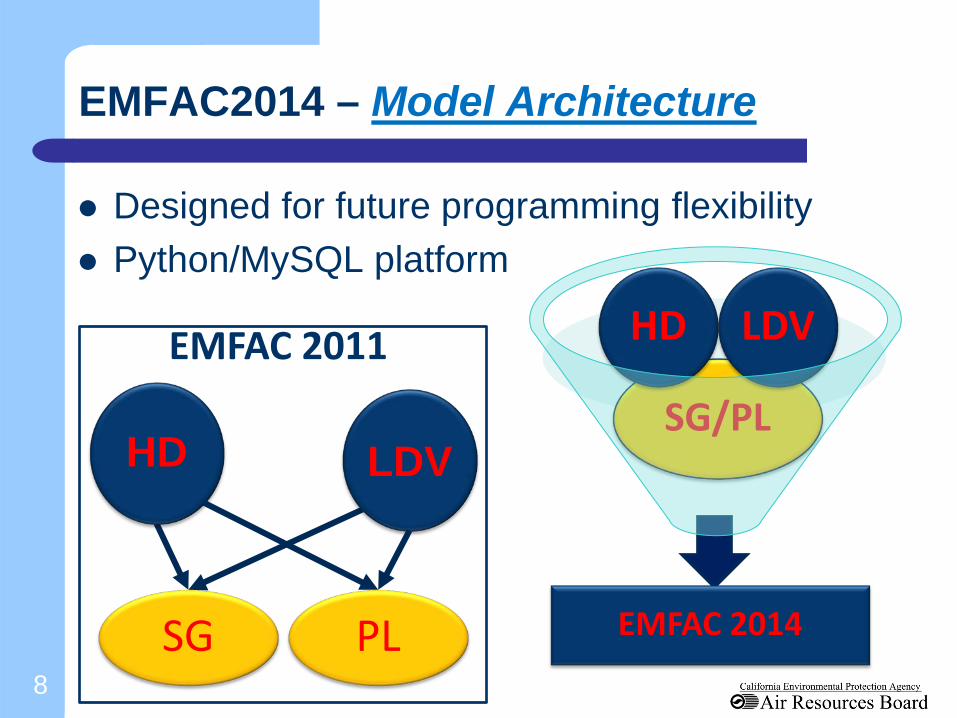
Designed for future programming flexibility Python/MySQL platform
EMFAC 2014
SG/PL
HD LDV EMFAC 2011
8
EMFAC2014 – Model Architecture
HD LDV
SG PL
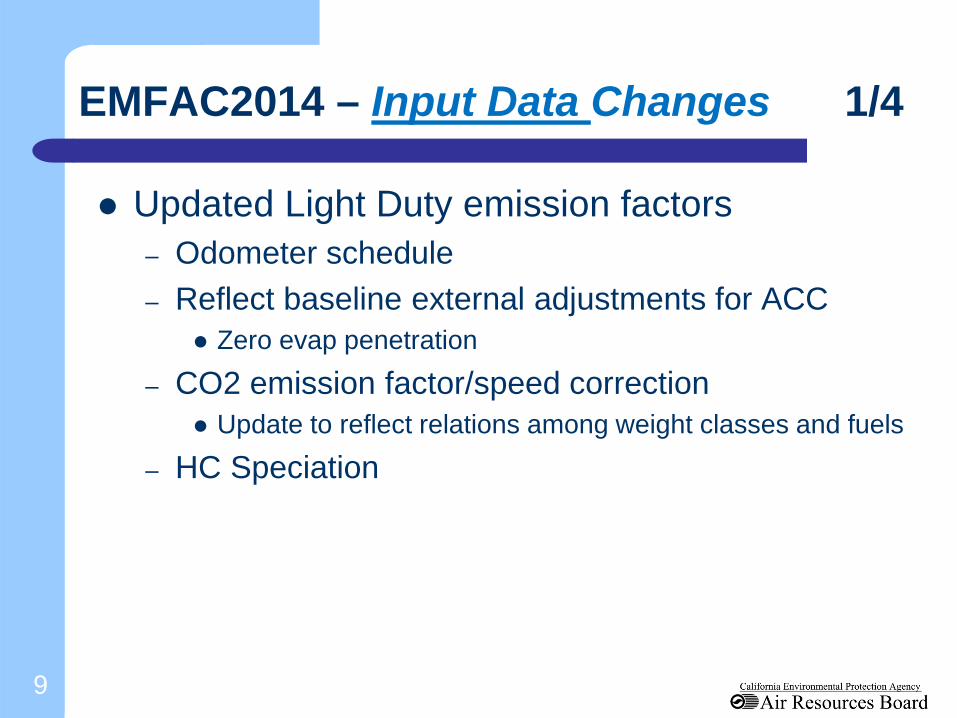
Updated Light Duty emission factors – Odometer schedule – Reflect baseline external adjustments for ACC
Zero evap penetration
– CO2 emission factor/speed correction Update to reflect relations among weight classes and fuels
– HC Speciation
9
EMFAC2014 – Input Data Changes 1/4
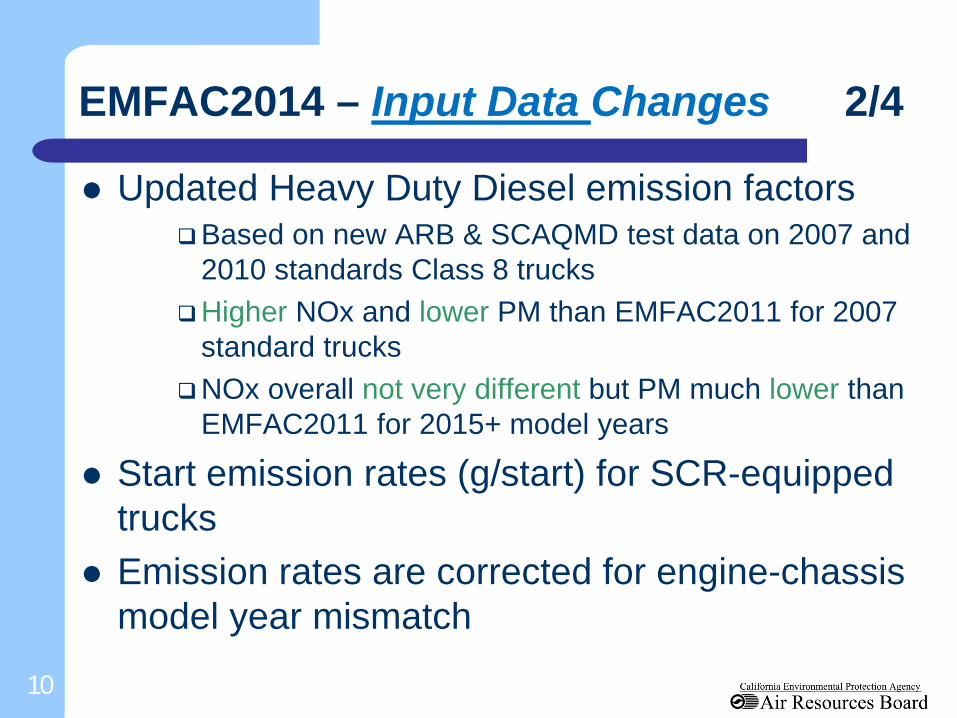
Updated Heavy Duty Diesel emission factors Based on new ARB & SCAQMD test data on 2007 and
2010 standards Class 8 trucks Higher NOx and lower PM than EMFAC2011 for 2007
standard trucks NOx overall not very different but PM much lower than
EMFAC2011 for 2015+ model years
Start emission rates (g/start) for SCR-equipped trucks
Emission rates are corrected for engine-chassis model year mismatch
10
EMFAC2014 – Input Data Changes 2/4

Reflects natural gas urban buses and refuse trucks – Based on data from SCAQMD
Lower PM (as compared to Diesel) Lower NOx (as compared to Diesel) with Three-Way Catalyst
– Vocation specific emission rates Central Business District (CBD) Cycle for Urban Transit
Buses Refuse Truck Cycle (RTC) for Refuse Trucks
– Population estimated based on Bus registry data DMV Registration data
11
EMFAC2014 – Input Data Changes 3/4
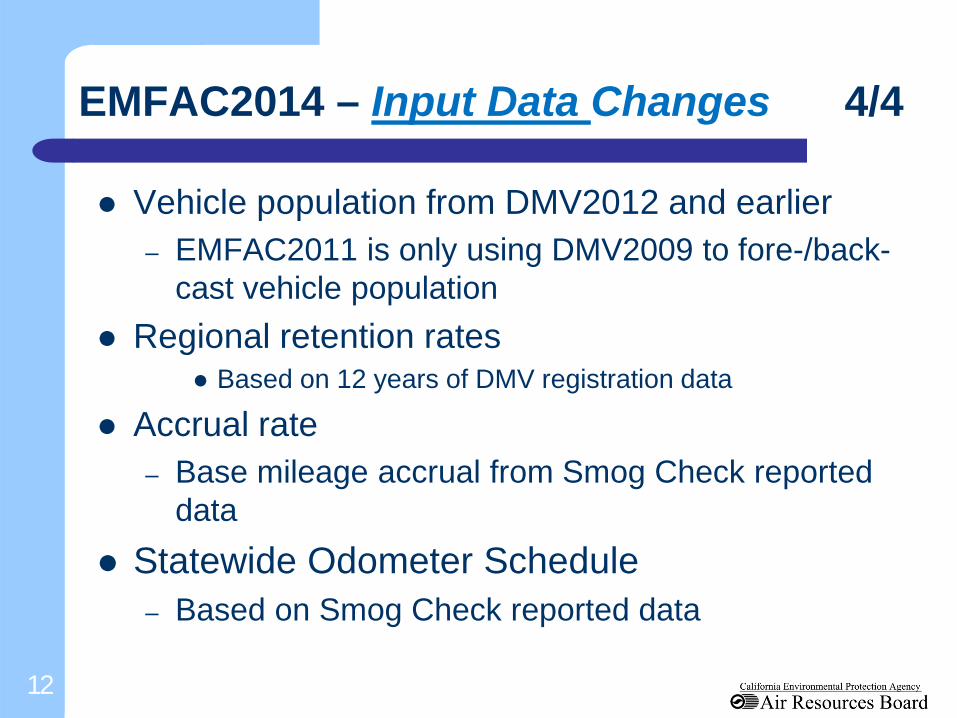
Vehicle population from DMV2012 and earlier – EMFAC2011 is only using DMV2009 to fore-/back-
cast vehicle population Regional retention rates
Based on 12 years of DMV registration data
Accrual rate – Base mileage accrual from Smog Check reported
data Statewide Odometer Schedule
– Based on Smog Check reported data
12
EMFAC2014 – Input Data Changes 4/4

EMFAC2011 ‘Default’ was based on MPO data EMFAC2014 ‘Default’ model supports conducting
analyses that need to be consistent with GHG inventory – Fuel based activity model that uses VMT estimates
calculated such that the associated fuel use matches historical fuel sales, similar to GHG inventory
New forecast methods involve socio-econometric modeling of new vehicle sales and VMT growth
13
EMFAC2014 – Formulation Changes 1/4
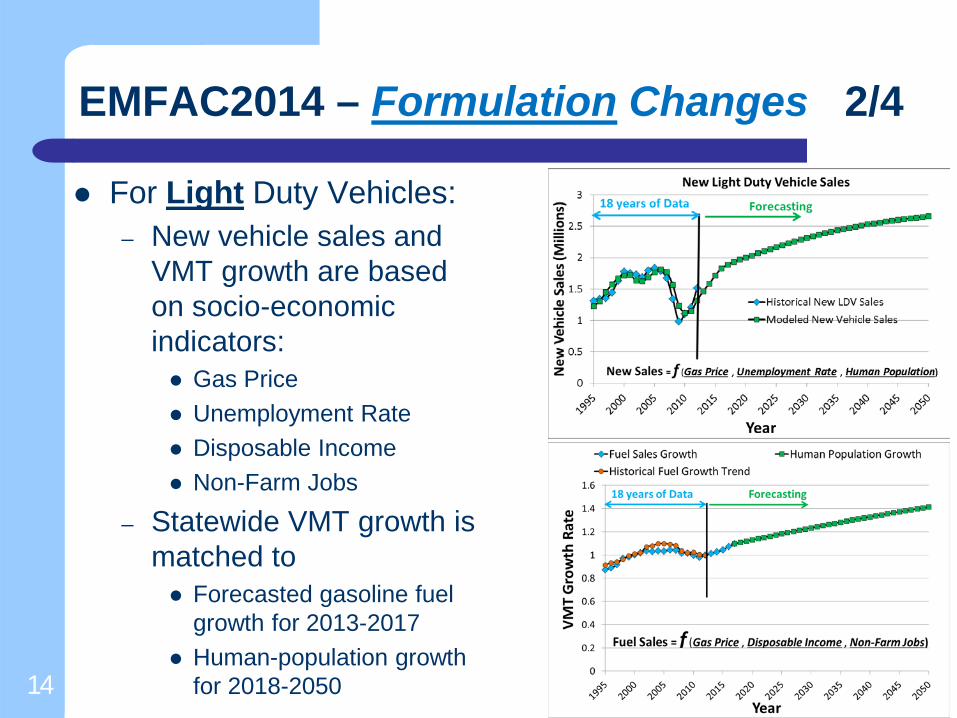
For Light Duty Vehicles: – New vehicle sales and
VMT growth are based on socio-economic indicators: Gas Price Unemployment Rate Disposable Income Non-Farm Jobs
– Statewide VMT growth is matched to Forecasted gasoline fuel
growth for 2013-2017 Human-population growth
for 2018-2050
EMFAC2014 – Formulation Changes 2/4
14
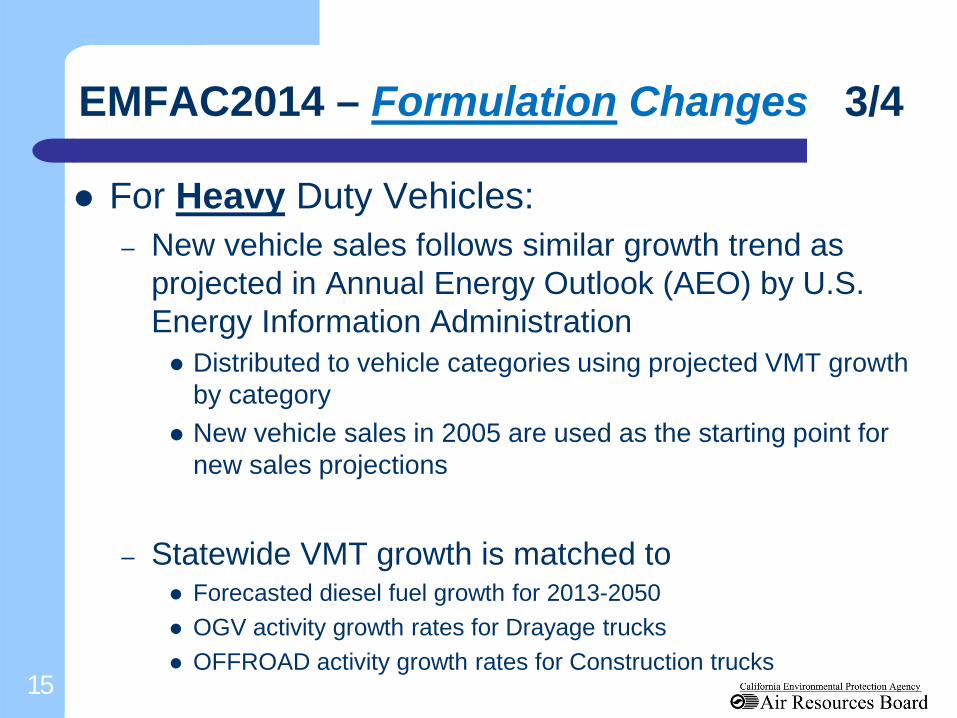
For Heavy Duty Vehicles: – New vehicle sales follows similar growth trend as
projected in Annual Energy Outlook (AEO) by U.S. Energy Information Administration Distributed to vehicle categories using projected VMT growth
by category New vehicle sales in 2005 are used as the starting point for
new sales projections
– Statewide VMT growth is matched to
Forecasted diesel fuel growth for 2013-2050 OGV activity growth rates for Drayage trucks OFFROAD activity growth rates for Construction trucks
EMFAC2014 – Formulation Changes 3/4
15

16
EMFAC2014 – Formulation Changes 4/4
T&B Compliance. Iterative approach for modeling HD population and Truck & Bus Rule compliance
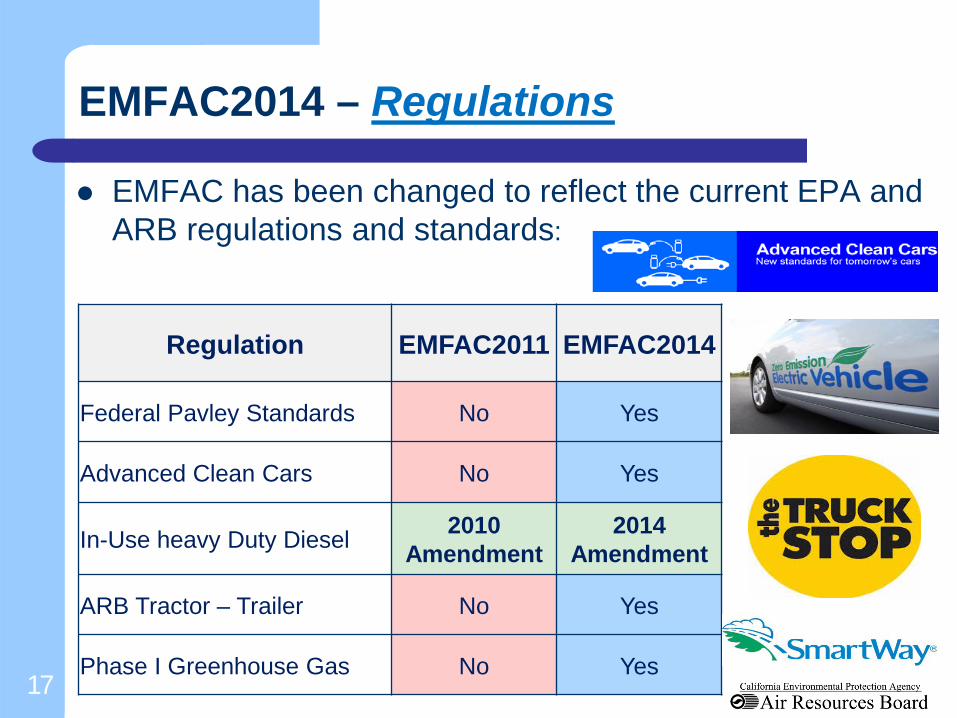
EMFAC has been changed to reflect the current EPA and ARB regulations and standards:
17
EMFAC2014 – Regulations
Regulation EMFAC2011 EMFAC2014
Federal Pavley Standards No Yes
Advanced Clean Cars No Yes
In-Use heavy Duty Diesel 2010 Amendment
2014 Amendment
ARB Tractor – Trailer No Yes
Phase I Greenhouse Gas No Yes

18
Project Type Guidance
Part III
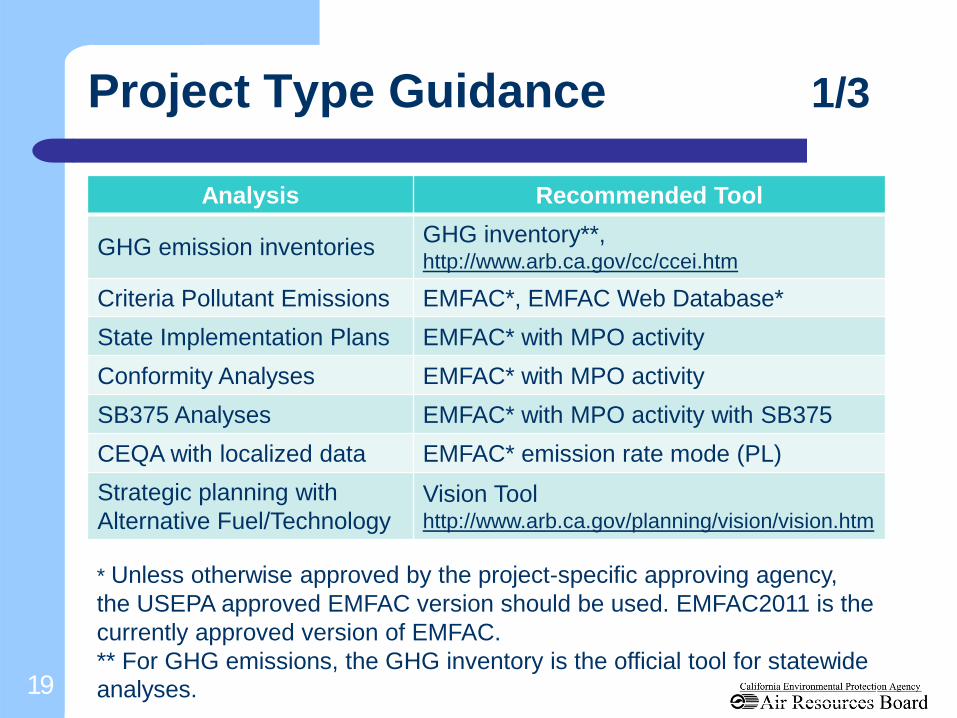
Analysis Recommended Tool
GHG emission inventories GHG inventory**, http://www.arb.ca.gov/cc/ccei.htm
Criteria Pollutant Emissions EMFAC*, EMFAC Web Database* State Implementation Plans EMFAC* with MPO activity Conformity Analyses EMFAC* with MPO activity SB375 Analyses EMFAC* with MPO activity with SB375 CEQA with localized data EMFAC* emission rate mode (PL) Strategic planning with Alternative Fuel/Technology
Vision Tool http://www.arb.ca.gov/planning/vision/vision.htm
Project Type Guidance 1/3
19
* Unless otherwise approved by the project-specific approving agency, the USEPA approved EMFAC version should be used. EMFAC2011 is the currently approved version of EMFAC. ** For GHG emissions, the GHG inventory is the official tool for statewide analyses.

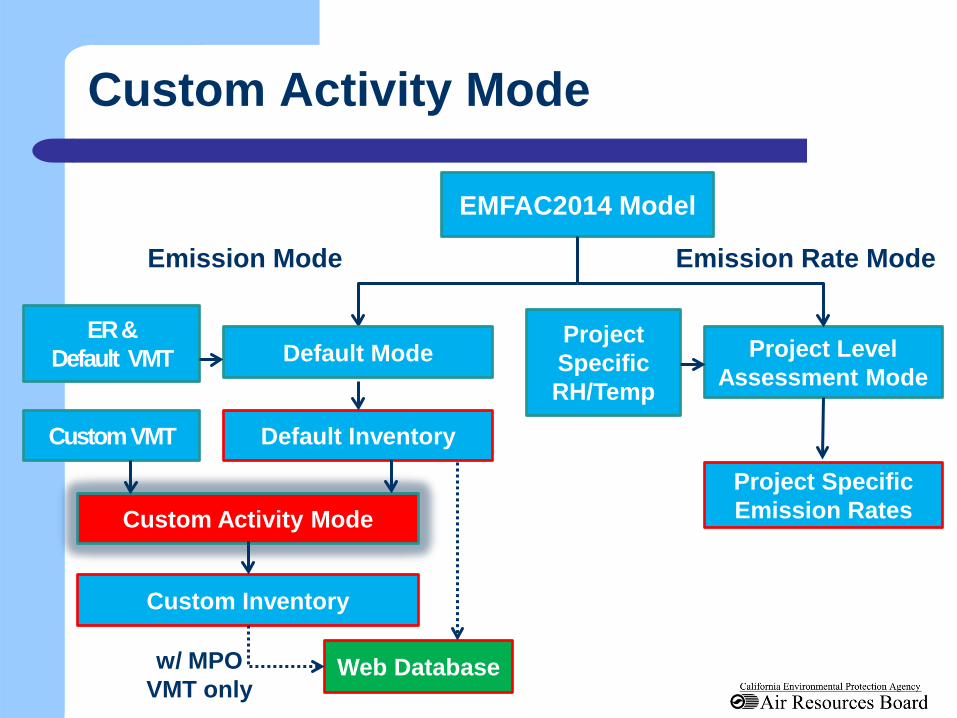
EMFAC2014 Model
Default Inventory
Custom Activity Mode
Custom VMT
Custom Inventory
Emission Mode Emission Rate Mode
Project Level Assessment Mode
Project Specific Emission Rates
Default Mode ER &
Default VMT
Web Database
Project Specific RH/Temp
Project Type Guidance 2/3
w/ MPO VMT only

Emission Mode Emission Rate Mode (PL) Web Database Default
Activity Custom Activity
Aggregated Area N N N Y
Model Year Y N Y Y
Agg. Veh Class N N Y N
Temp/RH Default only Default only Users Specific Default only
Hourly Y Y Y N
Electric Veh Y N Y Y
NG Veh N N Y N
Cat/Non-Cat Y In CTF format N N
All Pollutants Y Y Y No CH4, THC, TPM
Project Type Guidance 3/3
21
All provide emissions/emission rates by season, speed, process, daily as well as EMFAC2007&2011 Vehicle Classes
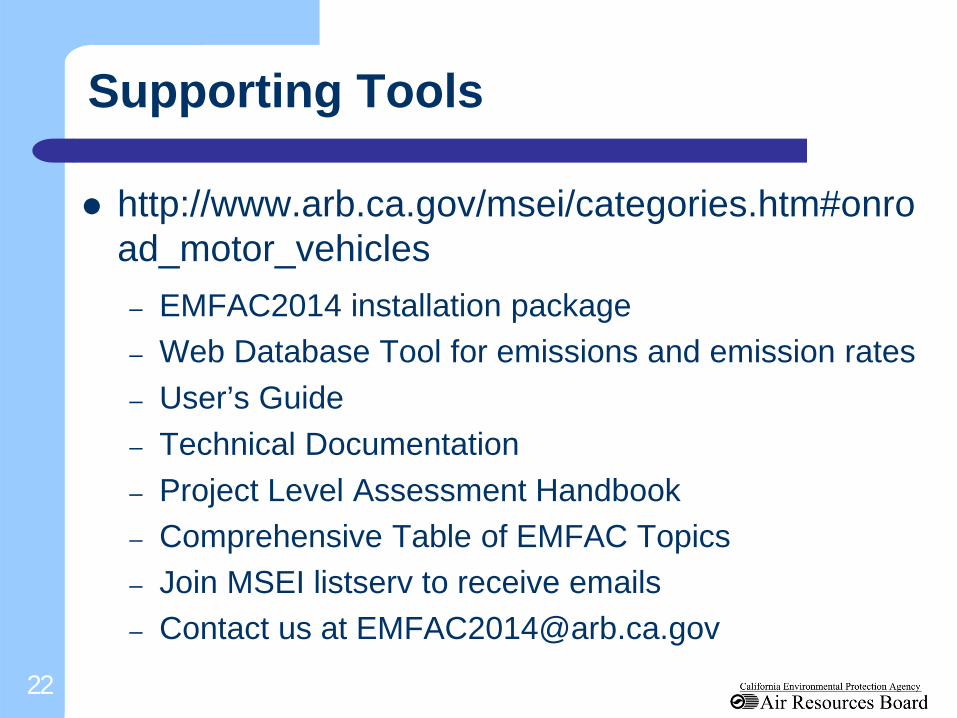
http://www.arb.ca.gov/msei/categories.htm#onroad_motor_vehicles – EMFAC2014 installation package – Web Database Tool for emissions and emission rates – User’s Guide
– Technical Documentation – Project Level Assessment Handbook – Comprehensive Table of EMFAC Topics – Join MSEI listserv to receive emails – Contact us at [email protected]
Supporting Tools
22
23
Installation of EMFAC2014
Part IV
Installing EMFAC 2014
System Requirements Installation Steps Configuration
24
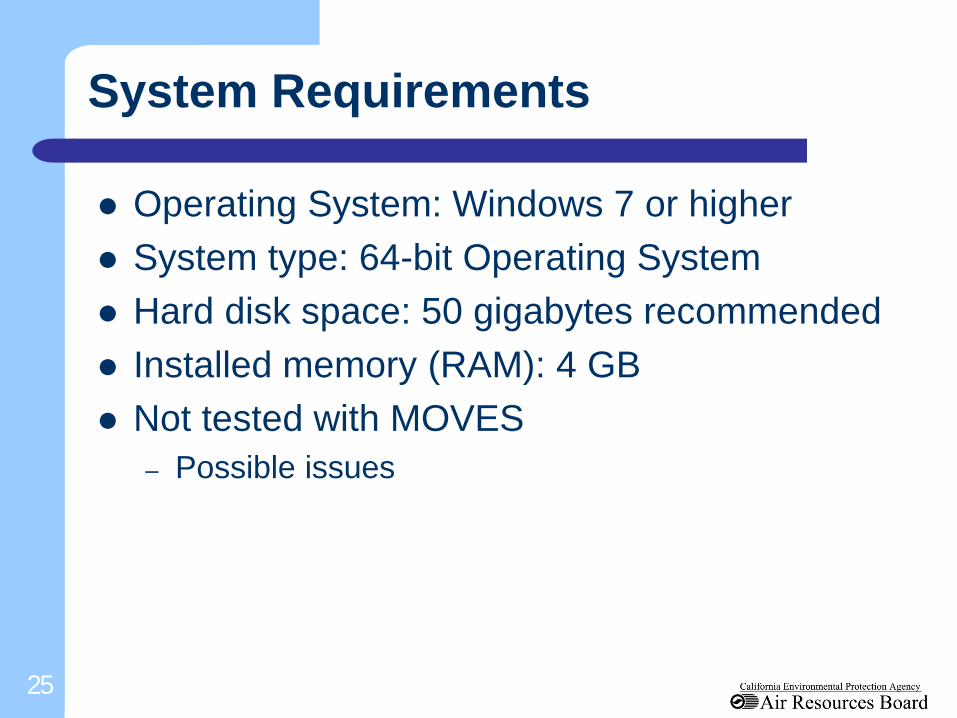
System Requirements
Operating System: Windows 7 or higher System type: 64-bit Operating System Hard disk space: 50 gigabytes recommended Installed memory (RAM): 4 GB Not tested with MOVES
– Possible issues
25

Installation Steps
Download/Install MySQL Download/Install EMFAC 2014 Configure EMFAC 2014
26

Download/Install MySQL
1. MySQL Community Server: http://dev.mysql.com/downloads/mysql/
2. MySQL Installer for Windows 3. Install 64 bit edition, “Server Only” 4. Remember the root password! 5. Elapsed time: ~10 minutes
27
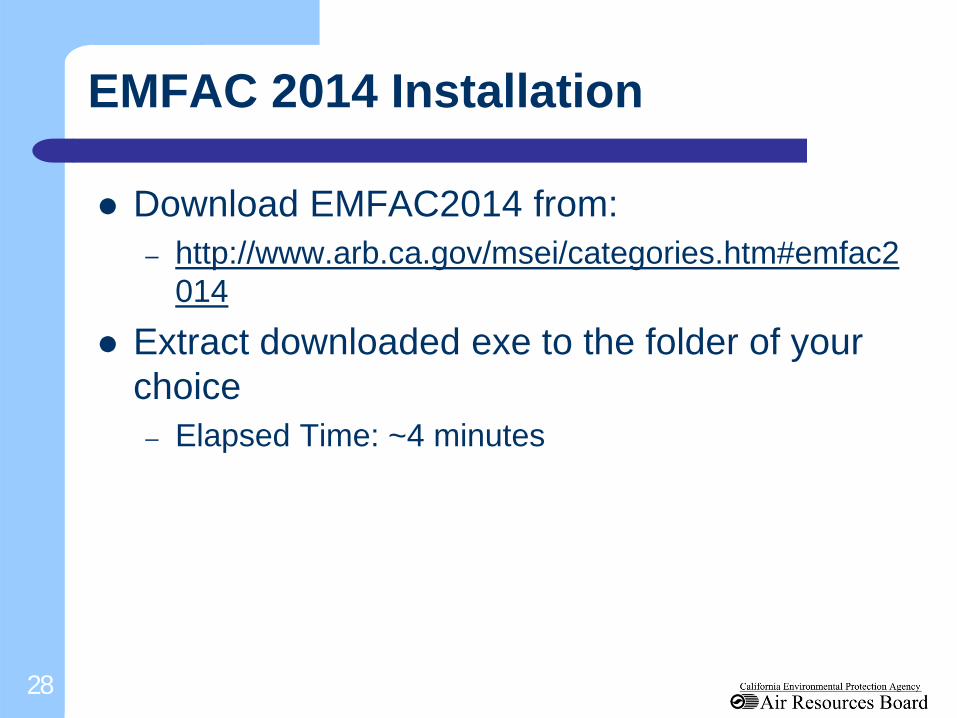
EMFAC 2014 Installation
Download EMFAC2014 from: – http://www.arb.ca.gov/msei/categories.htm#emfac2
014 Extract downloaded exe to the folder of your
choice – Elapsed Time: ~4 minutes
28
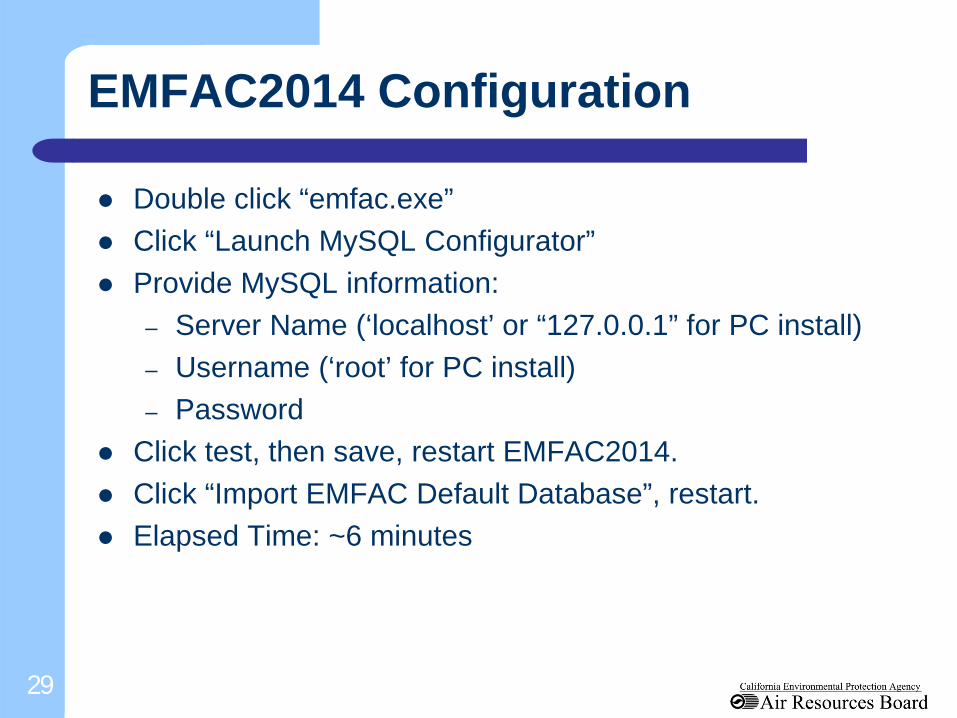
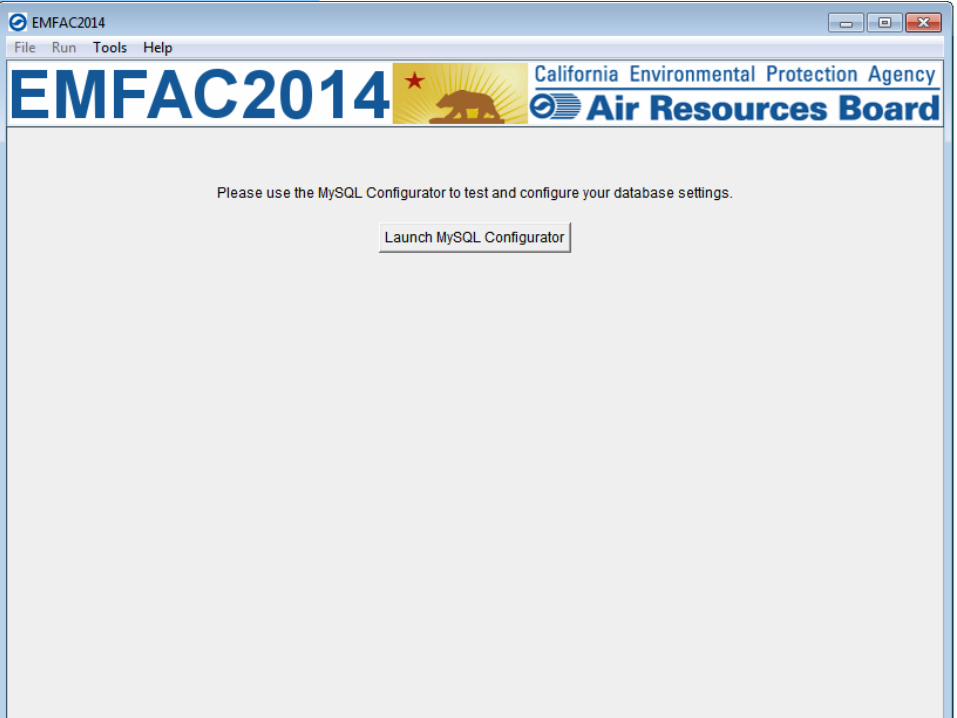
EMFAC2014 Configuration
Double click “emfac.exe” Click “Launch MySQL Configurator” Provide MySQL information:
– Server Name (‘localhost’ or “127.0.0.1” for PC install) – Username (‘root’ for PC install) – Password
Click test, then save, restart EMFAC2014. Click “Import EMFAC Default Database”, restart. Elapsed Time: ~6 minutes
29
30

31

32
33
Emissions Mode: Default Activity
Part V
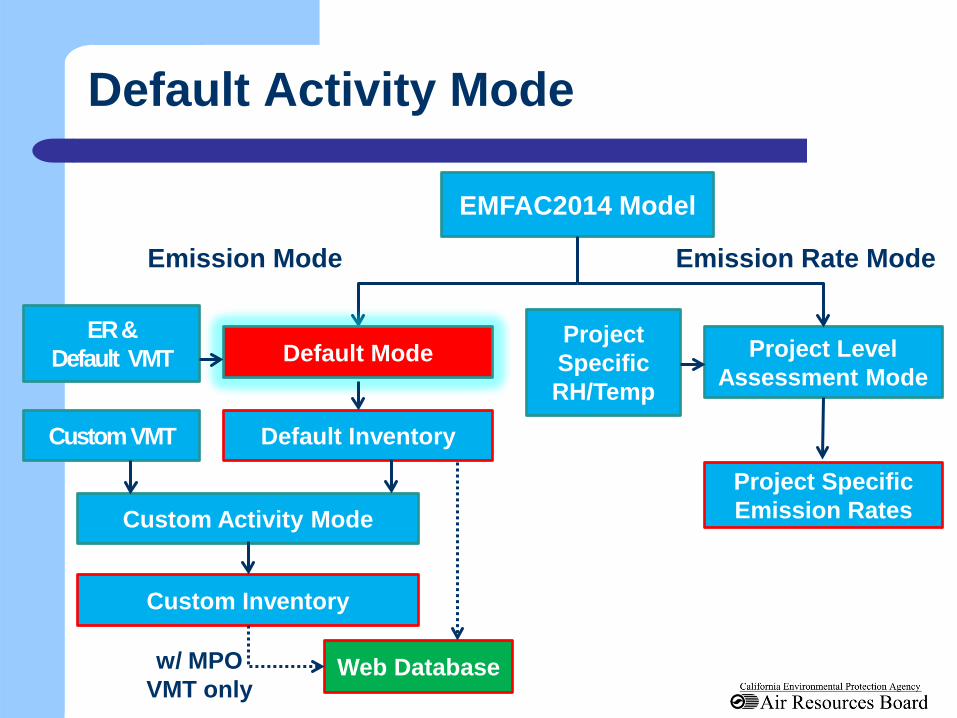
EMFAC2014 Model
Default Inventory
Custom Activity Mode
Custom VMT
Custom Inventory
Emission Mode Emission Rate Mode
Project Level Assessment Mode
Project Specific Emission Rates
Default Mode ER &
Default VMT
Web Database
Project Specific RH/Temp
Default Activity Mode
w/ MPO VMT only
Emissions: Default Activity
Uses Reports: CSV Demonstration
35

36
Emissions Mode: Custom Activity
Part VI

Overview of Custom Activity Mode Create custom activity template Changing total VMT Changing VMT by vehicle class & fuel type SB 375 output
Overview
37
Custom Activity Mode
EMFAC2014 Model
Default Inventory
Custom Activity Mode
Custom VMT
Custom Inventory
Emission Mode Emission Rate Mode
Project Level Assessment Mode
Project Specific Emission Rates
Default Mode ER &
Default VMT
Web Database
Project Specific RH/Temp
w/ MPO VMT only
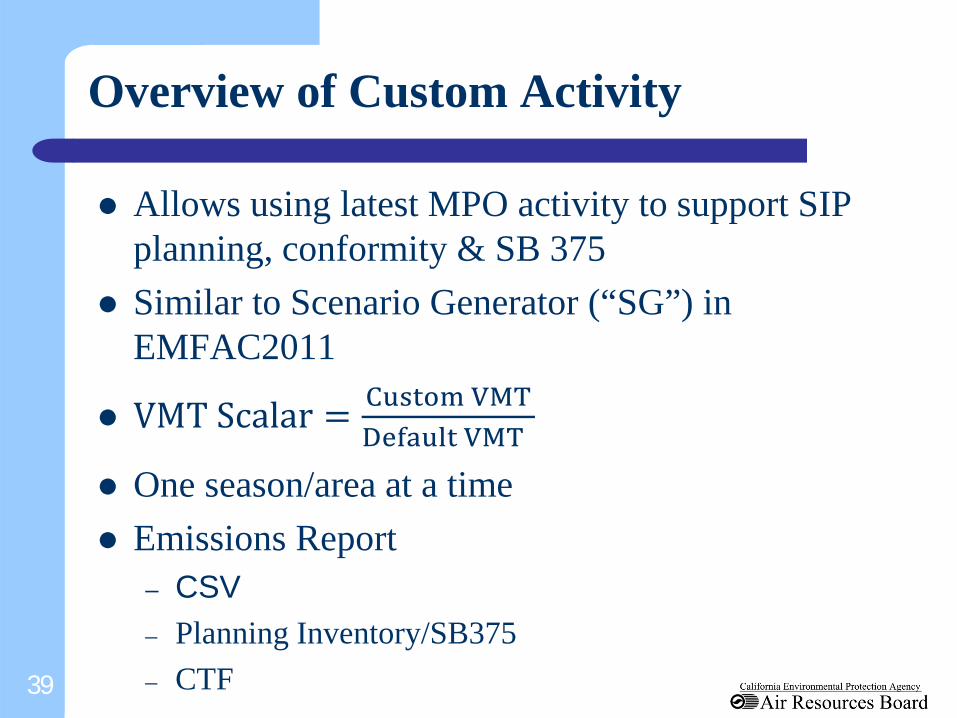
Overview of Custom Activity
Allows using latest MPO activity to support SIP planning, conformity & SB 375
Similar to Scenario Generator (“SG”) in EMFAC2011
VMT Scalar = Custom VMTDefault VMT
One season/area at a time Emissions Report
– CSV – Planning Inventory/SB375 – CTF 39
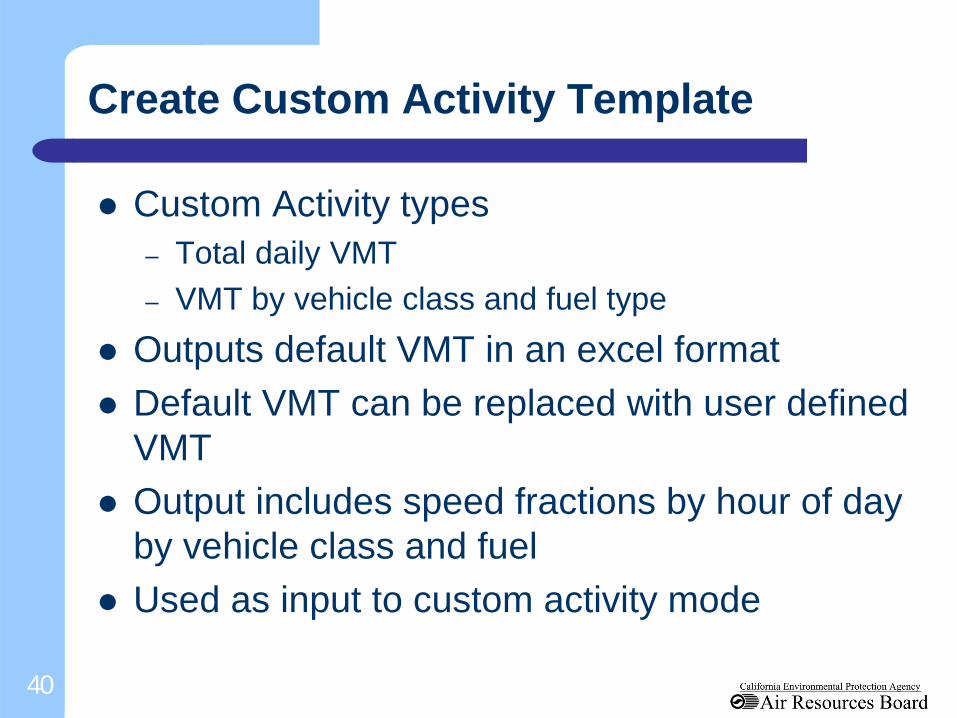
Create Custom Activity Template
Custom Activity types – Total daily VMT – VMT by vehicle class and fuel type
Outputs default VMT in an excel format Default VMT can be replaced with user defined
VMT Output includes speed fractions by hour of day
by vehicle class and fuel Used as input to custom activity mode
40
Changing Total Daily VMT
Scenario: Increase total daily VMT by 10% Modify custom activity template to reflect new
VMT Could modify speed fractions if available Output includes activity and emissions by area
type, calendar year and vehicle class and fuel type
41
Changing VMT by Vehicle & Fuel Type
Scenario: Increase LDV VMT by 5% Modify custom activity template to reflect new
VMT by vehicle & fuel type Could modify speed fractions if available Output includes activity and emissions by area
type, calendar year and vehicle class and fuel type
42

Generate SB 375 Output
SB 375 output only includes 4 vehicle class (LDA, LDT1, LDT2 & MDV)
Does not include Pavley I and ACC Estimates CO2 & fuel consumption only CO2 estimates are not ARB’s official GHG
inventory Scenario: Modify total daily VMT
43

http://www.arb.ca.gov/msei/categories.htm#onroad_motor_vehicles – User’s Guide
– Technical Documentation Chapter 4 – Custom Activity Mode
– Join MSEI listserv to receive emails – Contact us at [email protected]
Supporting Tools
44
45
Emission Rates Mode: Project Level Assessment
Part VII

EMFAC2014 Model
Default Inventory
Custom Activity Mode
Custom VMT
Custom Inventory
Emission Mode Emission Rate Mode
Project Level Assessment Mode
Project Specific Emission Rates
Default Mode ER &
Default VMT
Web Database
Project Specific RH/Temp
Project Level Assessment Mode
w/ MPO VMT only
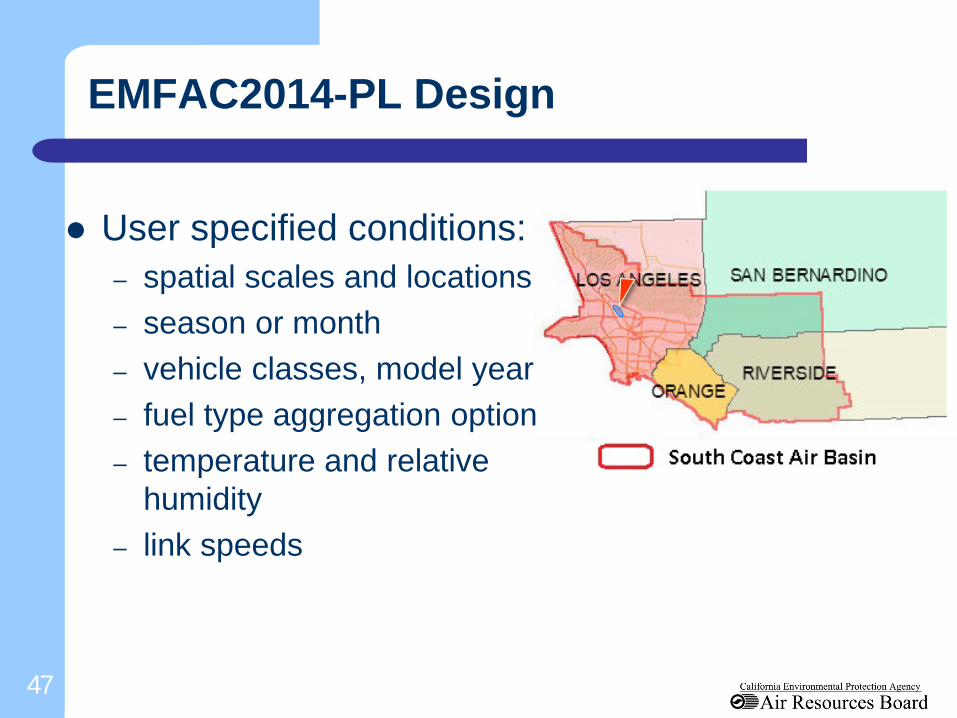
EMFAC2014-PL Design
User specified conditions: – spatial scales and locations – season or month – vehicle classes, model year – fuel type aggregation option – temperature and relative
humidity – link speeds
47
Demo Scenarios
Scenario 1: Arterial Link with Default Fleet Mix- Running Emissions
Scenario 2: Inter-Regional Bus Terminal ‐ Diesel Motor Coach – Idle Emissions
Scenario 3: Urban Bus Terminal ‐ UBUS Idle Emissions
Scenario 4: Park-n-Ride Parking Lot-Evaporative and Start Emissions
48
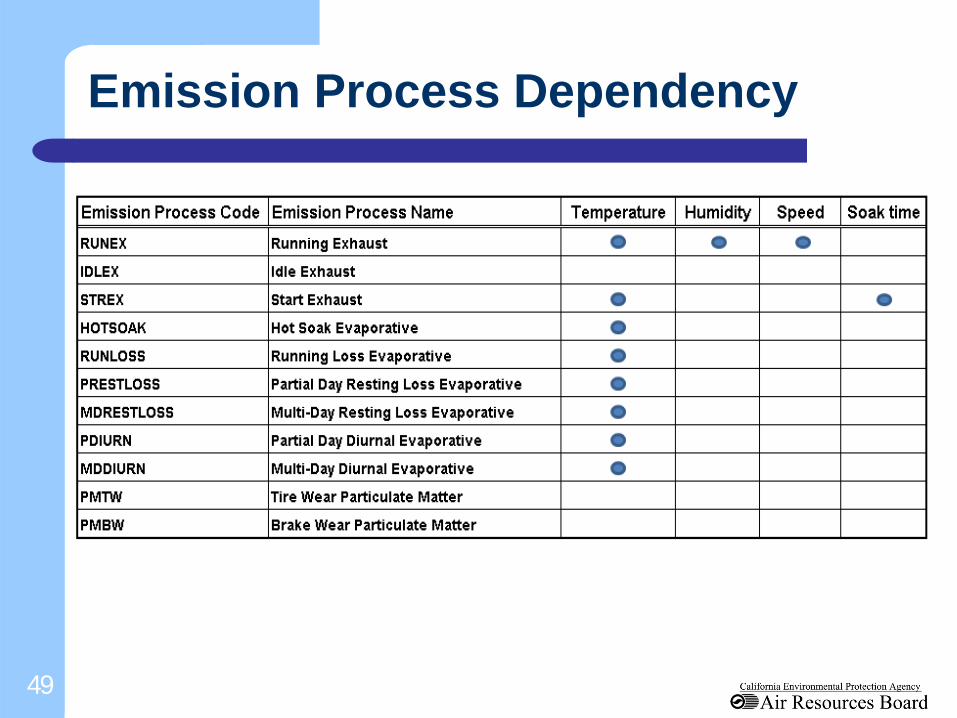
Emission Process Dependency
49

Scenario 1 - Project Details
50
o The project is for a lane expansion on an existing arterial o Location: Sacramento, CA o Analysis year: 2020 o Area is in nonattainment of the annual PM2.5
NAAQS and the 2006 24‐hour PM2.5 NAAQS o Assessment performed for four periods of a day: Morning
peak, Midday, Evening peak, and Overnight o VMT split between Truck and Non-Truck is known o Average link speed: 30 mph, same for all periods of a day o Meteorology data for the four periods available
Scenario 2 - Project Details
51
o This project is a interregional bus terminal where all buses are diesel motor coaches.
o Main process under study at the terminal: idling o Located in Solano county in San Francisco Bay
Area Air Basin o Analysis year: 2016 o Fleet consists of model year 2008 and 2014 o Population is specified by model year o Temperature and humidity available, but they do
not affect idle emissions.
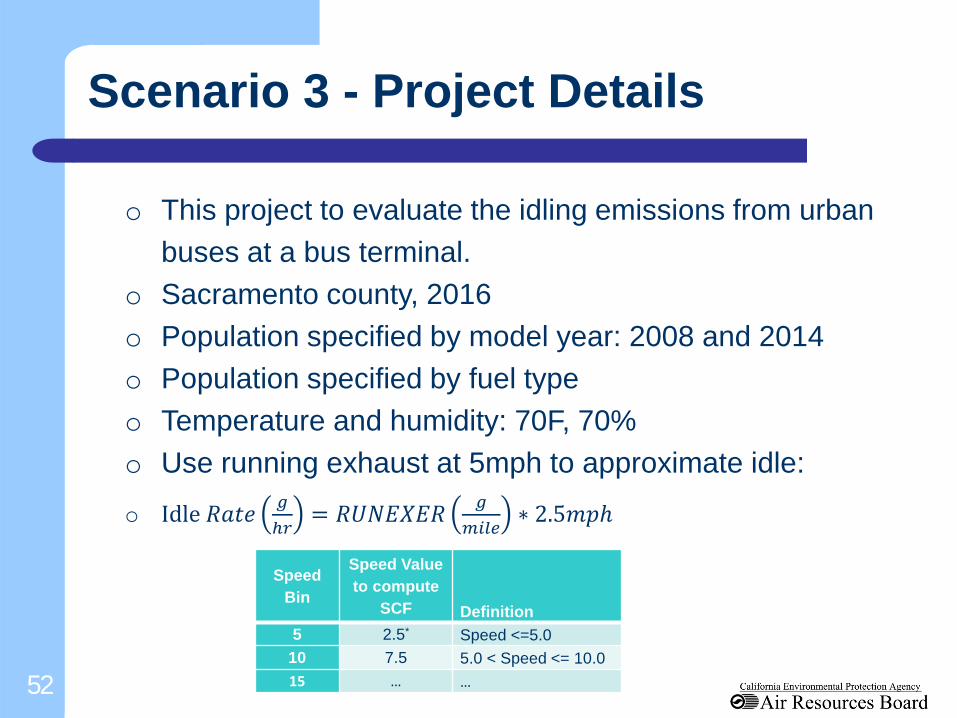
Scenario 3 - Project Details
52
o This project to evaluate the idling emissions from urban buses at a bus terminal.
o Sacramento county, 2016 o Population specified by model year: 2008 and 2014 o Population specified by fuel type o Temperature and humidity: 70F, 70% o Use running exhaust at 5mph to approximate idle:
o Idle 𝑅𝑅𝑅𝑅 𝑔ℎ𝑟
= 𝑅𝑅𝑅𝑅𝑅𝑅𝑅 𝑔𝑚𝑚𝑚𝑚
∗ 2.5𝑚𝑚𝑚
Speed Bin
Speed Value to compute
SCF Definition 5 2.5* Speed <=5.0
10 7.5 5.0 < Speed <= 10.0 15 … …
Scenario 4 - Project Details
53
o This project is for a park-n-ride parking lot o Located in Sacramento county o Analysis year: 2020 o Vehicle activities including population, number of starts
and soak time distributions are collected for fleets defined using EMFAC2007 language: LDA, LDT1, LDT2, MDV and MCY
o Soak time intervals are 5, 360 and 720 minutes o Population by model year unknown o Population by fuel type unknown o Temperature and relative humidity: (70F, 70%)
For More Information
EMFAC2014 User Guide EMFAC2014 Technical Documentation EMFAC2014 Handbook for Project-level
Analyses (http://www.arb.ca.gov/msei/categories.htm) Contact EMFAC team at
54
55
EMFAC Web Database
Part VII
EMFAC Web Database
56
The EMFAC Software provides all the components and functionalities that the users will need for different types of emissions analyses.
On the other hand, the EMFAC Web Database provides a quick and easy way to access commonly used emissions and emission rates data without having to install and run the EMFAC model.
The Web Database contains daily emissions and emission rates data for all areas, calendar years and seasons generated from the EMFAC model.
EMFAC Web Database
Advantages of Web Database vs. running the model: – No need to install anything – Faster – Provides spatially aggregated data
Limitations
– No hourly emissions FOR NOW – No Cat/NonCat split – Does not accept user activity inputs (but there is plan to
include emissions data based on MPO provided activities) – Does not provide emission rates by temperature and humidity
(which should be obtained by running PL using the model)
57
EMFAC Web Database
58
Both EMFAC2011 and EMFAC2014 versions of the Web Database are available now. Unless otherwise approved by the project-specific approving agency, the EPA approved EMFAC version should be used for analyses.
EMFAC2011:
– http://www.arb.ca.gov/emfac/2011 – Currently approved version by USEPA
EMFAC2014:
– http://www.arb.ca.gov/emfac/2014 – Pending USEPA approval as of today
Technical Documentation, User Guide, and PL Handbook at: http://www.arb.ca.gov/msei/categories.htm
Join MSEI email list at http://www.arb.ca.gov/listserv/listserv_ind.php?listname=msei
Contact EMFAC team at [email protected]
For Additional Information
59