Embed Size (px)
Citation preview

Emerging US Space LaunchTrends and Space Solar Power
2015 IEEE International Conference on Wireless for Space and Extreme Environments
Orlando, FLDecember 14-15, 2015
Edgar ZapataNASA Kennedy Space Center
https://ntrs.nasa.gov/search.jsp?R=20150023507 2018-04-25T11:35:21+00:00Z

2
Contents
• Purpose• Background
• The (Slightly) Bigger Picture• The HEO Picture
• Visions of Mars• Or not…or maybe?• The Scope of the Challenge
• Needs• 1. Money?• 2. Time?• 3. Adapting?
• Visions of Launch Affordability• Affordability – How are we doing?
• Spacecraft• Competitiveness – Global• US Launch• This is Not New• In the Pipe
• Visions of Space Solar Power• Relevance to Space Solar Power
• 4. NASA as Investor • NASA as Partner• Closing
• Backup• Comparison of NASA Space Exploration
Architecture Level Assessments

3
Purpose
• Provide an overview of emerging US space launch and space systems trends that are critical to the future of new space business cases – like space solar power
• But first…some background, some visions, and some needs.

$-
$2,000
$4,000
$6,000
$8,000
$10,000
$12,000
$14,000
$16,000
$18,000
$20,000
2003 2004 2005 2006 2007 2008 2009 2010 2011 2012 2013 2014 2015
$M
illi
on
s N
AS
A B
ud
ge
t (R
ea
l Ye
ar
Do
lla
rs)
Year
Cross Agency Support, Education & IG (+2010 fwd,Construction & Environmental)Aeronautics
Science
SFS (incl. SCaN, LSP, et al)
ISS R&D
ISS (Construction thru 2011, then Ops)
Cx ('07-'10), then SLS & Orion & Grd.Sys. ('11 Fwd)
Exploration R&D (was Shuttle Upgrades, SLI, BioSci,HSRT, et al)Space Technology
US Commercial Crew for ISS
ISS Crew (Soyuz) & Cargo (Commercial)
Shuttle
Earmarks
Rescissions (2012)
Rescissions (2012)
Purchase Power in 2003 $, NASA Inf. Index
ShuttleUpgrades +Other R&D
SFS incl. SCaN, LSP
<- US Commercial Crew ISS - Boeing & SpaceX Spacecrafts ->
Space Tech.
Decision: End Shuttle post-ISS
2005 Budget Shifts Begin ... Orion & SLS >
Last Shuttle Flight
2003 Columbia
Return To Flight
<-- ISS Cargo (US Commercial, Antares & Falcon 9 Launch, & Dragon and Cygnus Spacecrafts) & ISS Crew Soyuz -->
Actual NASA budget increases = 1.535% per year average (compound) since 2003
Science Launchers
Shuttle Production & Ops
E. Zapata NASA 8/31/2015
4
Background – The (Slightly) Bigger Picture
• The Entire NASA Budget since 2003 – and Purchasing Power
HEO
$0
$2,000
$4,000
$6,000
$8,000
$10,000
$12,000
$14,000
2015 2016 2017 2018 2019 2020 2021 2022 2023 2024 2025 2026 2027 2028 2029 2030 2031 2032 2033 2034 2035 2036 2037 2038
Life Cycle Cost Bars = All Procurement (Industry) and Government Costs as Modeled in Real Year $M2015 Human Exploration & Operations Budget = $8,185MNASA Scenario Model
2015You are Here!
100%? 50%? None?For?

$0
$2,000
$4,000
$6,000
$8,000
$10,000
$12,000
$14,000
2015 2016 2017 2018 2019 2020 2021 2022 2023 2024 2025 2026 2027 2028 2029 2030 2031 2032 2033 2034 2035 2036 2037 2038
Life Cycle Cost Bars = All Procurement (Industry) and Government Costs as Modeled in Real Year $M2015 Human Exploration & Operations Budget = $8,185MNASA Scenario Model
5
Background – The HEO Picture
• The Human Exploration & Operations (only) part of the NASA Budget
2015You are Here!
100%? 50%? None?For?
6
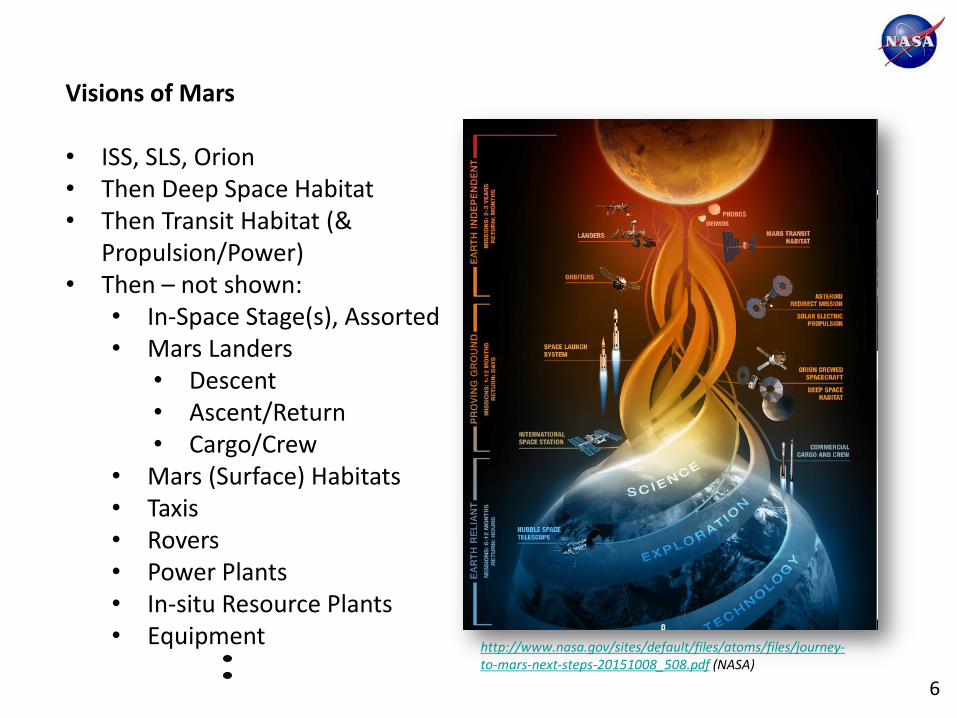
Visions of Mars
• ISS, SLS, Orion• Then Deep Space Habitat • Then Transit Habitat (&
Propulsion/Power)• Then – not shown:
• In-Space Stage(s), Assorted• Mars Landers
• Descent• Ascent/Return• Cargo/Crew
• Mars (Surface) Habitats• Taxis• Rovers• Power Plants• In-situ Resource Plants• Equipment
http://www.nasa.gov/sites/default/files/atoms/files/journey-to-mars-next-steps-20151008_508.pdf (NASA)

7
Visions of Mars – or not?
• National Research Council 2014
“Human Spaceflight Budget Projections. With current flat or even inflation-adjusted budget projections for human spaceflight, there are no viable pathways to Mars.
Potential Cost Reductions. The decadal timescales reflected above are based on traditional NASA acquisition. Acceleration might be possible with substantial cost reductions resulting from
a. More extensive use of broadly applicable commercial products and practices
b. Robust international cost sharing (that is, cost sharing that greatly exceeds the level of cost sharing with the ISS)
c. Unforeseen significant technological advances in the high-priority capabilities.”

8
Visions of Mars – or maybe?
• Jet Propulsion Laboratory 2015 – Price, Baker, Naderi
“This was the motivation for this study of a ‘‘minimal architecture’’ based on a high technology readiness level and the concept of staggered mission campaigns, in order to stay close to the current HSF annual budget adjusted for inflation.
This work was aimed at showing an example (an existence proof) that journeys to Mars could be doable using technologies that NASA is currently pursuing and on a time horizon of interest to stakeholders --without large spikes in NASA budget.”
http://spirit.as.utexas.edu/%7Efiso/telecon/Price_5-20-15/Price_5-20-15.pdf

9
Visions of Mars – the Scope of the Challenge
• SLS with Larger Upper Stage (~100+t>LEO)• 2 SLS/Year, 1 w. Orion as Payload. Other Payload TBD (No $ available)
HEO
$0
$2,000
$4,000
$6,000
$8,000
$10,000
$12,000
$14,000
2015 2016 2017 2018 2019 2020 2021 2022 2023 2024 2025 2026 2027 2028 2029 2030 2031 2032 2033 2034 2035 2036 2037 2038
Life Cycle Cost Bars = All Procurement (Industry) and Government Costs as Modeled in Real Year $M2015 Human Exploration & Operations Budget = $8,185MNASA Scenario Model
2015You are Here!
100%? 50%? None?For?
$0
$2,000
$4,000
$6,000
$8,000
$10,000
$12,000
$14,000
2015 2016 2017 2018 2019 2020 2021 2022 2023 2024 2025 2026 2027 2028 2029 2030 2031 2032 2033 2034 2035 2036 2037 2038
NASA SLS, NREC, Dev. NASA SLS, REC, Make, Fixed
NASA SLS, REC, Make, Var.
Stage, Earth Departure, NREC, Dev. Stage, Earth Departure, REC, Make NASA Orion, NREC, Dev.
NASA Orion, REC, Make, Fixed NASA Orion, REC, Make, Var.
Ground/Launch Site Ops., NREC, Dev. Ground/Launch Site Ops., REC
Government Project Management Government Program Management SLS+Orion+Ground Sys. Budget incl. Gov't Mng'mt
Post-ISS Funding Available per Scenario Selected ISS Funds (R&D & Cargo/Crew) ISS Funds All (incl. ISS Ops = ~ Mission Ops)
Human Spaceflight Total (w. SFS & R&D/"AES")
Life Cycle Cost Bars = All Procurement (Industry) and Government Costs as Modeled in Real Year $M2015 Human Exploration & Operations Budget = $8,185MNASA Scenario Model
2 X ~100t SLS a year
“challenge” No $ -
Exceeds Usual
Budget Growth
Upper Stage “challenge”
No $ -Exceeds
Usual Budget Growth
Replace SRB/SRM, “Advanced Booster” by 2030 for SLS ~130t>LEO
No $ - at Current Budget Growth/Inflation

$0
$2,000
$4,000
$6,000
$8,000
$10,000
$12,000
$14,000
2015 2016 2017 2018 2019 2020 2021 2022 2023 2024 2025 2026 2027 2028 2029 2030 2031 2032 2033 2034 2035 2036 2037 2038
NASA SLS, NREC, Dev. NASA SLS, REC, Make, Fixed
NASA SLS, REC, Make, Var.
Stage, Earth Departure, NREC, Dev. Stage, Earth Departure, REC, Make NASA Orion, NREC, Dev.
NASA Orion, REC, Make, Fixed NASA Orion, REC, Make, Var.
Ground/Launch Site Ops., NREC, Dev. Ground/Launch Site Ops., REC
Government Project Management Government Program Management SLS+Orion+Ground Sys. Budget incl. Gov't Mng'mt
Post-ISS Funding Available per Scenario Selected ISS Funds (R&D & Cargo/Crew) ISS Funds All (incl. ISS Ops = ~ Mission Ops)
Human Spaceflight Total (w. SFS & R&D/"AES")
Life Cycle Cost Bars = All Procurement (Industry) and Government Costs as Modeled in Real Year $M2015 Human Exploration & Operations Budget = $8,185MNASA Scenario Model
10
Visions of Mars – the Scope of the Challenge
• Or alternate futures? Other stakeholders.
HEO
$0
$2,000
$4,000
$6,000
$8,000
$10,000
$12,000
$14,000
2015 2016 2017 2018 2019 2020 2021 2022 2023 2024 2025 2026 2027 2028 2029 2030 2031 2032 2033 2034 2035 2036 2037 2038
Life Cycle Cost Bars = All Procurement (Industry) and Government Costs as Modeled in Real Year $M2015 Human Exploration & Operations Budget = $8,185MNASA Scenario Model
2015You are Here!
100%? 50%? None?For?
2 X ~100t SLS a year
“challenge” No $ -
Exceeds Usual
Budget Growth
Upper Stage “challenge”
No $ -Exceeds
Usual Budget Growth
Replace SRB/SRM, “Advanced Booster” by 2030 for SLS ~130t>LEO
No $ - at Current Budget Growth/Inflation

11
Needs
• Option 1: Getting More Money?
“Meaningful human exploration is possible under a less-constrained budget, ramping up to approximately $3 billion per year in real purchasing power above the FY 2010 guidance in total resources.”
-Seeking a Human Spaceflight Program Worthy of a Great Nation, by The Review of US Human Spaceflight Plans Committee
• Also NRC 2014, et al
• Option 2: Getting More Time? (& Money, & Doing Less)
• JPL 2015 et al• Mars landing by 2039• Assumption of infinite patience – if neglecting certain stakeholders
There’s a reason stakeholders are called “stake” holders

12
Needs
• Option 3: Adapting? – like Smith Corona?• For a time, saw threat as typewriters manufactured abroad
• Response: Plants moved abroad• For a time, created “personal word processors” –advanced for their time
• Why use someone else’s software?• Why use someone else’s electronics?• Why use someone else’s floppies?• Numerous advantages over those “PCs”
• Bankruptcy 1995
Adapting - right to the end

13
Visions of Launch Affordability
…Once upon a time…the Reusable Launch Vehicle program, NASA, late 1990’s
$1000/lb = $2,222/kg

14
Affordability – How are we doing?
• What do the numbers tell us?
$25,501
$3,107 $144 $222 $2,091
$14,057 $17,087
$-
$5,000
$10,000
$15,000
$20,000
$25,000
CSM-Apollo(crew/to Cis-Lunar)
CST-100 (crew/toLEO)
Cygnus (cargo/toLEO)
Dragon 1.0(cargo/to LEO)
Dragon 2.0(crew/to LEO)
LEM-Apollo(crew/to Lunar
Surface)
Orion (crew/to Cis-Lunar)
No
n-r
ecu
rrin
g $
M
NASA Non-recurring Investment / Development,Procurement $ Only, $M FY 2015$
E. Zapata NASA9/17/2015
Alphabetical Order ->
Total of Actuals to 2014, +Planned 2015-2020, +Estimates 2021-2022 to complete
Average Shown; UncertaintyLo $20B, Hi $31B
Average Shown; UncertaintyLo $12B, Hi $16B
Total of Actuals to 2014,+Planned to complete
Total of Actuals to 2014,+Planned to complete
NASA Only ShownPrivate $ add $148M
NASA Only ShownPrivate $ add $124M
$683
$420
$162 $91
$303
$699
$932
$- $100 $200 $300 $400 $500 $600 $700 $800 $900
$1,000
CSM-Apollo(crew/to Cis-Lunar)
CST-100 (crew/toLEO)
Cygnus (cargo/toLEO)
Dragon 1.0(cargo/to LEO)
Dragon 2.0(crew/to LEO)
LEM-Apollo(crew/to Lunar
Surface)
Orion (crew/to Cis-Lunar)
Re
cu
rrin
g $
M
Spacecraft Recurring Price to NASA per Unit,Procurement $ Only, $M FY 2015$
E. Zapata NASA9/2/2015
Alphabetical Order ->
Make Only.An estimate @1 unit/year.If @2 flights year, $566M/unit. Scenario if Orion less than 1 Flts/year = $1,560M/unit.
Make and Ops and Launch included (as a service).For CST-100 & Dragon 2.0, estimates / planned
Make Only.Average Shown; UncertaintyLo $300M, Hi $1,000M
Make Only.Average Shown; UncertaintyLo $400M, Hi $1,000M
0
5
10
15
20
25
30
35
40
45
19
90
19
91
19
92
19
93
19
94
19
95
19
96
19
97
19
98
19
99
20
00
20
01
20
02
20
03
20
04
20
05
20
06
20
07
20
08
20
09
20
10
20
11
20
12
20
13
20
14
20
15
To
tal
Co
mm
erc
ial
Sp
ace
La
un
ch
es
Da
ta U
S D
ep
art
me
nt
of
Tra
nsp
ort
ati
on
Year
United States
Russia
Europe
Sea Launch
China
India
Ukraine$28 $55 $61 $67
$88 $90
$97 $109 $184
$187 $223 $268 $295 $284
$775 $872
$1,547
580 443 13,150 13,150 13,150
43,000
13,150 4,900
28,790
9,797 17,443
11,587 12,124
28,790 24,400
70,000 70,000
$48,276
$124,153
$4,654 $5,119 $6,662
$2,093
$7,376
$22,247 $6,391 $19,087 $12,784
$23,159
$24,370 $9,865
$31,755 $12,458
$22,100
4,630 2,658
78,900 78,900 78,900 78,900
9,800
66,103
103,399 103,399
121,236
66,103
195,200
$-
$50,000
$100,000
$150,000
$200,000
$250,000
$-
$200
$400
$600
$800
$1,000
$1,200
$1,400
$1,600
$1,800
Minotaur I,DoD/ORS
Pegasus XL, NASALSP, Sci., Class-D
Falcon 9,Commercial
Falcon 9, NASA ISS,Cargo, Block-buy,
Bundle
Falcon 9, NASA LSP,Sci., Class-C
Falcon Heavy,Commercial
Falcon 9, DoD (w.NASA & NOAA)
Antares, NASA ISS,Cargo, Block-buy,
Bundle
Delta IV Heavy, NRO(Service ONLY, No
ELC)
Atlas V 401, NASALSP, Sci., Class A/B
Atlas V 541, NASALSP, Sci., Class A/B
ULA (Atlas/DeltaAvg., ALL
Customers)
ULA (Atlas/DeltaAvg., DoD Only,Service + ELC)
Delta IV Heavy, NRO(Service + ELC)
Space Shuttle (ref.,crew excluded from
calculation; seenotes)
SLS (+grd ops, noupper stage, no
Orion, 2 flts/year)
SLS (+grd ops, noupper stage, no
Orion, 1 flt/year)
$ p
er k
g B
asis
Min
imu
m C
ost o
f E
ntry
$ M
Cost of Entry = Price of the Specific Launcher for that Customer / Application in $ Millions
Maximum Payload Capability of Launcher, kg to LEO, 200km/28.5 circ. (regardless of actual kg used by customer)
$ per kg
Best Recent Yearly "System" (All Atlas's, All Delta's, All Falcon 9's, etc.) Capability Demonstrated, Total kg to LEO in a Year
E. Zapata NASA10/14/2015
No longer operational
(2011)
Not yet operational
(2018)
RECENT COST DATA 2012-2017In Order of Cost of Entry >
Best yearly capability (6 flights) not
recent - 1998
BUT IF NASA -NOT $184M
RATHER $389.1M
Atlas best total kg/year
20149 flights
Delta best total kg/year
20124 flights
Falcon 9 besttotal kg/year
20146 flights
All 2014 data, DoD Only costs and total
kg/year
Not yet operational
(2016)
Not yet operational
(2018)

15
• Holistic view, recent/old, cargo/crew, commercial/cost-plus
$25,501
$3,107 $144 $222 $2,091
$14,057 $17,087
$-
$5,000
$10,000
$15,000
$20,000
$25,000
CSM-Apollo(crew/to Cis-Lunar)
CST-100 (crew/toLEO)
Cygnus (cargo/toLEO)
Dragon 1.0(cargo/to LEO)
Dragon 2.0(crew/to LEO)
LEM-Apollo(crew/to Lunar
Surface)
Orion (crew/to Cis-Lunar)
No
n-r
ecu
rrin
g $
M
NASA Non-recurring Investment / Development,Procurement $ Only, $M FY 2015$
E. Zapata NASA9/17/2015
Alphabetical Order ->
Total of Actuals to 2014, +Planned 2015-2020, +Estimates 2021-2022 to complete
Average Shown; UncertaintyLo $20B, Hi $31B
Average Shown; UncertaintyLo $12B, Hi $16B
Total of Actuals to 2014,+Planned to complete
Total of Actuals to 2014,+Planned to complete
NASA Only ShownPrivate $ add $148M
NASA Only ShownPrivate $ add $124M
CrewCommercial
CargoCommercial
CargoCommercial
CrewCommercial
CrewCost+/BAU
Spacecraft Cost Data - Development(Cost as Price to NASA)
Emerging Space

16
$683
$420
$162 $91
$303
$699
$932
$- $100 $200 $300 $400 $500 $600 $700 $800 $900
$1,000
CSM-Apollo(crew/to Cis-Lunar)
CST-100 (crew/toLEO)
Cygnus (cargo/toLEO)
Dragon 1.0(cargo/to LEO)
Dragon 2.0(crew/to LEO)
LEM-Apollo(crew/to Lunar
Surface)
Orion (crew/to Cis-Lunar)
Re
curr
ing
$M
Spacecraft Recurring Price to NASA per Unit,Procurement $ Only, $M FY 2015$
E. Zapata NASA9/2/2015
Alphabetical Order ->
Make Only.An estimate @1 unit/year.If @2 flights year, $566M/unit. Scenario if Orion less than 1 Flts/year = $1,560M/unit.
Make and Ops and Launch included (as a service).For CST-100 & Dragon 2.0, estimates / planned
Make Only.Average Shown; UncertaintyLo $300M, Hi $1,000M
Make Only.Average Shown; UncertaintyLo $400M, Hi $1,000M
CrewCommercial
CargoCommercial
CargoCommercial
CrewCommercial
CrewCost+/BAU
Manuf. $ Only Manuf. and Ops/Launch $
• Holistic view, recent/old, cargo/crew, commercial/cost-plus
Spacecraft Cost Data – Manufacturing - “Thru Delivery”(Cost as Price to NASA)
Manuf. $ Only Manuf. $ Only
Emerging Space

17
0
5
10
15
20
25
30
35
40
45
19
90
19
91
19
92
19
93
19
94
19
95
19
96
19
97
19
98
19
99
20
00
20
01
20
02
20
03
20
04
20
05
20
06
20
07
20
08
20
09
20
10
20
11
20
12
20
13
20
14
20
15
Tota
l Co
mm
erc
ial S
pa
ce
Lau
nch
es
Da
ta U
S D
ep
art
me
nt
of
Tra
nsp
ort
ati
on
Year
United States
Russia
Europe
Sea Launch
China
India
Ukraine
6
6
6
0
1
0
0
Total Commercial
2015 = 19
Competitiveness2015 = 19 Commercial Launches out of 68 Total Global Major Launches
• The US is regaining commercial launch market share• Customers appear glad to return – for the right price
Emerging Space
Data through 2014 from US DOT: http://www.rita.dot.gov/bts/node/4909112015 data from assorted launch records

18
US Launch Prices (Costs to the Customers)
$4,600/kg $2,000/kg?
$28 $55 $61 $67
$88 $90
$97 $109 $184
$187 $223 $268 $295 $284
$775 $872
$1,547
580 443 13,150 13,150 13,150
43,000
13,150 4,900
28,790
9,797 17,443
11,587 12,124
28,790 24,400
70,000 70,000
$48,276
$124,153
$4,654 $5,119 $6,662
$2,093
$7,376
$22,247 $6,391 $19,087 $12,784
$23,159
$24,370 $9,865
$31,755 $12,458
$22,100
4,630 2,658
78,900 78,900 78,900 78,900
9,800
66,103
103,399 103,399
121,236
66,103
195,200
$-
$50,000
$100,000
$150,000
$200,000
$250,000
$-
$200
$400
$600
$800
$1,000
$1,200
$1,400
$1,600
$1,800
Minotaur I,DoD/ORS
Pegasus XL, NASALSP, Sci., Class-D
Falcon 9,Commercial
Falcon 9, NASA ISS,Cargo, Block-buy,
Bundle
Falcon 9, NASA LSP,Sci., Class-C
Falcon Heavy,Commercial
Falcon 9, DoD (w.NASA & NOAA)
Antares, NASA ISS,Cargo, Block-buy,
Bundle
Delta IV Heavy, NRO(Service ONLY, No
ELC)
Atlas V 401, NASALSP, Sci., Class A/B
Atlas V 541, NASALSP, Sci., Class A/B
ULA (Atlas/DeltaAvg., ALL
Customers)
ULA (Atlas/DeltaAvg., DoD Only,Service + ELC)
Delta IV Heavy, NRO(Service + ELC)
Space Shuttle (ref.,crew excluded from
calculation; seenotes)
SLS (+grd ops, noupper stage, no
Orion, 2 flts/year)
SLS (+grd ops, noupper stage, no
Orion, 1 flt/year)
$ p
er k
g B
asis
Min
imu
m C
ost o
f E
ntry
$ M
Cost of Entry = Price of the Specific Launcher for that Customer / Application in $ Millions
Maximum Payload Capability of Launcher, kg to LEO, 200km/28.5 circ. (regardless of actual kg used by customer)
$ per kg
Best Recent Yearly "System" (All Atlas's, All Delta's, All Falcon 9's, etc.) Capability Demonstrated, Total kg to LEO in a Year
E. Zapata NASA10/14/2015
No longer operational
(2011)
Not yet operational
(2018)
RECENT COST DATA 2012-2017In Order of Cost of Entry >
Best yearly capability (6 flights) not
recent - 1998
BUT IF NASA -NOT $184M
RATHER $389.1M
Atlas best total kg/year
20149 flights
Delta best total kg/year
20124 flights
Falcon 9 besttotal kg/year
20146 flights
All 2014 data, DoD Only costs and total
kg/year
Not yet operational
(2016)
Not yet operational
(2018)
Emerging Space

19
This is Not New – and it’s not limited to launch systems
• SpaceHab Price-Water House Report 1991• SpaceHab was 1/10th the cost as commercial (as defined then) versus
business-as-usual• One of a handful of historical data points with a Business-as-Usual ~
analog (SpaceLab)• Dependent on Shuttle; very much an ECLSS system extension
shielded within the Orbiter payload bay
SpaceHab double-research module, STS-107 Columbia, NASA

20
In the Pipe
• Reusability – Falcon 1st Stage(s)?
• ULA Vulcan launcher – price drops?
• Constellations of Sat’s – Round 2? OneWeb, Google/SpaceX, etc.
• Small Launch – business plans around the business plans of ever more Small Sat capabilities

21
http://science.ksc.nasa.gov/shuttle/nexgen/Nexgen_Images/solar_power_satellite_concept.jpg (Public Domain)
By permission, John C. Mankins
“Integrated Symmetrical Concentrator” (ISC) Solar Power Satellite, late 1990s, NASA
“SPS-ALPHA” (Solar Power Satellite by means of Arbitrarily Large Phased Array),
2013, Mankins Space Technology, Inc.
Visions of Space Solar Power

22
Relevance to Space Solar Power
Are the barriers to Mars and Space Solar Power the same?
• Both need more affordable space transportation
• Both need more affordable space systems
• Will both always be 20 years away?

23
Relevance to Space Solar Power – A New Option
1. Get Money2. Get Time3. Adapt4. NASA as Investor – transforming to become “one of many customers”
NASA, http://www.nasa.gov/offices/oct/partnership/comm_space/
Space Systems-Launch-Spacecraft-Habitation
Decreasing Prices, Decreasing Costs
Highest Price, Unsustainable Costs
24
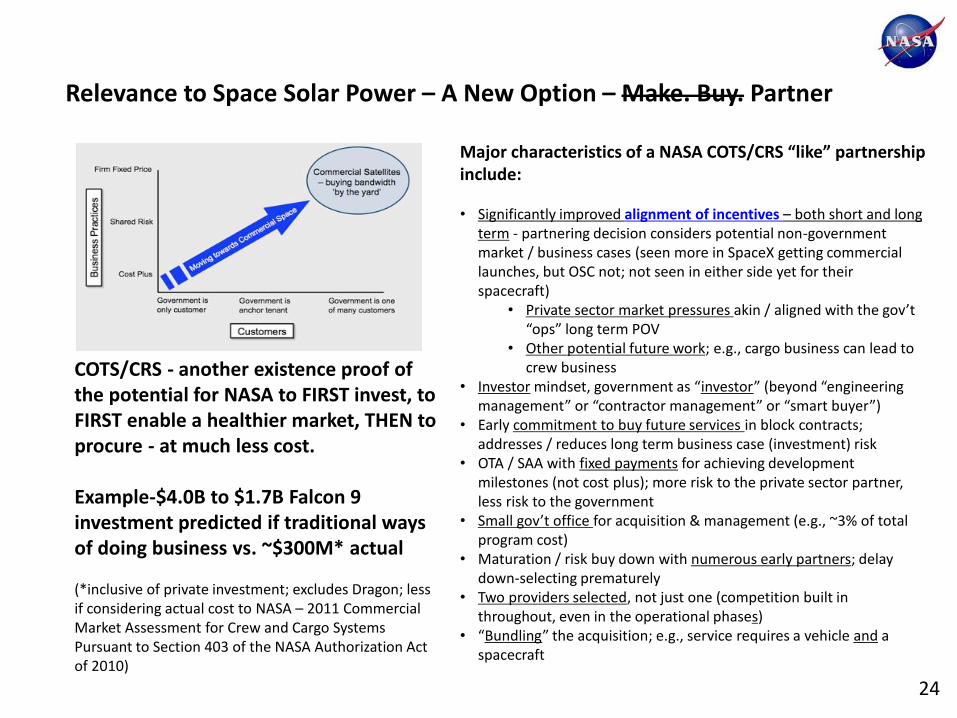
Relevance to Space Solar Power – A New Option – Make. Buy. Partner
Major characteristics of a NASA COTS/CRS “like” partnership include:
• Significantly improved alignment of incentives – both short and long term - partnering decision considers potential non-government market / business cases (seen more in SpaceX getting commercial launches, but OSC not; not seen in either side yet for their spacecraft)
• Private sector market pressures akin / aligned with the gov’t “ops” long term POV
• Other potential future work; e.g., cargo business can lead to crew business
• Investor mindset, government as “investor” (beyond “engineering management” or “contractor management” or “smart buyer”)
• Early commitment to buy future services in block contracts; addresses / reduces long term business case (investment) risk
• OTA / SAA with fixed payments for achieving development milestones (not cost plus); more risk to the private sector partner, less risk to the government
• Small gov’t office for acquisition & management (e.g., ~3% of total program cost)
• Maturation / risk buy down with numerous early partners; delay down-selecting prematurely
• Two providers selected, not just one (competition built in throughout, even in the operational phases)
• “Bundling” the acquisition; e.g., service requires a vehicle and a spacecraft
COTS/CRS - another existence proof of the potential for NASA to FIRST invest, to FIRST enable a healthier market, THEN to procure - at much less cost.
Example-$4.0B to $1.7B Falcon 9 investment predicted if traditional ways of doing business vs. ~$300M* actual
(*inclusive of private investment; excludes Dragon; less if considering actual cost to NASA – 2011 Commercial Market Assessment for Crew and Cargo Systems Pursuant to Section 403 of the NASA Authorization Act of 2010)

25
Relevance to Space Solar Power
• NASA as Investor / Partner• Smaller amounts of $ to justify• NASA (and partner contributions) $ leveraged into large effects
• Business case maturation• Strategic technology maturation / demonstration
• Modularity• Assembly• Transmission
• Encourage non-government investors• “NASA on board” (credibility of NASA)• “Virtuous cycle” – more investors ease the case for more
NASA partnering (credibility of the business)
“As was mentioned previously, a number of technology and systems level demonstrations can be accomplished without new space transportation”
-The Case for Space Solar Power, J. Mankins

26
Closing
• Space sector supply AND demand can, will and must grow together• Large scale programs – like Space Solar Power – face similar challenges
MoneyTimeAdapt
Transform
• An increased emphasis on public-private partnerships offers the most viable path forward
…when you have eliminated the impossible, whatever remains, however improbable, must be the truth? -Sherlock Holmes in The Sign of the Four
You can always count on Americans to do the right thing - after they've tried everything else. –Winston Churchill

27
Backup

28
Comparison of NASA Space Exploration Architecture Level Assessments
Study NASA Human Spaceflight Budget? (and/or inflation)
CAS, Science, Aeronautics $?STMD $?HEO SFS, M/GOps, & R&D $?
Mars Exploration Possible?
SLS,Orion?
ISS? Budget Profile incl. NASA support for Private Space Stations post-ISS?
Budget for 70t SLS to 110t? To 130t?
2014 NRC Committee on Human Spaceflight
..increases fasterthan *inflation(pp.41)
†Unaddressed
Unaddressed / **Frozen/Flat?
Yes – Phobosearly 2040s, Mars surface 2050s
Yes Ends2028
~No? Unaddressed
2015 JPL H2MMinimal Architecture
…increases at rate of *inflation
†Unaddressed
Unaddressed / **Frozen/Flat?
Yes – surface by 2039
Yes Ends2028
~No? Unaddressed
2015 Planetary Society Humans Orbiting Mars
Evolvable Lunar Architecture w. PPP
…increase athistorical budget growth…
All NASA areas increase at same rate as HEO
Lunar 1st, Mars asfollow-up study
**No n/a-> Possible - Budget set aside –ample fund split possible
n/a
Evolvable Mars Campaign
* aerospace, space systems specific inflation per se ill-defined** moves funds from X to Y† if flat, this shifts the whole NASA portfolio split
Segues off of JPL H2M Minimal Architecture
TBD
What about the 1991 Space Exploration Initiative (SEI)? Budget growth by multiples of then current. Rest ~ n/a.