Embed Size (px)
Citation preview
2018 ECONOMIC FORECASTJANUARY 17, 2018 Keynote Speaker • Jeremy J. Siegel Russell E. Palmer Professor of Finance, The Wharton School at The University of Pennsylvania. Author of Stocks for the Long Run and The Future for Investors:Why the Tried and the True Triumphs over the Bold and the New. , See page 39 for more information.
Your Best Guide to Sacramento’s EconomyLabor Market & Regional Economy » SBR/SAFE Credit Union Consumer Sentiment Survey » Small Business » Real Estate » Banking & Capital Markets » Human Capital Index
201 Mid-Year Update
Vo l u m e 9 I s s u e 2 ❱❱ s a c b u s i n e s s rev i ew. co m
Mid-Year
Emerging Trends in Sacramento’s Economy
UPDATE

MISSIONTo educate consumers on the economic and
financial health of the Sacramento region.
LABOR MARKET & REGIONAL ECONOMY
SBR/SAFE CREDIT UNION CONSUMER SENTIMENT SURVEY
SMALL BUSINESS
REAL ESTATE
BANKING & CAPITAL MARKETS
HUMAN CAPITAL INDEX
Follow us on twittertwitter.com/SacReview
@SacReview
CONTACTSanjay Varshney, PhD, CFA, Chief Economist,
Sacramento Business Review
(916) 799-6527
EDITORSJason Bell, CFA
Sanjay Varshney, PhD, CFA
GRAPHIC DESIGNCarrie Dennis Design
PHOTOGRAPHY
Tim Kesselring Photography
PROOFREADINGJMT Communications Management
Message from the Chief Economist
sacbusinessreview.comBUSINESS REVIEWsacramento
This information is for educational purposes only and should not be used or construed as financial advice, an offer to sell, a solicitation of an offer to buy, or a recommendation for any security or strategy mentioned. The views expressed are solely the personal opinions of the authors and do not necessarily reflect the views of California State University, Sacramento; Cushman & Wakefield; Planned Solutions; Rabobank, N.A.; or Wells Fargo. The authors do not guarantee that the information supplied is complete or timely, undertake to advise you of any change in its opinion, or make any guarantees of future results obtained from its use. The authors’ employers and affiliates may issue reports or have opinions that are inconsistent with, and reach different conclusions from, this report. Past performance does not indicate future results. Copyright 2017 Sacramento Business Review.
Mid-Year
Dear Friends,
I am pleased to share the 18th edition of the Sacramento Business Review – the most comprehensive, precise, and intellectually sophisticated analysis of the regional economy. For nine years, our team has provided thoughtful predictions that have accurately forecast the economic and business climate. With 17 of Sacramento’s very best financial analysts and researchers combining their skills and talent, the Sacramento Business Review (SBR) is now the most credible source of independent thinking, insights, and research on our economy in the region.
In sharp contrast to the global and national economic landscape that continues to improve and pick up steam, the local economy seems to show the first signs of slowing. The labor market in Sacramento has slowed down with goods-producing employment declining, and the construction sector losing jobs for the first time in seven years! Regional credit growth, while still strong, raises concerns about the future with Placer County experiencing its second consecutive yearly decline. We also expect loan growth among banks and credit unions to slow down relative to last year due to tightening credit conditions impacting local commercial real estate, and due to deteriorations in the auto loan segment.
Sacramento faces the fourth fastest aging workforce in the country, causing concern among area employers. Business optimism appears to be fading, regional business sentiment has declined in the first half in contrast to the national sentiment that rose sharply, and regional consumers appear less optimistic about their financial outlook and regional economic conditions when compared to national statistics. These all combined, appear to show the first signs of an economic slowdown, even though nationally and globally we see quite the opposite. To sound like a broken record — the region desperately needs to do something about developing or attracting higher paid jobs and diversifying the job mix.
I am both pleased and grateful for your overwhelmingly positive response to the publication, as you have embraced it and used it as your regional guide. Last year, we made countless presentations of our work to the community, and I received hundreds of emails and phone calls complimenting the work. I want you to know that our analysts do this work entirely as a public service to the region.
We are committed to delivering the very best economic and financial research to the region. I invite your feedback. Please do not hesitate to let me know how we may improve future issues or if you wish to be a supporting sponsor. To download your free copy, please visit sacbusinessreview.com.
Warm regards,
Sanjay Varshney, PhD, CFA Chief Economist, SBR ❱❱ (916) 799-6527 ❱❱ [email protected] ❱❱
sacbusinessreview.com
s a c b u s i n e s s rev i ew. co m 3
Sponsors .................................................. 4
Special Thanks ....................................... 5
About the Authors ................................ 6
Labor Market & Regional Economy ....10❱❱ Sacramento employment has continued to increase, but at a
slower pace than recent years.❱❱ Service sector employment remains strong while goods-
producing employment declined.❱❱ Health care employment growth continues to lead the region
while construction employment declined for the first time in seven years.
SBR/SAFE Credit Union Consumer Sentiment Survey..............14❱❱ Consumer sentiment in the region remains positive overall.❱❱ The vast majority of respondents (almost 90%) believe their
incomes will rise or stay the same over the next year. However, many respondents believe their incomes may not keep pace with inflation over this period.
❱❱ Expectations for business conditions in the region over the next year remain generally positive, but some of this optimism has tapered off since our last survey.
❱❱ Compared to national data, regional respondents are less optimistic about their financial outlook and the region’s economic conditions.
❱❱ Sentiment about business conditions in the national sample rose sharply during the first part of 2017, while regional sentiment has decreased over the same period.
Small Business Economy ..................... 18❱❱ Regional credit growth remains strong but the latest reading
raises questions about future growth rates. Sacramento County’s credit growth remains positive, while Placer County notched its second year of decline.
❱❱ The mid-year SBCI reading shows high degrees of confidence about the economic outlook, credit accessibility and future revenue opportunities. Local small businesses indicated they are very likely to hire, particularly in the manufacturing and services sectors.
❱❱ Business listing and sales activity continued its modestly positive trend as subject companies are increasingly ones of higher quality and size.
Real Estate ............................................ 22❱❱ Commercial real estate remained strong in all sectors at midyear. As
of Q2-2017: • Office vacancy down to 10.0%• Industrial vacancy in single digit territory, at 6.2%• Retail/shopping center vacancy down 110 BPS YoY, to 9.4%• Strong job growth and relatively few deliveries on the horizon,
so expect to see vacancy rates continue to fall while rents steadily rise across all commercial categories.
❱❱ Sacramento office skyline (top 17 Class A buildings) has seen asking rents at the highest quality properties reach $3.50 psf/mo (Full Service Gross).
❱❱ With limited supply of both existing and new SFR housing, Sacramento’s average home values have increased dramatically over the last five years. Despite the higher sale prices, the average home is still only on the market for approximately nine days.
Banking & Capital Markets ................ 26❱❱ Overall, loan growth for area banks and credit unions should
continue to slow relative to 2016 with tightened credit standards impacting the commercial real estate and auto loan categories in particular.
❱❱ A flattening yield curve resulting from two quarter-point Fed fund hikes year-to-date and geopolitical uncertainty causing investors to park cash in safer, longer term Treasuries has already started to impact the bottom lines of area financial institutions.
❱❱ Aided by the massive central bank stimulus programs that have only just begun to be scaled back, stock valuations continue to climb higher. The cyclically adjusted price-to-earnings ratio (aka the Schiller P/E) is approaching a level not seen since just before the Great Depression and the tech bubble of the early 2000s.
❱❱ The overall trajectory of the SBR Financial Conditions Index has continued upward, although the most recent reading showed a downturn that is likely related to seasonal factors.
Human Capital Index .......................... 32❱❱ Even though California is doing better than most of its peers,
a 14-cent gap in wages between full-time employed men and women still exists.
❱❱ Jobs in the software field have increased greatly although the overall number of jobs is small locally.
❱❱ Local player increasing Intel spending on AI jobs, but still a fraction compared to other global players.
❱❱ Sacramento has fourth fastest aging workforce in the nation, causing concerns for employers.
2018 Economic Forecast ...................... 39
Contents
sacramento BUSINESS REVIEW ❱❱ Emerging Trends in Sacramento’s Economy4
Publication Sponsors
Sponsors
s a c b u s i n e s s rev i ew. co m 5
AuthorsSpecial Thanks
Chase Armer, CFA, Co-owner, Planned Solutions, Inc.
Seung Bach, PhD, Professor, Sacramento State, College of Business Administration
Jessica Bagger, PhD, Professor, Sacramento State, College of Business Administration
Jason Bell, CFA, Senior Vice President and Senior Investment Strategist, Wells Fargo Private Bank
Jesse Catlin, PhD, Assistant Professor, Sacramento State, College of Business Administration
Matt Cologna, Senior Director, Cushman & Wakefield
Nick Hladek, Capital Planning Analyst, Golden 1 Credit Union
Nuriddin Ikromov, PhD, Associate Professor, Sacramento State, College of Business Administration
Brian M. Leu, CFA, CAIA, Head of Trading, Execution Services and Strategy (ESS) Group, CalPERS
Hao Lin, PhD, CFA, Associate Professor, Sacramento State, College of Business Administration
Lan Liu, PhD, CFA, Associate Professor, Sacramento State, College of Business Administration
Elizabeth Lyon, JD, LLM, Assistant Professor, Sacramento State, College of Business Administration
Joe Niehaus, CFA, Investment Manager, Golden 1 Credit Union
Terry Petlowany, MBA, Manager, Intel Corporation
Yang Sun, PhD, Associate Professor, Sacramento State, College of Business Administration
Sanjay Varshney, PhD, CFA, Professor, Sacramento State, College of Business Administration, and
Senior Vice President/Investment Strategy Specialist for California and Nevada at Wells Fargo Private Bank –
Wealth Management Group
Anna V. Vygodina, PhD, Associate Professor, Sacramento State, College of Business Administration
Authors
Melissa Sheldon Jasmine Graham
Sacramento State, College of Business Administration, Office of the Dean Staff
sacramento BUSINESS REVIEW ❱❱ Emerging Trends in Sacramento’s Economy6
Authors
Chase Armer, CFAChase Armer is a co-owner of Planned Solutions, Inc., a Sacramento-based financial planning and
investment advisory firm, where he currently acts as a financial planner and is a member of the Planned
Solutions Investment Management Committee. Chase holds several professional designations including
Certified Financial Planner Practitioner, Chartered Financial Analyst, and Enrolled Agent. Chase has
a degree in economics from California State University, Sacramento, a master’s in taxation from
William Howard Taft University, and a certificate in personal financial planning from UC Davis Extension.
Chase is a past president of the Financial Planning Association of Northern California and taught the
Investments classes in the UC Davis Extension Personal Financial Planning Certificate Program.
Seung Bach, PhDSeung Bach is Professor of Entrepreneurship and Strategic Management in the College of
Business Administration, and he currently serves as the faculty director of the Center for
Entrepreneurship at California State University, Sacramento. He earned his PhD in business
administration at the University of Tennessee, Knoxville, and his MBA at the George Washington
University, Washington, D.C. His expertise is in the areas of new venture creation, small business
management, entrepreneurial transitions, innovation and corporate entrepreneurship, and global
management and strategy.
Jessica Bagger, PhDJessica Bagger is a Management Professor at California State University, Sacramento, and Associated
Faculty at the University of Gothenburg in Sweden. She received her PhD in management at the
University of Arizona. Jessica’s scientific research relates to factors impacting employee well-being
and performance, including HR systems, leadership, and organizational culture.
Jason Bell, CFAJason Bell is a Senior Vice President and Senior Investment Strategist for Wells Fargo Private Bank,
where he manages funds for a select group of clients. He is a member of Wells Fargo’s Global
Strategies team and previously led the bank’s Domestic Equity Sector Strategy team. During the
past several years, Jason has served as a senior volunteer leader and advisor to the Board at CFA
Institute. He holds the Chartered Financial Analyst designation and a business degree from the
University of the Pacific, as well as an MBA from the University of California, Davis.
Jesse Catlin, PhDJesse Catlin is an Assistant Professor of Marketing at California State University, Sacramento.
He holds a PhD in Management with an emphasis in Marketing from the University of California,
Irvine, and holds master’s and bachelor’s degrees in economics from California State University,
Sacramento. His research interests include consumer behavior and decision-making. Prior to his
academic career, he worked as a consultant on projects related to market research and
economic development.
s a c b u s i n e s s rev i ew. co m 7
AuthorsAuthors
Matt Cologna Matt Cologna graduated with a degree in business from California State University, Sacramento,
and has been active in commercial real estate for the past 20 years in Sacramento. His experience
includes owner/user and investment sales, logistics, landlord and tenant representation, land
assemblage, build to suits, and developer relations. He has represented clients on a local, regional,
and national basis. He is involved with the Cushman & Wakefield Global Supply Chain Solutions
Group offering additional insight into current and future needs of occupiers in the market. Matt
has completed over 12 million square feet of deals with a value exceeding $411 million.
Nick Hladek Nick Hladek works as a Capital Planning Analyst at Golden 1 Credit Union where he assists in the
development and implementation of quantitative models used in the institution’s annual capital
plan. Prior to his time at Golden 1 Credit Union, Nick worked as a Senior Research Analyst at the
Greater Sacramento Economic Council. Nick holds both a bachelor’s degree and master’s degree
in economics from California State University, Sacramento.
Nuriddin Ikromov, PhDNuriddin Ikromov is an Associate Professor in the College of Business Administration at California
State University, Sacramento. He received his PhD in real estate finance from the Pennsylvania
State University. Nuriddin’s research interests include real estate market efficiency, experimental
economics, and valuation.
Brian M. Leu, CFA, CAIABrian Leu is the Head of Trading in the Execution Services and Strategy group at CalPERS,overseeing the trading activities of the internally managed equity and derivatives portfolio.Prior to joining CalPERS, he worked at DCA Capital Partners supporting the firm’s private equityinvestments and investment banking business. Previously, Brian worked in the Equities division atDeutsche Bank Securities and at a long-short equity hedge fund in New York City. Brian earned his MBA from the New York University Stern School of Business and an economics degree from Duke University and also holds the Chartered Financial Analyst and the Chartered Alternative Investment Analyst designations. He is also a past president of the CFA Society Sacramento.
Hao Lin, PhD, CFAHao Lin is an Associate Professor of Finance in the College of Business Administration at California
State University, Sacramento. He has a PhD in finance and MS in financial mathematics, both from
the University of Warwick in England. His expertise is in the areas of financial markets and market
microstructure. Hao holds the Chartered Financial Analyst designation.
sacramento BUSINESS REVIEW ❱❱ Emerging Trends in Sacramento’s Economy8
Lan Liu, PhD, CFALan Liu is an Associate Professor of Finance in the College of Business Administration at California
State University, Sacramento. She received both her PhD in finance and MSc in economics
and finance from the University of Warwick in England. Her research focuses on portfolio risk
management, forecasting, and performance measurement. Lan holds the Chartered Financial
Analyst designation and serves on the Board of Directors of the CFA Society Sacramento.
Elizabeth Lyon, JD, LLMElizabeth Lyon is an Assistant Professor of Accountancy at California State University, Sacramento.
She holds a JD from the University of California, Hastings College of the Law, an LLM from the
University of San Francisco, and an undergraduate degree from the University of California, Davis.
Her research interests include issues related to income tax, employment tax, and consumer
perceptions of taxation. Prior to joining Sacramento State, she was General Counsel for a global
consumer technology corporation.
Joe Niehaus, CFAJoe Niehaus is the Investment Manager for Golden 1 Credit Union where he identifies strategic
investment opportunities for the institution’s internal fixed income portfolio in addition to carrying
out day-to-day management of the liquidity and interest rate risk functions. Joe has worked as
a bank examiner, and he also served five years as an Electronic Intelligence Analyst with the U.S.
Navy. Joe holds a BS in business administration from California State University, Sacramento, and
an MBA from the University of Nebraska, Lincoln. He also holds the Chartered Financial Analyst
designation and serves as the Vice President for the CFA Society Sacramento.
Terry Petlowany, MBATerry Petlowany is a manager at Intel Corporation, where her team develops
and deploys organizational initiatives around diversity and inclusion as
well as leader development. She is a certified instructor in
microinequities, breaking bias and emotional intelligence. Terry earned her
bachelor's degree in business administration with a focus in organizational
behavior and her MBA at California State University, Sacramento.
Yang Sun, PhDYang Sun is an Associate Professor of Supply Chain Management and Quantitative Methods in the
College of Business Administration at California State University, Sacramento. In addition to his
PhD in industrial engineering from Arizona State University, he has a Six-Sigma Black Belt. He also
received an engineering degree from Tsinghua University in Beijing, China. He has research and
teaching interests in the areas of global supply chain management, operations strategy, Lean and Six
Sigma, managerial economics, operations research, and big data, and is a recipient of the university’s
Outstanding Scholarly and Creative Activities Award as well as Outstanding Teaching Award.
Authors
s a c b u s i n e s s rev i ew. co m 9
AuthorsAuthors
Sanjay Varshney, PhD, CFASanjay Varshney is Professor of Finance at California State University, Sacramento, and Senior
Vice President/Investment Strategy Specialist for California and Nevada at Wells Fargo Private Bank –
Wealth Management Group. He served as the Vice President for Economic and Regional Partnerships
and Dean of the College of Business Administration at California State University, Sacramento, for 10
years. He earned an undergraduate degree in accounting and financial management from Bombay
University, a master’s degree in economics from the University of Cincinnati, and a PhD in finance from
Louisiana State University. He also holds the Chartered Financial Analyst designation. Dr. Varshney
serves as the Chief Economist for the Sacramento Business Review.
Anna V. Vygodina, PhDAnna Vygodina is an Associate Professor of Finance in the College of Business Administration at
California State University, Sacramento. She holds a PhD degree in finance from the University of
Nebraska, Lincoln, and an MBA with economics minor from the University of Nebraska, Omaha. Anna’s
research interests are in exchange rates, speculative tensions, and heterogeneous expectations in
the capital markets.
Sponsors
sacramento BUSINESS REVIEW ❱❱ Emerging Trends in Sacramento’s Economy10
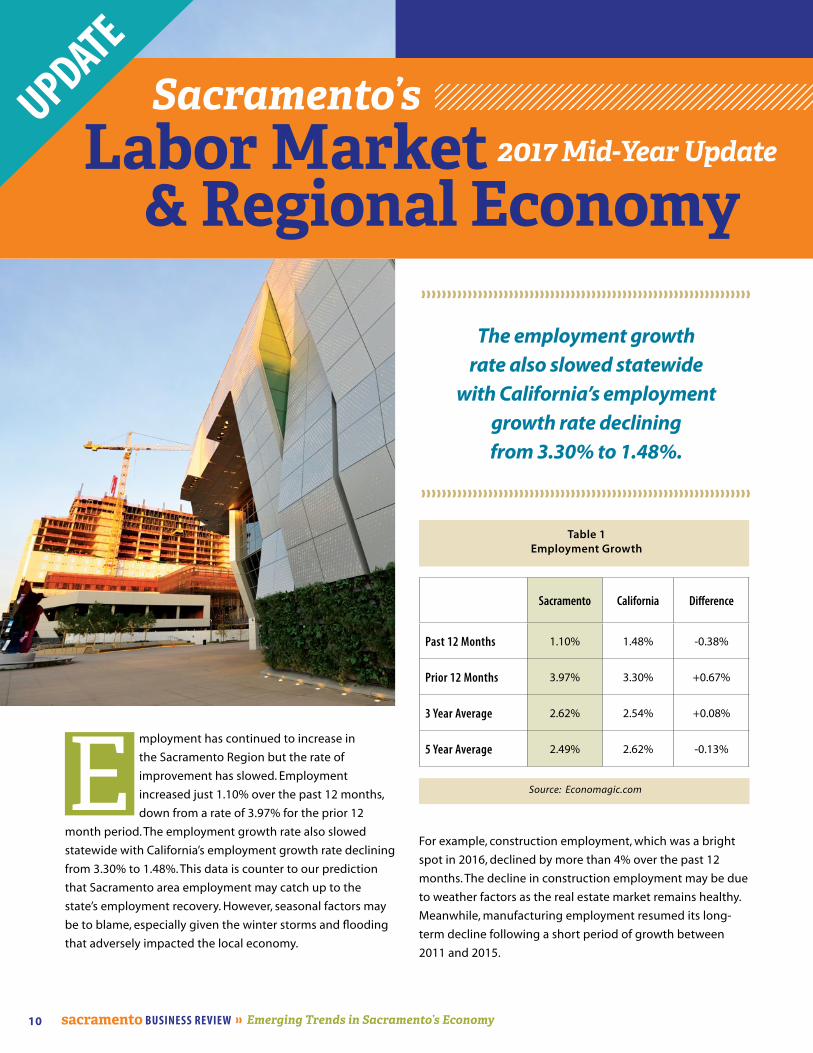
E mployment has continued to increase in
the Sacramento Region but the rate of
improvement has slowed. Employment
increased just 1.10% over the past 12 months,
down from a rate of 3.97% for the prior 12
month period. The employment growth rate also slowed
statewide with California’s employment growth rate declining
from 3.30% to 1.48%. This data is counter to our prediction
that Sacramento area employment may catch up to the
state’s employment recovery. However, seasonal factors may
be to blame, especially given the winter storms and flooding
that adversely impacted the local economy.
Labor Market & Regional Economy
Sacramento’s2017 Mid-Year Update
UPDATE
Table 1Employment Growth
Source: Economagic.com
Sacramento California Difference
Past 12 Months 1.10% 1.48% -0.38%
Prior 12 Months 3.97% 3.30% +0.67%
3 Year Average 2.62% 2.54% +0.08%
5 Year Average 2.49% 2.62% -0.13%
For example, construction employment, which was a bright
spot in 2016, declined by more than 4% over the past 12
months. The decline in construction employment may be due
to weather factors as the real estate market remains healthy.
Meanwhile, manufacturing employment resumed its long-
term decline following a short period of growth between
2011 and 2015.
The employment growth rate also slowed statewide
with California’s employment growth rate declining from 3.30% to 1.48%.
s a c b u s i n e s s rev i ew. co m 11
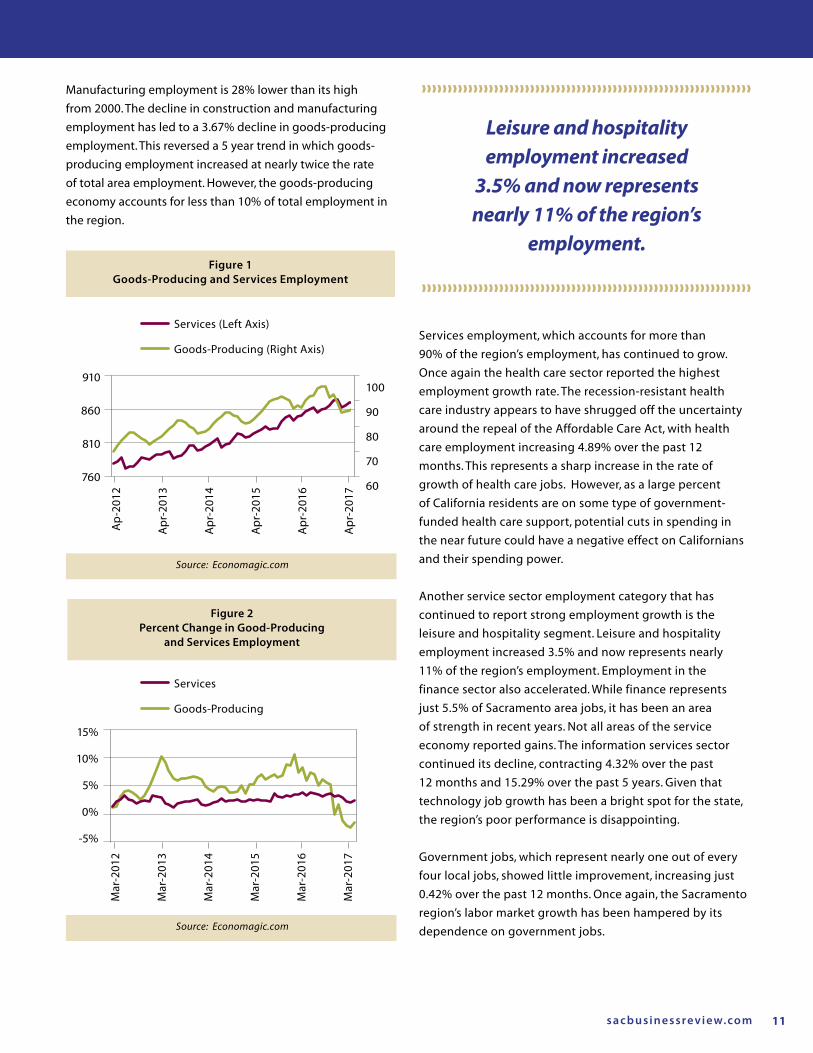
Figure 1Goods-Producing and Services Employment
Figure 2Percent Change in Good-Producing
and Services Employment
Services (Left Axis)
Goods-Producing (Right Axis)
Services
Goods-Producing
& Regional Economy2017 Mid-Year Update
Source: Economagic.com
Source: Economagic.com
Sacramento California Difference
Past 12 Months 1.10% 1.48% -0.38%
Prior 12 Months 3.97% 3.30% +0.67%
3 Year Average 2.62% 2.54% +0.08%
5 Year Average 2.49% 2.62% -0.13%
Manufacturing employment is 28% lower than its high
from 2000. The decline in construction and manufacturing
employment has led to a 3.67% decline in goods-producing
employment. This reversed a 5 year trend in which goods-
producing employment increased at nearly twice the rate
of total area employment. However, the goods-producing
economy accounts for less than 10% of total employment in
the region.
Leisure and hospitality employment increased
3.5% and now represents nearly 11% of the region’s
employment.
Services employment, which accounts for more than
90% of the region’s employment, has continued to grow.
Once again the health care sector reported the highest
employment growth rate. The recession-resistant health
care industry appears to have shrugged off the uncertainty
around the repeal of the Affordable Care Act, with health
care employment increasing 4.89% over the past 12
months. This represents a sharp increase in the rate of
growth of health care jobs. However, as a large percent
of California residents are on some type of government-
funded health care support, potential cuts in spending in
the near future could have a negative effect on Californians
and their spending power.
Another service sector employment category that has
continued to report strong employment growth is the
leisure and hospitality segment. Leisure and hospitality
employment increased 3.5% and now represents nearly
11% of the region’s employment. Employment in the
finance sector also accelerated. While finance represents
just 5.5% of Sacramento area jobs, it has been an area
of strength in recent years. Not all areas of the service
economy reported gains. The information services sector
continued its decline, contracting 4.32% over the past
12 months and 15.29% over the past 5 years. Given that
technology job growth has been a bright spot for the state,
the region’s poor performance is disappointing.
Government jobs, which represent nearly one out of every
four local jobs, showed little improvement, increasing just
0.42% over the past 12 months. Once again, the Sacramento
region’s labor market growth has been hampered by its
dependence on government jobs.
15%
10%
5%
0%
-5%
910
860
810
760
100
90
80
70
60
Ap-
2012
Apr
-201
3
Apr
-201
4
Apr
-201
5
Apr
-201
6
Apr
-201
7
Mar
-201
2
Mar
-201
3
Mar
-201
4
Mar
-201
5
Mar
-201
6
Mar
-201
7
sacramento BUSINESS REVIEW ❱❱ Emerging Trends in Sacramento’s Economy12
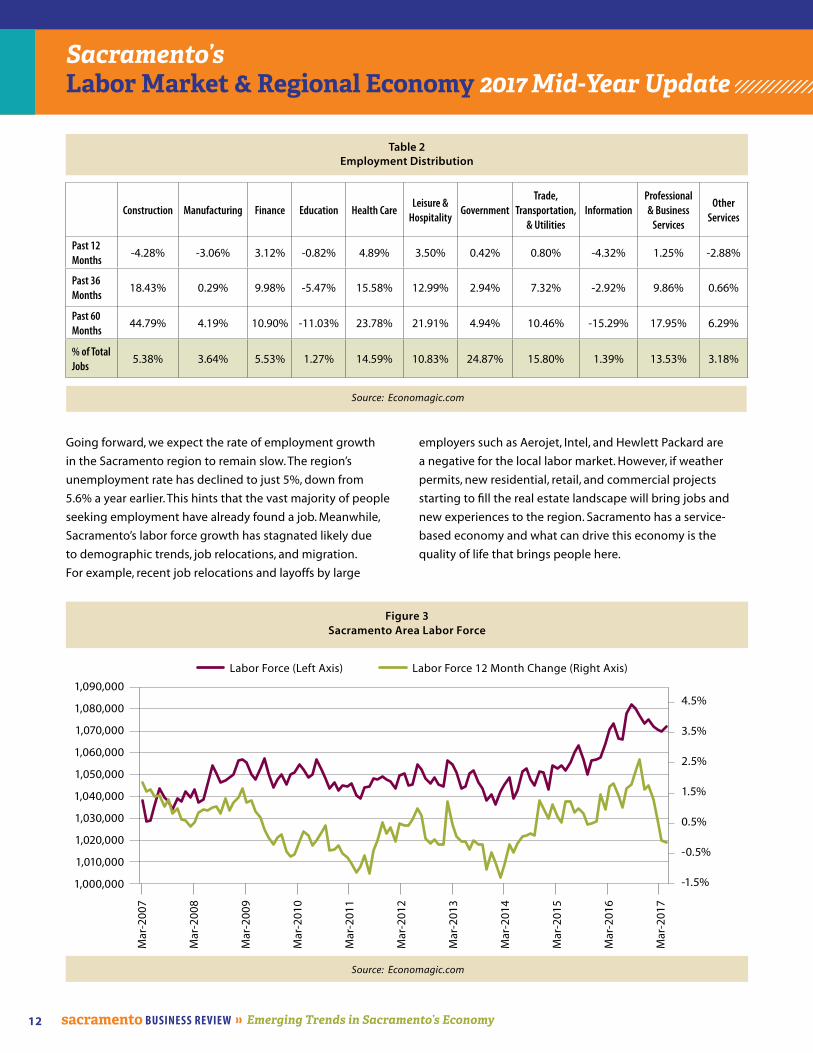
Going forward, we expect the rate of employment growth
in the Sacramento region to remain slow. The region’s
unemployment rate has declined to just 5%, down from
5.6% a year earlier. This hints that the vast majority of people
seeking employment have already found a job. Meanwhile,
Sacramento’s labor force growth has stagnated likely due
to demographic trends, job relocations, and migration.
For example, recent job relocations and layoffs by large
Figure 3Sacramento Area Labor Force
Sacramento’s Labor Market & Regional Economy 2017 Mid-Year Update
employers such as Aerojet, Intel, and Hewlett Packard are
a negative for the local labor market. However, if weather
permits, new residential, retail, and commercial projects
starting to fill the real estate landscape will bring jobs and
new experiences to the region. Sacramento has a service-
based economy and what can drive this economy is the
quality of life that brings people here.
Source: Economagic.com
Source: Economagic.com
Table 2Employment Distribution
Construction Manufacturing Finance Education Health CareLeisure &
HospitalityGovernment
Trade, Transportation,
& UtilitiesInformation
Professional & Business
Services
Other Services
Past 12 Months
-4.28% -3.06% 3.12% -0.82% 4.89% 3.50% 0.42% 0.80% -4.32% 1.25% -2.88%
Past 36 Months
18.43% 0.29% 9.98% -5.47% 15.58% 12.99% 2.94% 7.32% -2.92% 9.86% 0.66%
Past 60 Months
44.79% 4.19% 10.90% -11.03% 23.78% 21.91% 4.94% 10.46% -15.29% 17.95% 6.29%
% of Total Jobs
5.38% 3.64% 5.53% 1.27% 14.59% 10.83% 24.87% 15.80% 1.39% 13.53% 3.18%
Labor Force (Left Axis) Labor Force 12 Month Change (Right Axis)
1,090,000
1,080,000
1,070,000
1,060,000
1,050,000
1,040,000
1,030,000
1,020,000
1,010,000
1,000,000
4.5%
3.5%
2.5%
1.5%
0.5%
-0.5%
-1.5%
Mar
-200
7
Mar
-200
8
Mar
-200
9
Mar
-201
0
Mar
-201
1
Mar
-201
2
Mar
-201
3
Mar
-201
4
Mar
-201
5
Mar
-201
6
Mar
-201
7
Construction Manufacturing Finance Education Health CareLeisure &
HospitalityGovernment
Trade, Transportation,
& UtilitiesInformation
Professional & Business
Services
Other Services
Past 12 Months
-4.28% -3.06% 3.12% -0.82% 4.89% 3.50% 0.42% 0.80% -4.32% 1.25% -2.88%
Past 36 Months
18.43% 0.29% 9.98% -5.47% 15.58% 12.99% 2.94% 7.32% -2.92% 9.86% 0.66%
Past 60 Months
44.79% 4.19% 10.90% -11.03% 23.78% 21.91% 4.94% 10.46% -15.29% 17.95% 6.29%
% of Total Jobs
5.38% 3.64% 5.53% 1.27% 14.59% 10.83% 24.87% 15.80% 1.39% 13.53% 3.18%
For more information on sponsorship opportunities contact:
Sanjay Varshney – Chief Economist, SBR Email: [email protected]
Phone: (916) 799-6527
sacbusinessreview.com
Become a publication sponsoron the next economic forecast report.
Emerging Trends in Sacramento’s Economy
sacramento BUSINESS REVIEW ❱❱ Emerging Trends in Sacramento’s Economy14
SBR/SAFE Credit Union Consumer Sentiment Survey
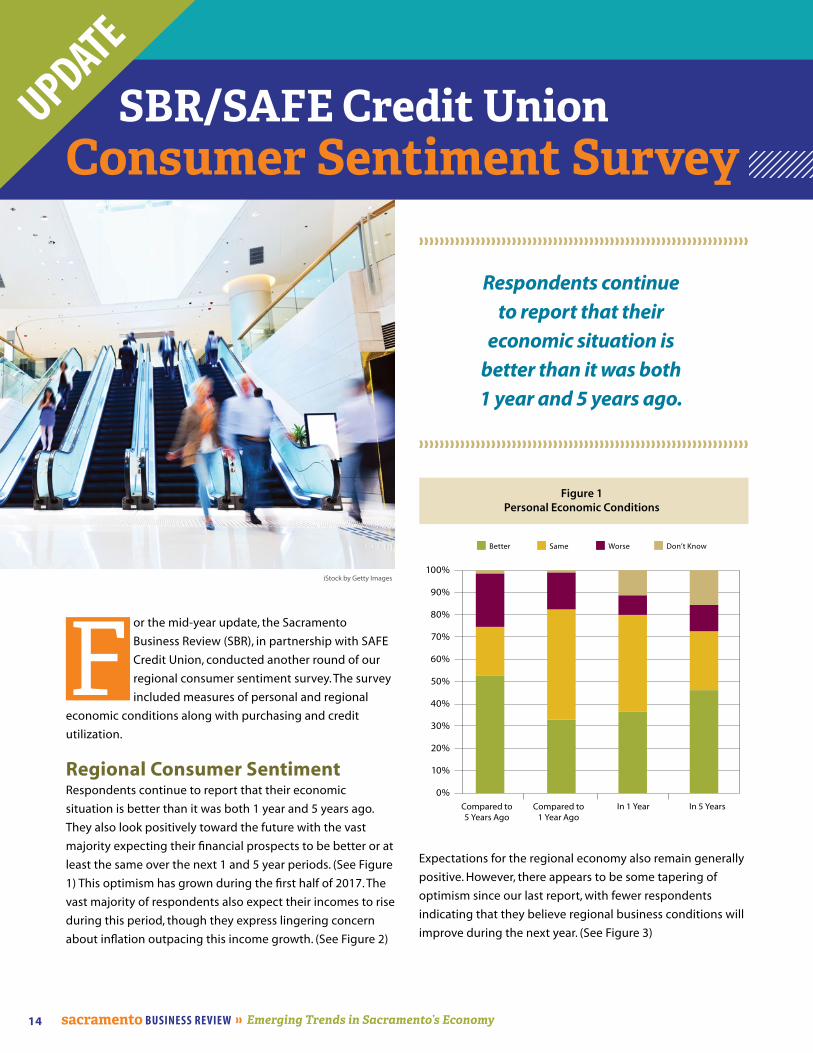
F or the mid-year update, the Sacramento
Business Review (SBR), in partnership with SAFE
Credit Union, conducted another round of our
regional consumer sentiment survey. The survey
included measures of personal and regional
economic conditions along with purchasing and credit
utilization.
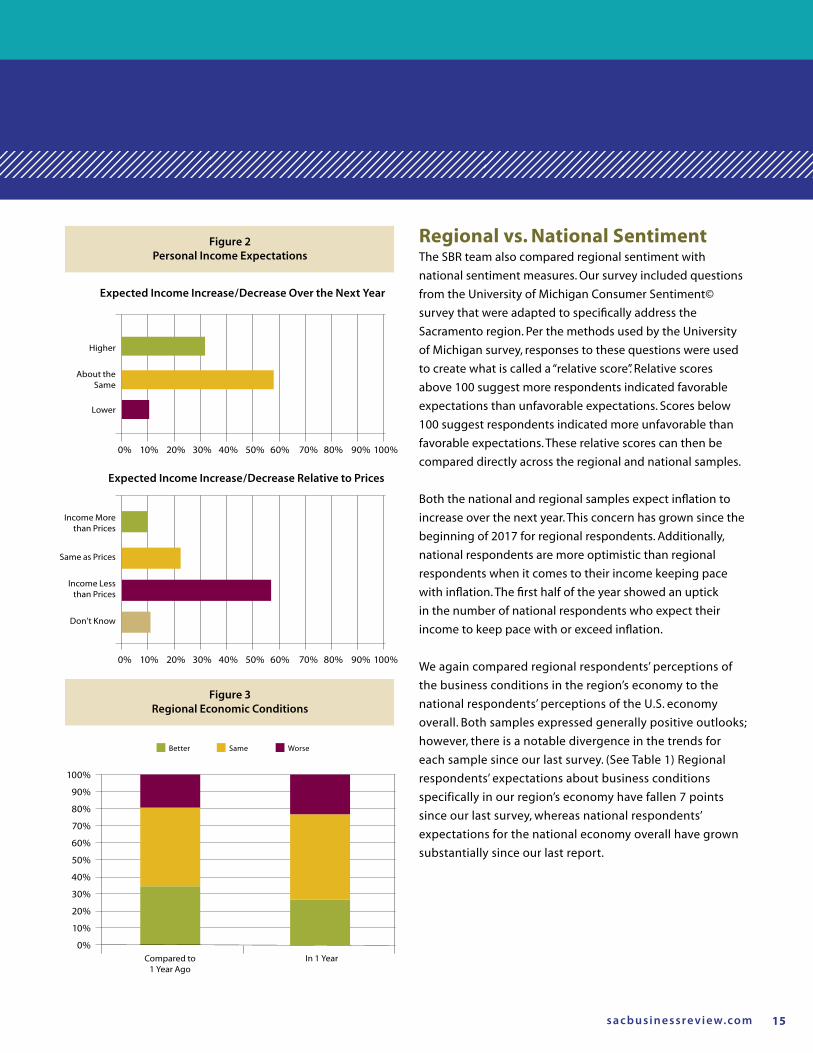
Regional Consumer SentimentRespondents continue to report that their economic
situation is better than it was both 1 year and 5 years ago.
They also look positively toward the future with the vast
majority expecting their financial prospects to be better or at
least the same over the next 1 and 5 year periods. (See Figure
1) This optimism has grown during the first half of 2017. The
vast majority of respondents also expect their incomes to rise
during this period, though they express lingering concern
about inflation outpacing this income growth. (See Figure 2)
Figure 1Personal Economic Conditions
Better WorseSame Don’t Know
100%
90%
80%
70%
60%
50%
40%
30%
20%
10%
0%Compared to 5 Years Ago
Compared to 1 Year Ago
In 1 Year In 5 Years
iStock by Getty Images
UPDATE
Expectations for the regional economy also remain generally
positive. However, there appears to be some tapering of
optimism since our last report, with fewer respondents
indicating that they believe regional business conditions will
improve during the next year. (See Figure 3)
Respondents continue to report that their
economic situation is better than it was both 1 year and 5 years ago.
s a c b u s i n e s s rev i ew. co m 15
SBR/SAFE Credit Union Consumer Sentiment Survey
Figure 2Personal Income Expectations
Higher
Income More than Prices
Income Less than Prices
Don’t Know
Same as Prices
About the Same
Lower
Figure 3Regional Economic Conditions
Better WorseSame
100%
90%
80%
70%
60%
50%
40%
30%
20%
10%
0%Compared to
1 Year AgoIn 1 Year
100%90%80%70%60%50%40%30%20%10%0%
100%90%80%70%60%50%40%30%20%10%0%
Expected Income Increase/Decrease Over the Next Year
Expected Income Increase/Decrease Relative to Prices
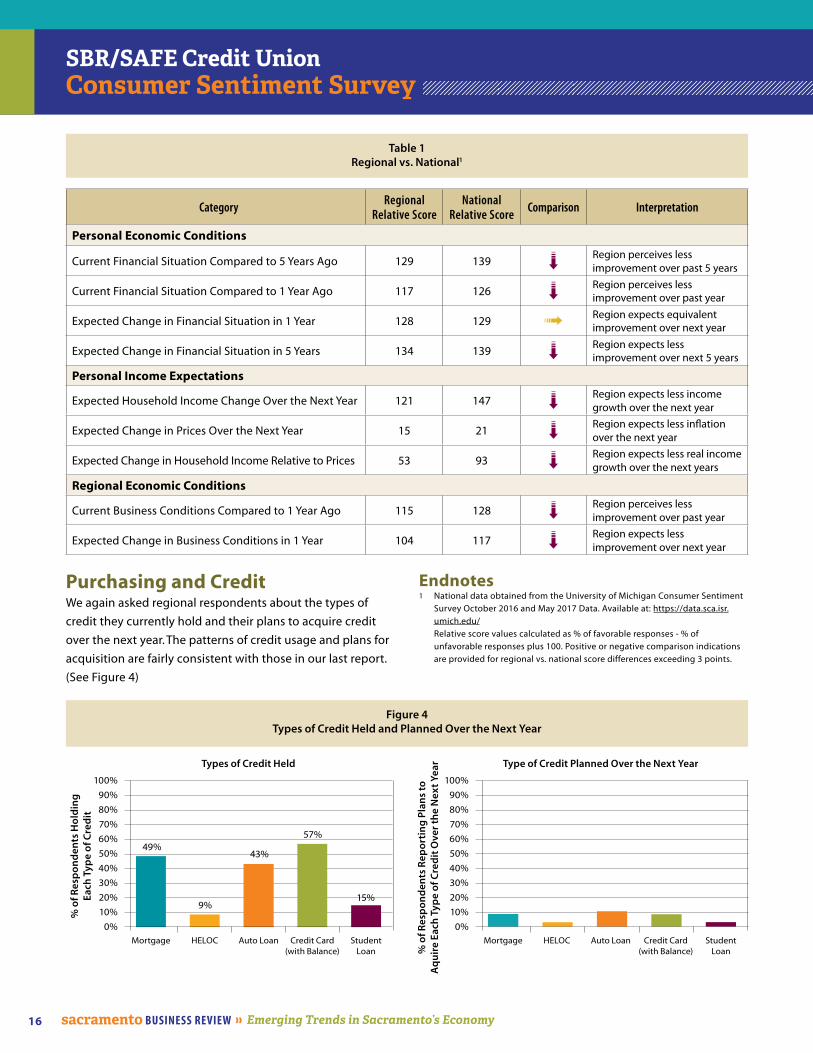
Regional vs. National SentimentThe SBR team also compared regional sentiment with
national sentiment measures. Our survey included questions
from the University of Michigan Consumer Sentiment©
survey that were adapted to specifically address the
Sacramento region. Per the methods used by the University
of Michigan survey, responses to these questions were used
to create what is called a “relative score”. Relative scores
above 100 suggest more respondents indicated favorable
expectations than unfavorable expectations. Scores below
100 suggest respondents indicated more unfavorable than
favorable expectations. These relative scores can then be
compared directly across the regional and national samples.
Both the national and regional samples expect inflation to
increase over the next year. This concern has grown since the
beginning of 2017 for regional respondents. Additionally,
national respondents are more optimistic than regional
respondents when it comes to their income keeping pace
with inflation. The first half of the year showed an uptick
in the number of national respondents who expect their
income to keep pace with or exceed inflation.
We again compared regional respondents’ perceptions of
the business conditions in the region’s economy to the
national respondents’ perceptions of the U.S. economy
overall. Both samples expressed generally positive outlooks;
however, there is a notable divergence in the trends for
each sample since our last survey. (See Table 1) Regional
respondents’ expectations about business conditions
specifically in our region’s economy have fallen 7 points
since our last survey, whereas national respondents’
expectations for the national economy overall have grown
substantially since our last report.
sacramento BUSINESS REVIEW ❱❱ Emerging Trends in Sacramento’s Economy16
Purchasing and CreditWe again asked regional respondents about the types of
credit they currently hold and their plans to acquire credit
over the next year. The patterns of credit usage and plans for
acquisition are fairly consistent with those in our last report.
(See Figure 4)
SBR/SAFE Credit Union Consumer Sentiment Survey
Table 1Regional vs. National1
Category Regional Relative Score
National Relative Score Comparison Interpretation
Personal Economic Conditions
Current Financial Situation Compared to 5 Years Ago 129 139 Region perceives less improvement over past 5 years
Current Financial Situation Compared to 1 Year Ago 117 126 Region perceives less improvement over past year
Expected Change in Financial Situation in 1 Year 128 129 Region expects equivalent improvement over next year
Expected Change in Financial Situation in 5 Years 134 139 Region expects less improvement over next 5 years
Personal Income Expectations
Expected Household Income Change Over the Next Year 121 147 Region expects less income growth over the next year
Expected Change in Prices Over the Next Year 15 21 Region expects less inflation over the next year
Expected Change in Household Income Relative to Prices 53 93 Region expects less real income growth over the next years
Regional Economic Conditions
Current Business Conditions Compared to 1 Year Ago 115 128 Region perceives less improvement over past year
Expected Change in Business Conditions in 1 Year 104 117 Region expects less improvement over next year
Figure 4Types of Credit Held and Planned Over the Next Year
Endnotes1 National data obtained from the University of Michigan Consumer Sentiment
Survey October 2016 and May 2017 Data. Available at: https://data.sca.isr.umich.edu/
Relative score values calculated as % of favorable responses - % of unfavorable responses plus 100. Positive or negative comparison indications are provided for regional vs. national score differences exceeding 3 points.
100%90%80%70%60%50%40%30%20%10%
0%
100%90%80%70%60%50%40%30%20%10%
0%Mortgage Mortgage HELOC HELOCAuto Loan Auto LoanCredit Card
(with Balance)Credit Card
(with Balance)Student
LoanStudent
Loan
49%
9%
43%
57%
15%
Types of Credit Held Type of Credit Planned Over the Next Year
% o
f Res
po
nd
ents
Ho
ldin
g
Each
Typ
e o
f Cre
dit
% o
f Res
po
nd
ents
Rep
ort
ing
Pla
ns
toA
qu
ire
Each
Typ
e o
f Cre
dit
Ove
r th
e N
ext
Year
About CFA Institute With more than 96,000 members in 133 countries and territories, CFA Institute is the global association for investment professionals. It
administers the CFA curriculum and exam programs worldwide; publishes research; conducts professional development programs; and sets
voluntary, ethics-based professional and performance-reporting standards for the investment industry.
CFA Institute is a respected advocate worldwide for full and fair disclosure of financial information by public issuers to investors, ethical conduct by
investment professionals that protects the clients’ best interests, investment
performance standards, and the highest level of investment knowledge and
competence. More information may be found at www.cfainstitute.org. A Member Society of CFA Institute
Global Network • Local PresenceFounded in 1991, the CFA Society Sacramento operates as a
member society of CFA Institute. Our membership consists of
more than 180 regional investment professionals and academics
who work in both the private and public sectors in a broad range
of capacities. More information may be found at www.cfass.org.
CFA Charter is The Gold Standard First awarded in 1963, the Chartered Financial Analyst (CFA) charter
has become known as the gold standard of professional credentials
within the global investment community. Investors recognize the CFA
designation as the definitive standard for measuring competence and
integrity in the fields of portfolio management and investment analysis.
sacramento BUSINESS REVIEW ❱❱ Emerging Trends in Sacramento’s Economy18
THE Small BusinessEconomy
Data Source: U.S. Small Business Administration
Figure 1Total Dollar Amount of SBA Loans Approved in the Sacramento MSA » Overall Since 2005 (in Millions)
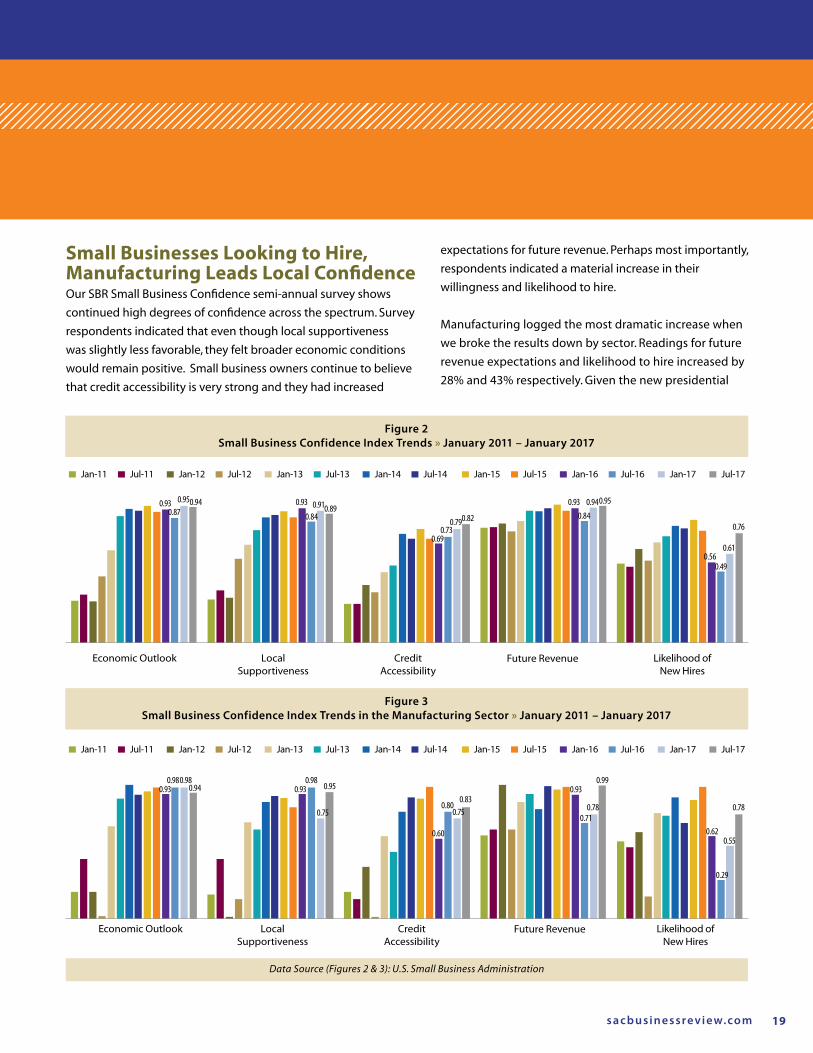
Local Credit Growth Remains Strong, but Uneven by CountyOur latest reading of regional lending shows that credit
extension remains strong, but lower absolute levels raise
questions about future growth rates. In the past six months,
the total dollar amount of approvals declined from $312M to
$285M, an 8% decrease.
This is not necessarily a cause for concern as the upward trend
appears intact and some variance in year to year point estimates
is to be expected. That said, we will be monitoring the next two
readings very closely to see if this data simply represents a soft
patch or portends more difficult conditions ahead.
Sacramento County continued to show strength into 2017,
surpassing last year’s high. This is especially encouraging as
Sacramento County makes up a 65% share of the aggregate.
Troublingly, Placer County, the second largest contributor,
registered its second decline in a row. El Dorado County held
steady while Yolo County regressed back to 2015 levels.
2010200820062005 201120092007 2012 2013 2014 2015 2016 2017(9 months)
400
350
300
250
200
150
100
50
0
UPDATE
El Dorado
Placer
Sacramento
Yolo
Total
s a c b u s i n e s s rev i ew. co m 19
Small BusinessEconomy
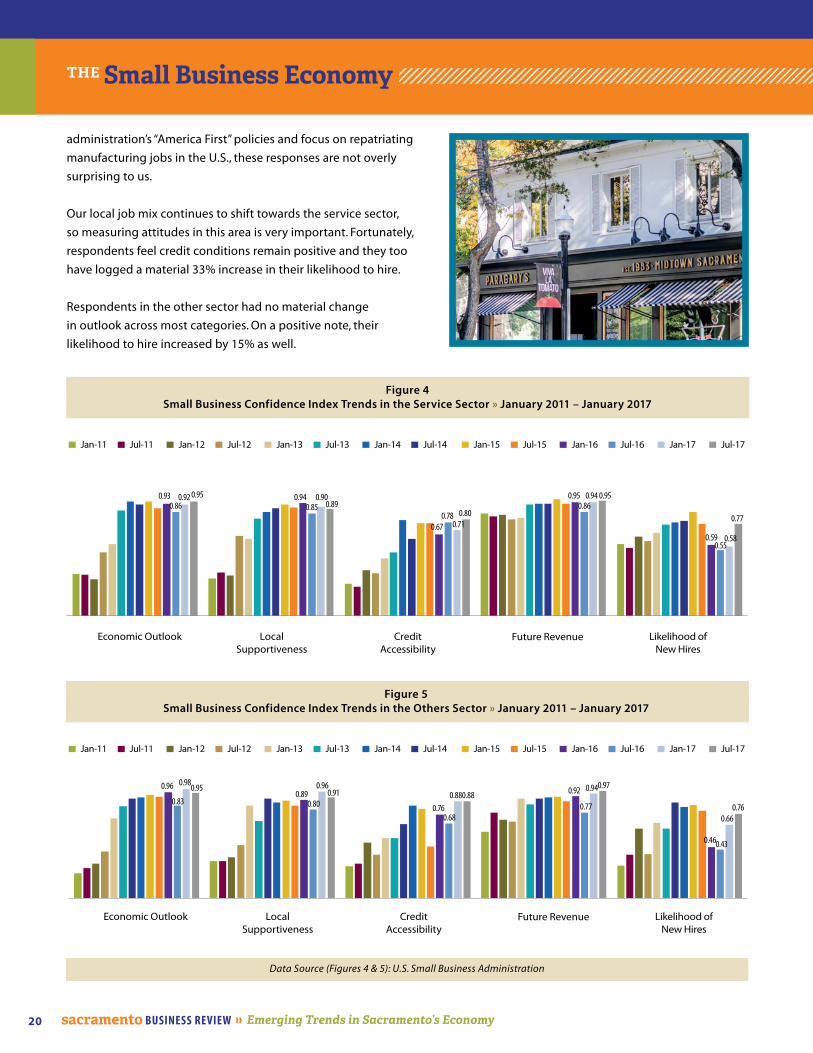
Small Businesses Looking to Hire, Manufacturing Leads Local ConfidenceOur SBR Small Business Confidence semi-annual survey shows
continued high degrees of confidence across the spectrum. Survey
respondents indicated that even though local supportiveness
was slightly less favorable, they felt broader economic conditions
would remain positive. Small business owners continue to believe
that credit accessibility is very strong and they had increased
expectations for future revenue. Perhaps most importantly,
respondents indicated a material increase in their
willingness and likelihood to hire.
Manufacturing logged the most dramatic increase when
we broke the results down by sector. Readings for future
revenue expectations and likelihood to hire increased by
28% and 43% respectively. Given the new presidential
Data Source (Figures 2 & 3): U.S. Small Business Administration
Figure 2Small Business Confidence Index Trends » January 2011 – January 2017
Figure 3Small Business Confidence Index Trends in the Manufacturing Sector » January 2011 – January 2017
Jan-11 Jan-15Jan-13 Jan-17 Jul-17Jul-11 Jul-15Jul-13Jan-12 Jan-16Jan-14Jul-12 Jul-16Jul-14
Jan-11 Jan-15Jan-13 Jan-17 Jul-17Jul-11 Jul-15Jul-13Jan-12 Jan-16Jan-14Jul-12 Jul-16Jul-14
Economic Outlook Local Supportiveness
Credit Accessibility
Future Revenue Likelihood of New Hires
El Dorado
Placer
Sacramento
Yolo
Total
Economic Outlook Local Supportiveness
Credit Accessibility
Future Revenue Likelihood of New Hires
0.93 0.930.950.94 0.910.890.790.82
0.940.95
0.61
0.76
0.87 0.840.73
0.84
0.49
0.69
0.93
0.56
0.93 0.930.980.98
0.940.98
0.75
0.95
0.60
0.80
0.930.99
0.710.78 0.78
0.62
0.29
0.55
0.750.83
sacramento BUSINESS REVIEW ❱❱ Emerging Trends in Sacramento’s Economy20
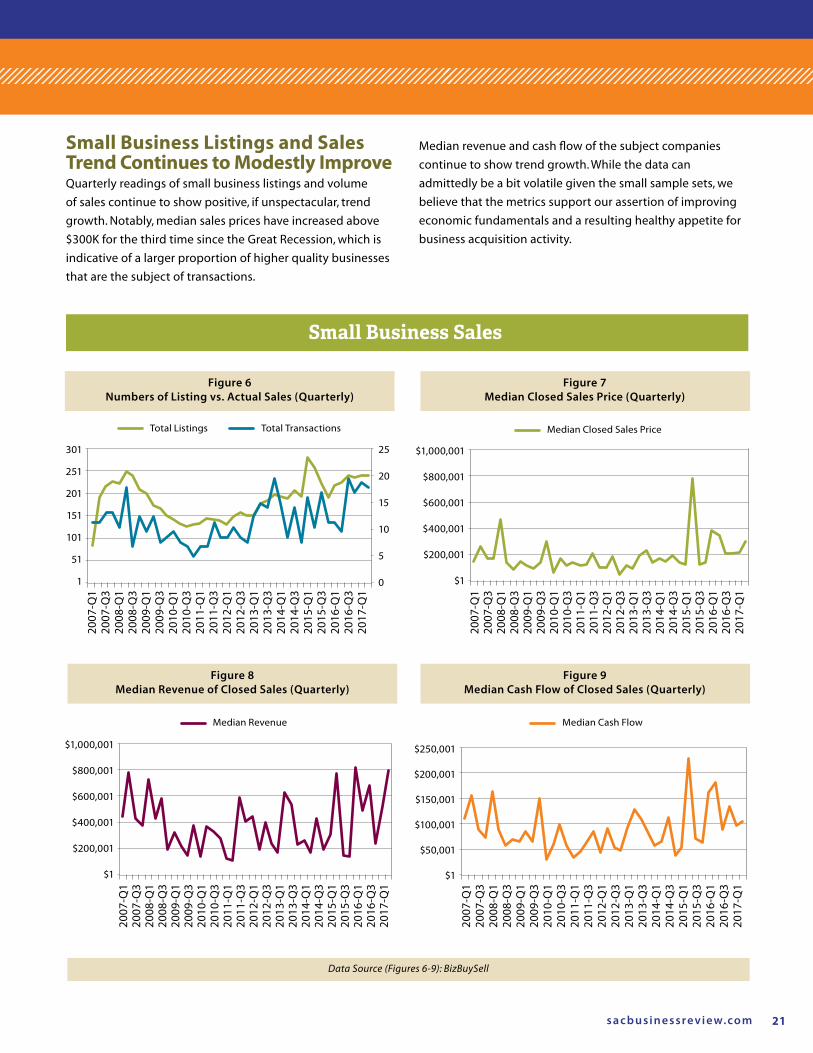
administration’s “America First” policies and focus on repatriating
manufacturing jobs in the U.S., these responses are not overly
surprising to us.
Our local job mix continues to shift towards the service sector,
so measuring attitudes in this area is very important. Fortunately,
respondents feel credit conditions remain positive and they too
have logged a material 33% increase in their likelihood to hire.
Respondents in the other sector had no material change
in outlook across most categories. On a positive note, their
likelihood to hire increased by 15% as well.
THE Small Business Economy
Data Source (Figures 4 & 5): U.S. Small Business Administration
Figure 4 Small Business Confidence Index Trends in the Service Sector » January 2011 – January 2017
Economic Outlook Local Supportiveness
Credit Accessibility
Future Revenue Likelihood of New Hires
Jan-11 Jan-15Jan-13 Jan-17 Jul-17Jul-11 Jul-15Jul-13Jan-12 Jan-16Jan-14Jul-12 Jul-16Jul-14
0.93 0.940.92 0.95 0.900.89
0.71
0.940.95 0.95
0.58
0.86 0.850.78 0.80
0.86
0.55
0.670.59
0.77
Economic Outlook Local Supportiveness
Credit Accessibility
Future Revenue Likelihood of New Hires
0.96 0.980.950.89
0.76
0.96 0.88 0.88 0.92 0.940.97
0.660.76
Figure 5 Small Business Confidence Index Trends in the Others Sector » January 2011 – January 2017
Jan-11 Jan-15Jan-13 Jan-17 Jul-17Jul-11 Jul-15Jul-13Jan-12 Jan-16Jan-14Jul-12 Jul-16Jul-14
0.83 0.800.68
0.77
0.460.43
0.91
s a c b u s i n e s s rev i ew. co m 21
Small Business Economy
Data Source (Figures 6-9): BizBuySell
Figure 6Numbers of Listing vs. Actual Sales (Quarterly)
Figure 7Median Closed Sales Price (Quarterly)
Small Business Sales
Total Listings Total Transactions Median Closed Sales Price
Figure 8Median Revenue of Closed Sales (Quarterly)
Figure 9Median Cash Flow of Closed Sales (Quarterly)
Median Revenue Median Cash Flow
$250,001
$200,001
$150,001
$100,001
$50,001
$1
301
251
201
151
101
51
1
25
20
15
10
5
0
2007
-Q1
2007
-Q3
2008
-Q1
2008
-Q3
2009
-Q1
2009
-Q3
2010
-Q1
2010
-Q3
2011
-Q1
2011
-Q3
2012
-Q1
2012
-Q3
2013
-Q1
2013
-Q3
2014
-Q1
2014
-Q3
2015
-Q1
2015
-Q3
2016
-Q1
2016
-Q3
2017
-Q1
2007
-Q1
2007
-Q3
2008
-Q1
2008
-Q3
2009
-Q1
2009
-Q3
2010
-Q1
2010
-Q3
2011
-Q1
2011
-Q3
2012
-Q1
2012
-Q3
2013
-Q1
2013
-Q3
2014
-Q1
2014
-Q3
2015
-Q1
2015
-Q3
2016
-Q1
2016
-Q3
2017
-Q1
2007
-Q1
2007
-Q3
2008
-Q1
2008
-Q3
2009
-Q1
2009
-Q3
2010
-Q1
2010
-Q3
2011
-Q1
2011
-Q3
2012
-Q1
2012
-Q3
2013
-Q1
2013
-Q3
2014
-Q1
2014
-Q3
2015
-Q1
2015
-Q3
2016
-Q1
2016
-Q3
2017
-Q1
2007
-Q1
2007
-Q3
2008
-Q1
2008
-Q3
2009
-Q1
2009
-Q3
2010
-Q1
2010
-Q3
2011
-Q1
2011
-Q3
2012
-Q1
2012
-Q3
2013
-Q1
2013
-Q3
2014
-Q1
2014
-Q3
2015
-Q1
2015
-Q3
2016
-Q1
2016
-Q3
2017
-Q1
$1,000,001
$800,001
$600,001
$400,001
$200,001
$1
$1,000,001
$800,001
$600,001
$400,001
$200,001
$1
Small Business Listings and Sales Trend Continues to Modestly ImproveQuarterly readings of small business listings and volume
of sales continue to show positive, if unspectacular, trend
growth. Notably, median sales prices have increased above
$300K for the third time since the Great Recession, which is
indicative of a larger proportion of higher quality businesses
that are the subject of transactions.
Median revenue and cash flow of the subject companies
continue to show trend growth. While the data can
admittedly be a bit volatile given the small sample sets, we
believe that the metrics support our assertion of improving
economic fundamentals and a resulting healthy appetite for
business acquisition activity.
sacramento BUSINESS REVIEW ❱❱ Emerging Trends in Sacramento’s Economy22
Real Estate Trends in the Sacramento Region
UPDATE
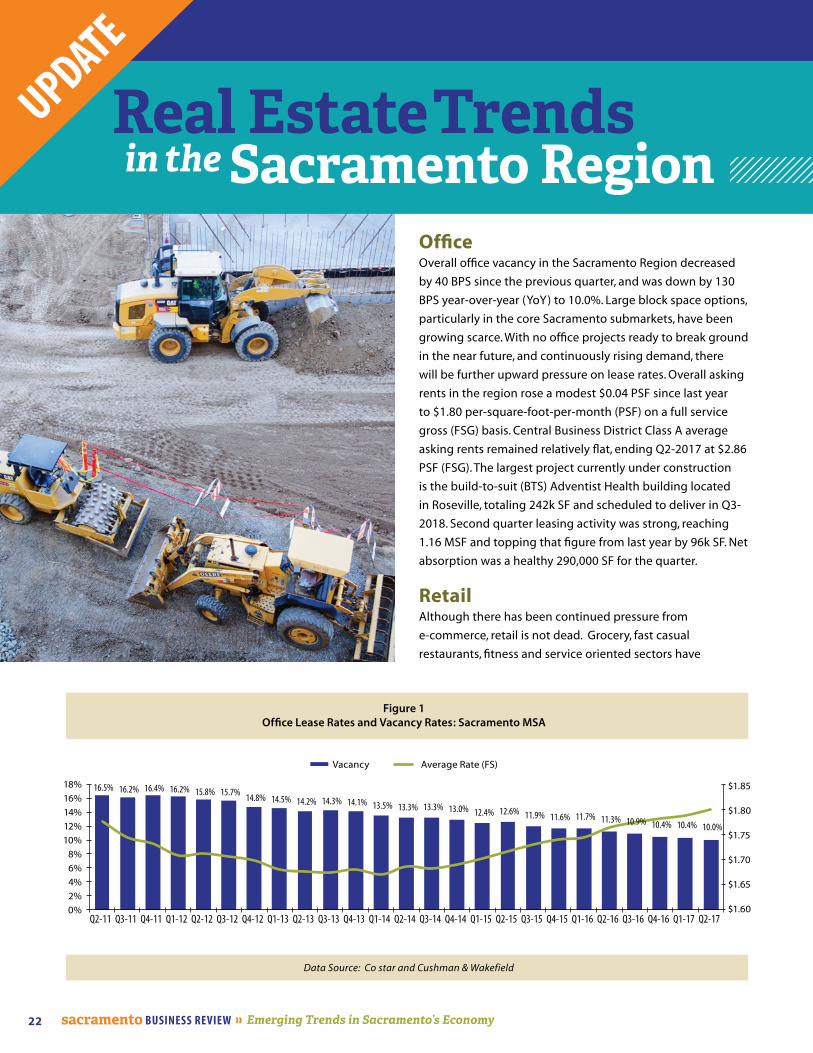
OfficeOverall office vacancy in the Sacramento Region decreased
by 40 BPS since the previous quarter, and was down by 130
BPS year-over-year (YoY) to 10.0%. Large block space options,
particularly in the core Sacramento submarkets, have been
growing scarce. With no office projects ready to break ground
in the near future, and continuously rising demand, there
will be further upward pressure on lease rates. Overall asking
rents in the region rose a modest $0.04 PSF since last year
to $1.80 per-square-foot-per-month (PSF) on a full service
gross (FSG) basis. Central Business District Class A average
asking rents remained relatively flat, ending Q2-2017 at $2.86
PSF (FSG). The largest project currently under construction
is the build-to-suit (BTS) Adventist Health building located
in Roseville, totaling 242k SF and scheduled to deliver in Q3-
2018. Second quarter leasing activity was strong, reaching
1.16 MSF and topping that figure from last year by 96k SF. Net
absorption was a healthy 290,000 SF for the quarter.
RetailAlthough there has been continued pressure from
e-commerce, retail is not dead. Grocery, fast casual
restaurants, fitness and service oriented sectors have
Data Source: Co star and Cushman & Wakefield
Figure 1Office Lease Rates and Vacancy Rates: Sacramento MSA
18%16%14%12%10%
8%6%4%2%0%
$1.85
$1.80
$1.75
$1.70
$1.65
$1.60
Vacancy Average Rate (FS)
s a c b u s i n e s s rev i ew. co m 23
Despite the limited amount of available industrial space in
Sacramento, the vacancy rate continued to fall in Q2-2017.
remained the strongest categories in retail, which are
predominantly insulated from e-commerce. Demand for
Class A retail is strong with vacancy in the 6% range and
asking rents in prime submarkets at around $36.00 per
square foot per year on a triple-net basis (NNN) and higher
for new construction. Overall vacancy has been hovering
around 9.4% and is very close to pre-recession levels in 2008
of under 9%. Although leasing activity in the 2nd quarter
was slow, this is not an indicator of any lack of demand. There
has been a torrential pace of investment activity. Among
the numerous retail properties under construction, the most
notable in the suburbs is Delta Shores Center (on Beach Lake
Rd. at Interstate 5) in the South Sacramento submarket. This
new speculative 727,400 SF power center is set to deliver
in late 2017, and will add such big box stores as Wal-Mart
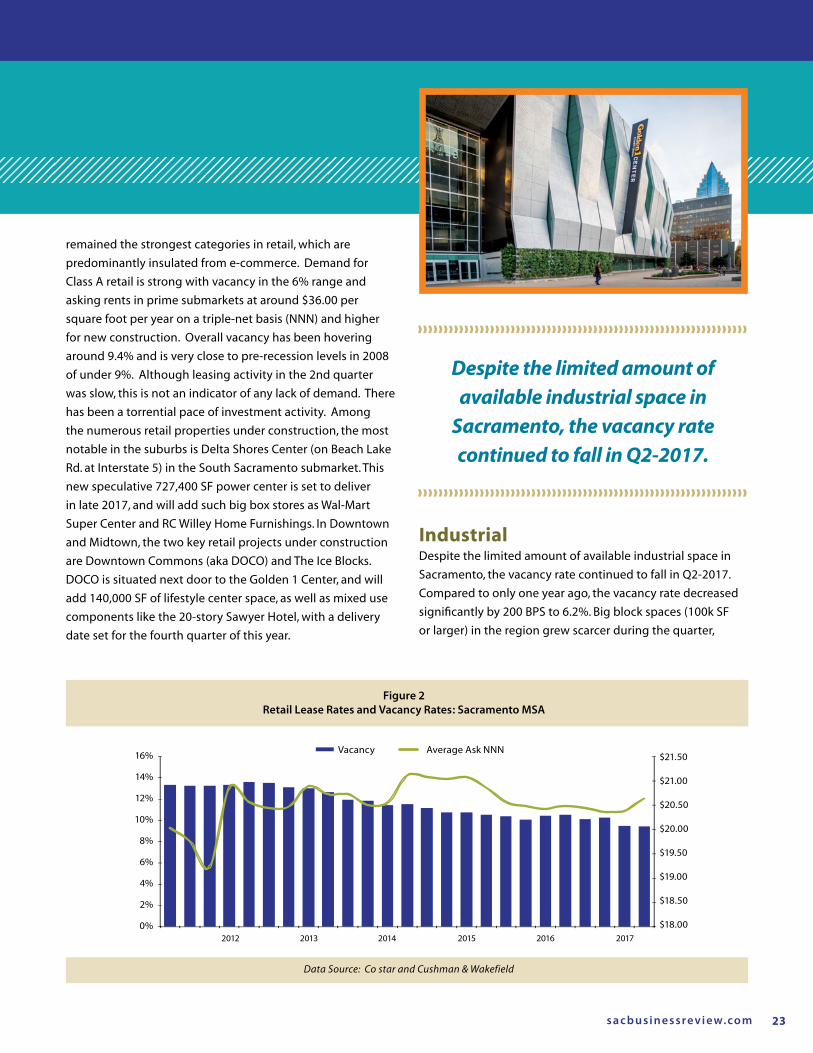
Super Center and RC Willey Home Furnishings. In Downtown
and Midtown, the two key retail projects under construction
are Downtown Commons (aka DOCO) and The Ice Blocks.
DOCO is situated next door to the Golden 1 Center, and will
add 140,000 SF of lifestyle center space, as well as mixed use
components like the 20-story Sawyer Hotel, with a delivery
date set for the fourth quarter of this year.
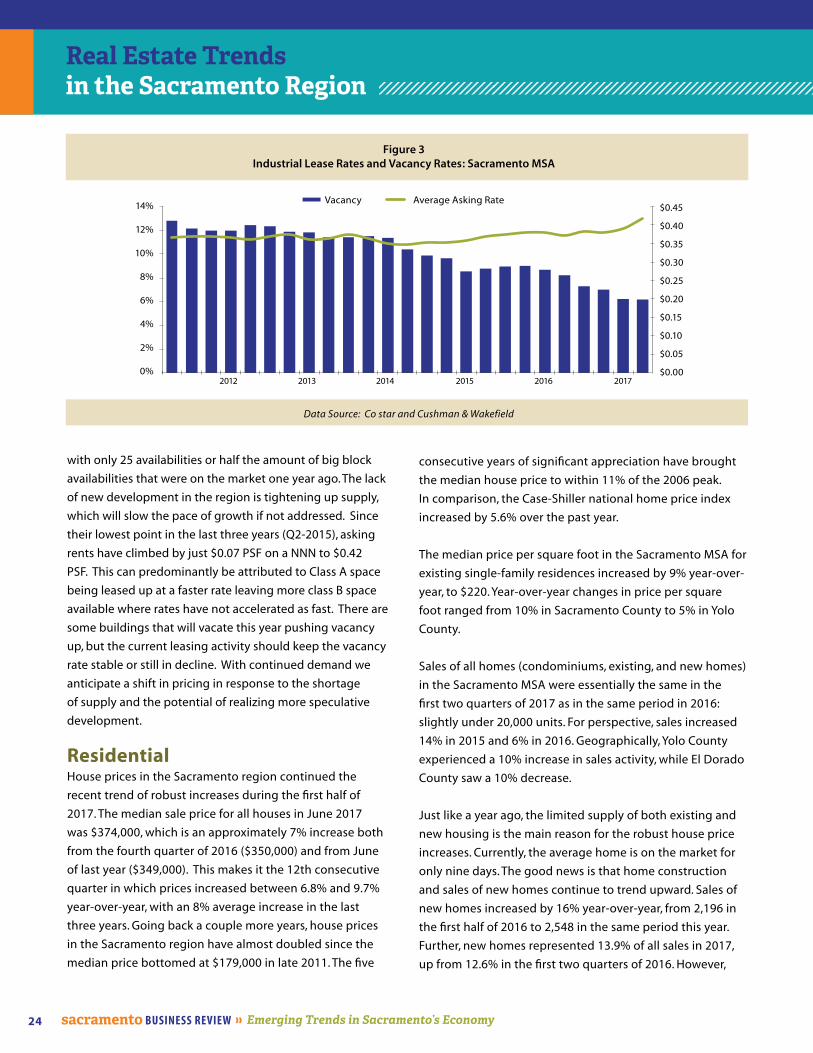
IndustrialDespite the limited amount of available industrial space in
Sacramento, the vacancy rate continued to fall in Q2-2017.
Compared to only one year ago, the vacancy rate decreased
significantly by 200 BPS to 6.2%. Big block spaces (100k SF
or larger) in the region grew scarcer during the quarter,
Data Source: Co star and Cushman & Wakefield
Figure 2Retail Lease Rates and Vacancy Rates: Sacramento MSA
16%
14%
12%
10%
8%
6%
4%
2%
0%
$21.50
$21.00
$20.50
$20.00
$19.50
$19.00
$18.50
$18.00
Vacancy Average Ask NNN
2012 2013 2014 2015 2016 2017
sacramento BUSINESS REVIEW ❱❱ Emerging Trends in Sacramento’s Economy24
Real Estate Trends in the Sacramento Region
with only 25 availabilities or half the amount of big block
availabilities that were on the market one year ago. The lack
of new development in the region is tightening up supply,
which will slow the pace of growth if not addressed. Since
their lowest point in the last three years (Q2-2015), asking
rents have climbed by just $0.07 PSF on a NNN to $0.42
PSF. This can predominantly be attributed to Class A space
being leased up at a faster rate leaving more class B space
available where rates have not accelerated as fast. There are
some buildings that will vacate this year pushing vacancy
up, but the current leasing activity should keep the vacancy
rate stable or still in decline. With continued demand we
anticipate a shift in pricing in response to the shortage
of supply and the potential of realizing more speculative
development.
ResidentialHouse prices in the Sacramento region continued the
recent trend of robust increases during the first half of
2017. The median sale price for all houses in June 2017
was $374,000, which is an approximately 7% increase both
from the fourth quarter of 2016 ($350,000) and from June
of last year ($349,000). This makes it the 12th consecutive
quarter in which prices increased between 6.8% and 9.7%
year-over-year, with an 8% average increase in the last
three years. Going back a couple more years, house prices
in the Sacramento region have almost doubled since the
median price bottomed at $179,000 in late 2011. The five
consecutive years of significant appreciation have brought
the median house price to within 11% of the 2006 peak.
In comparison, the Case-Shiller national home price index
increased by 5.6% over the past year.
The median price per square foot in the Sacramento MSA for
existing single-family residences increased by 9% year-over-
year, to $220. Year-over-year changes in price per square
foot ranged from 10% in Sacramento County to 5% in Yolo
County.
Sales of all homes (condominiums, existing, and new homes)
in the Sacramento MSA were essentially the same in the
first two quarters of 2017 as in the same period in 2016:
slightly under 20,000 units. For perspective, sales increased
14% in 2015 and 6% in 2016. Geographically, Yolo County
experienced a 10% increase in sales activity, while El Dorado
County saw a 10% decrease.
Just like a year ago, the limited supply of both existing and
new housing is the main reason for the robust house price
increases. Currently, the average home is on the market for
only nine days. The good news is that home construction
and sales of new homes continue to trend upward. Sales of
new homes increased by 16% year-over-year, from 2,196 in
the first half of 2016 to 2,548 in the same period this year.
Further, new homes represented 13.9% of all sales in 2017,
up from 12.6% in the first two quarters of 2016. However,
Data Source: Co star and Cushman & Wakefield
Figure 3Industrial Lease Rates and Vacancy Rates: Sacramento MSA
Vacancy Average Asking Rate14%
12%
10%
8%
6%
4%
2%
0%
$0.45
$0.40
$0.35
$0.30
$0.25
$0.20
$0.15
$0.10
$0.05
$0.002012 2013 2014 2015 2016 2017
s a c b u s i n e s s rev i ew. co m 25
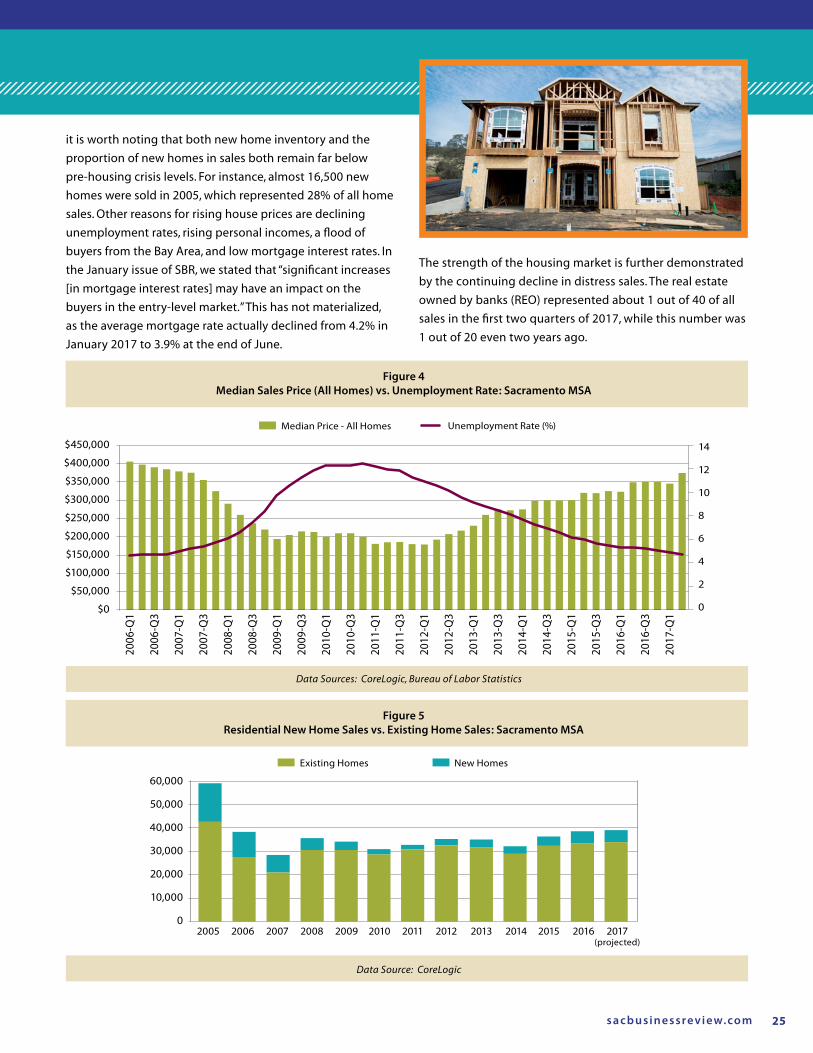
it is worth noting that both new home inventory and the
proportion of new homes in sales both remain far below
pre-housing crisis levels. For instance, almost 16,500 new
homes were sold in 2005, which represented 28% of all home
sales. Other reasons for rising house prices are declining
unemployment rates, rising personal incomes, a flood of
buyers from the Bay Area, and low mortgage interest rates. In
the January issue of SBR, we stated that “significant increases
[in mortgage interest rates] may have an impact on the
buyers in the entry-level market.” This has not materialized,
as the average mortgage rate actually declined from 4.2% in
January 2017 to 3.9% at the end of June.
Figure 4Median Sales Price (All Homes) vs. Unemployment Rate: Sacramento MSA
Figure 5Residential New Home Sales vs. Existing Home Sales: Sacramento MSA
Data Sources: CoreLogic, Bureau of Labor Statistics
Data Source: CoreLogic
The strength of the housing market is further demonstrated
by the continuing decline in distress sales. The real estate
owned by banks (REO) represented about 1 out of 40 of all
sales in the first two quarters of 2017, while this number was
1 out of 20 even two years ago.
60,000
50,000
40,000
30,000
20,000
10,000
0
$450,000
$400,000
$350,000
$300,000
$250,000
$200,000
$150,000
$100,000
$50,000
$0
2005 2006 2007 2008 2009 2010 2011 2012 20142013 2015 2016 2017 (projected)
Existing Homes New Homes
Unemployment Rate (%)Median Price - All Homes
14
12
10
8
6
4
2
0
2006
-Q1
2006
-Q3
2007
-Q1
2007
-Q3
2008
-Q1
2008
-Q3
2009
-Q1
2009
-Q3
2010
-Q1
2010
-Q3
2011
-Q1
2011
-Q3
2012
-Q1
2012
-Q3
2013
-Q1
2013
-Q3
2014
-Q1
2014
-Q3
2015
-Q1
2015
-Q3
2016
-Q1
2016
-Q3
2017
-Q1
sacramento BUSINESS REVIEW ❱❱ Emerging Trends in Sacramento’s Economy26
Table 1Bank Loan Growth by Category
Table 2Credit Union Loan Growth by Category
Data Source: FDIC
Data Source: NCUA
SegmentQ1 of 2016
Growth
Q1 of 2016 Annualized
Growth
2016 Annual Growth
Q1 of 2017
Growth
Q1 of 2017 Annualized
Growth
Commercial Real Estate 2.1% 8.6% 17.3% 3.8% 16.0%
Residential -0.3% -1.1% 1.1% 0.9% 3.7%
Commercial & Industrial -0.4% -1.5% 8.9% -1.2% -4.6%
Multi-family Residential 8.7% 39.5% 54.3% 1.9% 7.9%
Construction 6.5% 28.6% 14.1% -2.1% -8.1%
Other -3.1% 22.28% 6.9% -3.8% -14.5%
Total 1.1% 4.4% 13.2% 1.3% 5.3%
SegmentQ1 of 2016
Growth
Q1 of 2016 Annualized
Growth
2016 Annual Growth
Q1 of 2017
Growth
Q1 of 2017 Annualized
Growth
Auto 4.96% 21.37% 32.9% 5.1% 22.1%
Residential/RE Lines of Credit
2.5% 10.39% 17.8% 2.2% 9.2%
Credit Card/Unsecured -0.3% -1.19% 14.2% -1.1% -4.3%
Other 5.16% 22.28% 23.9% 5.4% 23.5%
Total 3.47% 14.6% 24.7% 3.5% 14.6%
2017 Banking & Capital Markets Mid-Year Update
UPDATE
o provide a more concise, yet informative
update for the local banking industry and
capital markets, the SBR team felt it best to
combine the two sections for the 2017 mid-
year update and future editions. Much of the
central bank policy decisions and actions that we typically
discuss in the Capital Markets section have unquestionable
ramifications for the local banking sector, and many of the
broader capital markets themes such as macroeconomic
expectations and stock market valuations directly impact
the local banking sector’s customer base and its behavior
regarding demand for loan and deposit products. We hope
you enjoy the new format, and as always, please feel free to
contact us with any feedback.
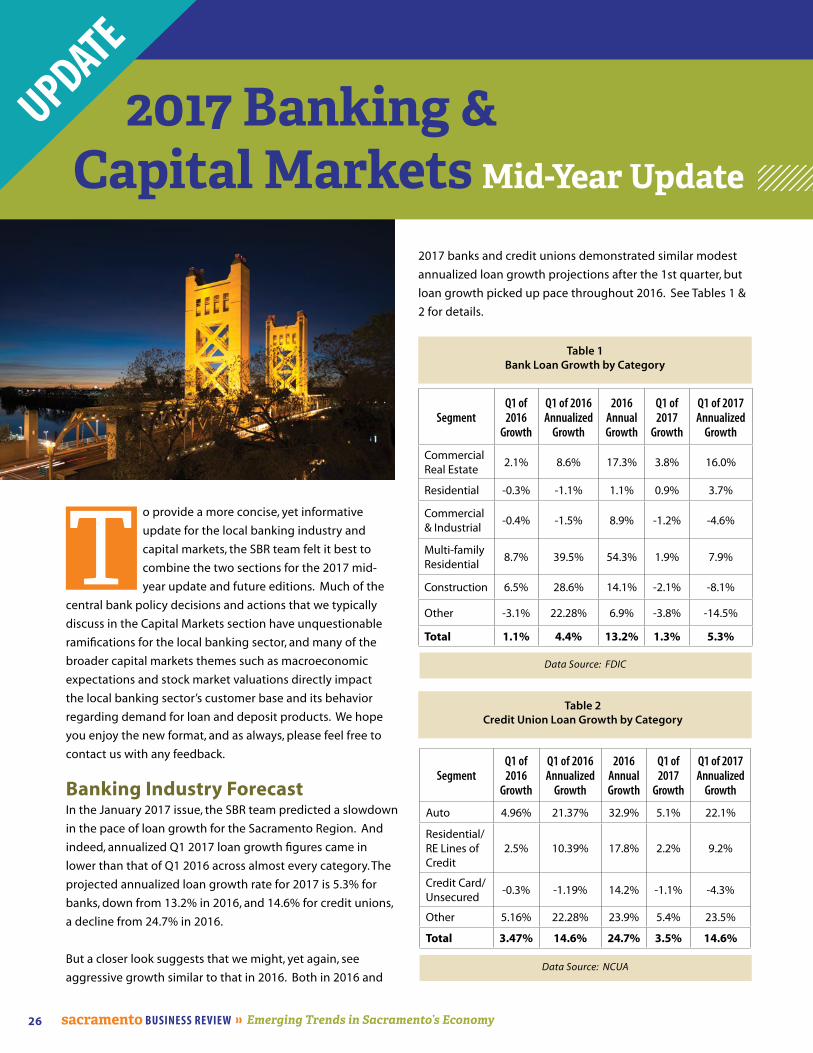
Banking Industry ForecastIn the January 2017 issue, the SBR team predicted a slowdown
in the pace of loan growth for the Sacramento Region. And
indeed, annualized Q1 2017 loan growth figures came in
lower than that of Q1 2016 across almost every category. The
projected annualized loan growth rate for 2017 is 5.3% for
banks, down from 13.2% in 2016, and 14.6% for credit unions,
a decline from 24.7% in 2016.
But a closer look suggests that we might, yet again, see
aggressive growth similar to that in 2016. Both in 2016 and
T
2017 banks and credit unions demonstrated similar modest
annualized loan growth projections after the 1st quarter, but
loan growth picked up pace throughout 2016. See Tables 1 &
2 for details.
s a c b u s i n e s s rev i ew. co m 27
SegmentQ1 of 2016
Growth
Q1 of 2016 Annualized
Growth
2016 Annual Growth
Q1 of 2017
Growth
Q1 of 2017 Annualized
Growth
Auto 4.96% 21.37% 32.9% 5.1% 22.1%
Residential/RE Lines of Credit
2.5% 10.39% 17.8% 2.2% 9.2%
Credit Card/Unsecured -0.3% -1.19% 14.2% -1.1% -4.3%
Other 5.16% 22.28% 23.9% 5.4% 23.5%
Total 3.47% 14.6% 24.7% 3.5% 14.6%
2017 Banking & Capital Markets Mid-Year Update
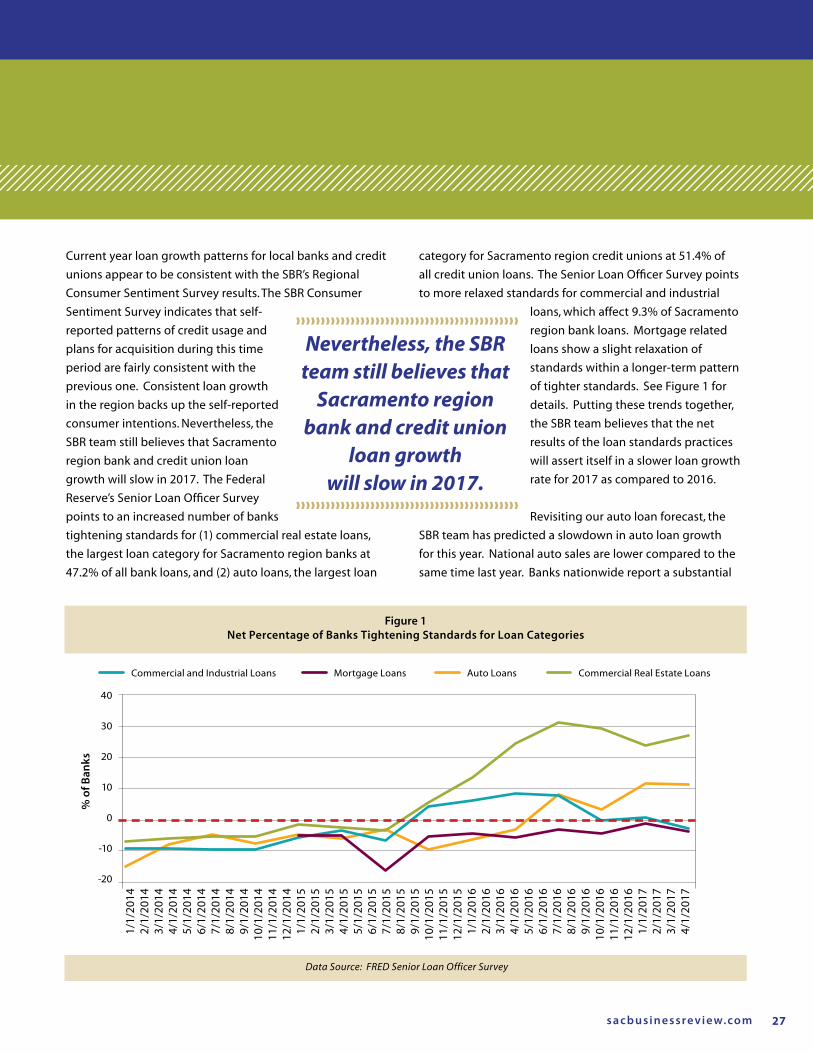
Figure 1Net Percentage of Banks Tightening Standards for Loan Categories
Data Source: FRED Senior Loan Officer Survey
category for Sacramento region credit unions at 51.4% of
all credit union loans. The Senior Loan Officer Survey points
to more relaxed standards for commercial and industrial
loans, which affect 9.3% of Sacramento
region bank loans. Mortgage related
loans show a slight relaxation of
standards within a longer-term pattern
of tighter standards. See Figure 1 for
details. Putting these trends together,
the SBR team believes that the net
results of the loan standards practices
will assert itself in a slower loan growth
rate for 2017 as compared to 2016.
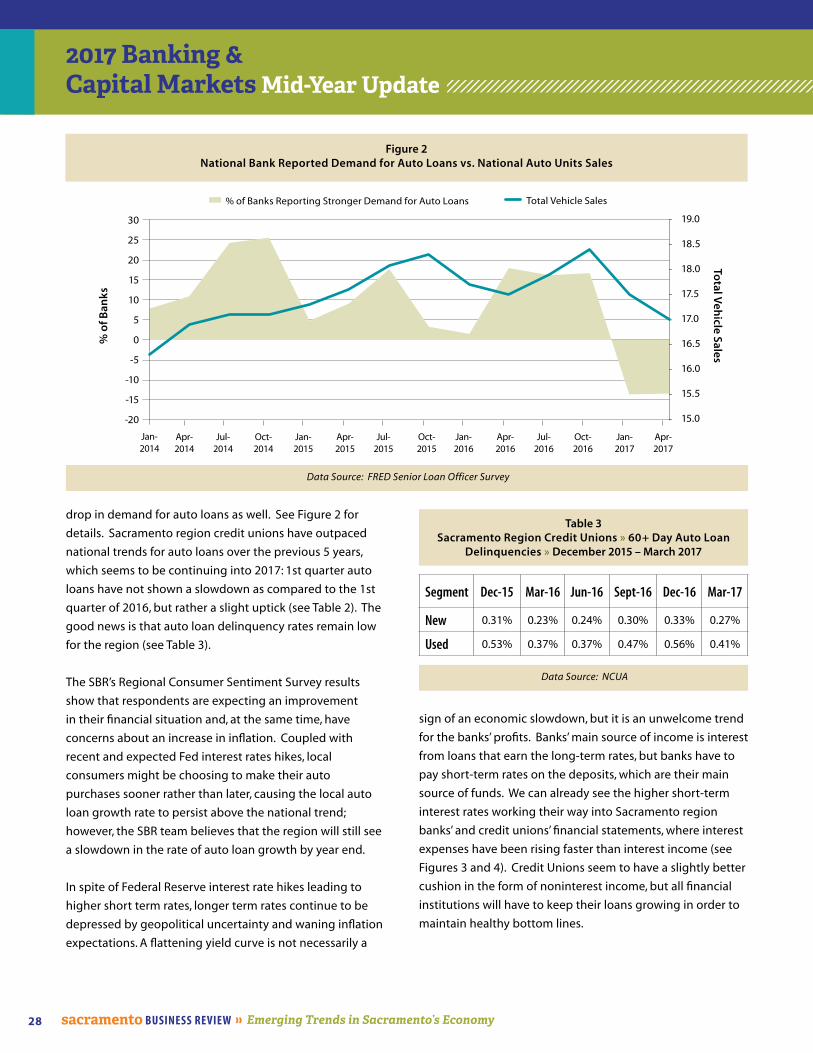
Revisiting our auto loan forecast, the
SBR team has predicted a slowdown in auto loan growth
for this year. National auto sales are lower compared to the
same time last year. Banks nationwide report a substantial
Nevertheless, the SBR team still believes that
Sacramento region bank and credit union
loan growth will slow in 2017.
Commercial and Industrial Loans Mortgage Loans Auto Loans Commercial Real Estate Loans
40
30
20
10
0
-10
-20
1/1/
2014
2/
1/20
14
3/1/
2014
4/1/
2014
5/1/
2014
6/1/
2014
7/1/
2014
8/1/
2014
9/1/
2014
10/1
/201
411
/1/2
014
12/1
/201
4 1/
1/20
152/
1/20
15
3/1/
2015
4/1/
2015
5/1/
2015
6/1/
2015
7/1/
2015
8/1/
2015
9/1/
2015
10/1
/201
511
/1/2
015
12/1
/201
51/
1/20
162/
1/20
16
3/1/
2016
4/1/
2016
5/1/
2016
6/1/
2016
7/1/
2016
8/1/
2016
9/1/
2016
10/1
/201
611
/1/2
016
12/1
/201
61/
1/20
172/
1/20
17
3/1/
2017
4/1/
2017
% o
f Ban
ks
Current year loan growth patterns for local banks and credit
unions appear to be consistent with the SBR’s Regional
Consumer Sentiment Survey results. The SBR Consumer
Sentiment Survey indicates that self-
reported patterns of credit usage and
plans for acquisition during this time
period are fairly consistent with the
previous one. Consistent loan growth
in the region backs up the self-reported
consumer intentions. Nevertheless, the
SBR team still believes that Sacramento
region bank and credit union loan
growth will slow in 2017. The Federal
Reserve’s Senior Loan Officer Survey
points to an increased number of banks
tightening standards for (1) commercial real estate loans,
the largest loan category for Sacramento region banks at
47.2% of all bank loans, and (2) auto loans, the largest loan
sacramento BUSINESS REVIEW ❱❱ Emerging Trends in Sacramento’s Economy28
2017 Banking & Capital Markets Mid-Year Update
Figure 2National Bank Reported Demand for Auto Loans vs. National Auto Units Sales
Table 3Sacramento Region Credit Unions » 60+ Day Auto Loan
Delinquencies » December 2015 – March 2017
Data Source: NCUA
Data Source: FRED Senior Loan Officer Survey
Segment Dec-15 Mar-16 Jun-16 Sept-16 Dec-16 Mar-17
New 0.31% 0.23% 0.24% 0.30% 0.33% 0.27%
Used 0.53% 0.37% 0.37% 0.47% 0.56% 0.41%
drop in demand for auto loans as well. See Figure 2 for
details. Sacramento region credit unions have outpaced
national trends for auto loans over the previous 5 years,
which seems to be continuing into 2017: 1st quarter auto
loans have not shown a slowdown as compared to the 1st
quarter of 2016, but rather a slight uptick (see Table 2). The
good news is that auto loan delinquency rates remain low
for the region (see Table 3).
The SBR’s Regional Consumer Sentiment Survey results
show that respondents are expecting an improvement
in their financial situation and, at the same time, have
concerns about an increase in inflation. Coupled with
recent and expected Fed interest rates hikes, local
consumers might be choosing to make their auto
purchases sooner rather than later, causing the local auto
loan growth rate to persist above the national trend;
however, the SBR team believes that the region will still see
a slowdown in the rate of auto loan growth by year end.
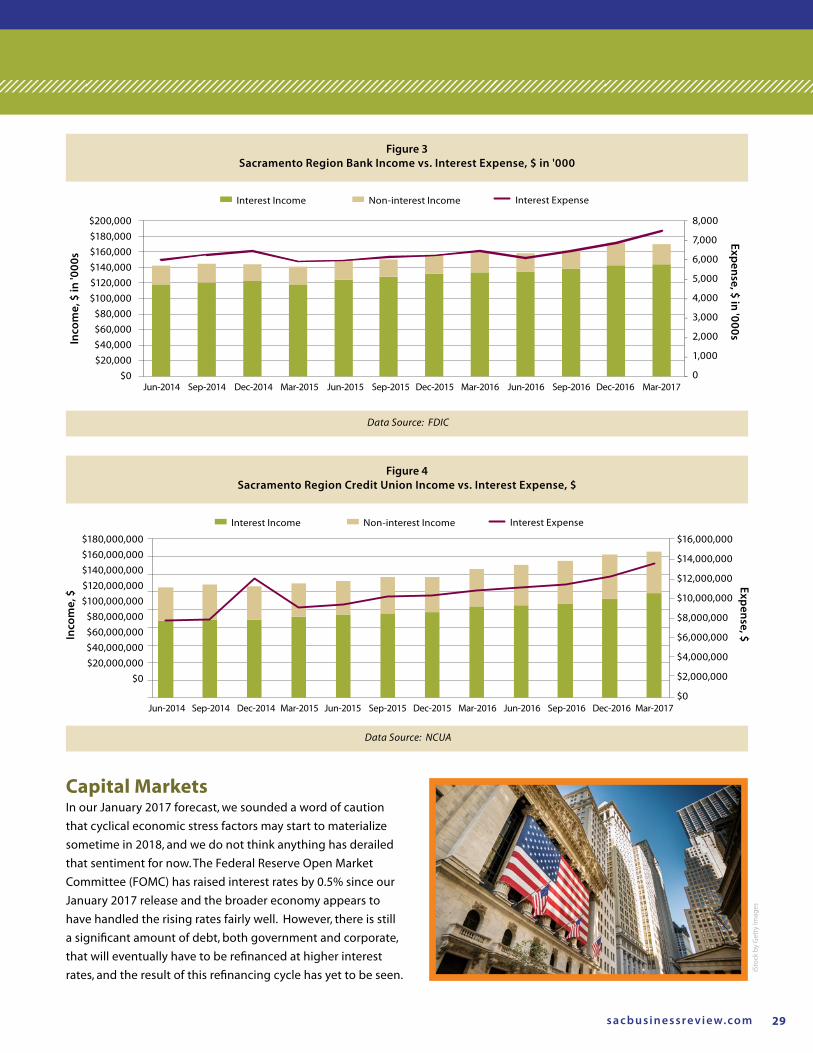
In spite of Federal Reserve interest rate hikes leading to
higher short term rates, longer term rates continue to be
depressed by geopolitical uncertainty and waning inflation
expectations. A flattening yield curve is not necessarily a
sign of an economic slowdown, but it is an unwelcome trend
for the banks’ profits. Banks’ main source of income is interest
from loans that earn the long-term rates, but banks have to
pay short-term rates on the deposits, which are their main
source of funds. We can already see the higher short-term
interest rates working their way into Sacramento region
banks’ and credit unions’ financial statements, where interest
expenses have been rising faster than interest income (see
Figures 3 and 4). Credit Unions seem to have a slightly better
cushion in the form of noninterest income, but all financial
institutions will have to keep their loans growing in order to
maintain healthy bottom lines.
Total Vehicle Sales% of Banks Reporting Stronger Demand for Auto Loans
% o
f Ban
ks
Total V
ehicle Sales
30
25
20
15
10
5
0
-5
-10
-15
-20
19.0
18.5
18.0
17.5
17.0
16.5
16.0
15.5
15.0
Jan-2014
Jan-2017
Jan-2015
Jan-2016
Apr-2014
Apr-2017
Apr-2015
Apr-2016
Jul-2014
Jul-2015
Jul-2016
Oct-2014
Oct-2015
Oct-2016
s a c b u s i n e s s rev i ew. co m 29
2017 Banking & Capital Markets Mid-Year Update
Figure 3Sacramento Region Bank Income vs. Interest Expense, $ in '000
Data Source: FDIC
Capital Markets In our January 2017 forecast, we sounded a word of caution
that cyclical economic stress factors may start to materialize
sometime in 2018, and we do not think anything has derailed
that sentiment for now. The Federal Reserve Open Market
Committee (FOMC) has raised interest rates by 0.5% since our
January 2017 release and the broader economy appears to
have handled the rising rates fairly well. However, there is still
a significant amount of debt, both government and corporate,
that will eventually have to be refinanced at higher interest
rates, and the result of this refinancing cycle has yet to be seen.
Interest ExpenseInterest Income Non-interest Income
Figure 4Sacramento Region Credit Union Income vs. Interest Expense, $
Data Source: NCUA
$180,000,000$160,000,000$140,000,000$120,000,000$100,000,000
$80,000,000$60,000,000$40,000,000$20,000,000
$0
Inco
me,
$
$16,000,000
$14,000,000
$12,000,000
$10,000,000
$8,000,000
$6,000,000
$4,000,000
$2,000,000
$0
Exp
ense, $
Jun-2014 Jun-2015 Jun-2016Sep-2014 Sep-2015 Sep-2016Dec-2014 Mar-2015 Mar-2016Dec-2015 Dec-2016 Mar-2017
Interest ExpenseInterest Income Non-interest Income
$200,000$180,000$160,000$140,000$120,000$100,000
$80,000$60,000$40,000$20,000
$0
Inco
me,
$ in
'00
0s
8,000
7,000
6,000
5,000
4,000
3,000
2,000
1,000
0
Exp
ense, $
in '0
00
s
Jun-2014 Jun-2015 Jun-2016Sep-2014 Sep-2015 Sep-2016Dec-2014 Mar-2015 Mar-2016Dec-2015 Dec-2016 Mar-2017
iSto
ck b
y G
etty
Imag
es
sacramento BUSINESS REVIEW ❱❱ Emerging Trends in Sacramento’s Economy30
2017 Banking & Capital Markets Mid-Year Update
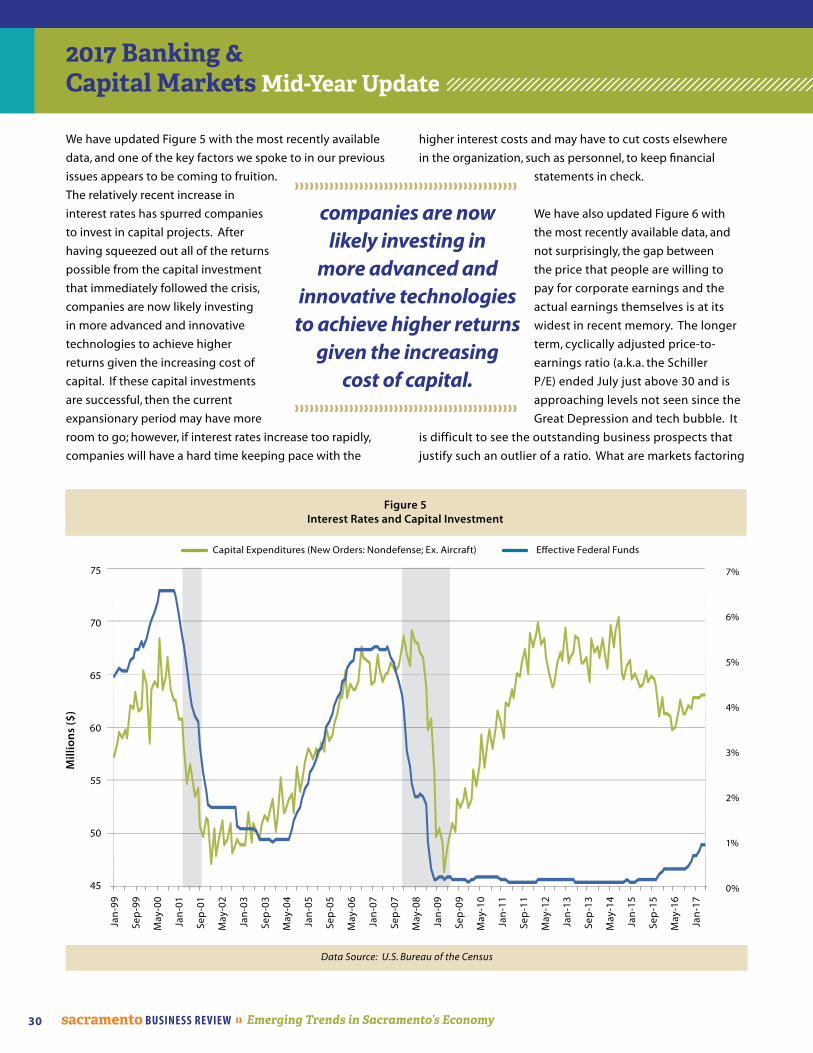
We have updated Figure 5 with the most recently available
data, and one of the key factors we spoke to in our previous
issues appears to be coming to fruition.
The relatively recent increase in
interest rates has spurred companies
to invest in capital projects. After
having squeezed out all of the returns
possible from the capital investment
that immediately followed the crisis,
companies are now likely investing
in more advanced and innovative
technologies to achieve higher
returns given the increasing cost of
capital. If these capital investments
are successful, then the current
expansionary period may have more
room to go; however, if interest rates increase too rapidly,
companies will have a hard time keeping pace with the
higher interest costs and may have to cut costs elsewhere
in the organization, such as personnel, to keep financial
statements in check.
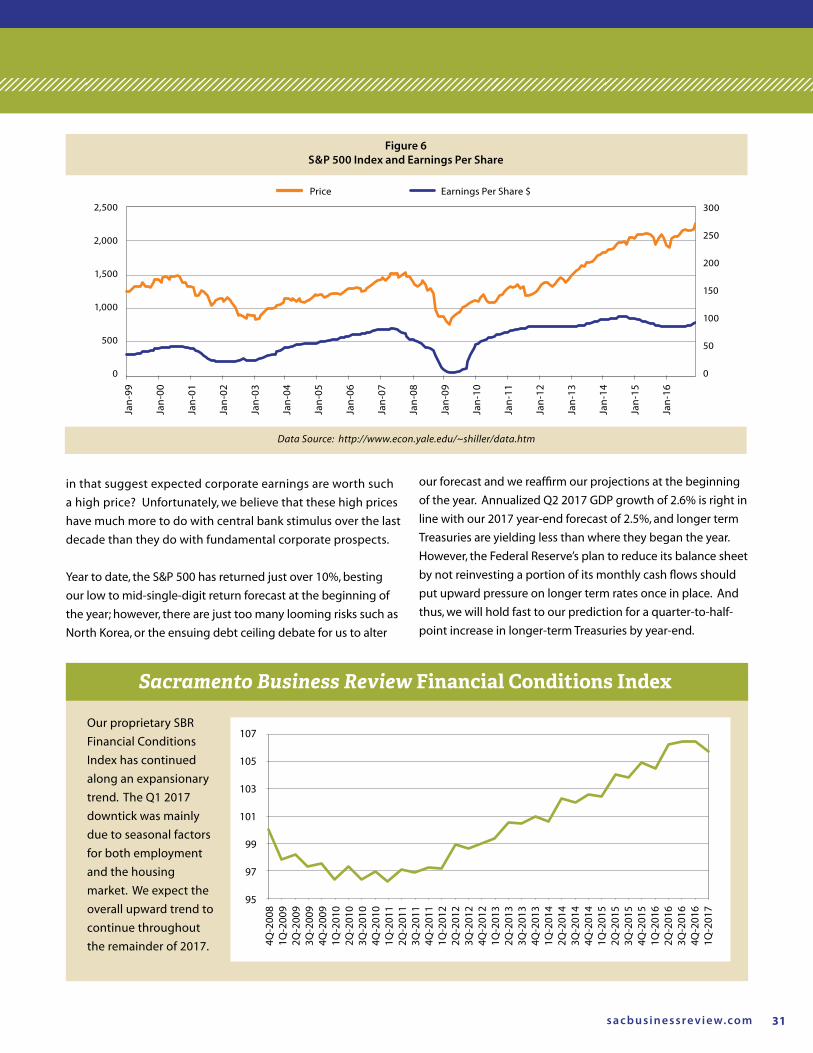
We have also updated Figure 6 with
the most recently available data, and
not surprisingly, the gap between
the price that people are willing to
pay for corporate earnings and the
actual earnings themselves is at its
widest in recent memory. The longer
term, cyclically adjusted price-to-
earnings ratio (a.k.a. the Schiller
P/E) ended July just above 30 and is
approaching levels not seen since the
Great Depression and tech bubble. It
is difficult to see the outstanding business prospects that
justify such an outlier of a ratio. What are markets factoring
Data Source: U.S. Bureau of the Census
7%
6%
5%
4%
3%
2%
1%
0%
Capital Expenditures (New Orders: Nondefense; Ex. Aircraft) Effective Federal Funds
Figure 5Interest Rates and Capital Investment
Mil
lio
ns
($)
Jan-
99
Sep
-99
May
-00
Jan-
01
Sep
-01
May
-02
Jan-
03
Sep
-03
May
-04
Jan-
05
Sep
-05
May
-06
Jan-
07
Sep
-07
May
-08
Jan-
09
Sep
-09
May
-10
Jan-
11
Sep
-11
May
-12
Jan-
13
Sep
-13
May
-14
Jan-
15
Sep
-15
May
-16
Jan-
17
companies are now likely investing in
more advanced and innovative technologies
to achieve higher returns given the increasing
cost of capital.
75
70
65
60
55
50
45
s a c b u s i n e s s rev i ew. co m 31
2017 Banking & Capital Markets Mid-Year Update
in that suggest expected corporate earnings are worth such
a high price? Unfortunately, we believe that these high prices
have much more to do with central bank stimulus over the last
decade than they do with fundamental corporate prospects.
Year to date, the S&P 500 has returned just over 10%, besting
our low to mid-single-digit return forecast at the beginning of
the year; however, there are just too many looming risks such as
North Korea, or the ensuing debt ceiling debate for us to alter
Our proprietary SBR
Financial Conditions
Index has continued
along an expansionary
trend. The Q1 2017
downtick was mainly
due to seasonal factors
for both employment
and the housing
market. We expect the
overall upward trend to
continue throughout
the remainder of 2017.
Sacramento Business Review Financial Conditions Index
107
105
103
101
99
97
95
7%
6%
5%
4%
3%
2%
1%
0%
Jan-
99
Sep
-99
May
-00
Jan-
01
Sep
-01
May
-02
Jan-
03
Sep
-03
May
-04
Jan-
05
Sep
-05
May
-06
Jan-
07
Sep
-07
May
-08
Jan-
09
Sep
-09
May
-10
Jan-
11
Sep
-11
May
-12
Jan-
13
Sep
-13
May
-14
Jan-
15
Sep
-15
May
-16
Jan-
17
our forecast and we reaffirm our projections at the beginning
of the year. Annualized Q2 2017 GDP growth of 2.6% is right in
line with our 2017 year-end forecast of 2.5%, and longer term
Treasuries are yielding less than where they began the year.
However, the Federal Reserve’s plan to reduce its balance sheet
by not reinvesting a portion of its monthly cash flows should
put upward pressure on longer term rates once in place. And
thus, we will hold fast to our prediction for a quarter-to-half-
point increase in longer-term Treasuries by year-end.
Data Source: http://www.econ.yale.edu/~shiller/data.htm
Figure 6S&P 500 Index and Earnings Per Share
2,500
2,000
1,500
1,000
500
0
Price Earnings Per Share $
300
250
200
150
100
50
0
Jan-
99
Jan-
00
Jan-
01
Jan-
02
Jan-
03
Jan-
04
Jan-
05
Jan-
06
Jan-
07
Jan-
08
Jan-
09
Jan-
10
Jan-
11
Jan-
12
Jan-
13
Jan-
14
Jan-
15
Jan-
16
4Q-2
008
1Q-2
009
2Q-2
009
3Q-2
009
4Q-2
009
1Q-2
010
2Q-2
010
3Q-2
010
4Q-2
010
1Q-2
011
2Q-2
011
3Q-2
011
4Q-2
011
1Q-2
012
2Q-2
012
3Q-2
012
4Q-2
012
1Q-2
013
2Q-2
013
3Q-2
013
4Q-2
013
1Q-2
014
2Q-2
014
3Q-2
014
4Q-2
014
1Q-2
015
2Q-2
015
3Q-2
015
4Q-2
015
1Q-2
016
2Q-2
016
3Q-2
016
4Q-2
016
1Q-2
017
sacramento BUSINESS REVIEW ❱❱ Emerging Trends in Sacramento’s Economy32
Human Capital Index
Sacramento Region
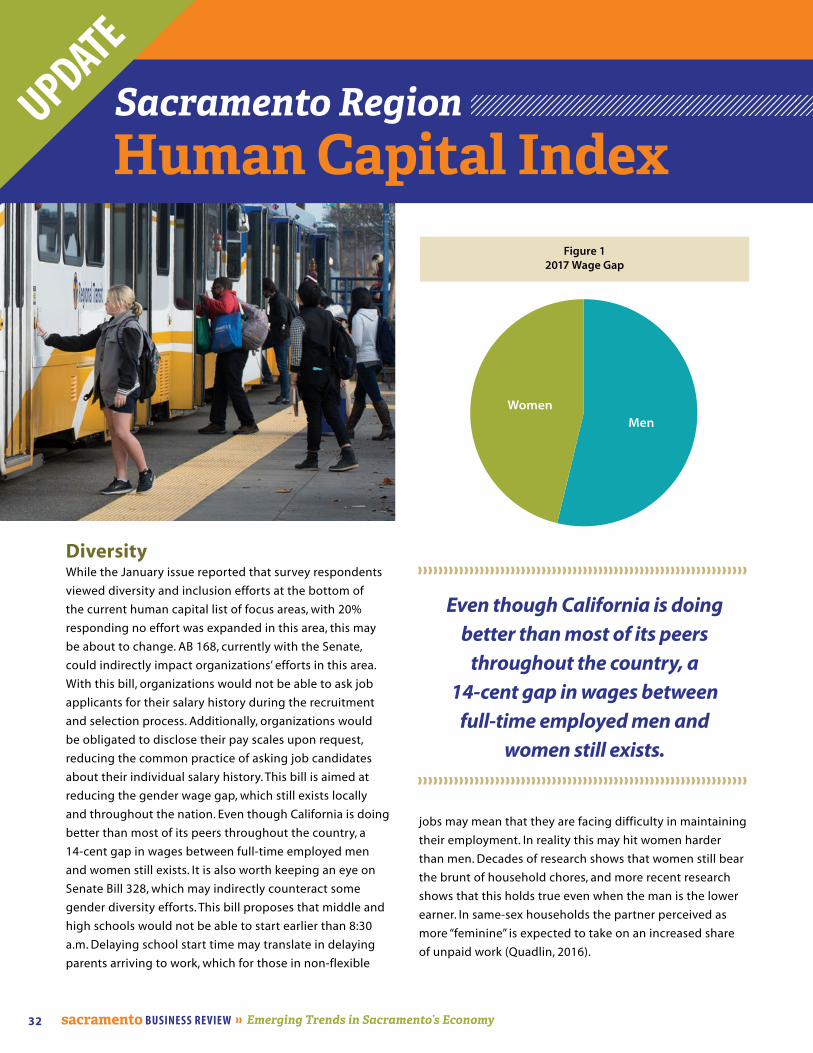
Diversity While the January issue reported that survey respondents
viewed diversity and inclusion efforts at the bottom of
the current human capital list of focus areas, with 20%
responding no effort was expanded in this area, this may
be about to change. AB 168, currently with the Senate,
could indirectly impact organizations’ efforts in this area.
With this bill, organizations would not be able to ask job
applicants for their salary history during the recruitment
and selection process. Additionally, organizations would
be obligated to disclose their pay scales upon request,
reducing the common practice of asking job candidates
about their individual salary history. This bill is aimed at
reducing the gender wage gap, which still exists locally
and throughout the nation. Even though California is doing
better than most of its peers throughout the country, a
14-cent gap in wages between full-time employed men
and women still exists. It is also worth keeping an eye on
Senate Bill 328, which may indirectly counteract some
gender diversity efforts. This bill proposes that middle and
high schools would not be able to start earlier than 8:30
a.m. Delaying school start time may translate in delaying
parents arriving to work, which for those in non-flexible
jobs may mean that they are facing difficulty in maintaining
their employment. In reality this may hit women harder
than men. Decades of research shows that women still bear
the brunt of household chores, and more recent research
shows that this holds true even when the man is the lower
earner. In same-sex households the partner perceived as
more “feminine” is expected to take on an increased share
of unpaid work (Quadlin, 2016).
Even though California is doing better than most of its peers
throughout the country, a 14-cent gap in wages between
full-time employed men and women still exists.
UPDATE
Figure 12017 Wage Gap
MenWomen
s a c b u s i n e s s rev i ew. co m 33
Recruiting and Employment The January issue reported that 57% of organizations
surveyed indicated that they would actively recruit new
employees. This is supported by numbers at the national
level indicating increasing recruitment efforts. In support of
this, unemployment remains low in our region at 4.4%
(down from 5.1% in 2016) thanks to an overall increase of
25% jobs across industries (Bureau of Labor Statistics). It is
worth noting that this statistic does not reflect that some
industries are small with few jobs added (e.g., mining and
logging). Furthermore, data reported in the January issue
showed organizations indicated increased recruiting while
at the same time expecting reduced voluntary turnover,
which prompted us to debate whether the organizations
were expecting turnover or possibly expanding their
operations. Current data would suggest that the former
would have been the more accurate prediction.
Jobs in the software field have increased a whopping
46.6% over the past few years (California Employment
Development Department) though they make up a fraction
of the overall job market locally – only about 6,500 jobs in
total. The Sacramento region is bucking the national trend
where organizations are predicted to spend more than
$650 million on salaries for newly created jobs in artificial
intelligence as automation becomes the new normal (Jones,
2017). Large local employers — except Intel Corporation —
are absent from that list, with Intel spending roughly 8% of
what Amazon spends, 15% of Google’s spending, and 25%
of Microsoft’s spending. Overall the Sacramento region
is a small player in this domain and hosts jobs in the field
of information in the low teens of thousands and further
declining with a 4.3% drop from last year (BLS).
The fastest growing industry locally is personal care
and service while the region keeps losing jobs in the
construction sector, where we see a decline exceeding
4% since last year, tracking closely with the underbuilding
of affordable housing in our region. With currently
In the January issue we reported that more than 75% of employees
view their pay and benefits positively.
debated legislation (SB 35) recently passed by the Senate,
communities may no longer be able to thwart housing
proposals which they deem not aligned with their
communities and we may see an uptick in construction and
construction-related jobs.
Government is currently approximately 238,000 jobs with a
small (0.4%) increase since last year, but facing great loss of
talent and knowledge as a majority of government workers
are age 50 or older. Anecdotally government agencies have
a hard time filling open positions with younger employees
who find it difficult to navigate job ads and selection
processes, and fear that once hired, the opportunity for
creativity and freedom is small. Sacramento has the fourth
fastest aging workforce in the nation.
Compensation In the January issue we reported that more than 75% of
employees view their pay and benefits positively. It remains
to be seen whether this sentiment will hold for our 2018
data collection as 2018 salary predictions remain modest
with an increase of about 3.2% nationally, although this
is slightly up from 2017 (3.1% increase) and 2016 (3.0%
increase). This may be surprising given the resurgence
of the global economy and anticipation of an expanding
U.S. economy due to expected eased fiscal policies at the
national level (SHRM).

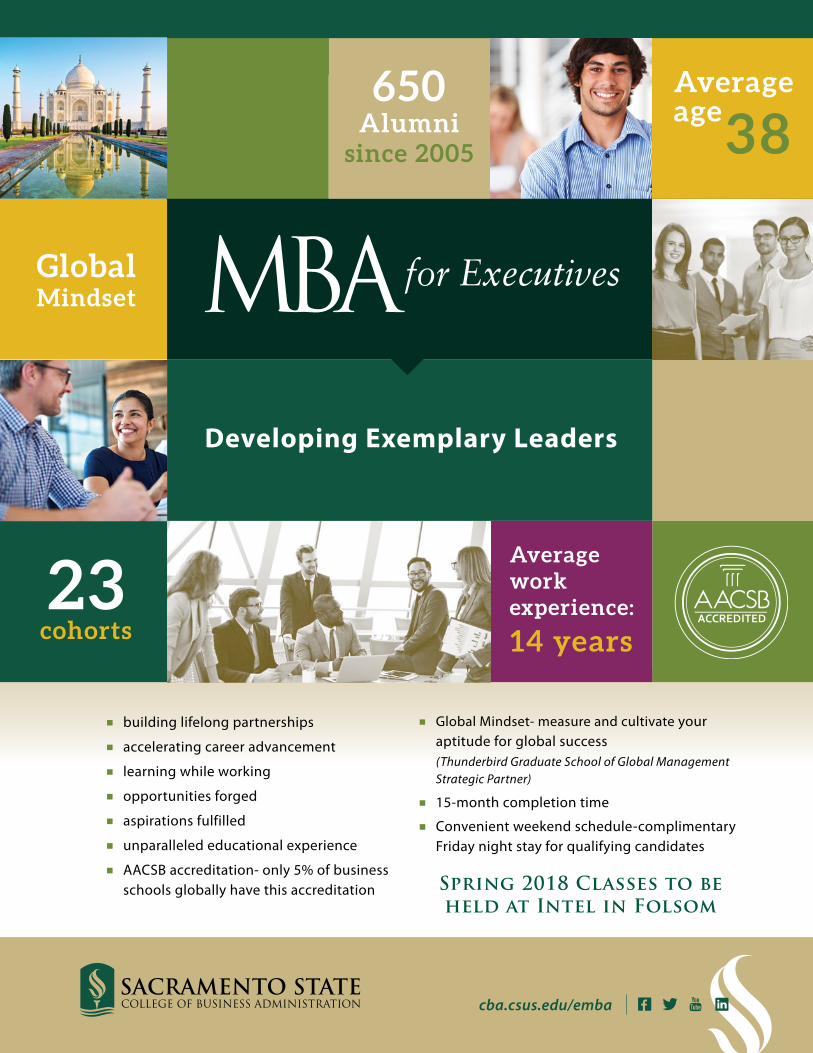
Spring 2018 Classes to be held at Intel in Folsom
23 cohorts
650Alumni
since 2005
Average work experience:
14 years
Global Mindset
Averageage
38
Developing Exemplary Leaders
cba.csus.edu/emba
n building lifelong partnerships
n accelerating career advancement
n learning while working
n opportunities forged
n aspirations fulfilled
n unparalleled educational experience
n AACSB accreditation- only 5% of business schools globally have this accreditation
n Global Mindset- measure and cultivate your aptitude for global success
(Thunderbird Graduate School of Global Management Strategic Partner)
n 15-month completion time
n Convenient weekend schedule-complimentary Friday night stay for qualifying candidates


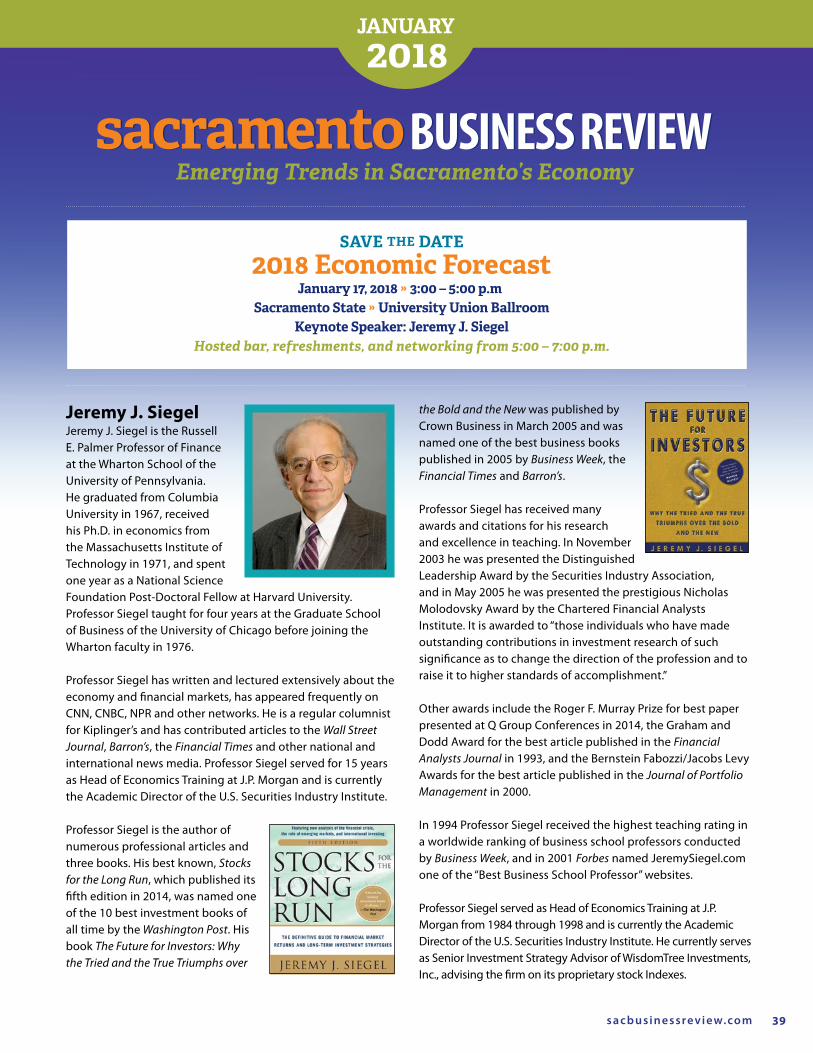
s a c b u s i n e s s rev i ew. co m 39
JANUARY
Emerging Trends in Sacramento’s Economy
Jeremy J. SiegelJeremy J. Siegel is the Russell E. Palmer Professor of Finance at the Wharton School of the University of Pennsylvania. He graduated from Columbia University in 1967, received his Ph.D. in economics from the Massachusetts Institute of Technology in 1971, and spent one year as a National Science Foundation Post-Doctoral Fellow at Harvard University. Professor Siegel taught for four years at the Graduate School of Business of the University of Chicago before joining the Wharton faculty in 1976.
Professor Siegel has written and lectured extensively about the economy and financial markets, has appeared frequently on CNN, CNBC, NPR and other networks. He is a regular columnist for Kiplinger’s and has contributed articles to the Wall Street Journal, Barron’s, the Financial Times and other national and international news media. Professor Siegel served for 15 years as Head of Economics Training at J.P. Morgan and is currently the Academic Director of the U.S. Securities Industry Institute.
Professor Siegel is the author of numerous professional articles and three books. His best known, Stocks for the Long Run, which published its fifth edition in 2014, was named one of the 10 best investment books of all time by the Washington Post. His book The Future for Investors: Why the Tried and the True Triumphs over
the Bold and the New was published by Crown Business in March 2005 and was named one of the best business books published in 2005 by Business Week, the Financial Times and Barron’s.
Professor Siegel has received many awards and citations for his research and excellence in teaching. In November 2003 he was presented the Distinguished Leadership Award by the Securities Industry Association, and in May 2005 he was presented the prestigious Nicholas Molodovsky Award by the Chartered Financial Analysts Institute. It is awarded to “those individuals who have made outstanding contributions in investment research of such significance as to change the direction of the profession and to raise it to higher standards of accomplishment.”
Other awards include the Roger F. Murray Prize for best paper presented at Q Group Conferences in 2014, the Graham and Dodd Award for the best article published in the FinancialAnalysts Journal in 1993, and the Bernstein Fabozzi/Jacobs Levy Awards for the best article published in the Journal of Portfolio Management in 2000.
In 1994 Professor Siegel received the highest teaching rating in a worldwide ranking of business school professors conducted by Business Week, and in 2001 Forbes named JeremySiegel.com one of the “Best Business School Professor” websites.
Professor Siegel served as Head of Economics Training at J.P. Morgan from 1984 through 1998 and is currently the Academic Director of the U.S. Securities Industry Institute. He currently serves as Senior Investment Strategy Advisor of WisdomTree Investments, Inc., advising the firm on its proprietary stock Indexes.
SAVE THE DATE
2018 Economic ForecastJanuary 17, 2018 » 3:00 – 5:00 p.m.
Sacramento State » University Union BallroomKeynote Speaker: Jeremy J. Siegel
Hosted bar, refreshments, and networking from 5:00 – 7:00 p.m.