Embed Size (px)
Citation preview
EMERGING SKILLS SUMMIT 2020 AND BEYOND
A Critical National Challenge
““SUSTAINABILITY OF THE MINERALS SUSTAINABILITY OF THE MINERALS SECTOR IN AUSTRALIA, SKILLS NEEDS SECTOR IN AUSTRALIA, SKILLS NEEDS
IN A GLOBAL INDUSTRYIN A GLOBAL INDUSTRY””
Don Larkin, CEO, The AusIMM
Tuesday 22 November 2005, Sydney NSW
“DISCIPLINE AREAS OF NATIONAL IMPORTANCE WILL BE PROTECTED WHERE
THEY ARE OF CONTINUING RELEVANCE”
Draft National Strategic Principles for Higher Draft National Strategic Principles for Higher Education – September 2006 Education – September 2006
Department of Education, Science and TrainingDepartment of Education, Science and Training

TODAY’S PRESENTATION
• Profile of the Minerals Sector – National Importance
• Human Capital Availability and Changing Structure of Workforce
• The Minerals Sector and Human Capital
• Implications
• Suggestions to Address Skills Shortages

PROFILE OF THE MINERALS SECTOR
• Global Industry – Global OptionsGlobal Industry – Global Options
• Cyclical Industry – Currently BuoyantCyclical Industry – Currently Buoyant
• Centralisation of Ownership with World Wide Centralisation of Ownership with World Wide Commodity GroupsCommodity Groups
• Emerging Sources of Supply – Increasing Emerging Sources of Supply – Increasing CompetitionCompetition
• Increasing Demand from China, India, AsiaIncreasing Demand from China, India, Asia
• Corporate and Social Responsibility – High on the Corporate and Social Responsibility – High on the AgendaAgenda
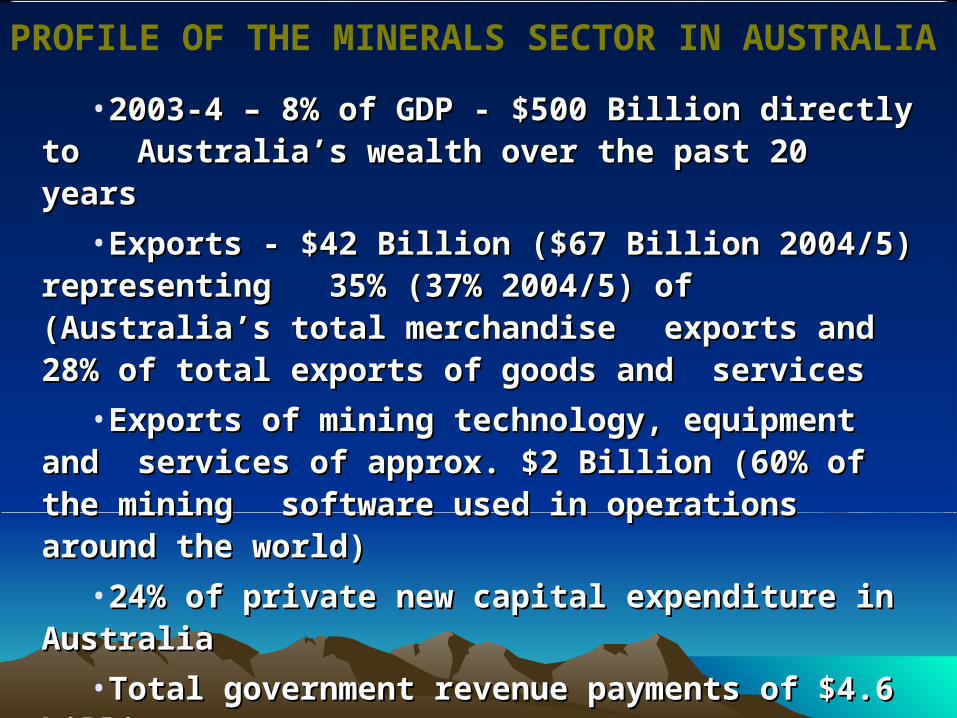
PROFILE OF THE MINERALS SECTOR IN AUSTRALIA
•2003-4 – 8% of GDP - $500 Billion directly to 2003-4 – 8% of GDP - $500 Billion directly to Australia’s wealth over the past 20 yearsAustralia’s wealth over the past 20 years
•Exports - $42 Billion ($67 Billion 2004/5) representing Exports - $42 Billion ($67 Billion 2004/5) representing 35% (37% 2004/5) of (Australia’s total merchandise 35% (37% 2004/5) of (Australia’s total merchandise
exports and 28% of total exports of goods and exports and 28% of total exports of goods and servicesservices
•Exports of mining technology, equipment and Exports of mining technology, equipment and services of approx. $2 Billion (60% of the mining services of approx. $2 Billion (60% of the mining software used in operations around the world)software used in operations around the world)
•24% of private new capital expenditure in Australia24% of private new capital expenditure in Australia
•Total government revenue payments of $4.6 billionTotal government revenue payments of $4.6 billion
•Significant infrastructure development – since Significant infrastructure development – since 1967 – 1967 – built 26 towns, 17 ports, 26 airfields and over built 26 towns, 17 ports, 26 airfields and over 2000 2000 km of railway line.km of railway line. Source: MCA Annual Report 2004
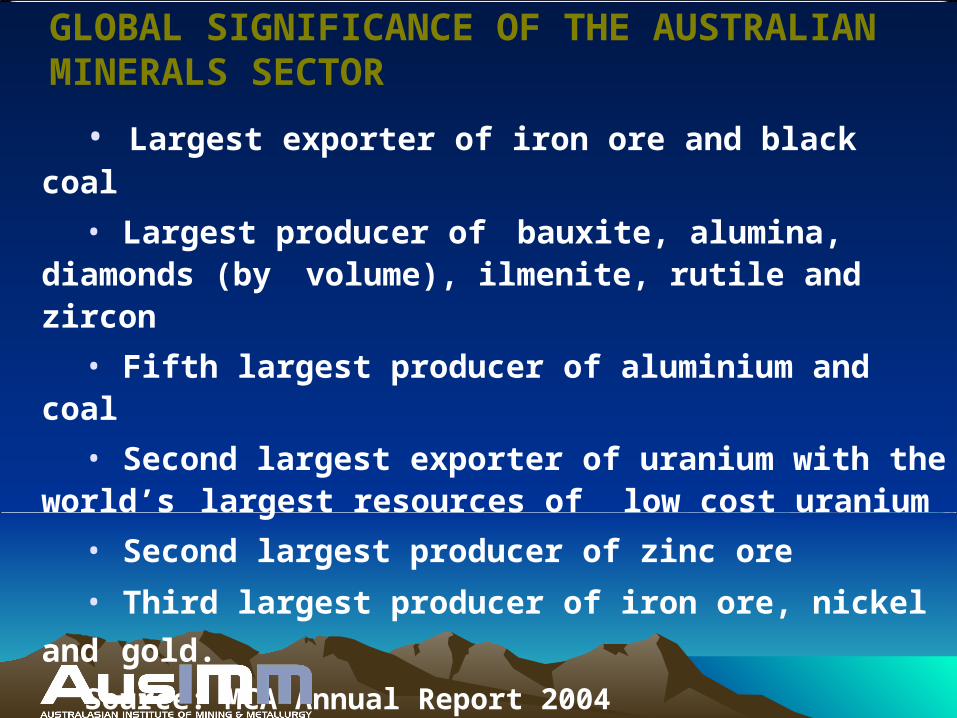
GLOBAL SIGNIFICANCE OF THE AUSTRALIAN MINERALS SECTOR
• Largest exporter of iron ore and black coal
• Largest producer of bauxite, alumina, diamonds (by volume), ilmenite, rutile and zircon
• Fifth largest producer of aluminium and coal
• Second largest exporter of uranium with the world’s largest resources of low cost uranium
• Second largest producer of zinc ore
• Third largest producer of iron ore, nickel and gold.
Source: MCA Annual Report 2004
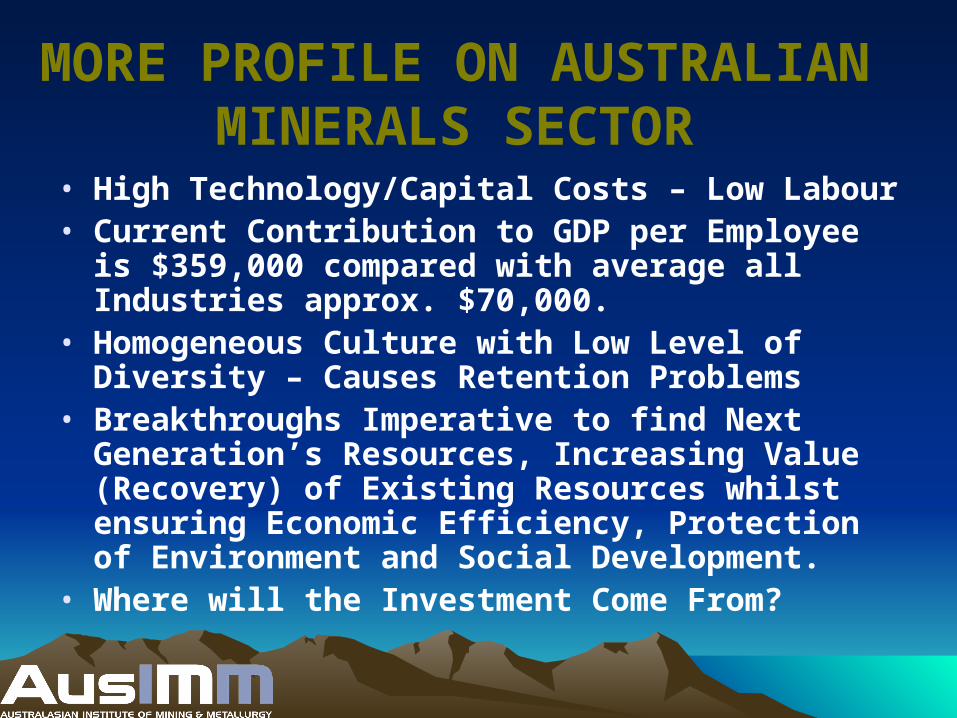
MORE PROFILE ON AUSTRALIAN MINERALS SECTOR
• High Technology/Capital Costs – Low Labour• Current Contribution to GDP per Employee is
$359,000 compared with average all Industries approx. $70,000.
• Homogeneous Culture with Low Level of Diversity – Causes Retention Problems
• Breakthroughs Imperative to find Next Generation’s Resources, Increasing Value (Recovery) of Existing Resources whilst ensuring Economic Efficiency, Protection of Environment and Social Development.
• Where will the Investment Come From?
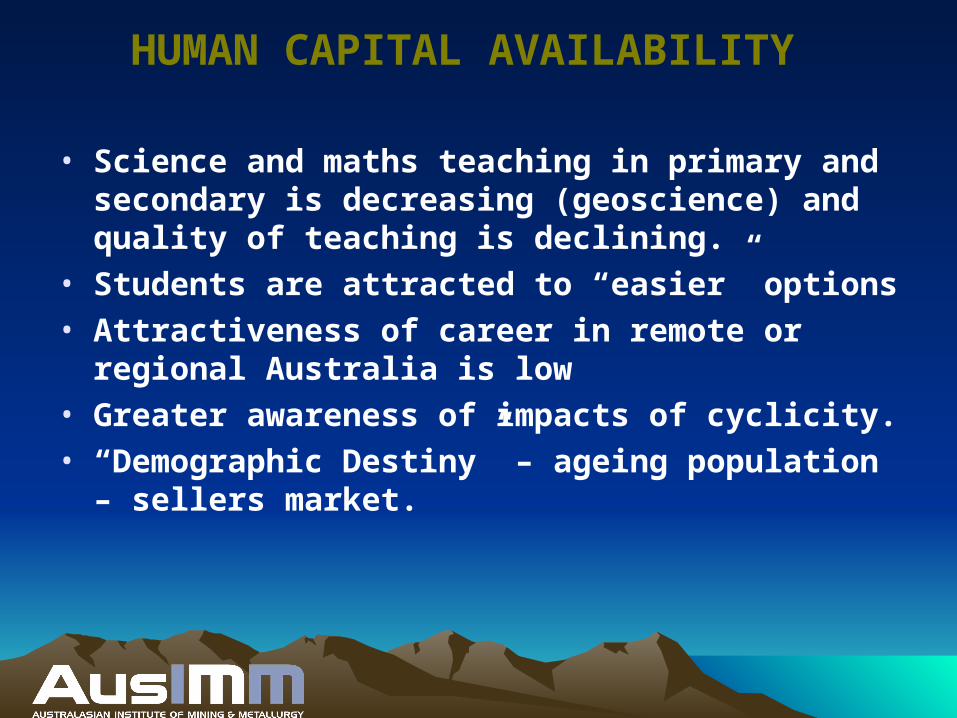
HUMAN CAPITAL AVAILABILITY
• Science and maths teaching in primary and secondary is decreasing (geoscience) and quality of teaching is declining.
• Students are attracted to “easier” options• Attractiveness of career in remote or regional
Australia is low• Greater awareness of impacts of cyclicity.• “Demographic Destiny” – ageing population –
sellers market.
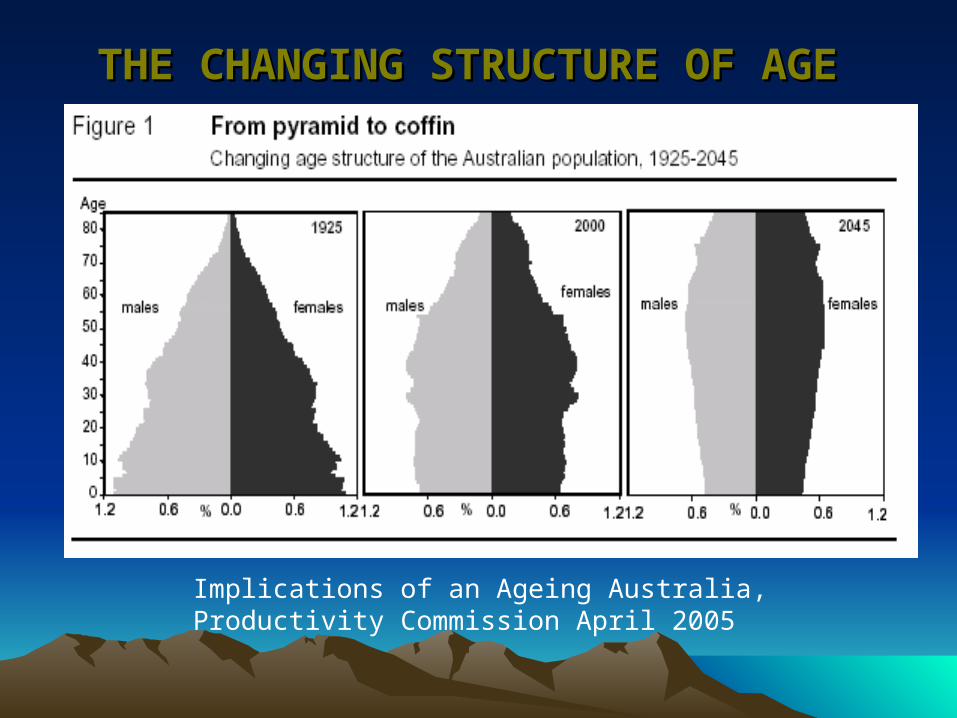
Implications of an Ageing Australia, Productivity Commission April 2005
THE CHANGING STRUCTURE OF AGETHE CHANGING STRUCTURE OF AGE

Successfully Managing Age in your Organisation
As the population ages a fault line is emerging that separates the past
and future landscapes of the Australian workforce. For the foreseeable
future, growth in the supply of labour will be firmly concentrated in the
group aged 45 years and over.
For every new young person entering the labour market today, there
are seven people aged 45 years and over available. By 2010 this will
create permanent shortages in the Australian Labour Market forcing
organisations to dramatically re-think their employment practices.
The Age Chasm – Drake White Paper Volume 2, No. 5
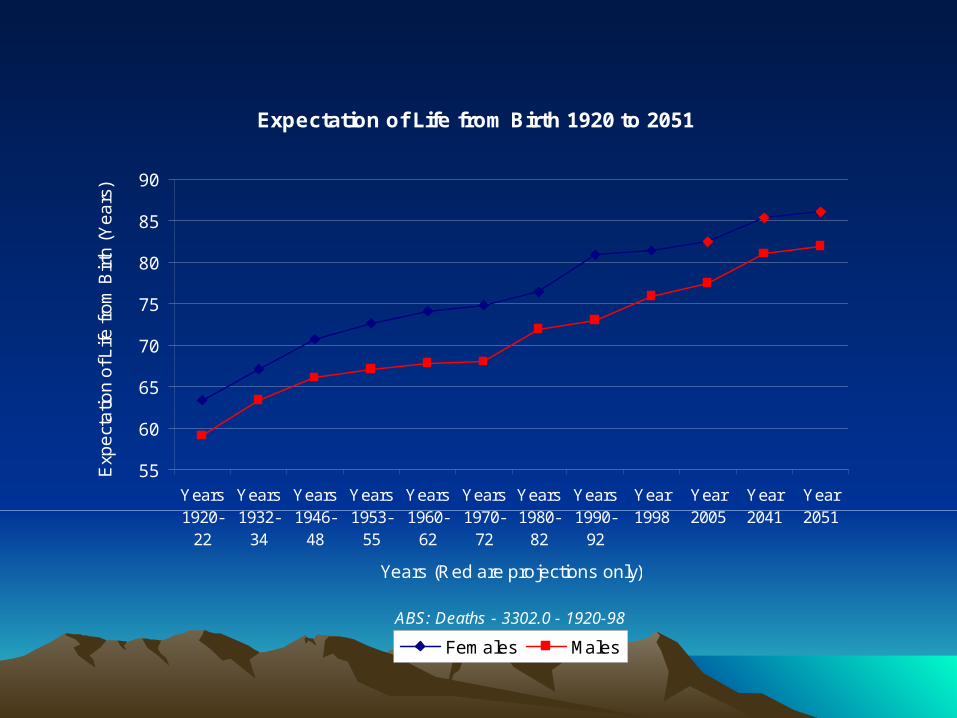
Expectation of Life from Birth 1920 to 2051
55
60
65
70
75
80
85
90
Years1920-
22
Years1932-
34
Years1946-
48
Years1953-
55
Years1960-
62
Years1970-
72
Years1980-
82
Years1990-
92
Year1998
Year2005
Year2041
Year2051
Years (Red are projections only)
ABS: Deaths - 3302.0 - 1920-98
Exp
ect
atio
n o
f Life
fro
m B
irth
(Y
ea
rs)
Females Males

Fertility Rates within Australia - 1921 to 2051
1.5
1.8
2.1
2.4
2.7
3
3.3
3.6
Years1921-
25
Years1932-
34
Years1946-
48
Years1953-
55
Years1960-
62
Years1970-
72
Years1980-
82
Years1990-
92
Year1998
Year2005
Year2006-
51
Years (Red are projections only)
ABS: Births - 3301.0 - 1998
Fe
rtili
ty R
ate
s

New entrants to the labour marketNew entrants to the labour marketDiminishing Access to LabourDiminishing Access to Labour
1980’s & 1990’s
2020’s and beyond
Access Economics
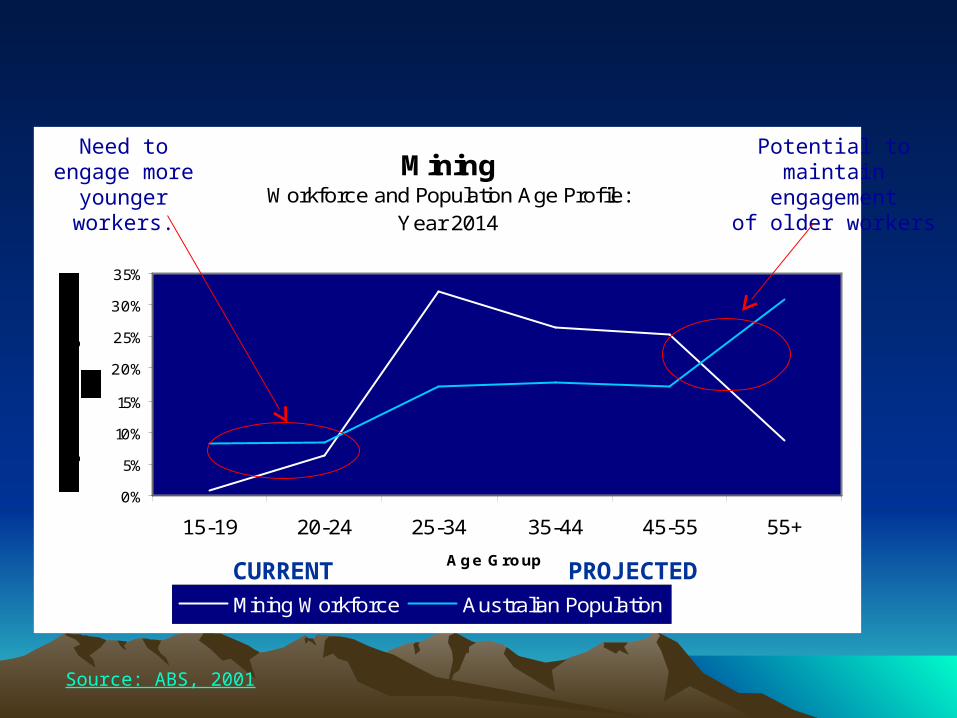
Mining
Workforce and Population Age Profile: Year 2014
0%
5%
10%
15%
20%
25%
30%
35%
15-19 20-24 25-34 35-44 45-55 55+
Age Group
Mining Workforce Australian Population
Potential to maintain engagement
of older workers
Need to engage more younger
workers.
Source: ABS, 2001
CURRENT PROJECTED
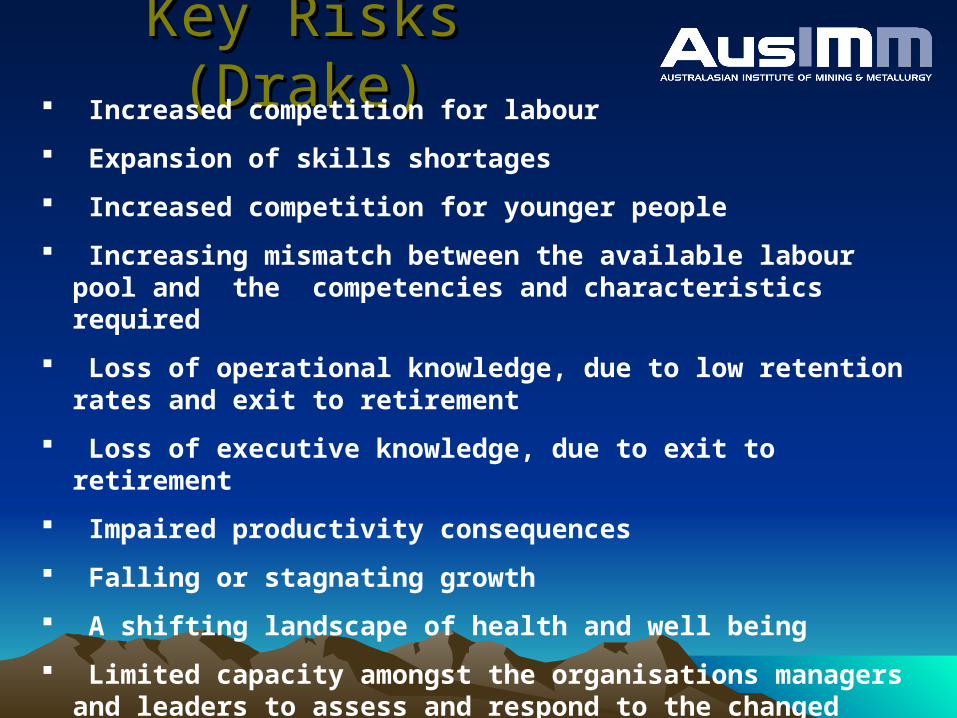
Key Risks (Drake)Key Risks (Drake) Increased competition for labour
Expansion of skills shortages
Increased competition for younger people
Increasing mismatch between the available labour pool and the competencies and characteristics required
Loss of operational knowledge, due to low retention rates and exit to retirement
Loss of executive knowledge, due to exit to retirement
Impaired productivity consequences
Falling or stagnating growth
A shifting landscape of health and well being
Limited capacity amongst the organisations managers and leaders to assess and respond to the changed environment
FINALLY
From The AusIMM’s point of view
Seize the Opportunity in Tertiary Education by Focusing on Discipline Areas of National Importance as Outlined in the National Strategic Principles for Higher Education to Ensure the Sustainability of the Minerals Sector in Australia by Backing a Winner and this does Require Some Interventions.

www.ausimm.comwww.ausimm.com