Embed Size (px)
Citation preview
Emerging Markets Leaders Fund
Quarterly Review December 2017
Todd M. McClone, CFA, Partner Jack Murphy, CFA, Partner Jeffrey A. Urbina, CFA, Partner Portfolio Managers
6588175
William Blair Emerging Markets Leaders Fund Important Disclosures December 2017 Risks: The views expressed in this report and the information about the holdings are as of the date of this material, unless otherwise noted, and are subject to change. Information about the Fund’s holdings should not be considered investment advice. There is no guarantee that the Fund will continue to hold any one particular security or stay invested in any one particular sector. Holdings are subject to change at any time. The Fund involves a high level of risk and may not be appropriate for everyone. You should only consider it for the aggressive portion of your portfolio. The Fund’s returns will vary, and you could lose money by investing in the Fund. The Fund holds equities which may decline in value due to both real and perceived general market, economic, and industry conditions. Investing in securities of smaller companies tends to be more volatile and less liquid than securities of larger companies. International investing involves special risk considerations, including currency fluctuations, higher volatility, lower liquidity, economic and political risk. Investing in emerging markets can increase these risks. The securities of emerging market companies may be subject to greater volatility and less liquidity than companies in more developed markets. Individual securities may not perform as expected or a strategy used by the Adviser may fail to produce its intended result. Currency rates may fluctuate significantly over short periods of time and may reduce the returns of a portfolio. Convertible securities may be called before intended, which may have an adverse effect on investment objectives. Performance cited represents past performance. Past Performance does not guarantee future results and current performance may be lower or higher than the data quoted. Results shown are average annual returns, which assume reinvestment of dividends and capital gains. Investment returns and principal will fluctuate with market and economic conditions and you may have a gain or loss when you sell shares. For the most current month end performance information, please call 1‐877‐962‐5247, or visit our Web site at www.williamblairfunds.com. Class N shares are available to the general public without a sales load. Class I Shares are available only to investors who meet certain eligibility requirements. This content is for informational and educational purposes only and is not intended as investment advice or a recommendation to buy or sell any security. Investment advice and recommendations can be provided only after careful consideration of an investor’s objectives, guidelines and restrictions. Investing includes the risk of loss. Please carefully consider the Fund's investment objective, risks, charges, and expenses before investing. This and other information is contained in the Fund's prospectus, which you may obtain by calling 1-800-742-7272. Read it carefully before you invest or send money. Copyright © 2018 William Blair & Company, L.L.C. “William Blair” is a registered trademark of William Blair & Company, L.L.C. Distributed by William Blair & Company, L.L.C., member FINRA/SIPC
2 6588175
William Blair Emerging Markets Leaders Fund Summary December 2017 Market Commentary & Outlook The 2017 market environment was characterized by strong and accelerating global economic growth. The broadening nature of growth was particularly noteworthy, as evidenced by strengthening industrial production volumes across the world. Corporate earnings results were bolstered by the expanding economic environment, providing a tailwind for investors. Beyond improving corporate performance, major national elections, especially in Europe, produced outcomes favorable for continued growth. Risk assets led the markets in 2017. Emerging markets—which received oxygen from a weak U.S. dollar—performed the strongest, returning 36.8% in USD terms, as measured by the MSCI EM IMI. Developed markets also performed well, advancing 22.4% for the year (MSCI World IMI). China (+50.7%) drove emerging markets’ performance to a significant extent, with additional contributions from South Korea (+46.0%), India (+43.7%), Poland (+53.6%), Chile (+43.3%) and South Africa (+34.0%)—illustrating the breadth of gains across the EM landscape. From a global sector perspective, technology led by a significant margin in 2017, advancing 41.0% for the year (as measured by MSCI ACWI IMI), far outpacing the second best performer, materials, which gained 29.3%. Within technology, the software and services industry returned 42.2%, followed by semiconductors and equipment (+42.0%) and technology hardware and equipment (+37.8%). In contrast, energy (+5.2%) and telecom (+8.2%) were the worst performing sectors for the year. The performance of William Blair’s proprietary quantitative models demonstrated that momentum, earnings trend and growth style factors outperformed during 2017, while fundamental volatility, quality and valuation factors underperformed. These style trends were more pronounced within emerging markets.
As we discussed in our recent Global Market Outlook paper1, underpinning 2017 performance was a broadening of growth in both developed and emerging markets, which we have not seen in more than a decade. As growth broadened, it also strengthened. Year-over-year growth in industrial production volumes, a proxy for growth, ranged from 3% in the United States to 8% in Brazil. When global growth drives expansion, it shows up in corporate earnings. In 2017, returns were driven predominantly by corporate earnings growth as opposed to price-to-earnings multiple expansion. That is not to say that multiple expansion was completely absent. Delving deeper into the sectoral composition of returns, Europe and the United States benefited from P/E expansion during the year, which we would expect in response to stronger growth performance. The synchronized global recovery is well understood, and global growth remains firm. For us, though, it is important to understand the nature of the cycle and how far we are into it. The low-volatility regimes we have experienced in the equity and fixed-income markets carry potential risks. When change comes, it will likely be difficult, because we have been shielded from natural cyclical behavior—from negative economic and market forces—for some time. Sudden inflationary pressures and wage growth acceleration would likely alter investor return expectations, driving bond yields and volatility materially higher, while potentially triggering equity-leadership rotation both across and within sectors. Financials would be expected to benefit from higher rates, for example, but increased caution would be warranted for financially-leveraged companies. We want to be mindful of this. Reflecting on some of the preeminent growth themes of 2017, including technology and the rise of innovation in China, we are optimistic. Despite the growing likelihood of a cyclical slowdown 1 https://www.williamblair.com/en/Research-and-Insights/Insights/Institutional-White-Paper/2017/Global-Market-Outlook-for-2018.aspx
3 6588175
William Blair Emerging Markets Leaders Fund Summary December 2017 within the technology sector, we believe that strong secular growth will continue. From a geographic perspective, we believe that emerging markets continue to offer attractive investment opportunities heading into 2018. In particular, there are abundant opportunities to invest in China’s growth, but we are mindful of the significant share-price gains in 2017 from the perspective of near-term momentum reversal risk. Performance Fourth quarter underperformance of the Emerging Markets Leaders Fund (Class N) versus the MSCI Emerging Markets (net) was primarily driven by negative stock selection across most sectors. Within the Telecommunication Services sector, Bharti Infratel Ltd and Telekomunikasi Indonesia Persero (Telekom Indo) weighed on relative returns. After jumping on speculation of a buyout by private equity and sovereign wealth funds, the shares of Bharti Infratel, the Indian wireless towers operator, declined on the back of disappointing 2QFY18 operating results and the sale of a $508 million stake by Bharti Airtel. Telekom Indo stock weakness was driven by investor concerns over increased competition and the impact of the company’s mobile segment slowdown on operating performance. In addition, Emaar Properties in the Real Estate sector was an additional source of underperformance. The UAE–based property developer and hospitality manager’s share price declined after its special dividend fell short of market expectations. Partially offsetting these negative effects were the underweight allocations in the Telecommunication Services and Real Estate sectors as well as positive stock selection in the Industrials sector. Within the Industrials sector, Bidvest Group contributed
positively to relative results. Share price strength for the South African conglomerate was underpinned by accelerating operating trends amid strong management execution and acquisitions that were positively received by investors. Calendar year 2017 outperformance of the Emerging Markets Leaders Fund (Class N) versus the MSCI Emerging Markets (net) was driven by a combination of selection and allocation effects. Financials stock selection was particularly beneficial, bolstered by China-based Ping An Insurance. Driving the share price was strong premium growth in the life and property & casualty segments. Ping An’s management was also optimistic on the outlook for the key Value of New Business metric—guiding for 20-30% growth in 2018. Sociedad Quimica y Minera de Chile (SQM) and Maruti Suzuki India in the Materials and Consumer Discretionary sectors were additional sources of outperformance. Chile-based lithium and agricultural chemicals producer SQM’s share price was supported by rising demand and prices for lithium, which is used in rechargeable vehicle and smartphone batteries. Maruti Suzuki’s share price benefited from solid financial results amid healthy demand for the company’s passenger cars in India. Maruti’s competitive advantages include deep reaching distribution and a premiumization strategy that has driven market share gains. Partially offsetting these positive effects were negative stock selection in the Real Estate and Telecommunication Services sectors as well as the overweight allocation in Brazil. Within the Real Estate sector, Emaar Properties detracted from relative returns. The UAE-based property developer and hospital manager’s share price was adversely impacted by its special dividend announced in December which fell short of investor expectations. Management cited the need to preserve liquidity in light of ongoing development of large scale projects.
4 6588175
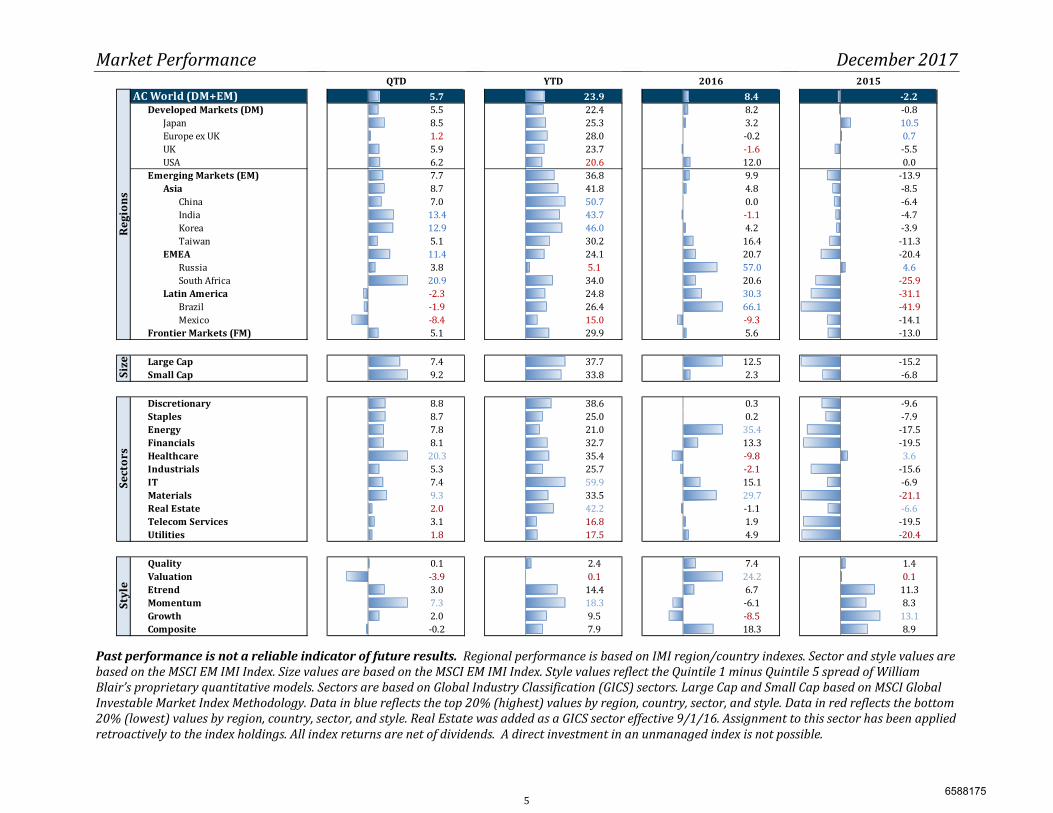
Market Performance December 2017
AC World (DM+EM) 5.7 23.9 8.4 -2.2Developed Markets (DM) 5.5 22.4 8.2 -0.8Japan 8.5 25.3 3.2 10.5Europe ex UK 1.2 28.0 -0.2 0.7UK 5.9 23.7 -1.6 -5.5USA 6.2 20.6 12.0 0.0Emerging Markets (EM) 7.7 36.8 9.9 -13.9
Asia 8.7 41.8 4.8 -8.5China 7.0 50.7 0.0 -6.4India 13.4 43.7 -1.1 -4.7Korea 12.9 46.0 4.2 -3.9Taiwan 5.1 30.2 16.4 -11.3EMEA 11.4 24.1 20.7 -20.4Russia 3.8 5.1 57.0 4.6South Africa 20.9 34.0 20.6 -25.9Latin America -2.3 24.8 30.3 -31.1Brazil -1.9 26.4 66.1 -41.9Mexico -8.4 15.0 -9.3 -14.1
Frontier Markets (FM) 5.1 29.9 5.6 -13.0Large Cap 7.4 37.7 12.5 -15.2Small Cap 9.2 33.8 2.3 -6.8Discretionary 8.8 38.6 0.3 -9.6Staples 8.7 25.0 0.2 -7.9Energy 7.8 21.0 35.4 -17.5Financials 8.1 32.7 13.3 -19.5Healthcare 20.3 35.4 -9.8 3.6Industrials 5.3 25.7 -2.1 -15.6IT 7.4 59.9 15.1 -6.9Materials 9.3 33.5 29.7 -21.1Real Estate 2.0 42.2 -1.1 -6.6Telecom Services 3.1 16.8 1.9 -19.5Utilities 1.8 17.5 4.9 -20.4Quality 0.1 2.4 7.4 1.4Valuation -3.9 0.1 24.2 0.1Etrend 3.0 14.4 6.7 11.3Momentum 7.3 18.3 -6.1 8.3Growth 2.0 9.5 -8.5 13.1Composite -0.2 7.9 18.3 8.9
QTD 2015
Regi
ons
YTD 2016
Size
Sect
ors
Styl
e
Past performance is not a reliable indicator of future results. Regional performance is based on IMI region/country indexes. Sector and style values are based on the MSCI EM IMI Index. Size values are based on the MSCI EM IMI Index. Style values reflect the Quintile 1 minus Quintile 5 spread of William Blair’s proprietary quantitative models. Sectors are based on Global Industry Classification (GICS) sectors. Large Cap and Small Cap based on MSCI Global Investable Market Index Methodology. Data in blue reflects the top 20% (highest) values by region, country, sector, and style. Data in red reflects the bottom 20% (lowest) values by region, country, sector, and style. Real Estate was added as a GICS sector effective 9/1/16. Assignment to this sector has been applied retroactively to the index holdings. All index returns are net of dividends. A direct investment in an unmanaged index is not possible.
5 6588175
William Blair Emerging Markets Leaders Fund Performance December 2017
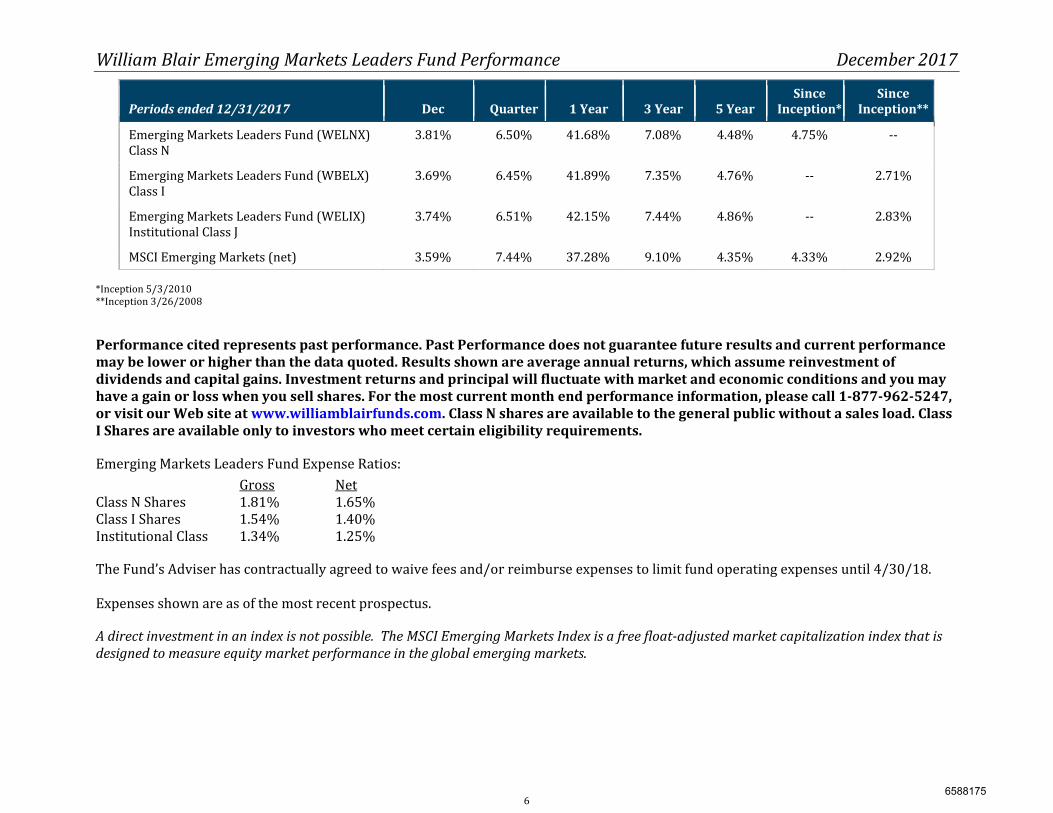
Periods ended 12/31/2017 Dec Quarter 1 Year 3 Year 5 Year
Since Inception*
Since Inception**Emerging Markets Leaders Fund (WELNX) Class N 3.81% 6.50% 41.68% 7.08% 4.48% 4.75% --
Emerging Markets Leaders Fund (WBELX) Class I 3.69% 6.45% 41.89% 7.35% 4.76% -- 2.71%Emerging Markets Leaders Fund (WELIX)Institutional Class J 3.74% 6.51% 42.15% 7.44% 4.86% -- 2.83%MSCI Emerging Markets (net) 3.59% 7.44% 37.28% 9.10% 4.35% 4.33% 2.92% *Inception 5/3/2010 **Inception 3/26/2008
Performance cited represents past performance. Past Performance does not guarantee future results and current performance may be lower or higher than the data quoted. Results shown are average annual returns, which assume reinvestment of dividends and capital gains. Investment returns and principal will fluctuate with market and economic conditions and you may have a gain or loss when you sell shares. For the most current month end performance information, please call 1-877-962-5247, or visit our Web site at www.williamblairfunds.com. Class N shares are available to the general public without a sales load. Class I Shares are available only to investors who meet certain eligibility requirements. Emerging Markets Leaders Fund Expense Ratios: Gross Net Class N Shares 1.81% 1.65% Class I Shares 1.54% 1.40% Institutional Class 1.34% 1.25% The Fund’s Adviser has contractually agreed to waive fees and/or reimburse expenses to limit fund operating expenses until 4/30/18. Expenses shown are as of the most recent prospectus. A direct investment in an index is not possible. The MSCI Emerging Markets Index is a free float-adjusted market capitalization index that is designed to measure equity market performance in the global emerging markets.
6 6588175
William Blair Emerging Markets Leaders Fund Performance Analysis (by sector) December 2017
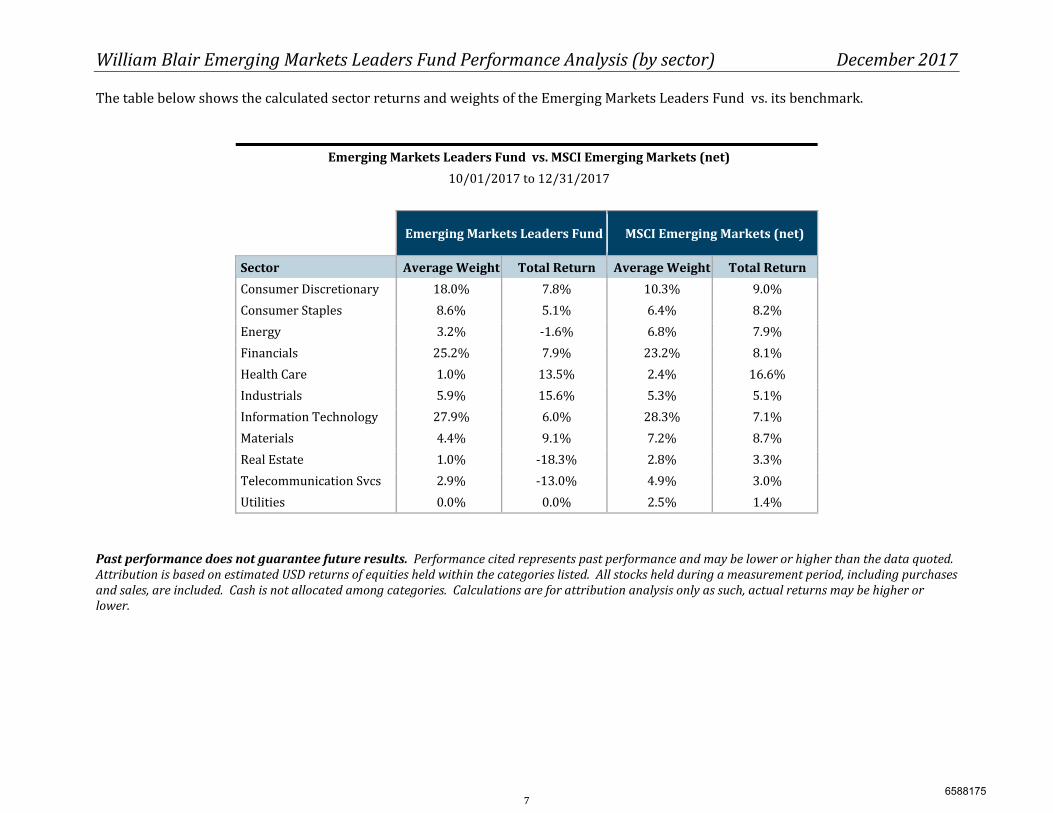
The table below shows the calculated sector returns and weights of the Emerging Markets Leaders Fund vs. its benchmark. Emerging Markets Leaders Fund vs. MSCI Emerging Markets (net)10/01/2017 to 12/31/2017 Emerging Markets Leaders Fund MSCI Emerging Markets (net)
Sector Average Weight Total Return Average Weight Total ReturnConsumer Discretionary 18.0% 7.8% 10.3% 9.0%Consumer Staples 8.6% 5.1% 6.4% 8.2%Energy 3.2% -1.6% 6.8% 7.9%Financials 25.2% 7.9% 23.2% 8.1%Health Care 1.0% 13.5% 2.4% 16.6%Industrials 5.9% 15.6% 5.3% 5.1%Information Technology 27.9% 6.0% 28.3% 7.1%Materials 4.4% 9.1% 7.2% 8.7%Real Estate 1.0% -18.3% 2.8% 3.3%Telecommunication Svcs 2.9% -13.0% 4.9% 3.0%Utilities 0.0% 0.0% 2.5% 1.4% Past performance does not guarantee future results. Performance cited represents past performance and may be lower or higher than the data quoted. Attribution is based on estimated USD returns of equities held within the categories listed. All stocks held during a measurement period, including purchases and sales, are included. Cash is not allocated among categories. Calculations are for attribution analysis only as such, actual returns may be higher or lower.
7 6588175
William Blair Emerging Markets Leaders Fund Performance Analysis (by region) December 2017
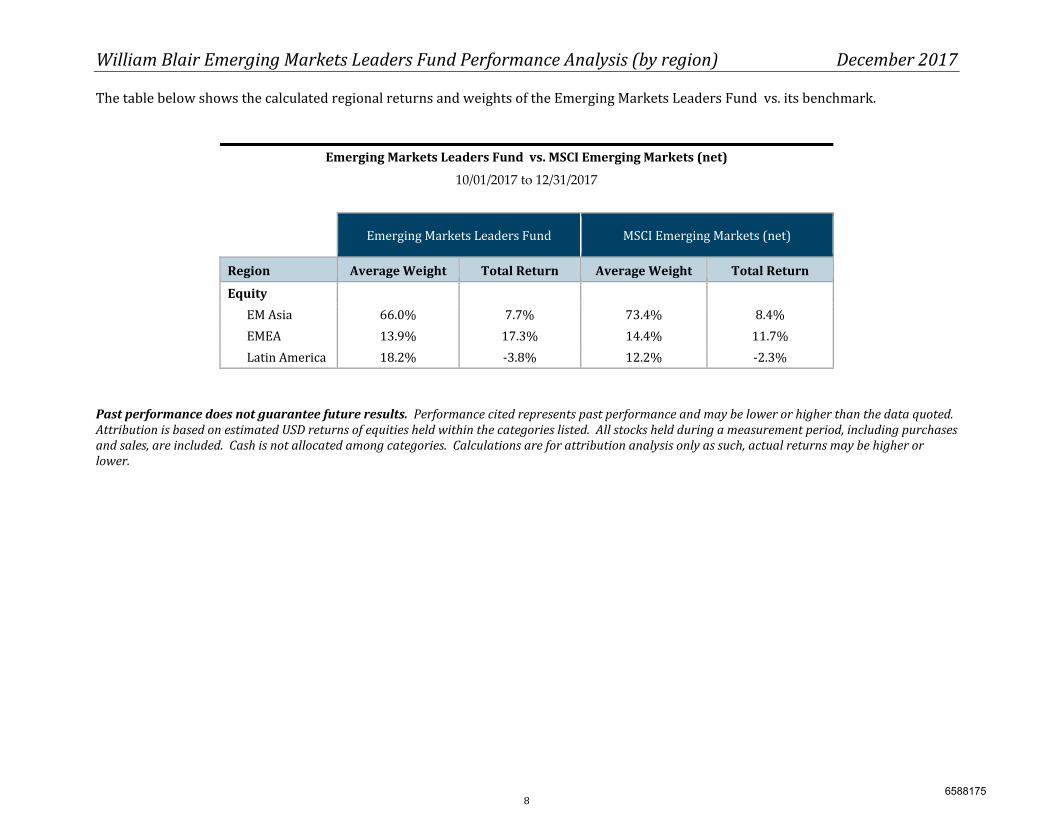
The table below shows the calculated regional returns and weights of the Emerging Markets Leaders Fund vs. its benchmark.
Emerging Markets Leaders Fund vs. MSCI Emerging Markets (net)
10/01/2017 to 12/31/2017 Emerging Markets Leaders Fund MSCI Emerging Markets (net)
Region Average Weight Total Return Average Weight Total Return
Equity EM Asia 66.0% 7.7% 73.4% 8.4%EMEA 13.9% 17.3% 14.4% 11.7%Latin America 18.2% -3.8% 12.2% -2.3% Past performance does not guarantee future results. Performance cited represents past performance and may be lower or higher than the data quoted. Attribution is based on estimated USD returns of equities held within the categories listed. All stocks held during a measurement period, including purchases and sales, are included. Cash is not allocated among categories. Calculations are for attribution analysis only as such, actual returns may be higher or lower.
8 6588175
William Blair Emerging Markets Leaders Fund Top Holdings by Weight December 2017
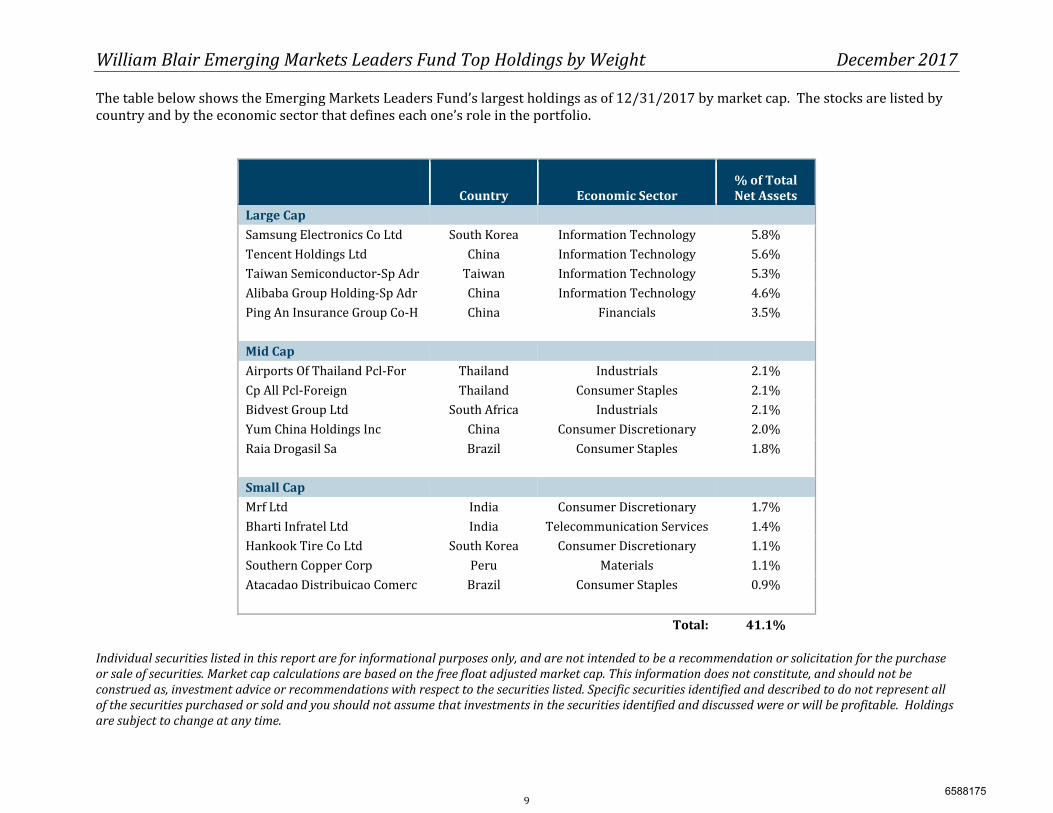
The table below shows the Emerging Markets Leaders Fund’s largest holdings as of 12/31/2017 by market cap. The stocks are listed by country and by the economic sector that defines each one’s role in the portfolio. Country Economic Sector
% of Total Net Assets
Large Cap Samsung Electronics Co Ltd South Korea Information Technology 5.8%Tencent Holdings Ltd China Information Technology 5.6%Taiwan Semiconductor-Sp Adr Taiwan Information Technology 5.3%Alibaba Group Holding-Sp Adr China Information Technology 4.6%Ping An Insurance Group Co-H China Financials 3.5% Mid Cap Airports Of Thailand Pcl-For Thailand Industrials 2.1%Cp All Pcl-Foreign Thailand Consumer Staples 2.1%Bidvest Group Ltd South Africa Industrials 2.1%Yum China Holdings Inc China Consumer Discretionary 2.0%Raia Drogasil Sa Brazil Consumer Staples 1.8% Small Cap Mrf Ltd India Consumer Discretionary 1.7%Bharti Infratel Ltd India Telecommunication Services 1.4%Hankook Tire Co Ltd South Korea Consumer Discretionary 1.1%Southern Copper Corp Peru Materials 1.1%Atacadao Distribuicao Comerc Brazil Consumer Staples 0.9% Total: 41.1%
Individual securities listed in this report are for informational purposes only, and are not intended to be a recommendation or solicitation for the purchase or sale of securities. Market cap calculations are based on the free float adjusted market cap. This information does not constitute, and should not be construed as, investment advice or recommendations with respect to the securities listed. Specific securities identified and described to do not represent all of the securities purchased or sold and you should not assume that investments in the securities identified and discussed were or will be profitable. Holdings are subject to change at any time.
9 6588175
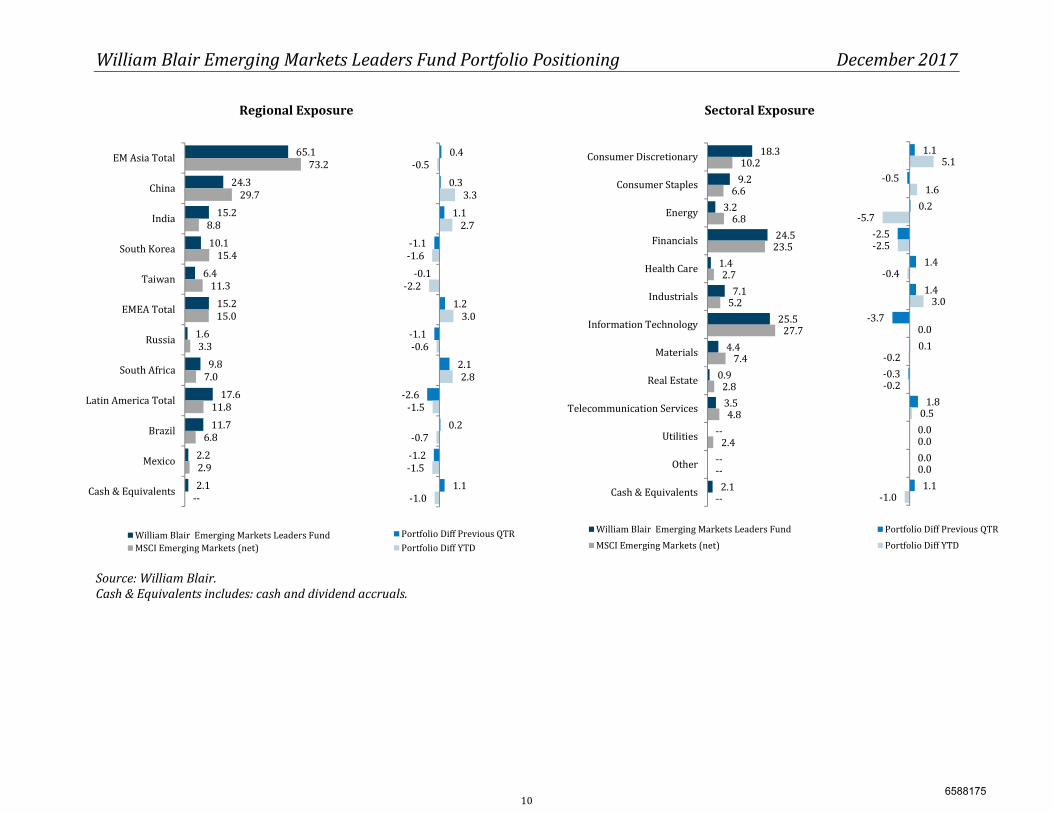
William Blair Emerging Markets Leaders Fund Portfolio Positioning December 2017
Regional Exposure Sectoral Exposure
65.124.3
15.210.1
6.415.2
1.69.8
17.611.7
2.22.1
73.229.7
8.815.4
11.315.0
3.37.0
11.86.8
2.9--
EM Asia TotalChinaIndia
South KoreaTaiwan
EMEA TotalRussia
South AfricaLatin America Total
BrazilMexico
Cash & EquivalentsWilliam Blair Emerging Markets Leaders FundMSCI Emerging Markets (net)
0.40.31.1
-1.1-0.1
1.2-1.1
2.1-2.6
0.2-1.2
1.1
-0.53.3
2.7-1.6
-2.23.0
-0.62.8
-1.5-0.7
-1.5-1.0
Portfolio Diff Previous QTRPortfolio Diff YTD
18.39.23.2 24.51.47.1 25.54.40.93.5----2.1
10.26.66.8 23.52.75.2 27.77.42.84.82.4----
Consumer DiscretionaryConsumer StaplesEnergyFinancialsHealth CareIndustrialsInformation TechnologyMaterialsReal EstateTelecommunication ServicesUtilitiesOtherCash & EquivalentsWilliam Blair Emerging Markets Leaders FundMSCI Emerging Markets (net)
1.1-0.5 0.2-2.5 1.41.4-3.7 0.1-0.3 1.80.00.01.1
5.11.6-5.7-2.5-0.4 3.00.0-0.2-0.2 0.50.00.0-1.0Portfolio Diff Previous QTRPortfolio Diff YTD
Source: William Blair. Cash & Equivalents includes: cash and dividend accruals.
10 6588175
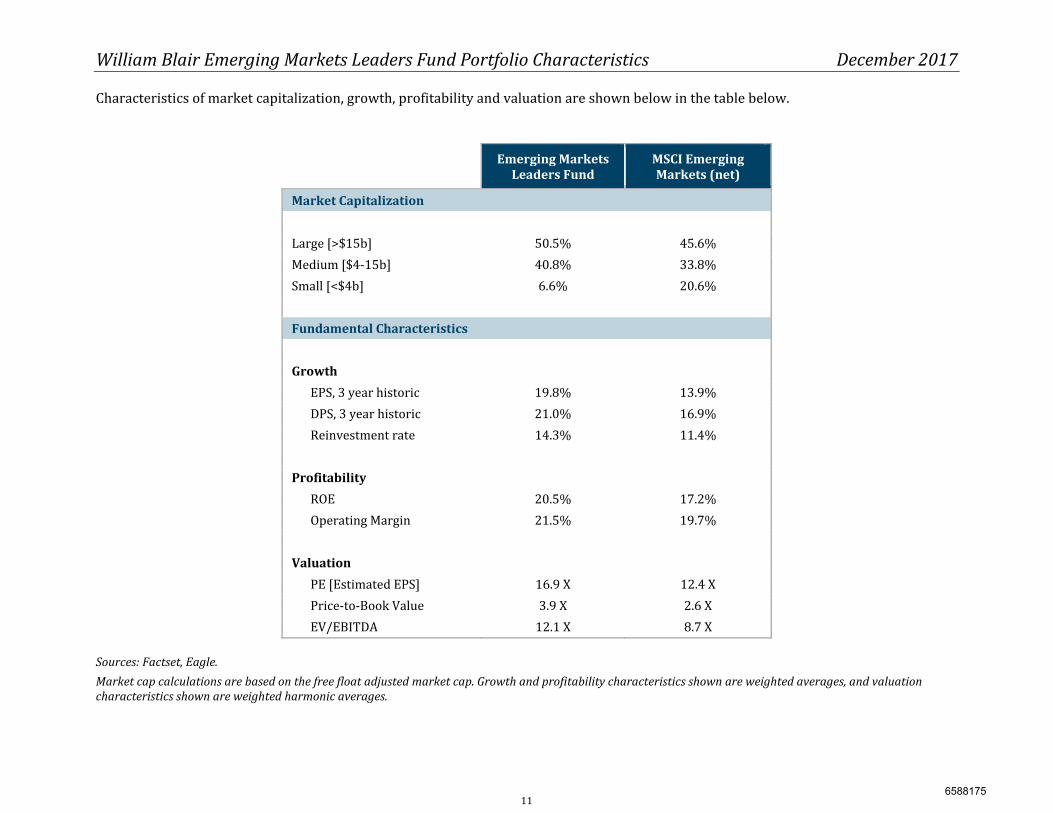
William Blair Emerging Markets Leaders Fund Portfolio Characteristics December 2017
Characteristics of market capitalization, growth, profitability and valuation are shown below in the table below. Emerging Markets Leaders Fund
MSCI Emerging Markets (net)
Market Capitalization Large [>$15b] 50.5% 45.6%Medium [$4-15b] 40.8% 33.8%Small [<$4b] 6.6% 20.6%Fundamental Characteristics Growth EPS, 3 year historic 19.8% 13.9% DPS, 3 year historic 21.0% 16.9% Reinvestment rate 14.3% 11.4% Profitability ROE 20.5% 17.2% Operating Margin 21.5% 19.7% Valuation PE [Estimated EPS] 16.9 X 12.4 X Price-to-Book Value 3.9 X 2.6 X EV/EBITDA 12.1 X 8.7 X
Sources: Factset, Eagle.
Market cap calculations are based on the free float adjusted market cap. Growth and profitability characteristics shown are weighted averages, and valuation characteristics shown are weighted harmonic averages.
11 6588175
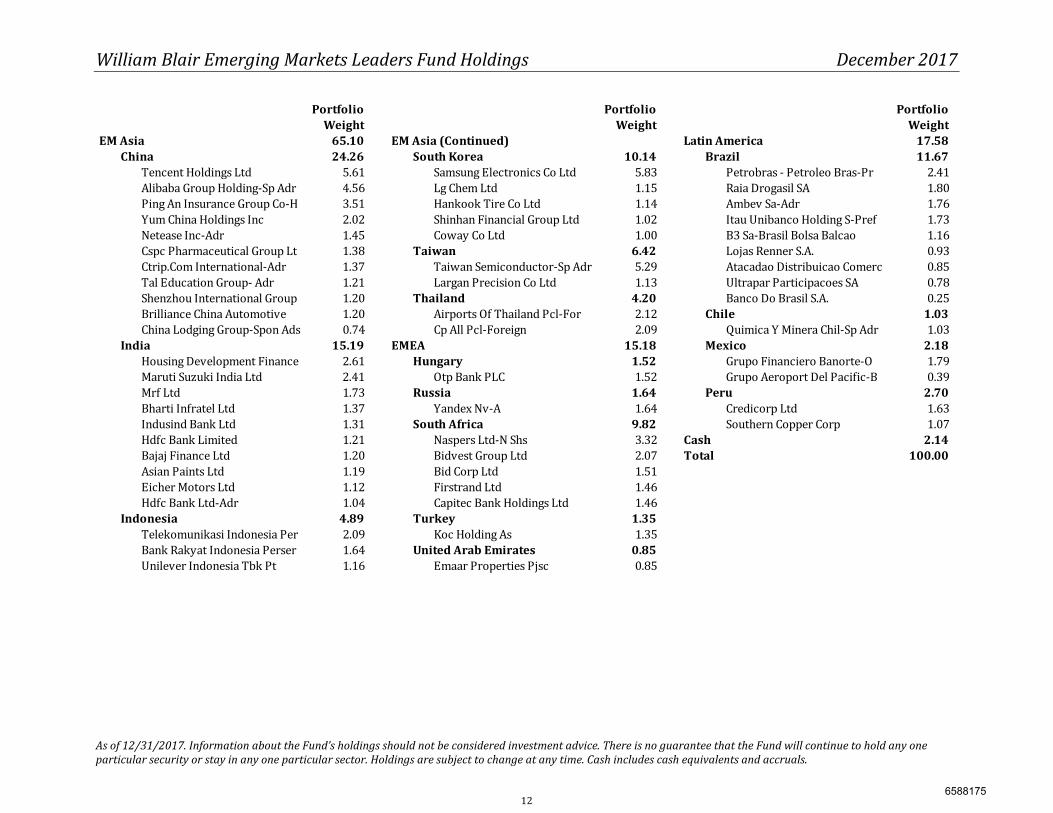
William Blair Emerging Markets Leaders Fund Holdings December 2017
As of 12/31/2017. Information about the Fund’s holdings should not be considered investment advice. There is no guarantee that the Fund will continue to hold any one particular security or stay in any one particular sector. Holdings are subject to change at any time. Cash includes cash equivalents and accruals.
Portfolio Portfolio PortfolioWeight Weight Weight
EM Asia 65.10 EM Asia (Continued) Latin America 17.58China 24.26 South Korea 10.14 Brazil 11.67Tencent Holdings Ltd 5.61 Samsung Electronics Co Ltd 5.83 Petrobras - Petroleo Bras-Pr 2.41Alibaba Group Holding-Sp Adr 4.56 Lg Chem Ltd 1.15 Raia Drogasil SA 1.80Ping An Insurance Group Co-H 3.51 Hankook Tire Co Ltd 1.14 Ambev Sa-Adr 1.76Yum China Holdings Inc 2.02 Shinhan Financial Group Ltd 1.02 Itau Unibanco Holding S-Pref 1.73Netease Inc-Adr 1.45 Coway Co Ltd 1.00 B3 Sa-Brasil Bolsa Balcao 1.16Cspc Pharmaceutical Group Lt 1.38 Taiwan 6.42 Lojas Renner S.A. 0.93Ctrip.Com International-Adr 1.37 Taiwan Semiconductor-Sp Adr 5.29 Atacadao Distribuicao Comerc 0.85Tal Education Group- Adr 1.21 Largan Precision Co Ltd 1.13 Ultrapar Participacoes SA 0.78Shenzhou International Group 1.20 Thailand 4.20 Banco Do Brasil S.A. 0.25Brilliance China Automotive 1.20 Airports Of Thailand Pcl-For 2.12 Chile 1.03China Lodging Group-Spon Ads 0.74 Cp All Pcl-Foreign 2.09 Quimica Y Minera Chil-Sp Adr 1.03India 15.19 EMEA 15.18 Mexico 2.18Housing Development Finance 2.61 Hungary 1.52 Grupo Financiero Banorte-O 1.79Maruti Suzuki India Ltd 2.41 Otp Bank PLC 1.52 Grupo Aeroport Del Pacific-B 0.39Mrf Ltd 1.73 Russia 1.64 Peru 2.70Bharti Infratel Ltd 1.37 Yandex Nv-A 1.64 Credicorp Ltd 1.63Indusind Bank Ltd 1.31 South Africa 9.82 Southern Copper Corp 1.07Hdfc Bank Limited 1.21 Naspers Ltd-N Shs 3.32 Cash 2.14Bajaj Finance Ltd 1.20 Bidvest Group Ltd 2.07 Total 100.00Asian Paints Ltd 1.19 Bid Corp Ltd 1.51Eicher Motors Ltd 1.12 Firstrand Ltd 1.46Hdfc Bank Ltd-Adr 1.04 Capitec Bank Holdings Ltd 1.46Indonesia 4.89 Turkey 1.35Telekomunikasi Indonesia Per 2.09 Koc Holding As 1.35Bank Rakyat Indonesia Perser 1.64 United Arab Emirates 0.85Unilever Indonesia Tbk Pt 1.16 Emaar Properties Pjsc 0.85
12 6588175
Glossary - Terms
Alpha: A measure of a portfolio’s return in excess of the market return, after both have been adjusted for risk. It is a mathematical estimate of the amount of return expected from a portfolio above and beyond the market return at any point in time. For example, an alpha of 1.25 indicates that a stock is projected to rise 1.25% in price in a year over the return of the market, or the return when the market return is zero. When an investment price is low relative to its alpha, it is undervalued, and considered a good selection. Beta: A quantitative measure of the volatility of the portfolio relative to the overall market, represented by a comparable benchmark. A beta above 1 is more volatile than the overall market, while a beta below 1 is less volatile, and could be expected to rise and fall more slowly than the market. Developed Markets: Using the Morgan Stanley Capital International (MSCI) geographic definition, this region includes: United Kingdom, Europe (Austria, Belgium, Denmark, Finland, France, Germany, Greece, Ireland, Italy, Netherlands, Norway, Spain, Sweden and Switzerland), Japan, Pacific Asia (Australia, Hong Kong, New Zealand, and Singapore) and the Western Hemisphere (Canada and other Americas). Debt to Total Capital Ratio: This figure is the percentage of each company’s invested capital that consists of debt. Companies with a high Debt to Total Capital level may be considered more risky. From a portfolio perspective, the portfolio Debt to Total Capital Ratio is a weighted average of the individual holdings' Debt to Total Capital Ratio. Emerging Markets: Using MSCI’s geographic definition, this region includes: Emerging Markets Asia (China, India, Indonesia, Malaysia, S Korea, Taiwan, and Thailand), Emerging Markets Europe, Mid-East and Africa (Czech Republic, Hungary, Poland, Russia, Turkey, Egypt, Morocco, and S Africa), and Latin America (Argentina, Brazil, Chile, Columbia, Mexico, Peru and Venezuela). EPS (Earnings Per Share) Growth Rate (Projected): This measure represents the weighted average of forecasted growth in earnings expected to be experienced by the stocks within the portfolio over the next 3-5 years. From a portfolio perspective, the portfolio P/E ratio and EPS Growth Rate are weighted averages of the individual holdings’ P/E ratios and EPS Growth Rates. Data calculated in FactSet. EV/EBITDA: (Enterprise Value / Earnings Before Interest, Taxes and Depreciation-Amortization): The EV/EBITDA ratio is useful for global comparisons because it ignores the distorting effects of individual countries' taxation policies. It's used to find attractive takeover candidates. Enterprise value is a better measure than market cap for takeovers because it takes into account the debt which the acquirer will have to assume. Therefore, a company with a low EV/EBITDA ratio can be viewed as a good takeover candidate. EV/IC: (Enterprise Value / Invested Capital) Ratio: Enterprise Value (EV), which is market capitalization minus cash plus debt divided by Invested Capital (IC), which is the sum of common stock, preferred stock and long-term debt. This number will get you a simple multiple. If it is below 1.0, then it means that the company is selling below book value and theoretically below its liquidation value. Information Coefficient: A measure of the correlation between expected and actual returns. Information Ratio: A measure of risk-adjusted return. The annualized excess return of the portfolio relative to a respective benchmark, divided by the annualized tracking error relative to that same benchmark. The higher the measure, the higher the risk-adjusted return. PBV: (Price/Book Value) Ratio: The PBV Ratio measures the value of a company's common stock relative to its shareholder's equity. A price-to-book multiple above one means that the price of the company's common stock is higher than its common shareholder's equity. A price-to-book multiple below one means that the price of the company's common stock are less than its break-up value, and the shares may be undervalued. PCF: (Price/CashFlow): Some analysts favor the price/cash flow over the price-earnings (PE) ratio as a measure of a company’s value. Cash flow is a measure of a company's financial health. It equals cash receipts minus cash payments over a given period of time.
13 6588175
Glossary - Terms
P/E: (Price/Earnings) Ratio: This is the most common measure of how expensive a stock is. Simply, it is the cost an investor in a given stock must pay per dollar of current annual earnings. A high P/E generally indicates that the market is paying more to obtain the stock because it has confidence in the company’s ability to increase its earnings. Conversely, a low P/E often indicates that the market has less confidence that the company’s earnings will increase rapidly or steadily, and therefore will not pay as much for its stock. R-squared: A measurement of how closely the portfolio’s performance correlates with the performance of its benchmark, such as the MSC AC World Free ex US Index. In other words, it is a measurement of what portion of a portfolio’s performance can be explained by the performance of the overall market or index. Ranges from 0 to 1, where 0 indicates no correlation and 1 indicates perfect correlation. Risk (Standard Deviation): A measure of the portfolio’s risk. A higher standard deviation represents a greater dispersion of returns, and thus a greater amount of risk. The annualized standard deviation is calculated using monthly returns. Sharpe-Ratio: A risk-adjusted measure calculated using standard deviation and excess return (Portfolio return – Risk Free Rate) to determine reward per unit of risk. The higher the Sharpe ratio, the better the portfolio’s historic risk-adjusted performance. Tracking Error: Tracking Error measures the extent to which a portfolio tracks its benchmark. The tracking error of an index portfolio should be lower than that of an active portfolio. The tracking error will always be greater than zero if the portfolio is anything other than a replication of the benchmark. Trailing 1-Year Turnover: This figure reflects the portfolio’s trading activity by calculating the amount of the portfolio’s holdings bought or sold over the prior year, expressed as a percentage of the portfolio’s average market value. Turnover figures may be related to the amount of trading costs experienced by the portfolio. Weighted Average Market Capitalization: Market capitalization refers to the total market value of each company's outstanding shares. The Weighted Average Market Capitalization for a portfolio is calculated as the average market capitalization of the stocks within the portfolio, weighted by the amount of each stock owned. Weighted Median Market Capitalization: This calculation represents the median market capitalization of the stocks in the portfolio, weighted by the amount of each stock owned.
14 6588175