Embed Size (px)
Citation preview
Emerging Local Government Leaders Steve Hoyt-McBeth, City of Portland
April 16, 2014www.pdxBikeShare.com
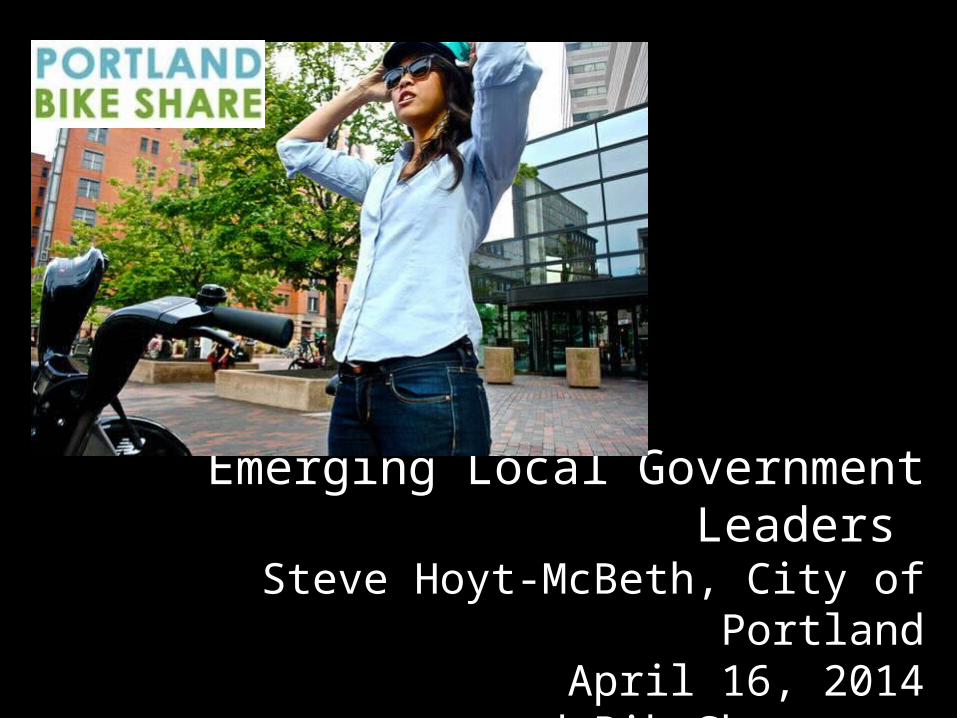
OverviewI. Description
A. HistoryB. Business Models
II. Portland
A. Project OverviewB. Do we need bike share?C. Experience: Bike friendly citiesD. Station planningE. Equity F. Challenges
III. Discussion
-
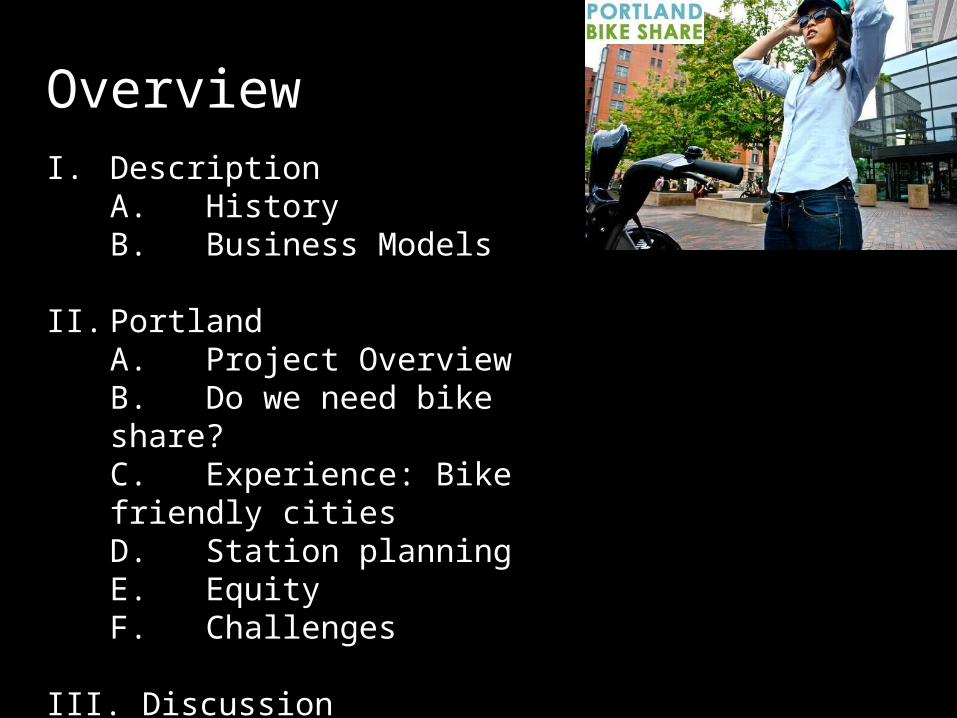
Bike Share Definition“Public bikes available for short term rental at unattended
locations.” – Paul DeMaio, Metrobike LLC
• “A non-motorized transportation service, typically structured to provide users to point-to-point transportation for short distance trips (1/2 – 3 miles).” – Pedestrian and Bicycle Information Center/Toole Group
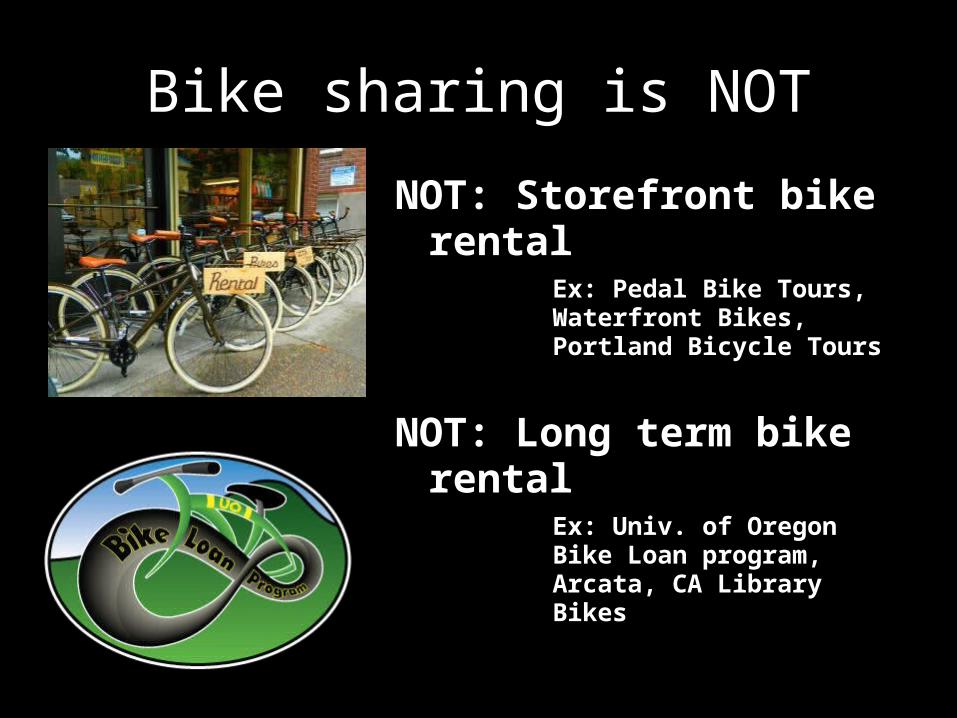
Bike sharing is NOT
NOT: Storefront bike rental• Ex: Pedal Bike Tours,
Waterfront Bikes, Portland Bicycle Tours
NOT: Long term bike rental• Ex: Univ. of Oregon Bike Loan
program, Arcata, CA Library Bikes
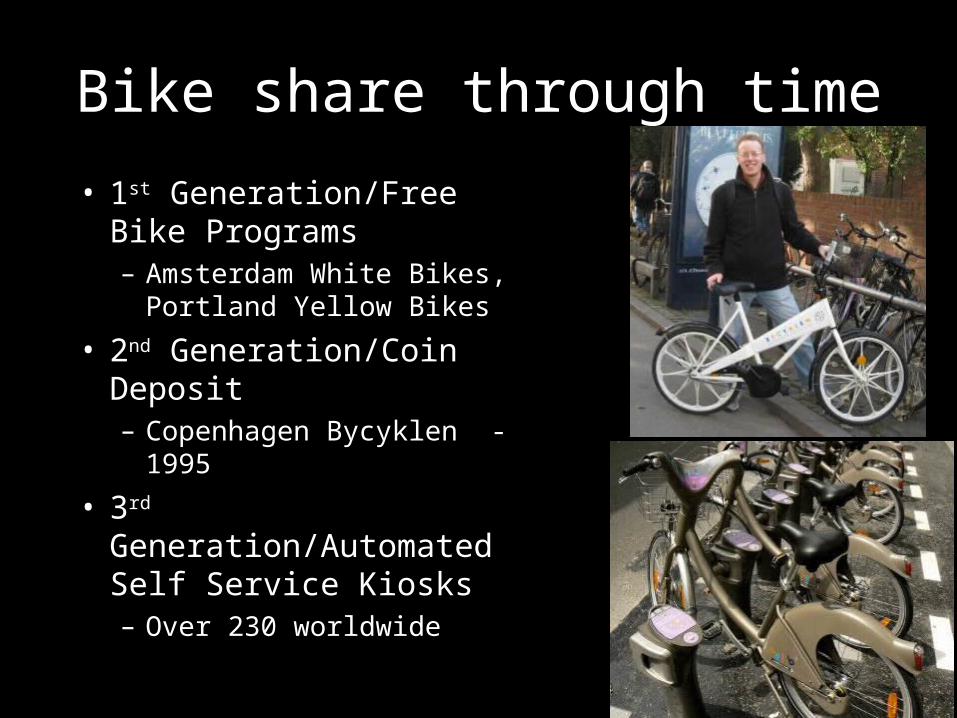
Bike share through time
• 1st Generation/Free Bike Programs– Amsterdam White Bikes,
Portland Yellow Bikes
• 2nd Generation/Coin Deposit– Copenhagen Bycyklen - 1995
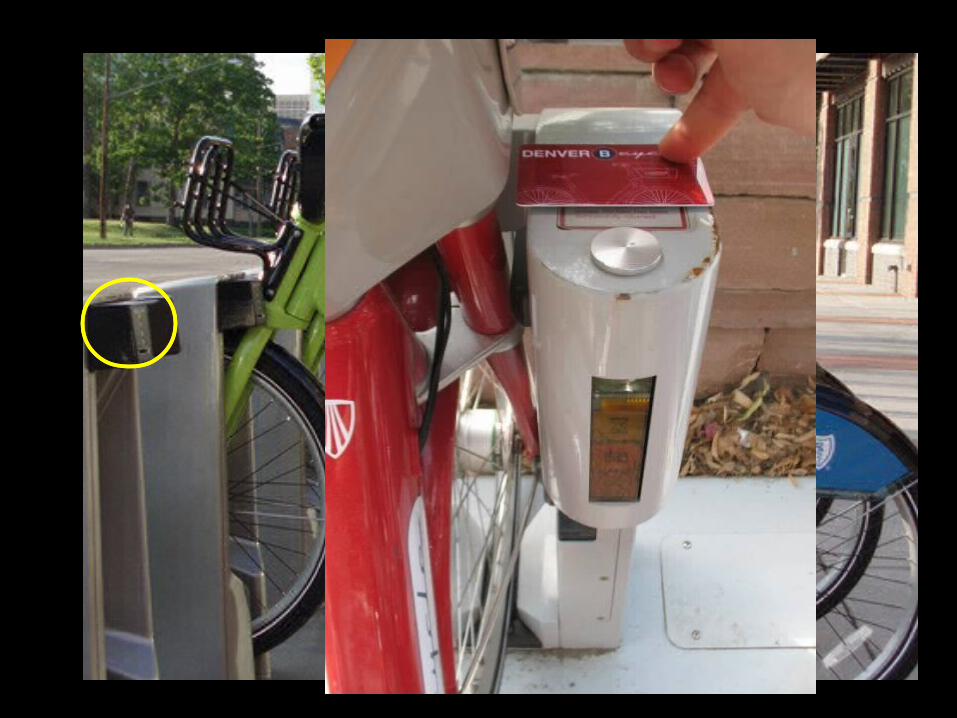
• 3rd Generation/Automated Self Service Kiosks– Over 230 worldwide
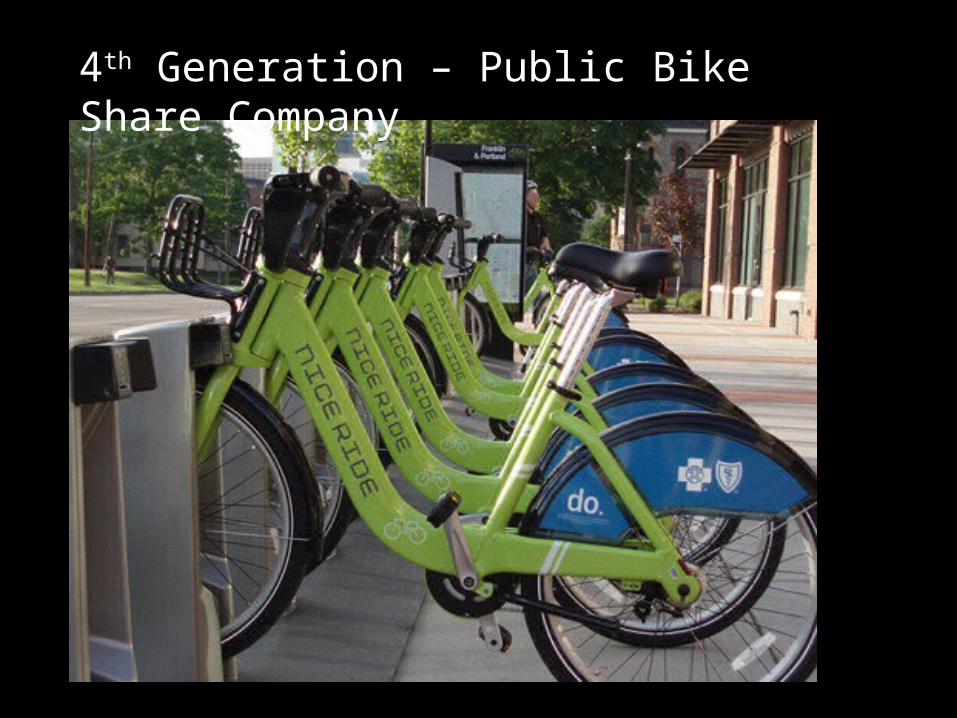
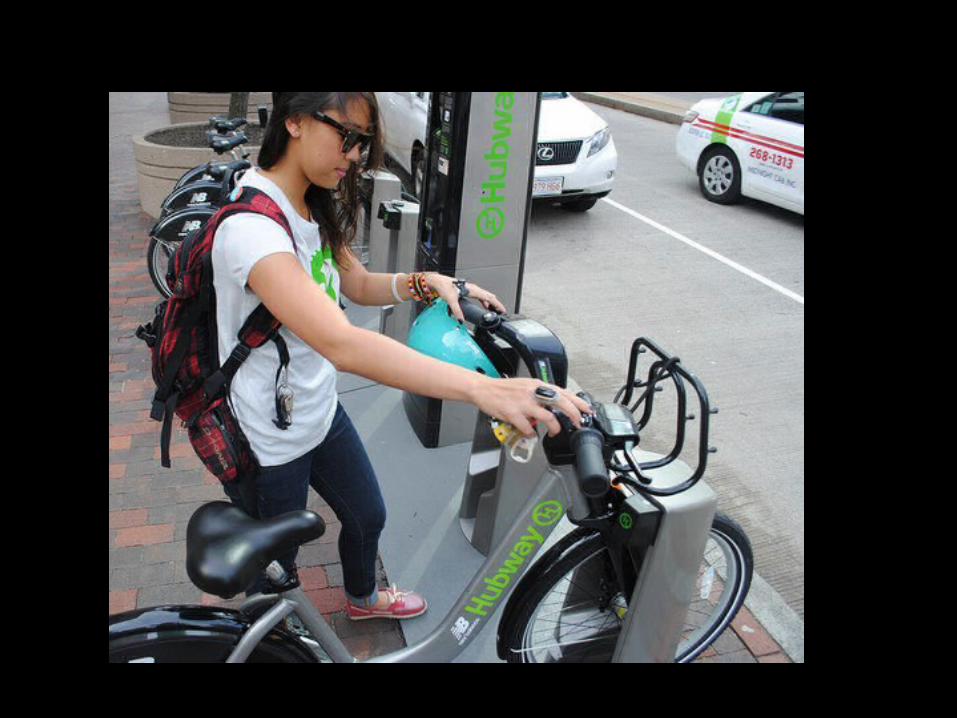
4th Generation – Public Bike Share Company
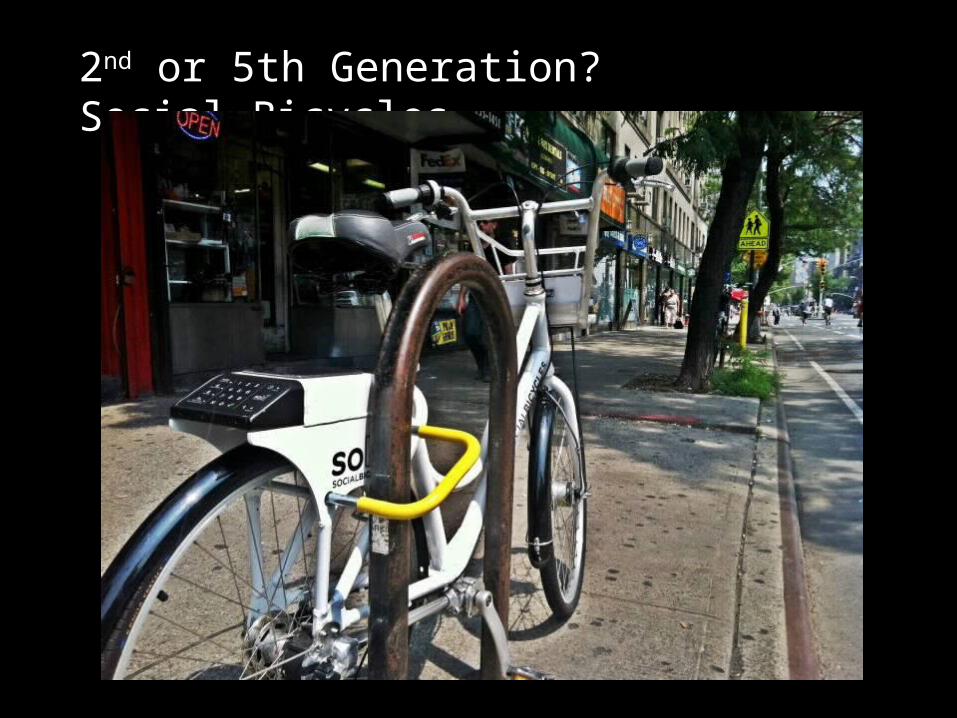
2nd or 5th Generation? Social Bicycles
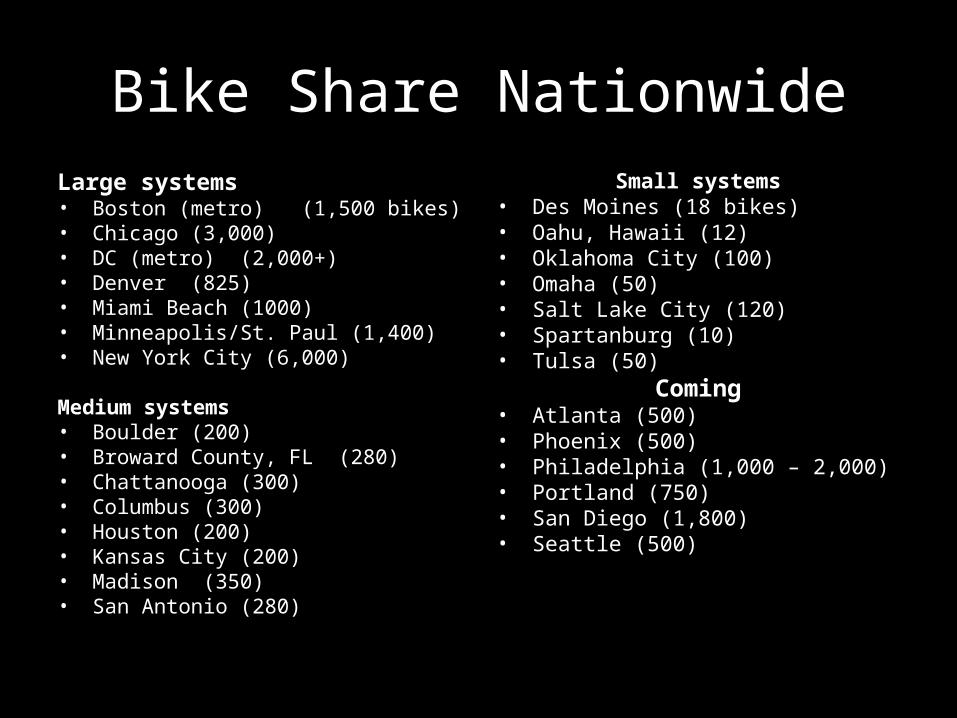
Bike Share NationwideLarge systems• Boston (metro) (1,500 bikes)• Chicago (3,000)• DC (metro) (2,000+)• Denver (825)• Miami Beach (1000)• Minneapolis/St. Paul (1,400)• New York City (6,000)
Medium systems• Boulder (200)• Broward County, FL (280)• Chattanooga (300)• Columbus (300)• Houston (200)• Kansas City (200)• Madison (350)• San Antonio (280)
Small systems• Des Moines (18 bikes)• Oahu, Hawaii (12)• Oklahoma City (100)• Omaha (50)• Salt Lake City (120)• Spartanburg (10)• Tulsa (50)
Coming• Atlanta (500)• Phoenix (500)• Philadelphia (1,000 – 2,000)• Portland (750)• San Diego (1,800)• Seattle (500)
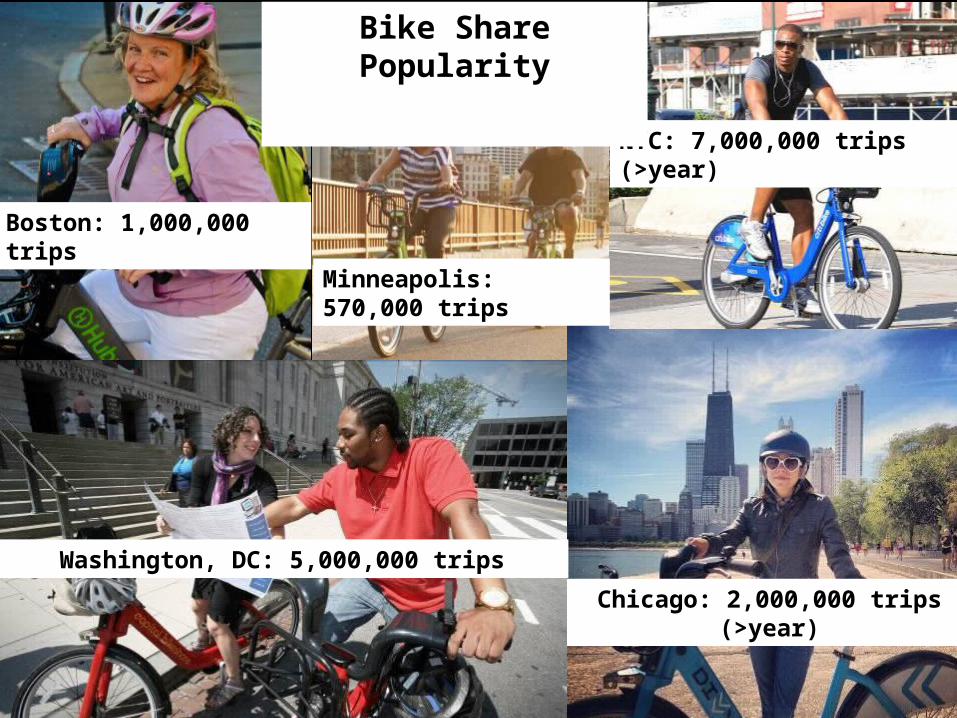
Chicago: 2,000,000 trips (>year)
NYC: 7,000,000 trips (>year)
Minneapolis: 570,000 trips
Boston: 1,000,000 trips
Washington, DC: 5,000,000 trips
Bike Share Popularity
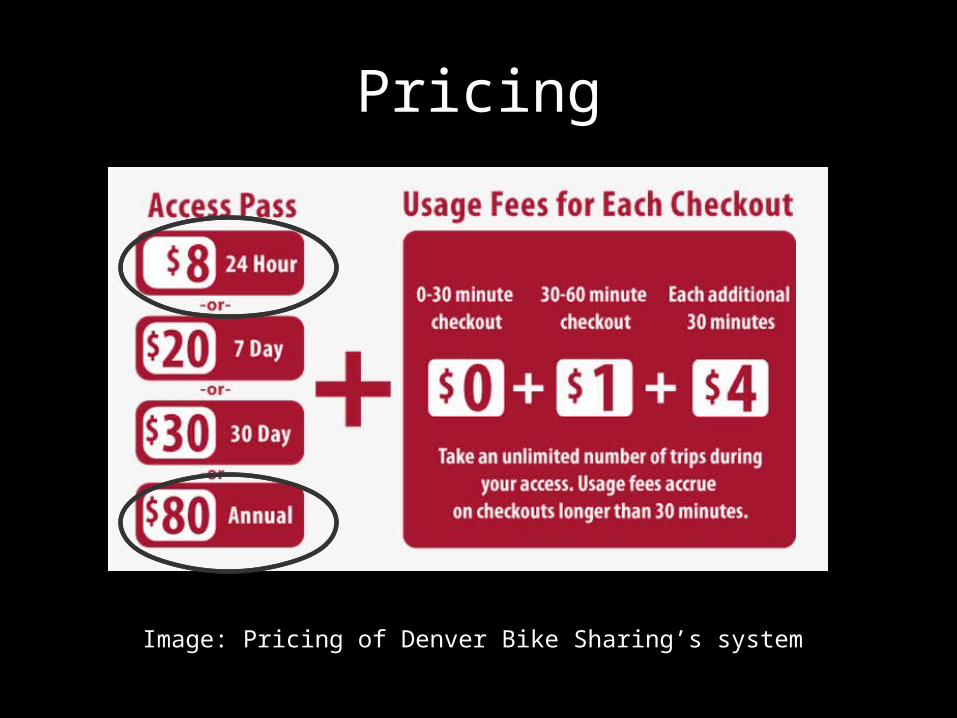
Pricing
Image: Pricing of Denver Bike Sharing’s system
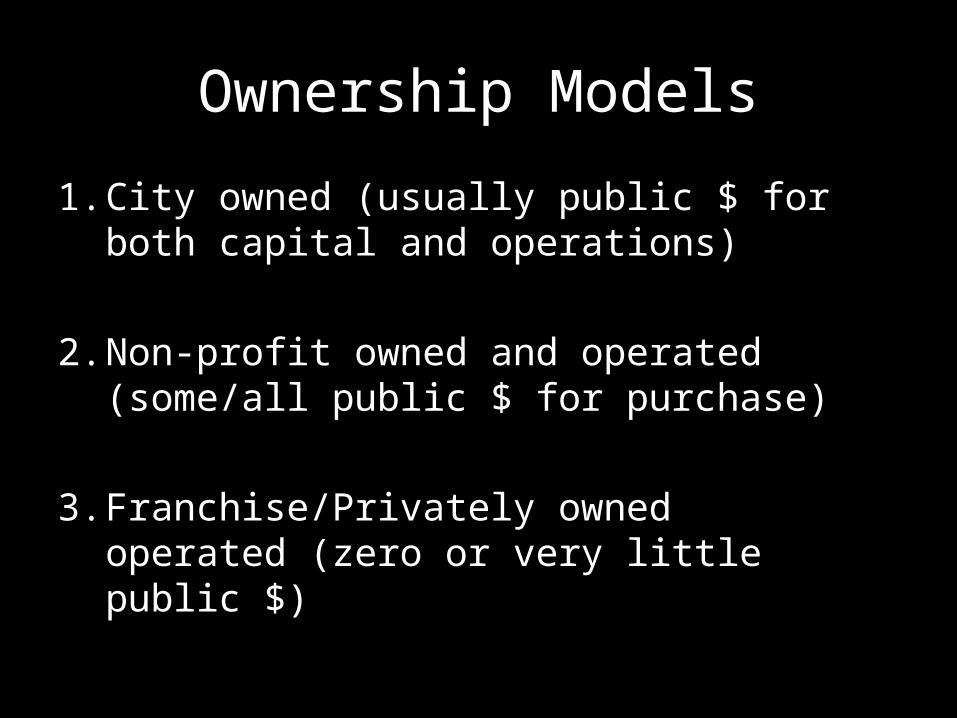
Ownership Models
1. City owned (usually public $ for both capital and operations)
2. Non-profit owned and operated (some/all public $ for purchase)
3. Franchise/Privately owned operated (zero or very little public $)
Business Model
• Capital & Expansion: Fed, Local and Grant $• Operating: Systems Revenues & Sponsorship
– Short term users generate more revenue– Annual members generate more trips
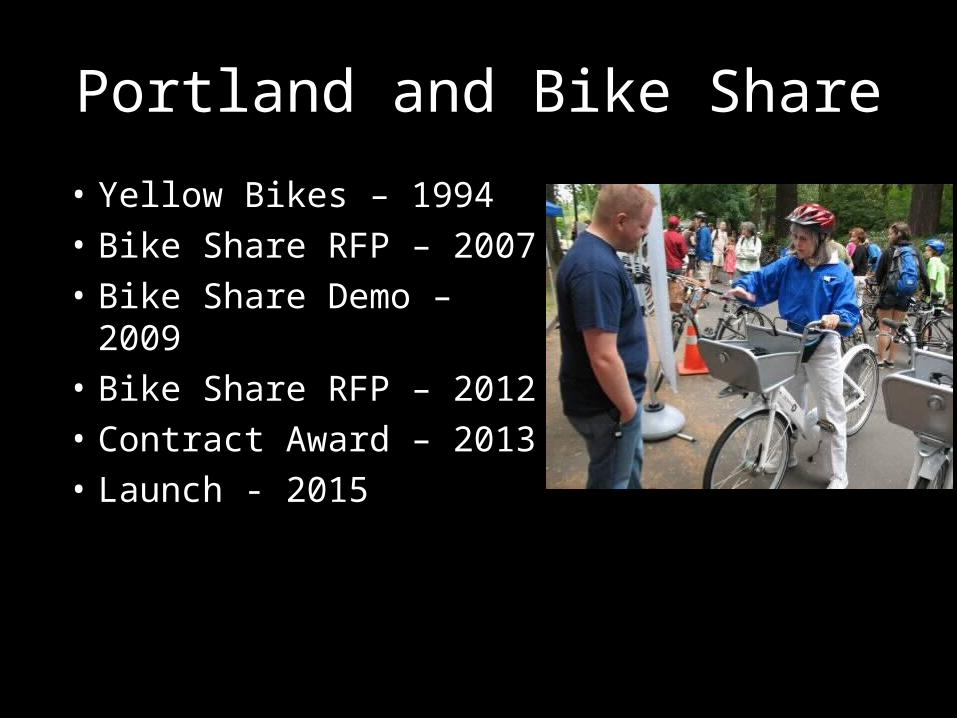
Portland and Bike Share
• Yellow Bikes – 1994• Bike Share RFP – 2007• Bike Share Demo – 2009• Bike Share RFP – 2012• Contract Award – 2013• Launch - 2015
Portland Contract
– 500 to 750 bike system
– Capital: $1.8M (Regional Flexible Funds)• Remainder to be raised by Alta via sponsors
– Operations: No City funds• Alta paid through system revenues and private
sponsors
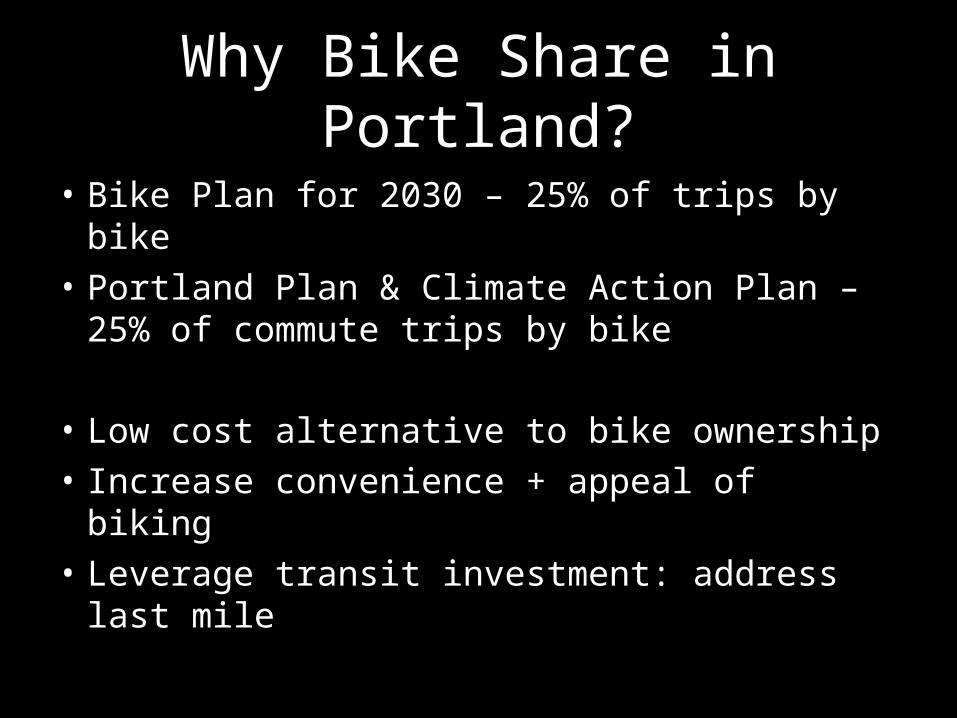
Why Bike Share in Portland?
• Bike Plan for 2030 – 25% of trips by bike• Portland Plan & Climate Action Plan – 25% of
commute trips by bike
• Low cost alternative to bike ownership• Increase convenience + appeal of biking• Leverage transit investment: address last mile
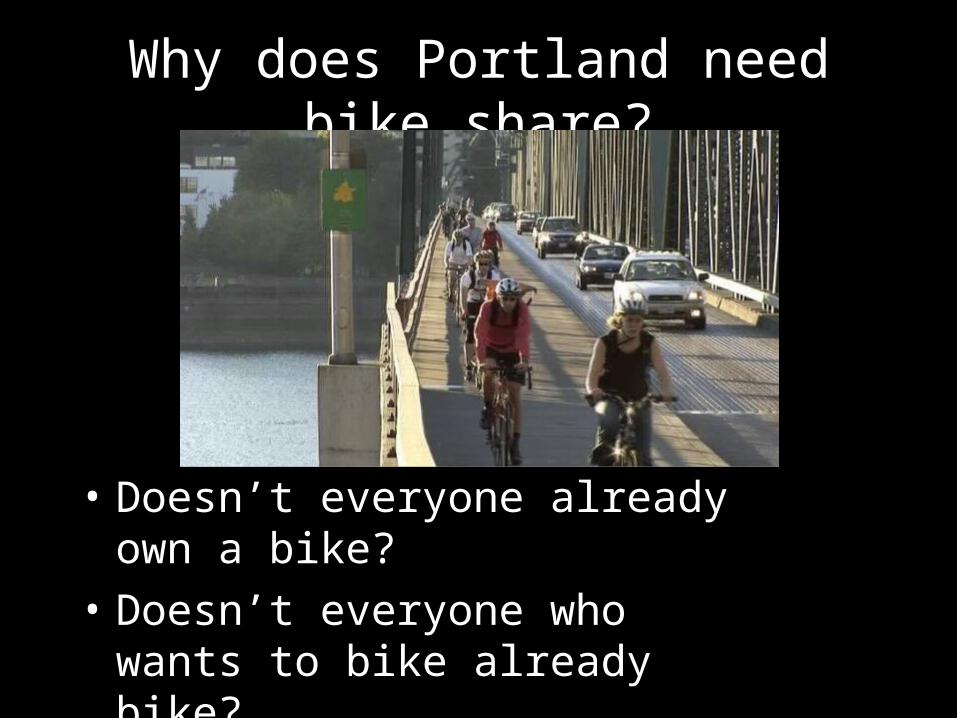
Why does Portland need bike share?
• Doesn’t everyone already own a bike?
• Doesn’t everyone who wants to bike already bike?
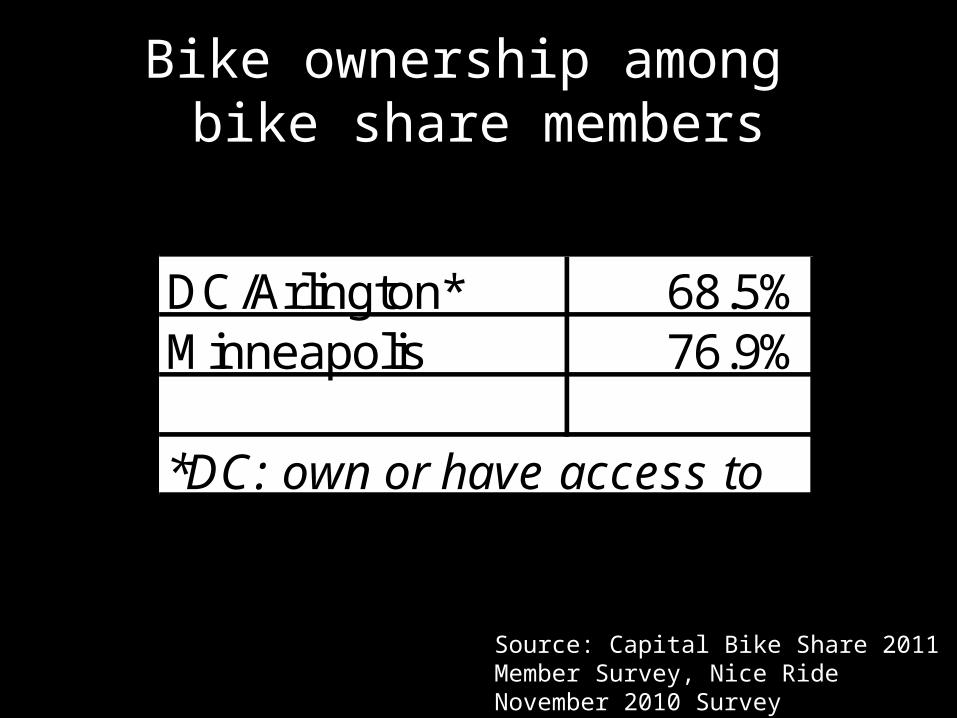
Bike ownership among bike share members
Source: Capital Bike Share 2011 Member Survey, Nice Ride November 2010 Survey
DC/Arlington* 68.5%Minneapolis 76.9%
*DC: own or have access to
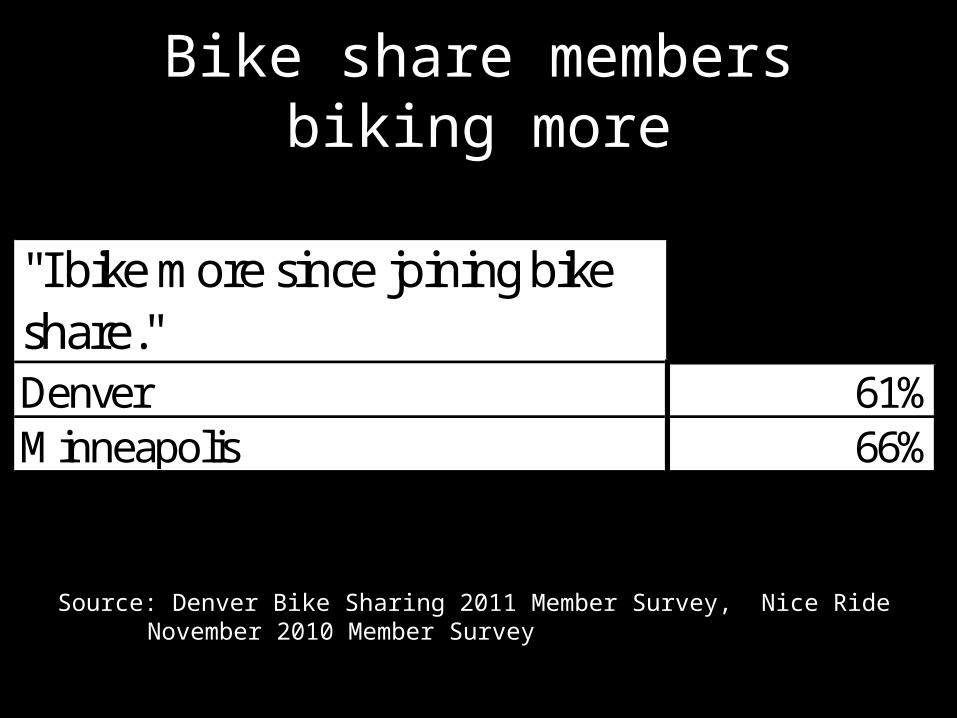
Bike share members biking more
Source: Denver Bike Sharing 2011 Member Survey, Nice Ride November 2010 Member Survey
"I bike more since joining bike share."Denver 61%Minneapolis 66%
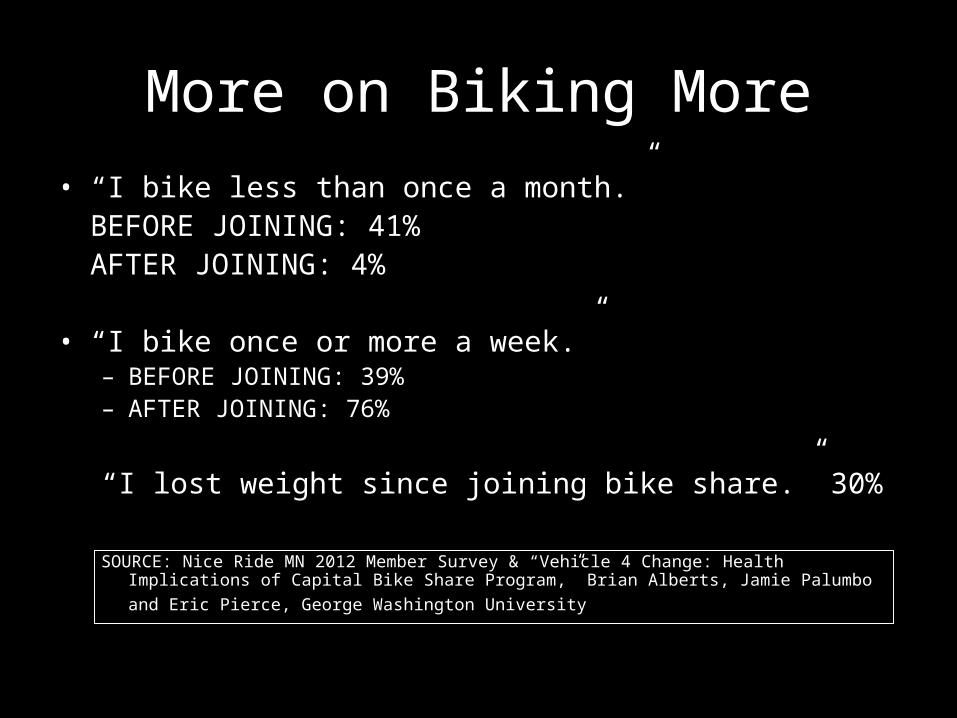
More on Biking More• “I bike less than once a month.”
BEFORE JOINING: 41%AFTER JOINING: 4%
• “I bike once or more a week.”– BEFORE JOINING: 39%– AFTER JOINING: 76%
“I lost weight since joining bike share.” 30%
SOURCE: Nice Ride MN 2012 Member Survey & “Vehicle 4 Change: Health Implications of Capital Bike Share Program,” Brian Alberts, Jamie Palumbo and Eric Pierce, George Washington University
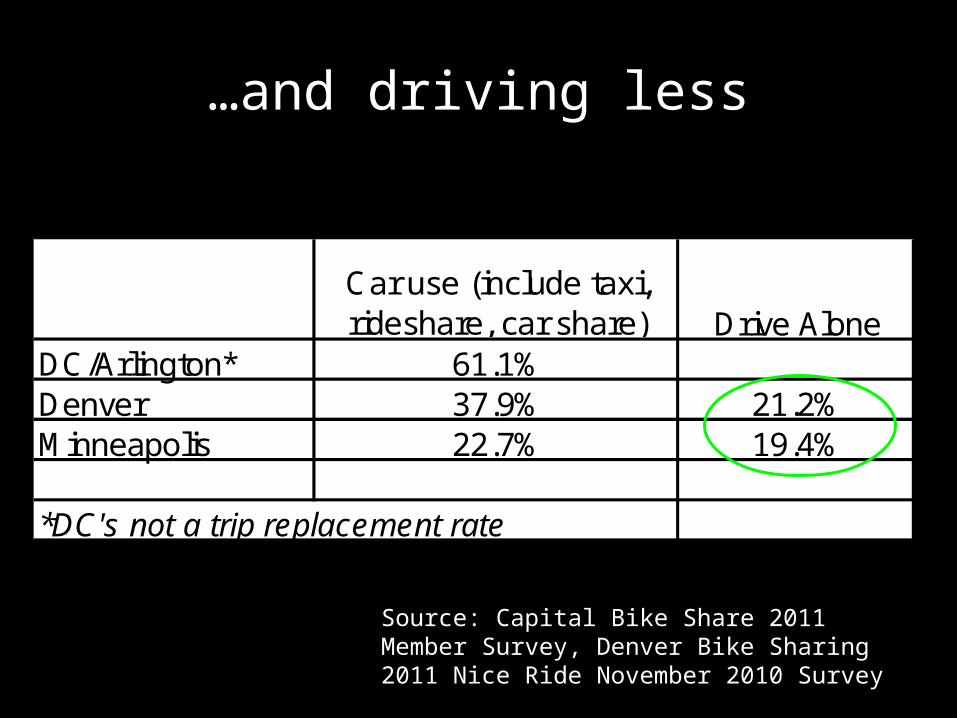
…and driving less
Source: Capital Bike Share 2011 Member Survey, Denver Bike Sharing 2011 Nice Ride November 2010 Survey
Car use (include taxi, rideshare, car share) Drive Alone
DC/Arlington* 61.10%Denver 37.90% 21.20%Minneapolis 22.70% 19.40%
*DC's not a trip replacement rate
Car use (include taxi, rideshare, car share) Drive Alone
DC/Arlington* 61.1%Denver 37.9% 21.2%Minneapolis 22.7% 19.4%
*DC's not a trip replacement rate
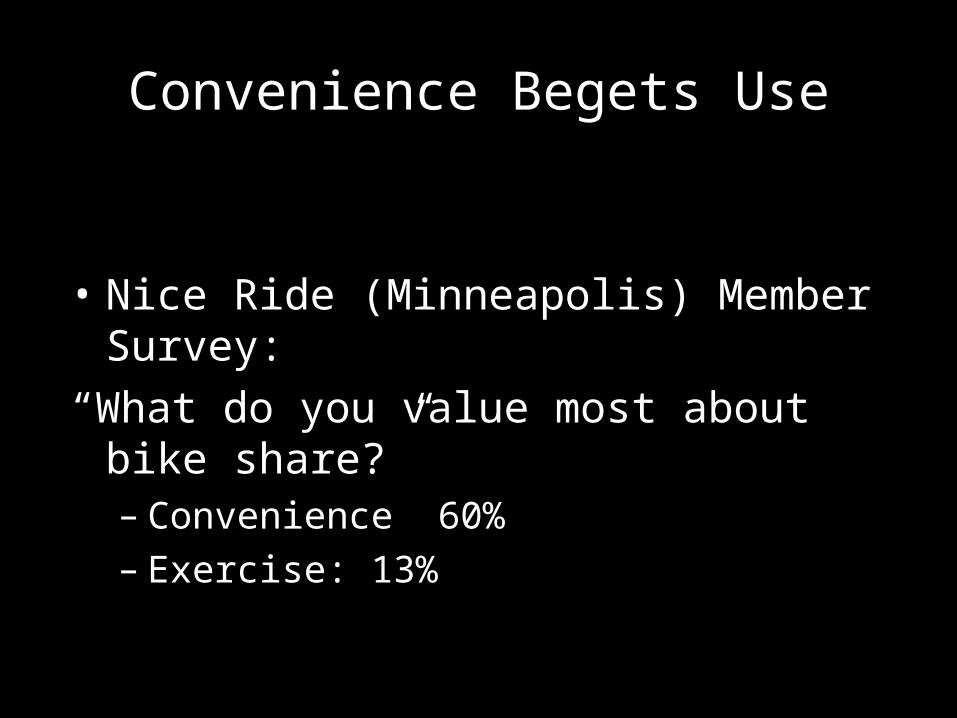
Convenience Begets Use
• Nice Ride (Minneapolis) Member Survey:“What do you value most about bike share?”
– Convenience 60%– Exercise: 13%
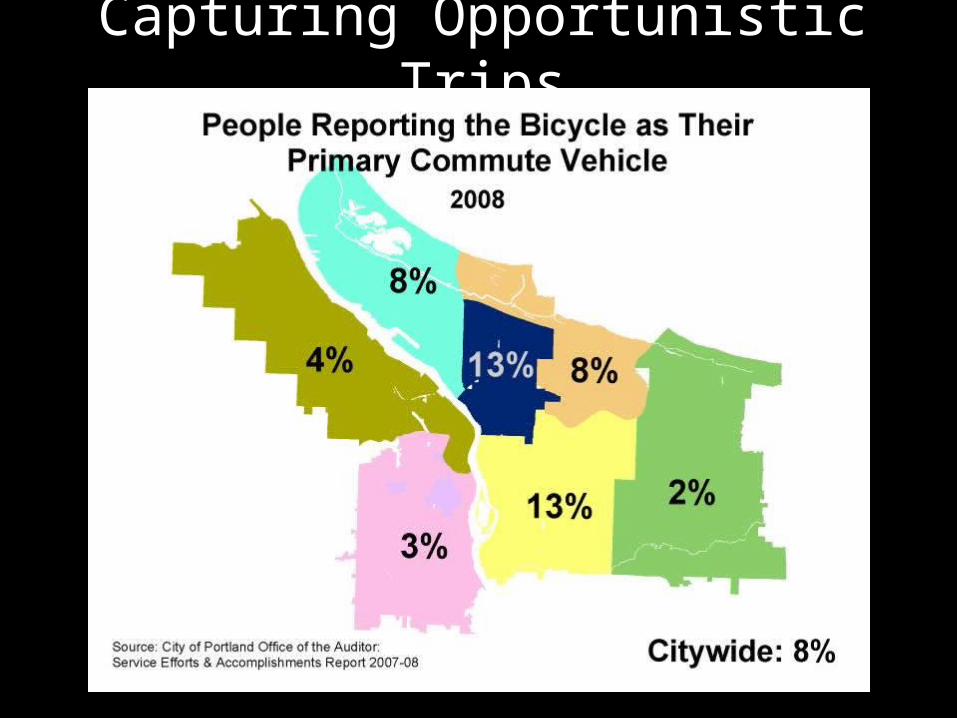
Capturing Opportunistic Trips

Capturing Opportunistic Trips
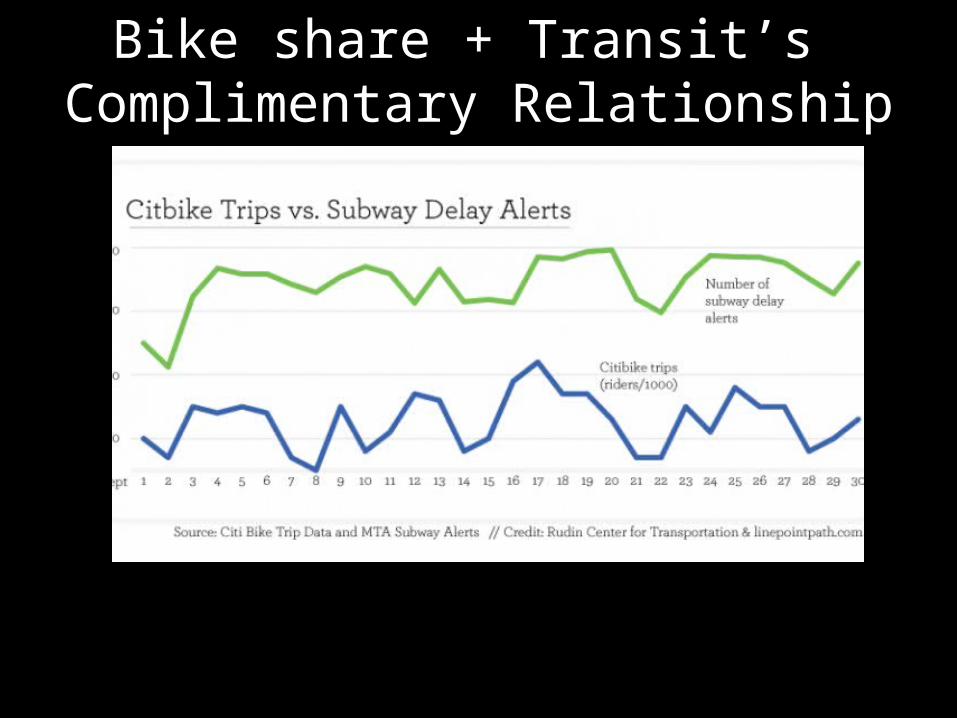
Bike share + Transit’s Complimentary Relationship
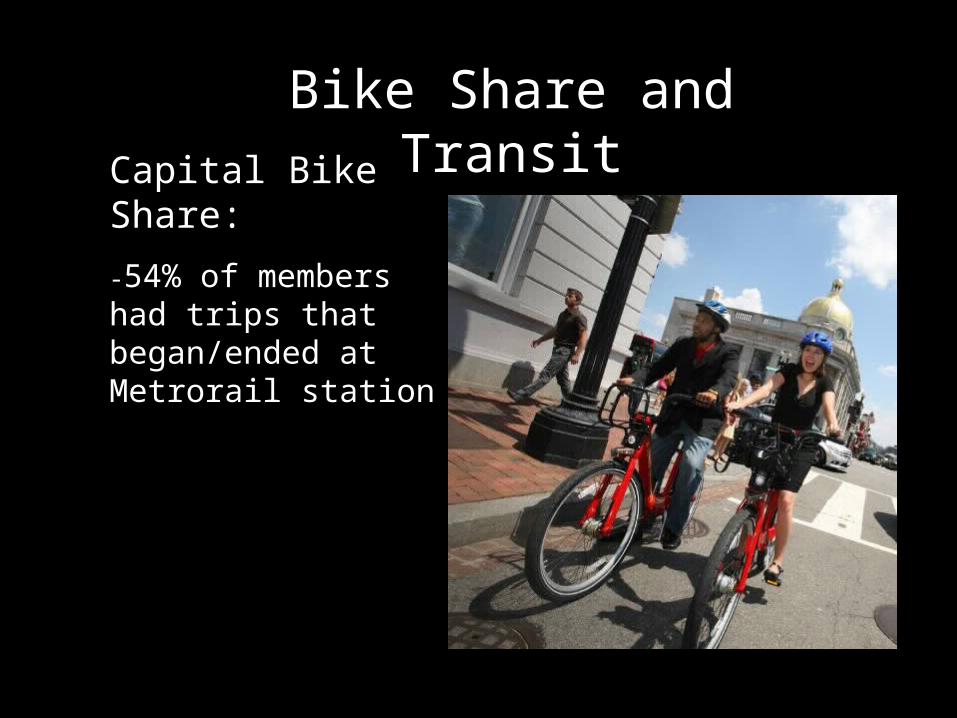
Bike Share and TransitCapital Bike Share:
-54% of members had trips that began/ended at Metrorail station
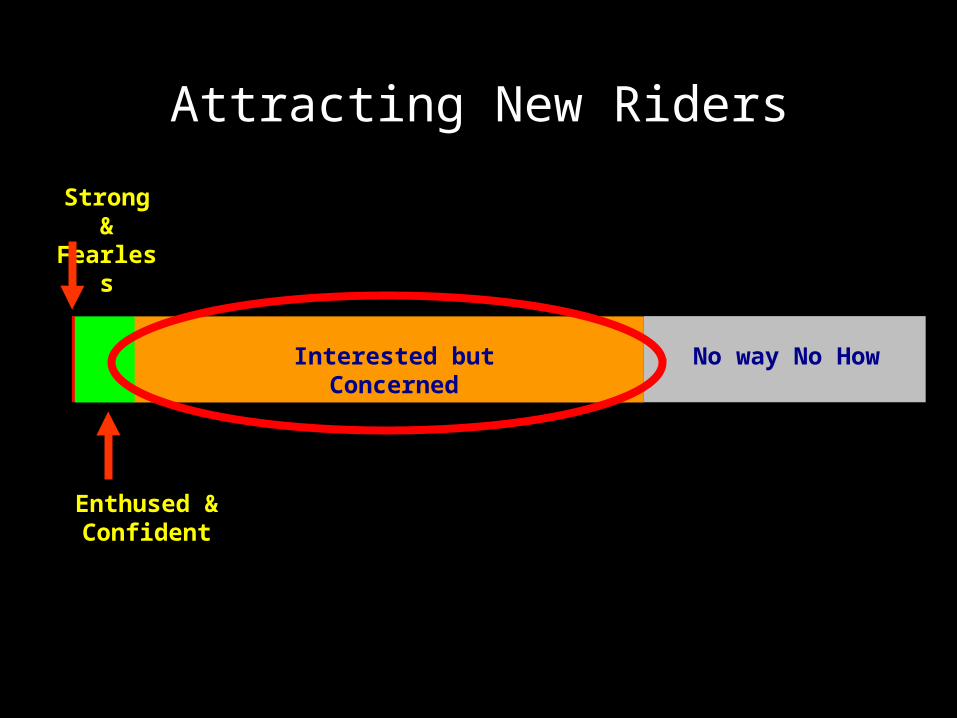
Attracting New Riders
Strong &Fearless
Enthused &Confident
No way No HowInterested but Concerned
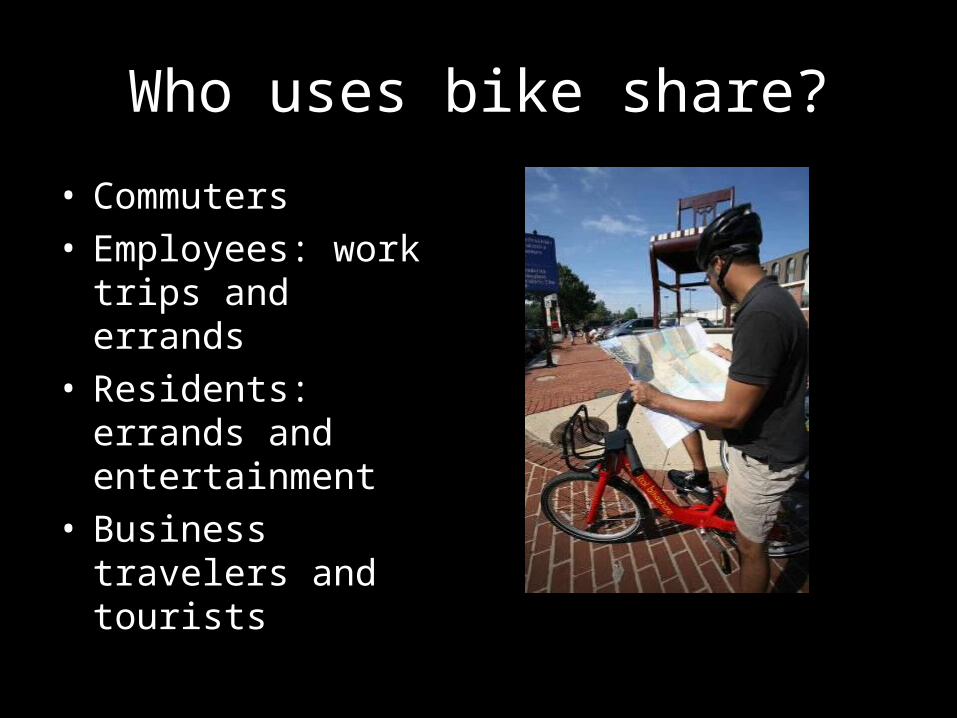
Who uses bike share?
• Commuters• Employees: work trips
and errands• Residents: errands and
entertainment• Business travelers and
tourists
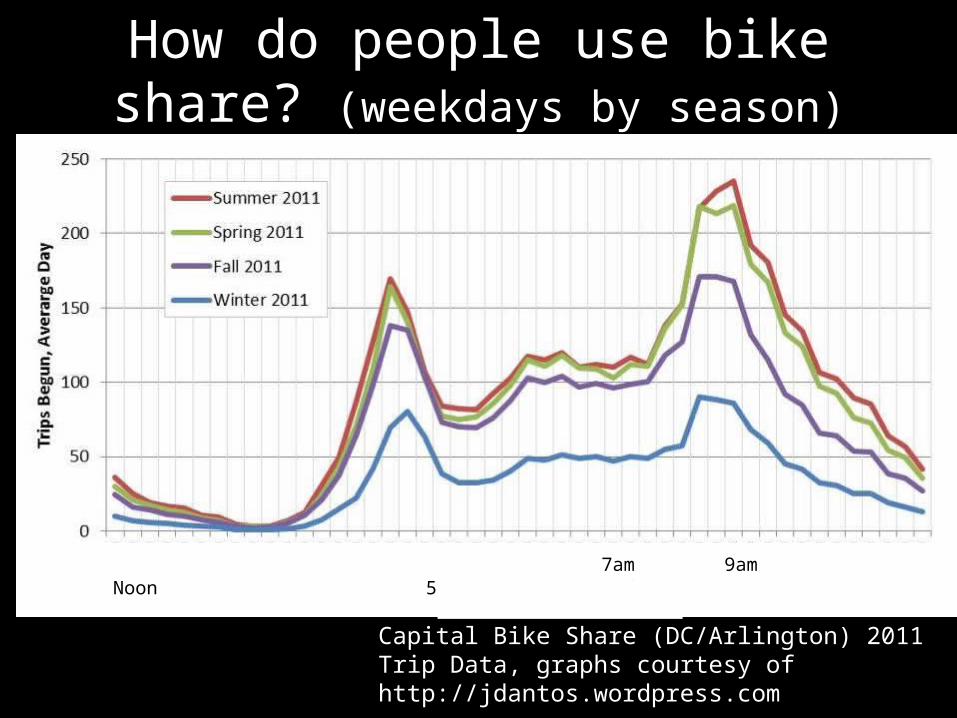
How do people use bike share? (weekdays by season)
Capital Bike Share (DC/Arlington) 2011 Trip Data, graphs courtesy of http://jdantos.wordpress.com
7am 9am Noon 5pm 7pm 9pm
Capital Bike Share (DC/Arlington) 2011 Trip Data,
graphs courtesy of http://jdantos.wordpress.com
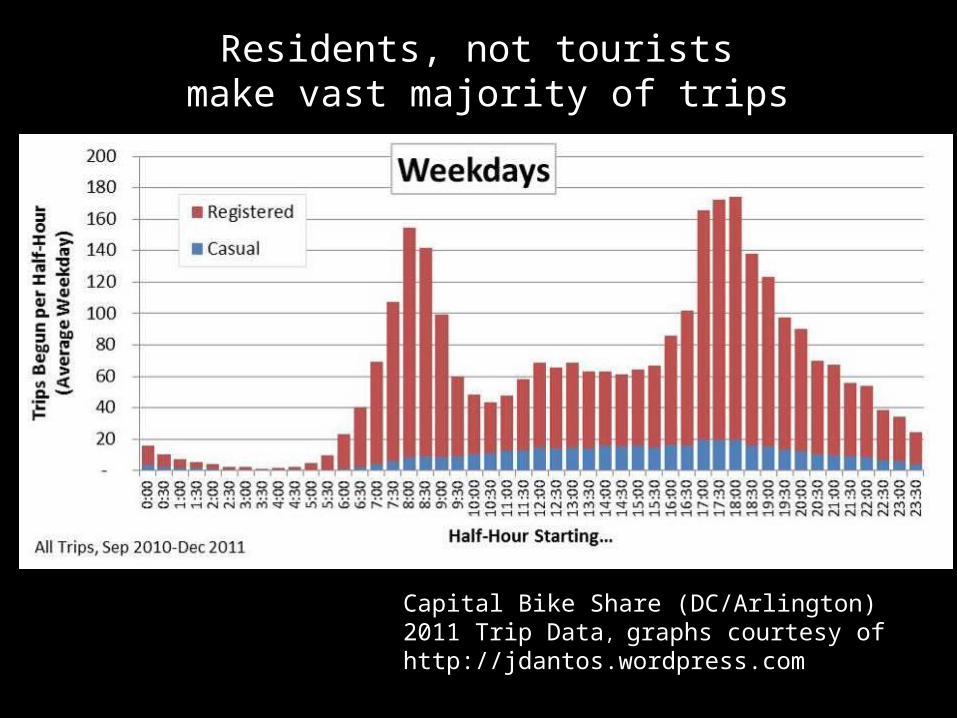
Residents, not tourists make vast majority of trips
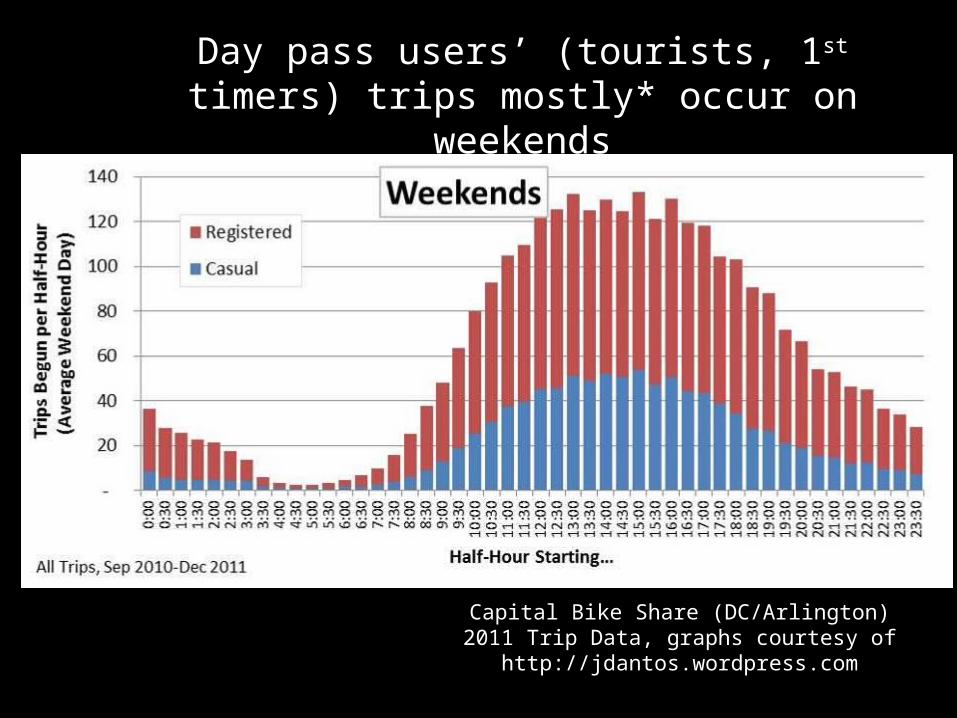
Day pass users’ (tourists, 1st timers) trips mostly* occur on weekends
Capital Bike Share (DC/Arlington) 2011 Trip Data, graphs courtesy of http://jdantos.wordpress.com
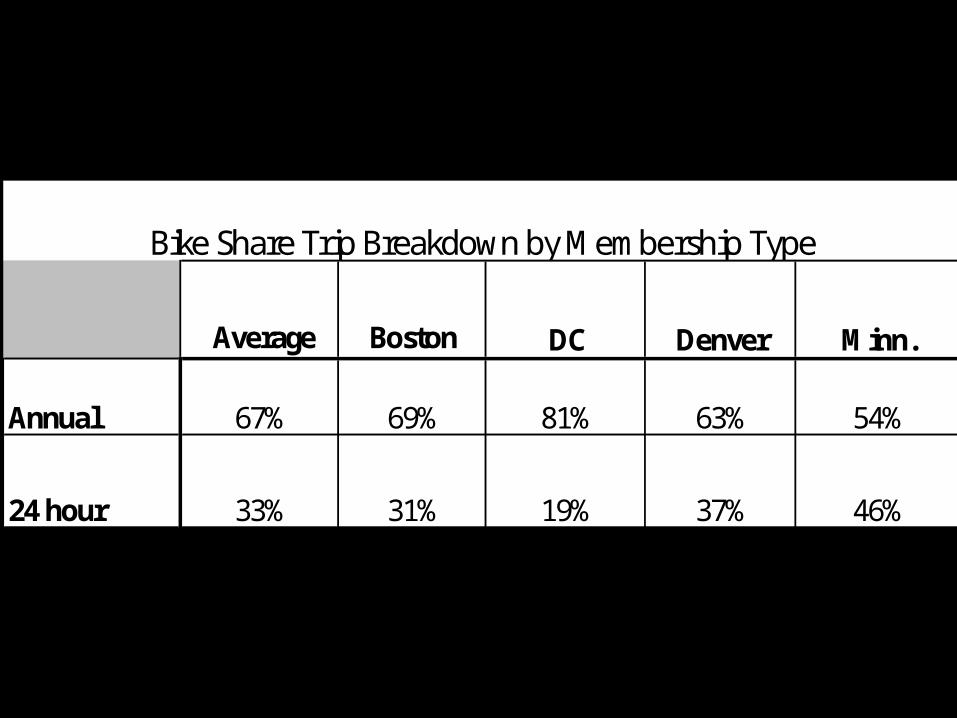
Average Boston DC Denver Minn.
Annual 67% 69% 81% 63% 54%
24 hour 33% 31% 19% 37% 46%
Bike Share Trip Breakdown by Membership Type
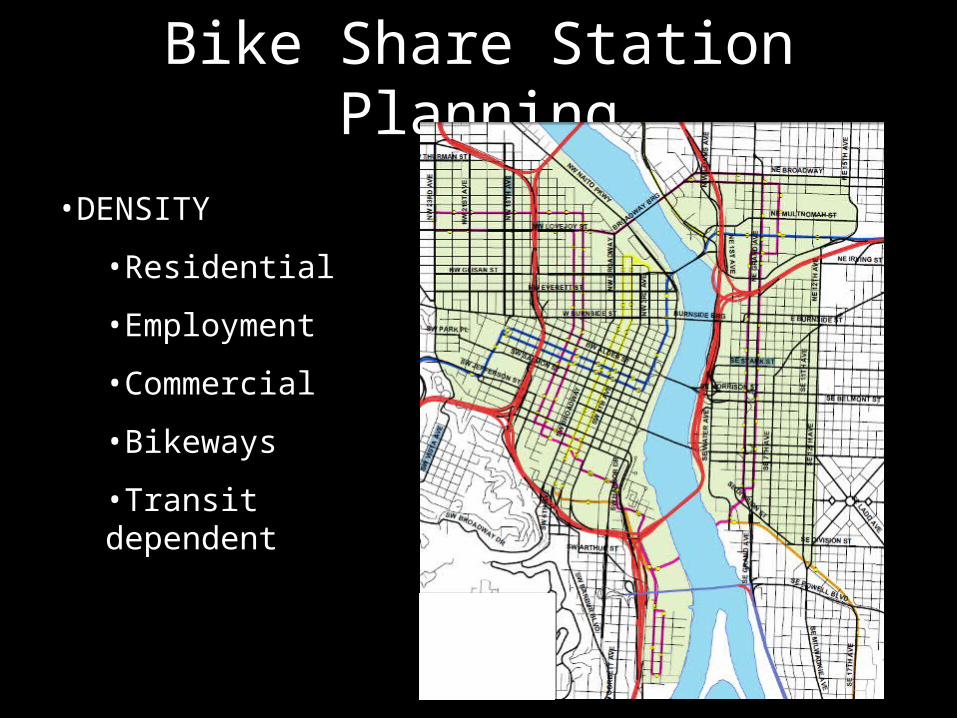
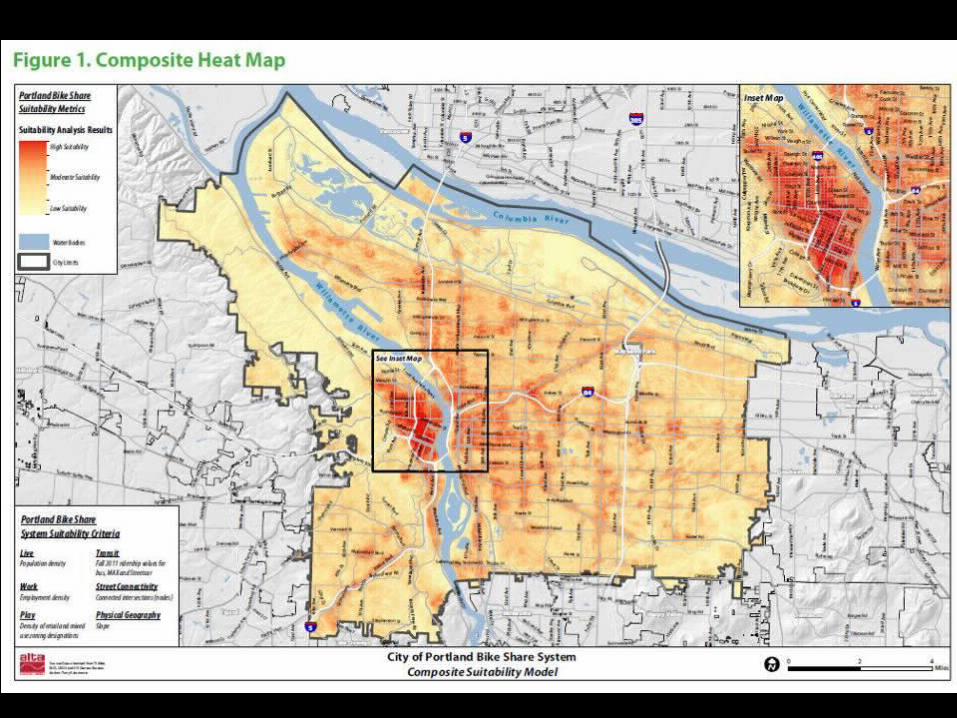
Bike Share Station Planning
•DENSITY
•Residential
•Employment
•Commercial
•Bikeways
•Transit dependent
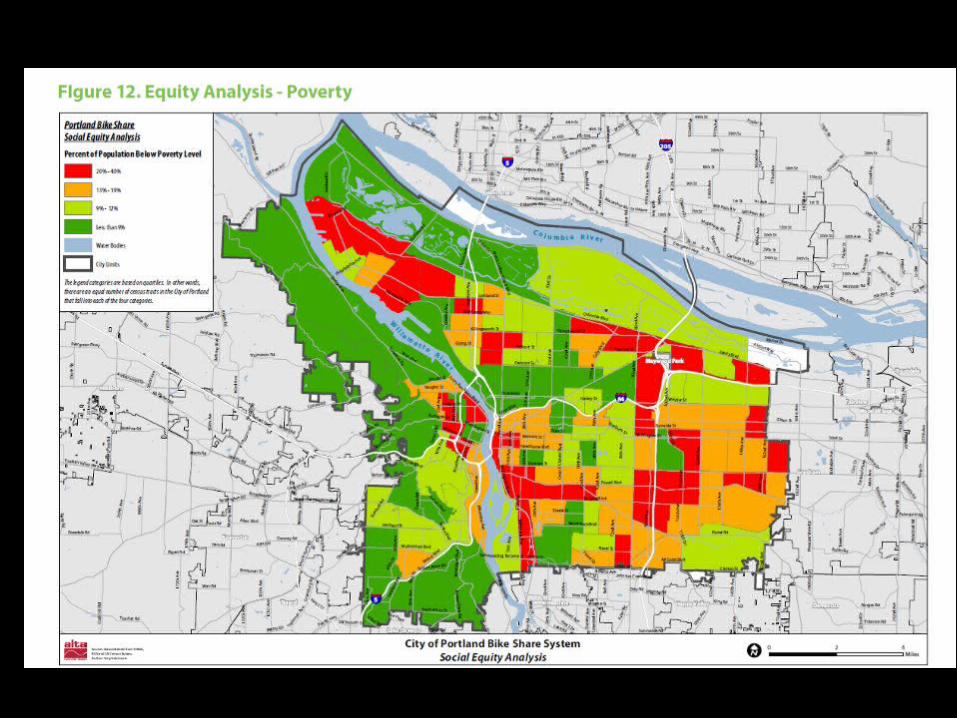
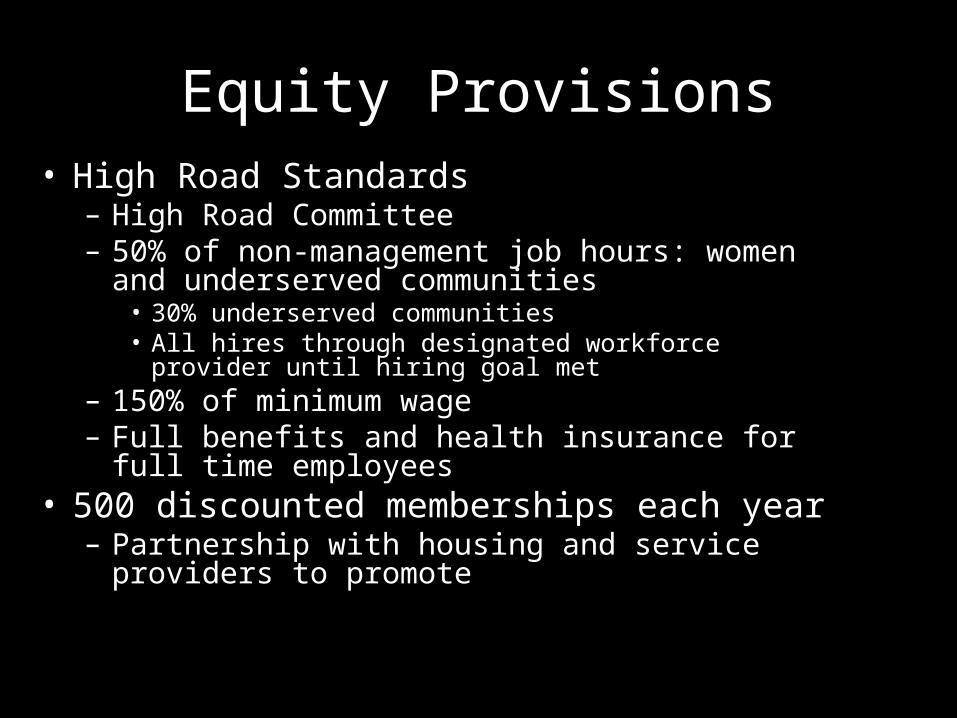
Equity Provisions• High Road Standards
– High Road Committee– 50% of non-management job hours: women and
underserved communities• 30% underserved communities• All hires through designated workforce provider until hiring
goal met– 150% of minimum wage– Full benefits and health insurance for full time
employees• 500 discounted memberships each year
– Partnership with housing and service providers to promote
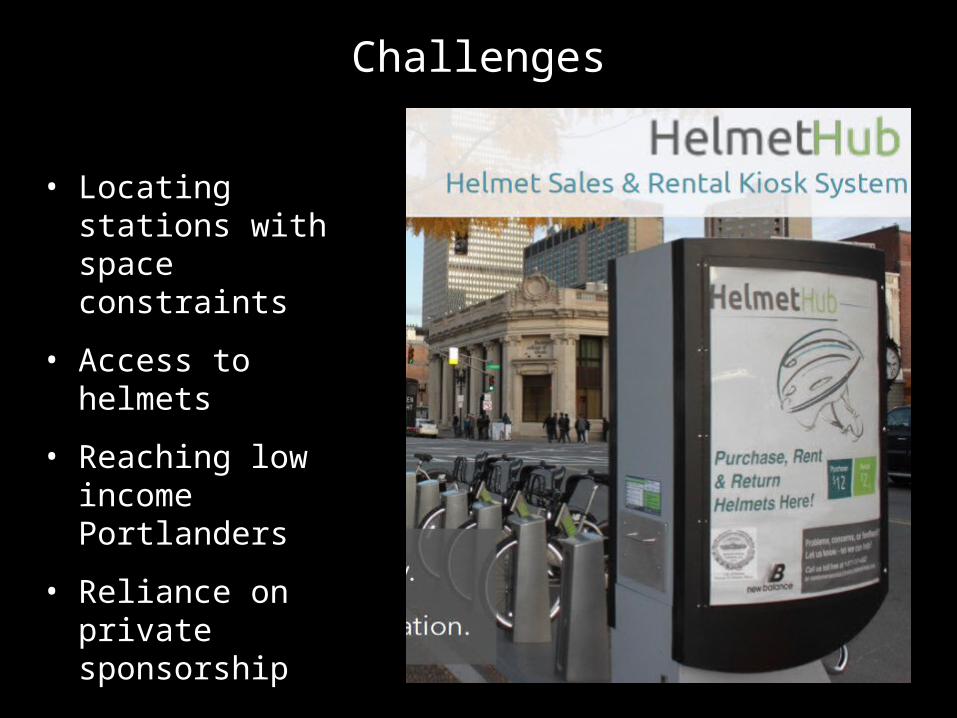
Challenges
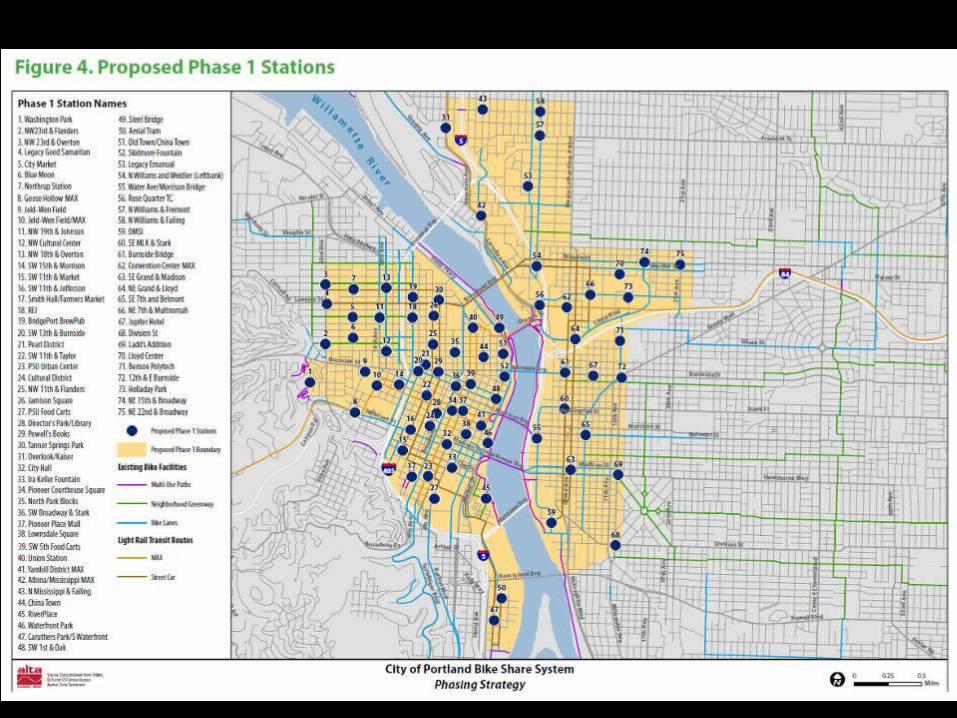
• Locating stations with space constraints
• Access to helmets
• Reaching low income Portlanders
• Reliance on private sponsorship

Industry Players: Suppliers
1. Public Bike System Company2. Bcycle
Other:-Bike Nation-Sandvault-8D-Social Bicycles
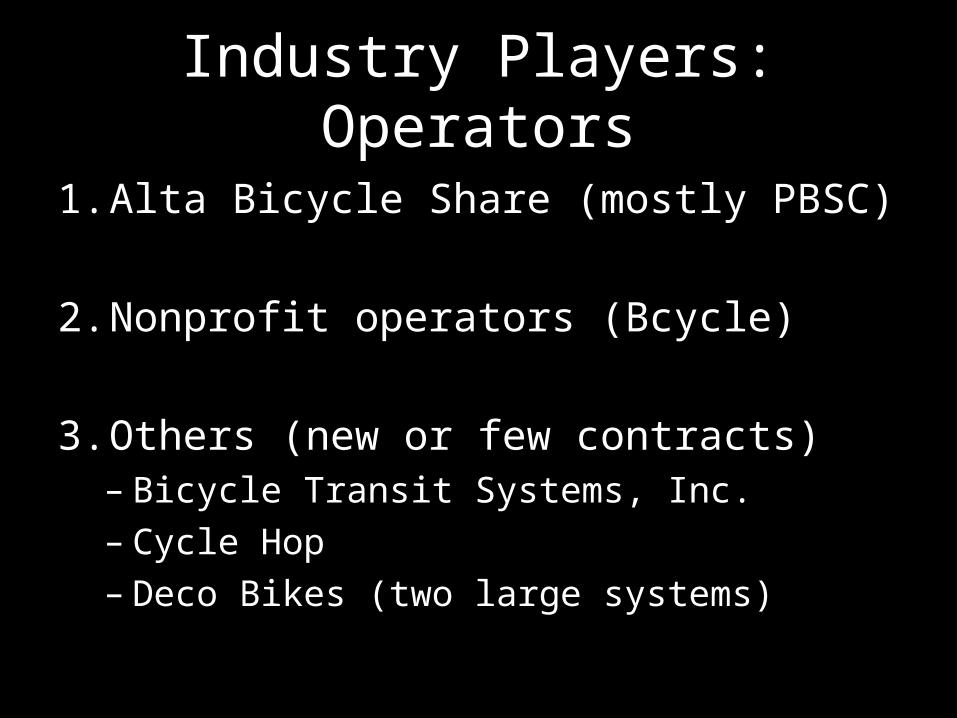
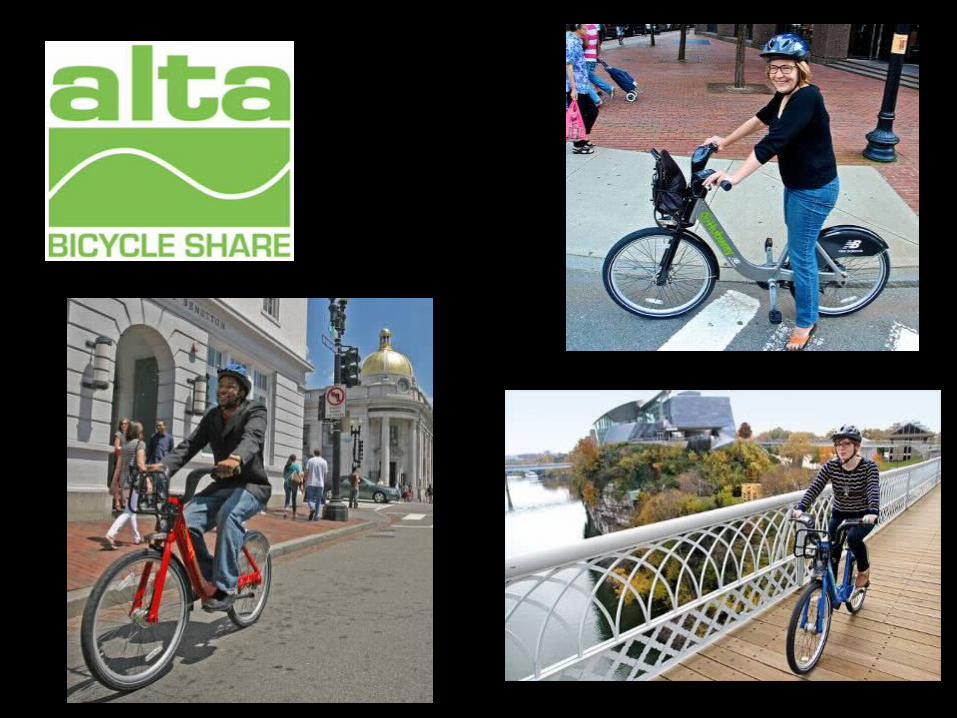
Industry Players: Operators
1. Alta Bicycle Share (mostly PBSC)
2. Nonprofit operators (Bcycle)
3. Others (new or few contracts)– Bicycle Transit Systems, Inc.– Cycle Hop– Deco Bikes (two large systems)
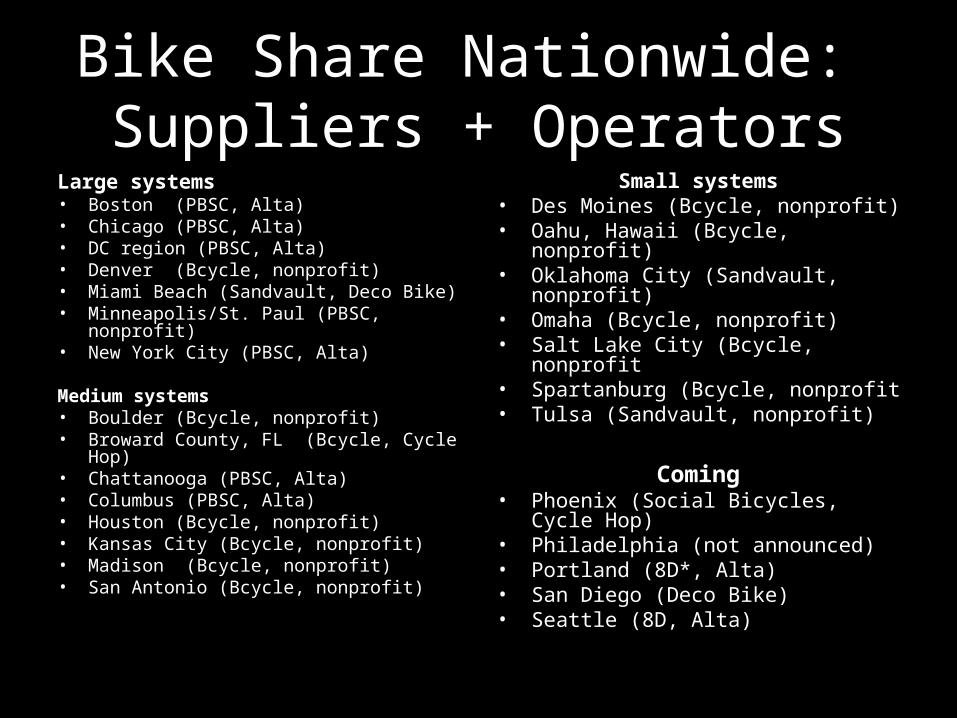
Bike Share Nationwide: Suppliers + Operators
Large systems• Boston (PBSC, Alta)• Chicago (PBSC, Alta)• DC region (PBSC, Alta)• Denver (Bcycle, nonprofit)• Miami Beach (Sandvault, Deco Bike)• Minneapolis/St. Paul (PBSC, nonprofit)• New York City (PBSC, Alta)
Medium systems• Boulder (Bcycle, nonprofit)• Broward County, FL (Bcycle, Cycle Hop)• Chattanooga (PBSC, Alta)• Columbus (PBSC, Alta)• Houston (Bcycle, nonprofit)• Kansas City (Bcycle, nonprofit)• Madison (Bcycle, nonprofit)• San Antonio (Bcycle, nonprofit)
Small systems• Des Moines (Bcycle, nonprofit)• Oahu, Hawaii (Bcycle, nonprofit)• Oklahoma City (Sandvault, nonprofit)• Omaha (Bcycle, nonprofit)• Salt Lake City (Bcycle, nonprofit• Spartanburg (Bcycle, nonprofit• Tulsa (Sandvault, nonprofit)
Coming• Phoenix (Social Bicycles, Cycle Hop)• Philadelphia (not announced)• Portland (8D*, Alta)• San Diego (Deco Bike)• Seattle (8D, Alta)
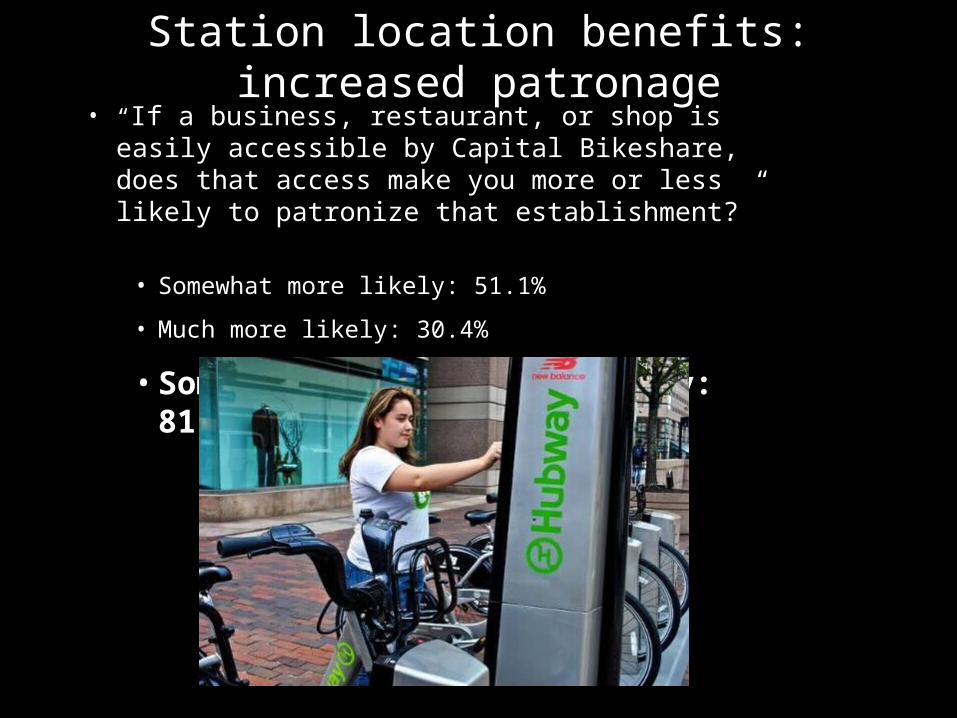
Station location benefits: increased patronage• “If a business, restaurant, or shop is easily accessible by
Capital Bikeshare, does that access make you more or less likely to patronize that establishment?”
• Somewhat more likely: 51.1%
• Much more likely: 30.4%
• Somewhat or much more likely: 81.5%