Embed Size (px)
Citation preview
July 2014
Emerging capital markets:The road to 2030
Research InstituteThought leadership from Credit Suisse Research
and the world’s foremost experts
Contents3 Introduction
4 Evolution of global capital markets
8 Global equity market expansion
from 1996 to 2030
18 Corporate bond market expansion
from 2005 to 2030
24 Sovereign bond market expansion
from 2005 to 2030
28 Capital markets opportunity in 2030
32 Global capital market revenue
outlook to 2030
33 Projected equity capital market
revenue to 2030
36 Projected debt capital market
revenue to 2030
39 Total primary capital markets
revenue opportunity
40 Growth in secondary equity activity
44 Implications for corporate capital
structures
46 Emerging debt and equity demand
52 Capital markets: key metrics
54 China – Becoming the world’s second
largest capital market
55 India – Second largest emerging
capital market
56 Korea – Domestic pension funds
sustain demand for assets
57 Brazil – A slower growth story than other
large EM countries
58 Russia – Deals set to accelerate in
bonds but stall in equities
59 Taiwan – A mature market with further
growth
60 Saudi Arabia – Liberalization could
drive rapid expansion
61 Indonesia – Second fastest growing
global capital market
63 Imprint/Disclaimer
Co
vE
RP
ho
To:
ISTo
CK
Ph
oTo
.Co
M/B
Ao
nA
, P
ho
To:
ISTo
CK
Ph
oTo
.Co
M/n
IKA
DA
For more information, please contact:
Richard Kersley, head of Global
Securities Products and Themes,
Credit Suisse Investment Banking,
Michael o’Sullivan, Chief Investment
officer, UK & EEMEA, Credit Suisse
Private Banking & Wealth Management,
michael.o’[email protected]
EMERGInG CAPITAL MARKETS_2
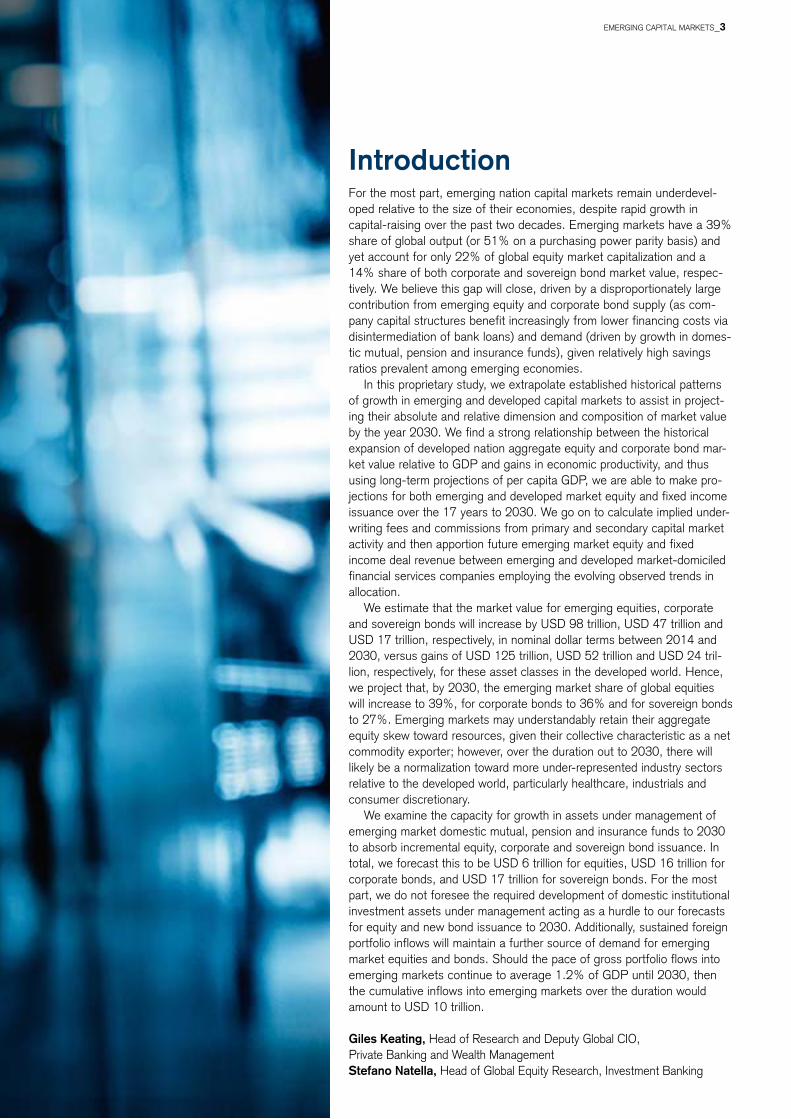
IntroductionFor the most part, emerging nation capital markets remain underdevel-oped relative to the size of their economies, despite rapid growth in capital-raising over the past two decades. Emerging markets have a 39% share of global output (or 51% on a purchasing power parity basis) and yet account for only 22% of global equity market capitalization and a 14% share of both corporate and sovereign bond market value, respec-tively. We believe this gap will close, driven by a disproportionately large contribution from emerging equity and corporate bond supply (as com-pany capital structures benefit increasingly from lower financing costs via disintermediation of bank loans) and demand (driven by growth in domes-tic mutual, pension and insurance funds), given relatively high savings ratios prevalent among emerging economies.
In this proprietary study, we extrapolate established historical patterns of growth in emerging and developed capital markets to assist in project-ing their absolute and relative dimension and composition of market value by the year 2030. We find a strong relationship between the historical expansion of developed nation aggregate equity and corporate bond mar-ket value relative to GDP and gains in economic productivity, and thus using long-term projections of per capita GDP, we are able to make pro-jections for both emerging and developed market equity and fixed income issuance over the 17 years to 2030. We go on to calculate implied under-writing fees and commissions from primary and secondary capital market activity and then apportion future emerging market equity and fixed income deal revenue between emerging and developed market-domiciled financial services companies employing the evolving observed trends in allocation.
We estimate that the market value for emerging equities, corporate and sovereign bonds will increase by USD 98 trillion, USD 47 trillion and USD 17 trillion, respectively, in nominal dollar terms between 2014 and 2030, versus gains of USD 125 trillion, USD 52 trillion and USD 24 tril-lion, respectively, for these asset classes in the developed world. hence, we project that, by 2030, the emerging market share of global equities will increase to 39%, for corporate bonds to 36% and for sovereign bonds to 27%. Emerging markets may understandably retain their aggregate equity skew toward resources, given their collective characteristic as a net commodity exporter; however, over the duration out to 2030, there will likely be a normalization toward more under-represented industry sectors relative to the developed world, particularly healthcare, industrials and consumer discretionary.
We examine the capacity for growth in assets under management of emerging market domestic mutual, pension and insurance funds to 2030 to absorb incremental equity, corporate and sovereign bond issuance. In total, we forecast this to be USD 6 trillion for equities, USD 16 trillion for corporate bonds, and USD 17 trillion for sovereign bonds. For the most part, we do not foresee the required development of domestic institutional investment assets under management acting as a hurdle to our forecasts for equity and new bond issuance to 2030. Additionally, sustained foreign portfolio inflows will maintain a further source of demand for emerging market equities and bonds. Should the pace of gross portfolio flows into emerging markets continue to average 1.2% of GDP until 2030, then the cumulative inflows into emerging markets over the duration would amount to USD 10 trillion.
Giles Keating, head of Research and Deputy Global CIo, Private Banking and Wealth ManagementStefano Natella, head of Global Equity Research, Investment Banking
EMERGInG CAPITAL MARKETS_3
Evolution of global capital marketsWe extrapolate established historical patterns of growth in emerging and developed capital markets to assist in projecting their absolute and relative dimensions and composition by the year 2030. We estimate the aggregate global capital markets opportunity (equities, corporate and sovereign bonds) in 2014 at USD 153 trillion, rising to USD 515 trillion by 2030.
Ph
oTo
: IS
ToC
KP
ho
To.C
om
/mo
RD
olF
F
EMERGInG CAPITAL MARKETS_4

Ph
oTo
: IS
ToC
KP
ho
To.C
om
/mo
RD
olF
F
EMERGInG CAPITAL MARKETS_5
0%
10%
20%
30%
40%
50%
60%
1996 1998 2000 2002 2004 2006 2008 2010 2012 2014 2016 2018 2020
GDP (PPP) GDP (current dollar)
1996 1998 2000 2002 2004 2006 2008 2010 2012 2014
Equity Corporate Sovereign
0%
10%
20%
30%
40%
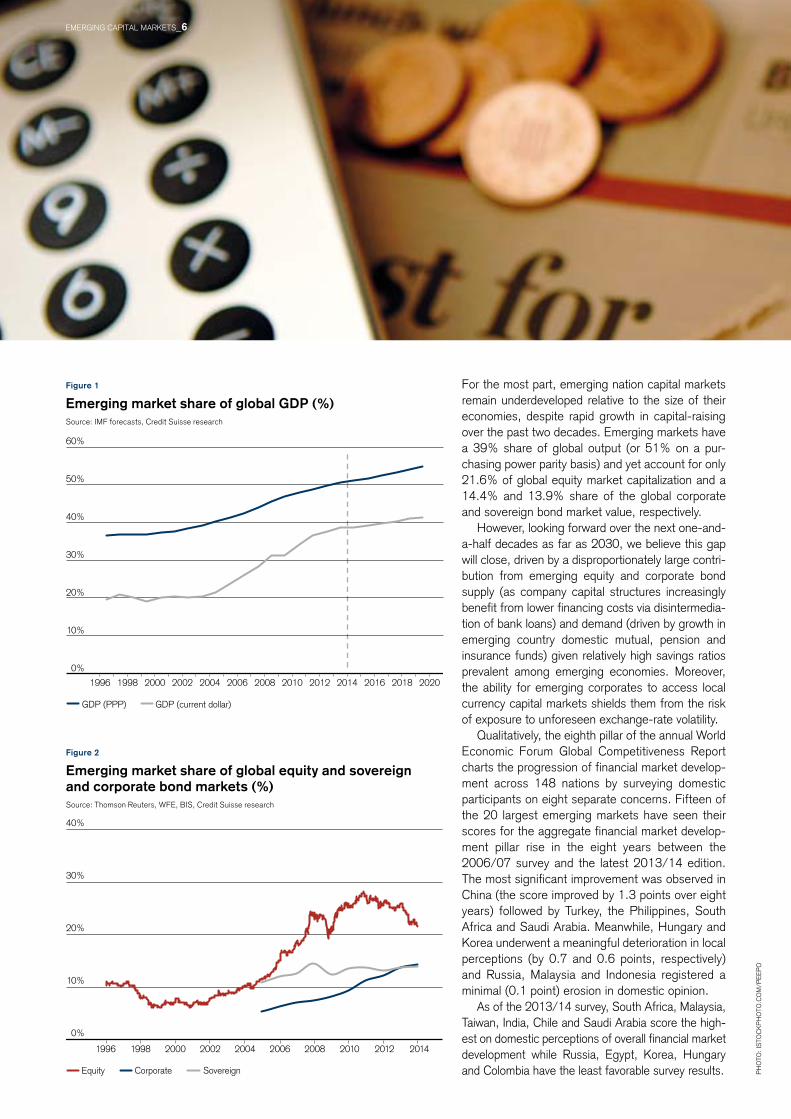
For the most part, emerging nation capital markets remain underdeveloped relative to the size of their economies, despite rapid growth in capital-raising over the past two decades. Emerging markets have a 39% share of global output (or 51% on a pur-chasing power parity basis) and yet account for only 21.6% of global equity market capitalization and a 14.4% and 13.9% share of the global corporate and sovereign bond market value, respectively.
however, looking forward over the next one-and-a-half decades as far as 2030, we believe this gap will close, driven by a disproportionately large contri-bution from emerging equity and corporate bond supply (as company capital structures increasingly benefit from lower financing costs via disintermedia-tion of bank loans) and demand (driven by growth in emerging country domestic mutual, pension and insurance funds) given relatively high savings ratios prevalent among emerging economies. Moreover, the ability for emerging corporates to access local currency capital markets shields them from the risk of exposure to unforeseen exchange-rate volatility.
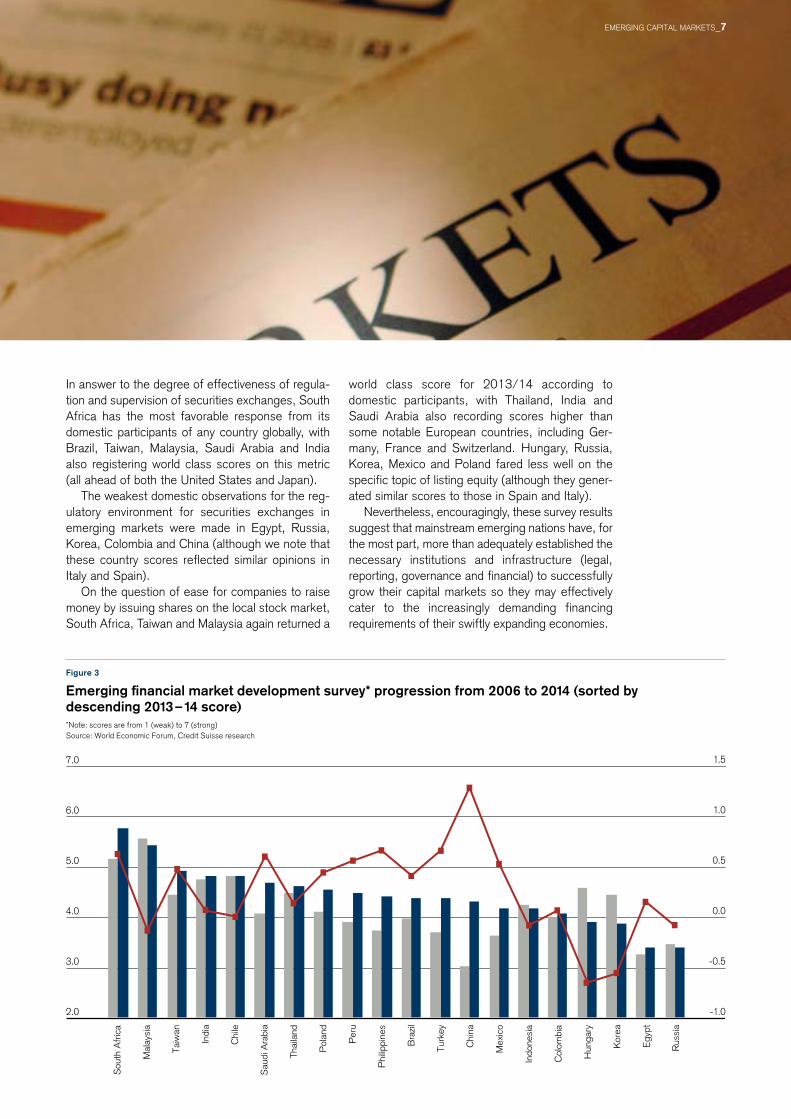
Qualitatively, the eighth pillar of the annual World Economic Forum Global Competitiveness Report charts the progression of financial market develop-ment across 148 nations by surveying domestic participants on eight separate concerns. Fifteen of the 20 largest emerging markets have seen their scores for the aggregate financial market develop-ment pillar rise in the eight years between the 2006/07 survey and the latest 2013/14 edition. The most significant improvement was observed in China (the score improved by 1.3 points over eight years) followed by Turkey, the Philippines, South Africa and Saudi Arabia. Meanwhile, hungary and Korea underwent a meaningful deterioration in local perceptions (by 0.7 and 0.6 points, respectively) and Russia, Malaysia and Indonesia registered a minimal (0.1 point) erosion in domestic opinion.
As of the 2013/14 survey, South Africa, Malaysia, Taiwan, India, Chile and Saudi Arabia score the high-est on domestic perceptions of overall financial market development while Russia, Egypt, Korea, hungary and Colombia have the least favorable survey results.
Figure 1
Emerging market share of global GDP (%)Source: IMF forecasts, Credit Suisse research
Figure 2
Emerging market share of global equity and sovereign and corporate bond markets (%)Source: Thomson Reuters, WFE, BIS, Credit Suisse research
Ph
oTo
: IS
ToC
KP
ho
To.C
oM
/PE
EP
o
EMERGInG CAPITAL MARKETS_6
-1.0
-0.5
0.0
0.5
1.0
1.5
2.0
3.0
4.0
5.0
6.0
7.0
Sou
th A
fric
a
Mal
aysi
a
Taiw
an
Indi
a
Chi
le
Sau
di A
rabi
a
Thai
land
Pol
and
Per
u
Phi
lippi
nes
Bra
zil
Turk
ey
Chi
na
Mex
ico
Indo
nesi
a
Col
ombi
a
Hun
gary
Kor
ea
Egy
pt
Rus
sia
2006–2007 2013–2014 diff.
In answer to the degree of effectiveness of regula-tion and supervision of securities exchanges, South Africa has the most favorable response from its domestic participants of any country globally, with Brazil, Taiwan, Malaysia, Saudi Arabia and India also registering world class scores on this metric (all ahead of both the United States and Japan).
The weakest domestic observations for the reg-ulatory environment for securities exchanges in emerging markets were made in Egypt, Russia, Korea, Colombia and China (although we note that these country scores reflected similar opinions in Italy and Spain).
on the question of ease for companies to raise money by issuing shares on the local stock market, South Africa, Taiwan and Malaysia again returned a
world class score for 2013/14 according to domestic participants, with Thailand, India and Saudi Arabia also recording scores higher than some notable European countries, including Ger-many, France and Switzerland. hungary, Russia, Korea, Mexico and Poland fared less well on the specific topic of listing equity (although they gener-ated similar scores to those in Spain and Italy).
nevertheless, encouragingly, these survey results suggest that mainstream emerging nations have, for the most part, more than adequately established the necessary institutions and infrastructure (legal, re porting, governance and financial) to successfully grow their capital markets so they may effectively cater to the increasingly demanding financing re quirements of their swiftly expanding economies.
Figure 3
Emerging financial market development survey* progression from 2006 to 2014 (sorted by descending 2013 – 14 score)*note: scores are from 1 (weak) to 7 (strong) Source: World Economic Forum, Credit Suisse research
Ph
oTo
: IS
ToC
KP
ho
To.C
oM
/PE
EP
o
EMERGInG CAPITAL MARKETS_7
We extrapolate established historical patterns of growth in emerging and developed equity markets to assist in projecting their absolute and relative dimension and composition of equity capitalization by the year 2030. Moreover, we decompose our forecast increase in aggregate common sharehold-ers’ equity (book value) to obtain an estimate for net issuance and inclusions, from which we calcu-late implied underwriting fees and commissions from primary and secondary equity activity. We then apportion future emerging market equity deals between financial services companies domiciled in emerging and developed markets, employing the evolving observed trends in allocation.
Identifying the focus of global equity markets within this study
This study focuses on a group of 34 countries: 20 emerging markets (19 of which are the largest con-stituents of the MSCI EM benchmark and, in addi-tion, Saudi Arabia) and 14 developed nations that are helpful for drawing precedents and provide a basis for future relative size comparisons (we include the 13 largest developed equity markets in addition to Israel, which was promoted to devel-oped from emerging market status by MSCI in May 2010). We have elected to exclude the frontier equity markets from this work (such as UAE, Qatar, Kuwait and nigeria among the more noteworthy – the former two of which were promoted by MSCI to emerging market status in June 2014) as, in the context of analysis within this study, the necessary
historical data are for the most part unavailable. We include the China A shares market in our analysis, with the assumption that the country’s capital account will liberalize over the duration of the next 17 years thus facilitating foreign access to Chinese domestic equity.
however, for the sake of consistency, we have maintained emerging and developed region country definitions throughout, although we recognize that, by 2030, it is likely that a number of country pro-motions (from emerging to developed and indeed frontier to emerging status) by index providers (such as MSCI and FTSE) will have taken place. The most significant candidates under consider-ation are Korea and Taiwan (both under MSCI review for promotion).
magnitude and composition of global equity market enlargement over 18 years
Since 1996, global equity market capitalization (for the 34 countries considered in this study) has grown (in nominal dollar terms) by USD 45.2 trillion (from USD 16.6 trillion to USD 61.8 trillion) at a compound annual growth rate (CAGR) of 7.6%.
In aggregate, for the 18-year period over which most country data are available, emerging equity market capitalization has grown by USD 11.6 tril-lion from USD 1.8 trillion in January 1996 to USD 13.3 trillion by January 2014. The leading con-tributor has been net issuance and index inclu-sions of USD 6.0 trillion, and price gains realized in local currency terms (driven by delivered and
Global equity market expansion from 1996 to 2030
Ph
oTo
: IS
ToC
KP
ho
To.C
oM
/nIK
AD
A
EMERGInG CAPITAL MARKETS_8
Local currency price gain FX gain Net issuance and inclusions
USD bn
01/1996 01/1999 01/2002 01/2005 01/2008 01/2011 01/2014
-5,000
0
5,000
10,000
15,000
20,000
25,000
Local currency price gain FX gain Net issuance and inclusions
-2,000
0
2,000
4,000
6,000
8,000
10,000 USD bn
01/1996 01/1999 01/2002 01/2005 01/2008 01/2011 01/2014
Figure 4
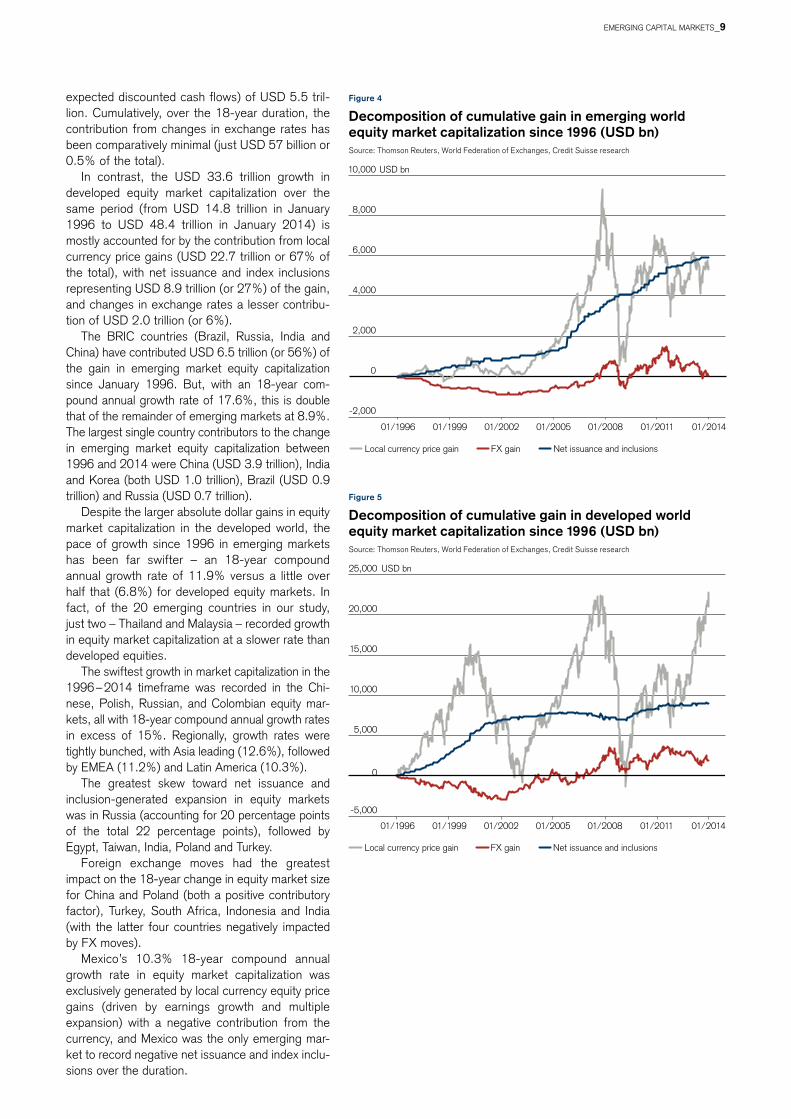
Decomposition of cumulative gain in emerging world equity market capitalization since 1996 (USD bn)Source: Thomson Reuters, World Federation of Exchanges, Credit Suisse research
Figure 5
Decomposition of cumulative gain in developed world equity market capitalization since 1996 (USD bn)Source: Thomson Reuters, World Federation of Exchanges, Credit Suisse research
expected discounted cash flows) of USD 5.5 tril-lion. Cumulatively, over the 18-year duration, the contribution from changes in exchange rates has been comparatively minimal (just USD 57 billion or 0.5% of the total).
In contrast, the USD 33.6 trillion growth in developed equity market capitalization over the same period (from USD 14.8 trillion in January 1996 to USD 48.4 trillion in January 2014) is mostly accounted for by the contribution from local currency price gains (USD 22.7 trillion or 67% of the total), with net issuance and index inclusions representing USD 8.9 trillion (or 27%) of the gain, and changes in exchange rates a lesser contribu-tion of USD 2.0 trillion (or 6%).
The BRIC countries (Brazil, Russia, India and China) have contributed USD 6.5 trillion (or 56%) of the gain in emerging market equity capitaliza tion since January 1996. But, with an 18-year com-pound annual growth rate of 17.6%, this is double that of the remainder of emerging markets at 8.9%. The largest single country contributors to the change in emerging market equity capitalization between 1996 and 2014 were China (USD 3.9 trillion), India and Korea (both USD 1.0 trillion), Brazil (USD 0.9 trillion) and Russia (USD 0.7 trillion).
Despite the larger absolute dollar gains in equity market capitalization in the developed world, the pace of growth since 1996 in emerging markets has been far swifter – an 18-year compound annual growth rate of 11.9% versus a little over half that (6.8%) for developed equity markets. In fact, of the 20 emerging countries in our study, just two – Thailand and Malaysia – recorded growth in equity market capitalization at a slower rate than developed equities.
The swiftest growth in market capitalization in the 1996 – 2014 timeframe was recorded in the Chi-nese, Polish, Russian, and Colombian equity mar-kets, all with 18-year compound annual growth rates in excess of 15%. Regionally, growth rates were tightly bunched, with Asia leading (12.6%), followed by EMEA (11.2%) and Latin America (10.3%).
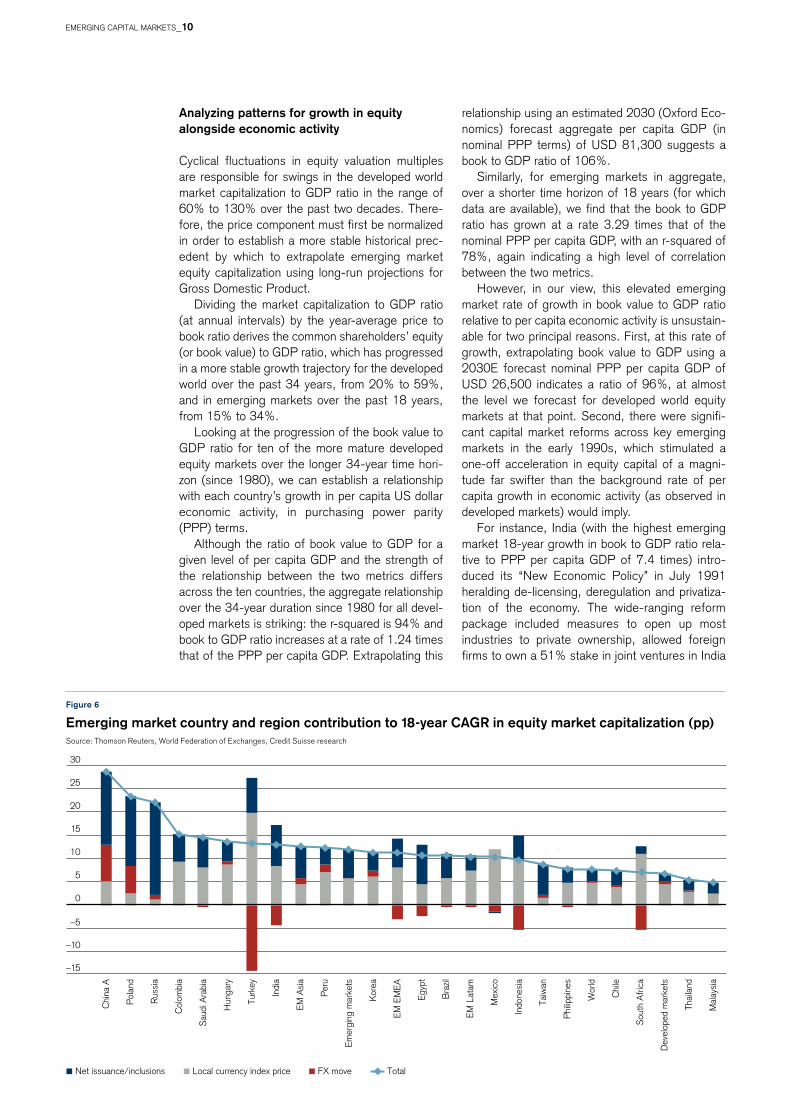
The greatest skew toward net issuance and inclusion-generated expansion in equity markets was in Russia (accounting for 20 percentage points of the total 22 percentage points), followed by Egypt, Taiwan, India, Poland and Turkey.
Foreign exchange moves had the greatest impact on the 18-year change in equity market size for China and Poland (both a positive contributory factor), Turkey, South Africa, Indonesia and India (with the latter four countries negatively impacted by FX moves).
Mexico’s 10.3% 18-year compound annual growth rate in equity market capitalization was exclusively generated by local currency equity price gains (driven by earnings growth and multiple expansion) with a negative contribution from the currency, and Mexico was the only emerging mar-ket to record negative net issuance and index inclu-sions over the duration.P
ho
To:
ISTo
CK
Ph
oTo
.Co
M/n
IKA
DA
EMERGInG CAPITAL MARKETS_9
Net issuance/inclusions Local currency index price TotalFX move
–15
–10
–5
0
5
10
15
20
25
30
Chi
na A
Pol
and
Rus
sia
Col
ombi
a
Sau
di A
rabi
a
Hun
gary
Turk
ey
Indi
a
EM A
sia
Per
u
Emer
ging
mar
kets
Kor
ea
EM E
MEA
Egyp
t
Bra
zil
EM L
atam
Mex
ico
Indo
nesi
a
Taiw
an
Phi
lippi
nes
Wor
ld
Chi
le
Sou
th A
frica
Dev
elop
ed m
arke
ts
Thai
land
Mal
aysi
a
Analyzing patterns for growth in equity alongside economic activity
Cyclical fluctuations in equity valuation multiples are responsible for swings in the developed world market capitalization to GDP ratio in the range of 60% to 130% over the past two decades. There-fore, the price component must first be normalized in order to establish a more stable historical prec-edent by which to extrapolate emerging market equity capitalization using long-run projections for Gross Domestic Product.
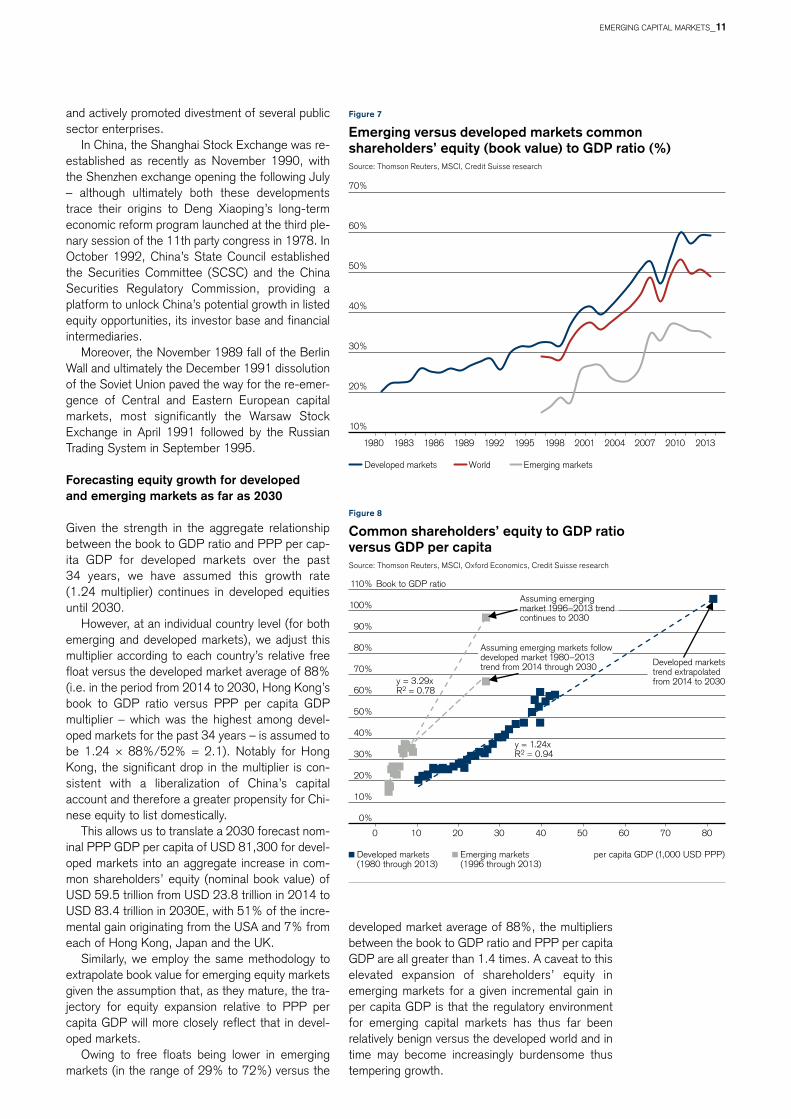
Dividing the market capitalization to GDP ratio (at annual intervals) by the year-average price to book ratio derives the common shareholders’ equity (or book value) to GDP ratio, which has progressed in a more stable growth trajectory for the developed world over the past 34 years, from 20% to 59%, and in emerging markets over the past 18 years, from 15% to 34%.
Looking at the progression of the book value to GDP ratio for ten of the more mature developed equity markets over the longer 34-year time hori-zon (since 1980), we can establish a relationship with each country’s growth in per capita US dollar economic activity, in purchasing power parity (PPP) terms.
Although the ratio of book value to GDP for a given level of per capita GDP and the strength of the relationship between the two metrics differs across the ten countries, the aggregate relationship over the 34-year duration since 1980 for all devel-oped markets is striking: the r-squared is 94% and book to GDP ratio increases at a rate of 1.24 times that of the PPP per capita GDP. Extrapolating this
relationship using an estimated 2030 (oxford Eco-nomics) forecast aggregate per capita GDP (in nominal PPP terms) of USD 81,300 suggests a book to GDP ratio of 106%.
Similarly, for emerging markets in aggregate, over a shorter time horizon of 18 years (for which data are available), we find that the book to GDP ratio has grown at a rate 3.29 times that of the nominal PPP per capita GDP, with an r-squared of 78%, again indicating a high level of correlation between the two metrics.
however, in our view, this elevated emerging market rate of growth in book value to GDP ratio relative to per capita economic activity is unsustain-able for two principal reasons. First, at this rate of growth, extrapolating book value to GDP using a 2030E forecast nominal PPP per capita GDP of USD 26,500 indicates a ratio of 96%, at almost the level we forecast for developed world equity markets at that point. Second, there were signifi-cant capital market reforms across key emerging markets in the early 1990s, which stimulated a one-off acceleration in equity capital of a magni-tude far swifter than the background rate of per capita growth in economic activity (as observed in developed markets) would imply.
For instance, India (with the highest emerging market 18-year growth in book to GDP ratio rela-tive to PPP per capita GDP of 7.4 times) intro-duced its “new Economic Policy” in July 1991 heralding de-licensing, deregulation and privatiza-tion of the economy. The wide-ranging reform package included measures to open up most industries to private ownership, allowed foreign firms to own a 51% stake in joint ventures in India
Figure 6
Emerging market country and region contribution to 18-year CAGR in equity market capitalization (pp)Source: Thomson Reuters, World Federation of Exchanges, Credit Suisse research
EMERGInG CAPITAL MARKETS_10
Developed markets World Emerging markets
10%
20%
30%
40%
50%
60%
70%
1980 1983 1986 1989 1992 1995 1998 2001 2004 2007 2010 2013
y = 3.29xR2 = 0.78
y = 1.24xR2 = 0.94
0%
10%
20%
30%
40%
50%
60%
70%
80%
90%
100%
110%
0 10 20 30 40 50 60 70 80
Book to GDP ratio
per capita GDP (1,000 USD PPP)
Developed markets trend extrapolated from 2014 to 2030
Developed markets(1980 through 2013)
Emerging markets(1996 through 2013)
Assuming emerging market 1996–2013 trend continues to 2030
Assuming emerging markets follow developed market 1980–2013 trend from 2014 through 2030
Figure 7
Emerging versus developed markets common shareholders’ equity (book value) to GDP ratio (%)Source: Thomson Reuters, MSCI, Credit Suisse research
Figure 8
Common shareholders’ equity to GDP ratio versus GDP per capitaSource: Thomson Reuters, MSCI, oxford Economics, Credit Suisse research
and actively promoted divestment of several public sector enterprises.
In China, the Shanghai Stock Exchange was re-established as recently as november 1990, with the Shenzhen exchange opening the following July – although ultimately both these developments trace their origins to Deng Xiaoping’s long-term economic reform program launched at the third ple-nary session of the 11th party congress in 1978. In october 1992, China’s State Council established the Securities Committee (SCSC) and the China Securities Regulatory Commission, providing a platform to unlock China’s potential growth in listed equity opportunities, its investor base and financial intermediaries.
Moreover, the november 1989 fall of the Berlin Wall and ultimately the December 1991 dissolution of the Soviet Union paved the way for the re-emer-gence of Central and Eastern European capital markets, most significantly the Warsaw Stock Exchange in April 1991 followed by the Russian Trading System in September 1995.
Forecasting equity growth for developed and emerging markets as far as 2030
Given the strength in the aggregate relationship between the book to GDP ratio and PPP per cap-ita GDP for developed markets over the past 34 years, we have assumed this growth rate (1.24 multiplier) continues in developed equities until 2030.
however, at an individual country level (for both emerging and developed markets), we adjust this multiplier according to each country’s relative free float versus the developed market average of 88% (i.e. in the period from 2014 to 2030, hong Kong’s book to GDP ratio versus PPP per capita GDP multiplier – which was the highest among devel-oped markets for the past 34 years – is assumed to be 1.24 × 88%/52% = 2.1). notably for hong Kong, the significant drop in the multiplier is con-sistent with a liberalization of China’s capital account and therefore a greater propensity for Chi-nese equity to list domestically.
This allows us to translate a 2030 forecast nom-inal PPP GDP per capita of USD 81,300 for devel-oped markets into an aggregate increase in com-mon shareholders’ equity (nominal book value) of USD 59.5 trillion from USD 23.8 trillion in 2014 to USD 83.4 trillion in 2030E, with 51% of the incre-mental gain originating from the USA and 7% from each of hong Kong, Japan and the UK.
Similarly, we employ the same methodology to extrapolate book value for emerging equity markets given the assumption that, as they mature, the tra-jectory for equity expansion relative to PPP per capita GDP will more closely reflect that in devel-oped markets.
owing to free floats being lower in emerging markets (in the range of 29% to 72%) versus the
developed market average of 88%, the multipliers between the book to GDP ratio and PPP per capita GDP are all greater than 1.4 times. A caveat to this elevated expansion of shareholders’ equity in emerging markets for a given incremental gain in per capita GDP is that the regulatory environment for emerging capital markets has thus far been relatively benign versus the developed world and in time may become increasingly burdensome thus tempering growth.
EMERGInG CAPITAL MARKETS_11
Country/Region Book value lT median Equity mkt. cap (USD bn) Weight within Em/Dm region Weight within global equities
2030E (USD bn)
PBR (x)
Jan 2014
2030E 17-year CAGR
Jan 2014 (%)
2030E (%)
gain (pp)
Jan 2014 (%)
2030E (%)
gain (pp)
Brazil 2,970 1.47 1,020 4,354 8.4% 7.7 3.9 -3.7 1.7 1.5 -0.1
Chile 910 1.72 265 1,565 10.4% 2.0 1.4 -0.6 0.4 0.6 0.1
China A 39,409 1.36 3,949 53,597 15.6% 29.6 48.2 18.6 6.4 18.9 12.5
Colombia 707 1.16 203 821 8.1% 1.5 0.7 -0.8 0.3 0.3 0.0
Egypt 294 1.96 62 574 13.2% 0.5 0.5 0.1 0.1 0.2 0.1
hungary 147 1.56 20 229 14.6% 0.1 0.2 0.1 0.0 0.1 0.0
India 4,123 2.17 1,139 8,947 12.1% 8.5 8.1 -0.5 1.8 3.1 1.3
Indonesia 1,441 2.99 347 4,308 15.0% 2.6 3.9 1.3 0.6 1.5 1.0
Korea 4,698 1.17 1,235 5,497 8.7% 9.3 4.9 -4.3 2.0 1.9 -0.1
Malaysia 1,335 1.80 500 2,403 9.1% 3.8 2.2 -1.6 0.8 0.8 0.0
Mexico 1,297 1.88 526 2,438 8.9% 3.9 2.2 -1.8 0.9 0.9 0.0
Peru 371 1.69 81 627 12.0% 0.6 0.6 0.0 0.1 0.2 0.1
Philippines 759 1.61 217 1,222 10.1% 1.6 1.1 -0.5 0.4 0.4 0.1
Poland 1,035 1.56 205 1,614 12.2% 1.5 1.5 -0.1 0.3 0.6 0.2
Russia 5,826 1.03 771 5,989 12.1% 5.8 5.4 -0.4 1.2 2.1 0.9
Saudi Arabia 2,349 1.84 467 4,323 13.2% 3.5 3.9 0.4 0.8 1.5 0.8
South Africa 1,387 2.23 943 3,092 6.8% 7.1 2.8 -4.3 1.5 1.1 -0.4
Taiwan 2,051 1.97 823 4,041 9.2% 6.2 3.6 -2.5 1.3 1.4 0.1
Thailand 1,115 2.16 354 2,408 11.2% 2.7 2.2 -0.5 0.6 0.8 0.3
Turkey 1,801 1.69 196 3,043 16.5% 1.5 2.7 1.3 0.3 1.1 0.8
Em Asia 54,932 1.50 8,564 82,423 13.4% 64.3 74.2 9.9 13.9 29.0 15.1
Em EmEA 12,838 1.47 2,663 18,865 11.5% 20.0 17.0 -3.0 4.3 6.6 2.3
Em latam 6,255 1.57 2,095 9,804 9.0% 15.7 8.8 -6.9 3.4 3.4 0.1
BRIC 52,328 1.39 6,879 72,886 14.0% 51.6 65.6 14.0 11.1 25.6 14.5
Emerging markets 74,024 1.50 13,322 111,092 12.5% 100.0 100.0 21.6 39.1 17.5
Australia 3,108 1.82 1,366 5,641 8.2% 2.8 3.3 0.4 2.2 2.0 -0.2
Canada 3,751 1.76 2,114 6,602 6.5% 4.4 3.8 -0.6 3.4 2.3 -1.1
France 3,559 1.60 2,138 5,677 5.6% 4.4 3.3 -1.1 3.5 2.0 -1.5
Germany 4,162 1.68 1,936 6,971 7.4% 4.0 4.0 0.0 3.1 2.5 -0.7
hong Kong 6,197 1.54 3,101 9,512 6.4% 6.4 5.5 -0.9 5.0 3.3 -1.7
Israel 646 2.03 203 1,311 10.9% 0.4 0.8 0.3 0.3 0.5 0.1
Italy 1,921 1.67 626 3,208 9.5% 1.3 1.9 0.6 1.0 1.1 0.1
Japan 7,436 1.76 4,543 13,087 6.1% 9.4 7.6 -1.8 7.4 4.6 -2.8
netherlands 887 1.51 545 1,340 5.1% 1.1 0.8 -0.4 0.9 0.5 -0.4
Singapore 2,259 1.41 744 3,185 8.4% 1.5 1.8 0.3 1.2 1.1 -0.1
Spain 1,928 1.73 1,117 3,336 6.3% 2.3 1.9 -0.4 1.8 1.2 -0.6
Switzerland 1,278 1.86 1,541 2,371 2.4% 3.2 1.4 -1.8 2.5 0.8 -1.7
UK 6,831 1.84 4,429 12,569 6.0% 9.1 7.3 -1.9 7.2 4.4 -2.7
US 39,415 2.50 24,035 98,341 8.1% 49.6 56.8 7.2 38.9 34.6 -4.3
Developed markets 83,379 2.03 48,437 173,151 7.3% 100.0 100.0 78.4 60.9 -17.5
World 157,403 2.03 61,759 284,243 8.9% 100.0 100.0
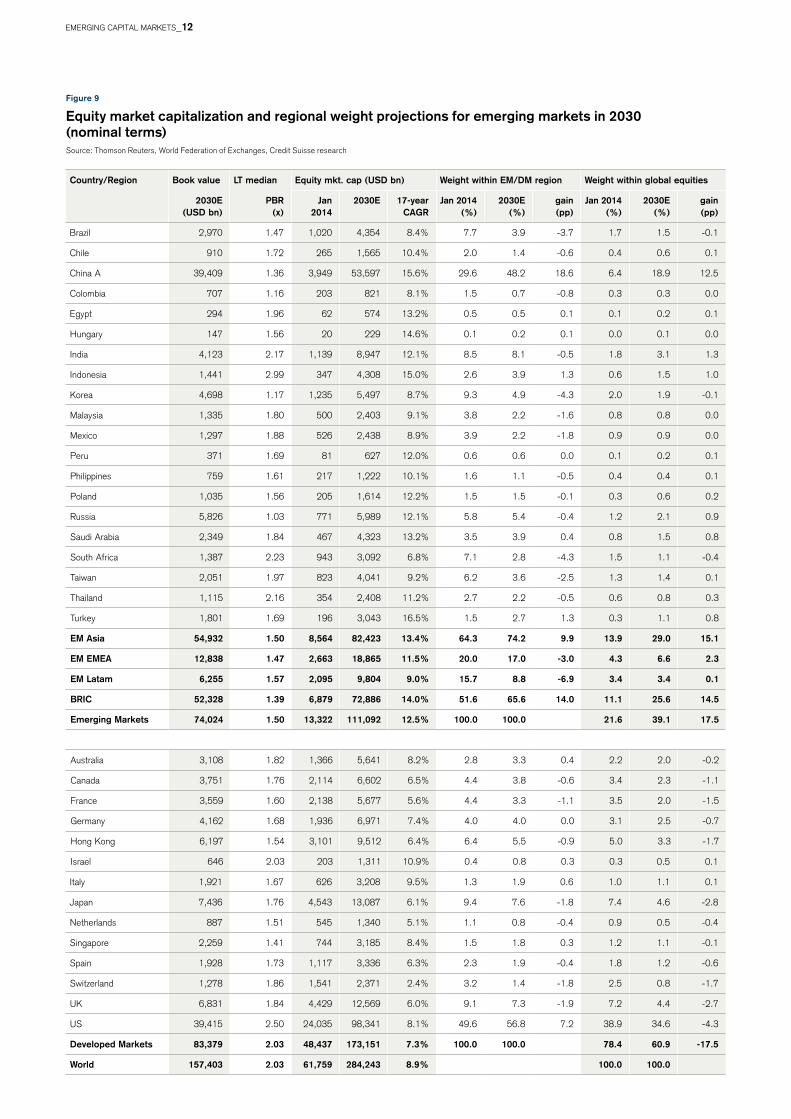
Figure 9
Equity market capitalization and regional weight projections for emerging markets in 2030 (nominal terms)Source: Thomson Reuters, World Federation of Exchanges, Credit Suisse research
EMERGInG CAPITAL MARKETS_12
Developed markets China Emerging markets ex China and India India
20
200
2,000
20,000
200,000 USD bn
12/1
978
12/1
982
12/1
986
12/1
990
12/1
994
12/1
998
12/2
002
12/2
006
12/2
010
12/2
014
12/2
018
12/2
022
12/2
026
12/2
030
USD bn
12/1
978
12/1
982
12/1
986
12/1
990
12/1
994
12/1
998
12/2
002
12/2
006
12/2
010
12/2
014
12/2
018
12/2
022
12/2
026
12/2
030
0
50,000
100,000
150,000
200,000
250,000
300,000
Developed markets China IndiaEmerging markets ex China and India
Global equity market capitalization and country weights in 2030
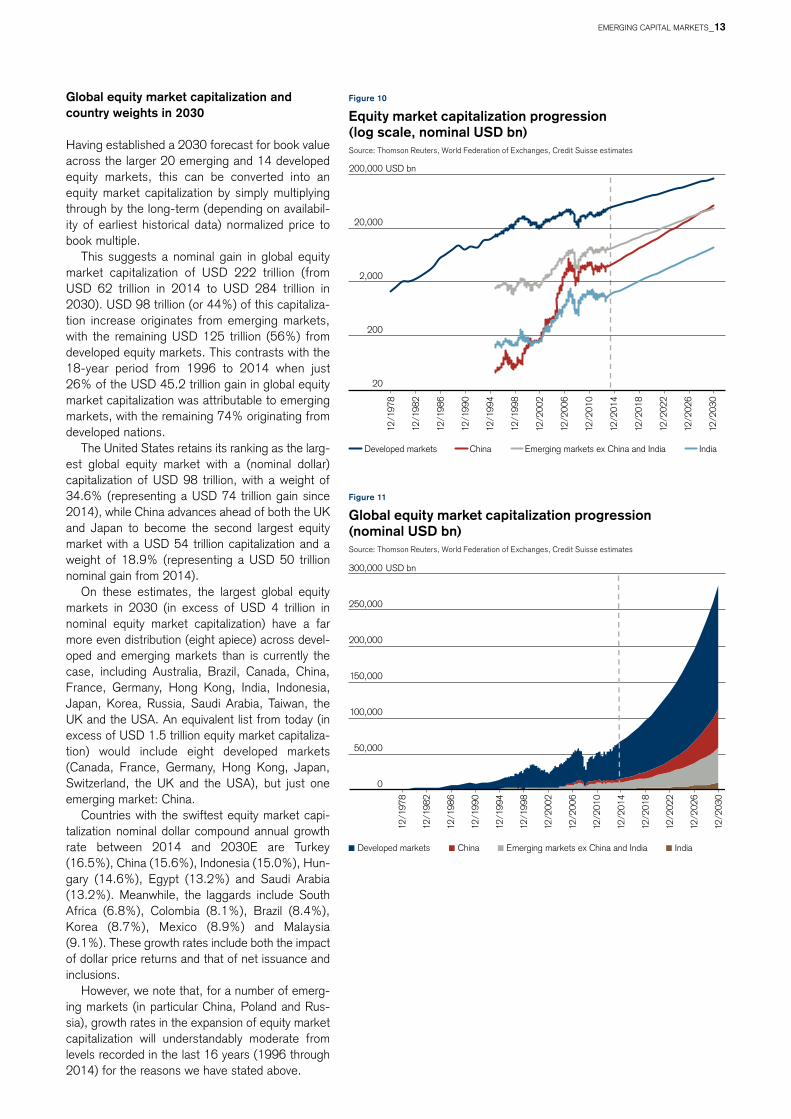
having established a 2030 forecast for book value across the larger 20 emerging and 14 developed equity markets, this can be converted into an equity market capitalization by simply multiplying through by the long-term (depending on availabil-ity of earliest historical data) normalized price to book multiple.
This suggests a nominal gain in global equity market capitalization of USD 222 trillion (from USD 62 trillion in 2014 to USD 284 trillion in 2030). USD 98 trillion (or 44%) of this capitaliza-tion increase originates from emerging markets, with the remaining USD 125 trillion (56%) from developed equity markets. This contrasts with the 18-year period from 1996 to 2014 when just 26% of the USD 45.2 trillion gain in global equity market capitalization was attributable to emerging markets, with the remaining 74% originating from developed nations.
The United States retains its ranking as the larg-est global equity market with a (nominal dollar) capitalization of USD 98 trillion, with a weight of 34.6% (representing a USD 74 trillion gain since 2014), while China advances ahead of both the UK and Japan to become the second largest equity market with a USD 54 trillion capitalization and a weight of 18.9% (representing a USD 50 trillion nominal gain from 2014).
on these estimates, the largest global equity markets in 2030 (in excess of USD 4 trillion in nominal equity market capitalization) have a far more even distribution (eight apiece) across devel-oped and emerging markets than is currently the case, including Australia, Brazil, Canada, China, France, Germany, hong Kong, India, Indonesia, Japan, Korea, Russia, Saudi Arabia, Taiwan, the UK and the USA. An equivalent list from today (in excess of USD 1.5 trillion equity market capitaliza-tion) would include eight developed markets (Canada, France, Germany, hong Kong, Japan, Switzerland, the UK and the USA), but just one emerging market: China.
Countries with the swiftest equity market capi-talization nominal dollar compound annual growth rate between 2014 and 2030E are Turkey (16.5%), China (15.6%), Indonesia (15.0%), hun-gary (14.6%), Egypt (13.2%) and Saudi Arabia (13.2%). Meanwhile, the laggards include South Africa (6.8%), Colombia (8.1%), Brazil (8.4%), Korea (8.7%), Mexico (8.9%) and Malaysia (9.1%). These growth rates include both the impact of dollar price returns and that of net issuance and inclusions.
however, we note that, for a number of emerg-ing markets (in particular China, Poland and Rus-sia), growth rates in the expansion of equity market capitalization will understandably moderate from levels recorded in the last 16 years (1996 through 2014) for the reasons we have stated above.
Figure 10
Equity market capitalization progression (log scale, nominal USD bn)Source: Thomson Reuters, World Federation of Exchanges, Credit Suisse estimates
Figure 11
Global equity market capitalization progression (nominal USD bn)Source: Thomson Reuters, World Federation of Exchanges, Credit Suisse estimates
EMERGInG CAPITAL MARKETS_13
1996 (% of total global) 2014 (% of total global) 2030 (% of total global)
3.4%
3.4%
4.3%
13.9%
11.1%
78.4%
2.2%
2.4%
6.1%
2.2%
10.7%
0 20,000 40,000 60,000 80,000 100,000 120,000 140,000 160,000 180,000 USD bn
EM Latam
EM EMEA
EM Asia
BRIC
Emerging markets
Developed markets
21.6%
89.3%
29.0%
6.6%
39.1%
25.6%
60.9%
The high forecast growth rate observed for Saudi Arabia would be consistent with a potential liberal-ization of the country’s equity market if the Saudi Capital Markets Authority proceeds with a reform package by opening its bourse to direct foreign participation, thus creating significant additional external demand for Saudi assets.
Plotting the 35-year progression of equity mar-ket capitalization in nominal dollars expressed in log terms using historical data to 2014 and then inter-polating to our forecast for 2030 (using the 2014 – 30 compound annual growth rates) clearly illustrates the slowing growth rate for China and India, whereas (in aggregate) the rest of the emerging markets and developed markets are undergoing a mild acceleration.
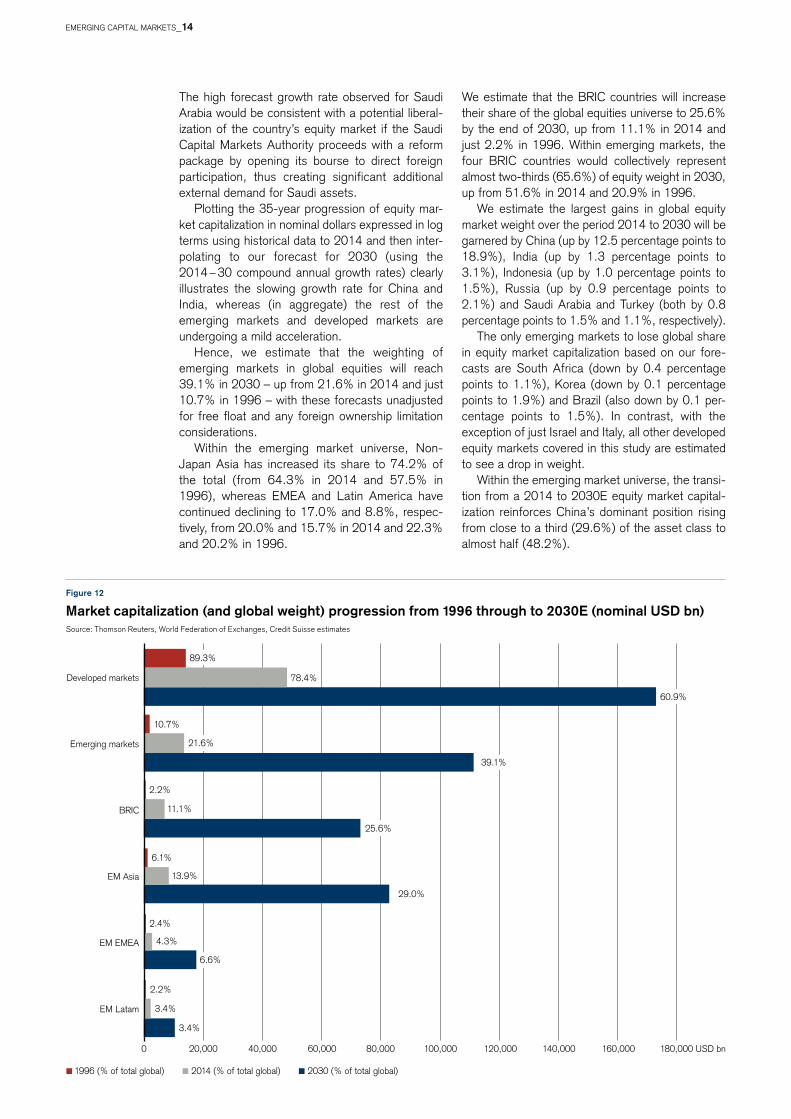
hence, we estimate that the weighting of emerging markets in global equities will reach 39.1% in 2030 – up from 21.6% in 2014 and just 10.7% in 1996 – with these forecasts unadjusted for free float and any foreign ownership limitation considerations.
Within the emerging market universe, non-Japan Asia has increased its share to 74.2% of the total (from 64.3% in 2014 and 57.5% in 1996), whereas EMEA and Latin America have continued declining to 17.0% and 8.8%, respec-tively, from 20.0% and 15.7% in 2014 and 22.3% and 20.2% in 1996.
Figure 12
market capitalization (and global weight) progression from 1996 through to 2030E (nominal USD bn)Source: Thomson Reuters, World Federation of Exchanges, Credit Suisse estimates
We estimate that the BRIC countries will increase their share of the global equities universe to 25.6% by the end of 2030, up from 11.1% in 2014 and just 2.2% in 1996. Within emerging markets, the four BRIC countries would collectively represent almost two-thirds (65.6%) of equity weight in 2030, up from 51.6% in 2014 and 20.9% in 1996.
We estimate the largest gains in global equity market weight over the period 2014 to 2030 will be garnered by China (up by 12.5 percentage points to 18.9%), India (up by 1.3 percentage points to 3.1%), Indonesia (up by 1.0 percentage points to 1.5%), Russia (up by 0.9 percentage points to 2.1%) and Saudi Arabia and Turkey (both by 0.8 percentage points to 1.5% and 1.1%, respectively).
The only emerging markets to lose global share in equity market capitalization based on our fore-casts are South Africa (down by 0.4 percentage points to 1.1%), Korea (down by 0.1 percentage points to 1.9%) and Brazil (also down by 0.1 per-centage points to 1.5%). In contrast, with the exception of just Israel and Italy, all other developed equity markets covered in this study are estimated to see a drop in weight.
Within the emerging market universe, the transi-tion from a 2014 to 2030E equity market capital-ization reinforces China’s dominant position rising from close to a third (29.6%) of the asset class to almost half (48.2%).
EMERGInG CAPITAL MARKETS_14
Turkey 1.5%
Malaysia 2.2%
Indonesia 2.6% Mexico 2.2%Thailand 2.7%
Thailand 2.2%
Saudi Arabia 3.5% South Africa 2.8%Malaysia 3.8%
Turkey 2.7%
Mexico 3.9% Indonesia 3.9%
Russia 5.8%
Taiwan 3.6%
Taiwan 6.2%Brazil 3.9%
South Africa 7.1%
Korea 4.9%
Brazil 7.7%
Russia 5.4%
India 8.5%
Saudi Arabia 3.9%
Korea 9.3%
India 8.1%
China A 29.6%
China A 48.2%
0%
10%
20%
30%
40%
50%
60%
70%
80%
90%
100%
2014 2030
US 35%
China A 19%Japan 5%
UK 4%
Hong Kong 3%
India 3%
Germany 2%
Canada 2%
Russia 2%
France 2%
Australia 2%
Korea 2%
Brazil 2%Saudi Arabia 2%
Indonesia 2%Taiwan 1%
Spain 1%South Africa 1%
Turkey 1%Switzerland 1% Others 8%
Figure 13
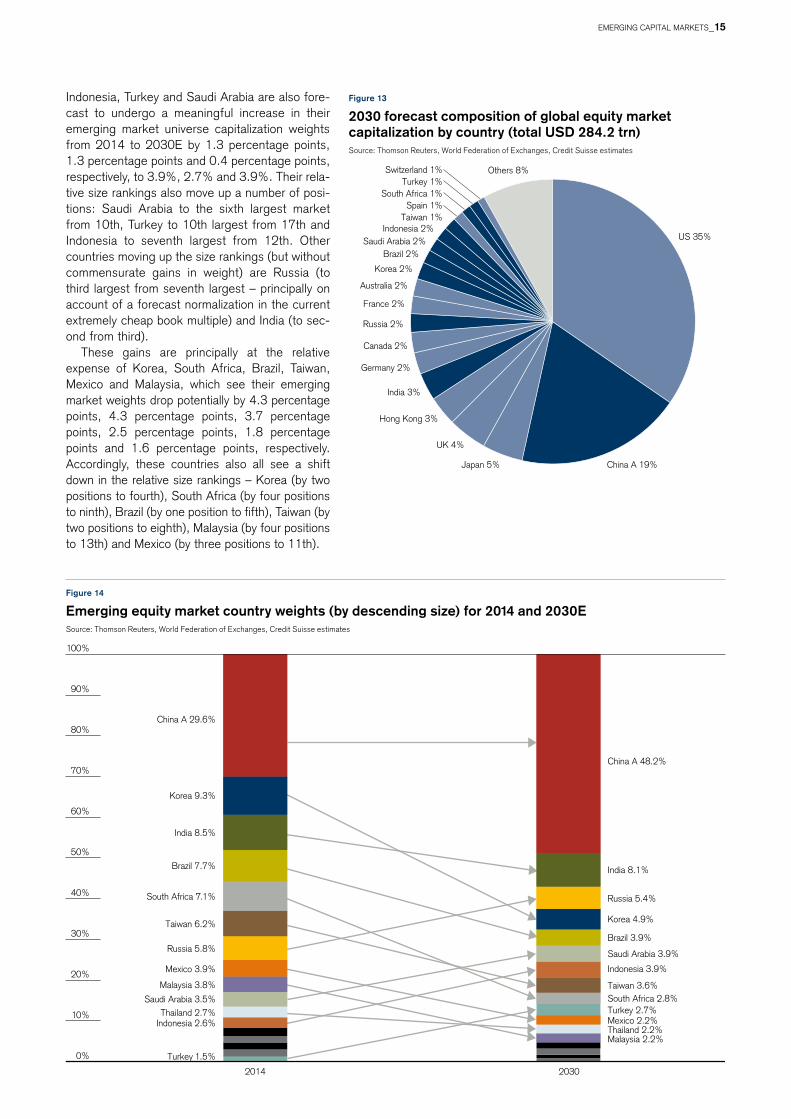
2030 forecast composition of global equity market capitalization by country (total USD 284.2 trn)Source: Thomson Reuters, World Federation of Exchanges, Credit Suisse estimates
Figure 14
Emerging equity market country weights (by descending size) for 2014 and 2030ESource: Thomson Reuters, World Federation of Exchanges, Credit Suisse estimates
Indonesia, Turkey and Saudi Arabia are also fore-cast to undergo a meaningful increase in their emerging market universe capitalization weights from 2014 to 2030E by 1.3 percentage points, 1.3 percentage points and 0.4 percentage points, respectively, to 3.9%, 2.7% and 3.9%. Their rela-tive size rankings also move up a number of posi-tions: Saudi Arabia to the sixth largest market from 10th, Turkey to 10th largest from 17th and Indonesia to seventh largest from 12th. other countries moving up the size rankings (but without commensurate gains in weight) are Russia (to third largest from seventh largest – principally on account of a forecast normalization in the current extremely cheap book multiple) and India (to sec-ond from third).
These gains are principally at the relative expense of Korea, South Africa, Brazil, Taiwan, Mexico and Malaysia, which see their emerging market weights drop potentially by 4.3 percentage points, 4.3 percentage points, 3.7 percentage points, 2.5 percentage points, 1.8 percentage points and 1.6 percentage points, respectively. Accordingly, these countries also all see a shift down in the relative size rankings – Korea (by two positions to fourth), South Africa (by four positions to ninth), Brazil (by one position to fifth), Taiwan (by two positions to eighth), Malaysia (by four positions to 13th) and Mexico (by three positions to 11th).
EMERGInG CAPITAL MARKETS_15
Developedmarkets 47.4%
China A 31.7%
India 3.3%
Saudi Arabia 2.3%
Brazil 2.2%Turkey 1.9%
Taiwan 1.5%Malaysia 1.5%
Chile 1.4%Indonesia 1.0%
Poland 0.9%
Other EM 4.9%
Which emerging market industry sectors will see the highest growth?
Emerging markets may understandably retain their aggregate equity skew toward resources (materials and energy) given their collective characteristic as a net commodity exporter; however, over the duration out to 2030, there will likely be a normalization toward more under-represented industry sectors relative to the developed world.
Telecoms, materials and information technology are the most over-represented sectors in emerging markets (7.0%, 9.3% and 16.8%, respectively) relative to developed equities (3.5%, 5.8% and 12.1%). Meanwhile the healthcare industry is par-ticularly under-represented in emerging markets with just 1.7% of equity capitalization weight versus 11.6% in the developed world. Industrials (6.5% versus 11.3%) and consumer discretionary (9.0% versus 11.7%) are also candidates for greater sec-tor representation within the emerging markets uni-verse, using developed market listed equity sector weighting as a helpful precedent.
Determining the magnitude of net equity issuance/inclusions for the next 17 years
To quantify net issuance and index inclusions out to 2030, we subtract retained earnings over the 17 years from the gain in book value. Total earnings is calculated by applying a long-term normalized trend return on equity over a time series of book value exponentially interpolated between our 2014 and 2030 start and end points. We then subtract divi-dends using a long-term trend historical payout ratio to arrive at total retained earnings for each country.
In aggregate, we find that emerging markets will account for USD 15.0 trillion (in nominal terms) – or 77% of net global equity issuance and inclusions during the 17 years to 2030 versus USD 6.0 trillion (or 40%) of the global total in the period since 1996. Consequently, the developed world share and total net equity issuance fall in nominal dollar terms for the next 17 years relative to the past 18 years – from USD 8.9 trillion (or 60%) to USD 4.5 trillion (23% of global share).
We forecast the emerging market leaders in net equity issuance and inclusions globally until 2030 to be China (USD 9.1 trillion or 47% of the total), India (USD 0.9 trillion or 4.8%), Saudi Arabia (USD 0.6 trillion or 3.3%) and Brazil (USD 0.6 trillion or 3.2%) – with all estimates in nominal dollar terms. other emerging countries with a meaningful share (2% or above) of global net equity issuance and inclusions are Turkey, Taiwan, Malaysia and Chile.
Under this scenario, the only significant loss in global market share in net equity issuance and inclusions we see over the next 17 years is for Rus-sia falling to 0.8% (or USD 162 billion in nominal terms) from 4.4% (USD 662 billion) between 1996 and 2014, and South Africa, where we forecast cumulative net issuance and inclusions of just USD 21 billion out to 2030 – although this may be explained by an elevated level of net buybacks and acquisitions by foreigners.
Mexico is the only emerging market to have recorded negative net equity issuance and inclu-sions in the 18 years between 1996 and 2014 (of USD 8.2 billion), primarily owing to significant for-eign acquisitions of Mexican assets, particularly financial services by US banks, which in 2001/02 alone amounted to USD 16.5 billion.
Quantifying the value of primary and secondary equity deals for the next 17 years
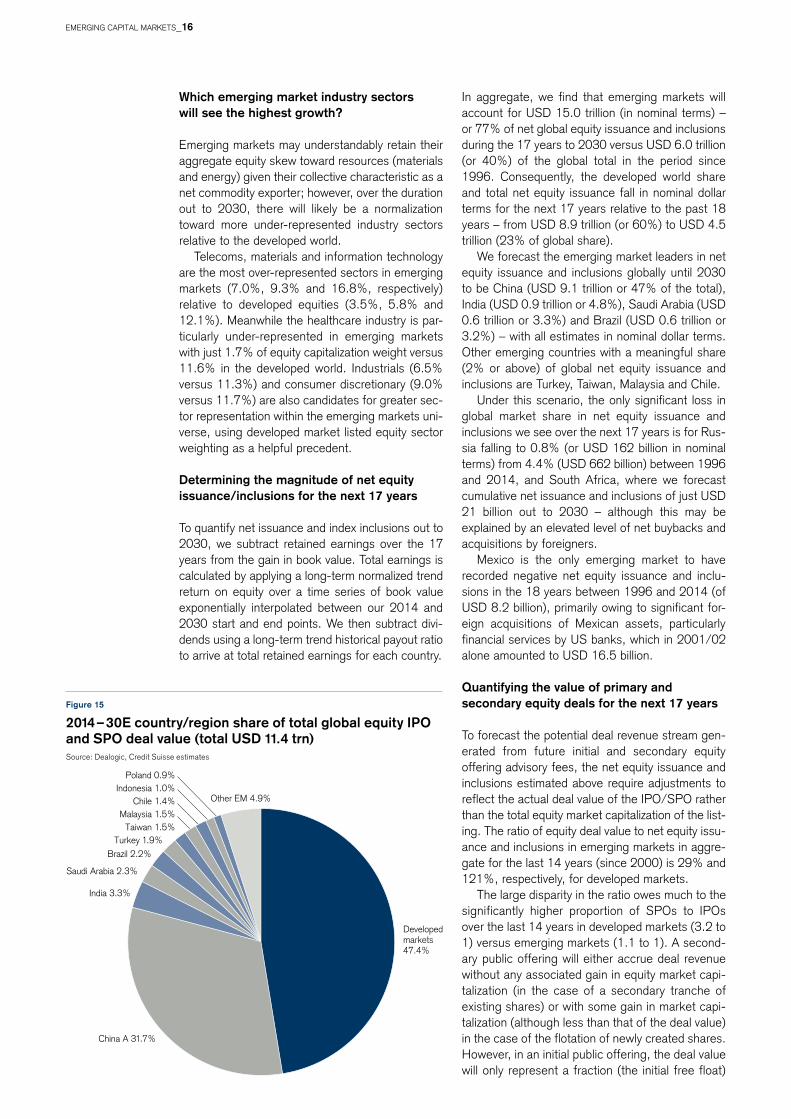
To forecast the potential deal revenue stream gen-erated from future initial and secondary equity offering advisory fees, the net equity issuance and inclusions estimated above require adjustments to reflect the actual deal value of the IPo/SPo rather than the total equity market capitalization of the list-ing. The ratio of equity deal value to net equity issu-ance and inclusions in emerging markets in aggre-gate for the last 14 years (since 2000) is 29% and 121%, respectively, for developed markets.
The large disparity in the ratio owes much to the significantly higher proportion of SPos to IPos over the last 14 years in developed markets (3.2 to 1) versus emerging markets (1.1 to 1). A second-ary public offering will either accrue deal revenue without any associated gain in equity market capi-talization (in the case of a secondary tranche of existing shares) or with some gain in market capi-talization (although less than that of the deal value) in the case of the flotation of newly created shares. however, in an initial public offering, the deal value will only represent a fraction (the initial free float)
Figure 15
2014 – 30E country/region share of total global equity IPo and SPo deal value (total USD 11.4 trn)Source: Dealogic, Credit Suisse estimates
Ph
oTo
: IS
ToC
KP
ho
To.C
oM
/hE
nR
IK50
00
EMERGInG CAPITAL MARKETS_16
of the total equity market capitalization of the com-pany being listed.
however, the ratio of equity deal value to net equity issuance and inclusions in emerging mar-kets has not been stable in the last 14 years (but has been stable for developed markets). The ratio has trended upward (in conjunction with the pat-tern for an increasing proportion of SPos to IPos in emerging markets) and, by 2014, had reached 40% – the assumed (we believe conservative) ratio we have employed in converting the 2014 to 2030 net equity issuance and inclusions into total deal value, while maintaining the 121% ratio for devel-oped markets.
Emerging market IPo volumes were curtailed through 2013 owing to a freeze on new equity list-ings by the China Securities Regulatory Commis-sion from november 2012 until the start of 2014, given concerns that a flood of new issuance (at one point there were 900 companies in the pipeline) would further dampen performance of the Chinese equity market.
Globally, this translates into a forecast total equity deal value (IPos and SPos) between 2014 and 2030 of USD 11.4 trillion, with a 53%/47% split between emerging and developed markets versus the 23%/77% split of the USD 7.0 trillion of equity deal value between 2000 and 2014. We estimate that emerging market deal value will almost quadruple to USD 6.0 trillion in nominal terms in the next 17 years from USD 1.6 trillion in the previous 14 years. For developed markets, we estimate the total deal value will be flat at USD 5.4 trillion for both periods (i.e. undergoing a sig-
nificant contraction in real terms – adjusted on a pro rata and inflationary basis). We estimate the fees generated (i.e. the revenue opportunity) by financial intermediaries from these deals in con-junction with debt capital market (DCM) activity in the next chapter.
We forecast that China’s share of the total emerging market and total global deal value (IPos and SPos) will rise from 40% and 9%, respec-tively, for the period from 2000 through 2013 (USD 639 billion of deal value) to 60% and 32% between 2014 and 2030E (USD 3,634 billion of deal value in nominal terms).
other significant potential sources of equity deal (IPo/SPo) value (in excess of USD 200 billion) between 2014 and 2030E based on this analysis are India (USD 375 billion), Saudi Arabia (USD 258 billion), Brazil (USD 250 billion), and Turkey (USD 218 billion). Collectively, these four markets plus China account for an estimated 79% (or USD 4,734 billion) of the total emerging market potential deal value between 2014 and 2030E (or 41% of the global total).
The BRIC market share is somewhat lower than the above group of five (USD 4,323 billion) owing to the estimated slowdown in IPo/SPo activity in Russia over the period 2014 through 2030E (USD 65 billion) versus that between 2000 through 2013 (USD 105 billion). only Russia (USD 40 billion less – or – 38%), South Africa (USD 21 billion less – or – 72%) and Korea (USD 19 billion less – or – 18%) are projected to record lower nominal dollar deal value for the next 17 years versus the past 14 years based on our analysis.P
ho
To:
ISTo
CK
Ph
oTo
.Co
M/h
En
RIK
5000
300% 200% 100% 0% 100% 200% 300%
South AfricaMalaysia
TaiwanKorea
ThailandChileBrazil
PhilippinesHungary
Emerging marketsIndia
MexicoColombia
ChinaPolandPeru
IndonesiaTurkey
Saudi ArabiaRussia
Equity Corporate (dom.) Corporate (int’l) Sovereign (dom.) Sovereign (int’l)
For our analysis of corporate and sovereign bonds, we focus on the same emerging and developed world nations as the equity study above, with the exception of Egypt (just 0.3% of the JP Morgan EMBI Global index weight) given the limited avail-ability of historical data.
With the notable exception of Korea and Malay-sia, emerging market corporate bond markets remain at a relatively nascent stage of development versus developed market peers as measured by their market value to GDP ratio (29% for emerging – both domestic and international listings – versus 104% for developed markets).
nonetheless, in all but three emerging markets (Taiwan, Indonesia and the Philippines), growth in the corporate bond market outpaced that of overall economic activity in the 9-year period since 2005. For emerging markets in aggregate, the nominal dollar compound annual growth rate in market value for the corporate bond market since 2005 was 16.9% versus 13.0% for GDP (equivalent growth rates in developed markets were a more modest 3.8% and 3.2%, respectively). Collectively, the BRIC nations posted the strongest corporate bond market value CAGR over the period – 24% (Brazil), 31% (Russia), 20% (India) and 26% (China). From small beginnings, Turkey also recorded swift growth in the size of its corporate bond market to USD 46 billion in 2014 from just USD 3 billion in 2005, a nominal dollar CAGR of 35%.
Corporate bond market expansion from 2005 to 2030
In total, global corporate bond market value (domestic and international listings for the 33 coun-tries considered in this study) has grown by USD 17 trillion over the past nine years to USD 48 tril-lion from USD 31 trillion in 2005. The emerging market contribution was USD 5.2 trillion (or 31%) with regional corporate bond market value growing to USD 6.9 trillion from USD 1.7 trillion in 2005, and a commensurate gain in the emerging market weight in the global corporate bond market to 14.4% from 5.4%. Significantly China’s corporate bond market value share of the global total rose to 5.8% in 2014 from just 1.1% in 2005.
Structurally, we also note the observed trend for increasingly domestic emerging market corporate bond listings as capital markets deepen, hence reducing the risk of FX volatility.
however, the aggregate corporate bond market value data above significantly overstate the invest-able universe. Although the comprehensive dataset produced by the Bank of International Settlements is subdivided into financial and non-financial sec-tors, one of the difficulties with the dataset is that it includes bonds issued by banks and held within that same banking group. These do not earn fees for capital market participants. For example, many southern European banks have issued bonds to other companies within the same banking group that have been used as collateral against liquidity provided by the ECB.
This has particular relevance for markets with a pronounced skew toward financial sector corpo-rate bonds: for hungary, Turkey, India and Brazil, these represent in excess of 80% of the market. In total, two-thirds (65%) of emerging market cor-porate bonds are issued by the financial sector, with an even higher proportion (75%) in devel-oped nations.
nonetheless, we have elected to include the financial sector within our global corporate bond market value projections as, during the last nine years, 28% of total deal value was in the financial sector (45% for developed markets), with Turkey, hungary and India having a greater than 50% financial sector share of debt capital market deal value. hence, omitting the sector from this analy-sis would result in a significant underestimation of the total debt capital market deal value and thus broker revenue potential out to 2030.
The inability to trade a significant swathe of the emerging market financial sector corporate bond market amplifies the disproportionately skewed capital market investment opportunity toward equi-ties rather than the more even distribution across equity and fixed income asset classes in the devel-oped world.
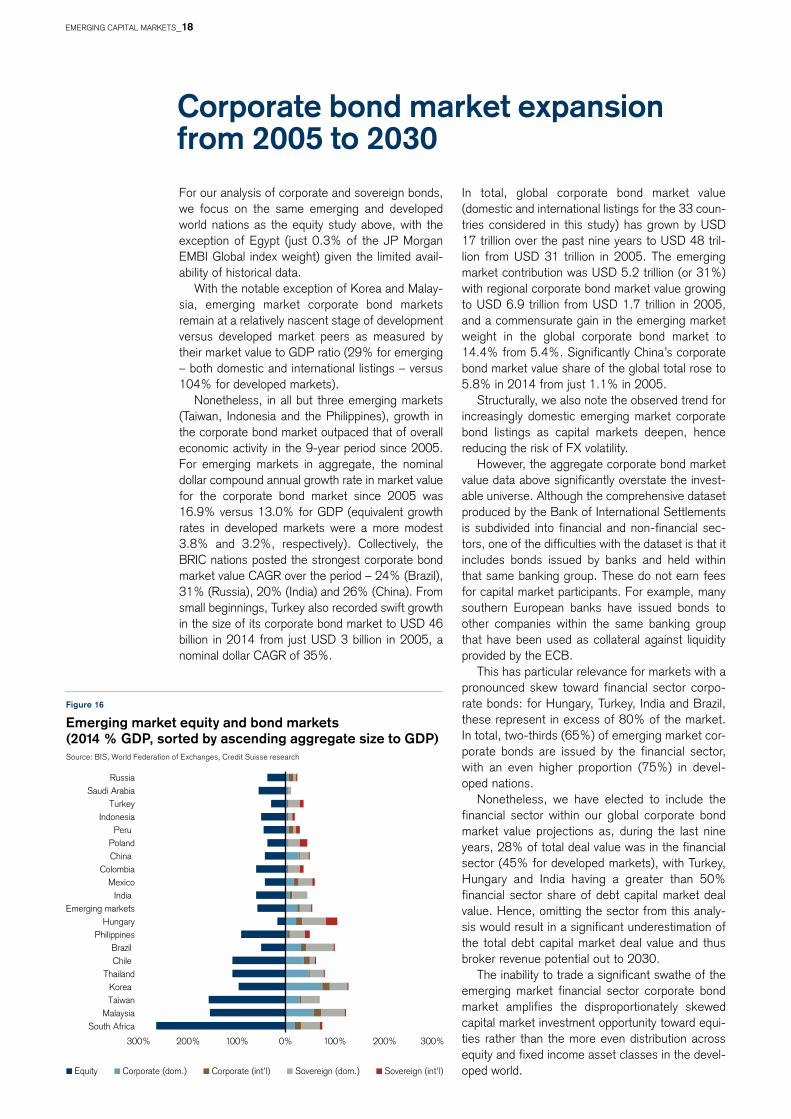
Figure 16
Emerging market equity and bond markets (2014 % GDP, sorted by ascending aggregate size to GDP)Source: BIS, World Federation of Exchanges, Credit Suisse research
EMERGInG CAPITAL MARKETS_18
Brazil Chile
China
Colombia
Hungary
India
Indonesia
Korea
Malaysia
Mexico
PeruPhilippines
Russia
South Africa
Thailand
Turkey
Emerging markets
Poland Saudi Arabia
Taiwan
19901991
199219931994
19961997
19981999 2000
2001
2002
2003 2004 20052006
2007
2008
2009
20102012
2013
y = 2.72xR2 = 0.91
0%
20%
40%
60%
80%
100%
120%
0 5,000 10,000 15,000 20,000 25,000 30,000 35,000 40,000 45,000
Corporate bonds to GDP ratio
per capita GDP (USD PPP)Emerging markets (2014) Developed markets (1990–2014)
1995
2011
The 2014 total capital market investment universe for emerging markets is comprised of 51% equi-ties, 26% corporate bonds and 23% sovereign bonds. The proportions for developed markets are noticeably more balanced at about a third each (36%, 34% and 30%, respectively). South Africa, Indonesia, Saudi Arabia and Taiwan have the great-est skew toward equities in their capital markets, whereas Brazil and Korea offer a more balanced opportunity across asset classes.
Precedent shows growth in the corporate bond market related to productivity gains
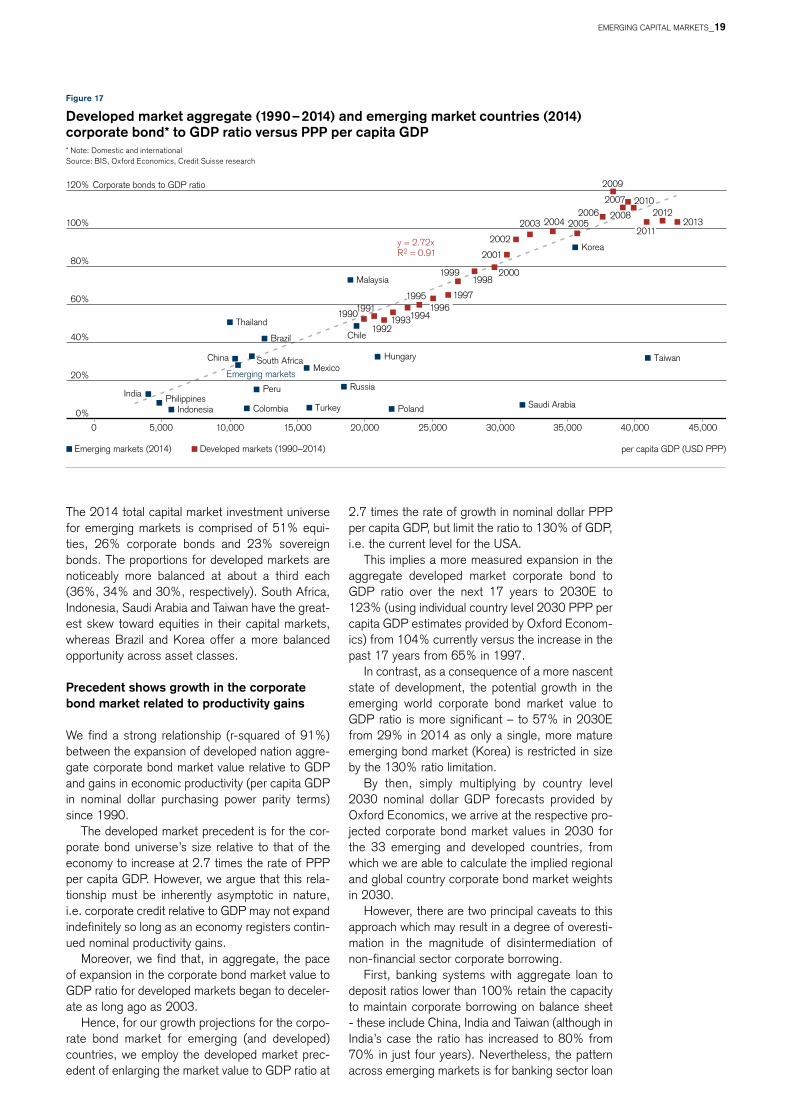
We find a strong relationship (r-squared of 91%) between the expansion of developed nation aggre-gate corporate bond market value relative to GDP and gains in economic productivity (per capita GDP in nominal dollar purchasing power parity terms) since 1990.
The developed market precedent is for the cor-porate bond universe’s size relative to that of the economy to increase at 2.7 times the rate of PPP per capita GDP. however, we argue that this rela-tionship must be inherently asymptotic in nature, i.e. corporate credit relative to GDP may not expand indefinitely so long as an economy registers contin-ued nominal productivity gains.
Moreover, we find that, in aggregate, the pace of expansion in the corporate bond market value to GDP ratio for developed markets began to deceler-ate as long ago as 2003.
hence, for our growth projections for the corpo-rate bond market for emerging (and developed) countries, we employ the developed market prec-edent of enlarging the market value to GDP ratio at
2.7 times the rate of growth in nominal dollar PPP per capita GDP, but limit the ratio to 130% of GDP, i.e. the current level for the USA.
This implies a more measured expansion in the aggregate developed market corporate bond to GDP ratio over the next 17 years to 2030E to 123% (using individual country level 2030 PPP per capita GDP estimates provided by oxford Econom-ics) from 104% currently versus the increase in the past 17 years from 65% in 1997.
In contrast, as a consequence of a more nascent state of development, the potential growth in the emerging world corporate bond market value to GDP ratio is more significant – to 57% in 2030E from 29% in 2014 as only a single, more mature emerging bond market (Korea) is restricted in size by the 130% ratio limitation.
By then, simply multiplying by country level 2030 nominal dollar GDP forecasts provided by oxford Economics, we arrive at the respective pro-jected corporate bond market values in 2030 for the 33 emerging and developed countries, from which we are able to calculate the implied regional and global country corporate bond market weights in 2030.
however, there are two principal caveats to this approach which may result in a degree of overesti-mation in the magnitude of disintermediation of non-financial sector corporate borrowing.
First, banking systems with aggregate loan to deposit ratios lower than 100% retain the capacity to maintain corporate borrowing on balance sheet - these include China, India and Taiwan (although in India’s case the ratio has increased to 80% from 70% in just four years). nevertheless, the pattern across emerging markets is for banking sector loan
Figure 17
Developed market aggregate (1990 – 2014) and emerging market countries (2014) corporate bond* to GDP ratio versus PPP per capita GDP* note: Domestic and international Source: BIS, oxford Economics, Credit Suisse research
EMERGInG CAPITAL MARKETS_19
Country/Region Per capita GDP (‘000s USD, PPP)
Corporate bond market (% GDP)
Corporate bond market (USD bn)
Weight in Em/Dm region
Weight in global corp. bonds
2014 2030E 2014 2030E 2014 2030E 2014 2030E 2014 2030E
Brazil 12.3 25.1 42.8% 61.9% 961.0 3,005.8 13.9% 5.6% 2.0% 2.0%
Chile 19.5 42.0 49.2% 82.9% 137.8 643.8 2.0% 1.2% 0.3% 0.4%
China 10.5 30.4 30.3% 60.2% 2,785.7 31,885.5 40.4% 59.5% 5.8% 21.7%
Colombia 11.4 25.4 6.0% 26.9% 22.6 231.8 0.3% 0.4% 0.0% 0.2%
hungary 20.9 41.0 33.5% 63.7% 43.7 173.1 0.6% 0.3% 0.1% 0.1%
India 4.1 11.7 13.0% 24.4% 241.6 1,837.9 3.5% 3.4% 0.5% 1.3%
Indonesia 5.7 15.8 5.7% 20.8% 49.4 753.5 0.7% 1.4% 0.1% 0.5%
Korea 35.6 77.6 90.2% 130.0% 1,088.2 3,895.1 15.8% 7.3% 2.3% 2.6%
Malaysia 18.8 38.8 73.4% 103.3% 229.2 1,113.5 3.3% 2.1% 0.5% 0.8%
Mexico 15.6 30.6 26.3% 48.7% 331.1 1,500.8 4.8% 2.8% 0.7% 1.0%
Peru 11.9 29.1 15.3% 41.0% 31.6 246.9 0.5% 0.5% 0.1% 0.2%
Philippines 4.9 11.4 7.9% 17.8% 21.5 237.9 0.3% 0.4% 0.0% 0.2%
Poland 22.1 49.1 5.5% 46.0% 28.2 551.9 0.4% 1.0% 0.1% 0.4%
Russia 18.3 40.9 17.0% 50.9% 362.1 2,707.1 5.2% 5.1% 0.8% 1.8%
Saudi Arabia 31.7 60.7 6.8% 50.2% 50.6 1,092.8 0.7% 2.0% 0.1% 0.7%
South Africa 11.6 24.9 32.7% 52.6% 114.9 592.0 1.7% 1.1% 0.2% 0.4%
Taiwan 40.9 87.1 32.4% 101.6% 158.5 1,390.7 2.3% 2.6% 0.3% 0.9%
Thailand 10.1 26.7 50.9% 75.9% 197.4 878.1 2.9% 1.6% 0.4% 0.6%
Turkey 15.9 36.6 5.6% 36.6% 46.2 820.7 0.7% 1.5% 0.1% 0.6%
Em Asia 8.9 25.2 32.7% 58.2% 4,771.4 41,992.1 69.1% 78.4% 9.9% 28.6%
Em EmEA 18.7 40.7 13.8% 48.2% 645.6 5,937.6 9.4% 11.1% 1.3% 4.0%
Em latam 13.3 27.7 34.0% 55.3% 1,484.1 5,629.2 21.5% 10.5% 3.1% 3.8%
BRIC 9.5 26.1 28.2% 55.8% 4,350.4 39,436.3 63.0% 73.6% 9.1% 26.8%
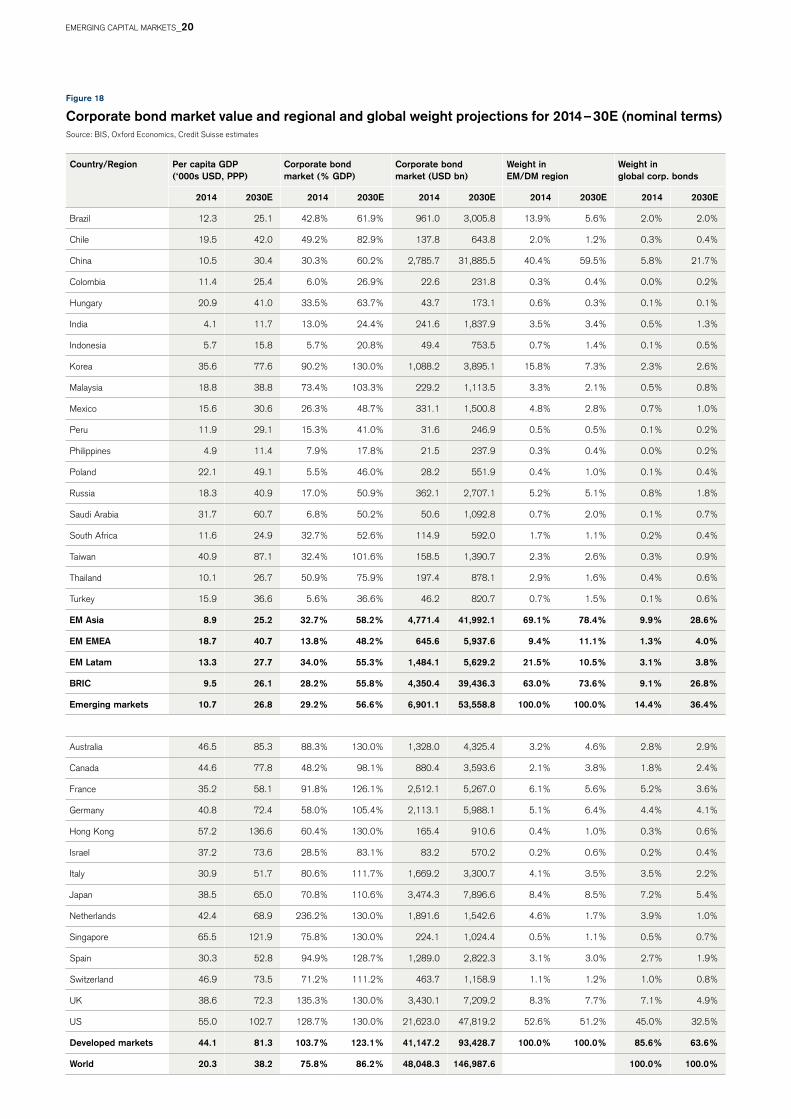
Emerging markets 10.7 26.8 29.2% 56.6% 6,901.1 53,558.8 100.0% 100.0% 14.4% 36.4%
Australia 46.5 85.3 88.3% 130.0% 1,328.0 4,325.4 3.2% 4.6% 2.8% 2.9%
Canada 44.6 77.8 48.2% 98.1% 880.4 3,593.6 2.1% 3.8% 1.8% 2.4%
France 35.2 58.1 91.8% 126.1% 2,512.1 5,267.0 6.1% 5.6% 5.2% 3.6%
Germany 40.8 72.4 58.0% 105.4% 2,113.1 5,988.1 5.1% 6.4% 4.4% 4.1%
hong Kong 57.2 136.6 60.4% 130.0% 165.4 910.6 0.4% 1.0% 0.3% 0.6%
Israel 37.2 73.6 28.5% 83.1% 83.2 570.2 0.2% 0.6% 0.2% 0.4%
Italy 30.9 51.7 80.6% 111.7% 1,669.2 3,300.7 4.1% 3.5% 3.5% 2.2%
Japan 38.5 65.0 70.8% 110.6% 3,474.3 7,896.6 8.4% 8.5% 7.2% 5.4%
netherlands 42.4 68.9 236.2% 130.0% 1,891.6 1,542.6 4.6% 1.7% 3.9% 1.0%
Singapore 65.5 121.9 75.8% 130.0% 224.1 1,024.4 0.5% 1.1% 0.5% 0.7%
Spain 30.3 52.8 94.9% 128.7% 1,289.0 2,822.3 3.1% 3.0% 2.7% 1.9%
Switzerland 46.9 73.5 71.2% 111.2% 463.7 1,158.9 1.1% 1.2% 1.0% 0.8%
UK 38.6 72.3 135.3% 130.0% 3,430.1 7,209.2 8.3% 7.7% 7.1% 4.9%
US 55.0 102.7 128.7% 130.0% 21,623.0 47,819.2 52.6% 51.2% 45.0% 32.5%
Developed markets 44.1 81.3 103.7% 123.1% 41,147.2 93,428.7 100.0% 100.0% 85.6% 63.6%
World 20.3 38.2 75.8% 86.2% 48,048.3 146,987.6 100.0% 100.0%
Figure 18
Corporate bond market value and regional and global weight projections for 2014 – 30E (nominal terms)Source: BIS, oxford Economics, Credit Suisse estimates
EMERGInG CAPITAL MARKETS_20
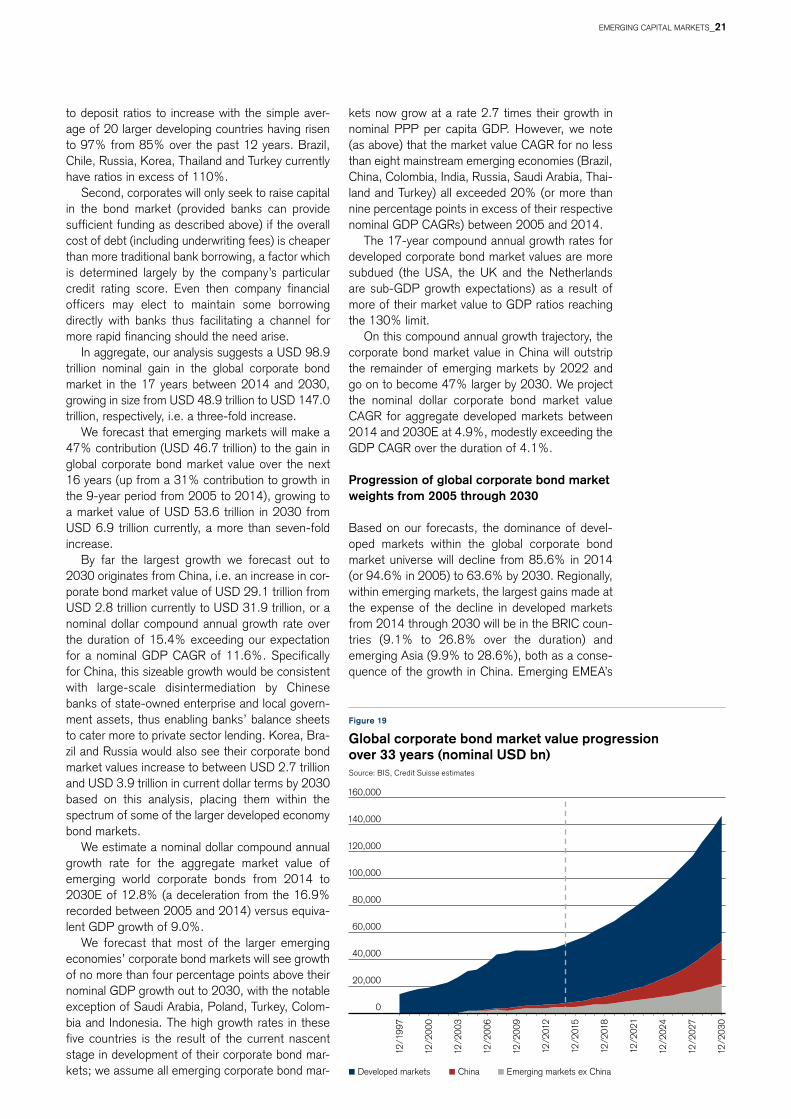
kets now grow at a rate 2.7 times their growth in nominal PPP per capita GDP. however, we note (as above) that the market value CAGR for no less than eight mainstream emerging economies (Brazil, China, Colombia, India, Russia, Saudi Arabia, Thai-land and Turkey) all exceeded 20% (or more than nine percentage points in excess of their respective nominal GDP CAGRs) between 2005 and 2014.
The 17-year compound annual growth rates for developed corporate bond market values are more subdued (the USA, the UK and the netherlands are sub-GDP growth expectations) as a result of more of their market value to GDP ratios reaching the 130% limit.
on this compound annual growth trajectory, the corporate bond market value in China will outstrip the remainder of emerging markets by 2022 and go on to become 47% larger by 2030. We project the nominal dollar corporate bond market value CAGR for aggregate developed markets between 2014 and 2030E at 4.9%, modestly exceeding the GDP CAGR over the duration of 4.1%.
Progression of global corporate bond market weights from 2005 through 2030
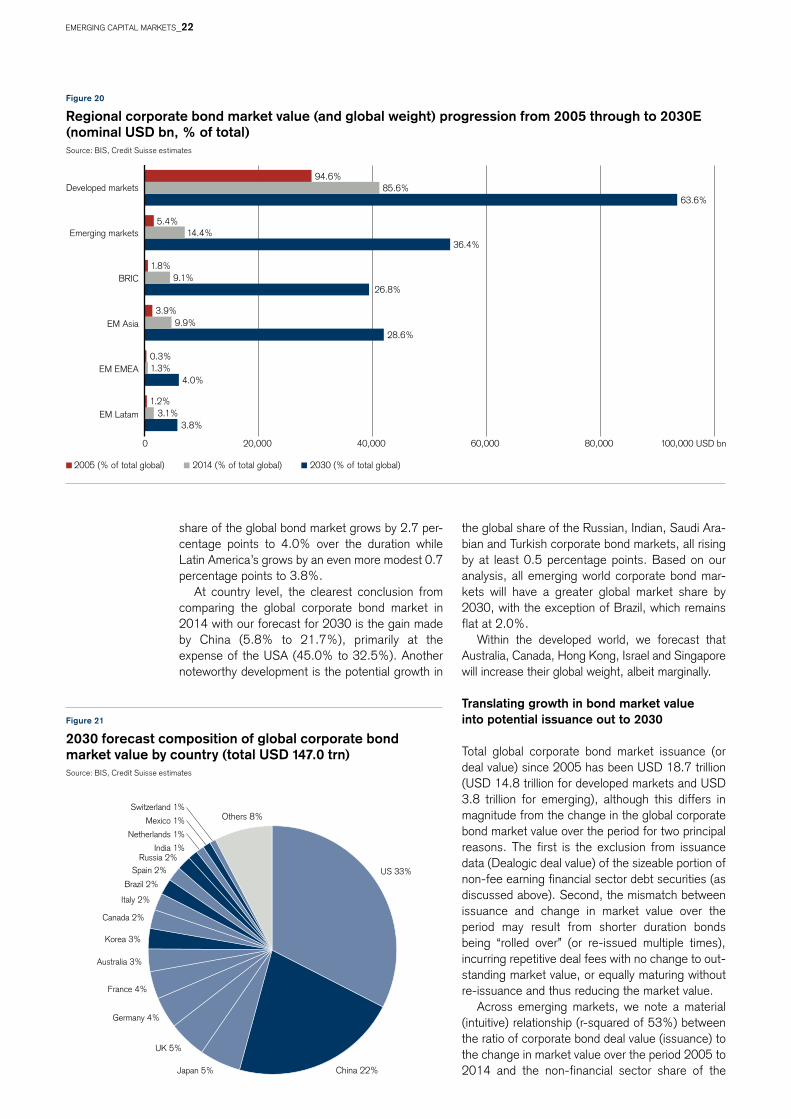
Based on our forecasts, the dominance of devel-oped markets within the global corporate bond market universe will decline from 85.6% in 2014 (or 94.6% in 2005) to 63.6% by 2030. Regionally, within emerging markets, the largest gains made at the expense of the decline in developed markets from 2014 through 2030 will be in the BRIC coun-tries (9.1% to 26.8% over the duration) and emerging Asia (9.9% to 28.6%), both as a conse-quence of the growth in China. Emerging EMEA’s
0
20,000
40,000
60,000
80,000
100,000
120,000
140,000
160,000
12/1
997
12/2
000
12/2
003
12/2
006
12/2
009
12/2
012
12/2
015
12/2
018
12/2
021
12/2
024
12/2
027
12/2
030
Developed markets China Emerging markets ex China
to deposit ratios to increase with the simple aver-age of 20 larger developing countries having risen to 97% from 85% over the past 12 years. Brazil, Chile, Russia, Korea, Thailand and Turkey currently have ratios in excess of 110%.
Second, corporates will only seek to raise capital in the bond market (provided banks can provide sufficient funding as described above) if the overall cost of debt (including underwriting fees) is cheaper than more traditional bank borrowing, a factor which is determined largely by the company’s particular credit rating score. Even then company financial officers may elect to maintain some borrowing directly with banks thus facilitating a channel for more rapid financing should the need arise.
In aggregate, our analysis suggests a USD 98.9 trillion nominal gain in the global corporate bond market in the 17 years between 2014 and 2030, growing in size from USD 48.9 trillion to USD 147.0 trillion, respectively, i.e. a three-fold increase.
We forecast that emerging markets will make a 47% contribution (USD 46.7 trillion) to the gain in global corporate bond market value over the next 16 years (up from a 31% contribution to growth in the 9-year period from 2005 to 2014), growing to a market value of USD 53.6 trillion in 2030 from USD 6.9 trillion currently, a more than seven-fold increase.
By far the largest growth we forecast out to 2030 originates from China, i.e. an increase in cor-porate bond market value of USD 29.1 trillion from USD 2.8 trillion currently to USD 31.9 trillion, or a nominal dollar compound annual growth rate over the duration of 15.4% exceeding our expectation for a nominal GDP CAGR of 11.6%. Specifically for China, this sizeable growth would be consistent with large-scale disintermediation by Chinese banks of state-owned enterprise and local govern-ment assets, thus enabling banks’ balance sheets to cater more to private sector lending. Korea, Bra-zil and Russia would also see their corporate bond market values increase to between USD 2.7 trillion and USD 3.9 trillion in current dollar terms by 2030 based on this analysis, placing them within the spectrum of some of the larger developed economy bond markets.
We estimate a nominal dollar compound annual growth rate for the aggregate market value of emerging world corporate bonds from 2014 to 2030E of 12.8% (a deceleration from the 16.9% recorded between 2005 and 2014) versus equiva-lent GDP growth of 9.0%.
We forecast that most of the larger emerging economies’ corporate bond markets will see growth of no more than four percentage points above their nominal GDP growth out to 2030, with the notable exception of Saudi Arabia, Poland, Turkey, Colom-bia and Indonesia. The high growth rates in these five countries is the result of the current nascent stage in development of their corporate bond mar-kets; we assume all emerging corporate bond mar-
Figure 19
Global corporate bond market value progression over 33 years (nominal USD bn)Source: BIS, Credit Suisse estimates
EMERGInG CAPITAL MARKETS_21
US 33%
China 22%Japan 5%
UK 5%
Germany 4%
France 4%
Australia 3%
Korea 3%
Canada 2%
Italy 2%
Brazil 2%
Spain 2%Russia 2%
India 1%
Netherlands 1%
Mexico 1%
Switzerland 1%Others 8%
2005 (% of total global) 2014 (% of total global) 2030 (% of total global)
3.8%
4.0%
28.6%
36.4%
63.6%
3.1%
1.3%
9.9%
9.1%
14.4%
85.6%
1.2%
0.3%
3.9%
1.8%
5.4%
94.6%
0 20,000 40,000 60,000 80,000 100,000 USD bn
EM Latam
EM EMEA
EM Asia
BRIC
Emerging markets
Developed markets
26.8%
Figure 21
2030 forecast composition of global corporate bond market value by country (total USD 147.0 trn)Source: BIS, Credit Suisse estimates
share of the global bond market grows by 2.7 per-centage points to 4.0% over the duration while Latin America’s grows by an even more modest 0.7 percentage points to 3.8%.
At country level, the clearest conclusion from comparing the global corporate bond market in 2014 with our forecast for 2030 is the gain made by China (5.8% to 21.7%), primarily at the expense of the USA (45.0% to 32.5%). Another noteworthy development is the potential growth in
the global share of the Russian, Indian, Saudi Ara-bian and Turkish corporate bond markets, all rising by at least 0.5 percentage points. Based on our analysis, all emerging world corporate bond mar-kets will have a greater global market share by 2030, with the exception of Brazil, which remains flat at 2.0%.
Within the developed world, we forecast that Australia, Canada, hong Kong, Israel and Singapore will increase their global weight, albeit marginally.
Translating growth in bond market value into potential issuance out to 2030
Total global corporate bond market issuance (or deal value) since 2005 has been USD 18.7 trillion (USD 14.8 trillion for developed markets and USD 3.8 trillion for emerging), although this differs in magnitude from the change in the global corporate bond market value over the period for two principal reasons. The first is the exclusion from issuance data (Dealogic deal value) of the sizeable portion of non-fee earning financial sector debt securities (as discussed above). Second, the mismatch between issuance and change in market value over the period may result from shorter duration bonds being “rolled over” (or re-issued multiple times), incurring repetitive deal fees with no change to out-standing market value, or equally maturing without re-issuance and thus reducing the market value.
Across emerging markets, we note a material (intuitive) relationship (r-squared of 53%) between the ratio of corporate bond deal value (issuance) to the change in market value over the period 2005 to 2014 and the non-financial sector share of the
Figure 20
Regional corporate bond market value (and global weight) progression from 2005 through to 2030E (nominal USD bn, % of total)Source: BIS, Credit Suisse estimates
Ph
oTo
: IS
ToC
KP
ho
To.C
oM
/JLG
UTI
ER
RE
z
EMERGInG CAPITAL MARKETS_22
Developedmarkets 63%
China 19%
Korea 3%
Russia 3%
India 2%Taiwan 2%
Mexico 1%Indonesia 1%
Malaysia 1%Saudi Arabia 1% Brazil 1%
Other EM 3%
Figure 22
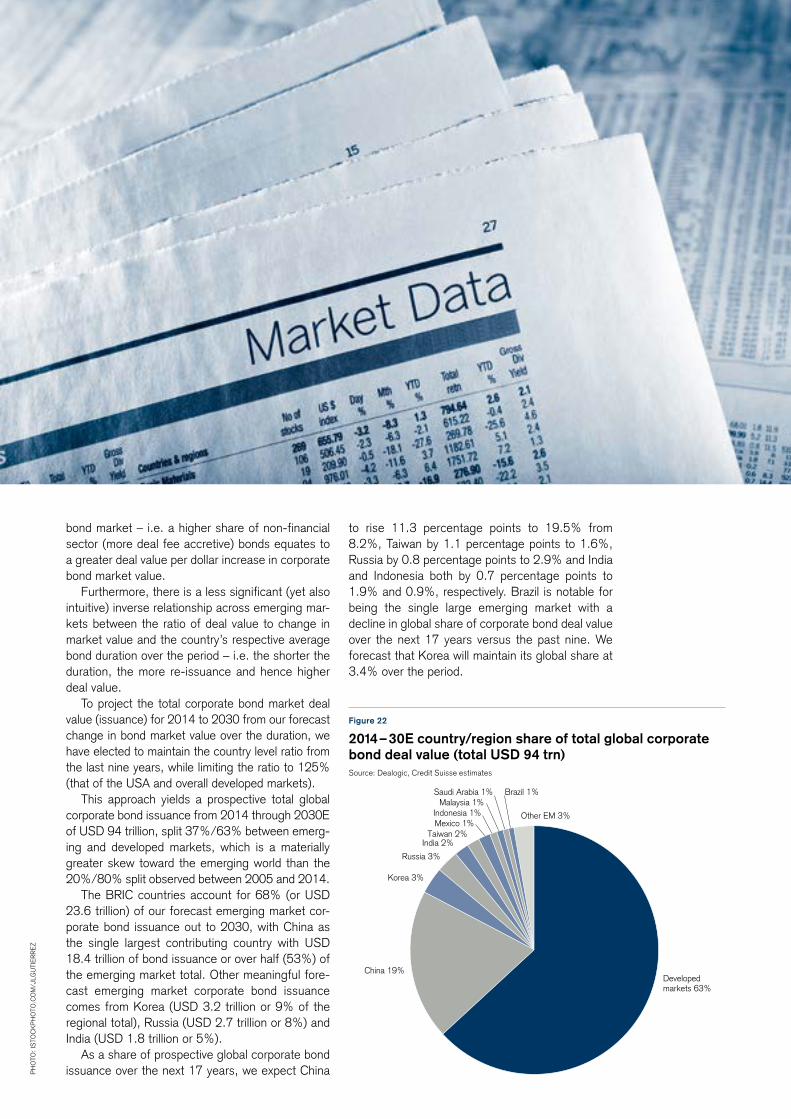
2014 – 30E country/region share of total global corporate bond deal value (total USD 94 trn)Source: Dealogic, Credit Suisse estimates
bond market – i.e. a higher share of non-financial sector (more deal fee accretive) bonds equates to a greater deal value per dollar increase in corporate bond market value.
Furthermore, there is a less significant (yet also intuitive) inverse relationship across emerging mar-kets between the ratio of deal value to change in market value and the country’s respective average bond duration over the period – i.e. the shorter the duration, the more re-issuance and hence higher deal value.
To project the total corporate bond market deal value (issuance) for 2014 to 2030 from our forecast change in bond market value over the duration, we have elected to maintain the country level ratio from the last nine years, while limiting the ratio to 125% (that of the USA and overall developed markets).
This approach yields a prospective total global corporate bond issuance from 2014 through 2030E of USD 94 trillion, split 37%/63% between emerg-ing and developed markets, which is a materially greater skew toward the emerging world than the 20%/80% split observed between 2005 and 2014.
The BRIC countries account for 68% (or USD 23.6 trillion) of our forecast emerging market cor-porate bond issuance out to 2030, with China as the single largest contributing country with USD 18.4 trillion of bond issuance or over half (53%) of the emerging market total. other meaningful fore-cast emerging market corporate bond issuance comes from Korea (USD 3.2 trillion or 9% of the regional total), Russia (USD 2.7 trillion or 8%) and India (USD 1.8 trillion or 5%).
As a share of prospective global corporate bond issuance over the next 17 years, we expect China
to rise 11.3 percentage points to 19.5% from 8.2%, Taiwan by 1.1 percentage points to 1.6%, Russia by 0.8 percentage points to 2.9% and India and Indonesia both by 0.7 percentage points to 1.9% and 0.9%, respectively. Brazil is notable for being the single large emerging market with a decline in global share of corporate bond deal value over the next 17 years versus the past nine. We forecast that Korea will maintain its global share at 3.4% over the period.
Ph
oTo
: IS
ToC
KP
ho
To.C
oM
/JLG
UTI
ER
RE
z
10%
20%
30%
40%
50%
60%
70%
2000
2002
2004
2006
2008
2010
2012
2014
2016
2018
2020
2022
2024
2026
2028
2030
Brazil Korea India China
of GDP
0%
50%
100%
150%
200%
250% of GDP
2000
2002
2004
2006
2008
2010
2012
2014
2016
2018
2020
2022
2024
2026
2028
2030
Japan USA Italy UK
Sovereign bond market expansion from 2005 to 2030
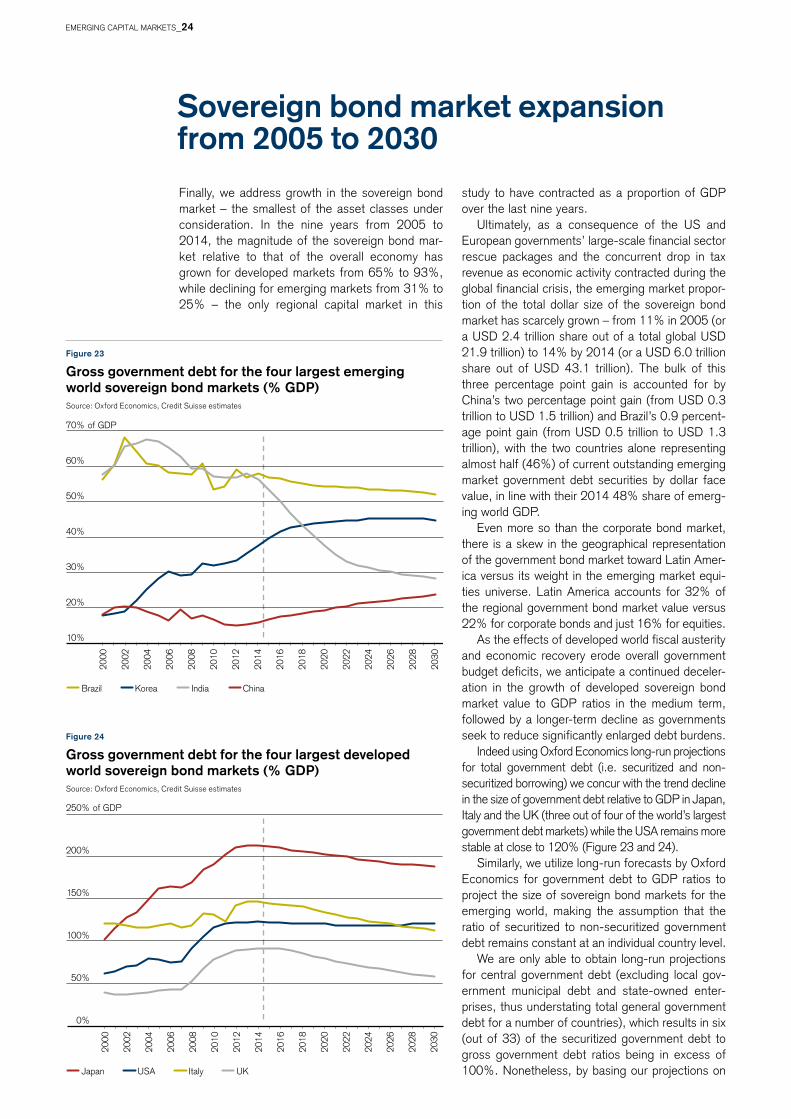
study to have contracted as a proportion of GDP over the last nine years.
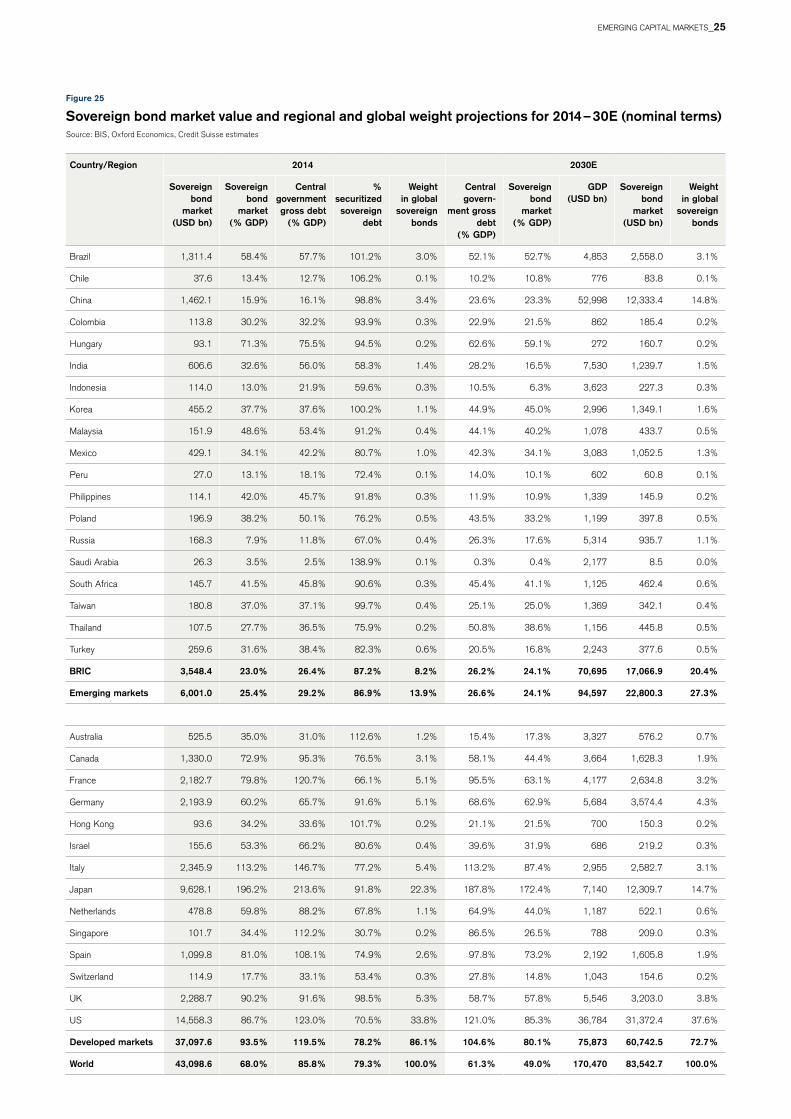
Ultimately, as a consequence of the US and European governments’ large-scale financial sector rescue packages and the concurrent drop in tax revenue as economic activity contracted during the global financial crisis, the emerging market propor-tion of the total dollar size of the sovereign bond market has scarcely grown – from 11% in 2005 (or a USD 2.4 trillion share out of a total global USD 21.9 trillion) to 14% by 2014 (or a USD 6.0 trillion share out of USD 43.1 trillion). The bulk of this three percentage point gain is accounted for by China’s two percentage point gain (from USD 0.3 trillion to USD 1.5 trillion) and Brazil’s 0.9 percent-age point gain (from USD 0.5 trillion to USD 1.3 trillion), with the two countries alone representing almost half (46%) of current outstanding emerging market government debt securities by dollar face value, in line with their 2014 48% share of emerg-ing world GDP.
Even more so than the corporate bond market, there is a skew in the geographical representation of the government bond market toward Latin Amer-ica versus its weight in the emerging market equi-ties universe. Latin America accounts for 32% of the regional government bond market value versus 22% for corporate bonds and just 16% for equities.
As the effects of developed world fiscal austerity and economic recovery erode overall government budget deficits, we anticipate a continued deceler-ation in the growth of developed sovereign bond market value to GDP ratios in the medium term, followed by a longer-term decline as governments seek to reduce significantly enlarged debt burdens.
Indeed using oxford Economics long-run projections for total government debt (i.e. securitized and non-securitized borrowing) we concur with the trend decline in the size of government debt relative to GDP in Japan, Italy and the UK (three out of four of the world’s largest government debt markets) while the USA remains more stable at close to 120% (Figure 23 and 24).
Similarly, we utilize long-run forecasts by oxford Economics for government debt to GDP ratios to project the size of sovereign bond markets for the emerging world, making the assumption that the ratio of securitized to non-securitized government debt remains constant at an individual country level.
We are only able to obtain long-run projections for central government debt (excluding local gov-ernment municipal debt and state-owned enter-prises, thus understating total general government debt for a number of countries), which results in six (out of 33) of the securitized government debt to gross government debt ratios being in excess of 100%. nonetheless, by basing our projections on
Figure 23
Gross government debt for the four largest emerging world sovereign bond markets (% GDP)Source: oxford Economics, Credit Suisse estimates
Figure 24
Gross government debt for the four largest developed world sovereign bond markets (% GDP)Source: oxford Economics, Credit Suisse estimates
Finally, we address growth in the sovereign bond market – the smallest of the asset classes under consideration. In the nine years from 2005 to 2014, the magnitude of the sovereign bond mar-ket relative to that of the overall economy has grown for developed markets from 65% to 93%, while declining for emerging markets from 31% to 25% – the only regional capital market in this
EMERGInG CAPITAL MARKETS_24
Country/Region 2014 2030E
Sovereign bond
market (USD bn)
Sovereign bond
market (% GDP)
Central government gross debt
(% GDP)
% securitized
sovereign debt
Weight in global
sovereign bonds
Central govern-
ment gross debt
(% GDP)
Sovereign bond
market (% GDP)
GDP (USD bn)
Sovereign bond
market (USD bn)
Weight in global
sovereign bonds
Brazil 1,311.4 58.4% 57.7% 101.2% 3.0% 52.1% 52.7% 4,853 2,558.0 3.1%
Chile 37.6 13.4% 12.7% 106.2% 0.1% 10.2% 10.8% 776 83.8 0.1%
China 1,462.1 15.9% 16.1% 98.8% 3.4% 23.6% 23.3% 52,998 12,333.4 14.8%
Colombia 113.8 30.2% 32.2% 93.9% 0.3% 22.9% 21.5% 862 185.4 0.2%
hungary 93.1 71.3% 75.5% 94.5% 0.2% 62.6% 59.1% 272 160.7 0.2%
India 606.6 32.6% 56.0% 58.3% 1.4% 28.2% 16.5% 7,530 1,239.7 1.5%
Indonesia 114.0 13.0% 21.9% 59.6% 0.3% 10.5% 6.3% 3,623 227.3 0.3%
Korea 455.2 37.7% 37.6% 100.2% 1.1% 44.9% 45.0% 2,996 1,349.1 1.6%
Malaysia 151.9 48.6% 53.4% 91.2% 0.4% 44.1% 40.2% 1,078 433.7 0.5%
Mexico 429.1 34.1% 42.2% 80.7% 1.0% 42.3% 34.1% 3,083 1,052.5 1.3%
Peru 27.0 13.1% 18.1% 72.4% 0.1% 14.0% 10.1% 602 60.8 0.1%
Philippines 114.1 42.0% 45.7% 91.8% 0.3% 11.9% 10.9% 1,339 145.9 0.2%
Poland 196.9 38.2% 50.1% 76.2% 0.5% 43.5% 33.2% 1,199 397.8 0.5%
Russia 168.3 7.9% 11.8% 67.0% 0.4% 26.3% 17.6% 5,314 935.7 1.1%
Saudi Arabia 26.3 3.5% 2.5% 138.9% 0.1% 0.3% 0.4% 2,177 8.5 0.0%
South Africa 145.7 41.5% 45.8% 90.6% 0.3% 45.4% 41.1% 1,125 462.4 0.6%
Taiwan 180.8 37.0% 37.1% 99.7% 0.4% 25.1% 25.0% 1,369 342.1 0.4%
Thailand 107.5 27.7% 36.5% 75.9% 0.2% 50.8% 38.6% 1,156 445.8 0.5%
Turkey 259.6 31.6% 38.4% 82.3% 0.6% 20.5% 16.8% 2,243 377.6 0.5%
BRIC 3,548.4 23.0% 26.4% 87.2% 8.2% 26.2% 24.1% 70,695 17,066.9 20.4%
Emerging markets 6,001.0 25.4% 29.2% 86.9% 13.9% 26.6% 24.1% 94,597 22,800.3 27.3%
Australia 525.5 35.0% 31.0% 112.6% 1.2% 15.4% 17.3% 3,327 576.2 0.7%
Canada 1,330.0 72.9% 95.3% 76.5% 3.1% 58.1% 44.4% 3,664 1,628.3 1.9%
France 2,182.7 79.8% 120.7% 66.1% 5.1% 95.5% 63.1% 4,177 2,634.8 3.2%
Germany 2,193.9 60.2% 65.7% 91.6% 5.1% 68.6% 62.9% 5,684 3,574.4 4.3%
hong Kong 93.6 34.2% 33.6% 101.7% 0.2% 21.1% 21.5% 700 150.3 0.2%
Israel 155.6 53.3% 66.2% 80.6% 0.4% 39.6% 31.9% 686 219.2 0.3%
Italy 2,345.9 113.2% 146.7% 77.2% 5.4% 113.2% 87.4% 2,955 2,582.7 3.1%
Japan 9,628.1 196.2% 213.6% 91.8% 22.3% 187.8% 172.4% 7,140 12,309.7 14.7%
netherlands 478.8 59.8% 88.2% 67.8% 1.1% 64.9% 44.0% 1,187 522.1 0.6%
Singapore 101.7 34.4% 112.2% 30.7% 0.2% 86.5% 26.5% 788 209.0 0.3%
Spain 1,099.8 81.0% 108.1% 74.9% 2.6% 97.8% 73.2% 2,192 1,605.8 1.9%
Switzerland 114.9 17.7% 33.1% 53.4% 0.3% 27.8% 14.8% 1,043 154.6 0.2%
UK 2,288.7 90.2% 91.6% 98.5% 5.3% 58.7% 57.8% 5,546 3,203.0 3.8%
US 14,558.3 86.7% 123.0% 70.5% 33.8% 121.0% 85.3% 36,784 31,372.4 37.6%
Developed markets 37,097.6 93.5% 119.5% 78.2% 86.1% 104.6% 80.1% 75,873 60,742.5 72.7%
World 43,098.6 68.0% 85.8% 79.3% 100.0% 61.3% 49.0% 170,470 83,542.7 100.0%
Figure 25
Sovereign bond market value and regional and global weight projections for 2014 – 30E (nominal terms)Source: BIS, oxford Economics, Credit Suisse estimates
EMERGInG CAPITAL MARKETS_25
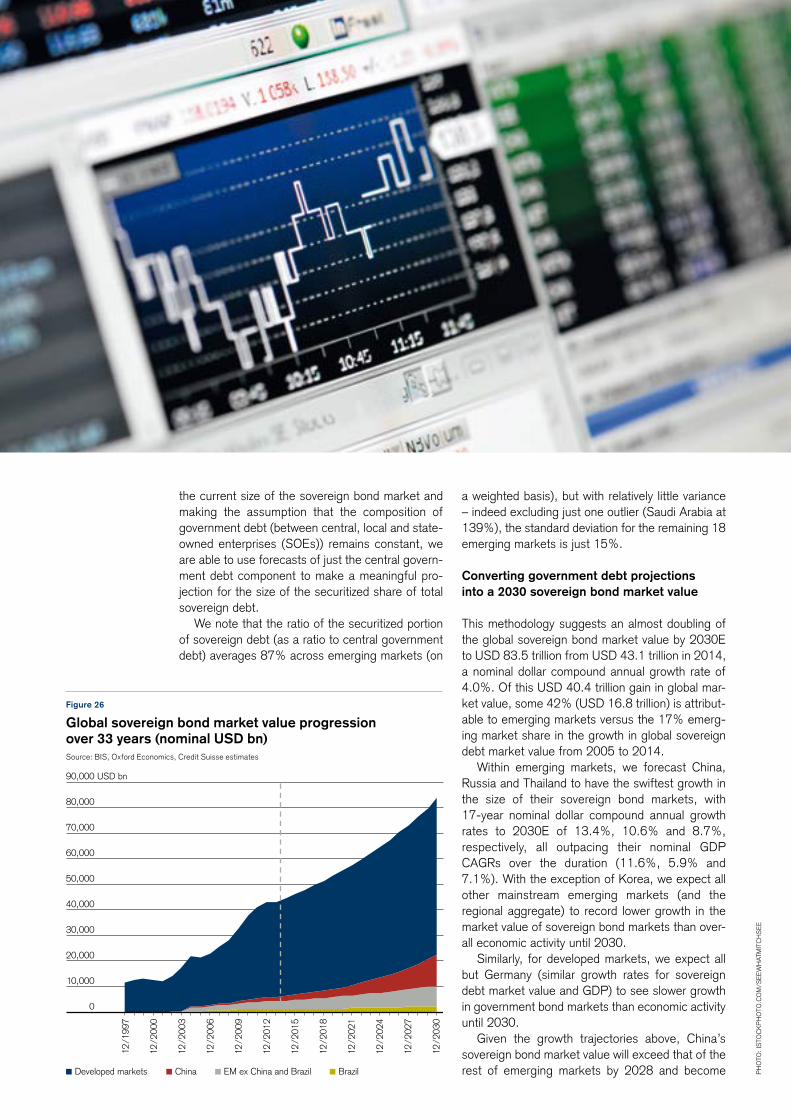
Developed markets China EM ex China and Brazil Brazil
0
10,000
20,000
30,000
40,000
50,000
60,000
70,000
80,000
90,000 USD bn
12/1
997
12/2
000
12/2
003
12/2
006
12/2
009
12/2
012
12/2
015
12/2
018
12/2
021
12/2
024
12/2
027
12/2
030
Figure 26
Global sovereign bond market value progression over 33 years (nominal USD bn)Source: BIS, oxford Economics, Credit Suisse estimates
a weighted basis), but with relatively little variance – indeed excluding just one outlier (Saudi Arabia at 139%), the standard deviation for the remaining 18 emerging markets is just 15%.
Converting government debt projections into a 2030 sovereign bond market value
This methodology suggests an almost doubling of the global sovereign bond market value by 2030E to USD 83.5 trillion from USD 43.1 trillion in 2014, a nominal dollar compound annual growth rate of 4.0%. of this USD 40.4 trillion gain in global mar-ket value, some 42% (USD 16.8 trillion) is attribut-able to emerging markets versus the 17% emerg-ing market share in the growth in global sovereign debt market value from 2005 to 2014.
Within emerging markets, we forecast China, Russia and Thailand to have the swiftest growth in the size of their sovereign bond markets, with 17-year nominal dollar compound annual growth rates to 2030E of 13.4%, 10.6% and 8.7%, respectively, all outpacing their nominal GDP CAGRs over the duration (11.6%, 5.9% and 7.1%). With the exception of Korea, we expect all other mainstream emerging markets (and the regional aggregate) to record lower growth in the market value of sovereign bond markets than over-all economic activity until 2030.
Similarly, for developed markets, we expect all but Germany (similar growth rates for sovereign debt market value and GDP) to see slower growth in government bond markets than economic activity until 2030.
Given the growth trajectories above, China’s sovereign bond market value will exceed that of the rest of emerging markets by 2028 and become
the current size of the sovereign bond market and making the assumption that the composition of government debt (between central, local and state-owned enterprises (SoEs)) remains constant, we are able to use forecasts of just the central govern-ment debt component to make a meaningful pro-jection for the size of the securitized share of total sovereign debt.
We note that the ratio of the securitized portion of sovereign debt (as a ratio to central government debt) averages 87% across emerging markets (on
Ph
oTo
: IS
ToC
KP
ho
To.C
oM
/SE
EW
hAT
MIT
Ch
SE
E
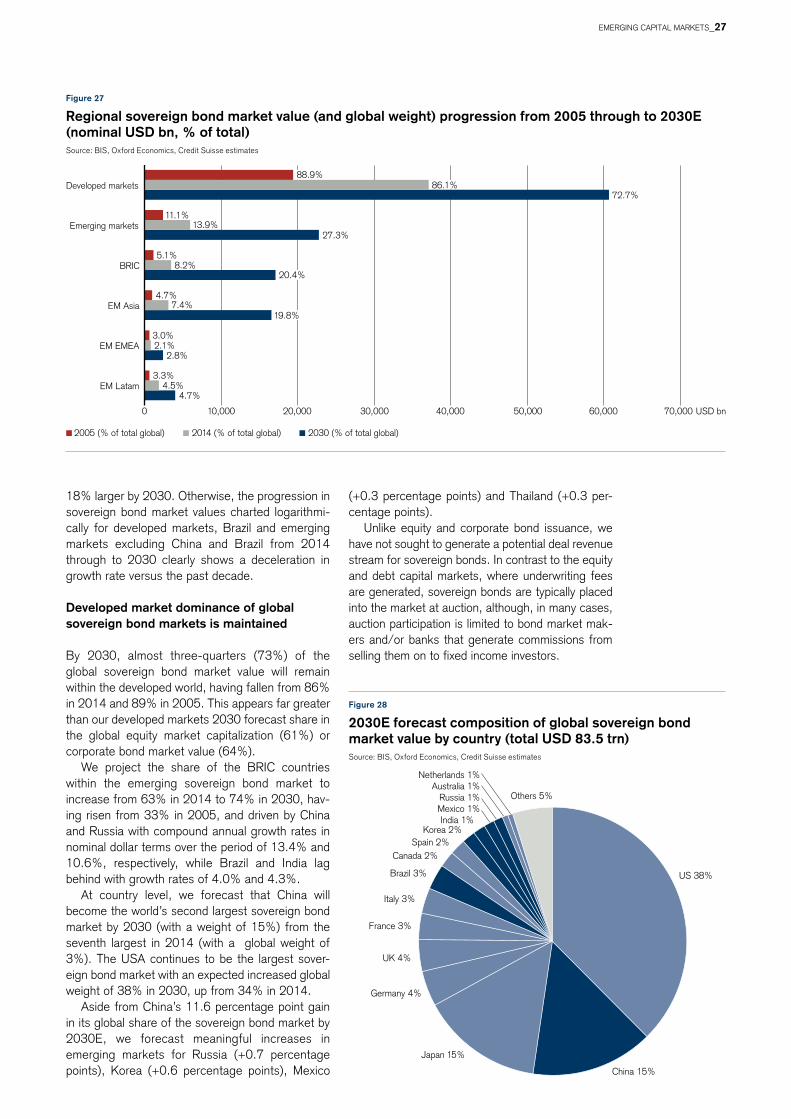
US 38%
China 15%
Japan 15%
Germany 4%
UK 4%
France 3%
Italy 3%
Brazil 3%
Canada 2%Spain 2%
Korea 2%India 1%
Mexico 1%Russia 1%
Australia 1%Netherlands 1%
Others 5%
2005 (% of total global) 2014 (% of total global) 2030 (% of total global)
USD bn
4.7%
2.8%
20.4%
27.3%
72.7%
4.5%
2.1%
7.4%
8.2%
13.9%
86.1%
3.3%
3.0%
4.7%
5.1%
11.1%
88.9%
0 10,000 20,000 30,000 40,000 50,000 60,000 70,000
EM Latam
EM EMEA
EM Asia
BRIC
Emerging markets
Developed markets
19.8%
Figure 27
Regional sovereign bond market value (and global weight) progression from 2005 through to 2030E (nominal USD bn, % of total)Source: BIS, oxford Economics, Credit Suisse estimates
Figure 28
2030E forecast composition of global sovereign bond market value by country (total USD 83.5 trn)Source: BIS, oxford Economics, Credit Suisse estimates
18% larger by 2030. otherwise, the progression in sovereign bond market values charted logarithmi-cally for developed markets, Brazil and emerging markets excluding China and Brazil from 2014 through to 2030 clearly shows a deceleration in growth rate versus the past decade.
Developed market dominance of global sovereign bond markets is maintained
By 2030, almost three-quarters (73%) of the global sovereign bond market value will remain within the developed world, having fallen from 86% in 2014 and 89% in 2005. This appears far greater than our developed markets 2030 forecast share in the global equity market capitalization (61%) or corporate bond market value (64%).
We project the share of the BRIC countries within the emerging sovereign bond market to increase from 63% in 2014 to 74% in 2030, hav-ing risen from 33% in 2005, and driven by China and Russia with compound annual growth rates in nominal dollar terms over the period of 13.4% and 10.6%, respectively, while Brazil and India lag behind with growth rates of 4.0% and 4.3%.
At country level, we forecast that China will become the world’s second largest sovereign bond market by 2030 (with a weight of 15%) from the seventh largest in 2014 (with a global weight of 3%). The USA continues to be the largest sover-eign bond market with an expected increased global weight of 38% in 2030, up from 34% in 2014.
Aside from China’s 11.6 percentage point gain in its global share of the sovereign bond market by 2030E, we forecast meaningful increases in emerging markets for Russia (+0.7 percentage points), Korea (+0.6 percentage points), Mexico
(+0.3 percentage points) and Thailand (+0.3 per-centage points).
Unlike equity and corporate bond issuance, we have not sought to generate a potential deal revenue stream for sovereign bonds. In contrast to the equity and debt capital markets, where underwriting fees are generated, sovereign bonds are typically placed into the market at auction, although, in many cases, auction participation is limited to bond market mak-ers and/or banks that generate commissions from selling them on to fixed income investors.
Ph
oTo
: IS
ToC
KP
ho
To.C
oM
/SE
EW
hAT
MIT
Ch
SE
E
EMERGInG CAPITAL MARKETS_27
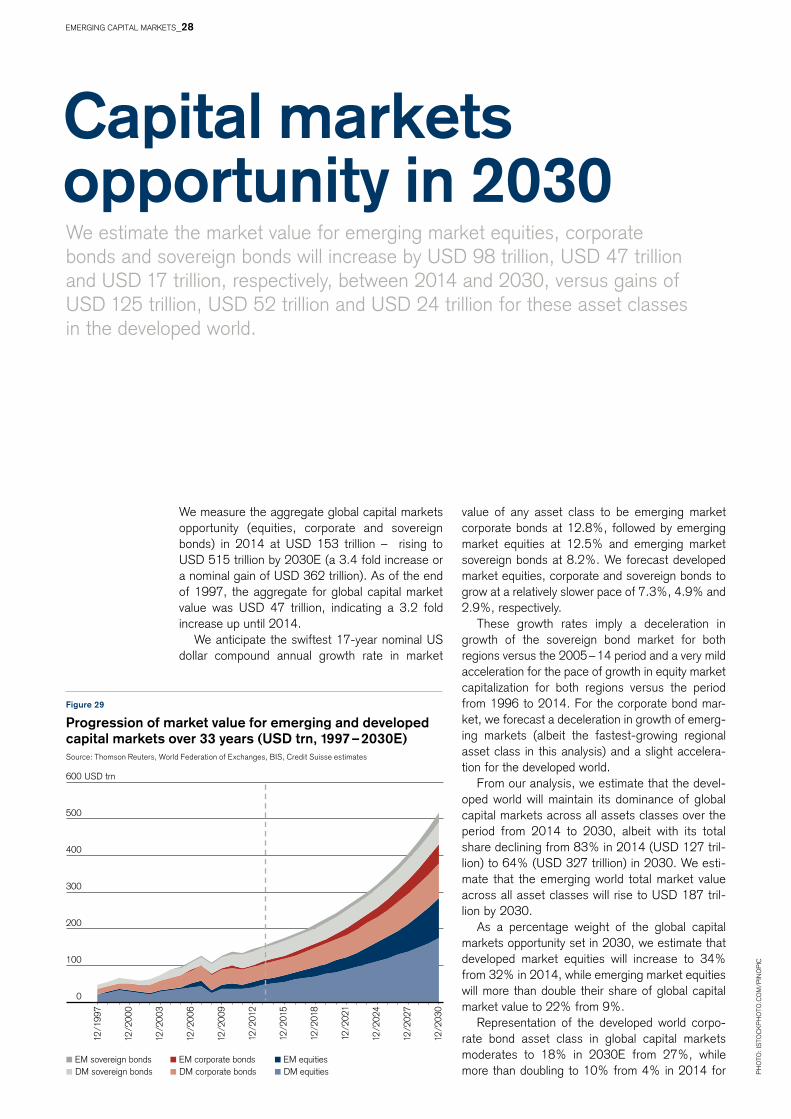
12/1
997
12/2
000
12/2
003
12/2
006
12/2
009
12/2
012
12/2
015
12/2
018
12/2
021
12/2
024
12/2
027
12/2
030
DM sovereign bonds DM corporate bonds DM equities
0
100
200
300
400
500
600 USD trn
EM sovereign bonds EM corporate bonds EM equities
Figure 29
Progression of market value for emerging and developed capital markets over 33 years (USD trn, 1997 – 2030E)Source: Thomson Reuters, World Federation of Exchanges, BIS, Credit Suisse estimates
Capital markets opportunity in 2030We estimate the market value for emerging market equities, corporate bonds and sovereign bonds will increase by USD 98 trillion, USD 47 trillion and USD 17 trillion, respectively, between 2014 and 2030, versus gains of USD 125 trillion, USD 52 trillion and USD 24 trillion for these asset classes in the developed world.
We measure the aggregate global capital markets opportunity (equities, corporate and sovereign bonds) in 2014 at USD 153 trillion – rising to USD 515 trillion by 2030E (a 3.4 fold increase or a nominal gain of USD 362 trillion). As of the end of 1997, the aggregate for global capital market value was USD 47 trillion, indicating a 3.2 fold increase up until 2014.
We anticipate the swiftest 17-year nominal US dollar compound annual growth rate in market
Ph
oTo
: IS
ToC
KP
ho
To.C
oM
/PIn
oP
IC
value of any asset class to be emerging market corporate bonds at 12.8%, followed by emerging market equities at 12.5% and emerging market sovereign bonds at 8.2%. We forecast developed market equities, corporate and sovereign bonds to grow at a relatively slower pace of 7.3%, 4.9% and 2.9%, respectively.
These growth rates imply a deceleration in growth of the sovereign bond market for both regions versus the 2005 – 14 period and a very mild acceleration for the pace of growth in equity market capitalization for both regions versus the period from 1996 to 2014. For the corporate bond mar-ket, we forecast a deceleration in growth of emerg-ing markets (albeit the fastest-growing regional asset class in this analysis) and a slight accelera-tion for the developed world.
From our analysis, we estimate that the devel-oped world will maintain its dominance of global capital markets across all assets classes over the period from 2014 to 2030, albeit with its total share declining from 83% in 2014 (USD 127 tril-lion) to 64% (USD 327 trillion) in 2030. We esti-mate that the emerging world total market value across all asset classes will rise to USD 187 tril-lion by 2030.
As a percentage weight of the global capital markets opportunity set in 2030, we estimate that developed market equities will increase to 34% from 32% in 2014, while emerging market equities will more than double their share of global capital market value to 22% from 9%.
Representation of the developed world corpo-rate bond asset class in global capital markets moderates to 18% in 2030E from 27%, while more than doubling to 10% from 4% in 2014 for
EMERGInG CAPITAL MARKETS_28

Ph
oTo
: IS
ToC
KP
ho
To.C
oM
/PIn
oP
IC
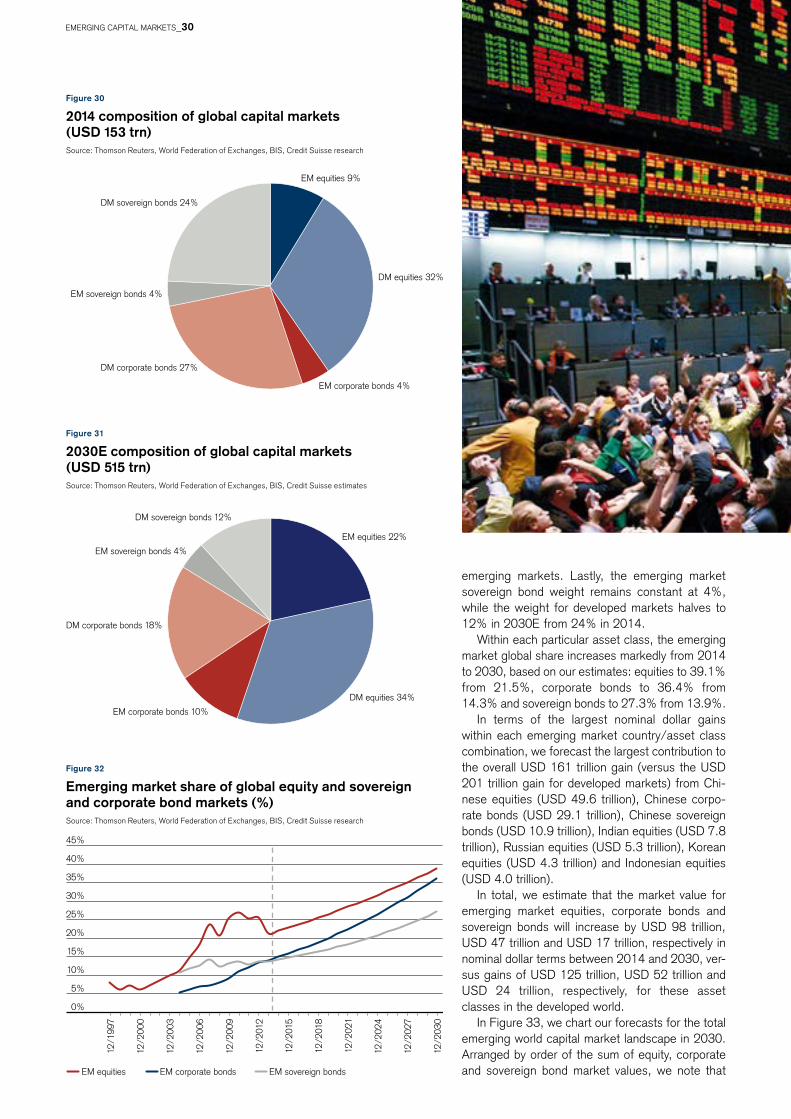
0%
5%
10%
15%
20%
25%
30%
35%
40%
45%
12/1
997
12/2
000
12/2
003
12/2
006
12/2
009
12/2
012
12/2
015
12/2
018
12/2
021
12/2
024
12/2
027
12/2
030
EM equities EM corporate bonds EM sovereign bonds
EM equities 9%
DM equities 32%
EM corporate bonds 4%
DM corporate bonds 27%
EM sovereign bonds 4%
DM sovereign bonds 24%
EM equities 22%
DM equities 34%
EM corporate bonds 10%
DM corporate bonds 18%
EM sovereign bonds 4%
DM sovereign bonds 12%
Figure 32
Emerging market share of global equity and sovereign and corporate bond markets (%)Source: Thomson Reuters, World Federation of Exchanges, BIS, Credit Suisse research
emerging markets. Lastly, the emerging market sovereign bond weight remains constant at 4%, while the weight for developed markets halves to 12% in 2030E from 24% in 2014.
Within each particular asset class, the emerging market global share increases markedly from 2014 to 2030, based on our estimates: equities to 39.1% from 21.5%, corporate bonds to 36.4% from 14.3% and sovereign bonds to 27.3% from 13.9%.
In terms of the largest nominal dollar gains within each emerging market country/asset class combination, we forecast the largest contribution to the overall USD 161 trillion gain (versus the USD 201 trillion gain for developed markets) from Chi-nese equities (USD 49.6 trillion), Chinese corpo-rate bonds (USD 29.1 trillion), Chinese sovereign bonds (USD 10.9 trillion), Indian equities (USD 7.8 trillion), Russian equities (USD 5.3 trillion), Korean equities (USD 4.3 trillion) and Indonesian equities (USD 4.0 trillion).
In total, we estimate that the market value for emerging market equities, corporate bonds and sovereign bonds will increase by USD 98 trillion, USD 47 trillion and USD 17 trillion, respectively in nominal dollar terms between 2014 and 2030, ver-sus gains of USD 125 trillion, USD 52 trillion and USD 24 trillion, respectively, for these asset classes in the developed world.
In Figure 33, we chart our forecasts for the total emerging world capital market landscape in 2030. Arranged by order of the sum of equity, corporate and sovereign bond market values, we note that
Figure 30
2014 composition of global capital markets (USD 153 trn)Source: Thomson Reuters, World Federation of Exchanges, BIS, Credit Suisse research
Figure 31
2030E composition of global capital markets (USD 515 trn)Source: Thomson Reuters, World Federation of Exchanges, BIS, Credit Suisse estimates
Ph
oTo
: IS
ToC
KP
ho
To.C
oM
/ED
STo
CK
EMERGInG CAPITAL MARKETS_30
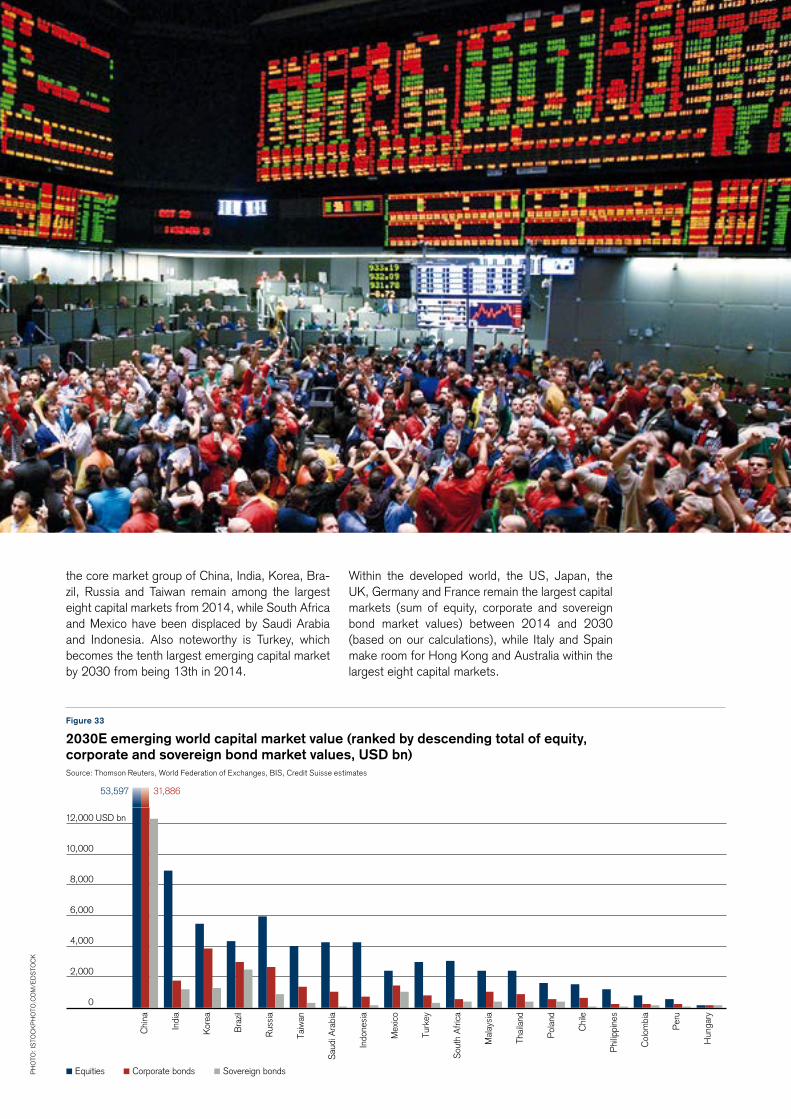
Chi
na
Indi
a
Kor
ea
Bra
zil
Rus
sia
Taiw
an
Sau
di A
rabi
a
Indo
nesi
a
Mex
ico
Turk
ey
Sou
th A
frica
Mal
aysi
a
Thai
land
Pol
and
Chi
le
Phi
lippi
nes
Col
ombi
a
Per
u
Hun
gary
0
2,000
4,000
6,000
8,000
10,000
12,000 USD bn
53,597 31,886
Equities Corporate bonds Sovereign bonds
Figure 33
2030E emerging world capital market value (ranked by descending total of equity, corporate and sovereign bond market values, USD bn)Source: Thomson Reuters, World Federation of Exchanges, BIS, Credit Suisse estimates
Ph
oTo
: IS
ToC
KP
ho
To.C
oM
/ED
STo
CK
the core market group of China, India, Korea, Bra-zil, Russia and Taiwan remain among the largest eight capital markets from 2014, while South Africa and Mexico have been displaced by Saudi Arabia and Indonesia. Also noteworthy is Turkey, which becomes the tenth largest emerging capital market by 2030 from being 13th in 2014.
Within the developed world, the US, Japan, the UK, Germany and France remain the largest capital markets (sum of equity, corporate and sovereign bond market values) between 2014 and 2030 (based on our calculations), while Italy and Spain make room for hong Kong and Australia within the largest eight capital markets.
Global capital market revenue outlook to 2030From our analysis of the evolution of global capital markets, we estimate underwriting fees from primary equity and bond activity, which we then apportion between emerging and developed market-domiciled financial service intermediaries using observed trends in allocation.
From our analysis on the evolution of global capital markets, we have determined the progression of equity and corporate debt markets globally until 2030. having calculated an estimate for potential deal value, we can estimate the implied underwriting fees from primary equity and bond activity, which we then apportion between financial service intermedi-aries domiciled in emerging and developed markets
using the observed trends in allocation. Unlike equity and corporate bond issuance, we have not sought to generate a potential deal revenue stream for sovereign bonds, which are typically placed into the market at auction, although in many cases auc-tion participants are limited to bond market makers and/or banks that generate commissions from sell-ing them on to fixed income investors. P
ho
To:
ISTo
CK
Ph
oTo
.Co
M/-
oX
FoR
D-
EMERGInG CAPITAL MARKETS_32
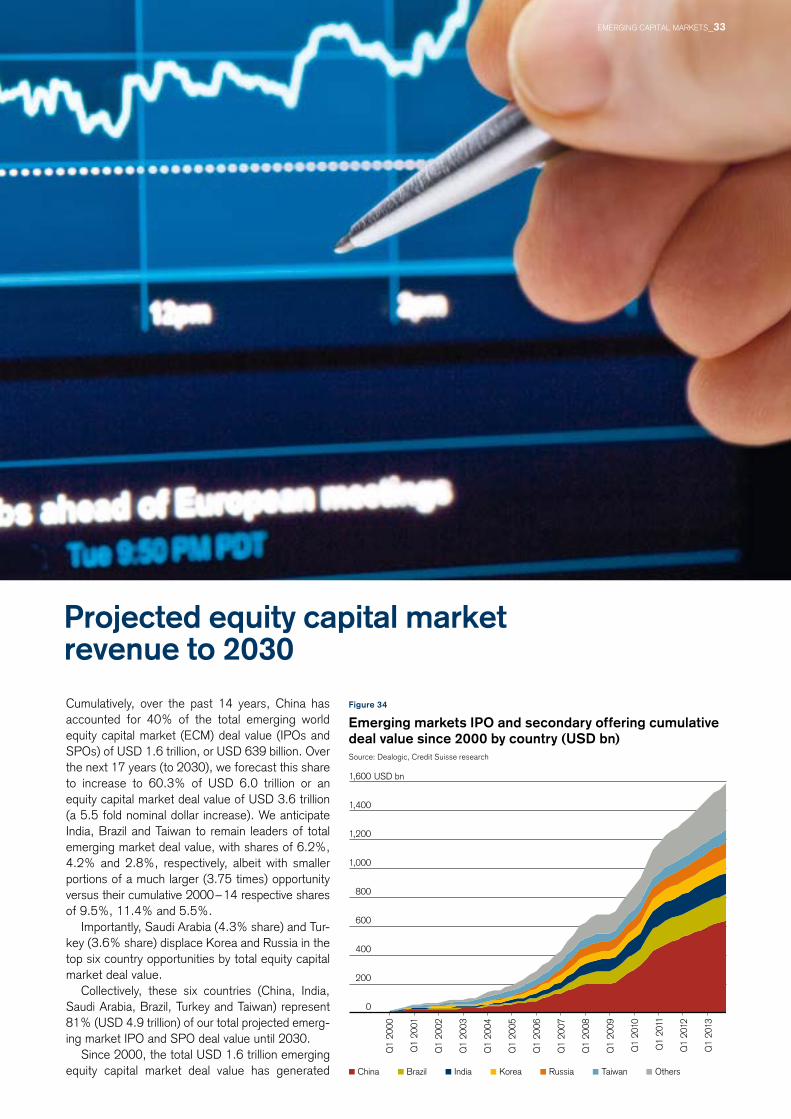
Korea Russia Taiwan OthersChina Brazil India
0
200
400
600
800
1,000
1,200
1,400
1,600 USD bn
Q1
2000
Q1
2001
Q1
2002
Q1
2003
Q1
2004
Q1
2005
Q1
2006
Q1
2007
Q1
2008
Q1
2009
Q1
2010
Q1
2011
Q1
2012
Q1
2013
Projected equity capital market revenue to 2030
Cumulatively, over the past 14 years, China has accounted for 40% of the total emerging world equity capital market (ECM) deal value (IPos and SPos) of USD 1.6 trillion, or USD 639 billion. over the next 17 years (to 2030), we forecast this share to increase to 60.3% of USD 6.0 trillion or an equity capital market deal value of USD 3.6 trillion (a 5.5 fold nominal dollar increase). We anticipate India, Brazil and Taiwan to remain leaders of total emerging market deal value, with shares of 6.2%, 4.2% and 2.8%, respectively, albeit with smaller portions of a much larger (3.75 times) opportunity versus their cumulative 2000 – 14 respective shares of 9.5%, 11.4% and 5.5%.
Importantly, Saudi Arabia (4.3% share) and Tur-key (3.6% share) displace Korea and Russia in the top six country opportunities by total equity capital market deal value.
Collectively, these six countries (China, India, Saudi Arabia, Brazil, Turkey and Taiwan) represent 81% (USD 4.9 trillion) of our total projected emerg-ing market IPo and SPo deal value until 2030.
Since 2000, the total USD 1.6 trillion emerging equity capital market deal value has generated
Figure 34
Emerging markets IPo and secondary offering cumulative deal value since 2000 by country (USD bn)Source: Dealogic, Credit Suisse research
Ph
oTo
: IS
ToC
KP
ho
To.C
oM
/-o
XFo
RD
-
EMERGInG CAPITAL MARKETS_33
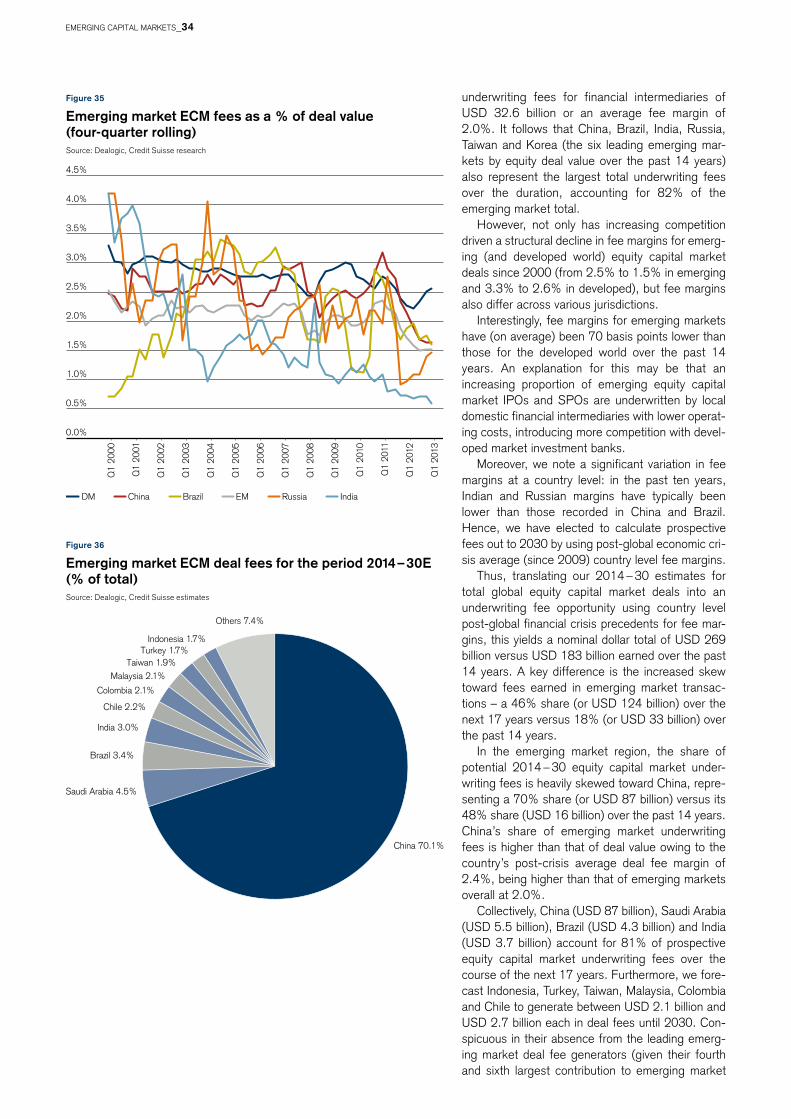
China 70.1%
Saudi Arabia 4.5%
Brazil 3.4%
India 3.0%
Chile 2.2%
Colombia 2.1%
Malaysia 2.1%Taiwan 1.9%
Turkey 1.7%Indonesia 1.7%
Others 7.4%
Q1
2000
Q1
2001
Q1
2002
Q1
2003
Q1
2004
Q1
2005
Q1
2006
Q1
2007
Q1
2008
Q1
2009
Q1
2010
Q1
2011
Q1
2012
Q1
2013
0.0%
0.5%
1.0%
1.5%
2.0%
2.5%
3.0%
3.5%
4.0%
4.5%
DM China Brazil EM Russia India
underwriting fees for financial intermediaries of USD 32.6 billion or an average fee margin of 2.0%. It follows that China, Brazil, India, Russia, Taiwan and Korea (the six leading emerging mar-kets by equity deal value over the past 14 years) also represent the largest total underwriting fees over the duration, accounting for 82% of the emerging market total.
however, not only has increasing competition driven a structural decline in fee margins for emerg-ing (and developed world) equity capital market deals since 2000 (from 2.5% to 1.5% in emerging and 3.3% to 2.6% in developed), but fee margins also differ across various jurisdictions.
Interestingly, fee margins for emerging markets have (on average) been 70 basis points lower than those for the developed world over the past 14 years. An explanation for this may be that an increasing proportion of emerging equity capital market IPos and SPos are underwritten by local domestic financial intermediaries with lower operat-ing costs, introducing more competition with devel-oped market investment banks.
Moreover, we note a significant variation in fee margins at a country level: in the past ten years, Indian and Russian margins have typically been lower than those recorded in China and Brazil. hence, we have elected to calculate prospective fees out to 2030 by using post-global economic cri-sis average (since 2009) country level fee margins.
Thus, translating our 2014 – 30 estimates for total global equity capital market deals into an underwriting fee opportunity using country level post-global financial crisis precedents for fee mar-gins, this yields a nominal dollar total of USD 269 billion versus USD 183 billion earned over the past 14 years. A key difference is the increased skew toward fees earned in emerging market transac-tions – a 46% share (or USD 124 billion) over the next 17 years versus 18% (or USD 33 billion) over the past 14 years.
In the emerging market region, the share of potential 2014 – 30 equity capital market under-writing fees is heavily skewed toward China, repre-senting a 70% share (or USD 87 billion) versus its 48% share (USD 16 billion) over the past 14 years. China’s share of emerging market underwriting fees is higher than that of deal value owing to the country’s post-crisis average deal fee margin of 2.4%, being higher than that of emerging markets overall at 2.0%.
Collectively, China (USD 87 billion), Saudi Arabia (USD 5.5 billion), Brazil (USD 4.3 billion) and India (USD 3.7 billion) account for 81% of prospective equity capital market underwriting fees over the course of the next 17 years. Furthermore, we fore-cast Indonesia, Turkey, Taiwan, Malaysia, Colombia and Chile to generate between USD 2.1 billion and USD 2.7 billion each in deal fees until 2030. Con-spicuous in their absence from the leading emerg-ing market deal fee generators (given their fourth and sixth largest contribution to emerging market
Figure 36
Emerging market ECm deal fees for the period 2014 – 30E (% of total)Source: Dealogic, Credit Suisse estimates
Figure 35
Emerging market ECm fees as a % of deal value (four-quarter rolling)Source: Dealogic, Credit Suisse research
EMERGInG CAPITAL MARKETS_34
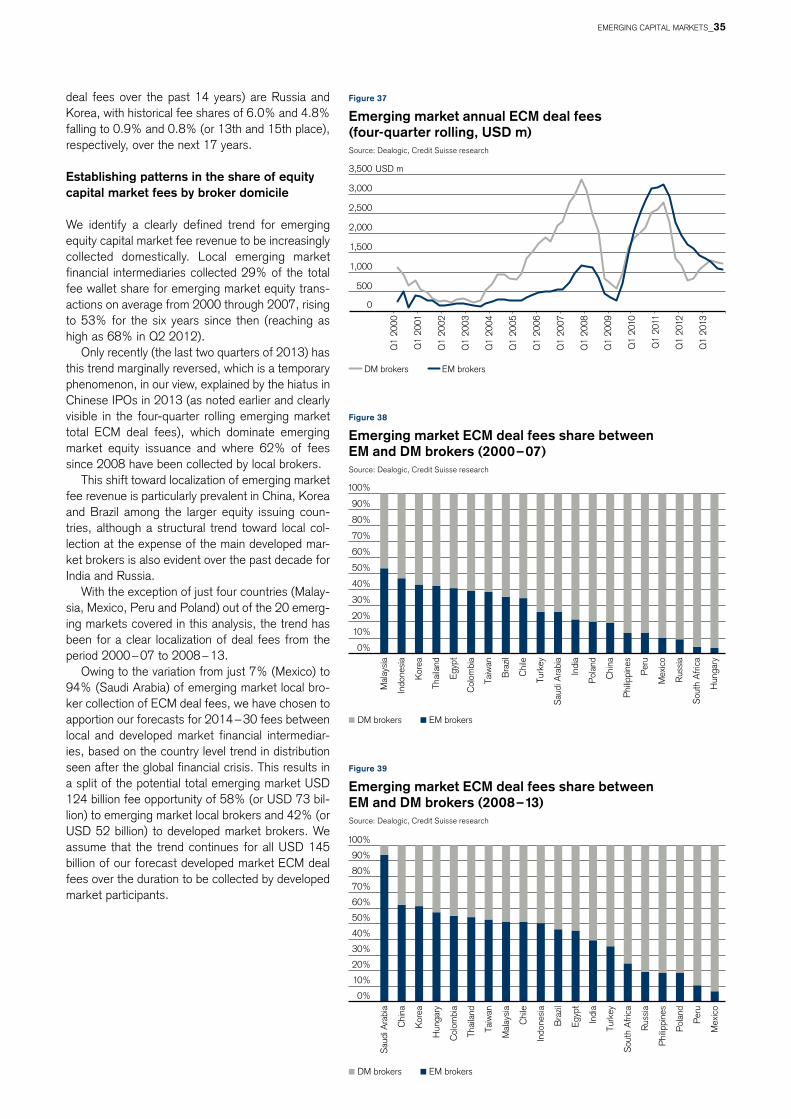
USD m
Q1
2000
Q1
2001
Q1
2002
Q1
2003
Q1
2004
Q1
2005
Q1
2006
Q1
2007
Q1
2008
Q1
2009
Q1
2010
Q1
2011
Q1
2012
Q1
2013
0
500
1,000
1,500
2,000
2,500
3,000
3,500
DM brokers EM brokers
DM brokers EM brokers
0%
10%
20%
30%
40%
50%
60%
70%
80%
90%
100%
Sau
di A
rabi
a
Chi
na
Kor
ea
Hun
gary
Col
ombi
a
Thai
land
Taiw
an
Mal
aysi
a
Chi
le
Indo
nesi
a
Bra
zil
Egyp
t
Indi
a
Turk
ey
Sou
th A
frica
Rus
sia
Phi
lippi
nes
Pol
and
Per
u
Mex
ico
DM brokers EM brokers
0%
10%
20%
30%
40%
50%
60%
70%
80%
90%
100%
Mal
aysi
a
Indo
nesi
a
Kor
ea
Thai
land
Egyp
t
Col
ombi
a
Taiw
an
Bra
zil
Chi
le
Turk
ey
Sau
di A
rabi
a
Indi
a
Pol
and
Chi
na
Phi
lippi
nes
Per
u
Mex
ico
Rus
sia
Sou
th A
frica
Hun
gary
Figure 37
Emerging market annual ECm deal fees (four-quarter rolling, USD m)Source: Dealogic, Credit Suisse research
Figure 38
Emerging market ECm deal fees share between Em and Dm brokers (2000 – 07)Source: Dealogic, Credit Suisse research
Figure 39
Emerging market ECm deal fees share between Em and Dm brokers (2008 – 13)Source: Dealogic, Credit Suisse research
deal fees over the past 14 years) are Russia and Korea, with historical fee shares of 6.0% and 4.8% falling to 0.9% and 0.8% (or 13th and 15th place), respectively, over the next 17 years.
Establishing patterns in the share of equity capital market fees by broker domicile
We identify a clearly defined trend for emerging equity capital market fee revenue to be increasingly collected domestically. Local emerging market financial intermediaries collected 29% of the total fee wallet share for emerging market equity trans-actions on average from 2000 through 2007, rising to 53% for the six years since then (reaching as high as 68% in Q2 2012).
only recently (the last two quarters of 2013) has this trend marginally reversed, which is a temporary phenomenon, in our view, explained by the hiatus in Chinese IPos in 2013 (as noted earlier and clearly visible in the four-quarter rolling emerging market total ECM deal fees), which dominate emerging market equity issuance and where 62% of fees since 2008 have been collected by local brokers.
This shift toward localization of emerging market fee revenue is particularly prevalent in China, Korea and Brazil among the larger equity issuing coun-tries, although a structural trend toward local col-lection at the expense of the main developed mar-ket brokers is also evident over the past decade for India and Russia.
With the exception of just four countries (Malay-sia, Mexico, Peru and Poland) out of the 20 emerg-ing markets covered in this analysis, the trend has been for a clear localization of deal fees from the period 2000 – 07 to 2008 – 13.
owing to the variation from just 7% (Mexico) to 94% (Saudi Arabia) of emerging market local bro-ker collection of ECM deal fees, we have chosen to apportion our forecasts for 2014 – 30 fees between local and developed market financial intermediar-ies, based on the country level trend in distribution seen after the global financial crisis. This results in a split of the potential total emerging market USD 124 billion fee opportunity of 58% (or USD 73 bil-lion) to emerging market local brokers and 42% (or USD 52 billion) to developed market brokers. We assume that the trend continues for all USD 145 billion of our forecast developed market ECM deal fees over the duration to be collected by developed market participants.
EMERGInG CAPITAL MARKETS_35
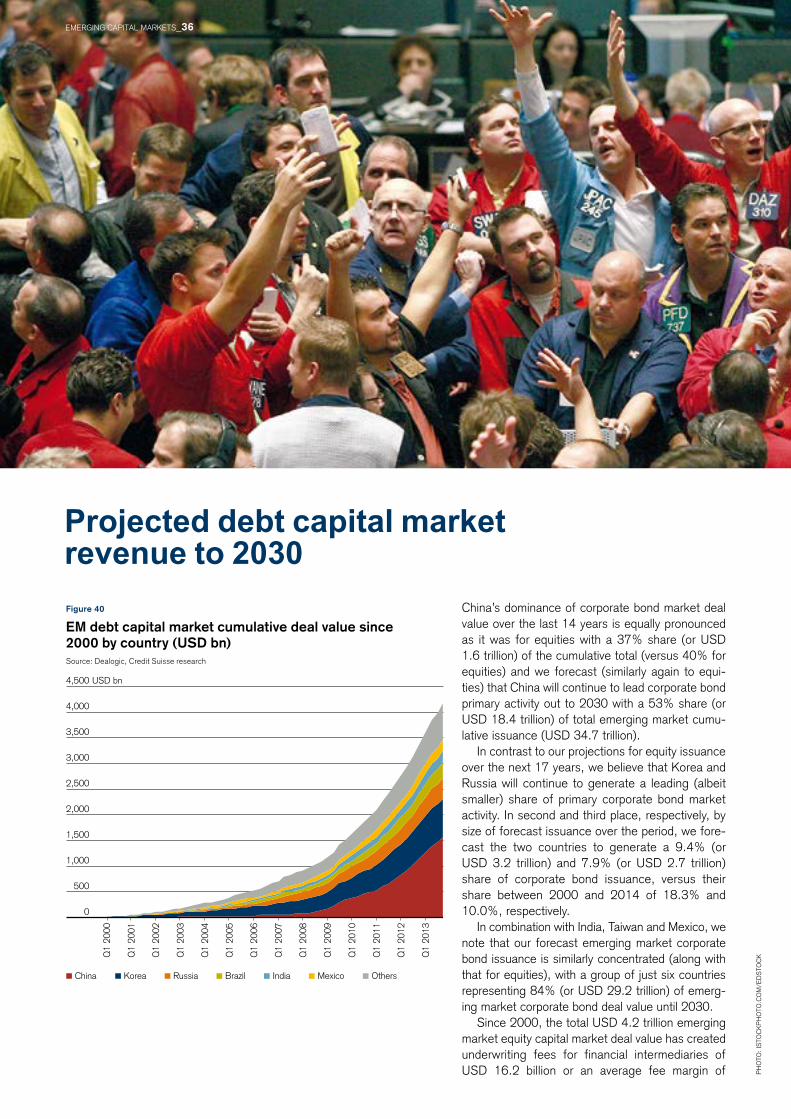
Brazil India Mexico OthersChina Korea Russia
USD bn
Q1
2000
Q1
2001
Q1
2002
Q1
2003
Q1
2004
Q1
2005
Q1
2006
Q1
2007
Q1
2008
Q1
2009
Q1
2010
Q1
2011
Q1
2012
Q1
2013
0
500
1,000
1,500
2,000
2,500
3,000
3,500
4,000
4,500
Projected debt capital market revenue to 2030Figure 40
Em debt capital market cumulative deal value since 2000 by country (USD bn)Source: Dealogic, Credit Suisse research
China’s dominance of corporate bond market deal value over the last 14 years is equally pronounced as it was for equities with a 37% share (or USD 1.6 trillion) of the cumulative total (versus 40% for equities) and we forecast (similarly again to equi-ties) that China will continue to lead corporate bond primary activity out to 2030 with a 53% share (or USD 18.4 trillion) of total emerging market cumu-lative issuance (USD 34.7 trillion).
In contrast to our projections for equity issuance over the next 17 years, we believe that Korea and Russia will continue to generate a leading (albeit smaller) share of primary corporate bond market activity. In second and third place, respectively, by size of forecast issuance over the period, we fore-cast the two countries to generate a 9.4% (or USD 3.2 trillion) and 7.9% (or USD 2.7 trillion) share of corporate bond issuance, versus their share between 2000 and 2014 of 18.3% and 10.0%, respectively.
In combination with India, Taiwan and Mexico, we note that our forecast emerging market corporate bond issuance is similarly concentrated (along with that for equities), with a group of just six countries representing 84% (or USD 29.2 trillion) of emerg-ing market corporate bond deal value until 2030.
Since 2000, the total USD 4.2 trillion emerging market equity capital market deal value has created underwriting fees for financial intermediaries of USD 16.2 billion or an average fee margin of P
ho
To:
ISTo
CK
Ph
oTo
.Co
M/E
DS
ToC
K
EMERGInG CAPITAL MARKETS_36
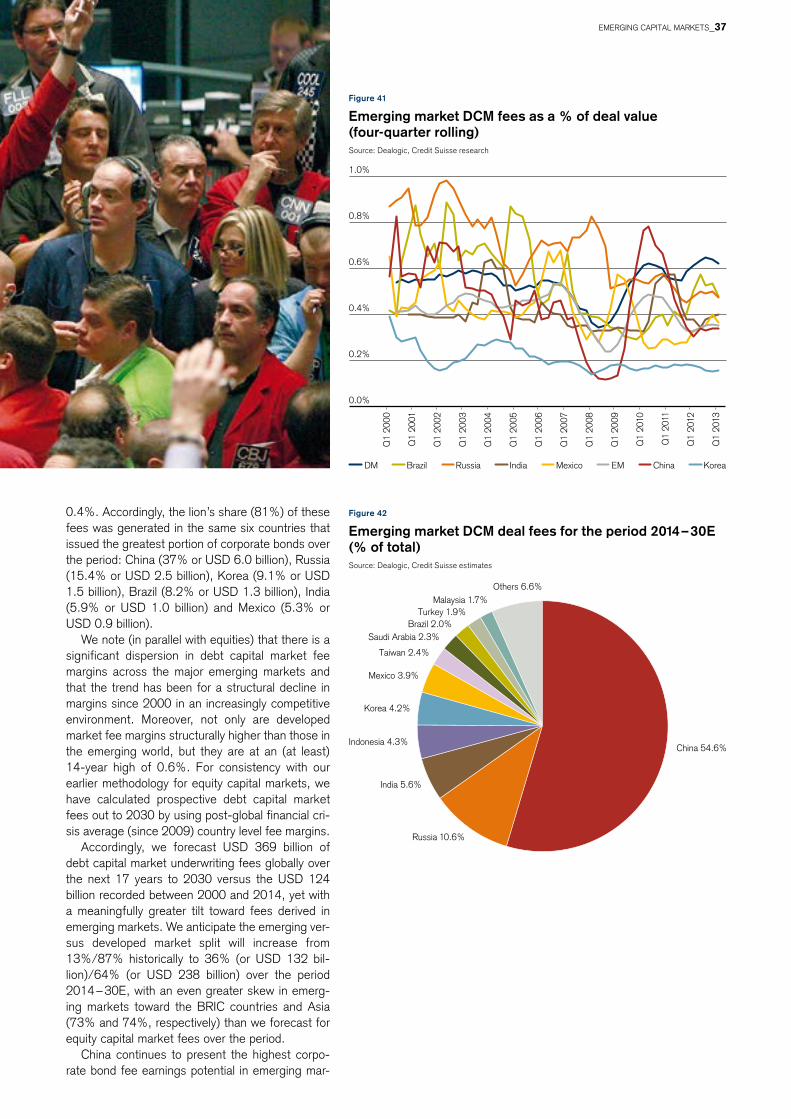
Q1
2000
Q1
2001
Q1
2002
Q1
2003
Q1
2004
Q1
2005
Q1
2006
Q1
2007
Q1
2008
Q1
2009
Q1
2010
Q1
2011
Q1
2012
Q1
2013
0.0%
0.2%
0.4%
0.6%
0.8%
1.0%
DM Brazil Russia India Mexico EM China Korea
China 54.6%
Russia 10.6%
India 5.6%
Indonesia 4.3%
Korea 4.2%
Mexico 3.9%
Taiwan 2.4%
Saudi Arabia 2.3%Brazil 2.0%
Turkey 1.9%Malaysia 1.7%
Others 6.6%
Figure 41
Emerging market DCm fees as a % of deal value (four-quarter rolling)Source: Dealogic, Credit Suisse research
Figure 42
Emerging market DCm deal fees for the period 2014 – 30E (% of total)Source: Dealogic, Credit Suisse estimates
0.4%. Accordingly, the lion’s share (81%) of these fees was generated in the same six countries that issued the greatest portion of corporate bonds over the period: China (37% or USD 6.0 billion), Russia (15.4% or USD 2.5 billion), Korea (9.1% or USD 1.5 billion), Brazil (8.2% or USD 1.3 billion), India (5.9% or USD 1.0 billion) and Mexico (5.3% or USD 0.9 billion).
We note (in parallel with equities) that there is a significant dispersion in debt capital market fee margins across the major emerging markets and that the trend has been for a structural decline in margins since 2000 in an increasingly competitive environment. Moreover, not only are developed market fee margins structurally higher than those in the emerging world, but they are at an (at least) 14-year high of 0.6%. For consistency with our earlier methodology for equity capital markets, we have calculated prospective debt capital market fees out to 2030 by using post-global financial cri-sis average (since 2009) country level fee margins.
Accordingly, we forecast USD 369 billion of debt capital market underwriting fees globally over the next 17 years to 2030 versus the USD 124 billion recorded between 2000 and 2014, yet with a meaningfully greater tilt toward fees derived in emerging markets. We anticipate the emerging ver-sus developed market split will increase from 13%/87% historically to 36% (or USD 132 bil-lion)/64% (or USD 238 billion) over the period 2014 – 30E, with an even greater skew in emerg-ing markets toward the BRIC countries and Asia (73% and 74%, respectively) than we forecast for equity capital market fees over the period.
China continues to present the highest corpo-rate bond fee earnings potential in emerging mar-P
ho
To:
ISTo
CK
Ph
oTo
.Co
M/E
DS
ToC
K
EMERGInG CAPITAL MARKETS_37
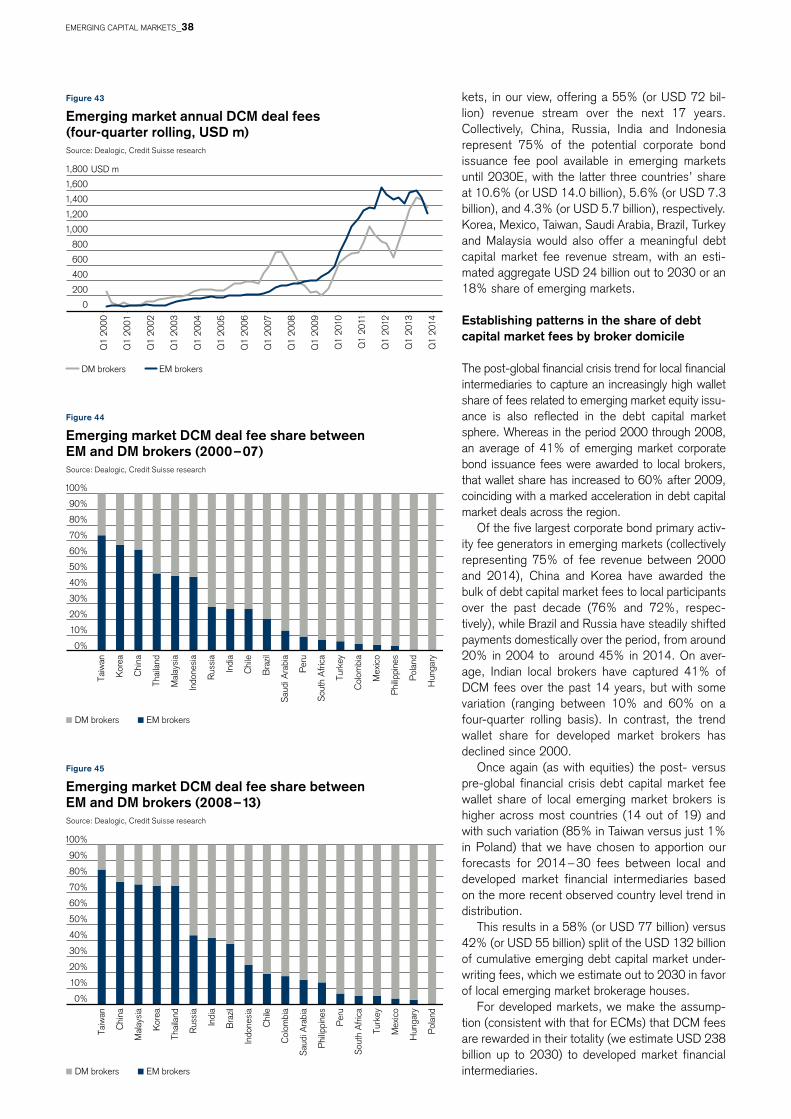
DM brokers EM brokers
0%
10%
20%
30%
40%
50%
60%
70%
80%
90%
100%
Taiw
an
Kor
ea
Chi
na
Thai
land
Mal
aysi
a
Indo
nesi
a
Rus
sia
Indi
a
Chi
le
Bra
zil
Sau
di A
rabi
a
Per
u
Sou
th A
frica
Turk
ey
Col
ombi
a
Mex
ico
Phi
lippi
nes
Pol
and
Hun
gary
DM brokers EM brokers
0%
10%
20%
30%
40%
50%
60%
70%
80%
90%
100%
Taiw
an
Chi
na
Mal
aysi
a
Kor
ea
Thai
land
Rus
sia
Indi
a
Bra
zil
Indo
nesi
a
Chi
le
Col
ombi
a
Sau
di A
rabi
a
Phi
lippi
nes
Per
u
Sou
th A
frica
Turk
ey
Mex
ico
Hun
gary
Pol
and
USD m
Q1
2000
Q1
2001
Q1
2002
Q1
2003
Q1
2004
Q1
2005
Q1
2006
Q1
2007
Q1
2008
Q1
2009
Q1
2010
Q1
2011
Q1
2012
Q1
2013
Q1
2014
DM brokers EM brokers
0
200
400
600
800
1,000
1,200
1,400
1,600
1,800
Figure 44
Emerging market DCm deal fee share between Em and Dm brokers (2000 – 07)Source: Dealogic, Credit Suisse research
Figure 45
Emerging market DCm deal fee share between Em and Dm brokers (2008 – 13)Source: Dealogic, Credit Suisse research
kets, in our view, offering a 55% (or USD 72 bil-lion) revenue stream over the next 17 years. Collectively, China, Russia, India and Indonesia represent 75% of the potential corporate bond issuance fee pool available in emerging markets until 2030E, with the latter three countries’ share at 10.6% (or USD 14.0 billion), 5.6% (or USD 7.3 billion), and 4.3% (or USD 5.7 billion), respectively. Korea, Mexico, Taiwan, Saudi Arabia, Brazil, Turkey and Malaysia would also offer a meaningful debt capital market fee revenue stream, with an esti-mated aggregate USD 24 billion out to 2030 or an 18% share of emerging markets.
Establishing patterns in the share of debt capital market fees by broker domicile
The post-global financial crisis trend for local financial intermediaries to capture an increasingly high wallet share of fees related to emerging market equity issu-ance is also reflected in the debt capital market sphere. Whereas in the period 2000 through 2008, an average of 41% of emerging market corporate bond issuance fees were awarded to local brokers, that wallet share has increased to 60% after 2009, coinciding with a marked acceleration in debt capital market deals across the region.
of the five largest corporate bond primary activ-ity fee generators in emerging markets (collectively representing 75% of fee revenue between 2000 and 2014), China and Korea have awarded the bulk of debt capital market fees to local participants over the past decade (76% and 72%, respec-tively), while Brazil and Russia have steadily shifted payments domestically over the period, from around 20% in 2004 to around 45% in 2014. on aver-age, Indian local brokers have captured 41% of DCM fees over the past 14 years, but with some variation (ranging between 10% and 60% on a four-quarter rolling basis). In contrast, the trend wallet share for developed market brokers has declined since 2000.
once again (as with equities) the post- versus pre-global financial crisis debt capital market fee wallet share of local emerging market brokers is higher across most countries (14 out of 19) and with such variation (85% in Taiwan versus just 1% in Poland) that we have chosen to apportion our forecasts for 2014 – 30 fees between local and developed market financial intermediaries based on the more recent observed country level trend in distribution.
This results in a 58% (or USD 77 billion) versus 42% (or USD 55 billion) split of the USD 132 billion of cumulative emerging debt capital market under-writing fees, which we estimate out to 2030 in favor of local emerging market brokerage houses.
For developed markets, we make the assump-tion (consistent with that for ECMs) that DCM fees are rewarded in their totality (we estimate USD 238 billion up to 2030) to developed market financial intermediaries.
Figure 43
Emerging market annual DCm deal fees (four-quarter rolling, USD m)Source: Dealogic, Credit Suisse research
EMERGInG CAPITAL MARKETS_38
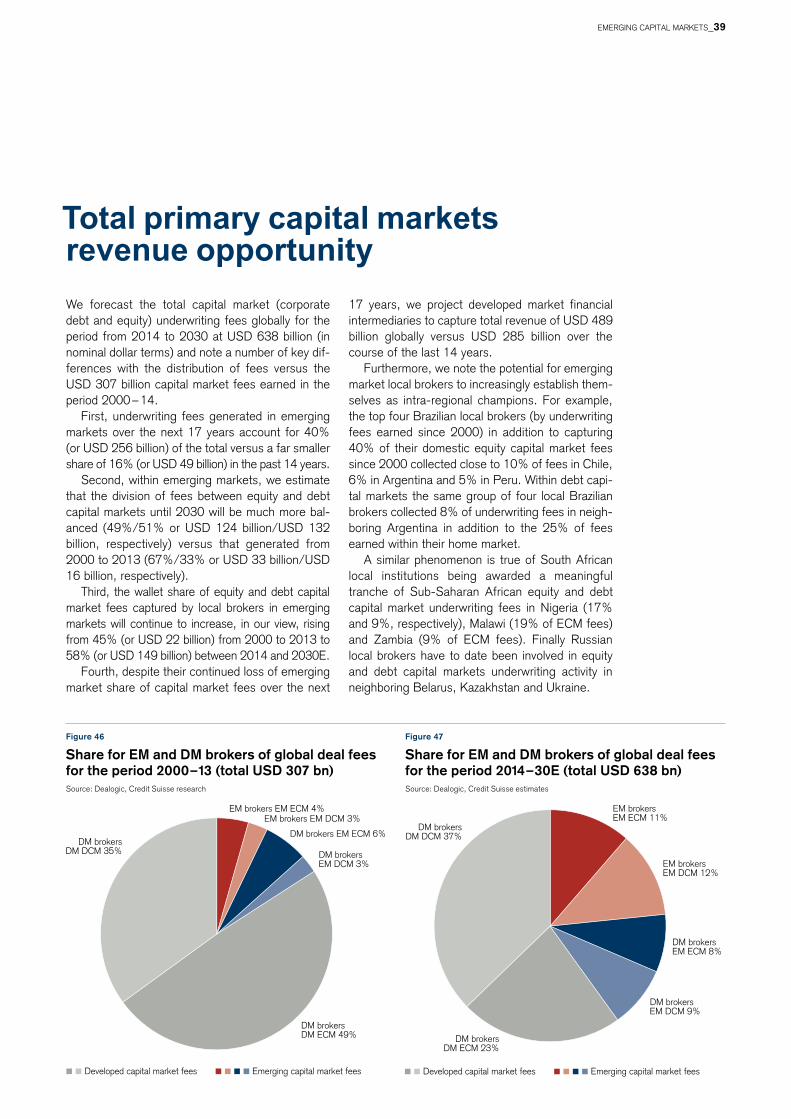
EM brokers EM ECM 4%EM brokers EM DCM 3%
DM brokers EM ECM 6%
DM brokers EM DCM 3%
DM brokers DM ECM 49%
DM brokers DM DCM 35%
Developed capital market fees Emerging capital market fees
EM brokers EM ECM 11%
EM brokers EM DCM 12%
DM brokers EM ECM 8%
DM brokers EM DCM 9%
DM brokersDM ECM 23%
DM brokersDM DCM 37%
Developed capital market fees Emerging capital market fees
Figure 46
Share for Em and Dm brokers of global deal fees for the period 2000–13 (total USD 307 bn)Source: Dealogic, Credit Suisse research
Figure 47
Share for Em and Dm brokers of global deal fees for the period 2014–30E (total USD 638 bn)Source: Dealogic, Credit Suisse estimates
We forecast the total capital market (corporate debt and equity) underwriting fees globally for the period from 2014 to 2030 at USD 638 billion (in nominal dollar terms) and note a number of key dif-ferences with the distribution of fees versus the USD 307 billion capital market fees earned in the period 2000 – 14.
First, underwriting fees generated in emerging markets over the next 17 years account for 40% (or USD 256 billion) of the total versus a far smaller share of 16% (or USD 49 billion) in the past 14 years.
Second, within emerging markets, we estimate that the division of fees between equity and debt capital markets until 2030 will be much more bal-anced (49%/51% or USD 124 billion/USD 132 billion, respectively) versus that generated from 2000 to 2013 (67%/33% or USD 33 billion/USD 16 billion, respectively).
Third, the wallet share of equity and debt capital market fees captured by local brokers in emerging markets will continue to increase, in our view, rising from 45% (or USD 22 billion) from 2000 to 2013 to 58% (or USD 149 billion) between 2014 and 2030E.
Fourth, despite their continued loss of emerging market share of capital market fees over the next
Total primary capital markets revenue opportunity
17 years, we project developed market financial intermediaries to capture total revenue of USD 489 billion globally versus USD 285 billion over the course of the last 14 years.
Furthermore, we note the potential for emerging market local brokers to increasingly establish them-selves as intra-regional champions. For example, the top four Brazilian local brokers (by underwriting fees earned since 2000) in addition to capturing 40% of their domestic equity capital market fees since 2000 collected close to 10% of fees in Chile, 6% in Argentina and 5% in Peru. Within debt capi-tal markets the same group of four local Brazilian brokers collected 8% of underwriting fees in neigh-boring Argentina in addition to the 25% of fees earned within their home market.
A similar phenomenon is true of South African local institutions being awarded a meaningful tranche of Sub-Saharan African equity and debt capital market underwriting fees in nigeria (17% and 9%, respectively), Malawi (19% of ECM fees) and zambia (9% of ECM fees). Finally Russian local brokers have to date been involved in equity and debt capital markets underwriting activity in neighboring Belarus, Kazakhstan and Ukraine.
EMERGInG CAPITAL MARKETS_39
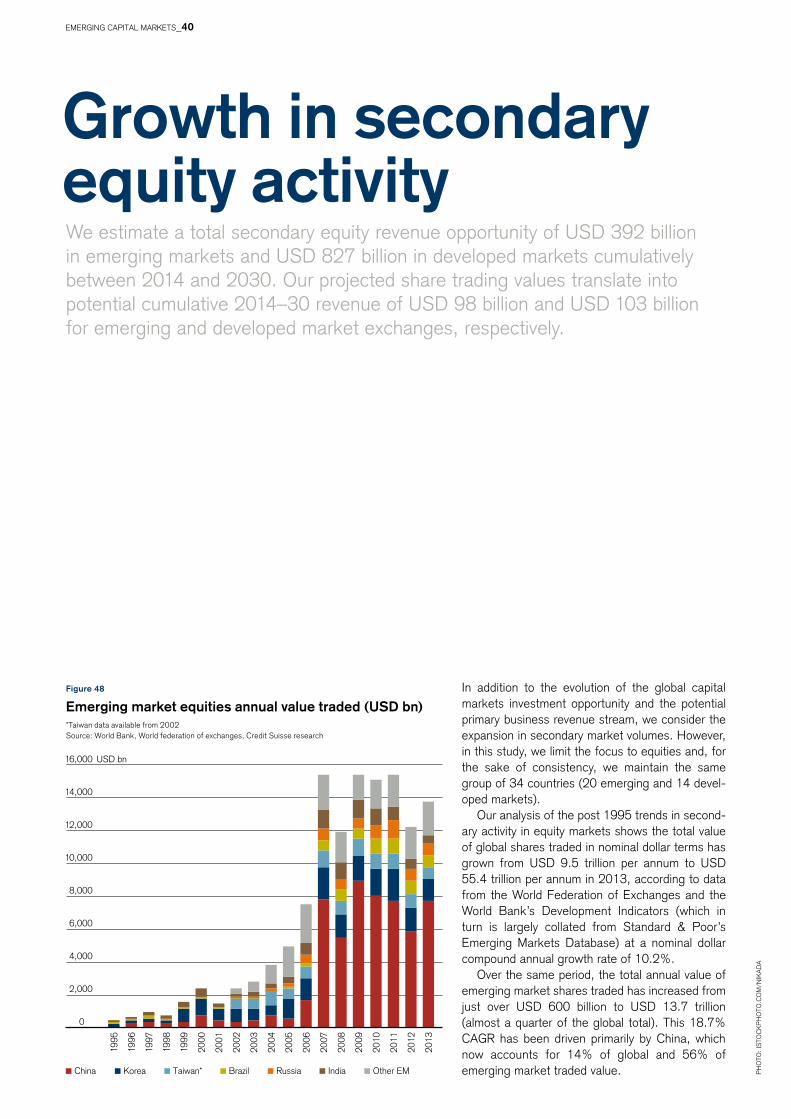
0
2,000
4,000
6,000
8,000
10,000
12,000
14,000
16,000 USD bn
1995
1996
1997
1998
1999
2000
2001
2002
2003
2004
2005
2006
2007
2008
2009
2010
2011
2012
2013
China Korea Taiwan* Brazil Russia India Other EM
Growth in secondary equity activity
Figure 48
Emerging market equities annual value traded (USD bn)*Taiwan data available from 2002 Source: World Bank, World federation of exchanges, Credit Suisse research
We estimate a total secondary equity revenue opportunity of USD 392 billion in emerging markets and USD 827 billion in developed markets cumulatively between 2014 and 2030. our projected share trading values translate into potential cumulative 2014–30 revenue of USD 98 billion and USD 103 billion for emerging and developed market exchanges, respectively.
Ph
oTo
: IS
ToC
KP
ho
To.C
oM
/nIK
AD
A
In addition to the evolution of the global capital markets investment opportunity and the potential primary business revenue stream, we consider the expansion in secondary market volumes. however, in this study, we limit the focus to equities and, for the sake of consistency, we maintain the same group of 34 countries (20 emerging and 14 devel-oped markets).
our analysis of the post 1995 trends in second-ary activity in equity markets shows the total value of global shares traded in nominal dollar terms has grown from USD 9.5 trillion per annum to USD 55.4 trillion per annum in 2013, according to data from the World Federation of Exchanges and the World Bank’s Development Indicators (which in turn is largely collated from Standard & Poor’s Emerging Markets Database) at a nominal dollar compound annual growth rate of 10.2%.
over the same period, the total annual value of emerging market shares traded has increased from just over USD 600 billion to USD 13.7 trillion (almost a quarter of the global total). This 18.7% CAGR has been driven primarily by China, which now accounts for 14% of global and 56% of emerging market traded value.
EMERGInG CAPITAL MARKETS_40

Ph
oTo
: IS
ToC
KP
ho
To.C
oM
/nIK
AD
A
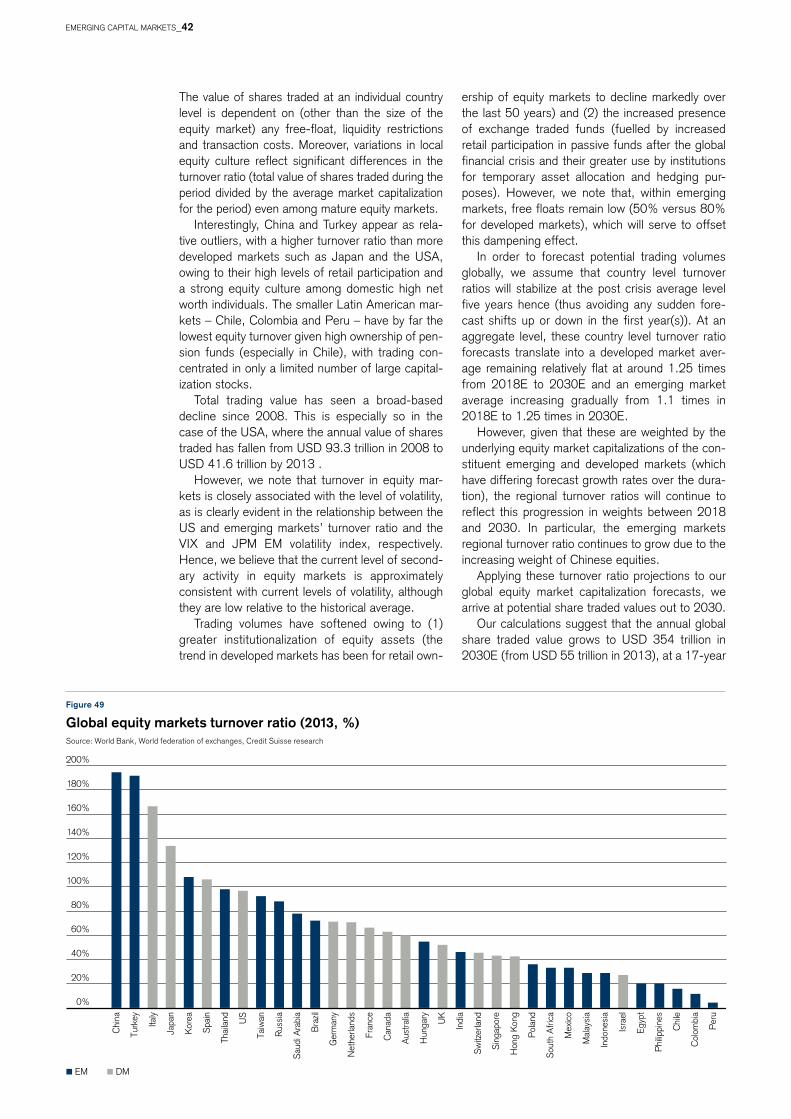
0%
20%
40%
60%
80%
100%
120%
140%
160%
180%
200%
Chi
na
Turk
ey
Italy
Japa
n
Kor
ea
Spa
in
Thai
land US
Taiw
an
Rus
sia
Sau
di A
rabi
a
Bra
zil
Ger
man
y
Net
herla
nds
Fran
ce
Can
ada
Aus
tralia
Hun
gary UK
Indi
a
Sw
itzer
land
Sin
gapo
re
Hon
g K
ong
Pol
and
Sou
th A
frica
Mex
ico
Mal
aysi
a
Indo
nesi
a
Isra
el
Egyp
t
Phi
lippi
nes
Chi
le
Col
ombi
a
Per
u
EM DM
The value of shares traded at an individual country level is dependent on (other than the size of the equity market) any free-float, liquidity restrictions and transaction costs. Moreover, variations in local equity culture reflect significant differences in the turnover ratio (total value of shares traded during the period divided by the average market capitalization for the period) even among mature equity markets.
Interestingly, China and Turkey appear as rela-tive outliers, with a higher turnover ratio than more developed markets such as Japan and the USA, owing to their high levels of retail participation and a strong equity culture among domestic high net worth individuals. The smaller Latin American mar-kets – Chile, Colombia and Peru – have by far the lowest equity turnover given high ownership of pen-sion funds (especially in Chile), with trading con-centrated in only a limited number of large capital-ization stocks.
Total trading value has seen a broad-based decline since 2008. This is especially so in the case of the USA, where the annual value of shares traded has fallen from USD 93.3 trillion in 2008 to USD 41.6 trillion by 2013 .
however, we note that turnover in equity mar-kets is closely associated with the level of volatility, as is clearly evident in the relationship between the US and emerging markets’ turnover ratio and the vIX and JPM EM volatility index, respectively. hence, we believe that the current level of second-ary activity in equity markets is approximately consistent with current levels of volatility, although they are low relative to the historical average.
Trading volumes have softened owing to (1) greater institutionalization of equity assets (the trend in developed markets has been for retail own-
Figure 49
Global equity markets turnover ratio (2013, %)Source: World Bank, World federation of exchanges, Credit Suisse research
ership of equity markets to decline markedly over the last 50 years) and (2) the increased presence of exchange traded funds (fuelled by increased retail participation in passive funds after the global financial crisis and their greater use by institutions for temporary asset allocation and hedging pur-poses). however, we note that, within emerging markets, free floats remain low (50% versus 80% for developed markets), which will serve to offset this dampening effect.
In order to forecast potential trading volumes globally, we assume that country level turnover ratios will stabilize at the post crisis average level five years hence (thus avoiding any sudden fore-cast shifts up or down in the first year(s)). At an aggregate level, these country level turnover ratio forecasts translate into a developed market aver-age remaining relatively flat at around 1.25 times from 2018E to 2030E and an emerging market average increasing gradually from 1.1 times in 2018E to 1.25 times in 2030E.
however, given that these are weighted by the underlying equity market capitalizations of the con-stituent emerging and developed markets (which have differing forecast growth rates over the dura-tion), the regional turnover ratios will continue to reflect this progression in weights between 2018 and 2030. In particular, the emerging markets regional turnover ratio continues to grow due to the increasing weight of Chinese equities.
Applying these turnover ratio projections to our global equity market capitalization forecasts, we arrive at potential share traded values out to 2030.
our calculations suggest that the annual global share traded value grows to USD 354 trillion in 2030E (from USD 55 trillion in 2013), at a 17-year
EMERGInG CAPITAL MARKETS_42
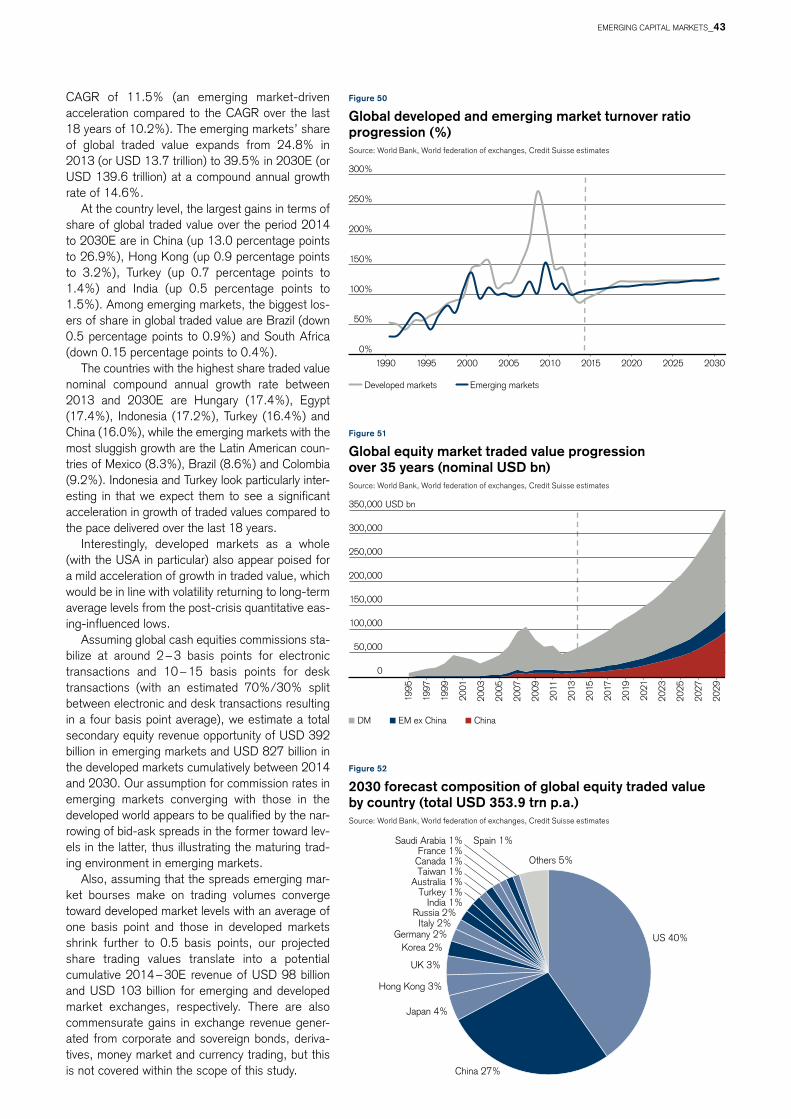
US 40%
China 27%
Japan 4%
Hong Kong 3%
UK 3%
Korea 2%Germany 2%
Italy 2%Russia 2%
India 1%Turkey 1%
Australia 1%Taiwan 1%Canada 1%France 1%
Saudi Arabia 1% Spain 1%
Others 5%
Developed markets Emerging markets
0%
50%
100%
150%
200%
250%
300%
1990 1995 2000 2005 2010 2015 2020 2025 2030
0
50,000
100,000
150,000
200,000
250,000
300,000
350,000 USD bn
1995
1997
1999
2001
2003
2005
2007
2009
2011
2013
2015
2017
2019
2021
2023
2025
2027
2029
DM EM ex China China
Figure 52
2030 forecast composition of global equity traded value by country (total USD 353.9 trn p.a.)Source: World Bank, World federation of exchanges, Credit Suisse estimates
CAGR of 11.5% (an emerging market-driven acceleration compared to the CAGR over the last 18 years of 10.2%). The emerging markets’ share of global traded value expands from 24.8% in 2013 (or USD 13.7 trillion) to 39.5% in 2030E (or USD 139.6 trillion) at a compound annual growth rate of 14.6%.
At the country level, the largest gains in terms of share of global traded value over the period 2014 to 2030E are in China (up 13.0 percentage points to 26.9%), hong Kong (up 0.9 percentage points to 3.2%), Turkey (up 0.7 percentage points to 1.4%) and India (up 0.5 percentage points to 1.5%). Among emerging markets, the biggest los-ers of share in global traded value are Brazil (down 0.5 percentage points to 0.9%) and South Africa (down 0.15 percentage points to 0.4%).
The countries with the highest share traded value nominal compound annual growth rate between 2013 and 2030E are hungary (17.4%), Egypt (17.4%), Indonesia (17.2%), Turkey (16.4%) and China (16.0%), while the emerging markets with the most sluggish growth are the Latin American coun-tries of Mexico (8.3%), Brazil (8.6%) and Colombia (9.2%). Indonesia and Turkey look particularly inter-esting in that we expect them to see a significant acceleration in growth of traded values compared to the pace delivered over the last 18 years.
Interestingly, developed markets as a whole (with the USA in particular) also appear poised for a mild acceleration of growth in traded value, which would be in line with volatility returning to long-term average levels from the post-crisis quantitative eas-ing-influenced lows.
Assuming global cash equities commissions sta-bilize at around 2 – 3 basis points for electronic transactions and 10 – 15 basis points for desk transactions (with an estimated 70%/30% split between electronic and desk transactions resulting in a four basis point average), we estimate a total secondary equity revenue opportunity of USD 392 billion in emerging markets and USD 827 billion in the developed markets cumulatively between 2014 and 2030. our assumption for commission rates in emerging markets converging with those in the developed world appears to be qualified by the nar-rowing of bid-ask spreads in the former toward lev-els in the latter, thus illustrating the maturing trad-ing environment in emerging markets.
Also, assuming that the spreads emerging mar-ket bourses make on trading volumes converge toward developed market levels with an average of one basis point and those in developed markets shrink further to 0.5 basis points, our projected share trading values translate into a potential cumulative 2014 – 30E revenue of USD 98 billion and USD 103 billion for emerging and developed market exchanges, respectively. There are also commensurate gains in exchange revenue gener-ated from corporate and sovereign bonds, deriva-tives, money market and currency trading, but this is not covered within the scope of this study.
Figure 50
Global developed and emerging market turnover ratio progression (%)Source: World Bank, World federation of exchanges, Credit Suisse estimates
Figure 51
Global equity market traded value progression over 35 years (nominal USD bn) Source: World Bank, World federation of exchanges, Credit Suisse estimates
EMERGInG CAPITAL MARKETS_43
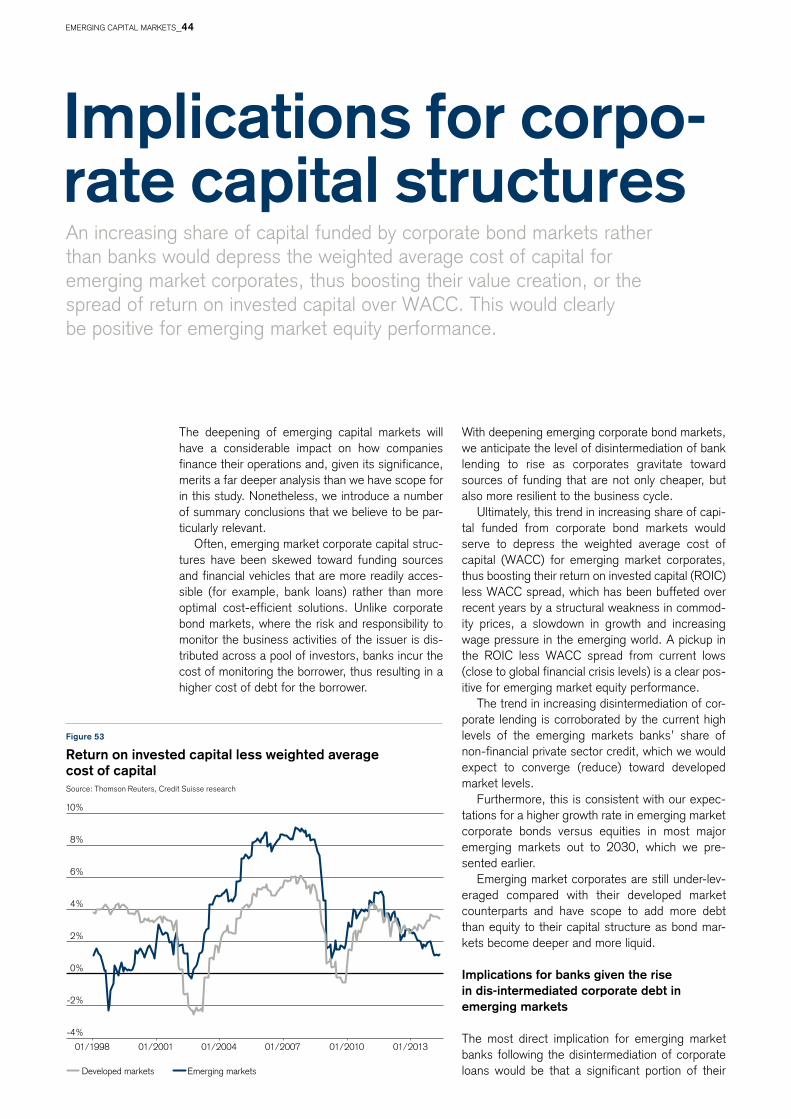
-4%
-2%
0%
2%
4%
6%
8%
10%
01/1998 01/2001 01/2004 01/2007 01/2010 01/2013
Developed markets Emerging markets
An increasing share of capital funded by corporate bond markets rather than banks would depress the weighted average cost of capital for emerging market corporates, thus boosting their value creation, or the spread of return on invested capital over WACC. This would clearly be positive for emerging market equity performance.
Implications for corpo-rate capital structures
With deepening emerging corporate bond markets, we anticipate the level of disintermediation of bank lending to rise as corporates gravitate toward sources of funding that are not only cheaper, but also more resilient to the business cycle.
Ultimately, this trend in increasing share of capi-tal funded from corporate bond markets would serve to depress the weighted average cost of capital (WACC) for emerging market corporates, thus boosting their return on invested capital (RoIC) less WACC spread, which has been buffeted over recent years by a structural weakness in commod-ity prices, a slowdown in growth and increasing wage pressure in the emerging world. A pickup in the RoIC less WACC spread from current lows (close to global financial crisis levels) is a clear pos-itive for emerging market equity performance.
The trend in increasing disintermediation of cor-porate lending is corroborated by the current high levels of the emerging markets banks’ share of non-financial private sector credit, which we would expect to converge (reduce) toward developed market levels.
Furthermore, this is consistent with our expec-tations for a higher growth rate in emerging market corporate bonds versus equities in most major emerging markets out to 2030, which we pre-sented earlier.
Emerging market corporates are still under-lev-eraged compared with their developed market counterparts and have scope to add more debt than equity to their capital structure as bond mar-kets become deeper and more liquid.
Implications for banks given the rise in dis-intermediated corporate debt in emerging markets
The most direct implication for emerging market banks following the disintermediation of corporate loans would be that a significant portion of their
The deepening of emerging capital markets will have a considerable impact on how companies finance their operations and, given its significance, merits a far deeper analysis than we have scope for in this study. nonetheless, we introduce a number of summary conclusions that we believe to be par-ticularly relevant.
often, emerging market corporate capital struc-tures have been skewed toward funding sources and financial vehicles that are more readily acces-sible (for example, bank loans) rather than more optimal cost-efficient solutions. Unlike corporate bond markets, where the risk and responsibility to monitor the business activities of the issuer is dis-tributed across a pool of investors, banks incur the cost of monitoring the borrower, thus resulting in a higher cost of debt for the borrower.
Ph
oTo
: IS
ToC
KP
ho
To.C
oM
/RAW
PIX
EL
Figure 53
Return on invested capital less weighted average cost of capitalSource: Thomson Reuters, Credit Suisse research
EMERGInG CAPITAL MARKETS_44
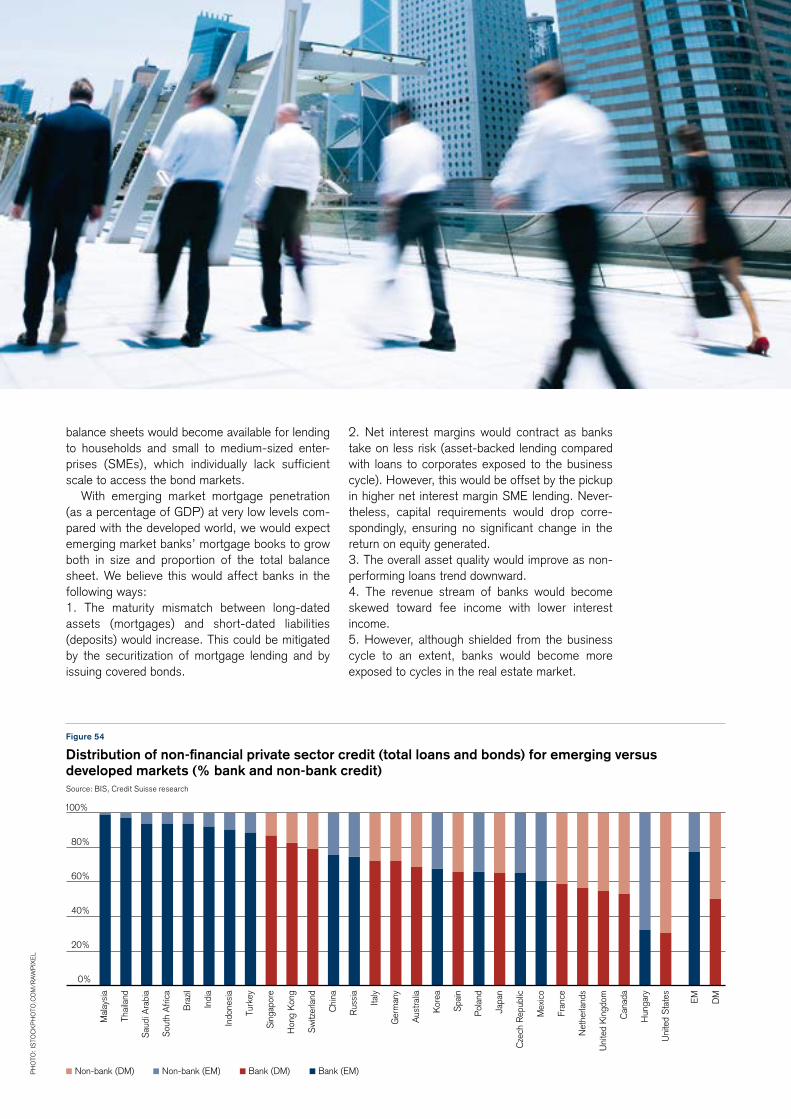
Non-bank (DM) Non-bank (EM) Bank (DM) Bank (EM)
0%
20%
40%
60%
80%
100%
Mal
aysi
a
Thai
land
Sau
di A
rabi
a
Sou
th A
frica
Bra
zil
Indi
a
Indo
nesi
a
Turk
ey
Sin
gapo
re
Hon
g K
ong
Sw
itzer
land
Chi
na
Rus
sia
Italy
Ger
man
y
Aus
tralia
Kor
ea
Spa
in
Pol
and
Japa
n
Cze
ch R
epub
lic
Mex
ico
Fran
ce
Net
herla
nds
Uni
ted
Kin
gdom
Can
ada
Hun
gary
Uni
ted
Sta
tes
EM DM
balance sheets would become available for lending to households and small to medium-sized enter-prises (SMEs), which individually lack sufficient scale to access the bond markets.
With emerging market mortgage penetration (as a percentage of GDP) at very low levels com-pared with the developed world, we would expect emerging market banks’ mortgage books to grow both in size and proportion of the total balance sheet. We believe this would affect banks in the following ways:1. The maturity mismatch between long-dated assets (mortgages) and short-dated liabilities (deposits) would increase. This could be mitigated by the securitization of mortgage lending and by issuing covered bonds.
2. net interest margins would contract as banks take on less risk (asset-backed lending compared with loans to corporates exposed to the business cycle). however, this would be offset by the pickup in higher net interest margin SME lending. never-theless, capital requirements would drop corre-spondingly, ensuring no significant change in the return on equity generated.3. The overall asset quality would improve as non-performing loans trend downward.4. The revenue stream of banks would become skewed toward fee income with lower interest income.5. however, although shielded from the business cycle to an extent, banks would become more exposed to cycles in the real estate market.
Ph
oTo
: IS
ToC
KP
ho
To.C
oM
/RAW
PIX
EL
Figure 54
Distribution of non-financial private sector credit (total loans and bonds) for emerging versus developed markets (% bank and non-bank credit)Source: BIS, Credit Suisse research
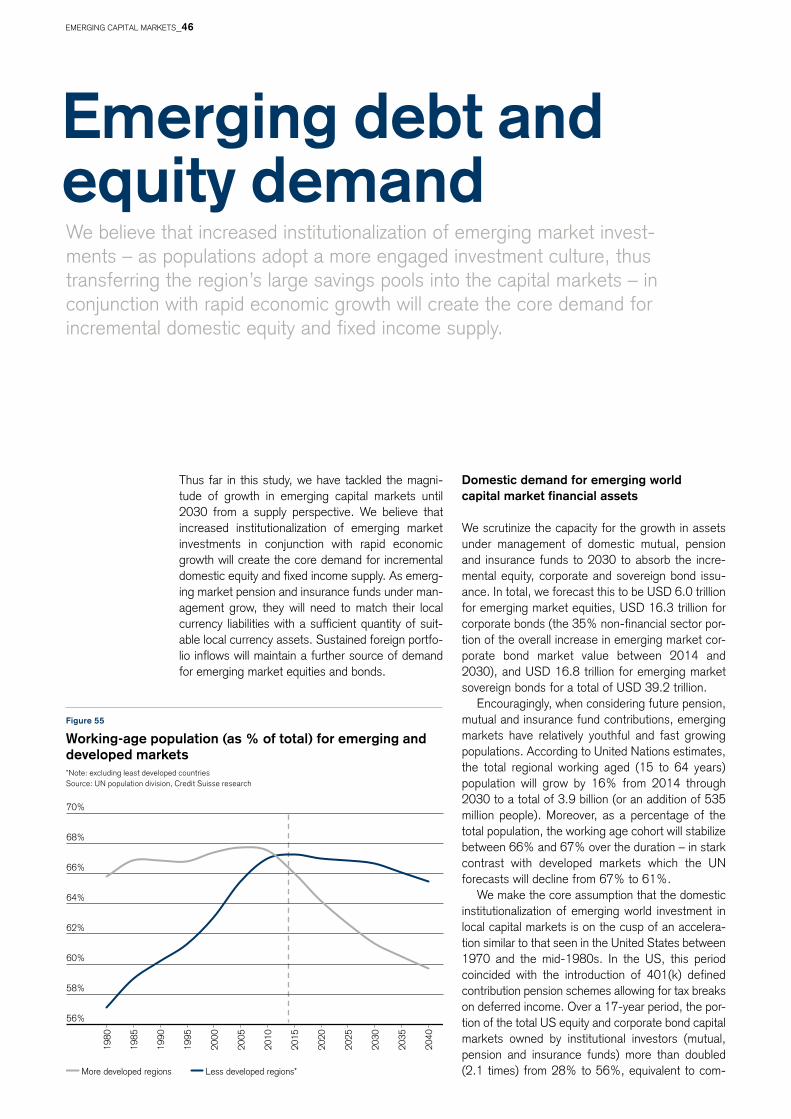
56%
58%
60%
62%
64%
66%
68%
70%
1980
1985
1990
1995
2000
2005
2010
2015
2020
2025
2030
2035
2040
More developed regions Less developed regions*
We believe that increased institutionalization of emerging market invest-ments – as populations adopt a more engaged investment culture, thus transferring the region’s large savings pools into the capital markets – in conjunction with rapid economic growth will create the core demand for incremental domestic equity and fixed income supply.
Emerging debt and equity demand
Figure 55
Working-age population (as % of total) for emerging and developed markets*note: excluding least developed countries Source: Un population division, Credit Suisse research
Thus far in this study, we have tackled the magni-tude of growth in emerging capital markets until 2030 from a supply perspective. We believe that increased institutionalization of emerging market investments in conjunction with rapid economic growth will create the core demand for incremental domestic equity and fixed income supply. As emerg-ing market pension and insurance funds under man-agement grow, they will need to match their local currency liabilities with a sufficient quantity of suit-able local currency assets. Sustained foreign portfo-lio inflows will maintain a further source of demand for emerging market equities and bonds.
Domestic demand for emerging world capital market financial assets
We scrutinize the capacity for the growth in assets under management of domestic mutual, pension and insurance funds to 2030 to absorb the incre-mental equity, corporate and sovereign bond issu-ance. In total, we forecast this to be USD 6.0 trillion for emerging market equities, USD 16.3 trillion for corporate bonds (the 35% non-financial sector por-tion of the overall increase in emerging market cor-porate bond market value between 2014 and 2030), and USD 16.8 trillion for emerging market sovereign bonds for a total of USD 39.2 trillion.
Encouragingly, when considering future pension, mutual and insurance fund contributions, emerging markets have relatively youthful and fast growing populations. According to United nations estimates, the total regional working aged (15 to 64 years) population will grow by 16% from 2014 through 2030 to a total of 3.9 billion (or an addition of 535 million people). Moreover, as a percentage of the total population, the working age cohort will stabilize between 66% and 67% over the duration – in stark contrast with developed markets which the Un forecasts will decline from 67% to 61%.
We make the core assumption that the domestic institutionalization of emerging world investment in local capital markets is on the cusp of an accelera-tion similar to that seen in the United States between 1970 and the mid-1980s. In the US, this period coincided with the introduction of 401(k) defined contribution pension schemes allowing for tax breaks on deferred income. over a 17-year period, the por-tion of the total US equity and corporate bond capital markets owned by institutional investors (mutual, pension and insurance funds) more than doubled (2.1 times) from 28% to 56%, equivalent to com- P
ho
To:
ISTo
CK
Ph
oTo
.Co
M/h
IDE
Sy
EMERGInG CAPITAL MARKETS_46
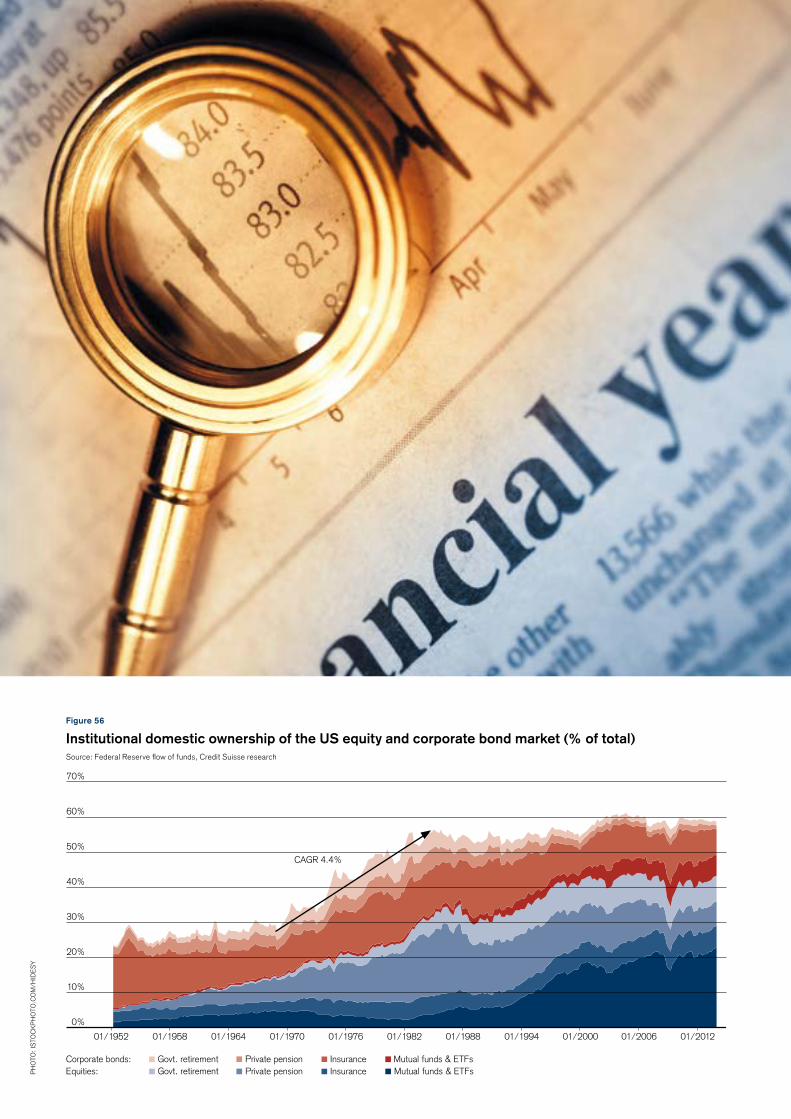
Private pension Mutual funds & ETFsPrivate pension
Govt. retirement InsuranceGovt. retirement Mutual funds & ETFsInsurance
0%
10%
20%
30%
40%
50%
60%
70%
01/1952 01/1958 01/1964 01/1970 01/1976 01/1982 01/1988 01/1994 01/2000 01/2006 01/2012
CAGR 4.4%
Corporate bonds:Equities:
Figure 56
Institutional domestic ownership of the US equity and corporate bond market (% of total)Source: Federal Reserve flow of funds, Credit Suisse research
Ph
oTo
: IS
ToC
KP
ho
To.C
oM
/hID
ES
y
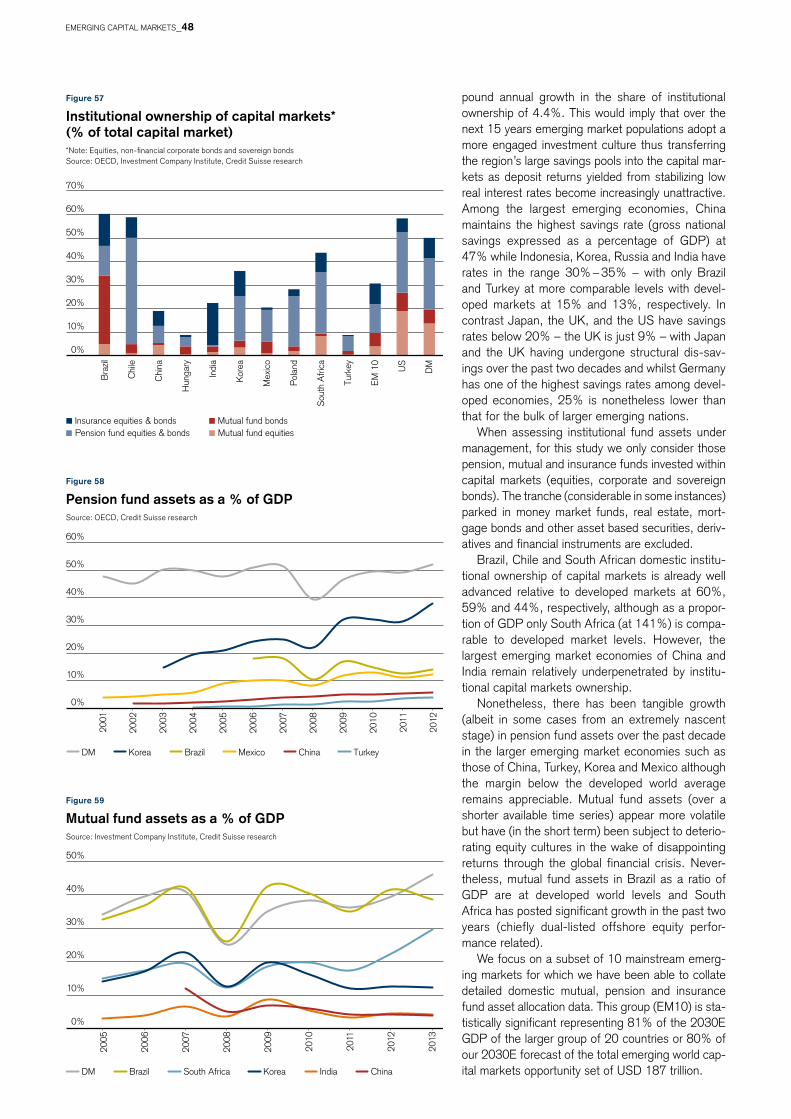
0%
10%
20%
30%
40%
50%
60%
2001
2002
2003
2004
2005
2006
2007
2008
2009
2010
2011
2012
DM Brazil TurkeyKorea Mexico China
0%
10%
20%
30%
40%
50%
2005
2006
2007
2008
2009
2010
2011
2012
2013
DM Brazil South Africa Korea India China
0%
10%
20%
30%
40%
50%
60%
70%
Bra
zil
Chi
le
Chi
na
Hun
gary
Indi
a
Kor
ea
Mex
ico
Pol
and
Sou
th A
frica
Turk
ey
EM 1
0
US
DM
Pension fund equities & bonds Mutual fund equitiesInsurance equities & bonds Mutual fund bonds
Figure 58
Pension fund assets as a % of GDPSource: oECD, Credit Suisse research
Figure 59
mutual fund assets as a % of GDPSource: Investment Company Institute, Credit Suisse research
pound annual growth in the share of institutional ownership of 4.4%. This would imply that over the next 15 years emerging market populations adopt a more engaged investment culture thus transferring the region’s large savings pools into the capital mar-kets as deposit returns yielded from stabilizing low real interest rates become increasingly unattractive. Among the largest emerging economies, China maintains the highest savings rate (gross national savings expressed as a percentage of GDP) at 47% while Indonesia, Korea, Russia and India have rates in the range 30% – 35% – with only Brazil and Turkey at more comparable levels with devel-oped markets at 15% and 13%, respectively. In contrast Japan, the UK, and the US have savings rates below 20% – the UK is just 9% – with Japan and the UK having undergone structural dis-sav-ings over the past two decades and whilst Germany has one of the highest savings rates among devel-oped economies, 25% is nonetheless lower than that for the bulk of larger emerging nations.
When assessing institutional fund assets under management, for this study we only consider those pension, mutual and insurance funds invested within capital markets (equities, corporate and sovereign bonds). The tranche (considerable in some instances) parked in money market funds, real estate, mort-gage bonds and other asset based securities, deriv-atives and financial instruments are excluded.
Brazil, Chile and South African domestic institu-tional ownership of capital markets is already well advanced relative to developed markets at 60%, 59% and 44%, respectively, although as a propor-tion of GDP only South Africa (at 141%) is compa-rable to developed market levels. however, the largest emerging market economies of China and India remain relatively underpenetrated by institu-tional capital markets ownership.
nonetheless, there has been tangible growth (albeit in some cases from an extremely nascent stage) in pension fund assets over the past decade in the larger emerging market economies such as those of China, Turkey, Korea and Mexico although the margin below the developed world average remains appreciable. Mutual fund assets (over a shorter available time series) appear more volatile but have (in the short term) been subject to deterio-rating equity cultures in the wake of disappointing returns through the global financial crisis. never-theless, mutual fund assets in Brazil as a ratio of GDP are at developed world levels and South Africa has posted significant growth in the past two years (chiefly dual-listed offshore equity perfor-mance related).
We focus on a subset of 10 mainstream emerg-ing markets for which we have been able to collate detailed domestic mutual, pension and insurance fund asset allocation data. This group (EM10) is sta-tistically significant representing 81% of the 2030E GDP of the larger group of 20 countries or 80% of our 2030E forecast of the total emerging world cap-ital markets opportunity set of USD 187 trillion.
Figure 57
Institutional ownership of capital markets* (% of total capital market)*Note: Equities, non-financial corporate bonds and sovereign bonds Source: oECD, Investment Company Institute, Credit Suisse research
EMERGInG CAPITAL MARKETS_48
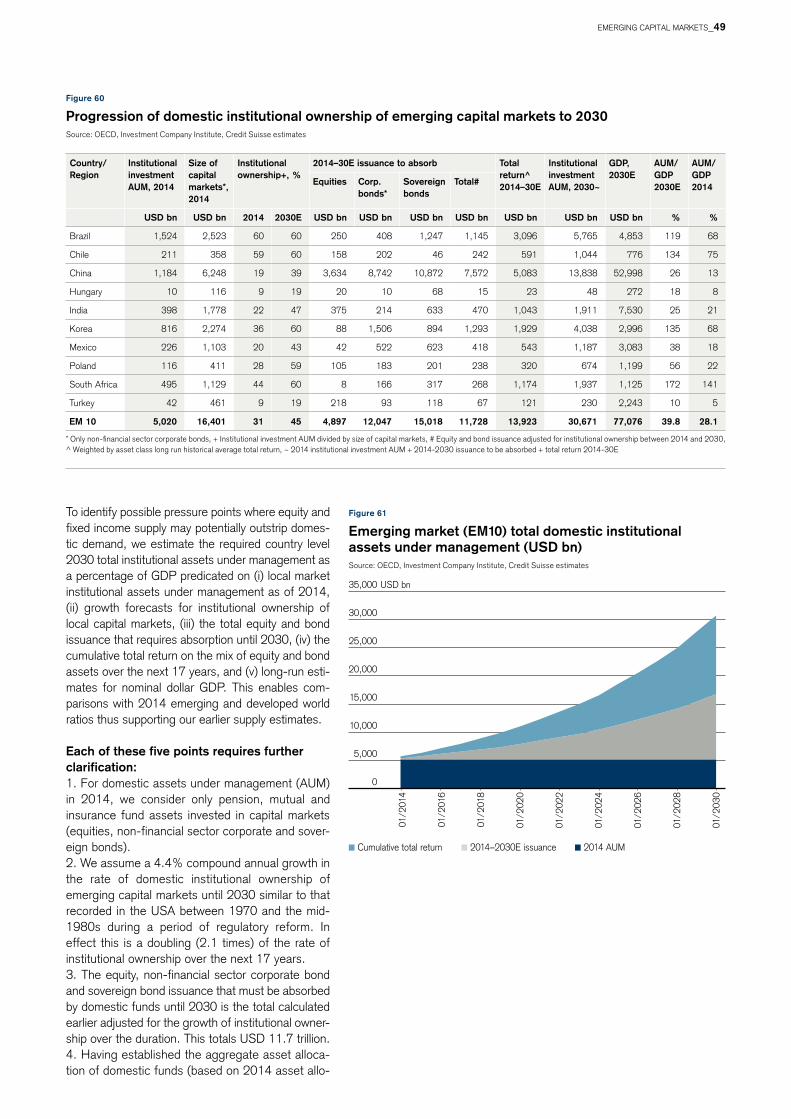
0
5,000
10,000
15,000
20,000
25,000
30,000
35,000 USD bn
01/2
014
01/2
016
01/2
018
01/2
020
01/2
022
01/2
024
01/2
026
01/2
028
01/2
030
Cumulative total return 2014–2030E issuance 2014 AUM
Figure 60
Progression of domestic institutional ownership of emerging capital markets to 2030Source: oECD, Investment Company Institute, Credit Suisse estimates
Country/ Region
Institutional investment AUm, 2014
Size of capital markets*, 2014
Institutional ownership+, %
2014–30E issuance to absorb Total return^ 2014–30E
Institutional investment AUm, 2030~
GDP, 2030E
AUm/GDP 2030E
AUm/GDP 2014Equities Corp.
bonds*Sovereign bonds
Total#
USD bn USD bn 2014 2030E USD bn USD bn USD bn USD bn USD bn USD bn USD bn % %
Brazil 1,524 2,523 60 60 250 408 1,247 1,145 3,096 5,765 4,853 119 68
Chile 211 358 59 60 158 202 46 242 591 1,044 776 134 75
China 1,184 6,248 19 39 3,634 8,742 10,872 7,572 5,083 13,838 52,998 26 13
hungary 10 116 9 19 20 10 68 15 23 48 272 18 8
India 398 1,778 22 47 375 214 633 470 1,043 1,911 7,530 25 21
Korea 816 2,274 36 60 88 1,506 894 1,293 1,929 4,038 2,996 135 68
Mexico 226 1,103 20 43 42 522 623 418 543 1,187 3,083 38 18
Poland 116 411 28 59 105 183 201 238 320 674 1,199 56 22
South Africa 495 1,129 44 60 8 166 317 268 1,174 1,937 1,125 172 141
Turkey 42 461 9 19 218 93 118 67 121 230 2,243 10 5
Em 10 5,020 16,401 31 45 4,897 12,047 15,018 11,728 13,923 30,671 77,076 39.8 28.1
Figure 61
Emerging market (Em10) total domestic institutional assets under management (USD bn)Source: oECD, Investment Company Institute, Credit Suisse estimates
To identify possible pressure points where equity and fixed income supply may potentially outstrip domes-tic demand, we estimate the required country level 2030 total institutional assets under management as a percentage of GDP predicated on (i) local market institutional assets under management as of 2014, (ii) growth forecasts for institutional ownership of local capital markets, (iii) the total equity and bond issuance that requires absorption until 2030, (iv) the cumulative total return on the mix of equity and bond assets over the next 17 years, and (v) long-run esti-mates for nominal dollar GDP. This enables com-parisons with 2014 emerging and developed world ratios thus supporting our earlier supply estimates.
Each of these five points requires further clarification:1. For domestic assets under management (AUM) in 2014, we consider only pension, mutual and insurance fund assets invested in capital markets (equities, non-financial sector corporate and sover-eign bonds).2. We assume a 4.4% compound annual growth in the rate of domestic institutional ownership of emerging capital markets until 2030 similar to that recorded in the USA between 1970 and the mid-1980s during a period of regulatory reform. In effect this is a doubling (2.1 times) of the rate of institutional ownership over the next 17 years.3. The equity, non-financial sector corporate bond and sovereign bond issuance that must be absorbed by domestic funds until 2030 is the total calculated earlier adjusted for the growth of institutional owner-ship over the duration. This totals USD 11.7 trillion.4. having established the aggregate asset alloca-tion of domestic funds (based on 2014 asset allo-
* Only non-financial sector corporate bonds, + Institutional investment AUM divided by size of capital markets, # Equity and bond issuance adjusted for institutional ownership between 2014 and 2030, ^ Weighted by asset class long run historical average total return, ~ 2014 institutional investment AUM + 2014-2030 issuance to be absorbed + total return 2014-30E
EMERGInG CAPITAL MARKETS_49
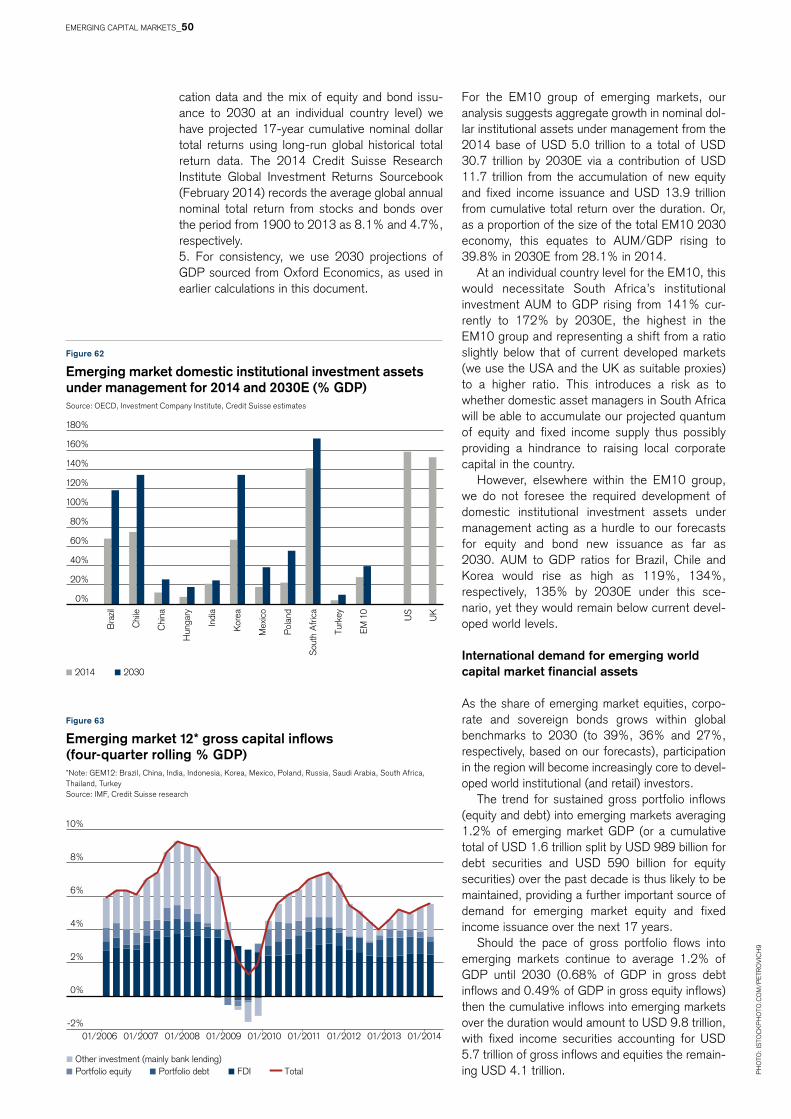
2014 2030
0%
20%
40%
60%
80%
100%
120%
140%
160%
180%
Bra
zil
Chi
le
Chi
na
Hun
gary
Indi
a
Kor
ea
Mex
ico
Pol
and
Sou
th A
frica
Turk
ey
EM 1
0
US
UK
-2%
0%
2%
4%
6%
8%
10%
01/2006 01/2007 01/2008 01/2009 01/2010 01/2011 01/2012 01/2013 01/2014
Portfolio equity FDIPortfolio debtOther investment (mainly bank lending)
Total
Figure 62
Emerging market domestic institutional investment assets under management for 2014 and 2030E (% GDP)Source: oECD, Investment Company Institute, Credit Suisse estimates
Figure 63
Emerging market 12* gross capital inflows (four-quarter rolling % GDP)*note: GEM12: Brazil, China, India, Indonesia, Korea, Mexico, Poland, Russia, Saudi Arabia, South Africa, Thailand, Turkey Source: IMF, Credit Suisse research
For the EM10 group of emerging markets, our analysis suggests aggregate growth in nominal dol-lar institutional assets under management from the 2014 base of USD 5.0 trillion to a total of USD 30.7 trillion by 2030E via a contribution of USD 11.7 trillion from the accumulation of new equity and fixed income issuance and USD 13.9 trillion from cumulative total return over the duration. or, as a proportion of the size of the total EM10 2030 economy, this equates to AUM/GDP rising to 39.8% in 2030E from 28.1% in 2014.
At an individual country level for the EM10, this would necessitate South Africa’s institutional investment AUM to GDP rising from 141% cur-rently to 172% by 2030E, the highest in the EM10 group and representing a shift from a ratio slightly below that of current developed markets (we use the USA and the UK as suitable proxies) to a higher ratio. This introduces a risk as to whether domestic asset managers in South Africa will be able to accumulate our projected quantum of equity and fixed income supply thus possibly providing a hindrance to raising local corporate capital in the country.
however, elsewhere within the EM10 group, we do not foresee the required development of domestic institutional investment assets under management acting as a hurdle to our forecasts for equity and bond new issuance as far as 2030. AUM to GDP ratios for Brazil, Chile and Korea would rise as high as 119%, 134%, respectively, 135% by 2030E under this sce-nario, yet they would remain below current devel-oped world levels.
International demand for emerging world capital market financial assets
As the share of emerging market equities, corpo-rate and sovereign bonds grows within global benchmarks to 2030 (to 39%, 36% and 27%, respectively, based on our forecasts), participation in the region will become increasingly core to devel-oped world institutional (and retail) investors.
The trend for sustained gross portfolio inflows (equity and debt) into emerging markets averaging 1.2% of emerging market GDP (or a cumulative total of USD 1.6 trillion split by USD 989 billion for debt securities and USD 590 billion for equity securities) over the past decade is thus likely to be maintained, providing a further important source of demand for emerging market equity and fixed income issuance over the next 17 years.
Should the pace of gross portfolio flows into emerging markets continue to average 1.2% of GDP until 2030 (0.68% of GDP in gross debt inflows and 0.49% of GDP in gross equity inflows) then the cumulative inflows into emerging markets over the duration would amount to USD 9.8 trillion, with fixed income securities accounting for USD 5.7 trillion of gross inflows and equities the remain-ing USD 4.1 trillion. P
ho
To:
ISTo
CK
Ph
oTo
.Co
M/P
ETR
ov
ICh
9
cation data and the mix of equity and bond issu-ance to 2030 at an individual country level) we have projected 17-year cumulative nominal dollar total returns using long-run global historical total return data. The 2014 Credit Suisse Research Institute Global Investment Returns Sourcebook (February 2014) records the average global annual nominal total return from stocks and bonds over the period from 1900 to 2013 as 8.1% and 4.7%, respectively.5. For consistency, we use 2030 projections of GDP sourced from oxford Economics, as used in earlier calculations in this document.
EMERGInG CAPITAL MARKETS_50

Ph
oTo
: IS
ToC
KP
ho
To.C
oM
/PE
TRo
vIC
h9
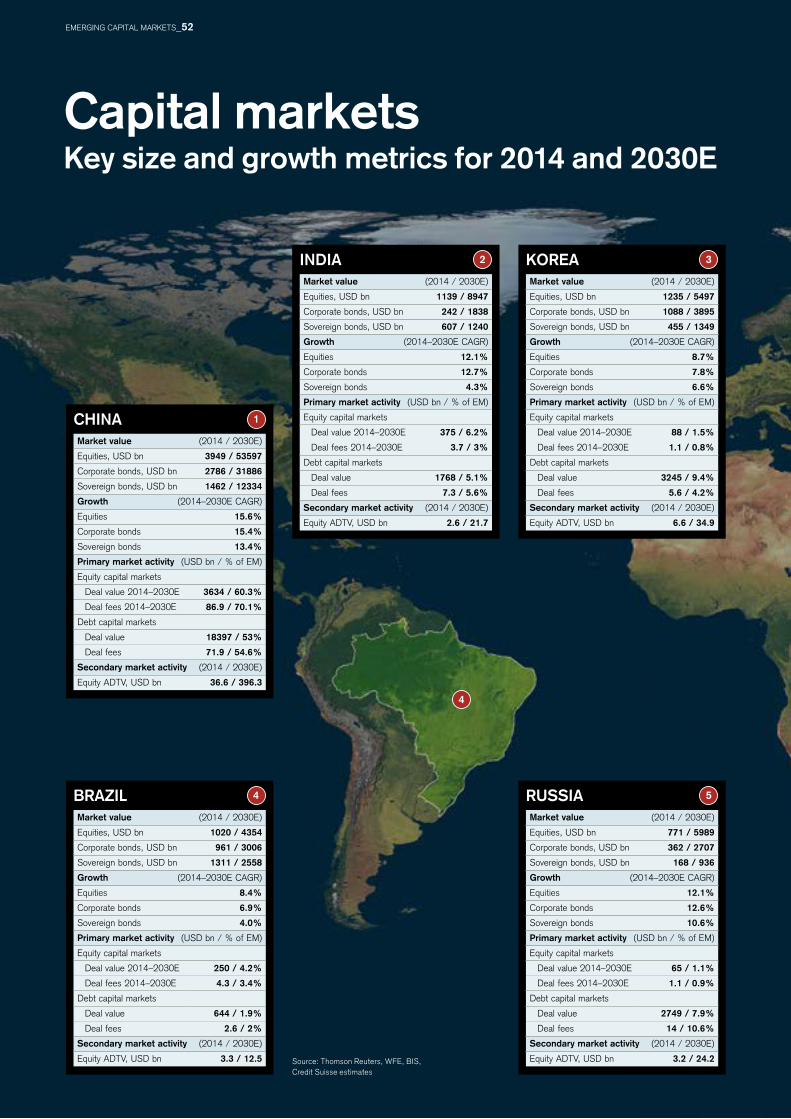
Capital marketsKey size and growth metrics for 2014 and 2030E
Source: Thomson Reuters, WFE, BIS, Credit Suisse estimates
ChINAmarket value (2014 / 2030E)
Equities, USD bn 3949 / 53597
Corporate bonds, USD bn 2786 / 31886
Sovereign bonds, USD bn 1462 / 12334
Growth (2014–2030E CAGR)
Equities 15.6%
Corporate bonds 15.4%
Sovereign bonds 13.4%
Primary market activity (USD bn / % of EM)
Equity capital markets
Deal value 2014–2030E 3634 / 60.3%
Deal fees 2014–2030E 86.9 / 70.1%
Debt capital markets
Deal value 18397 / 53%
Deal fees 71.9 / 54.6%
Secondary market activity (2014 / 2030E)
Equity ADTv, USD bn 36.6 / 396.3
1
KoREAmarket value (2014 / 2030E)
Equities, USD bn 1235 / 5497
Corporate bonds, USD bn 1088 / 3895
Sovereign bonds, USD bn 455 / 1349
Growth (2014–2030E CAGR)
Equities 8.7%
Corporate bonds 7.8%
Sovereign bonds 6.6%
Primary market activity (USD bn / % of EM)
Equity capital markets
Deal value 2014–2030E 88 / 1.5%
Deal fees 2014–2030E 1.1 / 0.8%
Debt capital markets
Deal value 3245 / 9.4%
Deal fees 5.6 / 4.2%
Secondary market activity (2014 / 2030E)
Equity ADTv, USD bn 6.6 / 34.9
3
RUSSIAmarket value (2014 / 2030E)
Equities, USD bn 771 / 5989
Corporate bonds, USD bn 362 / 2707
Sovereign bonds, USD bn 168 / 936
Growth (2014–2030E CAGR)
Equities 12.1%
Corporate bonds 12.6%
Sovereign bonds 10.6%
Primary market activity (USD bn / % of EM)
Equity capital markets
Deal value 2014–2030E 65 / 1.1%
Deal fees 2014–2030E 1.1 / 0.9%
Debt capital markets
Deal value 2749 / 7.9%
Deal fees 14 / 10.6%
Secondary market activity (2014 / 2030E)
Equity ADTv, USD bn 3.2 / 24.2
5
INDIAmarket value (2014 / 2030E)
Equities, USD bn 1139 / 8947
Corporate bonds, USD bn 242 / 1838
Sovereign bonds, USD bn 607 / 1240
Growth (2014–2030E CAGR)
Equities 12.1%
Corporate bonds 12.7%
Sovereign bonds 4.3%
Primary market activity (USD bn / % of EM)
Equity capital markets
Deal value 2014–2030E 375 / 6.2%
Deal fees 2014–2030E 3.7 / 3%
Debt capital markets
Deal value 1768 / 5.1%
Deal fees 7.3 / 5.6%
Secondary market activity (2014 / 2030E)
Equity ADTv, USD bn 2.6 / 21.7
2
BRAzIlmarket value (2014 / 2030E)
Equities, USD bn 1020 / 4354
Corporate bonds, USD bn 961 / 3006
Sovereign bonds, USD bn 1311 / 2558
Growth (2014–2030E CAGR)
Equities 8.4%
Corporate bonds 6.9%
Sovereign bonds 4.0%
Primary market activity (USD bn / % of EM)
Equity capital markets
Deal value 2014–2030E 250 / 4.2%
Deal fees 2014–2030E 4.3 / 3.4%
Debt capital markets
Deal value 644 / 1.9%
Deal fees 2.6 / 2%
Secondary market activity (2014 / 2030E)
Equity ADTv, USD bn 3.3 / 12.5
4
4
EMERGInG CAPITAL MARKETS_52
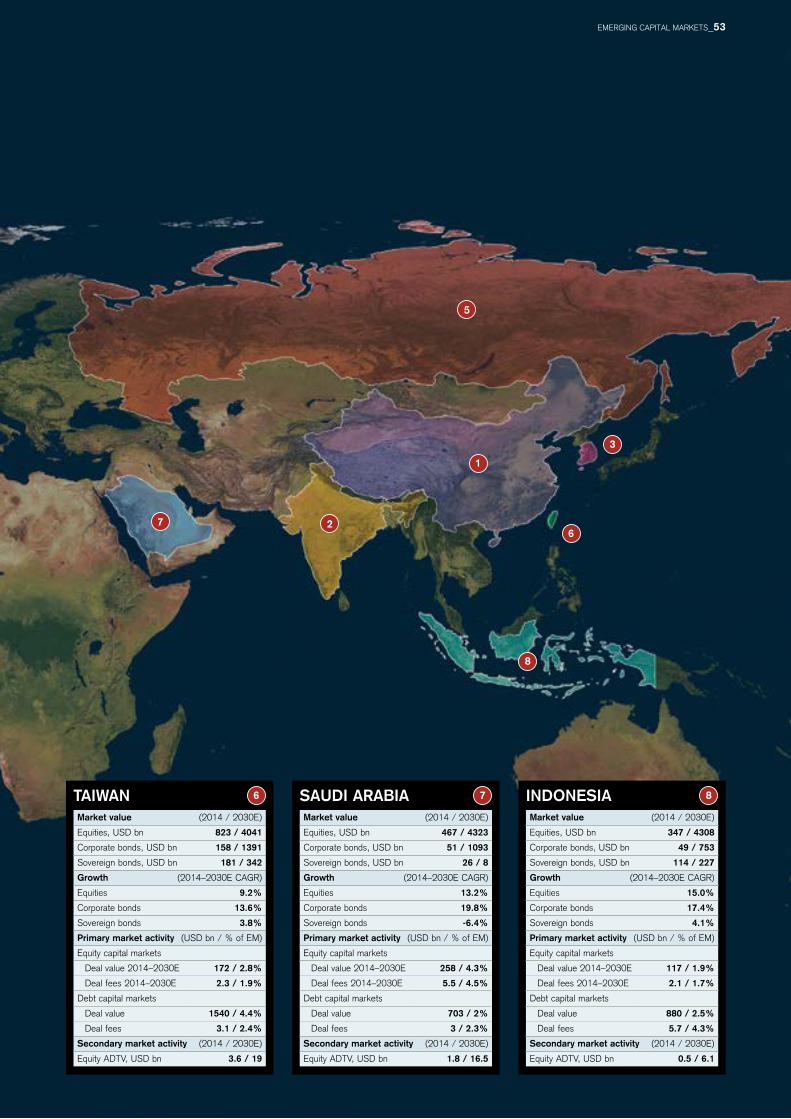
1
2
SAUDI ARABIAmarket value (2014 / 2030E)
Equities, USD bn 467 / 4323
Corporate bonds, USD bn 51 / 1093
Sovereign bonds, USD bn 26 / 8
Growth (2014–2030E CAGR)
Equities 13.2%
Corporate bonds 19.8%
Sovereign bonds -6.4%
Primary market activity (USD bn / % of EM)
Equity capital markets
Deal value 2014–2030E 258 / 4.3%
Deal fees 2014–2030E 5.5 / 4.5%
Debt capital markets
Deal value 703 / 2%
Deal fees 3 / 2.3%
Secondary market activity (2014 / 2030E)
Equity ADTv, USD bn 1.8 / 16.5
7 INDoNESIAmarket value (2014 / 2030E)
Equities, USD bn 347 / 4308
Corporate bonds, USD bn 49 / 753
Sovereign bonds, USD bn 114 / 227
Growth (2014–2030E CAGR)
Equities 15.0%
Corporate bonds 17.4%
Sovereign bonds 4.1%
Primary market activity (USD bn / % of EM)
Equity capital markets
Deal value 2014–2030E 117 / 1.9%
Deal fees 2014–2030E 2.1 / 1.7%
Debt capital markets
Deal value 880 / 2.5%
Deal fees 5.7 / 4.3%
Secondary market activity (2014 / 2030E)
Equity ADTv, USD bn 0.5 / 6.1
8TAIWANmarket value (2014 / 2030E)
Equities, USD bn 823 / 4041
Corporate bonds, USD bn 158 / 1391
Sovereign bonds, USD bn 181 / 342
Growth (2014–2030E CAGR)
Equities 9.2%
Corporate bonds 13.6%
Sovereign bonds 3.8%
Primary market activity (USD bn / % of EM)
Equity capital markets
Deal value 2014–2030E 172 / 2.8%
Deal fees 2014–2030E 2.3 / 1.9%
Debt capital markets
Deal value 1540 / 4.4%
Deal fees 3.1 / 2.4%
Secondary market activity (2014 / 2030E)
Equity ADTv, USD bn 3.6 / 19
6
3
5
67
8
EMERGInG CAPITAL MARKETS_53
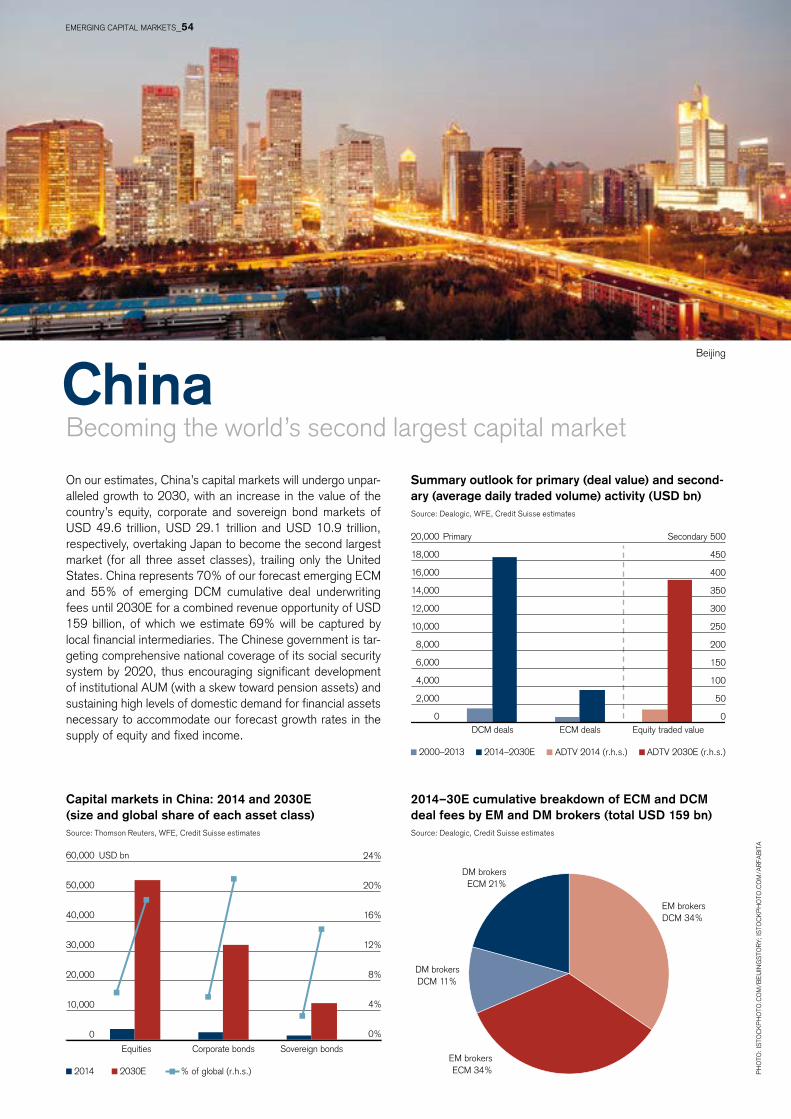
EM brokersDCM 34%
EM brokersECM 34%
DM brokersDCM 11%
DM brokersECM 21%
ChinaBecoming the world’s second largest capital market
on our estimates, China’s capital markets will undergo unpar-alleled growth to 2030, with an increase in the value of the country’s equity, corporate and sovereign bond markets of USD 49.6 trillion, USD 29.1 trillion and USD 10.9 trillion, respectively, overtaking Japan to become the second largest market (for all three asset classes), trailing only the United States. China represents 70% of our forecast emerging ECM and 55% of emerging DCM cumulative deal underwriting fees until 2030E for a combined revenue opportunity of USD 159 billion, of which we estimate 69% will be captured by local financial intermediaries. The Chinese government is tar-geting comprehensive national coverage of its social security system by 2020, thus encouraging significant development of institutional AUM (with a skew toward pension assets) and sustaining high levels of domestic demand for financial assets necessary to accommodate our forecast growth rates in the supply of equity and fixed income.
Ph
oTo
: IS
ToC
KP
ho
To.C
oM
/BE
IJIn
GS
ToR
y; IS
ToC
KP
ho
To.C
oM
/AR
FAB
ITA
Beijing
Capital markets in China: 2014 and 2030E (size and global share of each asset class)Source: Thomson Reuters, WFE, Credit Suisse estimates
2014–30E cumulative breakdown of ECm and DCm deal fees by Em and Dm brokers (total USD 159 bn)Source: Dealogic, Credit Suisse estimates
Summary outlook for primary (deal value) and sec ond-ary (average daily traded volume) activity (USD bn)Source: Dealogic, WFE, Credit Suisse estimates
2014 2030E % of global (r.h.s.)
0%
4%
8%
12%
16%
20%
24%
0
10,000
20,000
30,000
40,000
50,000
60,000
Equities Corporate bonds Sovereign bonds
USD bn
0
50
100
150
200
250
300
350
400
450
500
0
2,000
4,000
6,000
8,000
10,000
12,000
14,000
16,000
18,000
20,000
DCM deals ECM deals Equity traded value
2000–2013 2014–2030E ADTV 2014 (r.h.s.) ADTV 2030E (r.h.s.)
SecondaryPrimary
EMERGInG CAPITAL MARKETS_54
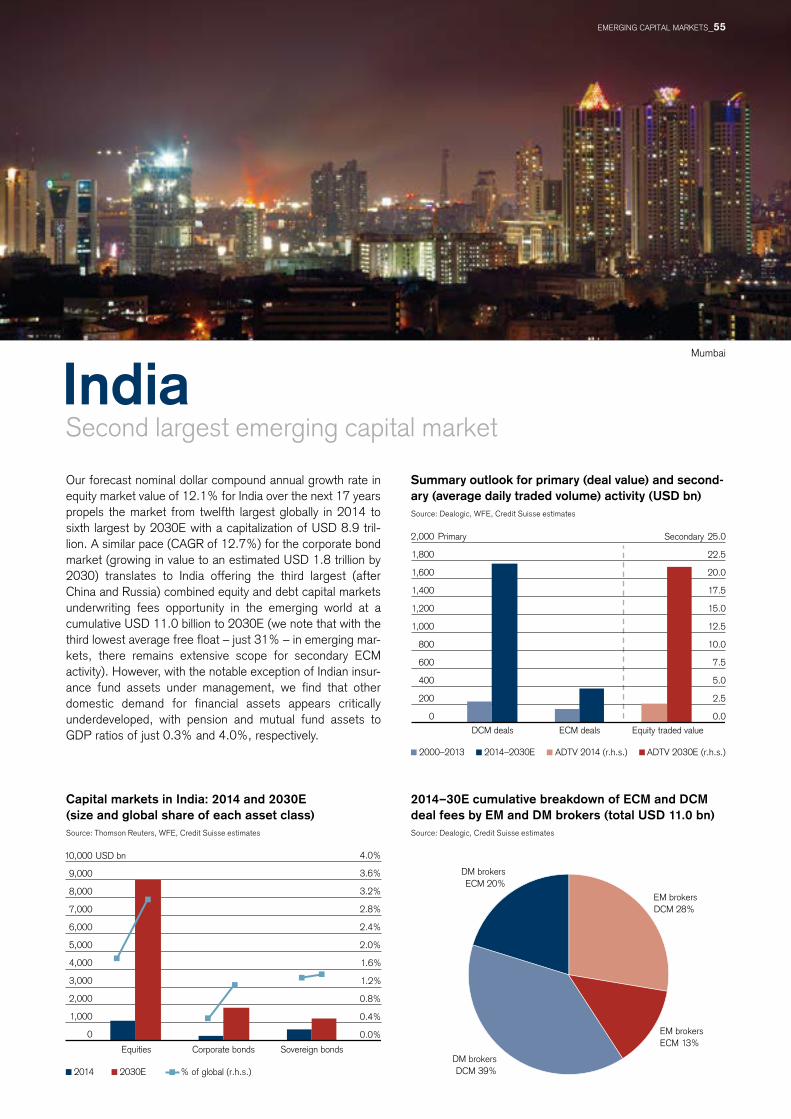
Mumbai
IndiaSecond largest emerging capital market
our forecast nominal dollar compound annual growth rate in equity market value of 12.1% for India over the next 17 years propels the market from twelfth largest globally in 2014 to sixth largest by 2030E with a capitalization of USD 8.9 tril-lion. A similar pace (CAGR of 12.7%) for the corporate bond market (growing in value to an estimated USD 1.8 trillion by 2030) translates to India offering the third largest (after China and Russia) combined equity and debt capital markets underwriting fees opportunity in the emerging world at a cumulative USD 11.0 billion to 2030E (we note that with the third lowest average free float – just 31% – in emerging mar-kets, there remains extensive scope for secondary ECM activity). however, with the notable exception of Indian insur-ance fund assets under management, we find that other domestic demand for financial assets appears critically underdeveloped, with pension and mutual fund assets to GDP ratios of just 0.3% and 4.0%, respectively.
Summary outlook for primary (deal value) and sec ond-ary (average daily traded volume) activity (USD bn)Source: Dealogic, WFE, Credit Suisse estimates
Capital markets in India: 2014 and 2030E (size and global share of each asset class)Source: Thomson Reuters, WFE, Credit Suisse estimates
2014–30E cumulative breakdown of ECm and DCm deal fees by Em and Dm brokers (total USD 11.0 bn)Source: Dealogic, Credit Suisse estimates
EM brokersDCM 28%
EM brokersECM 13%
DM brokersDCM 39%
DM brokersECM 20%
2014 2030E % of global (r.h.s.)
Equities Corporate bonds Sovereign bonds
USD bn
0.0%
0.4%
0.8%
1.2%
1.6%
2.0%
2.4%
2.8%
3.2%
3.6%
4.0%
0
1,000
2,000
3,000
4,000
5,000
6,000
7,000
8,000
9,000
10,000
DCM deals ECM deals Equity traded value
2000–2013 2014–2030E ADTV 2014 (r.h.s.) ADTV 2030E (r.h.s.)
Secondary
0.0
2.5
5.0
7.5
10.0
12.5
15.0
17.5
20.0
22.5
25.0
0
200
400
600
800
1,000
1,200
1,400
1,600
1,800
2,000 Primary
EMERGInG CAPITAL MARKETS_55
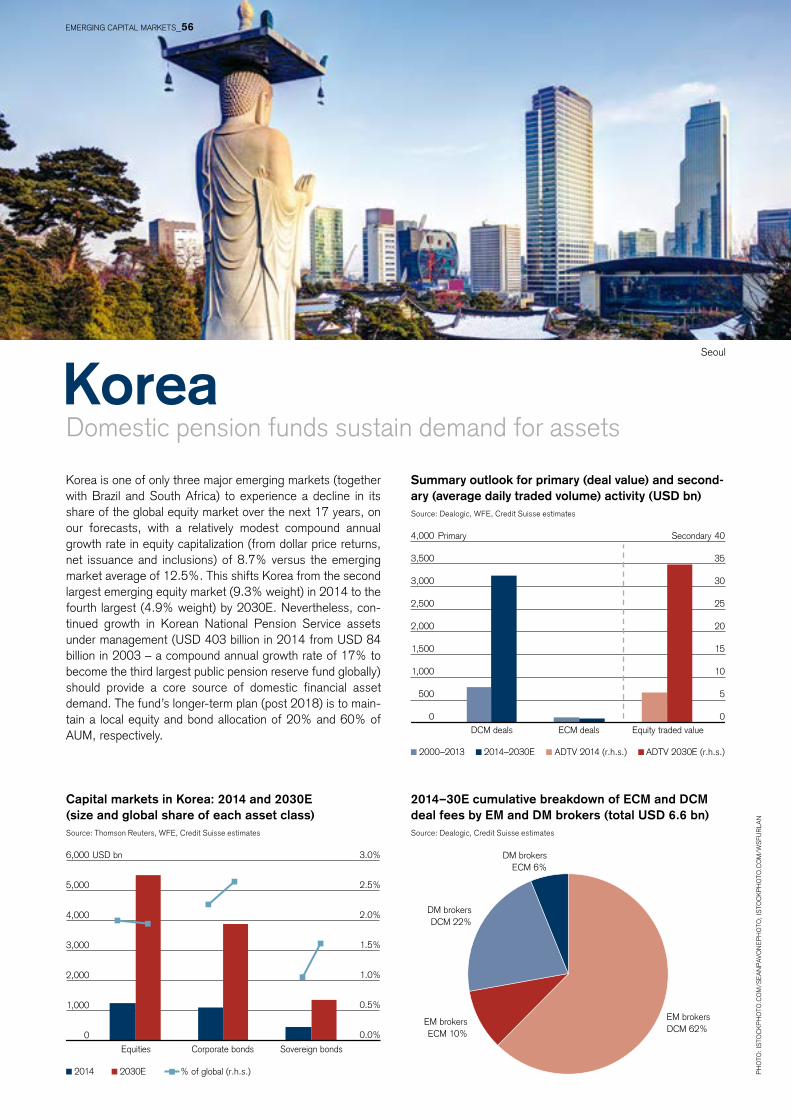
KoreaDomestic pension funds sustain demand for assets
Korea is one of only three major emerging markets (together with Brazil and South Africa) to experience a decline in its share of the global equity market over the next 17 years, on our forecasts, with a relatively modest compound annual growth rate in equity capitalization (from dollar price returns, net issuance and inclusions) of 8.7% versus the emerging market average of 12.5%. This shifts Korea from the second largest emerging equity market (9.3% weight) in 2014 to the fourth largest (4.9% weight) by 2030E. nevertheless, con-tinued growth in Korean national Pension Service assets under management (USD 403 billion in 2014 from USD 84 billion in 2003 – a compound annual growth rate of 17% to become the third largest public pension reserve fund globally) should provide a core source of domestic financial asset demand. The fund’s longer-term plan (post 2018) is to main-tain a local equity and bond allocation of 20% and 60% of AUM, respectively.
Ph
oTo
: IS
ToC
KP
ho
To.C
oM
/SE
An
PAv
on
EP
ho
To;
ISTo
CK
Ph
oTo
.Co
M/W
SFU
RLA
n
Seoul
Summary outlook for primary (deal value) and sec ond-ary (average daily traded volume) activity (USD bn)Source: Dealogic, WFE, Credit Suisse estimates
Capital markets in Korea: 2014 and 2030E (size and global share of each asset class)Source: Thomson Reuters, WFE, Credit Suisse estimates
2014–30E cumulative breakdown of ECm and DCm deal fees by Em and Dm brokers (total USD 6.6 bn)Source: Dealogic, Credit Suisse estimates
EM brokers DCM 62%
EM brokersECM 10%
DM brokersDCM 22%
DM brokersECM 6%
2014 2030E % of global (r.h.s.)
Equities Corporate bonds Sovereign bonds
USD bn
0.0%
0.5%
1.0%
1.5%
2.0%
2.5%
3.0%
0
1,000
2,000
3,000
4,000
5,000
6,000
DCM deals ECM deals Equity traded value
2000–2013 2014–2030E ADTV 2014 (r.h.s.) ADTV 2030E (r.h.s.)
0
5
10
15
20
25
30
35
40
0
500
1,000
1,500
2,000
2,500
3,000
3,500
4,000 SecondaryPrimary
EMERGInG CAPITAL MARKETS_56
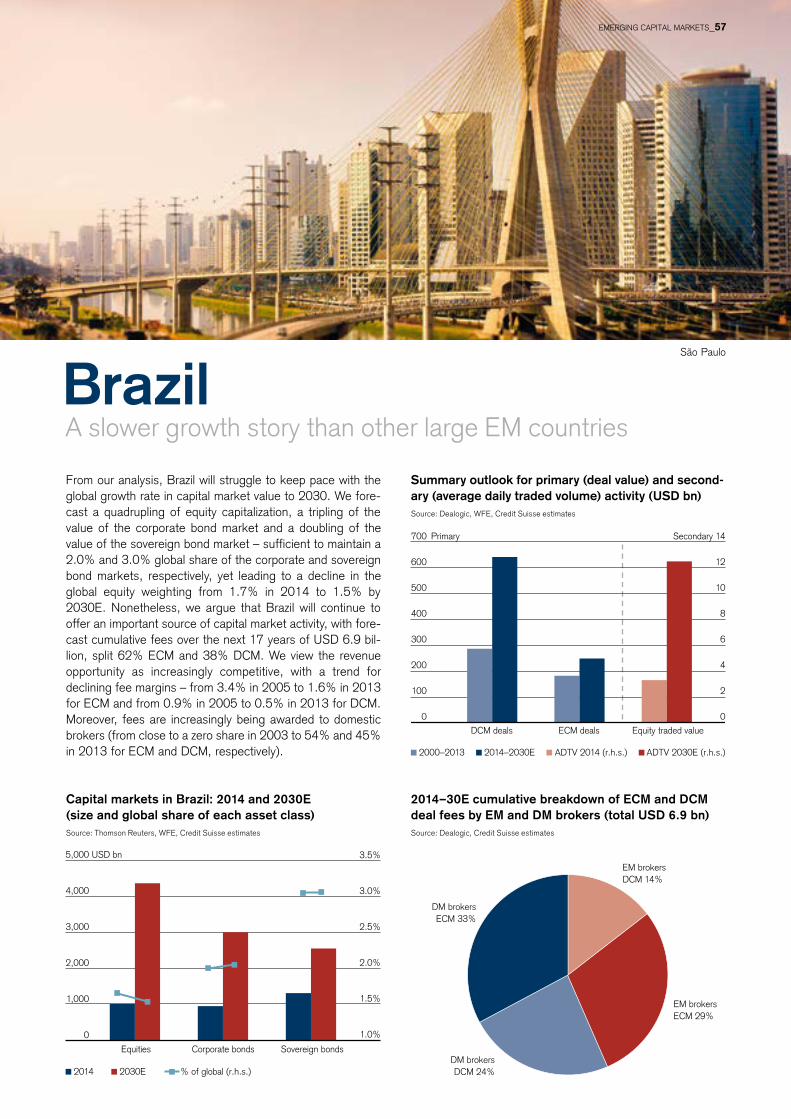
BrazilA slower growth story than other large EM countries
From our analysis, Brazil will struggle to keep pace with the global growth rate in capital market value to 2030. We fore-cast a quadrupling of equity capitalization, a tripling of the value of the corporate bond market and a doubling of the value of the sovereign bond market – sufficient to maintain a 2.0% and 3.0% global share of the corporate and sovereign bond markets, respectively, yet leading to a decline in the global equity weighting from 1.7% in 2014 to 1.5% by 2030E. nonetheless, we argue that Brazil will continue to offer an important source of capital market activity, with fore-cast cumulative fees over the next 17 years of USD 6.9 bil-lion, split 62% ECM and 38% DCM. We view the revenue opportunity as increasingly competitive, with a trend for declining fee margins – from 3.4% in 2005 to 1.6% in 2013 for ECM and from 0.9% in 2005 to 0.5% in 2013 for DCM. Moreover, fees are increasingly being awarded to domestic brokers (from close to a zero share in 2003 to 54% and 45% in 2013 for ECM and DCM, respectively).
São Paulo
Summary outlook for primary (deal value) and sec ond-ary (average daily traded volume) activity (USD bn)Source: Dealogic, WFE, Credit Suisse estimates
Capital markets in Brazil: 2014 and 2030E (size and global share of each asset class)Source: Thomson Reuters, WFE, Credit Suisse estimates
2014–30E cumulative breakdown of ECm and DCm deal fees by Em and Dm brokers (total USD 6.9 bn)Source: Dealogic, Credit Suisse estimates
EM brokersDCM 14%
EM brokersECM 29%
DM brokersDCM 24%
DM brokersECM 33%
2014 2030E % of global (r.h.s.)
Equities Corporate bonds Sovereign bonds
USD bn
1.0%
1.5%
2.0%
2.5%
3.0%
3.5%
0
1,000
2,000
3,000
4,000
5,000
DCM deals ECM deals Equity traded value
2000–2013 2014–2030E ADTV 2014 (r.h.s.) ADTV 2030E (r.h.s.)
0
2
4
6
8
10
12
14
0
100
200
300
400
500
600
700 SecondaryPrimary
EMERGInG CAPITAL MARKETS_57
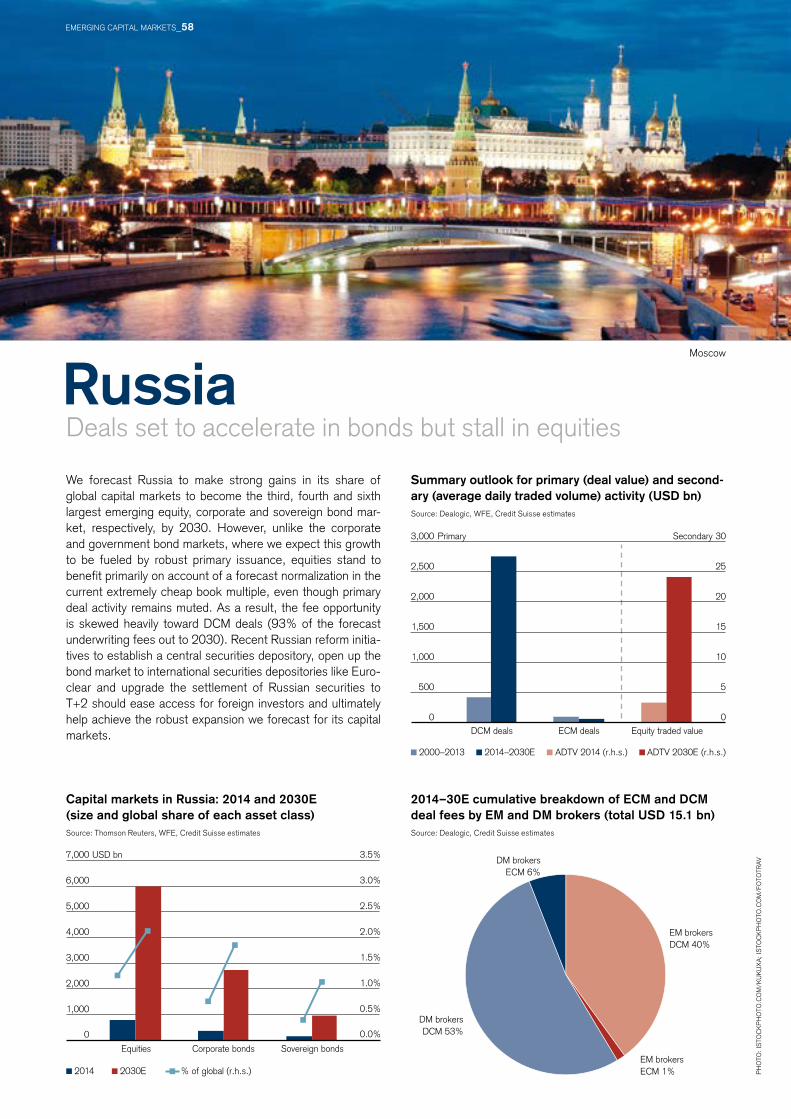
RussiaDeals set to accelerate in bonds but stall in equities
Ph
oTo
: IS
ToC
KP
ho
To.C
oM
/KU
KU
XA
; IS
ToC
KP
ho
To.C
oM
/Fo
ToTR
Av
Moscow
We forecast Russia to make strong gains in its share of global capital markets to become the third, fourth and sixth largest emerging equity, corporate and sovereign bond mar-ket, respectively, by 2030. however, unlike the corporate and government bond markets, where we expect this growth to be fueled by robust primary issuance, equities stand to benefit primarily on account of a forecast normalization in the current extremely cheap book multiple, even though primary deal activity remains muted. As a result, the fee opportunity is skewed heavily toward DCM deals (93% of the forecast underwriting fees out to 2030). Recent Russian reform initia-tives to establish a central securities depository, open up the bond market to international securities depositories like Euro-clear and upgrade the settlement of Russian securities to T+2 should ease access for foreign investors and ultimately help achieve the robust expansion we forecast for its capital markets.
Summary outlook for primary (deal value) and sec ond-ary (average daily traded volume) activity (USD bn)Source: Dealogic, WFE, Credit Suisse estimates
Capital markets in Russia: 2014 and 2030E (size and global share of each asset class)Source: Thomson Reuters, WFE, Credit Suisse estimates
2014–30E cumulative breakdown of ECm and DCm deal fees by Em and Dm brokers (total USD 15.1 bn)Source: Dealogic, Credit Suisse estimates
EM brokers DCM 40%
EM brokersECM 1%
DM brokersDCM 53%
DM brokersECM 6%
2014 2030E % of global (r.h.s.)
Equities Corporate bonds Sovereign bonds
USD bn
0.0%
0.5%
1.0%
1.5%
2.0%
2.5%
3.0%
3.5%
0
1,000
2,000
3,000
4,000
5,000
6,000
7,000
DCM deals ECM deals Equity traded value
2000–2013 2014–2030E ADTV 2014 (r.h.s.) ADTV 2030E (r.h.s.)
Secondary
0
5
10
15
20
25
30
0
500
1,000
1,500
2,000
2,500
3,000 Primary
EMERGInG CAPITAL MARKETS_58
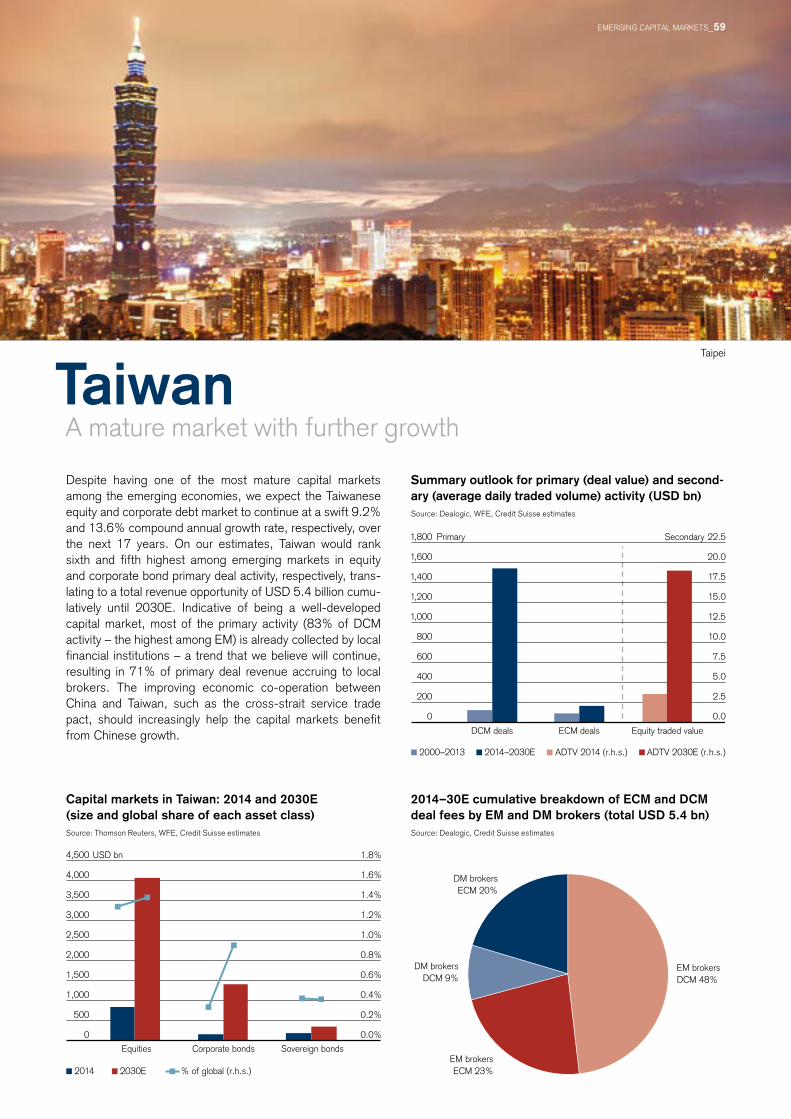
TaiwanA mature market with further growth
Despite having one of the most mature capital markets among the emerging economies, we expect the Taiwanese equity and corporate debt market to continue at a swift 9.2% and 13.6% compound annual growth rate, respectively, over the next 17 years. on our estimates, Taiwan would rank sixth and fifth highest among emerging markets in equity and corporate bond primary deal activity, respectively, trans-lating to a total revenue opportunity of USD 5.4 billion cumu-latively until 2030E. Indicative of being a well-developed capital market, most of the primary activity (83% of DCM activity – the highest among EM) is already collected by local financial institutions – a trend that we believe will continue, resulting in 71% of primary deal revenue accruing to local brokers. The improving economic co-operation between China and Taiwan, such as the cross-strait service trade pact, should increasingly help the capital markets benefit from Chinese growth.
Taipei
Summary outlook for primary (deal value) and sec ond-ary (average daily traded volume) activity (USD bn)Source: Dealogic, WFE, Credit Suisse estimates
Capital markets in Taiwan: 2014 and 2030E (size and global share of each asset class)Source: Thomson Reuters, WFE, Credit Suisse estimates
2014–30E cumulative breakdown of ECm and DCm deal fees by Em and Dm brokers (total USD 5.4 bn)Source: Dealogic, Credit Suisse estimates
EM brokersDCM 48%
EM brokersECM 23%
DM brokersDCM 9%
DM brokersECM 20%
2014 2030E % of global (r.h.s.)
Equities Corporate bonds Sovereign bonds
USD bn
0.0%
0.2%
0.4%
0.6%
0.8%
1.0%
1.2%
1.4%
1.6%
1.8%
0
500
1,000
1,500
2,000
2,500
3,000
3,500
4,000
4,500
DCM deals ECM deals Equity traded value
2000–2013 2014–2030E ADTV 2014 (r.h.s.) ADTV 2030E (r.h.s.)
Secondary
0.0
2.5
5.0
7.5
10.0
12.5
15.0
17.5
20.0
22.5
0
200
400
600
800
1,000
1,200
1,400
1,600
1,800 Primary
EMERGInG CAPITAL MARKETS_59
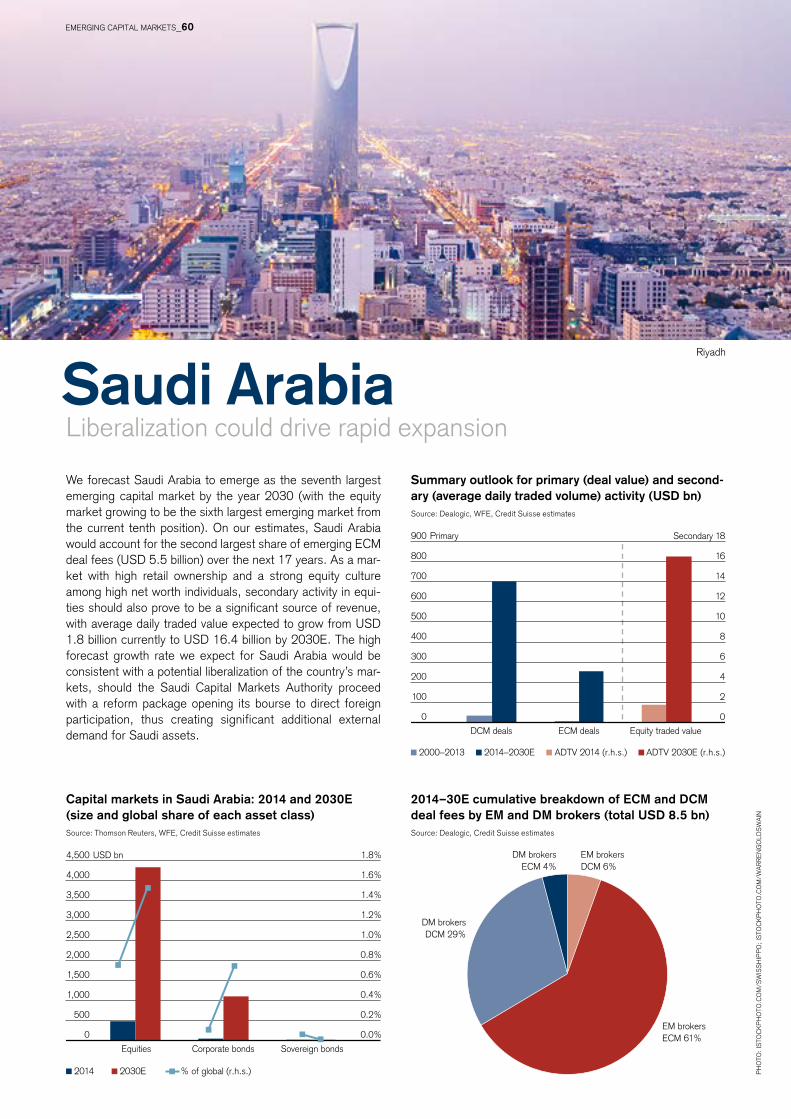
Saudi ArabiaLiberalization could drive rapid expansion
Ph
oTo
: IS
ToC
KP
ho
To.C
oM
/SW
ISS
hIP
Po
; IS
ToC
KP
ho
To.C
oM
/WA
RR
En
Go
LDS
WA
In
Riyadh
We forecast Saudi Arabia to emerge as the seventh largest emerging capital market by the year 2030 (with the equity market growing to be the sixth largest emerging market from the current tenth position). on our estimates, Saudi Arabia would account for the second largest share of emerging ECM deal fees (USD 5.5 billion) over the next 17 years. As a mar-ket with high retail ownership and a strong equity culture among high net worth individuals, secondary activity in equi-ties should also prove to be a significant source of revenue, with average daily traded value expected to grow from USD 1.8 billion currently to USD 16.4 billion by 2030E. The high forecast growth rate we expect for Saudi Arabia would be consistent with a potential liberalization of the country’s mar-kets, should the Saudi Capital Markets Authority proceed with a reform package opening its bourse to direct foreign participation, thus creating significant additional external demand for Saudi assets.
Summary outlook for primary (deal value) and sec ond-ary (average daily traded volume) activity (USD bn)Source: Dealogic, WFE, Credit Suisse estimates
Capital markets in Saudi Arabia: 2014 and 2030E (size and global share of each asset class)Source: Thomson Reuters, WFE, Credit Suisse estimates
2014–30E cumulative breakdown of ECm and DCm deal fees by Em and Dm brokers (total USD 8.5 bn)Source: Dealogic, Credit Suisse estimates
EM brokersDCM 6%
EM brokersECM 61%
DM brokersDCM 29%
DM brokersECM 4%
2014 2030E % of global (r.h.s.)
Equities Corporate bonds Sovereign bonds
USD bn
0.0%
0.2%
0.4%
0.6%
0.8%
1.0%
1.2%
1.4%
1.6%
1.8%
0
500
1,000
1,500
2,000
2,500
3,000
3,500
4,000
4,500
DCM deals ECM deals Equity traded value
2000–2013 2014–2030E ADTV 2014 (r.h.s.) ADTV 2030E (r.h.s.)
Secondary
0
2
4
6
8
10
12
14
16
18
0
100
200
300
400
500
600
700
800
900 Primary
EMERGInG CAPITAL MARKETS_60
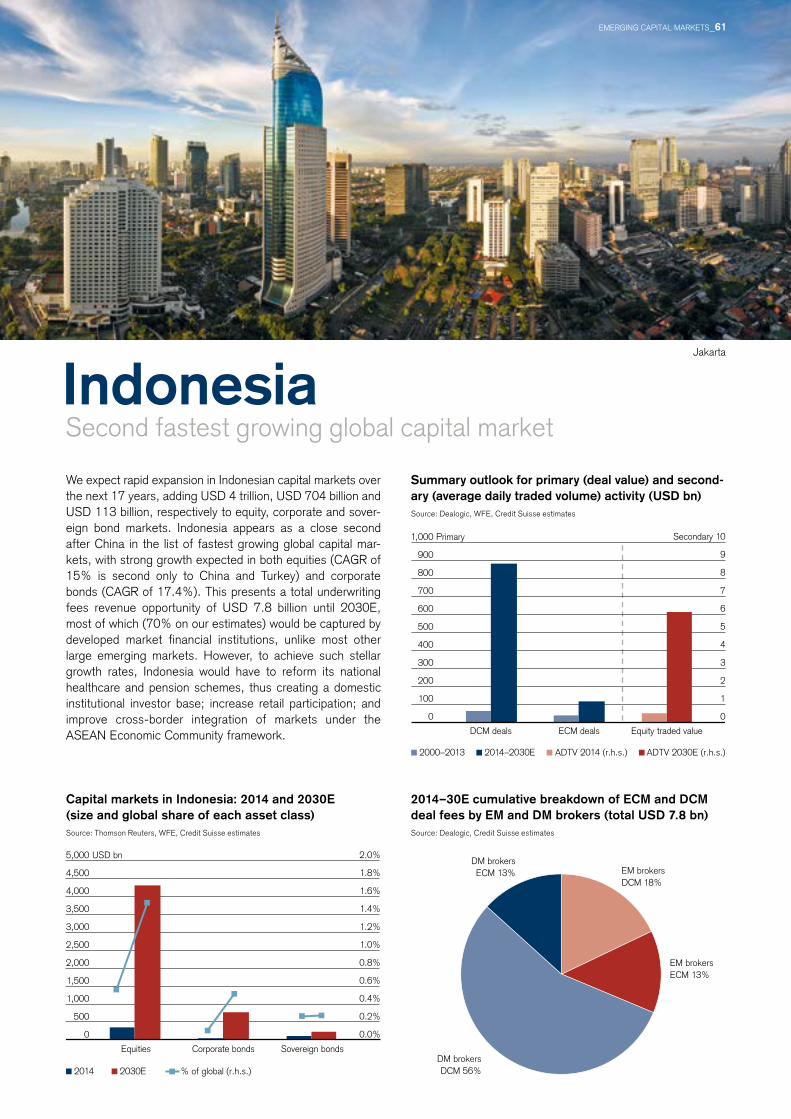
IndonesiaSecond fastest growing global capital market
We expect rapid expansion in Indonesian capital markets over the next 17 years, adding USD 4 trillion, USD 704 billion and USD 113 billion, respectively to equity, corporate and sover-eign bond markets. Indonesia appears as a close second after China in the list of fastest growing global capital mar-kets, with strong growth expected in both equities (CAGR of 15% is second only to China and Turkey) and corporate bonds (CAGR of 17.4%). This presents a total underwriting fees revenue opportunity of USD 7.8 billion until 2030E, most of which (70% on our estimates) would be captured by developed market financial institutions, unlike most other large emerging markets. however, to achieve such stellar growth rates, Indonesia would have to reform its national healthcare and pension schemes, thus creating a domestic institutional investor base; increase retail participation; and improve cross-border integration of markets under the ASEAn Economic Community framework.
Jakarta
Summary outlook for primary (deal value) and sec ond-ary (average daily traded volume) activity (USD bn)Source: Dealogic, WFE, Credit Suisse estimates
Capital markets in Indonesia: 2014 and 2030E (size and global share of each asset class)Source: Thomson Reuters, WFE, Credit Suisse estimates
2014–30E cumulative breakdown of ECm and DCm deal fees by Em and Dm brokers (total USD 7.8 bn)Source: Dealogic, Credit Suisse estimates
EM brokersDCM 18%
EM brokersECM 13%
DM brokersDCM 56%
DM brokersECM 13%
2014 2030E % of global (r.h.s.)
Equities Corporate bonds Sovereign bonds
USD bn
0.0%
0.2%
0.4%
0.6%
0.8%
1.0%
1.2%
1.4%
1.6%
1.8%
2.0%
0
500
1,000
1,500
2,000
2,500
3,000
3,500
4,000
4,500
5,000
DCM deals ECM deals Equity traded value
2000–2013 2014–2030E ADTV 2014 (r.h.s.) ADTV 2030E (r.h.s.)
Secondary
1
0
2
3
4
5
6
7
8
9
10
0
100
200
300
400
500
600
700
800
900
1,000 Primary
EMERGInG CAPITAL MARKETS_61

Also published by the Research Institute
Emerging Consumer Survey 2012January 2012
Investing for impactJanuary 2012
Family businesses:Sustaining performanceSeptember 2012
opportunities in an urbanizing worldApril 2012
Gender diversity and corporate performanceAugust 2012
Global Wealth Report 2012october 2012
latin America: The long roadFebruary 2014
Emerging Consumer Survey 2014 February 2014
Credit Suisse Global Investment Returns Yearbook 2014February 2014
Credit Suisse Global Investment Returns Yearbook 2012January 2012
The shale revolutionDecember 2012
Emerging Consumer Survey 2013 January 2013
Credit Suisse Global Investment Returns Yearbook 2013February 2013
SugarConsumption at a crossroadsSeptember 2013
Global WealthReport 2013october 2013
EMERGInG CAPITAL MARKETS_62
EMERGInG CAPITAL MARKETS_63
PUBlIShERCREDIT SUISSE AGResearch InstituteParadeplatz 8Ch-8070 zurichSwitzerland
PRoDUCTIoN mANAGEmENTINvESTmENT STRATEGY & RESEARCh INvESTmENT PUBlIShINGMarkus Kleeb (head)Ross hewittKatharina Schlatter
AUThoRSAlexander J. RedmanArun Sai
EDIToRIAl DEADlINE26 June 2014
ADDITIoNAl CoPIESAdditional copies of this publication can be ordered via the Credit Suisse publication shop www.credit-suisse.com/publications or via your customer advisor.
Imprint
General disclaimer / Important informationThis document was produced by and the opinions expressed are those of Credit Suisse as of the date of writing and are subject to change. It has been prepared solely for information purposes and for the use of the recipient. It does not constitute an offer or an invitation by or on behalf of Credit Suisse to any person to buy or sell any security. nothing in this material constitutes investment, legal, accounting or tax advice, or a representation that any investment or strategy is suitable or appropriate to your individual circumstances, or otherwise constitutes a personal recommendation to you. The price and value of investments mentioned and any income that might accrue may fluctuate and may fall or rise. Any reference to past performance is not a guide to the future.The information and analysis contained in this publication have been compiled or arrived at from sources believed to be reliable but Credit Suisse does not make any representation as to their accuracy or completeness and does not accept liability for any loss arising from the use hereof. A Credit Suisse Group company may have acted upon the information and analysis contained in this publication before being made available to clients of Credit Suisse. Investments in emerging markets are speculative and considerably more volatile than investments in established markets. Some of the main risks are political risks, economic risks, credit risks, currency risks and market risks. Investments in foreign currencies are subject to exchange rate fluctuations. Before entering into any transaction, you should consider the suitability of the transaction to your particular circumstances and independently review (with your professional advisers as necessary) the specific financial risks as well as legal, regulatory, credit, tax and accounting consequences. This document is issued and distributed in the United States by Credit Suisse Securities (USA) LLC, a U.S. registered broker-dealer; in Canada by Credit Suisse Securities (Canada), Inc.; and in Brazil by Banco de Investimentos Credit Suisse (Brasil) S.A.This document is distributed in Switzerland by Credit Suisse AG, a Swiss bank. Credit Suisse is authorized and regulated by the Swiss Financial Market Supervisory Authority (FInMA). This document is issued and distributed in Europe (except Switzerland) by Credit Suisse (UK) Limited and Credit Suisse Securities (Europe) Limited. Credit Suisse Securities (Europe) Limited and Credit Suisse (UK) Limited, both authorized by the Prudential Regulation Authority and regulated by the Financial Conduct Authority and the Prudential Regulation Authority, are associated but independent legal entities within Credit Suisse. The protections made available by the Financial Conduct Authority and/or the Prudential Regulation Authority for retail clients do not apply to investments or services provided by a person outside the UK, nor will the Financial Services Compensation Scheme be available if the issuer of the investment fails to meet its obligations. This document is distributed in Guernsey by Credit Suisse (Channel Islands) Limited, an independent legal entity registered in Guernsey under 15197, with its registered address at helvetia Court, Les Echelons, South Esplanade, St Peter Port, Guernsey. Credit Suisse (Channel Islands) Limited is wholly owned by Credit Suisse AG and is regulated by the Guernsey Financial Services Commission. Copies of the latest audited accounts are available on request. This document is distributed in Jersey by Credit Suisse (Channel Islands) Limited, Jersey Branch, which is regulated by the Jersey Financial Services Commission. The business address of Credit Suisse (Channel Islands) Limited, Jersey Branch, in Jersey is: TradeWind house, 22 Esplanade, St helier, Jersey JE2 3QA. This document has been issued in Asia-Pacific by whichever of the following is the appropriately authorised entity of the relevant jurisdiction: in hong Kong by Credit Suisse (hong Kong) Limited, a corporation licensed with the hong Kong Securities and Futures Commission or Credit Suisse hong Kong branch, an Authorized Institution regulated by the hong Kong Monetary Authority and a Registered Institution regulated by the Securities and Futures ordinance (Chapter 571 of the Laws of hong Kong); in Japan by Credit Suisse Securities (Japan) Limited; elsewhere in Asia/Pacific by whichever of the following is the appropriately authorized entity in the relevant jurisdiction: Credit Suisse Equities (Australia) Limited, Credit Suisse Securities (Thailand) Limited, Credit Suisse Securities (Malaysia) Sdn Bhd, Credit Suisse AG, Singapore Branch, and elsewhere in the world by the relevant authorized affiliate of the above.This document may not be reproduced either in whole, or in part, without the written permission of the authors and Credit Suisse. © 2014 Credit Suisse Group AG and/or its affiliates. All rights reserved

RC
E 1
5458
84
07
/201
4
CREDIT SUISSE AGResearch InstituteParadeplatz 8Ch-8070 zurichSwitzerland
[email protected]/researchinstitute