Embed Size (px)
Citation preview

Emergent Cultural Signaturesand Persistent Diversity:
A Model of Conformity and Consistency
Jenna Bednar, Aaron Bramson, Andrea Jones-Rooy, and Scott PageUniversity of Michigan∗
February 24, 2010
Abstract
Empirical evidence demonstrates that cultures exist, they differ from one another,they’re coherent, and yet diversity persists within them. In this paper, we describea multi-dimensional model of cultural formation that produces all of these properties.Our model includes two forces: an internal desire to be consistent and social pressure toconform. When both forces operate, the society converges to a coordinated behaviorthat is consistent across the attributes. We find that convergence in the two-forcemodel is slower than a pure conformity model and that a preponderance of one forceover the other slows convergence, rather than hastening it. We further find that thetwo forces amplify small errors in individual behavior and prove capable of producingsubstantial persistent diversity.
Keywords: culture, identity, diversity, coordination, dynamic equilibrium, agent based model
∗This research was funded by AFOSR-MURI Grant 57100001867. We thank Paul Hartzog, JenniferMiller, Len Sander, Casey Schneider-Mizell, and seminar participants at Stanford University for helpfulconversations. Contact [email protected] or [email protected].
1

Empirical research on cultural differences reveals four broadly accepted findings. First,
cultures exhibit coherence in both actions and belief systems. These cultural signatures
are socially, economically, and politically meaningful. Second, these actions and behaviors
also exhibit consistency. This consistency allows policy makers to anticipate and predict
responses based on cultural affiliations and scholars to identify artifacts as belonging to
particular groups. Third, despite the identifiability of consistent group level signatures,
cultures exhibit substantial within group heterogeneity. Not all Germans are alike. Finally,
and perhaps most importantly, cultures differ. These differences influence the management
of economies, political systems, and the environment.
The formal literature on cultural differentiation and integration considers the first and
last regularities, as Macy et al describe them: “the disproportionate homogeneity in social
groups and the persistence of diversity across groups” (Macy et al. 2003:2). Within-group
homogeneity can be produced by mild incentives for coordination (Durrett and Levin 2005,
Kuran and Sandholm 2008). These same models implicitly demonstrate inter-group diversity:
geographically disjoint groups would be very unlikely to converge on identical ensembles of
beliefs and behaviors. A more subtle logic based on preferential interaction can also explain
cultural differences between groups. Axelrod’s (1997) culture model assumes that agents
mediate interactions based on social distances. As a result, people cluster into like-minded
groups as thick boundaries emerge between internally homogeneous cultures (see also Centola
et al. 2007, Klemm et al. 2003, Kitts et al. 1999, Friedkin and Johnsen 1997, Marsden and
Friedkin 1993, Friedkin 1984).1
The existing models provide a foundation from which to explore the causes of the other
two findings: consistency across domains and persistent diversity within interacting popula-
tions. In this paper, we describe a model that has as its base a set of standard coordination
games. The coordination game, in some form, underpins most culture models. We then add
1In addition to interaction and influence dynamics, many of these models show that variations in networkconfigurations of agents and/or network dynamics (for example, completely cutting off relations with aneighbor with whom one shares no common traits) can also influence the extent to which global polarizationand local convergence takes place.
2

a behavioral assumption that individuals prefer to behave consistently across domains. We
might expect behavior and beliefs to transfer across domains for either of two reasons. First,
coherence may require less cognitive effort (Bednar and Page 2007). Consistent behavior
entails less cognitive dissonance (Festinger 1957). Second, an individual’s coherence may be
informationally more efficient for others. If members of a culture assign types, such as high
or low trust, to others, then they can update beliefs much more easily and accurately if they
assume those types apply across domains. We then show that this model can produce all
four findings.
As a first step, we define what we mean by a consistent cultural signature.2 Within a
culture, actions on each domain can be coordinated, i.e. everyone can shake hands or bow,
but this need not imply that behavior in one domain bears any resemblance to behaviors
in other domains. Ethnographic research suggests that human cultures possess signatures,
or what might be described as coherence across domains of actions and beliefs. Signatures
allow actors within cultures to anticipate responses across wide settings of interaction. For
example, if a culture values competitiveness in its economy, its schools may teach and reward
competitiveness as well. If a culture is based upon a strict social hierarchy, employees may
be more likely to encounter glass ceilings obstructing their merited promotion if they come
from a class perceived as subordinate. In contrast, a culture may be technically speaking
coherent, but lack identifiable linkages across domains, such as a society where children are
the center of attention in social occasions, but that sets school funding as its lowest priority.
One can model individual attributes as a vector of traits, and a culture as the prepon-
derance of similar vectors within a community. For example, a culture may coordinate on
the vector (7, 4, 3, 5). If most of the people within a group exhibit these traits, then we can
think of this as a coherent culture. For a culture to exhibit a consistent signature, we need
the traits in one domain to be interpretable relative to traits in other domains. In other
words, in the vector (7, 4, 3, 5), we would need the seven and the four to have an explicit
2Interpretative cultural theorists such as Sewell (1999) and Wedeen (2002) refer to a related construct ofcoherence. Their formulation allows for substantial social construction of meaning.
3
relationship to one another. In the simplest version of our model, we assume that traits,
what we call attributes, take binary values. We further assume that if two attributes take
the same value, then they are consistent. Therefore, a culture that coordinated on the vector
(1, 1, 1, 1) would be consistent, but one that coordinated on (0, 1, 0, 1) would not be.
This construction allows us to anticipate how the two cultures might respond to a new
domain of interaction. We would expect that the members of the first culture would choose
action one, but we could only guess at the behavior of the members of the second culture.
Predictions of cultural consistency can and have been made empirically. Fisman and Miguel
(2007) find a correlation between home country corruption levels and unpaid parking tickets
issued to diplomats in New York City, and Miguel et al. (2008) have found a correlation
between a soccer player’s tendency be penalized and the prevalence of violence in his home
country. In both cases, behavior translates across distinct domains demonstrating consis-
tency.
Our construction exogenously imposes a single perceived meaning to each action. This
does not allow for socially constructed meanings which are well established by interpretive
models of culture (Wedeen 2002). Our current model can be extended to allow actions to
have sets of possible meanings or to have multi-dimensional meanings. Either extension
would allow for the social construction of the meaning of acts. They would also allow
individuals to reinterpret or rationalize their actions to establish consistency. The effect of
including socially constructed meanings would be to increase intra-cultural heterogeneity.
Our approach, which fixes the meaning of acts, makes the production of heterogeneity more
difficult, so it the natural place to start.
By heterogeneity, we mean something different from the polarization of sub-cultures.3
We mean the lack of convergence within an interacting group. The fact that existing models
do not produce significant within-culture variation can hardly be called a failure given the
purposes of those models. By adding a small noise or error term, coordination models
3In coordination models, the result that people break into subcultures is a scaled down version of aglobal/local model of between-culture heterogeneity. In contrast, when we write of heterogeneity and diver-sity in this paper, we refer to differences between individuals in a population.
4
produce proportional levels of heterogeneity, as we show. In our model, small amounts of
noise or error become amplified producing substantial heterogeneity. The more dimensions
to behavior and the more domains of interaction, the greater this amplification. Thus, our
model suggests behavioral trembles as a candidate explanation for the observed substantial
persistent heterogeneity of cultures.
Recall that our model differs from extant models in that it includes two incentives: a
desire to coordinate and a desire to be consistent. To show how these two forces operate,
we describe three models: a pure conformity model, a pure consistency model, and a com-
bined conformity/consistency model. As we have no reason to believe that conformity and
consistency matter equally, we also vary the weight across the two forces in the combined
model. For each model we first omit the possibility of error, and then we include random
errors and solve for equilibrium distributions of behavior. The error-free, single force models
produce intuitive results: in the pure conformity model, individuals adopt identical but in-
ternally inconsistent attributes. Whatever cultural differences exist arise from randomness
(the odds of coordinating on the same attributes are low) or from different initial condi-
tions (the attributes that are most prevalent initially tend to become the dominant cultural
attributes). This simple social conformity (i.e., coordination) model can therefore explain
inter-cultural heterogeneity as distinct equilibria of the coordination dynamic, but it cannot
produce intra-cultural heterogeneity. Moreover, these equilibria cannot be interpreted as
possessing a cultural signature.4 Similarly, the error-free, pure consistency model produces
consistent individuals but no intra-culture consistency. That is, it produces internally con-
sistent individuals, but social coordination only arises by chance. When we introduce both
forces of consistency and conformity to the model, the error-free version produces consistent
individuals and coherent cultures but no within-cultural heterogeneity. We find though that
the model takes a comparatively long time to converge, which suggests complex dynamics.
Our formal time to convergence results provide an alternative method for interpreting the
4These findings are consistent with those of other conformity models, including those that allow forpreferential interaction (Macy et al. 2003, Axelrod 1997, Rogers 1983, Hannan 1979, Barth 1969, Simmel1955, and Homans 1950).
5

amplification of trembles, namely that the complex dynamics allow errors to accumulate.
1 Meaningful Cultural Signatures and the Persistence
of Internal Group Diversity
Survey research across social science disciplines has consistently revealed substantial dif-
ferences between cultures. In fact, this inter-cultural variation provides a foundation for
nearly all social scientific comparative studies. The nature of area studies research implicitly
assumes recognizable and significant differences between behaviors of peoples in different
geographical regions, be they informal societies, communities, cities, or countries. Inglehart,
in summarizing data from the World Values Survey, concludes that “cultural variation is
. . . relatively constant within a given society, but shows relatively great variation between
different societies” (Inglehart 1997:166).5 The French, for example, tend to be more uncer-
tainty averse than Americans (Hofstede 2001), and Danish attitudes about well-being can
be consistently distinguished from French, Italian, or Portuguese attitudes.
Complementing these survey results, psychological and economic experiments reveal sys-
tematic differences in patterns of thought across countries. Nisbett (2003) finds that citizens
of Eastern countries take context into account far more than Westerners and as a result are
much more willing to accept logical contradiction. Henrich et al. (2001) study fifteen small-
scale societies across five cultures finding substantive evidence of inter-cultural behavioral
variation. In another study Henrich (2000) finds that the economic behavior of Peruvian
communities varies widely from the behavior of a Los Angeles control group, which suggests
that “economic reasoning may be heavily influenced by cultural differences—that is, by
socially transmitted rules about how to behave in certain circumstances (economic or other-
wise) that may vary from group to group as a consequence of different cultural evolutionary
trajectories” (Henrich 2000:973).
Despite observable cultural signatures, people within cultures differ widely. Not all Ger-
5On most variables he finds significant variation between country means. On cross cultural differences inlife satisfaction over 64 countries, the United States life satisfaction mean is 7.7, based on a ten-point scale;across all 64 societies the means range from as low as 3.7 to as high as 8.2.
6

man people think and act the same way, nor do all members of the Itza’ or the !Kung.
In fact, the differences within cultures are as substantial as the differences between them
(Inglehart 1997, Pelto and Pelto 1975, Thompson 1975, Graves 1970, Au 1999, Hofstede
2001). Au (1999) captures within-culture diversity related to work beliefs, finding that some
countries that share similar cultural average scores can have wider or tighter spreads in the
distribution of the population, and this variation may affect cross-cultural comparisons as
much as the average. A simple plot of two factor scores of two countries from the World
Values Survey data provides striking demonstration of all three regularities: inter-cultural
diversity, identifiable cultural signatures, and intra-cultural diversity.
We generated the graphs below using data from the World Values Survey (Inglehart and
Welzel 2005). On the x-axis the Traditional – Secular-rational dimension captures how im-
portant religion is to respondents in each country. High scores on this dimension correspond
with high values placed on concepts like family, tradition, and deference to authority. On
the y-axis the Survival – Self-expression dimension captures the differences in responses on
questions related to materialist or post-materialist values. High scores correspond with high
values placed on concepts like diversity, imagination, tolerance, environmental protection,
and involvement in political and economic life, as well as with high interpersonal trust. Not
only do responses differ considerably between countries, but also that responses from Swe-
den demonstrate greater within-culture diversity. These factors aggregate multiple responses
from each individual, so were the variation due to random error, within-country variation
would be very small.
7

Evidence of intra-cultural variation and our proposed explanation say nothing of its
importance. Cultural, economic, and social behavior may differ in meaningful ways. Durham
(1991) demonstrates variety in types of marriage custom within Tibetan culture. Thompson
(1975) provides evidence of significant intra-cultural variation in willingness to accept delayed
economic gratification between three communities in Uganda. A study of a series of six
cultures across four continents by Minturn and Lambert (1964) and Whiting (1963) found
that all but one variable on child rearing behavior was better captured by intra-cultural
variation than by inter-cultural variation. In sum, within-cultural differences matter as
much as cross-cultural differences, and for many of the same reasons.
2 Microfoundations: Conformity and Consistency
The development of a meaningful cultural signature implies that individuals within a commu-
nity conform their behavior to match one another’s, and also that there is some relationship
that ties their behaviors and beliefs together from one activity or domain to the next, creat-
ing consistency across behaviors. In this section we describe and then model the two forces
of social conformity and internal consistency.
Social conformity, the inclination to become more like those around oneself, can be un-
packed into four distinct individual-level desires and incentives: (1) the desire to fit in with
others, (2) the strategic benefit from coordination, (3) the incentive to free ride on the infor-
8

mation of others, and (4) the tendency to interact with people similar to oneself. It is a well
established observation in social psychology that people tend to mimic the behaviors, beliefs,
and attributes of those with whom they interact. Social pressure can also impart desire to fit
in with others (Bernheim 1994, Kuran 1995). And, if others positively reinforce conforming
behavior, then conformity itself can become a conditioned response (Pavlov 1903, Skinner
1974). Finally, people who interact frequently act similarly, dress similarly, reveal similar
preferences (Axelrod 1997), and react similarly to novel situations (Simon 1982).6
Although conformity has several well accepted causes, attempts to identify the extent of
conformity run up against an identification problem (Brock and Durlauf 2006). In addition to
conforming, people also choose to be around those who act as they do – this is the observation
of homophily.7 Homophily curbs group mergers because people avoid interacting with others
who are not like themselves. Adding social influence to models of homophily exacerbates
these effects: when individuals interact with others like themselves, and also actively become
more similar to them, polarization between groups is even more pronounced. In our model
we take the interacting groups as fixed and rule out the possibility of subcultures of this
sort, acknowledging that the possibility of subcultures would create further intra-cultural
heterogeneity.
Conformity need not be divorced from incentives. Individuals often mimic selectively,
looking only to the behaviors of their more successful neighbors (Kennedy 1988). More-
over, common behavior need not imply conformity. People who face similar problems may
construct similar solutions without imitating just as students who enroll in the same class
and take identical exams may produce similar answers without copying. Seminal works in
psychology by Pavlov (1903) and Skinner (1974) connect positive reinforcement and the
conditioning of learned responses. Similar learning environments could, therefore, condition
near identical behaviors. Along the same lines, institutions create a common set of incentives
6Bandura (1977) demonstrated that children imitate behavior they view on TV and Huesmann (1988,1998) showed that copied behaviors become encoded into children’s their behavioral schemas.
7McPherson et al. (2001) review the scores of empirical studies. See also Schelling’s (1971) discussion ofpreferences and racial segregation.
9

and constraints on behavior, which could encourage conformity (North 1990, Young 1998,
Bednar and Page 2007).
Often institutions or the environment create strong incentives for identical behavior. If
everyone else in a community shakes hands upon greeting, drives on the left side of the road,
and speaks English, an individual benefits from doing the same. In these instances, the
incentives to take the same action as others are economic as opposed to psychological and
are therefore considered as strategic coordination games and not instances of conformity.
Not all conformity, though, can be seen as economically based. This holds true even in
economic contexts. Young and Burke (2001), for example, show that rather than choose
optimal contracts based on soil conditions, landowners and tenant farmers coordinate on
common revenue sharing arrangements.
An incentive to conform also arises in uncertain situations, where individuals turn to
others for behavioral clues (Tittle and Hill 1967, Liska 1975). In general, the more observable
one’s behavior is to others, the more likely one is to conform to the majority behavior and/or
the standing social norm (Liska 1975, Ajzen and Fishbein 1969, Warner and DeFleur 1969,
Bowers 1968). If someone sees that everyone else has taken some action, she cannot help
but draw inferences about the beliefs of others. This tendency can lead to herd behavior
(Banerjee 1992) and information cascades (Bikchandani, et al 1992).
The second fundamental force that we consider in our model relates to an individual’s
desire to be consistent. Moral principles may undergird consistency. For example, ideology or
religion may provide umbrella beliefs or a set of values to guide behavior that are unlikely to
change significantly over time.8 The drive to consistency may also be based on convenience:
consistent behavior across domains reduces cognitive load.9 Internal consistency, whether
motivated by principles or cognitive burden, provides the linkage across dimensions necessary
for a recognizable cultural signature.
8Note that these umbrella beliefs do not imply perfect consistency. People are prone to idiosyncraticchanges in behavior (or that what is “consistent” for one person might not be consistent for another), muchas they might idiosyncratically copy a neighbor or not. The inclusion of errors in the second version of themodel helps capture this.
9See Bednar and Page (2007) for a discussion of cognitive load and culture.
10

Like conformity, the desire for consistency is also well established empirically. Psycho-
logical research shows that personal uneasiness with cognitive dissonance creates within
individuals a desire for consistency; people find it difficult to behave differently in every sit-
uation (Festinger 1957, Ajzen and Fishbein 1980, Ross and Ward 1995, Van Overwalle and
Jordens 2002). Consistency extends to the political realm: Darmofal (2005) finds a citizen
will tend to disagree with public policy expert’s recommendations when they run counter
to an individual’s life experiences. Psychologists generally agree that individuals overcome
cognitive dissonance by either restricting their behavior to be consistent with their attitudes
or by changing their attitudes to match their inconsistent behavior (McGuire 1966, Singer
1966, Beauvois and Joule 1996, Aronson 1999, Harmon-Jones and Harmon-Jones 2002).
Research in neuroscience complements psychological evidence for consistency. The phys-
iology of the brain may enforce minimal levels of consistency for the simple reason that
repeated behaviors create cognitive pathways which funnel future thought and action (Gaz-
zaniga 1999). This neurological evidence aligns with empirical studies that show when con-
fronted with a novel situation, an individual often chooses a behavioral response that belongs
to their existing repertoire (March 1991, Cavalli-Sforza and Feldman 1981).
Finally, at a more abstract level, consistency can be justified theoretically using the logic
of cost-benefit analysis. Consistent behavior allows others to predict his/her next moves.
Accurate predictions grease the wheels of economic and political institutions. In fact, one
broadly-accepted role of culture is to help coordinate on equilibria. Some equilibria may be
more focal than others based on their relationship to the wider culture (Calvert and Johnson
1998).
To summarize, empirical evidence shows that individuals tend toward both consistency
and conformity. Note that we do not take consistency and conformity to be hard and fast
rules but, rather, emphasize that they are two general forces that guide human behavior.
Moment-to-moment, individuals can be as unpredictable in their behavior as they might be
arbitrary in whom they imitate, but on the whole, they are generally consistent and they
generally coordinate with others. Below, we present our model that captures these two forces
11

that motivate human behavior. We show that these two simple pressures alone can generate
the macro-observation of groups that are distinct from one another, that possess meaningful
culture signatures, and that are characterized by persistent within-culture diversity.
2.1 General Structure of the Models
In the model, we assume N agents indexed by j. Each agent can be represented by a vector
of M attributes that take one of A values. We write agent j as aj = (aj1, aj2, . . . a
jM), where
each aji ∈ {0, 1, . . . A}. These attributes can represent behaviors, dispositions, customs,
attire and so on. Crucial to our model will be that attribute values have meaning. If an
agent’s attributes take the same value, i.e. if aji = ajk, then the agent will be consistent on
those two attributes. The agents will alter their attributes over time following behavioral
rules, which we describe below.10 In what follows, we first describe pure internal consistency
and pure social conformity models. We then combine the two models to create a consistent,
conformity model. The single force models prove important to understand the process of
cultural formation. To make that process as transparent as possible, in the mathematical
analysis that follows we restrict attention to the case of binary attribute values, aji ∈ {0, 1}.11
2.2 Force 1: Internal Consistency
We first describe a model in which agents strive for consistency. We capture this formally
as follows: We let s(aj) equal the number of times the most common attribute appears in
agent j’s vector of attributes. We can write a consistency payoff function as follows:
s(aj) = maxa∈A{| i |: aji = a}.
Given this payoff function, an optimizing agent would set all attributes to the same value. In
our model, we implicitly assume that agents lack a holistic awareness of their inconsistencies.
10Thus, these attributes are not sacred in the sense of Ginges et al. (2007).11The extension to non-binary attributes is notationally burdensome but straightforward.
12

Instead, they alter their attribute values with the goal of increasing consistency. To model
this process, in each period we randomly select an agent. The agent then applies the following
internal consistency rule:
Internal Consistency Rule: The agent chooses two random distinct attributes and changes
the value of the first attribute to match the value of the second.
Repeated application of this rule leads to consistency. To see why, assume attributes take
value zero or one. Let x denote the number of an agent’s attributes with value one. Recall
that M attributes exist in total. Thus, if x = 0 or x = M , the agent is consistent. In
game theory, these consistent states would be called equilibria, while in dynamical systems
they would be called absorbing states. Given our focus on process, we adopt the latter
terminology.
The internal consistency rule has the feature that the consistency payoff function is
equally likely to increase as it is to decrease. Consider the special case where exactly one
attribute has value one and all other attributes have value zero. The rule chooses two
attributes with only the first changing its value. For the consistency to increase the first
attribute chosen must be the single attribute with value one, in which case, the agent becomes
fully consistent. This occurs with probability 1M
. For consistency to decrease, the second
attribute selected has to be the single attribute with value one. The probability that the first
attribute has value zero equals M−1M
, andthe probability that the second has value one equals
1M−1
. The combined probability equals 1M
, which equals the probability that consistency
increased. We can now state the following lemma, whose proof relies on an extension of this
logic.
Lemma 1 Let x denote the number of M attributes whose values equal one. Applying the
internal consistency rule, the probability that x increases or decreases by one equals:
(M − x)x
M(M − 1)
13

pf. For x to increase, the first attribute must be one of the M − x attributes with value
zero, and the second attribute must belong to one of the x attributes with value one. These
events occur with probabilities M−xM
and xM−1
. The proof for the case in which x decreases
follows the same logic.
Given this lemma, we can infer two features of the dynamics. First, because the number
of ones is equally likely to increase or decrease, the process has no bias in either direction.
Second, agents who are very inconsistent, i.e. who have nearly equal numbers of zeros and
ones, relatively quickly become more consistent. In contrast, agents who are nearly consistent
may take relatively long to become fully consistent. In technical terms, we can describe the
process as an unbiased random walk in which the probability of movement slows near the
two absorbing states.
2.3 Force 2: Coordination, Social Conformity
We next describe a pure conformity model. This model underpins many of the culture mod-
els. For the conformity model, we define the payoff to agent j, f(aj, a−j), as the percentage
of other agents whose attributes match those of agent j averaged across all attributes:
f(aj, a−j) =
∑k 6=j∑M
i=1 δ(aji , a
ki )
NM
where δ(aji , aki ) = 1 if and only if aji = aki . In other words, δ = 1 if the agents’ values agree on
the attribute and zero if they do not. We refer to this as the conformity payoff function. In
the model, in each period, we randomly choose a pair of agents. Note that this differs from
the internal consistency rule in which we chose a pair of attributes. The first agent chosen
applies the social conformity rule:
Social Conformity Rule: The first paired agent randomly chooses an attribute and sets
the value of that attribute equal to the value that the other agent assigns to that attribute.
This rule converges to full conformity if the agents update asynchronously (Page 1997). Like
the internal consistency rule we established above, the social conformity rule also creates a
14

random walk. The next lemma applies to a single attribute version (M = 1) of the model.
The extension to the more general case is straightforward.
Lemma 2 Let M = 1 and let y denote the number of N agents whose values on the attribute
equal one. Applying the social conformity rule, the probability that y increases or decreases
by one equals:
(N − y)y
N(N − 1)
The proof follows that of the consistency model because the processes are equivalent revealing
a symmetry that can be made formal.
Observation: The internal consistency model applied to N agents with M attributes is
equivalent to the social conformity model applied to M agents with N attributes.
In other words, a one dimensional pure conformity model is equivalent to a multidimen-
sional pure consistency model. We now turn to the full model in which agents care about
both consistency and conformity.
2.4 The Forces Combined: The Consistent Conformity Model
In the combined model, we characterize the payoff function to an agent j, πj, as a convex
combination of the payoff functions of the first two models:
πj(aj, a−j) = αs(aj) + (1− α) f(aj, a−j)
where α ∈ [0, 1] denotes the relative weight on consistency. To model behavior we combine
the previous two rules to create a single parameter family of rules CC(p) where p denotes
the probability that the agent applies the internal consistency rule. The parameter p may
or may not equal α. As in the conformity model, in each period we randomly choose a pair
of agents. The first agent in the pair applies the following behavioral rule:
15

Consistent Conformity Rule CC(p): With probability p the activated agent applies the
internal consistency rule and with probability (1 − p) the activated agent applies the social
conformity rule.
Note that this construction makes the consistency and conformity models special cases of
this model, where CC(1) is the consistency model and CC(0) is the conformity model. The
equilibria given the payoff function described above are the same as the absorbing states
given our behavioral rule: all agents choose the same value for each attribute.12
The next lemma characterizes the dynamics of the class of CC(p) models. It states that
the probability that an agent increases the number of attributes with value one depends on
the number of attributes the agent sets to one (the consistency effect) and the number of
other agents’ attributes that equal one.
Lemma 3 Assume a population of N agents with M binary attributes and an agent whose
first x attributes take value one. Let Si equal the number of other agents in the population
who have value one on attribute i. The probability that x increases by one equals
px(M − x)
M(M − 1)+ (1− p) 1
M
M∑i=x+1
SiN − 1
,
and the probability that x decreases by one equals
px(M − x)
M(M − 1)+ (1− p) 1
M
x∑i=1
N − 1− SiN − 1
.
pf: The proof follows from the first two lemmas.
As in the two single force models, this dynamic bounces back and forth and slows near
the absorbing states. One important difference between this dynamic and the others is that
it has far fewer equilibria (absorbing states). To see why, recall that N is the number of
agents, M is the number of attributes, and A is the number of values per attribute. In
12Note that other behavioral rules, in particular a myopic best response adjustment process, in which anagent only switches an attribute’s value if it leads to a higher payoff, can produce inefficient equilibria aswell (Kuran and Sandholm 2008).
16

the Consistency Model there are AM equilibria, in the conformity model, AN equilibria, but
in the combined CC(p) model, only A equilibria. The fact that the Consistent Conformity
model has far fewer equilibria does not necessarily imply that those equilibria will take longer
to locate, but when we expose the dynamics we’ll see that this in fact the case.
Before we present our analytic results, an example is instructive to demonstrate the
tension between conformity and consistency. Suppose that two members of a society interact
in three distinct contexts. In each context, a person can take a fair action, F , that equally
splits resources, or take a utilitarian action, U , that produces a higher total payoff. Given
these assumptions, we can describe an agent by a vector of length three consisting of F ’s
and U ’s. Let’s call these agents John and Jeremy, and assign them the following initial
behavioral vectors:
John: (F, F, U)
Jeremy: (F,U, U).
Assume first that John and Jeremy apply the internal consistency rule. John may switch
his third attribute so that his vector of attributes becomes (F, F, F ). Jeremy, in contrast,
may switch his first attribute so that his vector becomes (U,U, U). John and Jeremy would
both achieve internal consistency and do so quickly.13 Or, suppose John and Jeremy apply
the social conformity rule. In this case, if John is activated first, and it is his second attribute
that is selected, then John would switch his second attribute to U so that his vector becomes
(F,U, U) The two agents have quickly reached conformity.
Now, assume that John and Jeremy apply both the internal consistency and the social
conformity rules. John might first switch to (F, F, F ). He may then meet Jeremy and switch
to (F,U, F ). However, he may then realize that he is being inconsistent and switch back to
(F, F, F ). Jeremy, meanwhile, may switch to (U,U, U) and then, aiming to conform, switch
back to (F,U, U). Eventually, both John and Jeremy will be consistent and conform with
one another but it would take much longer. Because conformity and consistency can pull in
13Note that John could also change to (F,U, U) or (U, F, U) given the internal consistency rule, but atsome point, he would have all three of his attributes taking the same value.
17

different directions, the time required to attain an equilibrium can be greatly increased.
3 Analytic Results
We now establish analytical claims on time to convergence. In this section we demonstrate
how the process of cultural signature creation may be lengthy by considering a model without
any errors, an assumption we relax in the next subsection. We compare the time to con-
vergence in the three models—pure consistency, pure conformity, and the combined CC(p)
model. We find that the combined model, necessary for cultural coherence, takes far longer
to converge. We also vary the weight of the two pure models within the CC(p) model, find-
ing that the greater the imbalance, the longer the convergence takes. We then introduce
errors and show that the stochastic equilibrium of the combined model produces much more
persistence of diversity than either of the two individual force models.
Often, time to convergence can serve as a proxy for complexity of underlying dynamics;
processes that take longer to converge have more interesting dynamics.14 Further, more
complex dynamic processes are more likely to amplify small errors and create persistent
heterogeneity. In our model, we find this to be true. In fact, time to convergence proves a
perfect correlate to error amplification.15
We consider the simplest interesting case: two agents, two attributes, and two values per
attribute (A = 2, N = 2, M = 2). This case proves sufficient to demonstrate two main
results: (1) the Consistent Conformity model takes longer to converge than either of the two
single force models, and (2) its equilibrium in the model with errors has greater dispersion.16
With two agents and two binary attributes, the systems can be in any one of sixteen
14In studies of large systems, such as entire societies, equilibria may not be attained in reasonable time.Thus, time to convergence merits attention on its own (Page 2008).
15The class of problems that we consider here has analogs in physics and computer science. Scholarsin those fields have analyzed time to convergence as the number of attributes or agents grows very large.Using techniques developed by Bouchaud et al. (1990), it can be shown that the time to convergence in theconsistency model is of order M2, and time to convergence in the conformity model with one attribute is oforder M2 (see appendix). The time to convergence for the Consistent Conformity Model can be shown toincrease in order N2M2 for p = 1/2 (Page et al. 2007).
16A similar analysis for the three binary attribute, two agent model demonstrates the same qualitativeresults with the quantitative findings exaggerated.
18

states which can be sorted into five categories: the two agents can be in conformity and
internally consistent (C&C), consistent but not conforming (CON), conforming but not
consistent (CRD), one agent can be consistent but the other not, what we call off by one
(OBO), or both can be inconsistent and lack conformity (NOT). Using the letters a and b
to denote distinct attribute values, in Table 1 we define each category and its probabilities,
given random assignment of attributes.
Table 1: States of the System
State Agents ProbConformed & (a,a) 1
8Consistent (C&C) (a,a)Consistent Not (a,a) 1
8Conformed (CON) (b,b)Conformed Not (a,b) 1
8Consistent (CRD) (a,b)Off By (a,b) 1
2One (OBO) (a,a)Not Conformed (a,b) 1
8Not Consistent (NOT) (b,a)
Consistency Model
In the consistency model, the equilibria consist of configurations in the sets C&C and CON .
We can calculate the probability that any one of the other states moves to those states.
For example, If the initial state is in OBO, then applying the internal consistency rule, the
probability of staying in OBO equals one half, and the probability of moving to C&C or to
CON equals one fourth. Similarly, if the initial state is NOT or CRD, then it moves into
OBO with probability one. We display this information diagrammatically in Figure 1.
Notice how the flow diagram shows the potential for bouncing back and forth in the
category OBO before reaching an absorbing state. That oscillation is limited in expected
duration, as we now show in a lemma.
19

Figure 1: The Dynamics of the Internal Consistency Rule
NOT
��
1
C&C
1��
OBO14
pp
12��
..14
CON
1
��
CRD
OO
1
OO
Lemma 4 With two agents and two attributes, the expected time to equilibrium for the
Internal Consistency Rule is 134
interactions.17
pf: Let TS denote the time (or expected time) to get to equilbrium from a given state. First,
note that TCON = TC&C = 0, since C&C and CON are absorbing states. Second note that
the time to reach an absorbing state from a state in CRD or NOT equals one plus the time
it takes to reach an absorbing state from OBO.
TCRD = TNOT = 1 + TOBO
We calculate the expected time to reach an absorbing state from OBO as follows: With
probability one half, the process takes only one time period. The other half of the time, the
process remains in OBO, which means the time to an absorbing state equals one plus the
time to an absorbing state from OBO. We can write this as follows:
TOBO = 12(1) + 1
2(1 + TOBO) = 1 + 1
2TOBO
Solving for TOBO yields that TOBO = 2. Therefore TCRD = TNOT = 3, so applying the internal
consistency rule, the expected time to attain an absorbing state, T ICR, equals T ICR =
18(0) + 1
8(0) + 1
8(3) + 1
8(3) + 1
2(2) = 13
4.
17Time is measured by the number of interactions (an interaction is one application of a rule) with eachinteraction taking one time step. Hence, time is really a measure of the iterations of the model irrespectiveof the computational complexity of the iteration.
20

Figure 2: The Dynamics of the Social Conformity Rule
NOT
��
1
C&C
1��
OBO14
pp
��
14
��
12��
CON1pp
CRD
1
XX
Conformity Model
We next construct a similar diagram for the dynamics created by the social conformity rule
(see Figure 2). Notice that the diagram above is identical to Figure 1 except that the states
CRD and CON have changed places. In light of that symmetry, it follows that the expected
time to an absorbing state in this model is also 134
interactions.
Lemma 5 With two agents and two attributes, the expected time to equilibrium for the Social
Conformity Rule is 134
interactions.
pf: follows from above.
CC(p) Model
Next, we consider the combined coordination/consistency model, or CC(p). In the diagram
below, we show the case where p = 12. The diagram for this model, Figure 3, combines the
diagrams for the previous two models. Notice that the only absorbing state (equilibrium) is
C&C. Using Figure 3, we can state the following claim.
Lemma 6 With two agents and two attributes, the expected time to equilibrium for the
CC(p) Rule is 178
+ 1p(1−p) .
21

Figure 3: The Dynamics of the Combined Rule where p = 12
NOT
��
1
C&C
1��
OBO14
pp
18
12�� 1
8 .. CON
12
��
12
nn
CRD
12
XX
12
JJ
pf: see appendix.
Our first claim follows from the previous three lemmas.
Claim 1 With two agents and two attributes, the expected time to equilibrium in the com-
bined model is strictly greater than either the social conformity or internal consistency models.
pf: Follows directly from Lemmas 4, 5, and 6.
We can also use Lemma 6 to establish a second substantive claim and corollary that
compare the time to convergence as we vary the probability that the consistency rule is
invoked:
Claim 2 In the CC(p) model, the time to convergence is minimized at p = 12.
Corollary 1 For p ∈ (0, 1), the time to convergence increases as p→ 0 or p→ 1.
pf: Straightforward from Lemma 6.
Given that we have equal numbers of agents and attributes, if the behavioral rule in-
cludes both conformity and consistency, the time to convergence is minimized when the two
forces are equally weighted. We can compare the expected time to equilibrium in the three
22
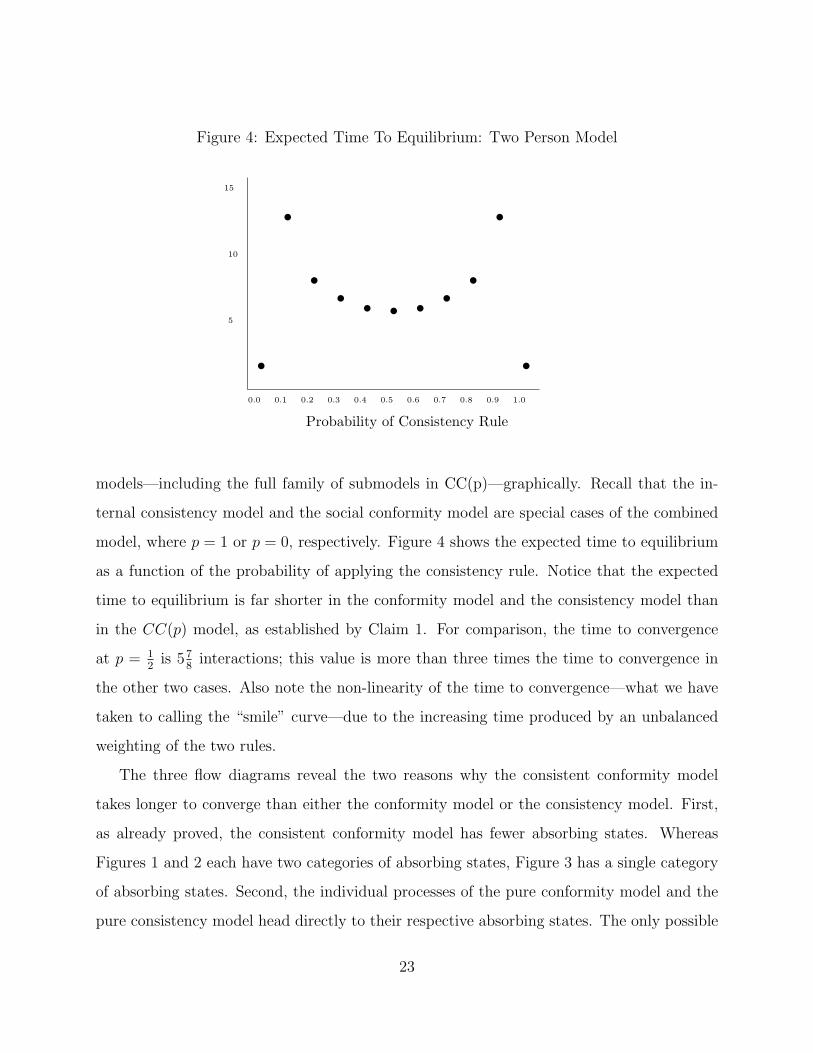
Figure 4: Expected Time To Equilibrium: Two Person Model
0.0 0.1 0.2 0.3 0.4 0.5 0.6 0.7 0.8 0.9 1.0
t
tt t t t t t t
t
t5
10
15
Probability of Consistency Rule
models—including the full family of submodels in CC(p)—graphically. Recall that the in-
ternal consistency model and the social conformity model are special cases of the combined
model, where p = 1 or p = 0, respectively. Figure 4 shows the expected time to equilibrium
as a function of the probability of applying the consistency rule. Notice that the expected
time to equilibrium is far shorter in the conformity model and the consistency model than
in the CC(p) model, as established by Claim 1. For comparison, the time to convergence
at p = 12
is 578
interactions; this value is more than three times the time to convergence in
the other two cases. Also note the non-linearity of the time to convergence—what we have
taken to calling the “smile” curve—due to the increasing time produced by an unbalanced
weighting of the two rules.
The three flow diagrams reveal the two reasons why the consistent conformity model
takes longer to converge than either the conformity model or the consistency model. First,
as already proved, the consistent conformity model has fewer absorbing states. Whereas
Figures 1 and 2 each have two categories of absorbing states, Figure 3 has a single category
of absorbing states. Second, the individual processes of the pure conformity model and the
pure consistency model head directly to their respective absorbing states. The only possible
23

delay that can occur in either of those single processes is the system remaining in state OBO.
In contrast, the consistent conformity model can move from CRD to OBO to CON and
back to OBO, and thus considerably slowing convergence.
Slow convergence can result from either a slow dynamic or complex interactions. In the
case of the CC(p) rule, it is the latter cause. When we add errors to the dynamic, these
complex interactions can enable those errors to accumulate resulting in greater variation in
the limiting distribution. In other words, the more complex dynamics of the CC(p) model
may result in greater intra-cultural heterogeneity. We make that connection more formal in
the next section.
3.1 The Persistence of Diversity
The inclusion of errors is a standard assumption in learning and conformity models. These
models still attain equilibria, but the equilibria are not longer static. Instead, the system
reaches a limiting equilibrium distribution over states (Young 1998). For example, with
error, the conformity model might spend 95% of the time in the conformity state and 5% of
the time in the category OBO. That would be an equilibrium distribution but not a static
equilibrium.
To capture errors, we assume that with some small positive probability, ε, an agent
randomly changes an attribute’s value rather than applying its behavioral rule. We focus
on how the forces for coordination and consistency singly and jointly magnify these errors.
One might expect that adding noise at a level ε would create an equilibrium distribution in
which approximately ε of the agents are out of equilibrium. And in the Consistency Model
and the Conformity Model, we find something close to that. In the Consistent Conformity
Model, however, the behavioral rule magnifies the noise term.
Consistency Model
We begin with the pure consistency model. It suffices to consider a single agent, which allows
us to reduce our five states to three. We can let CNS denote the union of the states CON
24

and C&C. These represent the states where the agents are consistent. We can then combine
the NOT and CRD into the state NCN . In this state, neither agent is consistent. This
gives a Markov Process defined over three states CNS, NCN , and OBO. We can write the
Markov Transition Matrix as follows:
T + 1CNS OBO NCN
TCNS 1− ε ε 0OBO 1
21−ε2
ε2
NCN 0 1 0
This gives three equations that characterize the dynamic equilibrium: PCNS = (1 −
ε)PCNS + 12POBO, POBO = εPCNS + 1−ε
2POBO + PNCN , and PNCN = ε
2POBO. Solving these
equations gives
PCNS = 11+2ε+ε2
, POBO = 2ε1+2ε+ε2
, PNCN = ε2
1+2ε+ε2
These last three equations characterize the dynamic equilibrium. The proportion of
agents in the consistent state, CNS, equals approximately 11+2ε
, which is approximately
1 − 2ε. In other words, ε error translates into 2ε of the population on average not in the
error-free absorbing state.
Conformity Model
We can perform a similar analysis for the conformity model. Let CDC equal the union of
the two states in which the two agents have confromed, CRD and C&C, and let NCD equal
the union of the states in which they have not, NOT and CON . We can write the Markov
Transition Matrix as follows:
T + 1CDC OBO NCD
TCDC 1− ε ε 0OBO 1
21−ε2
ε2
NCD 0 1 0
25

This matrix is identical to the one for the Consistency Model up to a relabeling of the
states. Therefore, the equilibrium equals
PCDC = 11+2ε+ε2
, POBO = 2ε1+2ε+ε2
, PNCD = ε2
1+2ε+ε2
These equations can be interpreted the same as the previous ones: introducing an error
of size ε produces an equilibrium that has on average 2ε of the agents not in the error-free
model’s absorbing state.
CC(p) Model
For the Consistent Conformity Model, we can write the Markov Transition matrix between
as follows:
T + 1C&C OBO CRD CON NOT
T
C&C 1− ε ε 0 0 0
OBO 14
(1−ε)2
p+ε−εp4
1−p−εp4
ε4
CRD 0 1− p+ εp p− εp 0 0CON 0 p+ ε+ εp 0 1− p− ε+ εp 0NOT 0 1 0 0 0
The equilibrium of this process can be written as follows:
PC&C = 11+4ε+ε2+αε+α−1ε
, POBO = 4ε1+4ε+ε2+αε+α−1ε
, PCRD = αε1+4ε+ε2+αε+α−1ε
PCON = α−1ε1+4ε+ε2+αε+α−1ε
, PNOT = ε2
1+4ε+ε2+αε+α−1ε
Where α = (p+ε−εp)(1−p+εp) which equals the ratio of the probability of moving from OBO to CON
to the probability of moving from OBO to CRD. By inspection, (α+ α−1) must be greater
than or equal to two.
Note first, and most importantly, that the proportion of time in the absorbing state equals
approximately, 11+(4+α+α−1)ε
. For small ε this is approximately 1 − (4 + α + α−1)ε. Thus,
an error of ε implies that, on average, at least 6ε of the population is not in the error-free
absorbing state. Not only does diversity persist, but at much higher rates than the level of
26

error. Note second that the higher α, the more time the system will spend in CON . The
lower α, the more time that the system will spend in CRD. Finally, note that setting p = 12
maximizes the time spent in the consistent conformity state (C&C). Figure 5 shows the
percentage of the time the system spends outside of state C&C as a function of p for a given
error level ε. If we let p go to 0 then α converges to ε and the system spends half of the
time outside of the state C&C. Similarly, if we let p go to 1 then α converges to 1ε, and the
system again spends half of the time outside of the state C&C. Thus, even for very small
errors, if one dynamic outweighs the other, the system can spend almost half of its time out
of equilibrium.
Figure 5: Distance to Conformed and Consistent Equilibrium: Error Model
0.0 0.1 0.2 0.3 0.4 0.5 0.6 0.7 0.8 0.9 1.0
t
tt t t t t t t
t
t5 ε
10ε
15ε
Probability of Consistency Rule
Except for the units on the y-axis, this figure matches figure 4 exactly. The equivalence,
modulo a rescaling, of the time to equilibrium and the distance to the perfectly conformed
and consistent equilibrium is an artifact of our model. But the correlation between the two
generally hints at an important insight: the longer the time to equilibrium, the more complex
the dynamics. The more complex the dynamics, the larger the potential effects of error.
We can summarize these results in the following claim:
27

Claim 3 With two agents and two attributes, the average proportion of time not spent in an
absorbing state in the social conformity or internal consistency models approximately equals
2ε. In the combined model, the average proportion of time not spent in an absorbing state is
at least 6ε and can approach one-half for any ε.
This claim establishes that small amounts of error produce substantial heterogeneity in
the combined model. It also establishes that the model is capable of producing agents who
are somewhat consistent and somewhat coordinated. A natural question to ask is whether
this result scales: Do similar findings hold with larger number of agents and attributes? We
provide a statistical answer to that question using numerical experiments.
4 Numerical Experiments
We now run numerical experiments to test the robustness of our results to an increase in the
number of agents and attributes. We varied the number of agents from two to one thousand,
the number of attributes from two to ten, and the number of values per attribute from two
to six.18
We present two sets of computational experiments. In the first set, we measure the time to
convergence in the error-free model. In the second set, we measure levels of consistency and
conformity in the models with errors. Figure 6 shows the time to convergence as a function
of p for a model with one hundred agents, ten attributes, and six values per attribute. The
results are averages of over fifty trials. All of the differences are statistically significant. The
arrows point to the values for p = 0 and p = 1, which are otherwise easy to overlook.
Our theoretical results suggested that the time to convergence should increase as p ap-
proaches zero and one. Here, we only see that phenomenon as p approaches one because
the number of agents is far larger than the number of attributes. The probability of ap-
plying the consistency rule must be very small before we would expect to see the time to
18As a robustness check, we wrote two separate programs, one in C and one in Repast (a java-basedmodeling toolkit). The models produced indistinguishable results. All results presented come from themodel written in C.
28

Figure 6: Time to Convergence in Number of Periods
0.0 0.1 0.2 0.3 0.4 0.5 0.6 0.7 0.8 0.9 1.0
p ←
w v w v x x xx
x
p→
4000
8000
12000
16000
Probability of Consistency Rule
convergence to increase given the greater need for conformity. All of the models converge,
but the magnitude of the time to convergence differs substantially. In the conformity model
and the consistency model, the system converges in a few hundred periods. The consistent
conformity model can take more than fifteen thousand periods to converge.
In the second set of experiments we test to see whether errors have a much larger effect
in the Consistent Conformity Model. To make this comparison we need some measures of
consistency and conformity. In constructing these measures, we refer back to notation we
used in constructing payoff functions. Recall that s(aj) equals the number of times the most
common attribute appears in agent j’s vector of attributes. We define pconsistent as follows:
pconsistent =
∑Mj=1 s(a
j)
AM
By construction, pconsistent takes on values in the closed interval between zero and one,
with perfectly consistent agents taking the value one. We similarly define pconformity to be
29

Table 2: Percentage of Conformity and Consistency (Models with Error)p = 0.0 p = 0.5 p = 1.0
pconformity pconsistent pconformity pconsistent pconformity pconsistentmean stdev mean stdev mean stdev mean stdev mean stdev mean stdev
noi
se
0 1 0 0.360 0.082 1 0 1 0 0.200 0.016 1 00.005 0.736 0.064 0.373 0.044 0.354 0.081 0.556 0.067 0.199 0.012 0.970 0.0090.01 0.585 0.052 0.376 0.030 0.299 0.037 0.510 0.033 0.200 0.012 0.946 0.0120.02 0.482 0.044 0.376 0.023 0.269 0.017 0.483 0.017 0.201 0.012 0.904 0.017
the average of the conformity payoff functions.
pconformity =
∑Mj=1 f(aj, a−j)
M
Thus, if the entire population has conformed, then the value of pcoordinate equals one.
Table 2 shows the average percent values and standard deviations of inter-agent value dif-
ference (pconformity) and intra-agent value difference (pconsistent) for each of the three
models. The data cover the last 1000 interactions of 100 runs with 100 agents, 10 features,
5 values per feature and a total run time of 5,000,000 interactions per run. Notice that
in alignment with theoretical predictions, with no errors, the CC(12) model converges to a
consistent and coordinated state as we expect, and the two pure models (the equivalent of
CC(0) and CC(1)) converge unproblematically, as predicted by the theory.
Most importantly, for the CC(12) model, the introduction of even the tiniest bit of noise
(0.005) leads to substantial heterogeneity both between agents (only 35.4% conform) and
within agents (55.6% are consistent), displaying far more diversity than in the other two
models (73.6% conform and 97% are consistent). A little noise has a much larger effect when
both forces operate.19 These computational experiments show that the insight generated in
the starker mathematical model—that the effect of noise when both forces are in play greatly
exceeds the sum of the individual effects—becomes amplified in larger systems. Thus, even
19Comparing results for cases with noise = 0.005, the p-value for a test of the difference of means forconformity for the p=0.0 and p=0.5 models is 2.23 × 10−304 and the p-value for a test of the difference ofmeans for consistency for the p=0.5 and p=1.0 models is 1.61× 10−831.
30

small amounts of error may produce substantial heterogeneity in a society of people who
wish to conform and be consistent.
While our model offers an explanation for the emergence of cultural signatures and in-
ternal cultural diversity, it remains consistent with models based upon Axelrod (1997) that
support differences between cultures. Two runs of any coordination game models (including
ours) are very unlikely to produce the same outcomes. Thus, if we treat one run of the
model as the United States, and a second run of the model as Germany, then we will nat-
urally see two different “cultures” emerge, each with its own signature. And because our
model includes conformity, we also see that its distinct signatures are meaningful and con-
sistent with the broader fabric of behaviors in that society. Also because of consistency, we
see the persistence of diversity within each culture. As different runs of the model produce
different outcomes, the model naturally provides an explanation for inter-cultural diversity—
differences in initial conditions and different paths lead to diverse outcomes. Consistent with
Axelrod (1997), even when these cultures interact, group distinctions persist.
5 Conclusion
In this paper, we construct a model that produces four hallmarks of culture: coordinated
behavior, coherent cultural signatures , substantial within culture diversity, and cross cultural
differences. That model combines a social drive to coordinate with an individual desire for
internal consistency. In our analysis, we explore the dynamics of the model and show how
the combined forces for conformity and consistency result in greater complexity and longer
time to convergence than found in models of culture that consider only coordination.
We also find that varying the weights of the forces slows convergence and increases
diversity when the model includes error. This finding may help us to understand why some
cultures exhibit more diversity than others: if pressures to conform or be consistent are higher
or lower, we’ll see different levels of diversity. For example, in a society in which the relative
tendency to conform is high relative to the tendency to be consistent, people may be less
consistent but more similar. Thus, whether one culture appears more or less heterogeneous
31

depends on the type of questions asked in a survey. If survey questions ask about an existing
behavior, we’d expect a higher conforming society to appear less heterogeneous. However,
if the questions are hypothetical, the lack of consistency may give respondents a variety
of possible behaviors to apply in the novel context. Depending on the questions asked,
a less individualistic society, like Japan, could appear more heterogeneous than a highly
individualistic society like the United States.
Relatedly, the presence of more or fewer “errors” (such as propensities towards missteps,
misinformation, or confusion) in different systems would respectively promote or inhibit
diversity. We might then speculate that informational systems provide a crude proxy for the
transmission error of cultural traits. Closer relations between individuals would push in the
opposite direction.
As mentioned in the introduction, in our model, we ascribe meaning to the attribute
values. A worthwhile extension of this model would be to allow for the meaning of attribute
values to be endogenous, to be socially constructed. To accomplish that we could differen-
tiate between the set of actions on attributes and the values associated with those actions.
Meaning making would entail mapping actions into values. That meaning making must be
constrained in some way. If the maps could be arbitrary, than outsiders would not be capa-
ble of external validation of consistent cultural signatures. Thus, an extension must include
enough flexibility in meaning making to allow for substantial reinterpretations of actions but
at the same time, not so much flexibility that cultural signatures fail to exist. We hasten to
add that such a model would, among other results, probably produce greater intra-cultural
heterogeneity owing to the coordination on meaning that must also occur.
Our model also has implications for a range of organizational forms. Within corporations,
for example, people face incentives to conform as well as to be consistent, though for reasons
that differ slightly from those we described above. Relatedly, members of a political party
also desire conformity and consistency, and these two desires may result in the analogous
effects: differences within and between parties as well as coherent party ideologies. In a party
version of the model, attribute values would represent participants’ ideal points in policy or
32

preference space. The internal consistency rule would capture the individual desire for a
consistent ideology, and the social conformity rule would capture the collective desire for
party cohesiveness. The simplicity of our model means it could be reasonably extended in a
number of ways to be sensitive to any particular constraints in different contexts in which it
is relevant.
One implication of our results is that consistent cohesiveness cannot emerge without
top down encouragement or even enforcement.20 Within any organization or collection of
people, be it an interest group, a community organization, or an academic department, these
two forces probably operate. Absent strong central control, diversity should reign.21 This
finding agrees with what we see in the real world: few (if any) groups converge to a state of
consistent conformity, but meaningful cultural signatures do emerge.
Intra-group heterogeneity undoubtedly influences political and economic outcomes. Most
empirical studies of heterogeneity and it’s effects focus on ethnic or religious differences. Here,
we’re considering variations within such groups. So in our case, the lack of convergence, be
it in a society, a political, party, or an organization, may, on balance, be a good thing. It
may promote innovation in the form of cultural evolution. It may even be interpreted as
a form of dissent as individuals either conform of stick to their own lights. This tension
between conformity and consistency maps to related tensions between “exploiters versus
explorers”, “conformers versus nonconformers”, and “scroungers versus producers” and may
produce stability through variation (March 1991, Kameda and Nakanishi 2002, Boyd and
Richerson 1985, Rogers 1995, Nisbett and Ross 1980, Tindall 1976, Weick 1969, Campbell
1965, Axelrod and Cohen 2000, Roberts and Zuni 1964). Diverse societies may also better
produce knowledge and be more adept at problem solving and prediction (Wallace 1991, Page
2007). Overall, diverse societies may be more robust, as they have the potential to adapt to
new and changing circumstances (Bednar 2009). In contrast, societies that lack intra-cultural
diversity may be prone to collapse (Diamond 2005). Thus, the persistence of diversity in the
20As presented, the model considers random mixing and no central transmission of desired attributes.21Note that that control would need to be very strong, as our model shows a preponderance of incentives
to conform typically slows convergence.
33

face of two homogenizing forces may prove as serendipitous as it is paradoxical.
34

Appendix
Claim 4 The expected time to convergence for the consistency model with binary values and
M attributes for a random starting point is of order M2 periods.
pf: (Courtesy of Len Sander) Let x denote the number of attributes with value 1. Let Tx be
the time to convergence if at location x. Let mx be the probability of increasing or decreasing
the number of attributes with value 1. By the previous claim, these probabilities are equal.
After one time period, the expected time has to be one period less. Therefore, we have the
following equation:
Tx − 1 = mxTx+1 +mxTx−1 + (1− 2mx)Tx
This reduces to
−1 = mx[(Tx+1 − Tx)− (Tx − Tx−1)]
Recall from Claim 1 that mx = (M−x)xM(M−1)
. For large M we can approximate this as mx =
(M−x)xM2 . Let p(x) = x
M, so that mx = p(x)[1− p(x)]. We then can rewrite Tx+1 − Tx as
1
M· (T (p(x+ 1))− T (p(x))
1M
For large M , this converges to ∂T (p(x))∂p
. It follows that we can write the following approxi-
mation:
(Tx+1 − Tx)− (Tx − Tx−1) ∼1
M
[∂T (p(x))
∂p− ∂T (p(x− 1))
∂p
]Which in turn we can approximate as
1
M2
∂2T (p(x)
∂p
We can therefore approximate our initial difference equation as
35

−1 = p(x)[1− p(x)]1
M2
∂2T (p(x))
∂p
Rearranging terms and simplifying notation gives
∂2T (p)
∂p2= − M2
p(1− p)We also have that T (0) = T (1) = 0. The solution to this differential equation is
T (p) = M2
[p log(
1
p) + (1− p) log(
1
1− p)
]which completes the proof.
We can state a similar result for the conformity model.
Corollary 2 The expected time to convergence for the conformity model with binary values
and N agents converges for a random starting point is of order N2 periods.
pf: follows from our earlier observation of equivalence and the previous claim.
Proof of Lemma 6:
We can write the following equations.
TC&C = 0
TOBO = 1 + 14TC&C + 1
2TOBO + p
4TCON + (1−p)
4TCRD
TCON = 1 + (1− p)TOBO + pTCON
TCRD = 1 + pTOBO + (1− p)TCRD
TNOT = 1 + TOBO
By substitution, these equations imply that
TCON = 11−p + TOBO, and TCRD = 1
p+ TOBO
These in turn imply that
36

TOBO = 1 + 12TOBO + p
4(1−p) + (1−p)4p
+ 14TOBO
This reduces to
TOBO = 4 + (1−2p+2p2)p(1−p)
Substituting back into the other equations gives
TCON = 4 + (1−p+2p2)p(1−p) , TCRD = 4 + (2−3p+2p2)
p(1−p) , TNOT = 5 + (1−2p+2p2)p(1−p)
Therefore the average time to convergence equals
1
2
(4 +
(1− 2p+ 2p2)
p(1− p)
)+
1
8
(4 +
(1− p+ 2p2)
p(1− p)+ 4 +
(2− 3p+ 2p2)
p(1− p)+ 5 +
(1− 2p+ 2p2)
p(1− p)
)Which reduces to
178
+ 1p(1−p)
For the special case p = 12, these equations become
TOBO = 1 + 14TC&C + 1
2TOBO + 1
8TCON + 1
8TCRD
TCON = 1 + 12TOBO + 1
2TCON
TCRD = 1 + 12TOBO + 1
2TCRD
TNOT = 1 + TOBO
By substitution, these equations imply that TCON = TCRD = 2 + TOBO. Which in turn
implies that TOBO = 1 + 12TOBO + 1
2+ 1
4TOBO. This is an equation in a single variable,
TOBO. Solving gives equation gives TOBO = 6. Substituting back into the other equations
gives TCON = TCRD = 8 and TNOT = 7. Therefore the average time to convergence equals
12(6) + 1
8(8 + 8 + 7) = 57
8.
37

References
[1] Ajzen, Icek and Martin Fishbein. (1980). Understanding Attitudes and Predicting Social
Behavior. Englewood Cliffs, NJ: Prentice-Hall.
[2] Aronson, Elliot. (1999). “Dissonance, Hypocrisy, and the Self Concept.” In E. Harmon-
Jones and J. Mills (Eds.), Cognitive Dissonance: Progress on a Pivotal Theory in Social
Psychology (pp. 103-126). Washington, DC: American Psychological Association.
[3] Au, Kevin Y. (1999). “Intra-Cultural Variation: Evidence and Implications for Interna-
tional Business.” Journal of International Business Studies 30(4): 799-812.
[4] Axelrod, Robert. (1997). “The Dissemination of Culture: A Model with Local Conver-
gence and Global Polarization.” Journal of Conflict Resolution 41: 203-226.
[5] Axelrod, Robert and Michael D. Cohen. (2000). Harnessing Complexity: Organizational
Implications of a Scientific Frontier. Free Press: New York
[6] Bandura, Albert. (1977). Social Learning Theory. New York: General Learning Press.
[7] Banerjee, Abhijit. (1992). “A Simple Model of Herd Behavior.” Quarterly Journal of
Economics 107(3): 797-817.
[8] Barth, Frederick, ed. (1969). Ethnic Groups and Boundaries: The Social Organization
of Culture Difference. Boston: Little, Brown.
[9] Beauvois, Jean-Leon and Robert-Vincent Joule. (1996). A Radical Dissonance Theory.
London: Taylor and Francis.
[10] Bednar, Jenna. (2009). The Robust Federation: Principles of Design. Cambridge, UK:
Cambridge University Press.
[11] Bednar, Jenna and Scott E. Page. (2007). “Can Game(s) Theory Explain Culture? The
Emergence of Cultural Behavior within Multiple Games.” Rationality and Society 19(1):
65–97.
38

[12] Bernheim, Douglas (1994). “A Theory of Conformity.” Journal of Political Economy
102(5): 841-877.
[13] Bikhchandani, Sushil, David Hirshleifer, and Ivo Welch. (1992). “A Theory of Fads,
Fashion, Custom, and Cultural Change as Informational Cascades.” Journal of Political
Economy 100(5): 992-1026.
[14] Brock, William A. and Stephen N. Durlauf. (2006). “Identification of Binary Choice
Models with Social Interactions.” Journal of Econometrics 140(1): 52-75.
[15] Bouchaud, J-P, A. Georges, J. Koplik, A. Provata, and S. Redner. (1990). “Superdiffu-
sion in Random Velocity Fields.” Physical Review Letters 64: 2503-2506.
[16] Bowers, William J. (1968). “Normative Constraints on Deviant Behavior in the College
Context.” Sociometry 31(4): 370-385.
[17] Boyd, Robert and Peter J. Richerson. (1985). Culture and the Evolutionary Process.
Chicago: The University of Chicago Press.
[18] Calvert, Randall and James Johnson. (1998). “Interpretation and Coordination in Con-
stitutional Politics.” W. Allen Wallis Institute of Political Economy, University of
Rochester, Working Paper 15.
[19] Campbell, Donald T. (1965). “Variation and Selective Retention in Socio-Cultural Evo-
lution.” In Herbert R. Barringer, George I. Blankstein, and Raymond W. Mack (Eds.),
Social Change in Developing Areas: A Reinterpretation of Evolutionary Theory (pp.
19-49). Cambridge, MA: Schenkman.
[20] Cavalli-Sforza, Luigi Luca and Marcus W. Feldman. (1981). Cultural Transmission and
Evolution: A Quantitative Approach. Princeton, NJ: Princeton University Press.
[21] Centola, Damon, Juan Carlos Gonzalez-Avella, Victor M. Eguiluz, and Maxi San
Miguel. (2007). “Homophily, Cultural Drift, and the Co-Evolution of Cultural Groups.”
Journal of Conflict Resolution 51(6): 905-29.
39

[22] Darmofal, David. (2005). “Elite Cues and Citizen Disagreement with Expert Opinion.”
Political Research Quarterly 58(3): 381-395.
[23] Diamond, Jared. (2005). Collapse: How Societies Choose to Fail or Succeed. New York:
Viking.
[24] Durham, William H. (1991). Coevolution: Genes, Culture, and Human Diversity. Stan-
ford, CA: Stanford University Press.
[25] Durrett, Richard and Simon Levin. (2005). “Can Stable Social Groups be Maintained
by Homophilous Imitation Alone?” Journal of Economic Behavior and Organization
57(3): 267-286.
[26] Festinger, Leon. (1957). A Theory of Cognitive Dissonance. Evanston, IL: Row and
Peterson.
[27] Fisman, Raymond and Edward Miguel. (2007). “Corruption, Norms, and Legal En-
forcement: Evidence from Diplomatic Parking Tickets.” Journal of Political Economy
115(6): 1020-1048.
[28] Friedkin, Noah E. (1984). “Structural Cohesion and Equivalence Explanations of Social
Homogeneity.” Sociological Methods and Research 12(3): 235-61.
[29] Friedkin, Noah E. and Eugene C. Johnsen. (1997). “Social Positions in Influence Net-
works.” Social Networks 19(3):209-22.
[30] Gazzaniga, Michael S., ed. (1999). Conversations in the Cognitive Neurosciences. Cam-
bridge, MA: The MIT Press.
[31] Ginges, Jeremy, Scott Atran, Douglas Medin, and Khalil Shikaki. (2007). “Moral Bar-
riers on Rational Resolution of Violent Political Conflict.” Proceedings of the National
Academy of Science 104(18): 7357-7360.
[32] Graves 1970
40

[33] Hannan, Timothy H. (1979). “Expense-Preference Behavior in Banking: A Reexamina-
tion.” Journal of Political Economy 87(4): 891-95.
[34] Harmon-Jones, Eddie and Cindy Harmon-Jones. (2002). “Testing the Action-Based
Model of Cognitive Dissonance: The Effect of Action Orientation on Postdecisional
Attitudes.” Personality and Social Psychology Bulletin 28(6): 711-723.
[35] Henrich, Joseph. (2000). “Does Culture Matter in Economic Behavior? Ultimatum
Game Bargaining Among the Machiguenga of the Peruvian Amazon.” The American
Economic Review 90(4): 973-979.
[36] Henrich, Joseph, Robert Boyd, Samuel Bowles, Colin Camerer, Ernst Fehr, Herbert
Gintis, and Richard McElreath. ( 2001). “In Search of Homo Economicus: Behavioral
Experiments in 15 Small-Scale Societies.” The American Economic Review 19(2), Papers
and Proceedings of the Hundred Thirteenth Annual Meeting of the American Economic
Association: 73-78.
[37] Hofstede, Geert. (2001). Culture’s Consequences: Comparing Values, Behaviors, Insti-
tutions, and Organizations Across Nations. Thousand Oaks, CA: Sage Publications.
[38] Homans, George C. (1950). The Human Group. New York: Harcourt, Brace, and Com-
pany.
[39] Huesmann, L. Rowell. (1988). “An Information Processing Model for the Development
of Aggression.” European Journal of Personality 3(2): 95-106.
[40] Huesmann, L. Rowell. (1998). “The Role of Social Information Processing and Cog-
nitive Schema in the Acquisition and Maintenance of Habitual Aggressive Behavior.”
In Russell G. Geen and Edward D. Donnerstein (eds.), Human Aggression: Theories,
Research, and Implications for Policy (pp. 73-109). New York: Academic Press.
[41] Inglehart, Ronald. (1977). The Silent Revolution: Changing Values and Political Styles
Among Western Publics. Oxford: Princeton University Press.
41

[42] Inglehart, Ronald. (1997). Modernization and Postmodernization: Cultural, Economic,
and Political Change in 43 Societies. Princeton, NJ: Princeton University Press.
[43] Inglehart, Ronald and Christian Welzel. (2005). Modernization, Cultural Change, and
Democracy: The Human Development Sequence. Cambridge: Cambridge University
Press.
[44] Kameda, Tatsuya and Daisuke Nakanishi. (2002). Does Social/Cultural Learning In-
crease Human Adaptibility? Roger’s Questions Revisited. Japan: Hokkeido University.
[45] Kennedy, Rodney J. (1988). “The Intermediary and Social Distance in Western Torres
Strait.” In Marvin K. Mayers and Daniel D. Rath (eds.), Nucleation in Papua New
Guinea Cultures (pp. 87-103). Dallas: International Museum of Cultures Publication,
23.
[46] Kitts, James A., Michael W. Macy, and Andreas Flache. (1999). “Structural Learning:
Attraction and Conformity in Task-Oriented Groups.” Computational and Mathematical
Organization Theory 5(2): 129-45.
[47] Klemm, Konstantin, Victor M. Eguıluz, Raul Toral, and Maxi San Miguel. (2003).
“Nonequilibrium Transitions in Complex Networks: A Model of Social Interaction.”
Physical Review E 67(2): 1-6.
[48] Kuran, Timur. (1995). Private Truths and Public Lies: The Social Consequences of
Preference Falsification Cambridge, MA: Harvard University Press.
[49] Kuran, Timur and William Sandholm. (2008). “Cultural Integration and Its Discon-
tents.” Review of Economic Studies 75: 201-228.
[50] Liska, Allen E. (1975). The Consistency Controversy. New York: Wiley and Sons.
[51] Macy, Michael W., James A. Kitts, Andreas Flache, and Steve Benard. (2003). “Po-
larization in Dynamic Networks: A Hopfield Model of Emergent Structure.” In Ronald
42

Breiger, Kathleen Carley, and Philippa Pattison (Eds.), Dynamic Social Network Mod-
eling and Analysis: Workshop Summary and Papers (pp. 162-173). Washington, DC:
The National Academies Press.
[52] March, James G. (1991). “Exploration and Exploitation in Organizational Learning.”
Organization Science 2(1): 71-87.
[53] Marsden, Peter V. and Noah E. Friedkin. (1993). “Network Studies of Social Influence.”
Sociological Methods Research 22: 127-51.
[54] McGuire, William J. (1966). “Attitudes and Opinions.” Annual Review of Psychology
17: 475-514.
[55] McPherson, Miller, Lynn Smith-Lovin and James M. Cook. (2001). “Birds of a feather:
Homophily in Social Networks.” Annual Review of Sociology 27: 415-44.
[56] Miguel, Edward, Sebastian M. Saiegh, and Shanker Satyanath. (2008.) “National Cul-
tures and Soccer Violence.” NBER Working Paper number 13968.
[57] Minturn, Leigh and William W. Lambert. (1964). Mothers of Six Cultures: Antecedents
of Child Rearing. New York: Wiley.
[58] Nisbett, Richard E. (2003). The Geography of Thought: How Asians and Westerners
Think Differently ... and Why. New York: Free Press.
[59] Nisbett, Richard. E., and Lee D. Ross. (1980). Human Inference: Strategies and Short-
comings of Social Judgment. Englewood Cliffs, NJ: Prentice-Hall.
[60] North, Douglass C. (1990). Institutions, Institutional Change, and Economic Perfor-
mance. Cambridge: Cambridge University Press.
[61] Page, Scott E. (1997). “On Incentives and Updating in Agent Based Models.” Compu-
tational Economics. 10(1) 67-87.
43

[62] Page, Scott E. (2007). The Difference: How the Power of Diversity Creates Better
Groups, Firms, Schools, and Societies. Princeton, NJ: Princeton University Press.
[63] Page, Scott E., Leonard M. Sander and Casey M. Schneider-Mizell. (2007). “Conformity
and Dissonance in Generalized Voter Models.” Journal of Statistical Physics 128(6):
1279-1287.
[64] Page, Scott E. (2008). “Uncertainty, Difficulty, and Complexity.” Journal of Theoretical
Politics 20(2): 115-149.
[65] Pavlov, Ivan P. (1903). “The Experimental Psychology and Psychopathology of Ani-
mals.” In I.P. Pavlov: Selected Works. Honolulu, HI: University Press of the Pacific,
2001.
[66] Pelto, Gretel H. and Pertti J. Pelto. (1975). “Intra-Cultural Diversity: Some Theoretical
Issues.” American Ethnologist 2(1), Intra-Cultural Variation: 1-18.
[67] Roberts, John M. (1964). “The Self-Management of Cultures.” In Ward H. Goodenough
(Ed.), Explorations in Cultural Anthropology: Essays in Honor of George Peter Murdock
(pp. 433-54). New York: McGraw-Hill.
[68] Rogers, Everett M. (1995). Diffusion of Innovations, Fourth Edition. New York: Free
Press.
[69] Ross, Lee and Andrew Ward. (1995). “Psychological Barriers to Dispute Resolution.”
In M. Zanna (Ed.), Advances in Experimental Social Psychology 27 (pp. 255-304). San
Diego: Academic Press.
[70] Schelling, Thomas C. (1971). “Dynamic Models of Segregation.” Journal of Mathemat-
ical Sociology 1: 143-186.
[71] Sewell, Jr., William H. (1999). “The Concept(s) of Culture.” In Victoria E. Bonnell and
Lynn Hunt (Eds.), Beyond the Cultural Turn. New Directions in the Study of Society
and Culture. Berkeley: University of California Press.
44

[72] Simmel, Georg. (1955). Conflict and the Web of Group Affiliations. New York: The
Free Press.
[73] Simon, Herbert Alexander. (1982). Models of Bounded Rationality. Boston: MIT Press.
[74] Singer, Jerome E. (1966). “Motivation for Consistency.” In Shel Feldman (Ed.), Cogni-
tive Consistency. New York: Academic Press.
[75] Skinner, Burrhus F. (1974). About Behaviorism. New York: Random House.
[76] Thompson, Richard W. (1975.) “Gratification Patterns in Buganda: An Explanation of
Intra-Cultural Diversity.” American Ethnologist 2(1): 193-206.
[77] Tindall, Bruce A. (1976). “Theory in the Study of Cultural Transmission.” Annual
Review of Anthropology 5: 195-208.
[78] Tittle, Charles R. and Richard J. Hill. (1967). “Attitude Measurement and Prediction
of Behavior: An Evaluation of Conditions and Measurement Techniques.” Sociometry
30(2): 199-213.
[79] Van Overwalle, Frank and Karen Jordens. (2002). “An Adaptive Connectionist Model
of Cognitive Dissonance.” Personality and Social Psychology Review 6(3): 204-231.
[80] Wallace 1991
[81] Warner, Lyle G. and Melvin L. DeFleur. (1969). “Attitude as an Interactional Concept:
Social Constraint and Social Distance as Intervening Variables between Attitudes and
Action.” American Sociological Review 34(2): 153-169
[82] Wedeen, Lisa. (2002). “Conceptualizing Culture: Possibilities for Political Science.”
American Political Science Review 96(4): 713-728.
[83] Weick, Karl E. (1969). The Social Psychology of Organizing. Reading, MA: Addison-
Wesley.
45

[84] Whiting, Beatrice B., ed. (1963). Six Cultures: Studies of Child Rearing. New York:
John Wiley.
[85] Young, Peyton. (1998). Individual Strategy and Social Structure: An Evolutionary The-
ory of Institutions. Princeton, NJ: Princeton University Press.
[86] Young, Peyton and Mary Burke. (2001). Competition and Custom in Economic Con-
tracts: A Case Study of Illinois Agriculture.” American Economic Review 91(3): 559-
573.
46