Embed Size (px)
Citation preview

Paper ID #32834
Emergency Transition of Intro Communication and Design Course to RemoteTeaching
Mr. Clay Swackhamer, University of California, Davis
Clay is a PhD candidate at UC Davis working under the supervision of Dr. Gail M. Bornhorst in thedepartment of Biological and Agricultural Engineering. His research focuses on the breakdown of solidfoods during gastric digestion and the development of improved in vitro models for studying digestion.
Dr. Jennifer Mullin, University of California, Davis
Jennifer S. Mullin is an Assistant Professor of Teaching in the Department of Biological and AgriculturalEngineering. She has a doctorate in Engineering Education from Virginia Tech where she was the firstto graduate from the program. Her creative passion for teaching introductory engineering and designcoursework through a ”learn-by-doing,” hands-on approach is focused on inspiring student success andinnovation. From her many varied instructional and professional development experiences, she believesin the power of communication, collaboration and community for a brighter healthier future.
c©American Society for Engineering Education, 2021
Emergency Transition of Intro Communication and Design Course to Remote Teaching
Abstract Due to the COVID-19 induced campus closure in spring of 2020, a large enrollment introduction to engineering design course was offered remotely, for the first time, at the University of California, Davis. Emergency circumstances necessitated a rapid re-design of the quarter-long course, with little more than a week to prepare. Despite the instructor and team of graduate teaching assistants (GTAs) having no prior experience with emergency remote teaching (ERT), key decisions were made to ensure integrity of learning outcomes during transition of the project-based, highly interactive, hands-on course experience from in-person to fully online during the early months of the pandemic. The main challenges involved the use of virtual tools to lead students through the engineering design process, to support team collaboration, to aid in the construction and testing of functional prototypes and, ultimately, to host an online final design showcase for the 45 teams. Other top challenges involved pivoting the teaching and learning of physical computing technologies (i.e., Arduino, circuits and coding) through interactive synchronous studio sessions in lieu of hands-on, in-person studio sessions. Elements of course re-design efforts presented in this paper illustrate the course transition from in-person to emergency remote format. Mixed-method data collection included pre/post Engineering Design Self-Efficacy (EDSE) student survey (Carberry et al., 2010), mid-quarter anonymous student feedback and an end of quarter student reflection. Mid-quarter feedback survey responses highlighted students’ [n = 98] preference for the asynchronous modified lecture format and in-person studio (47%) followed by in-person lecture and studio (34%). Results of EDSE pre/post analysis indicated significant gains (p < 0.05) in students’ [n=134] sense of confidence and ability to be successful in conducting and communicating fundamental aspects of the design process yet raise questions about their motivation and anxiety. End of quarter student reflections [n=136] provided further insight into students’ attitudes towards their design, communication, and technology learning in the online course. Analytical comparison of EDSE survey results from an in-person (spring 2019) and remote (spring 2020) course offerings provide a reference point for exploring opportunities for virtual design courses.
Introduction This paper highlights the transition of a project-based, highly interactive, hands-on design course from in-person to fully online during the early months of the COVID-19 pandemic. Offered every fall, winter, and spring quarter since the fall of 2017, the ENG 003 Introduction to Engineering Design course fulfills an oral communication elective for undergraduate engineering majors at the University of California, Davis. While the 4-unit course targets lower division students enrolled in the College of Engineering (COE), juniors, seniors and students outside the majors comprise 20% or more of those who enroll. With a focus on improving student’s engineering communication skills, students also learn about digital technologies, the design process and relevant presentation formats such as elevator pitches,
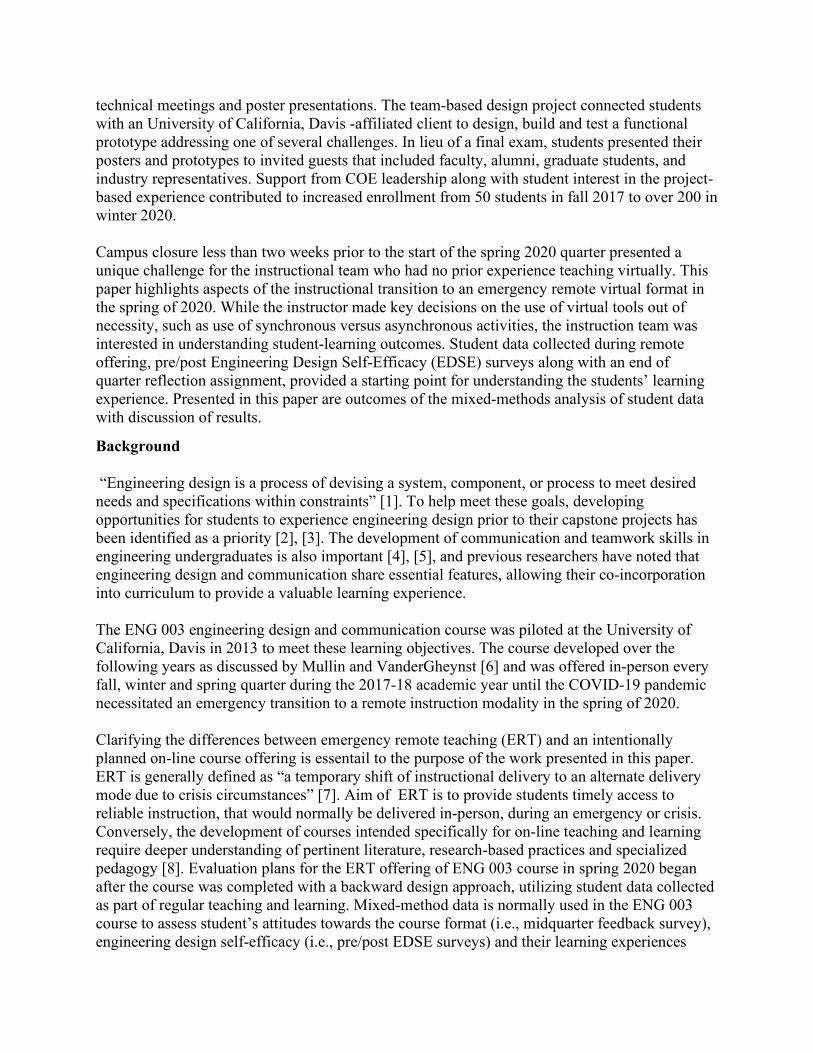
technical meetings and poster presentations. The team-based design project connected students with an University of California, Davis -affiliated client to design, build and test a functional prototype addressing one of several challenges. In lieu of a final exam, students presented their posters and prototypes to invited guests that included faculty, alumni, graduate students, and industry representatives. Support from COE leadership along with student interest in the project-based experience contributed to increased enrollment from 50 students in fall 2017 to over 200 in winter 2020. Campus closure less than two weeks prior to the start of the spring 2020 quarter presented a unique challenge for the instructional team who had no prior experience teaching virtually. This paper highlights aspects of the instructional transition to an emergency remote virtual format in the spring of 2020. While the instructor made key decisions on the use of virtual tools out of necessity, such as use of synchronous versus asynchronous activities, the instruction team was interested in understanding student-learning outcomes. Student data collected during remote offering, pre/post Engineering Design Self-Efficacy (EDSE) surveys along with an end of quarter reflection assignment, provided a starting point for understanding the students’ learning experience. Presented in this paper are outcomes of the mixed-methods analysis of student data with discussion of results.
Background “Engineering design is a process of devising a system, component, or process to meet desired needs and specifications within constraints” [1]. To help meet these goals, developing opportunities for students to experience engineering design prior to their capstone projects has been identified as a priority [2], [3]. The development of communication and teamwork skills in engineering undergraduates is also important [4], [5], and previous researchers have noted that engineering design and communication share essential features, allowing their co-incorporation into curriculum to provide a valuable learning experience. The ENG 003 engineering design and communication course was piloted at the University of California, Davis in 2013 to meet these learning objectives. The course developed over the following years as discussed by Mullin and VanderGheynst [6] and was offered in-person every fall, winter and spring quarter during the 2017-18 academic year until the COVID-19 pandemic necessitated an emergency transition to a remote instruction modality in the spring of 2020. Clarifying the differences between emergency remote teaching (ERT) and an intentionally planned on-line course offering is essentail to the purpose of the work presented in this paper. ERT is generally defined as “a temporary shift of instructional delivery to an alternate delivery mode due to crisis circumstances” [7]. Aim of ERT is to provide students timely access to reliable instruction, that would normally be delivered in-person, during an emergency or crisis. Conversely, the development of courses intended specifically for on-line teaching and learning require deeper understanding of pertinent literature, research-based practices and specialized pedagogy [8]. Evaluation plans for the ERT offering of ENG 003 course in spring 2020 began after the course was completed with a backward design approach, utilizing student data collected as part of regular teaching and learning. Mixed-method data is normally used in the ENG 003 course to assess student’s attitudes towards the course format (i.e., midquarter feedback survey), engineering design self-efficacy (i.e., pre/post EDSE surveys) and their learning experiences
with the technology, communication and team-based activities. These three data sources, from spring 2020, were analyzed to provide the instructional team a better understanding of students learning experiences during the ERT. The Engineering Design Self-Efficacy (EDSE) survey is assigned two times each quarter, in the first week and again in the last week of instruction, to provide the instructional team insight into student’s experience with engineering design and communications activities. EDSE is a 36-item instrument developed by Carberry et al., [9] based on the conceptual framework of self-efficacy [10]. Self-efficacy is generally defined as an individual’s judgement of their own capability to organize and execute courses of action for a certain task, it can be considered indicative of one’s belief in their ability to succeed. that Self-efficacy strongly correlates with response initiation, effort expenditure, and duration of response, and that these attributes may allow an individual to perform well and achieve success in a variety of circumstances [11]. Furthermore, previous studies have shown that self-efficacy is linked to academic achievement [12] and persistence [13] in undergraduate engineering students. Course Format All students enrolled in the ENG 003 course register for a lecture, two weekly 50 min sessions, led by the instructor. They also register for one of several studio sessions that met once a week for 110 min. Although the instructor is actively involved and oversees studio activities, two graduate teaching assistants (GTA) from the COE lead each session. During previous in-person offerings of the course, the studio sections were held in a specially-designed classroom space that was equipped with smartboards, projectors, moveable workbenches and extensive wall space and partitions for students to write on with erasable markers. The innovative room design provided the opportunity for a highly collaborative hands-on learning environment for the communication and technology activities. Open studio sessions along with instructor office hours were held several times a week for students to drop-in, as needed. During in-person studio sessions, students had access to a variety of open-source technologies used in the physical computing design project. Examples of the technology included Arduino, Raspberry Pi, and an assortment of electronic components (sensors, motors, LCD screens, breadboards, buttons, resistors, wires, etc.). Students received communication (i.e., announcements), assignment details (e.g., homework, presentation), course materials (copies of lecture and studio slides, rubrics, etc.) and grades through a Canvas site (Canvas Learning Management System, Instructure, Salt Lake City, Utah, USA). Finding suitable alternatives for the large lecture, hands-on studios and office hours was a priority during the course transition to ERT. The instructional team aimed to provide ample opportunity for student interaction with the instructor, GTAs and peers as well as approachable hands-on technology lessons. Prior experience with Canvas was an advantage during the transition to ERT, enabling a pivot of in-person lectures to instructor-narrated slides with prompts for participation credit, in lieu of in-person attendance and completion of in-person lecture handouts. Students had 48 hours to complete the lecture assignments, posted on Canvas at regularly scheduled meeting times. GTAs

led the synchronous studio sessions through Zoom (Zoom Video Communications, San Jose, CA, USA). The instructor attended all studio sessions to encourage in-person interactions and answer questions. Due to the oral communication course focus, students’ use of their video and microphone was strongly encouraged. Instructor and GTA office hours were held throughout the week for all students to attend. Opportunities for student interaction with the instructional team through virtual office hours were emphasized in studio and in lecture. These essential elements of the course for the in person and remote formats are highlighted in Table 1. Two other critical aspects of the course that required attention during the transition to the emergency remote format were the teaching and learning of the technology and final design showcase. A brief background on the design assignment is followed by emergency remote accommodations for technology and the final design showcase.

Table 1. ENG 003 Course elements for in-person and emergency remote formats. Format Lecture Studio Open-studio
In-person fall 2017 to winter 2020
Led by instructor in a large lecture hall 50 min sessions, twice per week Participation hand-outs provided and collected for attendance. GTAs provide support
Led by two GTAs 110 min session, once per week Limited to 24 students Instructor present at beginning of session to make announcements and answers questions
Led by GTAs Open to all students. Several hours were scheduled and offered each week. Instructor available to meet with students and provide support
Emergency remote spring 2020
Asynchronous Led by instructor through Canvas Narrated slides with reflection prompts for participation assignment (for credit) Posted at regularly scheduled lecture times Completion of response to prompts (text box) within 48 hours
Synchronous Led by two GTAs through Zoom 110 min session, once per week Limited to 24 students Instructor present at start of each session to interact with students, make announcements Students provided copy of slides in advance through Canvas
Synchronous Instructor and GTA Office hours held through Zoom Open to all students. Several hours were scheduled and offered each week.
Physical Computing Design Solutions for Elders and their Caregivers The open-ended team-based design project Physical Computing Design Solutions for Elders and their Caregiver provided students opportunities to practice communication and team skills while further developing hands-on problem-solving skills. This project, developed by the instructor in collaboration with the University of California, Davis Betty Irene Moore School of Nursing’s Family Caregiving Institute, was intended to promote human-centered design concepts. All
students, regardless of prior coursework, had opportunities to learn basic electronics, computer programming and prototyping techniques to apply to their functional “proof of concept” prototypes. Technical knowledge, skills and achievement were not graded; students were encouraged to be resourceful by using open-source information and in seeking peer and GTA support. Participation in course activities and project-related communication assignments constituted 75% of student’s final grades in the course. The Oral Communication VALUE rubric developed by American Colleges and Universities [14] informed evaluation of the communication assignments. Student teams of 3 to 4, assigned in the second week of the quarter, selected one of several design challenges provided. The team project, structured around a series of communication milestones, culminated with a Final Design Showcase event. Multidisciplinary teams presented their functional prototypes to university-affiliated guests (alumni, faculty, graduate students, university staff, etc.) and the showcase event in place of a final exam. Guest evaluators provided teams with feedback and score using rubric. Technology and Prototyping
- In-person format: Students were provided with a library of electronic components which included microprocessors in various form factors (Arduino Uno, Arduino Nano, Arduino Lilypad) and the Raspberry Pi B+ microcomputer in addition to the necessary peripherals. During open studio hours students were encouraged by GTAs to use these devices to build a functional prototype. In the studio, 6 movable tables were available for use by student teams, with each table close by a smartboard for collaborative coding, brainstorming, presentation development, and other team activities. Rollable white-boards, dry erase markers, and erasers were also provided to encourage collaboration. Each team submitted a request for a technology kit, which were assembled by GTAs, and included components desired by student teams to enable prototyping activities outside of the studio room. A kit typically consisted of one Arduino or Raspberry Pi, a power cable, an HDMI cable in the case of the Raspberry Pi, assorted sensors and actuators such as a Raspberry Pi camera, temperature and humidity sensors, tilt sensors, force sensitive or photosensitive resistors, and miscellaneous components such as resistors, buttons, light-emitting diodes, and wires. For prototyping, students were provided with access to 3D printing and laser cutting resources, furnished by the University of California, Davis Engineering Student Design Center. Students were required to attend training sessions to use these resources.
- Emergency remote format: Students were provided access to a site-based classroom in Tinkercad circuit simulation (https://tinkercad.com, Autodesk, San Rafael, CA, USA). The Tinkercad classrooms were managed by GTAs who had access to student’s workspace. GTAs provided students support and feedback through this workspace. Using the Tinkercad simulator, students were able to create and troubleshoot Arduino code and electronic circuits involving variety of sensors (e.g., photosensitive resistors, temperature sensors, etc) input, and output components (e.g., push buttons, servo motors, piezo buzzer, etc.). Students used this platform in synchronous studios, on collaborative team activities, and for studio homework assignments.. GTAs provided support for students in open office hours as well as step-by-step videos for on-demand help. In the fourth week

of the course, Arduino starter kits (https://store.arduino.cc/usa/arduino-starter-kit, Arduino LLC, Turin, Italy) were mailed to students to enable them to complete the design project. Kits mailed to students were theirs to keep after completion of the course, technical assignments shifted to encourage students to use physical components of the kit. For conceptual prototyping (i.e., enclosure to hold electronics), student design teams were encouraged to be resourcesful through use of household materials they had access to. Examples of these materials included cardboard, and up-cycled or repurposed devices such as canes, springs, plastic and wooden boxes, timers, hand sanitizer dispenser bottles, egg cartons, etc.).
Final Design Showcase The final design showcase, held during a two-hour final exam period, provided opportunities for university-affiliated guest evaluators to interact with students and provide feedback on team projects.
- In-person: The two-hour showcase event, held at various locations around campus, was widely attended. Student teams presented academic posters, printed by the instructional team, and functioning prototypes, while dressed in business attire. The format was a large, open floor plan showcase, where guest evaluators were free to peruse posters, explore design prototypes and interact with students. Evaluators were pre-assigned to evaluate three to five teams using the scoring rubric provided.
- Emergency Remote: The daylong virtual showcase was hosted through a password protected course website, specially designed by the COE Information Technology team. The website was open to guest evaluators between 9 AM and 9 PM on same day as the final exam. Student teams uploaded the following materials prior to the event: a poster, a 2 min. team pitch video, and a 1 min. video demonstrating prototype functionality. Guest evaluators accessed team’s materials through a landing page that held links to poster, pitch and demo videos, evaluation rubric and a Zoom room. Students were available, through Zoom room linked to the showcase site, to interact with evaluators in real time during a one-hour block during their final exam period.
While course format and other accommodations made during the emergency remote transition proved feasible in hindsight, instructional team sought to develop a grounded understanding of resultant student’s self-reported learning outcomes. Identification of specific insights to assist future instructional teams was a secondary goal. This analysis was guided by the following research questions:
Research questions The following research questions were investigated as part of this project:
1. Did students realize increases in their Engineering Design Self Efficacy (EDSE) during the in-person and/or remote offerings of the course, and if so, in which specific categories?
2. How did changes in EDSE during the in-person offering compare to those in the remote offering of the course? What could have contributed to these differences?

3. Did students feel that their communication, presentation, and engineering design skills
improved during the remote offering of the course? If so, in which ways?
4. What aspects of the remote course did students find beneficial? and/or challenging?
Methods Engineering Design Self-efficacy Survey A survey was administered to the students using an online form during the third week of instruction and again during the ninth week of instruction for both the in-person (spring 2019) and remote (spring 2020) offerings. The survey consisted of a validated, 36-item instrument developed by Carberry et al., [9] designed to assess Engineering Design Self-Efficacy (EDSE). This instrument has been used by previous researchers to assess longitudinal changes in EDSE in populations of students before and after taking engineering design courses [6], [15]–[17]. The following four main questions were presented in the survey:
1. Rate your degree of confidence (i.e., belief in your current ability) to perform the following tasks by recording a number from 0 to 100. (0 = cannot do at all; 50 = moderately can do; 100 = highly certain can do)
2. Rate how motivated you would be to perform the following tasks by recording a number from 0 to 100. (0 = not motivated; 50 = moderately motivated; 100 = highly motivated)
3. Rate how successful you would be in performing the following tasks by recording a number from 0 to 100. (0 = cannot expect success at all; 50 = moderately expect success; 100 = highly certain of success)
4. Rate your degree of anxiety (how apprehensive you would be) in performing the following tasks by recording a number from 0 to 100. (0 = not anxious at all; 50 = moderately anxious; 100 = highly anxious)
Under each main question the following nine specific tasks were presented:
• Conduct engineering design • Identify a research need • Research a design need • Develop design solutions • Select the best possible design • Construct a prototype • Evaluate and test a design • Communicate a design • Redesign
One hundred forty students enrolled in the spring 2020 remote course offering with 128 students completing both the pre and post EDSE surveys for a 91.4% response rate. Of the 180 students enrolled in the in-person spring 2019 course, 127 completed both the pre and post EDSE surveys for a 70.6% response rate. Personal identifiers were replaced with random subject identification

numbers to ensure anonymity, paired pre- and post-survey responses were analyzed (N=128 for the remote course offering and N=127 for the in-person offering). Paired t-test statistical analysis was carried out using MATLAB R2020a (Mathworks, Natick, MA, USA) on the matched pre- and post-survey responses to determine whether the student’s self-reported confidence, motivation, perceived success, and anxiety levels changed significantly during (1) the remote spring 2020 course offering, and (ii) the 2019 in-person offering. For the in-person offering and the remote offering. Results of this analysis were used to address specific research question #1 and are presented in Table 2. Follow-up analysis was conducted to determine whether the changes in student’s self-reported confidence, motivation, perceived success, and anxiety levels significantly differed between the in-person offering and the remote offering of the course. This was conducted by determining the delta in the response to each question (post survey value - pre survey value) for each student, and then calculating a 95% confidence interval for the change in response to each question for the in-person offering and the remote offering of the course. Results of this analysis were used to address the specific research question #2 and are presented in Figure 2. A mid-quarter, instructor developed anonymous survey was used to assess student preferences for remote or in-person instructional formats in the spring 2020 emergency remote offering. Although the students did not have a choice between in-person and on-line, the survey asked students to rate their preference for online and/or in-person instructional elements (i.e., lecture and studio). Of the total survey respondents [n = 98], 47% prefered online lecture and in-person studio, 34% had preference for in-person lecture and in-person studio with only 3% prefering in-person lecture and on-line studio. The survey asked students to comment on their choices, to discuss what was working well and what was not working well to facilitate their learning in the online environment, along with opportunity to provide solicited general feedback on the course. This survey was used to help address specific research questions #3 and #4. Additionally, a follow-up instructor-developed reflection survey was administered to students in the last week of instruction (i.e., week 10) for participation credit upon completion. Students were asked to respond to a series of open-ended questions covering self-reported gains in their communication, design and technology skills throughout the quarter. Students were asked how they felt about presenting and sharing their design project at the final design showcase. Responses were visualized using word frequency analysis (i.e., “wordclouds”, Figure 3), and sentiment analysis was conducted using VADER (Valence Aware Dictionary and sEntiment Reasoner) [18]. Specific responses deemed to be representative of the overall sentiment were presented. This survey was used to help address specific research questions #3 and #4.
Results and discussion
Student demographics The percentage of students enrolled in COE majors for both the remote spring 2020 and in-person spring 2019 course offerings are presented in Figure 1. For the remote offering, class standings were 15% first year, 35% second year, 26% third year, and 23% fourth year. For the

in-person offering, class standings of students consisted of 21% first year, 33% second year, 30% third year, and 16% fourth year.
Figure 1. Percentage of ENG 3 students by engineering major of study for students enrolled in the in-person spring 2019 (N=180) and remote spring 2020 (N=140) offerings.
Research question 1: Did students realize increases in their Engineering Design Self Efficacy (EDSE) during the in-person and/or remote offerings of the course, and if so, in which specific categories? Results showed statistically significant increases in students’ self-reported levels of confidence with respect to all sub-categories (Conduct engineering design, Identify design need, etc.) in both the in-person and remote offerings of the course. Averaged across all sub-categories, students’ confidence increased from 69.1 to 82.6 during the in-person course (on a scale of 0-100), and from 64.8 to 79.2 during the remote-course. Similarly, students reported significant increases in their level of motivation in all sub-categories for the in-person course offering. The average level of motivation across all sub-categories increased from 77.6 to 84.5 for the in-person course offering, and from 72.3 to 79.8 for the remote course offering. However, for the remote course offering there was no significant increase in motivation to evaluate and test a design. The lack of a significant gain in motivation to evaluate and test designs could be due to many factors and requires further investigation to substantiate any claims. From the instructors and GTAs subjective perspective, students may have benefitted from focused in-person guidance during the testing period, which typically occurs during the last few weeks of the quarter when students have a working prototype. With in-person offering of the course, the open studio sessions held in the final weeks were highly attended by teams seeking support with their prototype testing activities. Fatigue related to the ongoing pandemic may have
0 5 10 15 20 25Percent of total (%)
Other
Civil engineering
Mechanical engineering
Electrical engineering
Computer engineering
Aerospace engineering
Biological systems engineering
Computer science and engineering
Materials science and engineering
Environmental engineering
Biomedical engineering
Biochemical engineering In-person o�eringRemote o�ering
7.7 %2.9 %
15.5 %
12.7 %
21.8 %
9.2 %
7.7 %
8.5 %
1.4 %
7.7 %
2.8 %
3.5 %1.0 %
1.4 %
2.4 %
2.4 %
3.8 %
7.7 %
11.5 %
19.2 %
23.1 %
24.0 %
1.4 %0.5 %

also contributed to this lack of a significant increase in motivation. In general, the finding that students gained motivation with regards to evaluation and testing during the in-person course offering but not during the remote offering suggests that this aspect of EDSE may require extra consideration in remote teaching environments. Analysis results showed that students perceived success significantly increased across all sub-categories in both the in-person and remote course offering. Averaged across all sub-categories, students’ levels of perceived success increased from 71.7 to 82.1 for the in-person course offering, and from 69.0 to 80.5 in the online course offering. The last set of EDSE survey questions requested students to rate their degree of anxiety in performing a set of tasks. For this question, a lower reported level of anxiety on the after-survey than on the before-survey was indicative of a successful course experience. The average level of anxiety across all sub-categories decreased from 42.3 to 35.9 for the in-person course offering, and from 42.4 to 37.7 for the remote course offering. Students’ anxiety levels in the in-person course offering were significantly lower across all sub-categories in the after survey than in the before survey, except for the cases of “Select best possible design” and “Redesign.” For the remote course, student’s levels of anxiety were significantly lower in the post-survey than in the pre survey across all sub-categories. It is hypothesized by the instructional team that general levels of anxiety connected to the COVID-19 pandemic would be high, possibly washing out any effect of the course with regards to reducing anxiety toward completing engineering design tasks. It is not clear why students’ levels of anxiety with regards to “Selecting best possible design” and “Redesign” decreased significantly during the remote course offering but not in the in-person course. One hypothesis is that the remote course environment required each team of students to select the best design from multiple ideas and prototypes, as teams were not physically located together and that individual students produced protoypes in their own homes. This contrasts with the situation of the in-person course, where teams generally met face-to-face and produced only one prototype per team, per cycle of iteration. This weekly “down-selection” from multiple designs to a current best prototype could have given students more practice in design selection during the remote course, leadings to the observed reduction in the anxiety with regards to this task. Another possibility is that the reductions in anxiety that significantly decreased during the remote course offering but not over the in-person course offering could have been related to the theme of the design project. Specifically, caring for elders (the theme of the design project in the remote course) could have been a domain in which students felt less anxiety to redesign and select from multiple designs than in the domain of physical computing solutions for farmers (the theme of the design project in the in-person course). The impact of project theme on changes in EDSE could warrant future investigation. Changes in EDSE reported for both the in-person and remote offerings detailed in this study are similar to those in a previous study [6]. For example, Mullin & VanderGheynst [6] found that student confidence and motivation increased by approximately 10 to 15 points and anxiety decreased by 4 points from the before-survey to the after-survey, which are in good agreement with the results from the current study.
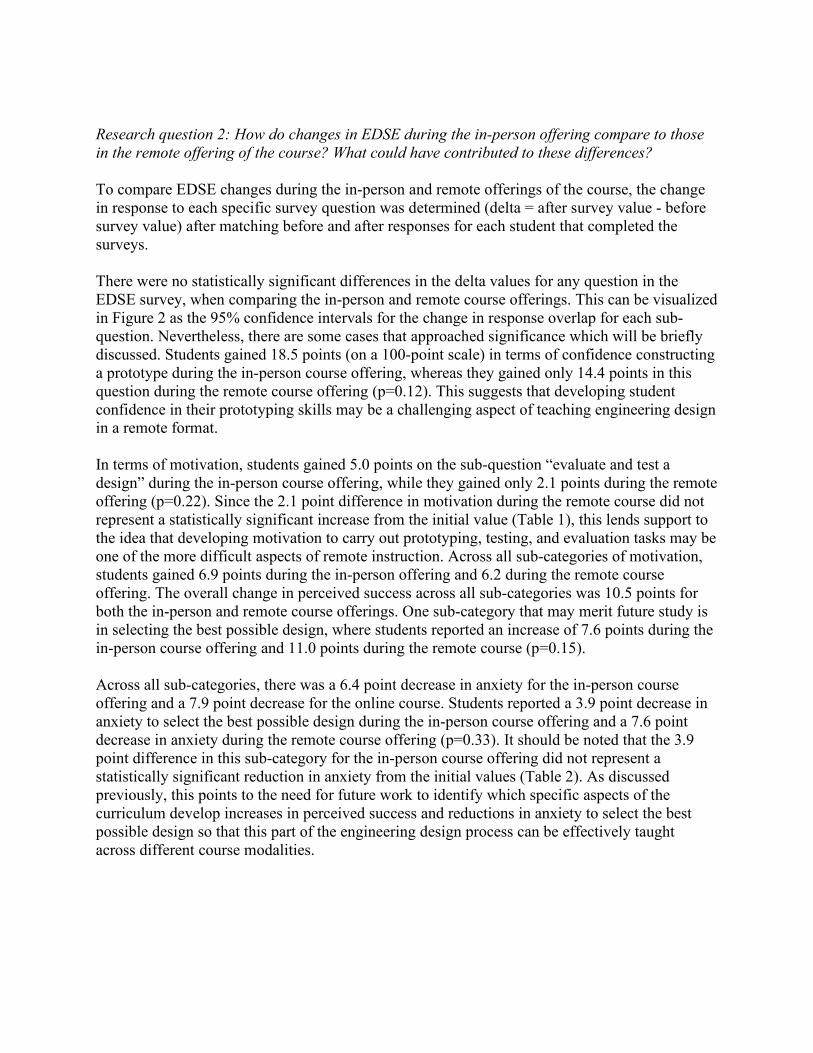
Research question 2: How do changes in EDSE during the in-person offering compare to those in the remote offering of the course? What could have contributed to these differences? To compare EDSE changes during the in-person and remote offerings of the course, the change in response to each specific survey question was determined (delta = after survey value - before survey value) after matching before and after responses for each student that completed the surveys. There were no statistically significant differences in the delta values for any question in the EDSE survey, when comparing the in-person and remote course offerings. This can be visualized in Figure 2 as the 95% confidence intervals for the change in response overlap for each sub-question. Nevertheless, there are some cases that approached significance which will be briefly discussed. Students gained 18.5 points (on a 100-point scale) in terms of confidence constructing a prototype during the in-person course offering, whereas they gained only 14.4 points in this question during the remote course offering (p=0.12). This suggests that developing student confidence in their prototyping skills may be a challenging aspect of teaching engineering design in a remote format. In terms of motivation, students gained 5.0 points on the sub-question “evaluate and test a design” during the in-person course offering, while they gained only 2.1 points during the remote offering (p=0.22). Since the 2.1 point difference in motivation during the remote course did not represent a statistically significant increase from the initial value (Table 1), this lends support to the idea that developing motivation to carry out prototyping, testing, and evaluation tasks may be one of the more difficult aspects of remote instruction. Across all sub-categories of motivation, students gained 6.9 points during the in-person offering and 6.2 during the remote course offering. The overall change in perceived success across all sub-categories was 10.5 points for both the in-person and remote course offerings. One sub-category that may merit future study is in selecting the best possible design, where students reported an increase of 7.6 points during the in-person course offering and 11.0 points during the remote course (p=0.15). Across all sub-categories, there was a 6.4 point decrease in anxiety for the in-person course offering and a 7.9 point decrease for the online course. Students reported a 3.9 point decrease in anxiety to select the best possible design during the in-person course offering and a 7.6 point decrease in anxiety during the remote course offering (p=0.33). It should be noted that the 3.9 point difference in this sub-category for the in-person course offering did not represent a statistically significant reduction in anxiety from the initial values (Table 2). As discussed previously, this points to the need for future work to identify which specific aspects of the curriculum develop increases in perceived success and reductions in anxiety to select the best possible design so that this part of the engineering design process can be effectively taught across different course modalities.

Table 1: Results from EDSE survey administered in the second week of the course (before or pre-survey) and in the 10th week of the course (after or post-survey) for the in-person offering (spring 2019) and remote offering (spring 2020). After matching before-survey and after-survey responses for individual students, significance of differences (before vs. after) were determined using paired t-tests (*** indicates p<0.001), ** indicates p<0.01, * indicates p<0.05, and NS indicates Not Significant). Means are shown ± standard deviation.
In-person course (spring 2019) Remote course (spring 2020)
EDSE Survey question Before After p Before After p
Rate your degree of confidence
(i.e., belief in your current ability) to
perform the following tasks:
Conduct engineering design 65.6±19.2 81.2±14.8 *** 61.9±21.5 78.6±15.8 *** Identify design need 69.2±17.7 83.7±14.7 *** 65.0±20.2 79.2±15.3 *** Research design need 74.7±16.5 83.7±15.5 *** 66.2±20.5 78.4±16.1 *** Develop design solutions 68.3±17.7 83.2±12.8 *** 62.6±19.5 78.5±14.3 *** Select best possible design 67.7±19.9 80.8±15.2 *** 62.5±20.4 78.0±14.3 *** Construct prototype 63.2±21.7 81.7±16.5 *** 64.0±23.3 78.4±18.2 *** Evaluate and test design 72.1±20.4 82.0±15.7 *** 67.8±21.2 79.1±15.2 *** Communicate design 70.5±20.3 83.8±15.7 *** 65.6±24.0 81.6±15.7 *** Redesign 70.9±18.0 83.4±13.8 *** 67.7±20.7 80.6±14.7 ***
Rate how motivated you would be to
perform the following tasks:
Conduct engineering design 80.3±17.8 85.0±15.8 ** 74.0±18.2 81.3±15.7 *** Identify design need 77.6±19.3 86.0±14.0 *** 72.5±21.0 78.9±17.4 *** Research design need 73.9±20.2 80.9±16.5 *** 68.9±21.9 75.4±20.3 *** Develop design solutions 79.0±16.8 86.9±14.3 *** 75.5±18.7 82.8±15.7 *** Select best possible design 80.2±18.3 86.5±14.2 *** 75.7±18.6 82.1±15.8 *** Construct prototype 81.4±18.8 87.3±16.2 *** 77.7±20.2 81.9±18.9 * Evaluate and test design 80.1±17.6 85.1±15.9 ** 76.8±20.3 78.9±17.4 NS Communicate design 73.9±23.0 83.2±16.6 *** 69.5±23.9 78.6±18.0 *** Redesign 72.3±22.1 79.8±19.0 *** 71.3±21.3 78.1±17.6 ***
Rate how successful you would be in performing the
following tasks:
Conduct engineering design 70.8±18.2 82.0±15.0 *** 66.9±18.0 78.5±14.9 *** Identify design need 72.5±17.4 83.1±14.1 *** 67.1±18.6 77.7±15.3 *** Research design need 76.5±17.1 82.4±14.8 *** 68.9±18.5 75.9±16.7 *** Develop design solutions 71.7±17.3 82.2±13.7 *** 67.6±18.6 79.1±15.2 *** Select best possible design 72.9±20.1 80.5±15.0 *** 65.5±19.5 76.6±15.7 *** Construct prototype 68.4±19.8 81.3±17.1 *** 67.7±20.3 78.3±18.4 *** Evaluate and test design 72.5±18.7 82.6±15.0 *** 69.5±19.0 79.4±15.3 *** Communicate design 70.9±19.6 84.6±14.3 *** 67.8±19.9 78.4±16.0 *** Redesign 69.0±18.8 80.5±15.8 *** 66.9±20.1 78.8±14.7 ***
Rate your degree of anxiety (how
apprehensive you would be) in
performing the following tasks:
Conduct engineering design 42.0±30.1 34.8±29.8 ** 42.9±27.9 32.8±24.3 *** Identify design need 38.9±28.3 32.6±28.5 * 38.4±27.6 32.0±24.7 ** Develop design solutions 41.2±28.9 33.5±29.1 ** 41.3±28.1 32.3±25.1 *** Select best possible design 42.5±29.7 38.7±30.5 NS 43.8±28.5 36.3±26.2 ** Construct prototype 46.1±30.3 37.3±30.5 ** 41.1±28.3 33.8±27.1 ** Evaluate and test design 40.8±27.8 35.1±29.2 * 37.2±27.9 31.6±26.2 * Communicate design 44.5±30.8 37.1±30.6 * 47.0±30.0 39.1±27.4 ** Redesign 42.4±29.0 37.7±32.3 NS 40.9±26.9 31.2±24.4 ***

Wu et al., [19] evaluated a project-based engineering design course delivered in both in-person and online formats and surveyed students to determine which types of course materials they considered valuable. Overall, it was found that students enrolled in the remote course rated homework assignments as more valuable as compared to students in the in-person format (p=0.047). This finding suggests that during remote instruction students may view their home as a primary location for learning, as compared to viewing the learning process as a series of activities that exist predominantly within the physical classroom. This provides context for the current study with results showing that students experienced statistically significant reductions in anxiety with regards to selecting the best possible design and redesigning only during remote instruction. It is hypothesized that carrying out these aspects of the engineering design process at homemay lead students to report lower anxiety during the remote course offering. The remote course analyzed in the current study ran during the months of March-June 2020 which coincided with a period of anxiety for many individuals due to the COVID-19 pandemic. Because of this, strategies for practicing patience with regards to the learning process were discussed and emphasized during weekly meetings of the instructional team. In general, this sense that all parties were doing their best despite the difficult situation fostered a collegial atmosphere which could have been the underlying basis of the apparent strengths of the remote course toward reducing student anxiety in selecting the best possible design and redesigning. The importance of developing a positive learning environment in the context of engineering design [20], [21] and communication [22] courses has been discussed by previous researchers. dashed line for the in-person course offering and as a vertical gold dashed line for the remote course offering.
Research question 3: Did students feel that their communication, presentation, and engineering design skills improved during the remote offering of the course? If so, in which ways? To further understand the students learning experience, an open-ended reflection assignment, developed by the instructor, was administered during the last week of instruction. Responses (N=134) were analyzed using a mix of quantiative and qualitative assessment. The question promts are shown in Figure 3. Word frequency analysis visualizations (i.e., “wordclouds”, Figure 3 A1, B1, and C1) were generated by agregating responses and removing words less than 5 letters in length in addition to words in the prompts that were commonly repeated in the first phrase of students’ responses, for example, “presentation”, “skills”, and “quarter.” A preliminary sentiment analysis of responses was carried out using the VADER algorithm [18], a general purpose, rule-based model for sentiment analysis that has been used by previous research to analyze student responses to course feedback questions [23]–[26]. This method assigns scores ranging from -1 (very negative sentiment) to +1 (very positive sentiment) based on a standard lexicon developed using over 90,000 human-provided ratings of sentiment in natural language. Histograms of VADER sentiment score from responses to each questions are shown in Figure 3 A2, B2, and C2. For VADER analysis, words less than two letters in length and punctuation were removed, but words in the question prompts were not removed.

Lastly, follow-up analysis was carried out by determining the most frequent 3-grams (3-word phrases, Figure 3 A3, B3, and C3) and 5-grams (5-word phrases, Figure 3 A4, B4, and C4) in student responses. These responses were then assessed using the VADER algorithm and the most frequent phrases with non-zero scores were displayed. This step was taken to eliminate common respones with no clear sentiment (ex. “my design project” and “my communication and presentation skills”). The first question asked students whether their communication and presentation skills had improved over the quarter. Highly represented words in the responses included “comfortable,” “better,” and “learned.” These highly represented words reflected the qualitative assessment of the responses, which largely reported the positive experience of gaining presentation skills. Two responses that exemplified this are shown below:
• “Unless you’re in a leadership position, or you do stand-up comedy of some sort, it’s hard to have an audience to practice on. I really liked the content and what was presented to us and it allowed me to self reflect on the things I could do better.”
• “I believe my presentation skills improved a lot thanks to the multiple presentation practices and helpful feedback from the Tas [graduate teaching assistants].”
The average VADER score from all respones to this question was 0.74 with a standard deviation of 0.29, suggesting a very positive sentiment was expressed by students in their responses. Highly represented 3-grams included affirmatory phrases such as “skills have improved” and “improved this quarter,” and highly represented 5-grams included “skills have improved this quarter” and “my communication skills have improved,” lending support to the conclusion that students felt their communication and presentation skills improved through the course experience.

Figure 2: Comparison of EDSE survey results between the in-person (dark blue) and remote (gold) course offerings. After matching the before-survey (pre) and after-survey (post) responses for each student, the change in each category (final-initial) was determined. The mean change in response to each question is shown with a point and its 95% confidence interval represented by a whisker. The average change in response across all sub-categories of a certain question are shown using a vertical dashed line.
Rate your degree of con�dence (i.e. belief in your current ability) to perform the following tasks:
Δ response (after survey - before survey) Δ response (after survey - before survey)
Δ response (after survey - before survey) Δ response (after survey - before survey)
A. Rate how motivated you would be to perform the following tasks:B.
Rate how successful you would be to perform the following tasks:C. Rate your degree of anxiety (how apprehensive
you would be) in performing the following tasks:D.
Conduct engineering design
Identify design need
Research design need
Develop design solutions
Select best possible design
Construct prototype
Evaluate and test design
Communicate design
Redesign
Conduct engineering design
Identify design need
Develop design solutions
Select best possible design
Construct prototype
Evaluate and test design
Communicate design
Redesign
Conduct engineering design
Identify design need
Research design need
Develop design solutions
Select best possible design
Construct prototype
Evaluate and test design
Communicate design
Redesign
Legend:
In-person course o�ering
Average Δ response(In-person o�ering)
Average Δ response(Remote o�ering)
Remote course o�ering
-20 -15 -10 -5 0 5
0 5 10 15 20 25
Conduct engineering design
Identify design need
Research design need
Develop design solutions
Select best possible design
Construct prototype
Evaluate and test design
Communicate design
Redesign
0 5 10 15 20
-5 0 5 10 15

The second question asked students if their engineering design skills had improved over the quarter, and highly represented words were generally positive. These included learning-centric words such as “knowledge,” “process,” and “experience,” in addition to words that ostensibly related to how skills were acquired, including “prototype,” “arduino” and “circuits.” Many responses to this question discussed the skills that were learned, which included analyzing design challenges, generating possible design solutions, prototyping, and refining an existing design. Two representative responses are shown below:
• “I think they have improved in the sense of giving me a more methodical way of going about it. Learning about the engineering design process and iterations has given me insight on how to come up with better design solutions. Doing activities like defining problem statements, solutions, and constraints has also helped me evaluate validity of designs that I brainstorm.”
• “It [the course] introduced me to a number of tools such as a design matrix and just working in an engineering team environment.”
The VADER score from all respones to this question was 0.64 with a standard deviation of 0.29, suggesting a positive sentiment was expressed by students. Highly represented 3-grams included the affirmatory phrases “skills have improved,” “have improved through,” and “have improved because,” with common 5-grams including “engineering design skills have improved,” further supporting the finding that students felt their engineering design skills had improved. The final question asked students how they felt about presenting and sharing the design project with individuals outside of the course instructors and classmates. Highly represented words in responses to this question included positive indications such as “confident,” “comfortable,” “excited,” and “proud,” but also some that suggested apprehension, such as “nervous.” Qualitiative analysis of responses suggested that students felt they had strengthened their presentation skills in the class but still believed it would be emotionally taxing to present in front of individuals outside the course environment. Two illustrative responses are given below:
• “I would feel a bit nervous presenting and sharing my design project with others outside of this class. Although, I believe that after I start presenting for a bit, I could likely overcome that initial nervousness.”
• “I am okay with it, but I think it will feel more professional and slightly less comfortable just because it is someone you know a bit less. I feel like it will compel me to act even more professional than I was in Studio and probably choose my words more wisely.”
The VADER score from all respones to this question was 0.61 with a standard deviation of 0.40, suggesting an overall positive sentiment was expressed but with perhaps with higher variablity than the sentiment expressed in the previous questions. Highly represented 3-grams included “skills have improved,” “have improved through,” and “have improved because,” with common 5-grams including “engineering design skills have improved.” None of the top 5 most frequent 3- or 5-grams in the responses to any question had a negative VADER score, further reinforcing that the majority of student feedback expresssed positive sentiment. One advantage of this approach is that it allowed responses with negative scores to be automatically identified and then examined in more detail. One response with a negative sentiment score to question B was:

• “This was my first time ever learning about programming and physically building a model so it was a big introduction for me. Since I had no past experience in working with circuits and coding, it became challenging at some points and the whole online process made it difficult to have someone look at my model and figure what I’m doing wrong.”
This response describes difficulty in troubleshooting technical aspects of circuit building and coding, echoing findings from the EDSE results and sugesting that future researchers teaching engineering design in remote formats should carefully consider the provision of troubleshooting resources for students. Two responses to question C that had negative sentiment scores were:
• “I feel that I get nervous about presenting in front of other people. However, it is not to the degree where I feel too anxious to not want to do it.”
• “I feel somewhat nervous and confident at the same time.”
These responses exempify the mixed feelings students expressed with regards to presenting outside of the course environment, and suggest that future work could be needed to help students develop confidence in this area. Future work involving the analysis of student feedback could involve automated sentiment analysis tools in concert with discourse analysis [27]–[29] to better understand student needs, self-concepts, and learning outcomes, as proposed by previous researchers [30], [31].

Figure 3: Analysis of student responses to the open-ended course reflection survey questions. Word-frequency diagrams (i.e. “word clouds”) were generated for the aggregated responses to each question (A1, B1, and C1). The VADER algorithm was used to estimate the sentiment of student reseponses to each question, and histograms of these sentiment scores (N=134) are shown (A2, B2, and C2) with the mean sentiment score for each question indicated by a vertical dashed line. The most common 3-grams (3-word phrases) were extracted from student responses (A3, B3, and C3) along with the most common 5-grams (A4, B4, and C4).
Research question 4: What aspects of the remote course did students find beneficial? and/or challenging? Student responses from the mid-quarter feedback and end-of-quarter reflection instructor developed surveys were analyzed to identify which aspects of the course students found beneficial and/or challenging. With regards to preferred course format, the most popular option was for an asynchronous online lecture and in-person studio (47%), followed by in-person lecture and studio (34%). In an open response item, students commented on the flexibility of the
Do you feel that your communication and presentation skills have improved this quarter? If so, in what ways?
A2 B2 C2
A1 B1 C1
How do you feel about presenting and sharing your design project with others outside ofENG 003 instructors and classmates?
Do you feel that your engineering design skills have improved this quarter? If so, in what ways?
learnedspeaking
bettercomfortable
improve
believe
de�nitely
online
con�dent
group
communicate
practice
nervous
ideas
others
people
courseaudience
feedback
helpedmyself
talking
being
person become
contact
voice
camera
doing
futurelearnedprocess
course
prototype
arduino
better
project
somethingdi�erent
problem
de�nitely
designing
experience
knowledge
product
working
believe
circuits
improve
circuit
learning
coding
together
understanding
building designs
engineer
great
group
ideas
nervouscon�dent
comfortableproud
product
present
excitedunderstand
experience
di�erent
family
friends
ideasbelieve
de�nitelyexplain
feedback
greathappy interested
learned
presentation
projects
something
talking
worked
working
concept
doing
everyone
-1 -0.8 -0.6 -0.4 -0.2 0 0.2 0.4 0.6 0.8 1
VADER score
Perc
ent o
f res
pons
es (%
)
-1 -0.8 -0.6 -0.4 -0.2 0 0.2 0.4 0.6 0.8 1
VADER score
Perc
ent o
f res
pons
es (%
)
-1 -0.8 -0.6 -0.4 -0.2 0 0.2 0.4 0.6 0.8 1
VADER score
0
10
20
30
40
50
60
0
10
20
30
40
50
60
0
10
20
30
40
50
60
Perc
ent o
f res
pons
es (%
)
C3
C4
presenting and sharing 0.42
0.42
0.42
0.49
0.36
Most frequent 3-grams
26
13
11
8
8
Count VADER score
and sharing my
sharing my design
I feel con�dent
I feel like
0.42
0.42
0.42
0.42
0.48
Most frequent 5-grams
10
9
9
6
4
Count VADER score
sharing my design project with
presenting and sharing my design
and sharing my design project
about presenting and sharing my
proud of what my team
B3
B4
skills have improved
Most frequent 3-grams
0.48
0.48
0.36
0.48
0.48
45
13
12
11
8
Count VADER score
improved through this
I feel like
have improved through
have improved because
0.48
0.48
0.48
0.48
0.48
Most frequent 5-grams
38
11
11
10
6
Count VADER score
engineering design skills have improved
design skills have improved through
skills have improved through this
have improved through this course
design skills have improved because
A3
A4
skills have improved
Most frequent 3-grams
0.48
0.48
0.48
0.36
0.36
64
40
36
23
15
Count VADER score
improved this quarter
have improved this
I feel like
feel like my
0.48
0.48
0.48
0.48
0.36
Most frequent 5-grams
44
32
27
12
9
Count VADER score
and presentation skills have improved
skills have improved this quarter
presentation skills have improved this
my communication skills have improved
I feel like my communication
Question A: Question B: Question C:

remote lecture format as an advantage, as this allowed them to choose how to allocate their time between other classes and activities. Students who preferred in-person studio and lecture activities generally suggested that in-person interactions felt more authentic, and that more synchronous activities could reduce distractions that may be present in the home. Two responses that exemplified these sentiments were:
• “Public speaking should be done in person and practicing in person would be much better. Online lectures are better because it allows for those who have busier schedules to be more flexible.”
• “There are too many distractions at home and I find it easier to focus and concentrate in a classroom setting.”
Some students reported that they felt more confident speaking to a group of people via Zoom than in person, while others commented that the lack of in-person interactions reduced the fun of carrying out the engineering design process. In general, responses to the open-ended surveys revealed a mixed response to remote instruction, with some students expressing displeasure with the format and others pointing out its advantages. This suggests that future instructional teams should anticipate some students to be disappointed regardless of whether it is decided to offer a course in-person or remotely. Moreover, these survey responses highlight perceived downsides of each course format, awareness of which could allow instructors to make decisions that address the concerns of students who prefer one format over the other. First, care should be taken to ensure that students have ample opportunities for interactions with instructors and peers during online instruction, as a common criticism of the remote format was that it prevented the establishment of strong connection between members of the design teams that could have been forged throughout an in-person experience. Responses that exemplified this point included:
• “I think this class is going well other than the fact that studio is online. In person action is essential to facilitate bonding.
• “I think if studio was in-person I would be more time-efficient and get a better feel of how my teammates feel. You can only emphasize emotion so much online.”
Students noted the technical difficulty of building and troubleshooting circuits in video meetings, for example:
• “When we are trying to identify parts from the Arduino box, it is sometimes hard to let TA [GTA] see and this could be an easy thing when we are meeting in person.”
From the perspective of a GTA, helping students to identify errors in code or in the wiring of electrical circuits that arose when carrying out the open-ended design challenge was a challenging aspect of the remote course format. In a similar sense, it was difficult to determine the level of comfort of students with regards to these technical aspects of the design and prototyping process. During in-person instruction, observing a student build a circuit or write code in real time can be a source of important insights such as the time taken to select a specific component from multiple similar components in a box, the frequency of errors in newly written code, and the ease with which a student explains their activities to a teammate. In a virtual setting, many of these interactions with the technology and with team members were carried out away from the student’s web camera. A potential recommendation for future instructors is to allow teams to occasionally conduct a working meeting with a GTA present as a consultant. This could help the instructional team more quickly identify when teams were struggling or when one

student was dominating a team’s design process and could potentially ease students anxiety toward aspects of the design process such as constructing a prototype, which was identified as an area of concern based on the EDSE survey data. Students noted difficulties establishing productive working environments in their homes, mentioning faulty web cameras, microphones, cluttered backgrounds, and other obstacles to learning:
• “I find the wifi at my house the most challenging and finding a place that is quiet while the whole family is home!”
With these challenges in mind, it may be useful to include links to university resources in course materials, and to inform GTAs of these resources. Students expressed divided opinions on the experience of learning the Arduino platform through remote instruction. Students appreciated the availability of Tinkercad, but also voice frustrations with translating their skills in circuit building developed using the simulator to real circuits with the Arduino in their kit. Students were appreciative of the video tutorials that were provided for building specific circuits using Arduino and requested that more videos were published.
Conclusion and recommendations In this paper the emergency transition of an introduction to engineering design and communication course from in-person to remote format was discussed. The course involved an open-ended, team-based, collaborative term project in which student teams developed an original prototype to solve a real-world problem of their choosing using a solution that incorporated physical computing, implemented using either Arduino or Raspberry Pi. A mixed-methods approach was used to assess the effectiveness of the transition, with data from a standard survey of Engineering Design Self-Efficacy (EDSE) [9] used in addition to open-ended surveys. Changes in EDSE were compared to results from an in-person offering of the same course the prior year. The main findings were that students reported significantly greater levels of confidence, motivation, and perceived success toward carrying out tasks in the engineering design process after taking the course, while also reporting decreased levels of anxiety. These significant differences in the pre-survey to post-course survey data were found in 34 of 36 sub-categories during the in-person course offering and 35 of 36 categories during the remote offering, demonstrating that students experienced gains in EDSE in both course formats. Students did not report increased motivation with regards to evaluating and testing a design during the remote course offering, suggesting the need for future study and course innovation in this area. Comparison of the changes in EDSE between the in-person and remote offerings of the course revealed no statistically significant differences between the two formats in any sub-category. Survey responses revealed that students believed their presentation and communication skills improved through the course, but expressed hesitancy when presented with the idea of presenting their design projects to individuals outside the course environment.

Students reported satisfaction with physical Arduino starter kits which were shipped to their local addresses, the availability of virtual office hours, an online Arduino simulator (TinkerCAD), and with instructional tutorial videos on constructing specific circuits. However, students also expressed frustration with technical and non-technical challenges of remote learning, including managing many assignments, attending lectures remotely, establishing productive working environments at home, and with communicating remotely with their design teams and with the instructional team. This data and discussion could help future researchers to transition engineering design courses to a remote environment. Due to the importance of teaching engineering design and communication, the success of instructional teams to develop and implement courses in these areas is critical to education of engineering undergraduates.

References [1] ABET, “Criteria for accrediting engineering programs,” 2020. [2] R. M. Marra, B. Palmer, and T. A. Litzinger, “The effects of a first-year engineering
design course on student intellectual development as measured by the perry scheme,” J. Eng. Educ., vol. 89, no. 1, pp. 39–45, 2000.
[3] A. F. Mckenna, G. E. Okudan Kremer, C. Plumb, H. Kyoung Ro, and A. Yin, “Approaches to Engaging Students in Engineering Design and Problem Solving Introduction,” Proc. Am. Soc. Eng. Educ. Annu. Conf. Vancouver, Canada, 2011.
[4] E. Seat, J. R. Parsons, and W. A. Poppen, “Enabling engineering performance skills: A program to teach communication, leadership, and teamwork,” J. Eng. Educ., vol. 90, no. 1, pp. 7–12, 2001.
[5] L. J. Shuman, M. Besterfield-Sacre, and J. McGourty, “The ABET ‘professional skills’ - Can they be taught? Can they be assessed?,” J. Eng. Educ., vol. 94, no. 1, pp. 41–55, 2005.
[6] J. S. Mullin and J. S. VanderGheynst, “An introductory design and communication course intended for all engineering majors takes it to the farm,” ASEE Annu. Conf. Expo. Conf. Proc., vol. 2018-June, 2018.
[7] C. Hodges, S. Moore, B. Lockee, T. Trust, and A. Bond, “The Difference Between Emergency Remote Teaching and Online Learning,” EDUCAUSE Review, 2020. [Online]. Available: https://er.educause.edu/articles/2020/3/the-difference-between-emergency-remote-teaching-and-online-learning.
[8] B. Means, M. Bakia, and R. Murphy, Learning Online: What Research Tells us About Whether, When, and How. New York: Routledge, 2014.
[9] A. R. Carberry, H.-S. Lee, and M. W. Ohland, “Measuring Engineering Design Self-Efficacy,” J. Eng. Educ., vol. 99, no. 1, pp. 71–79, Jan. 2010.
[10] A. Bandura, Social foundations of thought and action: A social cognitive theory. Englewood Cliffs: Prentice-Hall, NJ, 1986.
[11] R. Prabhu, S. R. Miller, T. W. Simpson, and N. A. Meisel, “Exploring the Effects of Additive Manufacturing Education on Students’ Engineering Design Process and its Outcomes,” J. Mech. Des. Trans. ASME, vol. 142, no. 4, pp. 1–11, 2020.
[12] P. H. Hsieh, J. R. Sullivan, D. A. Sass, and N. S. Guerra, “Undergraduate engineering students beliefs, coping strategies, and academic performance: An evaluation of theoretical models,” J. Exp. Educ., vol. 80, no. 2, pp. 196–218, 2012.
[13] J. P. Concannon and L. H. Barrow, “Men’s and women’s intentions to persist in undergraduate engineering degree programs,” J. Sci. Educ. Technol., vol. 19, no. 2, pp. 133–145, 2010.
[14] Association of American Colleges and Universities (AAC&U), “Inquiry and analysis VALUE rubric.” 2009.
[15] R. J. Morocz et al., “Relating student participation in university maker spaces to their engineering design self-efficacy,” ASEE Annu. Conf. Expo. Conf. Proc., vol. 2016-June, 2016.
[16] M. Tomko, R. L. Nagel, M. W. Aleman, W. C. Newstetter, and J. S. Linsey, “Toward understanding the design self-efficacy impact of makerspaces and access limitations,” ASEE Annu. Conf. Expo. Conf. Proc., vol. 2017-June, 2017.
[17] E. C. Hilton, M. Tomko, A. Murphy, R. Nagel, and J. S. Linsey, “Impacts on design self-

efficacy for students choosing to participate in a university makerspace,” Proc. Int. Conf. Eng. Des. ICED, pp. 1–10, 2018.
[18] C. J. Hutto and E. Gilbert, “VADER: A parsimonious rule-based model for sentiment analysis of social media text,” Proc. 8th Int. Conf. Weblogs Soc. Media, ICWSM 2014, pp. 216–225, 2014.
[19] L. L. Wu, C. Fischer, F. Rodriguez, and G. N. Washington, “Evaluation of online learning in a first-year engineering design course,” ASEE Annu. Conf. Expo. Conf. Proc., vol. 2018-June, 2018.
[20] H. Nguyen, L. L. Wu, G. N. Washington, K. Y. Lim, and C. Fischer, “Collaboration and design practices in first-year project-based engineering,” ASEE Annu. Conf. Expo. Conf. Proc., vol. 2020-June, 2020.
[21] R. R. DeLyser et al., “Creating a student centered learning environment at the University of Denver,” J. Eng. Educ., vol. 92, no. 3, pp. 269–273, 2003.
[22] J. Requena-carrión, F. Alonso-atienza, A. Guerrero-curieses, A. B. Rodríguez-gonzález, U. Rey, and J. Carlos, “Environment for Developing Communication Skills in Engineering Education,” Eng. Educ., pp. 783–786, 2010.
[23] H. Newman and D. Joyner, “Sentiment analysis of student evaluations of teaching,” in Artificial Intelligence in Education, 2018, pp. 282–286.
[24] T. Hixson, “Reactions vs. Reality: Using Sentiment Analysis to Measure University Students’ Responses to Learning ArcGIS,” J. Map Geogr. Libr., vol. 15, no. 2–3, pp. 263–276, 2019.
[25] G. S. Deo, A. Mishra, Z. M. Jalaluddin, and C. V. Mahamuni, “Predictive Analysis of Resource Usage Data in Academic Libraries using the VADER Sentiment Algorithm,” Proc. - 2020 12th Int. Conf. Comput. Intell. Commun. Networks, CICN 2020, pp. 221–228, 2020.
[26] O. B. Deho and W. A. Agangiba, “Sentiment analysis with word embedding : the case of double-track education system in Ghana,” Ghana J. Technol., vol. 3, no. 2, pp. 51–57, 2019.
[27] J. M. Case and G. Light, “Emerging methodologies in engineering education research,” J. Eng. Educ., vol. 100, no. 1, pp. 186–210, 2011.
[28] L. J. Anthony, M. F. Palius, C. A. Maher, and P. V. Moghe, “Using discourse analysis to study a cross-disciplinary learning community: Insights from an IGERT training program,” J. Eng. Educ., vol. 96, no. 2, pp. 141–156, 2007.
[29] K. Dunsmore, J. Turns, and J. M. Yellin, “Looking Toward the Real World: Student Conceptions of Engineering,” J. Eng. Educ., vol. 100, no. 2, pp. 329–348, Apr. 2011.
[30] R. K. Jena, “Sentiment mining in a collaborative learning environment: capitalising on big data,” Behav. Inf. Technol., vol. 38, no. 9, pp. 986–1001, 2019.
[31] R. Baragash and H. Aldowah, “Sentiment analysis in higher education: A systematic mapping review,” J. Phys. Conf. Ser., vol. 1860, no. 1, 2021.