Embed Size (px)
Citation preview

EmergencyDepartmentUtilization
Report2015


Emergency Department Utilization Report 2015
Agency for Health Care Administration Page i
Table of Contents
Table of Contents ........................................................................................................................................... i
Table of Figures ............................................................................................................................................. 1
Introduction .................................................................................................................................................. 1
Patient Characteristics .................................................................................................................................. 1
Volume Trends over Time ............................................................................................................................. 3
Inpatient Hospitalization ............................................................................................................................... 3
Patient Acuity ................................................................................................................................................ 5
Acuity Trends over Time ............................................................................................................................... 7
Top Medical Conditions ................................................................................................................................ 8
Geographic Variation in ED Use .................................................................................................................... 9
Appendix ..................................................................................................................................................... 12
Definition of Patient Acuity ......................................................................................................................... 21
ICD‐10 Transition Explanation .................................................................................................................... 22
Table of Figures
Figure 1. Pediatric ED Visits by Sex, Race/Ethnicity, Age Group, and Payer Group ..................................... 2
Figure 2. Adult ED Visits by Sex, Race/Ethnicity, Age Group, and Payer Group .......................................... 2
Figure 3. Total Visits by Payer 2012‐2015 .................................................................................................... 3
Figure 4. Inpatient Hospitalization Rate for Pediatric ED Visits by Patient Characteristics ......................... 4
Figure 5. Inpatient Hospitalization Rate for Adult ED Visits by Patient Characteristics............................... 5
Figure 6. Low Acuity Rate for Pediatric ED Visits by Patient Characteristics ............................................... 5
Figure 7. Mean Charges for Pediatric ED Visits by Acuity and Patient Characteristics ................................ 6
Figure 8. Low Acuity Rate for Adult ED Visits by Patient Characteristics ..................................................... 6
Figure 9. Mean Charges for Adult ED Visits by Acuity and Patient Characteristics ..................................... 7
Figure 10. Number of ED Visits Per Capita over Time by Acuity Level ......................................................... 8
Figure 11. Percentage of Visits Considered Low Acuity Compared to Uninsured Rate ............................... 8
Figure 12. Top Ten Most Common Medical Conditions for Outpatient ED Visits........................................ 9
Figure 13. Top Ten Most Common Medical Conditions for Inpatient Hospitalizations ............................... 9
Figure 14. ED Visits per 1,000 People by County ....................................................................................... 10
Figure 15. ED Visits by Urbanization Level and Median Household Income by County ............................. 11

Emergency Department Utilization Report 2015
This page intentionally left blank.
Emergency Department Utilization Report 2015
Agency for Health Care Administration Page 1 of 22
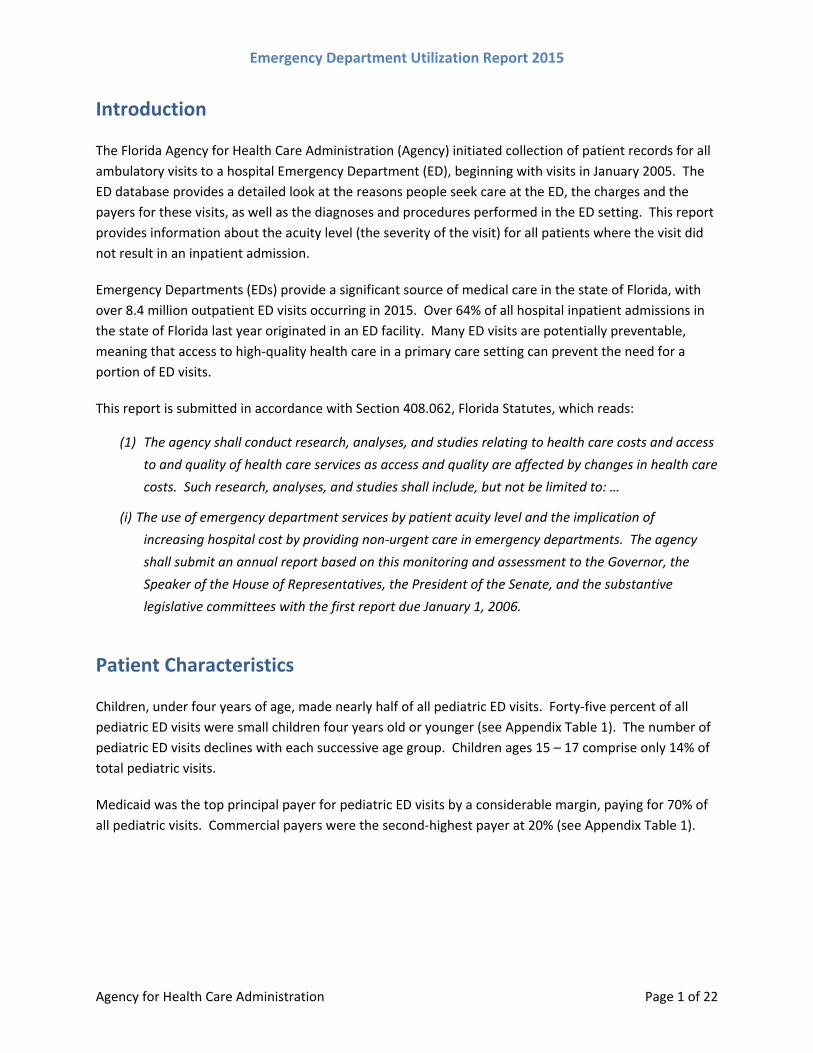
Introduction
The Florida Agency for Health Care Administration (Agency) initiated collection of patient records for all
ambulatory visits to a hospital Emergency Department (ED), beginning with visits in January 2005. The
ED database provides a detailed look at the reasons people seek care at the ED, the charges and the
payers for these visits, as well as the diagnoses and procedures performed in the ED setting. This report
provides information about the acuity level (the severity of the visit) for all patients where the visit did
not result in an inpatient admission.
Emergency Departments (EDs) provide a significant source of medical care in the state of Florida, with
over 8.4 million outpatient ED visits occurring in 2015. Over 64% of all hospital inpatient admissions in
the state of Florida last year originated in an ED facility. Many ED visits are potentially preventable,
meaning that access to high‐quality health care in a primary care setting can prevent the need for a
portion of ED visits.
This report is submitted in accordance with Section 408.062, Florida Statutes, which reads:
(1) The agency shall conduct research, analyses, and studies relating to health care costs and access
to and quality of health care services as access and quality are affected by changes in health care
costs. Such research, analyses, and studies shall include, but not be limited to: …
(i) The use of emergency department services by patient acuity level and the implication of
increasing hospital cost by providing non‐urgent care in emergency departments. The agency
shall submit an annual report based on this monitoring and assessment to the Governor, the
Speaker of the House of Representatives, the President of the Senate, and the substantive
legislative committees with the first report due January 1, 2006.
Patient Characteristics
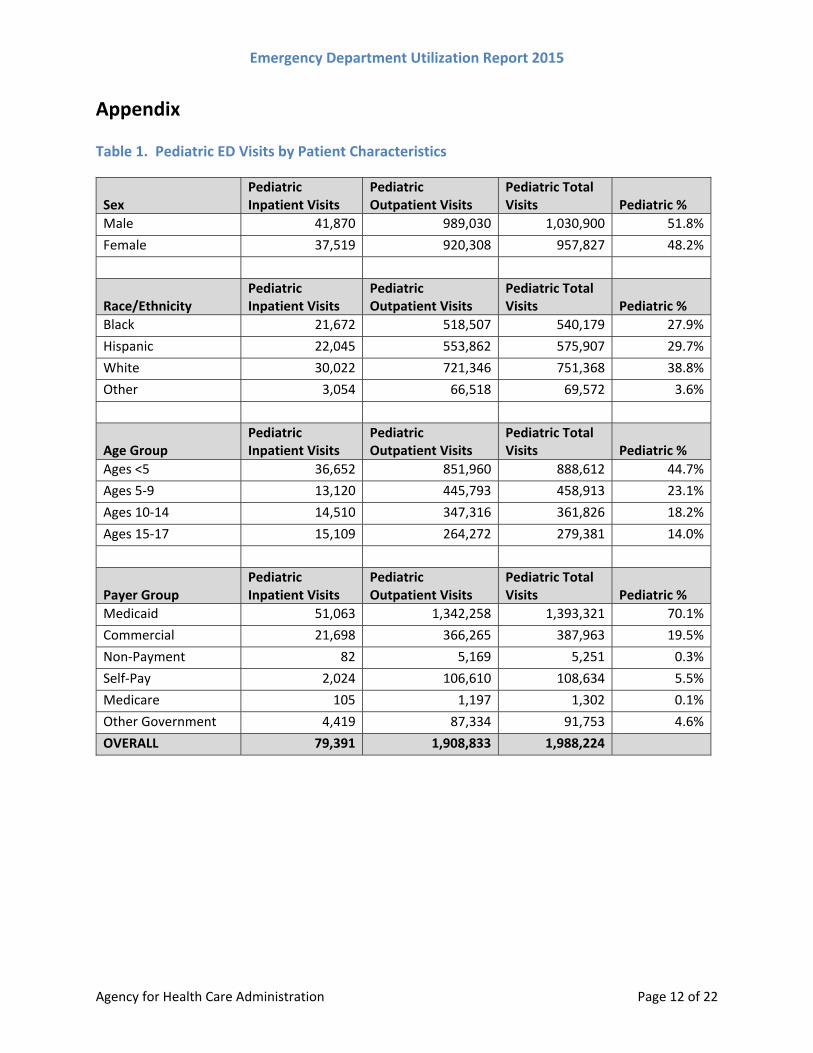
Children, under four years of age, made nearly half of all pediatric ED visits. Forty‐five percent of all
pediatric ED visits were small children four years old or younger (see Appendix Table 1). The number of
pediatric ED visits declines with each successive age group. Children ages 15 – 17 comprise only 14% of
total pediatric visits.
Medicaid was the top principal payer for pediatric ED visits by a considerable margin, paying for 70% of
all pediatric visits. Commercial payers were the second‐highest payer at 20% (see Appendix Table 1).
Emergency Department Utilization Report 2015
Agency for Health Care Administration Page 2 of 22
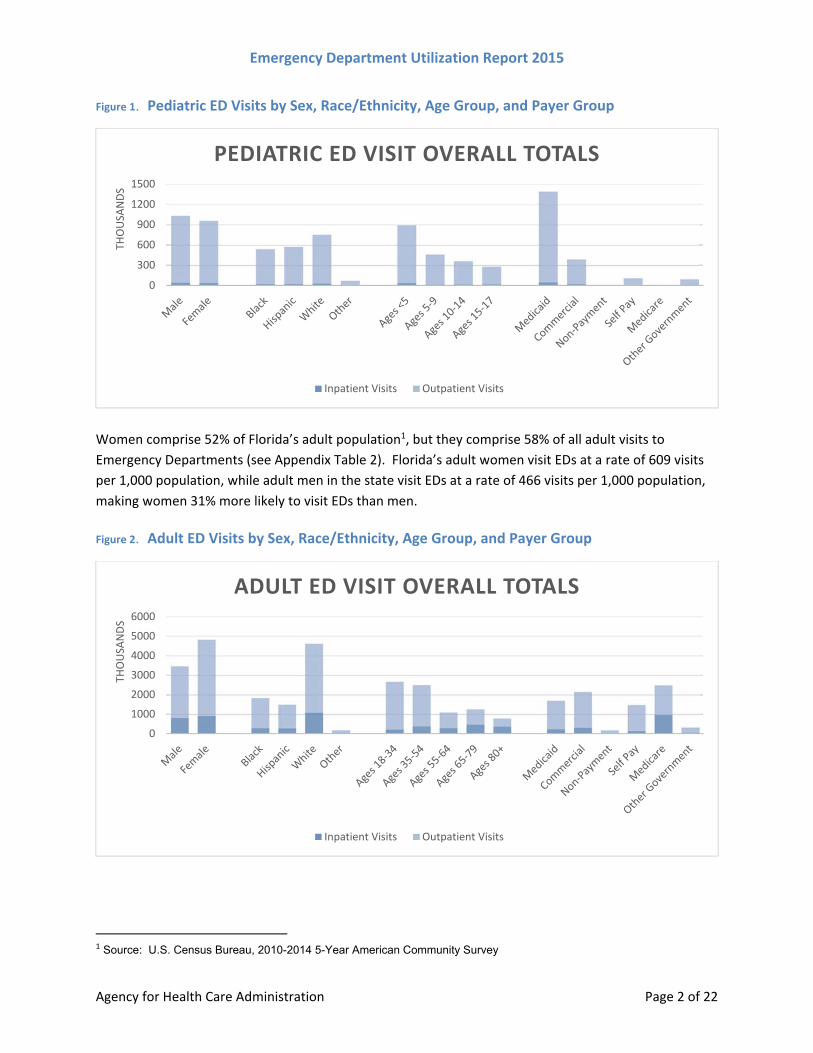
Figure 1. Pediatric ED Visits by Sex, Race/Ethnicity, Age Group, and Payer Group
Women comprise 52% of Florida’s adult population1, but they comprise 58% of all adult visits to
Emergency Departments (see Appendix Table 2). Florida’s adult women visit EDs at a rate of 609 visits
per 1,000 population, while adult men in the state visit EDs at a rate of 466 visits per 1,000 population,
making women 31% more likely to visit EDs than men.
Figure 2. Adult ED Visits by Sex, Race/Ethnicity, Age Group, and Payer Group
1 Source: U.S. Census Bureau, 2010-2014 5-Year American Community Survey
0
300
600
900
1200
1500
THOUSA
NDS
PEDIATRIC ED VISIT OVERALL TOTALS
Inpatient Visits Outpatient Visits
0
1000
2000
3000
4000
5000
6000
THOUSA
NDS
ADULT ED VISIT OVERALL TOTALS
Inpatient Visits Outpatient Visits

Emergency Department Utilization Report 2015
Agency for Health Care Administration Page 3 of 22
Volume Trends over Time
Due largely to population growth, the volume of ED visits for all payers has historically increased every
year. One of the more interesting developments over the past several years has been slowing growth in
the number of visits made by patients who are self‐paid. While total ED visits grew by 4.9% from 2014
to 2015, self‐pay visits actually declined by 3.6%.
Figure 3 shows the relative share of ED visits for each payer over the past four years. Blue lines indicate
an increase in visit share, while orange lines indicate a decrease in visit share. Line width indicates the
magnitude of change in visit share from 2012‐15.
Figure 3. Total Visits by Payer 2012‐2015
Inpatient Hospitalization
In 2015, Florida emergency departments saw 10,271,235 ED visits with 1,805,578 (17.6 percent) of
those visits subsequently resulting in a hospital inpatient admission. An inpatient hospitalization
resulted from 79,391 pediatric visits and 1,726,187 adult visits. The inpatient hospitalization rate for
pediatric visits was 4.0%, while the rate for adult visits was 20.8%.

Emergency Department Utilization Report 2015
Agency for Health Care Administration Page 4 of 22
Pediatric ED visits are less likely to result in inpatient hospitalization than adult visits. Regardless of
patient characteristics, the rate of pediatric ED visits resulting in inpatient hospitalization was much
lower than the rate for adult ED visits (see Appendix Table 3).
Non‐payment and self‐paid visits were less likely to be admitted for inpatient care than Medicaid,
Medicare, or commercial payers for pediatric visits. While 4.1% of visits with Medicaid, Medicare, Other
Government, or Commercial principal payers resulted in inpatient hospitalization, only 1.8% of Non‐
Payment or Self Pay pediatric visits were admitted for inpatient care. This rate is well below the
statewide average of 4.0% pediatric hospitalization (see Appendix Table 3). While Medicare visits
demonstrate a comparatively high inpatient hospitalization rate compared to other payers, these visits
comprise only 0.1% of pediatric visits. In addition, most children covered by Medicare have end‐stage
renal disease, Lou Gehrig’s Disease, or need a kidney transplant.
Figure 4. Inpatient Hospitalization Rate for Pediatric ED Visits by Patient Characteristics
Patient age is strongly correlated with an inpatient hospitalization following an ED visit. Older patients
who visit EDs are considerably more likely to be hospitalized for their conditions. This phenomenon is
most likely attributable to the types of conditions that bring patients to the Emergency Departments.
Eight of the top ten most common medical conditions for overall inpatient hospitalization are also
among the ten most common conditions for patients over 65 (see Figure 13). Visits paid by Medicare
are approximately three times as likely to result in inpatient hospitalization as other payers, most likely
due to Medicare’s strong positive correlation with age (see Appendix Table 3).
0%
2%
4%
6%
8%
10%
Inpatient Hospitalization Rate for Pediatric ED Visits

Emergency Department Utilization Report 2015
Agency for Health Care Administration Page 5 of 22
Figure 5. Inpatient Hospitalization Rate for Adult ED Visits by Patient Characteristics
Patient Acuity
The Agency for Health Care Administration’s outpatient Emergency Department database includes
Current Procedural Terminology, or CPT, Evaluation and Management codes, designed to categorize the
acuity (severity) of a patient’s diagnosis. The following analysis used these CPT codes to label outpatient
visits as either high acuity or low acuity visits.2
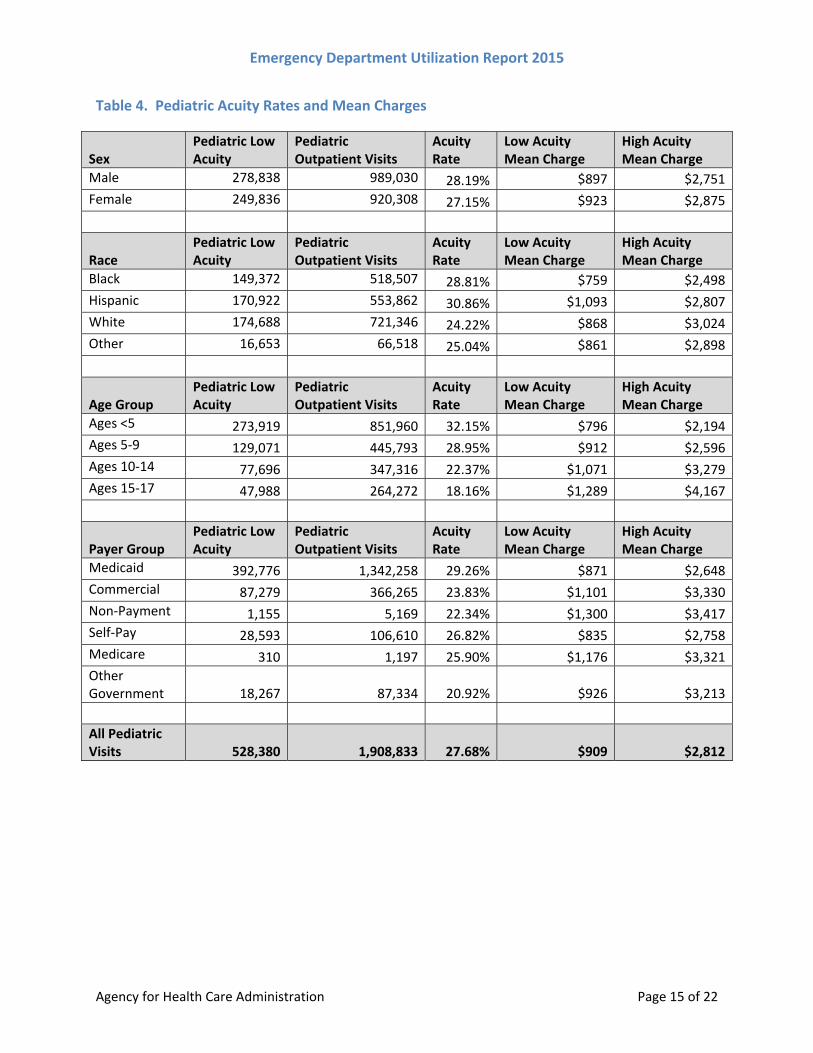
Pediatric visits for young children were more likely to be low acuity visits. The rate of low acuity visits
for children below five years of age was 77% higher than the low acuity rate for children aged 15‐17 (see
Appendix Table 4). Low acuity rates decrease for every increase in age group for pediatric visits.
Figure 6. Low Acuity Rate for Pediatric ED Visits by Patient Characteristics
2 For a full definition of patient acuity, see Appendix page 19, “Definition of Patient Acuity.”
0%
10%
20%
30%
40%
50%
Inpatient Hospitalization Rate for Adult ED Visits
0%
10%
20%
30%
40%
Percentage of Low Acuity Pediatric ED Visits

Emergency Department Utilization Report 2015
Agency for Health Care Administration Page 6 of 22
The average charges for pediatric visits increase with age. For both low and high acuity visits, the
average charge for a pediatric visit was much higher for the older age groups. The average low acuity
charge for ages 15‐17 was 42% higher than the statewide pediatric ED visit average of $909. The
average high acuity charge was 48% higher than the statewide average of $2,812 (Appendix Table 4).
Figure 7. Mean Charges for Pediatric ED Visits by Acuity and Patient Characteristics
ED visits by adult Hispanic patients were substantially more likely to be low acuity visits, and these visits
were significantly costlier than the average visit. The low acuity rate for Hispanic adult patients (18.5%)
was 42% higher than the statewide average. The mean charge for low acuity ED visits by Hispanic adults
($2,817) was 66% higher than the statewide average for all low acuity adult ED visits ($1,695) (see
Appendix Table 5).
Figure 8. Low Acuity Rate for Adult ED Visits by Patient Characteristics
$0
$1,000
$2,000
$3,000
$4,000
$5,000
Mean Charges for Low and High Acuity Pediatric ED Visits
Low Acuity Mean Charge High Acuity Mean Charge
0%
5%
10%
15%
20%
Percentage of Low Acuity Adult ED Visits

Emergency Department Utilization Report 2015
Agency for Health Care Administration Page 7 of 22
The average charges for adult visits also increased with age. For both low and high acuity visits, the
average charge increased with every increase in age. Low acuity visits for patients above 80 years of age
were 92% costlier than low acuity visits for the youngest adults. High acuity visits for patients over 80
years of age cost 67% more than high acuity visits for patients aged 18‐34 (see Appendix Table 5).
Figure 9. Mean Charges for Adult ED Visits by Acuity and Patient Characteristics
Acuity Trends over Time
The number of ED visits per capita in Florida has increased markedly in the past decade.3 ED visits per
1,000 population have risen 37% since 2005. However, the portion of those visits considered low acuity
has been reduced by nearly 50% in that same timeframe. Although EDs are seeing more patients, the
vast majority of visits are considered high acuity visits.
As seen in Figure 10 below, the low acuity rate for ED visits has decreased steadily since 2005. The
percentage of Floridians who lack health insurance remained relatively static until 2012 but has declined
by 33% in the past three years.4 These two trends are not necessarily related, although uninsured
patients are more likely to make low acuity visits to Emergency Departments than other types of
patients (see Figure 8).
3 Unless otherwise noted, all analysis in this report examines the full dataset of ED visits in 2015. In order to maintain
comparability with previous years’ reports, the “Acuity Trends over Time” section examines only visits made by Florida
residents.
4 The trend in uninsured rates in Florida is consistent with a nationwide increase in health insurance coverage rates. Source: http://www.census.gov/library/publications/2016/demo/p60‐257.html
$0
$2,000
$4,000
$6,000
$8,000
$10,000
Mean Charges for Low and High Acuity Adult ED Visits
Low Acuity Mean Charge High Acuity Mean Charge

Emergency Department Utilization Report 2015
Agency for Health Care Administration Page 8 of 22
Figure 10. Number of ED Visits Per Capita over Time by Acuity Level
Figure 11. Percentage of Visits Considered Low Acuity Compared to Uninsured Rate
Top Medical Conditions The following tables show the most commonly diagnosed medical conditions for both outpatient
Emergency Department visits (Figure 11) and ED visits requiring inpatient hospitalization (Figure 12).
The tables also show the average charge for each condition. For a breakdown of top pediatric/adult
conditions, see Appendix Tables 6‐9.5
5 For a description of how the transition to ICD‐10 affected the analysis, see p 22 “ICD‐10 Transition Explanation”.
137 70
161
337298
407
0
100
200
300
400
500
2005 2006 2007 2008 2009 2010 2011 2012 2013 2014 2015
Visits per 1000 population
Per Capita Acuity Trends, 2005‐2015
Low Acuity per 1000 High Acuity per 1000 Total visits per 1000
46.0%
17.2%
19.5%
13.3%
0%
10%
20%
30%
40%
50%
2005 2006 2007 2008 2009 2010 2011 2012 2013 2014 2015
Low Acuity and Uninsured Trends, 2005‐2015
Low Acuity Rate Uninsured Rate

Emergency Department Utilization Report 2015
Agency for Health Care Administration Page 9 of 22
Figure 12. Top Ten Most Common Medical Conditions for Outpatient ED Visits
Outpatient Conditions Percentage of ED Visits
Mean Charges
Other upper respiratory infections 5.34% $2,012
Abdominal pain 5.06% $8,638
Sprains and strains 4.85% $3,791
Superficial injury; contusion 4.68% $4,058
Nonspecific chest pain 3.83% $11,931
Spondylosis; intervertebral disc disorders; other back problems 3.71% $4,467
Skin and subcutaneous tissue infections 2.81% $2,579
Urinary tract infections 2.80% $5,868
Other injuries and conditions due to external causes 2.75% $5,185
Open wounds of extremities 2.35% $2,775
Figure 13. Top Ten Most Common Medical Conditions for Inpatient Hospitalizations following ED visit
Inpatient Conditions Percentage of Hospitalizations
Mean Charges
Septicemia (except in labor) 5.58% $97,837
Congestive heart failure; nonhypertensive 3.67% $53,873
Pneumonia (except that caused by tuberculosis or sexually transmitted disease)
3.15% $49,460
Chronic obstructive pulmonary disease and bronchiectasis 3.07% $42,052
Cardiac dysrhythmias 3.02% $47,853
Skin and subcutaneous tissue infections 2.75% $35,180
Mood disorders 2.66% $19,863
Urinary tract infections 2.46% $35,688
Acute myocardial infarction 2.37% $106,583
Acute cerebrovascular disease 2.33% $81,573
Geographic Variation in ED Use
Figure 14 shows the number of Emergency Department visits per 1,000 people in each county in Florida6
(see Appendix Tables 10‐11 for details). Visits are classified by the county of residence for each patient,
not the county in which the facility is located. If a patient lives in Wakulla County but visits an
Emergency Department in neighboring Leon County, for example, the visit is classified as a Wakulla
County visit.
6 Population estimates: http://edr.state.fl.us/Content/population‐demographics/data/index.cfm

Emergency Department Utilization Report 2015
Agency for Health Care Administration Page 10 of 22
Figure 14. ED Visits per 1,000 People by County
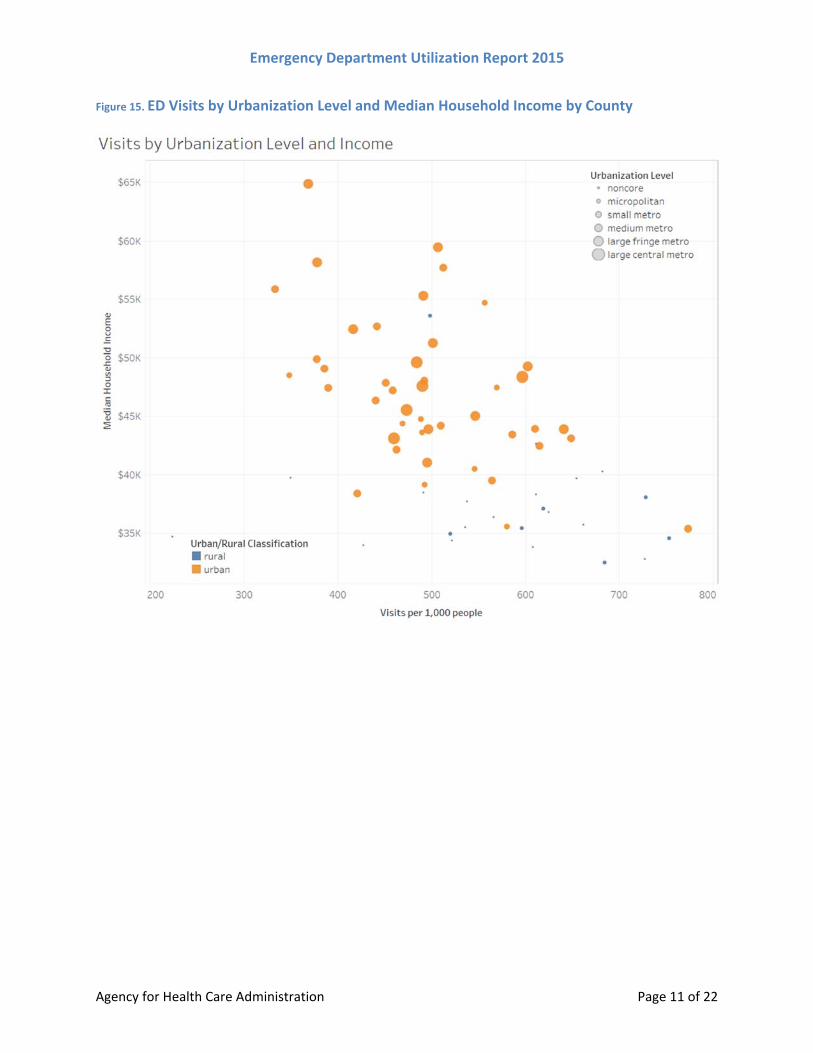
Visit volume is inversely correlated with both urbanization and median household income. Counties
with high per capita visits are typically small rural counties with low median incomes. Figure 15 shows
the relationship between urbanization, median household income, and ED visits per 1,000 population.78
7 Urbanization levels established by National Center for Health Statistics 2013 Urban‐Rural Classification Scheme for Counties. Source: http://www.cdc.gov/nchs/data/series/sr_02/sr02_166.pdf 8 Median household income from Census Bureau American Communities Survey.
Emergency Department Utilization Report 2015
Agency for Health Care Administration Page 11 of 22
Figure 15. ED Visits by Urbanization Level and Median Household Income by County
Emergency Department Utilization Report 2015
Agency for Health Care Administration Page 12 of 22
Appendix
Table 1. Pediatric ED Visits by Patient Characteristics
Sex Pediatric Inpatient Visits
Pediatric Outpatient Visits
Pediatric Total Visits Pediatric %
Male 41,870 989,030 1,030,900 51.8%
Female 37,519 920,308 957,827 48.2%
Race/Ethnicity Pediatric Inpatient Visits
Pediatric Outpatient Visits
Pediatric Total Visits Pediatric %
Black 21,672 518,507 540,179 27.9%
Hispanic 22,045 553,862 575,907 29.7%
White 30,022 721,346 751,368 38.8%
Other 3,054 66,518 69,572 3.6%
Age Group Pediatric Inpatient Visits
Pediatric Outpatient Visits
Pediatric Total Visits Pediatric %
Ages <5 36,652 851,960 888,612 44.7%
Ages 5‐9 13,120 445,793 458,913 23.1%
Ages 10‐14 14,510 347,316 361,826 18.2%
Ages 15‐17 15,109 264,272 279,381 14.0%
Payer Group Pediatric Inpatient Visits
Pediatric Outpatient Visits
Pediatric Total Visits Pediatric %
Medicaid 51,063 1,342,258 1,393,321 70.1%
Commercial 21,698 366,265 387,963 19.5%
Non‐Payment 82 5,169 5,251 0.3%
Self‐Pay 2,024 106,610 108,634 5.5%
Medicare 105 1,197 1,302 0.1%
Other Government 4,419 87,334 91,753 4.6%
OVERALL 79,391 1,908,833 1,988,224

Emergency Department Utilization Report 2015
Agency for Health Care Administration Page 13 of 22
Table 2. Adult ED Visits by Patient Characteristics
Sex Adult Inpatient Visits
Adult Outpatient Visits Adult Total Visits Adult %
Male 818,236 2,636,886 3,455,122 41.7%
Female 907,945 3,919,370 4,827,315 58.3%
Race/Ethnicity Adult Inpatient Visits
Adult Outpatient Visits Adult Total Visits Adult %
Black 288,432 1,538,058 1,826,490 22.5%
Hispanic 278,666 1,210,218 1,488,884 18.3%
White 1,090,789 3,531,450 4,622,239 56.9%
Other 36,123 144,415 180,538 2.2%
Age Group Adult Inpatient Visits
Adult Outpatient Visits Adult Total Visits Adult %
Ages 18‐34 214,967 2,448,120 2,663,087 32.2%
Ages 35‐54 379,178 2,111,108 2,490,286 30.1%
Ages 55‐64 293,091 797,331 1,090,422 13.2%
Ages 65‐79 467,384 787,508 1,254,892 15.2%
Ages 80+ 371,567 412,249 783,816 9.5%
Payer Group Adult Inpatient Visits
Adult Outpatient Visits Adult Total Visits Adult %
Medicaid 231,108 1,462,980 1,694,088 20.5%
Commercial 308,719 1,833,661 2,142,380 25.9%
Non‐Payment 35,206 142,099 177,305 2.1%
Self‐Pay 132,757 1,337,973 1,470,730 17.8%
Medicare 967,768 1,509,278 2,477,046 29.9%
Other Government 50,629 267,614 318,243 3.8%
OVERALL 1,726,187 6,553,605 8,279,792

Emergency Department Utilization Report 2015
Agency for Health Care Administration Page 14 of 22
Table 3. Inpatient Hospitalization Rate by Patient Characteristics
Sex Pediatric % Adult %
Male 4.1% 23.7%
Female 3.9% 18.8%
Race Pediatric % Adult %
Black 4.0% 15.8%
Hispanic 3.8% 18.7%
White 4.0% 23.6%
Other 4.4% 20.0%
Age Group Pediatric % Adult %
Ages <5 4.1% Ages 18‐34 8.1%
Ages 5‐9 2.9% Ages 35‐54 15.2%
Ages 10‐14 4.0% Ages 55‐64 26.9%
Ages 15‐17 5.4% Ages 65‐79 37.2%
Ages 80+ 47.4%
Payer Group Pediatric % Adult %
Medicaid 3.7% 13.6%
Commercial 5.6% 14.4%
Non‐Payment 1.6% 19.9%
Self‐Pay 1.9% 9.0%
Medicare 8.1% 39.1%
Other Government 4.8% 15.9%
All ED Visits 4.0% 20.8%
Emergency Department Utilization Report 2015
Agency for Health Care Administration Page 15 of 22
Table 4. Pediatric Acuity Rates and Mean Charges
Sex Pediatric Low Acuity
Pediatric Outpatient Visits
Acuity Rate
Low Acuity Mean Charge
High Acuity Mean Charge
Male 278,838 989,030 28.19% $897 $2,751
Female 249,836 920,308 27.15% $923 $2,875
Race Pediatric Low Acuity
Pediatric Outpatient Visits
Acuity Rate
Low Acuity Mean Charge
High Acuity Mean Charge
Black 149,372 518,507 28.81% $759 $2,498
Hispanic 170,922 553,862 30.86% $1,093 $2,807
White 174,688 721,346 24.22% $868 $3,024
Other 16,653 66,518 25.04% $861 $2,898
Age Group Pediatric Low Acuity
Pediatric Outpatient Visits
Acuity Rate
Low Acuity Mean Charge
High Acuity Mean Charge
Ages <5 273,919 851,960 32.15% $796 $2,194
Ages 5‐9 129,071 445,793 28.95% $912 $2,596
Ages 10‐14 77,696 347,316 22.37% $1,071 $3,279
Ages 15‐17 47,988 264,272 18.16% $1,289 $4,167
Payer Group Pediatric Low Acuity
Pediatric Outpatient Visits
Acuity Rate
Low Acuity Mean Charge
High Acuity Mean Charge
Medicaid 392,776 1,342,258 29.26% $871 $2,648
Commercial 87,279 366,265 23.83% $1,101 $3,330
Non‐Payment 1,155 5,169 22.34% $1,300 $3,417
Self‐Pay 28,593 106,610 26.82% $835 $2,758
Medicare 310 1,197 25.90% $1,176 $3,321
Other Government 18,267 87,334 20.92% $926 $3,213
All Pediatric Visits 528,380 1,908,833 27.68% $909 $2,812

Emergency Department Utilization Report 2015
Agency for Health Care Administration Page 16 of 22
Table 5. Adult Acuity Rates and Mean Charges
Sex Adult Low Acuity
Adult Outpatient Visits
Acuity Rate
Low Acuity Mean Charge
High Acuity Mean Charge
Male 369,549 2,636,886 14.01% $1,576 $6,673
Female 486,906 3,919,370 12.42% $1,785 $6,566
Race Adult Low Acuity
Adult Outpatient Visits
Acuity Rate
Low Acuity Mean Charge
High Acuity Mean Charge
Black 205,340 1,538,058 13.35% $1,239 $5,519
Hispanic 224,119 1,210,218 18.52% $2,817 $7,487
White 390,308 3,531,450 11.05% $1,298 $6,772
Other 15,437 144,415 10.69% $1,321 $7,087
Age Group Adult Low Acuity
Adult Outpatient Visits
Acuity Rate
Low Acuity Mean Charge
High Acuity Mean Charge
Ages 18‐34 384,588 2,448,120 15.71% $1,418 $5,234
Ages 35‐54 273,418 2,111,108 12.95% $1,716 $6,679
Ages 55‐64 88,317 797,331 11.08% $1,913 $7,647
Ages 65‐79 76,861 787,508 9.76% $2,305 $8,308
Ages 80+ 33,271 412,249 8.07% $2,727 $8,737
Payer Adult Low Acuity
Adult Outpatient Visits
Acuity Rate
Low Acuity Mean Charge
High Acuity Mean Charge
Medicaid 213,216 1,462,980 14.57% $1,476 $5,688
Commercial 233,798 1,833,661 12.75% $2,132 $6,947
Non‐Payment 20,805 142,099 14.64% $2,085 $5,998
Self‐Pay 208,444 1,337,973 15.58% $1,141 $5,529
Medicare 144,592 1,509,278 9.58% $2,159 $8,065
Other Government 34,312 267,614 12.82% $1,306 $6,202
All Adult Visits 855,167 6,553,605 13.05% $1,695 $6,608

Emergency Department Utilization Report 2015
Agency for Health Care Administration Page 17 of 22
Table 6. Top Ten Most Common Medical Conditions for Pediatric Outpatient Visits
Outpatient Pediatric Diagnosis Percentage of ED Visits
Mean Charges
Other upper respiratory infections 13.06% $1,578
Superficial injury; contusion 5.86% $1,998
Otitis media and related conditions 5.29% $1,295
Fever of unknown origin 4.52% $1,906
Other injuries and conditions due to external causes 4.11% $2,391
Sprains and strains 3.79% $2,351
Nausea and vomiting 3.49% $2,137
Open wounds of head; neck; and trunk 3.25% $1,835
Viral infection 3.40% $1,623
Abdominal pain 2.76% $4,883
Table 7. Top Ten Most Common Medical Conditions for Pediatric Inpatient Hospitalizations
Inpatient Pediatric Diagnosis Percentage of Hospitalizations Mean Charges
Mood disorders 7.58% $17,269
Pneumonia (except that caused by tuberculosis or STD) 6.78% $27,608
Asthma 6.52% $17,331
Acute bronchitis 5.79% $20,184
Skin and subcutaneous tissue infections 3.92% $17,931
Epilepsy; convulsions 3.63% $28,258
Appendicitis and other appendiceal conditions 3.29% $47,684
Urinary tract infections 2.46% $22,877
Fluid and electrolyte disorders 2.40% $21,580
Other upper respiratory infections 2.64% $19,632

Emergency Department Utilization Report 2015
Agency for Health Care Administration Page 18 of 22
Table 8. Top Ten Most Common Medical Conditions for Adult Outpatient Visits
Outpatient Adult Diagnosis Percentage of ED Visits
Mean Charges
Abdominal pain 5.74% $9,167
Sprains and strains 5.16% $4,101
Nonspecific chest pain 4.74% $12,315
Spondylosis; intervertebral disc disorders; other back problems 4.60% $4,540
Superficial injury; contusion 4.34% $4,873
Urinary tract infections 3.14% $6,258
Other upper respiratory infections 3.08% $2,550
Headache; including migraine 2.47% $5,906
Skin and subcutaneous tissue infections 2.95% $2,812
Other complications of pregnancy 2.61% $4,256
Table 9. Top Ten Most Common Medical Conditions for Adult Inpatient Hospitalizations
Inpatient Adult Diagnosis Percentage of Hospitalizations
Mean Charges
Septicemia (except in labor) 5.78% $97,897
Congestive heart failure; nonhypertensive 3.84% $53,795
Chronic obstructive pulmonary disease and bronchiectasis 3.20% $42,053
Cardiac dysrhythmias 3.14% $47,921
Pneumonia (except that caused by tuberculosis or STD) 2.99% $51,739
Skin and subcutaneous tissue infections 2.70% $36,331
Acute myocardial infarction 2.48% $106,581
Urinary tract infections 2.46% $36,425
Acute cerebrovascular disease 2.44% $81,422
Mood disorders 2.44% $20,233

Emergency Department Utilization Report 2015
Agency for Health Care Administration Page 19 of 22
Table 10. ED Visits per 1,000 Population by County
County Name Visits per 1,000 County Name Visits per 1,000 Alachua 463.2 Lee 390.4
Baker 603.0 Leon 440.8
Bay 569.5 Levy 521.6
Bradford 682.3 Liberty 654.4
Brevard 492.4 Madison 608.1
Broward 501.4 Manatee 451.3
Calhoun 727.2 Marion 564.5
Charlotte 469.4 Martin 378.1
Citrus 493.0 Miami‐Dade 460.4
Clay 507.4 Monroe 498.9
Collier 333.7 Nassau 491.7
Columbia 728.6 Okaloosa 557.2
DeSoto 520.4 Okeechobee 753.6
Dixie 427.3 Orange 490.3
Duval 596.7 Osceola 641.2
Escambia 610.3 Palm Beach 416.9
Flagler 458.8 Pasco 497.2
Franklin 611.4 Pinellas 473.7
Gadsden 773.2 Polk 649.1
Gilchrist 421.0 Putnam 684.4
Glades 223.8 Santa Rosa 512.9
Gulf 546.0 Sarasota 385.8
Hamilton 538.0 Seminole 378.2
Hardee 619.4 St. Johns 368.7
Hendry 596.6 St. Lucie 586.0
Hernando 495.7 Sumter 348.9
Highlands 580.6 Suwannee 662.2
Hillsborough 484.5 Taylor 566.2
Holmes 535.8 Union 611.3
Indian River 488.8 Volusia 615.3
Jackson 625.2 Wakulla 441.8
Jefferson 510.2 Walton 490.4
Lafayette 350.3 Washington 491.8
Lake 547.0 Statewide Average 525.6

Emergency Department Utilization Report 2015
Agency for Health Care Administration Page 20 of 22
Table 11. ED Visits per 1,000 Population by Visits
County Name Visits per 1,000 County Name Visits per 1,000
Gadsden 773.2 Clay 507.4
Okeechobee 753.6 Broward 501.4
Columbia 728.6 Monroe 498.9
Calhoun 727.2 Pasco 497.2
Putnam 684.4 Hernando 495.7
Bradford 682.3 Citrus 493.0
Suwannee 662.2 Brevard 492.4
Liberty 654.4 Washington 491.8
Polk 649.1 Nassau 491.7
Osceola 641.2 Walton 490.4
Jackson 625.2 Orange 490.3
Hardee 619.4 Indian River 488.8
Volusia 615.3 Hillsborough 484.5
Franklin 611.4 Pinellas 473.7
Union 611.3 Charlotte 469.4
Escambia 610.3 Alachua 463.2
Madison 608.1 Miami‐Dade 460.4
Baker 603.0 Flagler 458.8
Duval 596.7 Manatee 451.3
Hendry 596.6 Wakulla 441.8
St. Lucie 586.0 Leon 440.8
Highlands 580.6 Dixie 427.3
Bay 569.5 Gilchrist 421.0
Taylor 566.2 Palm Beach 416.9
Marion 564.5 Lee 390.4
Okaloosa 557.2 Sarasota 385.8
Lake 547.0 Seminole 378.2
Gulf 546.0 Martin 378.1
Hamilton 538.0 St. Johns 368.7
Holmes 535.8 Lafayette 350.3
Levy 521.6 Sumter 348.9
DeSoto 520.4 Collier 333.7
Santa Rosa 512.9 Glades 223.8
Jefferson 510.2 Statewide Average 525.6
Emergency Department Utilization Report 2015
Agency for Health Care Administration Page 21 of 22
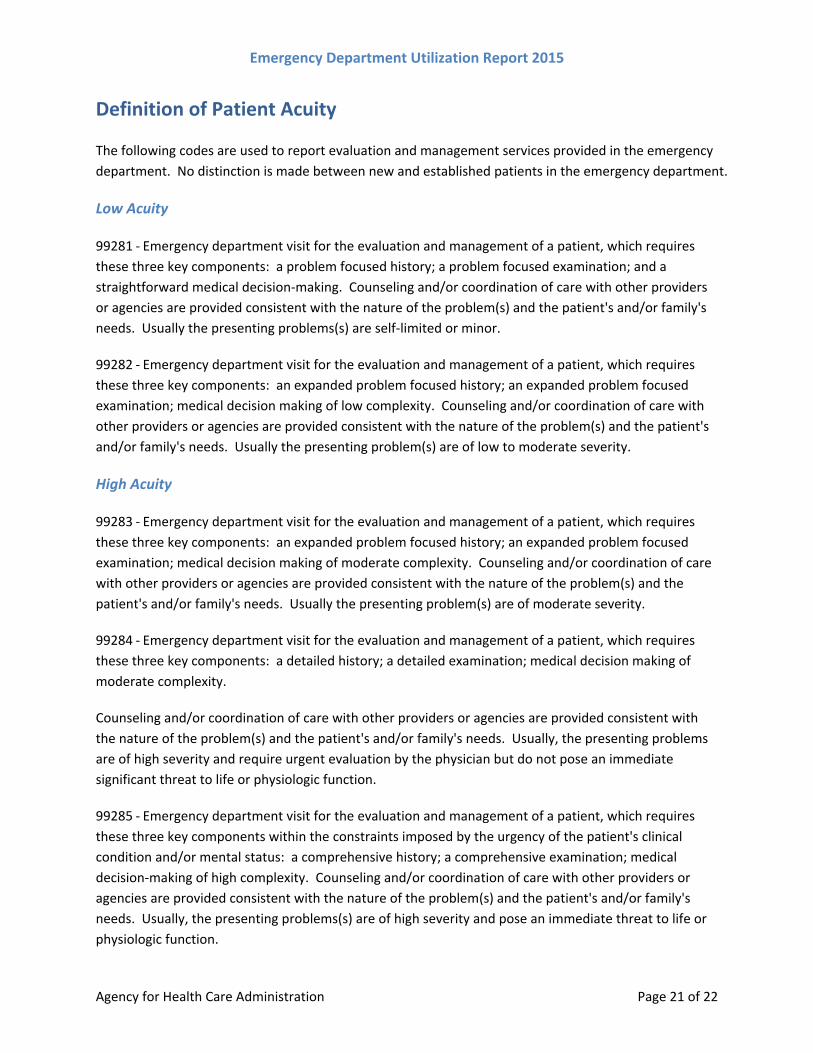
Definition of Patient Acuity
The following codes are used to report evaluation and management services provided in the emergency
department. No distinction is made between new and established patients in the emergency department.
Low Acuity
99281 ‐ Emergency department visit for the evaluation and management of a patient, which requires
these three key components: a problem focused history; a problem focused examination; and a
straightforward medical decision‐making. Counseling and/or coordination of care with other providers
or agencies are provided consistent with the nature of the problem(s) and the patient's and/or family's
needs. Usually the presenting problems(s) are self‐limited or minor.
99282 ‐ Emergency department visit for the evaluation and management of a patient, which requires
these three key components: an expanded problem focused history; an expanded problem focused
examination; medical decision making of low complexity. Counseling and/or coordination of care with
other providers or agencies are provided consistent with the nature of the problem(s) and the patient's
and/or family's needs. Usually the presenting problem(s) are of low to moderate severity.
High Acuity
99283 ‐ Emergency department visit for the evaluation and management of a patient, which requires
these three key components: an expanded problem focused history; an expanded problem focused
examination; medical decision making of moderate complexity. Counseling and/or coordination of care
with other providers or agencies are provided consistent with the nature of the problem(s) and the
patient's and/or family's needs. Usually the presenting problem(s) are of moderate severity.
99284 ‐ Emergency department visit for the evaluation and management of a patient, which requires
these three key components: a detailed history; a detailed examination; medical decision making of
moderate complexity.
Counseling and/or coordination of care with other providers or agencies are provided consistent with
the nature of the problem(s) and the patient's and/or family's needs. Usually, the presenting problems
are of high severity and require urgent evaluation by the physician but do not pose an immediate
significant threat to life or physiologic function.
99285 ‐ Emergency department visit for the evaluation and management of a patient, which requires
these three key components within the constraints imposed by the urgency of the patient's clinical
condition and/or mental status: a comprehensive history; a comprehensive examination; medical
decision‐making of high complexity. Counseling and/or coordination of care with other providers or
agencies are provided consistent with the nature of the problem(s) and the patient's and/or family's
needs. Usually, the presenting problems(s) are of high severity and pose an immediate threat to life or
physiologic function.

Emergency Department Utilization Report 2015
Agency for Health Care Administration Page 22 of 22
ICD‐10 Transition Explanation Due to the transition to ICD‐10 in October 2015, the dataset contains both ICD‐9 and ICD‐10 coding.
Analysis for this report involved aggregating diagnosis codes to the single‐level CCS category
independently for the first 3 quarters of 2015 (using ICD‐9) and Q4 2015 (using ICD‐10). Visits were
summed at the single‐level CCS level to determine most common conditions. Mean charges were
calculated using a weighted average for each subset of data, weighted by the number of visits.
Example:
The overall mean total charge in 2015 was $55,504. The first 3 quarters of 2015 saw 1,356,961 visits
with a mean charge of $54,798. Q4 of 2015 saw 428,667 visits with a mean charge of $57,737. The mean
total charge was found by calculating ((1,356,961*$54,798) + (428,667*$57,737)) / 1,785,628.


Agency for Health Care Administration2727 Mahan Drive
Tallahassee, FL 323081-800-419-3456
HTTP://AHCA.MyFlorida.com
Produced by AHCA Multimedia Design 11/2016