Embed Size (px)
Citation preview
Journal of Theoretical Biology 230 (2004) 203–214
ARTICLE IN PRESS
*Correspond
E-mail addr
c criado@uma.
0022-5193/$ - se
doi:10.1016/j.jtb
Emergence of community structure in terrestrialmammal-dominated ecosystems
Manuel Mendozaa,*, Brian Goodwinb, Carlos Criadoc
aDepartment of Ecology and Evolutionary Biology, Brown University, Providence, RI 02912, USAbSchumacher College, Dartington, Totnes, Devon TQ9 6EA, UK
cDepartment of Applied Physics I, Faculty of Science, University of Malaga, E-29071 Malaga, Spain
Received 23 September 2002; received in revised form 30 April 2004; accepted 4 May 2004
Available online 24 June 2004
Abstract
We present a paper that combines empirical and theoretical research about the trophic organization of biological communities.
Some regularities are observed in the analysis of the relationship between the trophic structure (how the species are distributed
among a set of feeding groups) of a number of African large mammal communities and the type of ecosystem. Different types of
ecosystems are characterized by specific patterns in the trophic structure of the mammal community. In order to explain the origin of
these patterns, we propose a model defining the underlying dynamic of mammal-dominated ecosystems. The main aim of this study
is to show that it is possible to obtain a dynamic explanation of those patterns. The model is shown to spontaneously define different
types of structures in community organization, related to those observed. We propose a model that could help to explain the
correlation between different environmental factors and the abundance or diversity of herbivores, and which establishes a general
mechanism that makes it possible to understand how some rules constrain the assembly of the communities. In addition, the
proposed model leads us to see how biological communities can operate in an integrated way, which allows for the acceptance of
their changes on large time-scales as evolutionary. In summary, we suggest that communities are unitary structures with coherent
properties that result from the self-organizing dynamic of the whole system.
r 2004 Elsevier Ltd. All rights reserved.
Keywords: Trophic structure; Mammal’s community; Self-organization; Biodiversity; Assembly rules
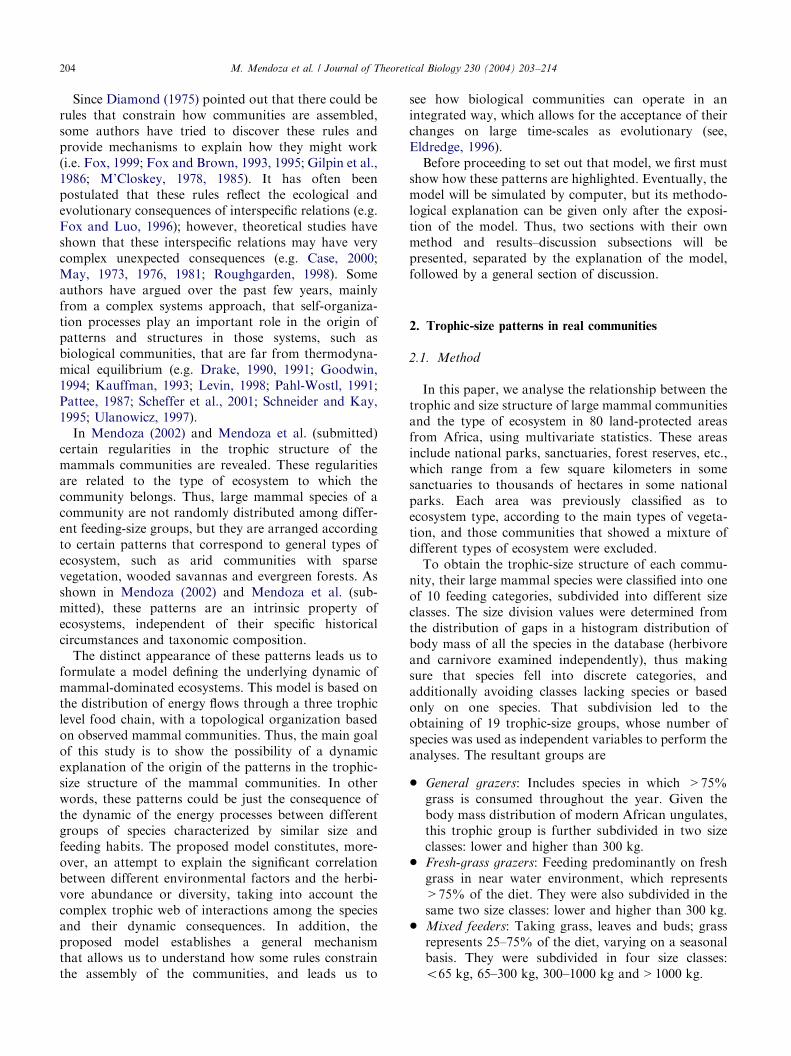
1. Introduction
A number of previous studies have highlighted thesignificant, although usually weak, correlation betweenrainfall, soil fertility and vegetational productivity onthe one hand, and total herbivore community biomass(Bell, 1982; East, 1984; McNaughton et al., 1989), plantquality (Belovsky, 1997; Coe, 1983; Du Toit and Owen-Smith, 1989) and species richness of herbivores (Danelland Niemela, 1996; Huston, 1994; Rosenzweig, 1995;Western and Ssemakula, 1981) on the other. However,these works do not explain the influence of these factorson herbivore diversity. Olff et al. (2002) recentlyproposed a model to explain that relationship. They
ing author.
esses: manuel [email protected] (M. Mendoza),
es (C. Criado).
e front matter r 2004 Elsevier Ltd. All rights reserved.
i.2004.05.002
showed that greater plant-available moisture reduces thenutrient content of plants but increases productivity,whereas greater plant-available nutrients increase bothof these factors. Thus, the highest potential herbivorediversity should occur in areas dry enough to yield high-quality plants and support smaller herbivores, butproductive enough to support larger herbivores.
The above studies assume a direct relation betweenthe environmental conditions and the communitycomposition, without taking into account the complextrophic web of interactions among the species. Thesestudies, moreover, do not explain the qualitativedifferences observed among different ecosystems (i.e.forests, wooded savannas, grasslands, bushlands, etc.),that represent distinct changes in habitat types, in spiteof the continuous change of most of the associatedenvironmental variables (i.e. rainfall, solar flux, tem-peratures, etc.).
ARTICLE IN PRESSM. Mendoza et al. / Journal of Theoretical Biology 230 (2004) 203–214204
Since Diamond (1975) pointed out that there could berules that constrain how communities are assembled,some authors have tried to discover these rules andprovide mechanisms to explain how they might work(i.e. Fox, 1999; Fox and Brown, 1993, 1995; Gilpin et al.,1986; M’Closkey, 1978, 1985). It has often beenpostulated that these rules reflect the ecological andevolutionary consequences of interspecific relations (e.g.Fox and Luo, 1996); however, theoretical studies haveshown that these interspecific relations may have verycomplex unexpected consequences (e.g. Case, 2000;May, 1973, 1976, 1981; Roughgarden, 1998). Someauthors have argued over the past few years, mainlyfrom a complex systems approach, that self-organiza-tion processes play an important role in the origin ofpatterns and structures in those systems, such asbiological communities, that are far from thermodyna-mical equilibrium (e.g. Drake, 1990, 1991; Goodwin,1994; Kauffman, 1993; Levin, 1998; Pahl-Wostl, 1991;Pattee, 1987; Scheffer et al., 2001; Schneider and Kay,1995; Ulanowicz, 1997).
In Mendoza (2002) and Mendoza et al. (submitted)certain regularities in the trophic structure of themammals communities are revealed. These regularitiesare related to the type of ecosystem to which thecommunity belongs. Thus, large mammal species of acommunity are not randomly distributed among differ-ent feeding-size groups, but they are arranged accordingto certain patterns that correspond to general types ofecosystem, such as arid communities with sparsevegetation, wooded savannas and evergreen forests. Asshown in Mendoza (2002) and Mendoza et al. (sub-mitted), these patterns are an intrinsic property ofecosystems, independent of their specific historicalcircumstances and taxonomic composition.
The distinct appearance of these patterns leads us toformulate a model defining the underlying dynamic ofmammal-dominated ecosystems. This model is based onthe distribution of energy flows through a three trophiclevel food chain, with a topological organization basedon observed mammal communities. Thus, the main goalof this study is to show the possibility of a dynamicexplanation of the origin of the patterns in the trophic-size structure of the mammal communities. In otherwords, these patterns could be just the consequence ofthe dynamic of the energy processes between differentgroups of species characterized by similar size andfeeding habits. The proposed model constitutes, more-over, an attempt to explain the significant correlationbetween different environmental factors and the herbi-vore abundance or diversity, taking into account thecomplex trophic web of interactions among the speciesand their dynamic consequences. In addition, theproposed model establishes a general mechanismthat allows us to understand how some rules constrainthe assembly of the communities, and leads us to
see how biological communities can operate in anintegrated way, which allows for the acceptance of theirchanges on large time-scales as evolutionary (see,Eldredge, 1996).
Before proceeding to set out that model, we first mustshow how these patterns are highlighted. Eventually, themodel will be simulated by computer, but its methodo-logical explanation can be given only after the exposi-tion of the model. Thus, two sections with their ownmethod and results–discussion subsections will bepresented, separated by the explanation of the model,followed by a general section of discussion.
2. Trophic-size patterns in real communities
2.1. Method
In this paper, we analyse the relationship between thetrophic and size structure of large mammal communitiesand the type of ecosystem in 80 land-protected areasfrom Africa, using multivariate statistics. These areasinclude national parks, sanctuaries, forest reserves, etc.,which range from a few square kilometers in somesanctuaries to thousands of hectares in some nationalparks. Each area was previously classified as toecosystem type, according to the main types of vegeta-tion, and those communities that showed a mixture ofdifferent types of ecosystem were excluded.
To obtain the trophic-size structure of each commu-nity, their large mammal species were classified into oneof 10 feeding categories, subdivided into different sizeclasses. The size division values were determined fromthe distribution of gaps in a histogram distribution ofbody mass of all the species in the database (herbivoreand carnivore examined independently), thus makingsure that species fell into discrete categories, andadditionally avoiding classes lacking species or basedonly on one species. That subdivision led to theobtaining of 19 trophic-size groups, whose number ofspecies was used as independent variables to perform theanalyses. The resultant groups are
* General grazers: Includes species in which >75%grass is consumed throughout the year. Given thebody mass distribution of modern African ungulates,this trophic group is further subdivided in two sizeclasses: lower and higher than 300 kg:
* Fresh-grass grazers: Feeding predominantly on freshgrass in near water environment, which represents>75% of the diet. They were also subdivided in thesame two size classes: lower and higher than 300 kg:
* Mixed feeders: Taking grass, leaves and buds; grassrepresents 25–75% of the diet, varying on a seasonalbasis. They were subdivided in four size classes:o65 kg; 65–300 kg; 300–1000 kg and > 1000 kg:
ARTICLE IN PRESSM. Mendoza et al. / Journal of Theoretical Biology 230 (2004) 203–214 205
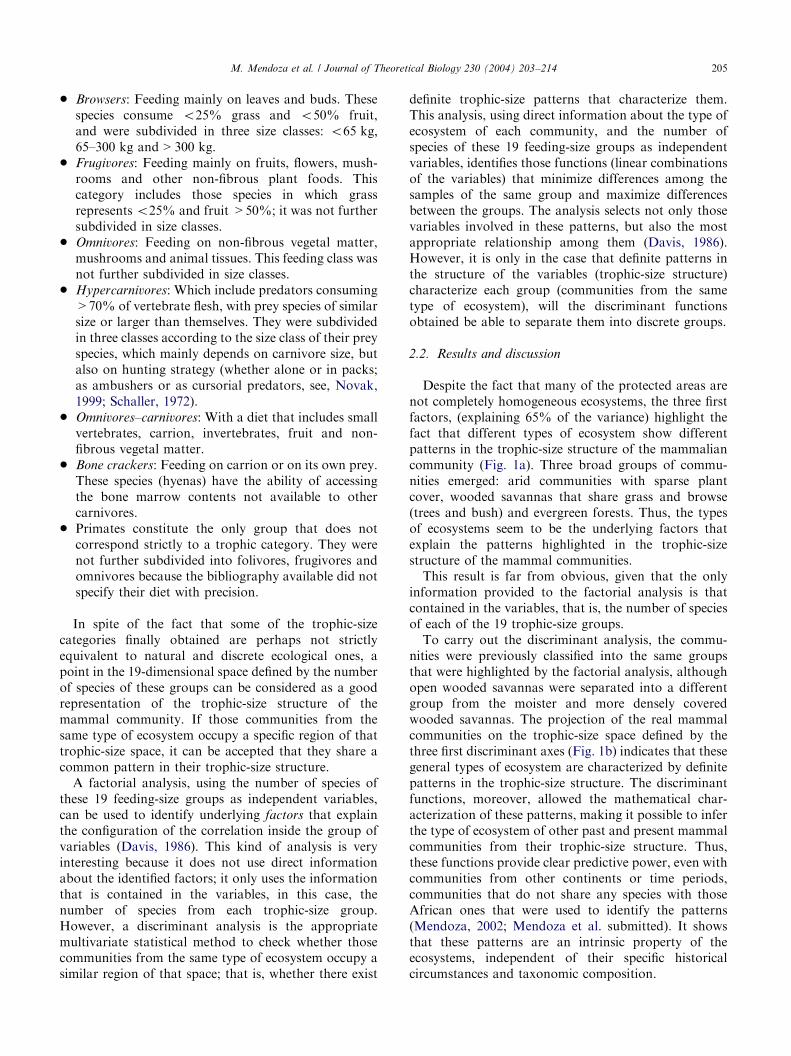
* Browsers: Feeding mainly on leaves and buds. Thesespecies consume o25% grass and o50% fruit,and were subdivided in three size classes: o65 kg;65–300 kg and > 300 kg:
* Frugivores: Feeding mainly on fruits, flowers, mush-rooms and other non-fibrous plant foods. Thiscategory includes those species in which grassrepresents o25% and fruit >50%; it was not furthersubdivided in size classes.
* Omnivores: Feeding on non-fibrous vegetal matter,mushrooms and animal tissues. This feeding class wasnot further subdivided in size classes.
* Hypercarnivores: Which include predators consuming>70% of vertebrate flesh, with prey species of similarsize or larger than themselves. They were subdividedin three classes according to the size class of their preyspecies, which mainly depends on carnivore size, butalso on hunting strategy (whether alone or in packs;as ambushers or as cursorial predators, see, Novak,1999; Schaller, 1972).
* Omnivores–carnivores: With a diet that includes smallvertebrates, carrion, invertebrates, fruit and non-fibrous vegetal matter.
* Bone crackers: Feeding on carrion or on its own prey.These species (hyenas) have the ability of accessingthe bone marrow contents not available to othercarnivores.
* Primates constitute the only group that does notcorrespond strictly to a trophic category. They werenot further subdivided into folivores, frugivores andomnivores because the bibliography available did notspecify their diet with precision.
In spite of the fact that some of the trophic-sizecategories finally obtained are perhaps not strictlyequivalent to natural and discrete ecological ones, apoint in the 19-dimensional space defined by the numberof species of these groups can be considered as a goodrepresentation of the trophic-size structure of themammal community. If those communities from thesame type of ecosystem occupy a specific region of thattrophic-size space, it can be accepted that they share acommon pattern in their trophic-size structure.
A factorial analysis, using the number of species ofthese 19 feeding-size groups as independent variables,can be used to identify underlying factors that explainthe configuration of the correlation inside the group ofvariables (Davis, 1986). This kind of analysis is veryinteresting because it does not use direct informationabout the identified factors; it only uses the informationthat is contained in the variables, in this case, thenumber of species from each trophic-size group.However, a discriminant analysis is the appropriatemultivariate statistical method to check whether thosecommunities from the same type of ecosystem occupy asimilar region of that space; that is, whether there exist
definite trophic-size patterns that characterize them.This analysis, using direct information about the type ofecosystem of each community, and the number ofspecies of these 19 feeding-size groups as independentvariables, identifies those functions (linear combinationsof the variables) that minimize differences among thesamples of the same group and maximize differencesbetween the groups. The analysis selects not only thosevariables involved in these patterns, but also the mostappropriate relationship among them (Davis, 1986).However, it is only in the case that definite patterns inthe structure of the variables (trophic-size structure)characterize each group (communities from the sametype of ecosystem), will the discriminant functionsobtained be able to separate them into discrete groups.
2.2. Results and discussion
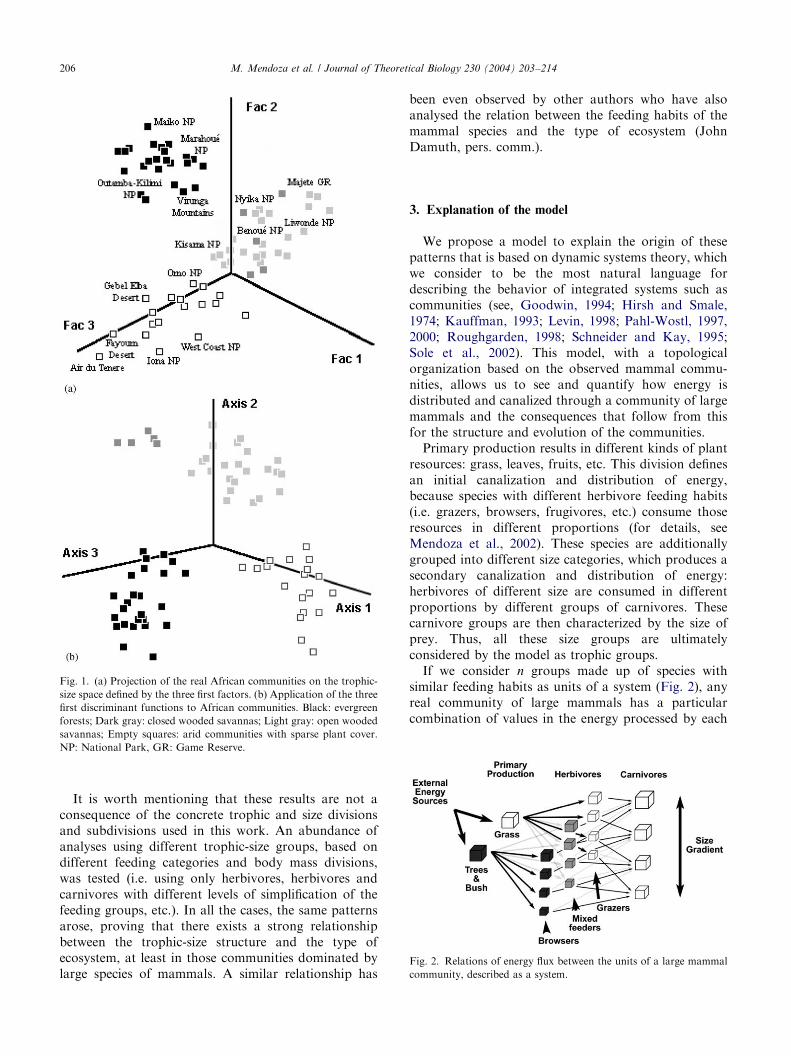
Despite the fact that many of the protected areas arenot completely homogeneous ecosystems, the three firstfactors, (explaining 65% of the variance) highlight thefact that different types of ecosystem show differentpatterns in the trophic-size structure of the mammaliancommunity (Fig. 1a). Three broad groups of commu-nities emerged: arid communities with sparse plantcover, wooded savannas that share grass and browse(trees and bush) and evergreen forests. Thus, the typesof ecosystems seem to be the underlying factors thatexplain the patterns highlighted in the trophic-sizestructure of the mammal communities.
This result is far from obvious, given that the onlyinformation provided to the factorial analysis is thatcontained in the variables, that is, the number of speciesof each of the 19 trophic-size groups.
To carry out the discriminant analysis, the commu-nities were previously classified into the same groupsthat were highlighted by the factorial analysis, althoughopen wooded savannas were separated into a differentgroup from the moister and more densely coveredwooded savannas. The projection of the real mammalcommunities on the trophic-size space defined by thethree first discriminant axes (Fig. 1b) indicates that thesegeneral types of ecosystem are characterized by definitepatterns in the trophic-size structure. The discriminantfunctions, moreover, allowed the mathematical char-acterization of these patterns, making it possible to inferthe type of ecosystem of other past and present mammalcommunities from their trophic-size structure. Thus,these functions provide clear predictive power, even withcommunities from other continents or time periods,communities that do not share any species with thoseAfrican ones that were used to identify the patterns(Mendoza, 2002; Mendoza et al. submitted). It showsthat these patterns are an intrinsic property of theecosystems, independent of their specific historicalcircumstances and taxonomic composition.
ARTICLE IN PRESS
Fig. 1. (a) Projection of the real African communities on the trophic-
size space defined by the three first factors. (b) Application of the three
first discriminant functions to African communities. Black: evergreen
forests; Dark gray: closed wooded savannas; Light gray: open wooded
savannas; Empty squares: arid communities with sparse plant cover.
NP: National Park, GR: Game Reserve.
Fig. 2. Relations of energy flux between the units of a large mammal
community, described as a system.
M. Mendoza et al. / Journal of Theoretical Biology 230 (2004) 203–214206
It is worth mentioning that these results are not aconsequence of the concrete trophic and size divisionsand subdivisions used in this work. An abundance ofanalyses using different trophic-size groups, based ondifferent feeding categories and body mass divisions,was tested (i.e. using only herbivores, herbivores andcarnivores with different levels of simplification of thefeeding groups, etc.). In all the cases, the same patternsarose, proving that there exists a strong relationshipbetween the trophic-size structure and the type ofecosystem, at least in those communities dominated bylarge species of mammals. A similar relationship has
been even observed by other authors who have alsoanalysed the relation between the feeding habits of themammal species and the type of ecosystem (JohnDamuth, pers. comm.).
3. Explanation of the model
We propose a model to explain the origin of thesepatterns that is based on dynamic systems theory, whichwe consider to be the most natural language fordescribing the behavior of integrated systems such ascommunities (see, Goodwin, 1994; Hirsh and Smale,1974; Kauffman, 1993; Levin, 1998; Pahl-Wostl, 1997,2000; Roughgarden, 1998; Schneider and Kay, 1995;Sole et al., 2002). This model, with a topologicalorganization based on the observed mammal commu-nities, allows us to see and quantify how energy isdistributed and canalized through a community of largemammals and the consequences that follow from thisfor the structure and evolution of the communities.
Primary production results in different kinds of plantresources: grass, leaves, fruits, etc. This division definesan initial canalization and distribution of energy,because species with different herbivore feeding habits(i.e. grazers, browsers, frugivores, etc.) consume thoseresources in different proportions (for details, seeMendoza et al., 2002). These species are additionallygrouped into different size categories, which produces asecondary canalization and distribution of energy:herbivores of different size are consumed in differentproportions by different groups of carnivores. Thesecarnivore groups are then characterized by the size ofprey. Thus, all these size groups are ultimatelyconsidered by the model as trophic groups.
If we consider n groups made up of species withsimilar feeding habits as units of a system (Fig. 2), anyreal community of large mammals has a particularcombination of values in the energy processed by each
ARTICLE IN PRESSM. Mendoza et al. / Journal of Theoretical Biology 230 (2004) 203–214 207
of them. This can be represented as a point in the n-
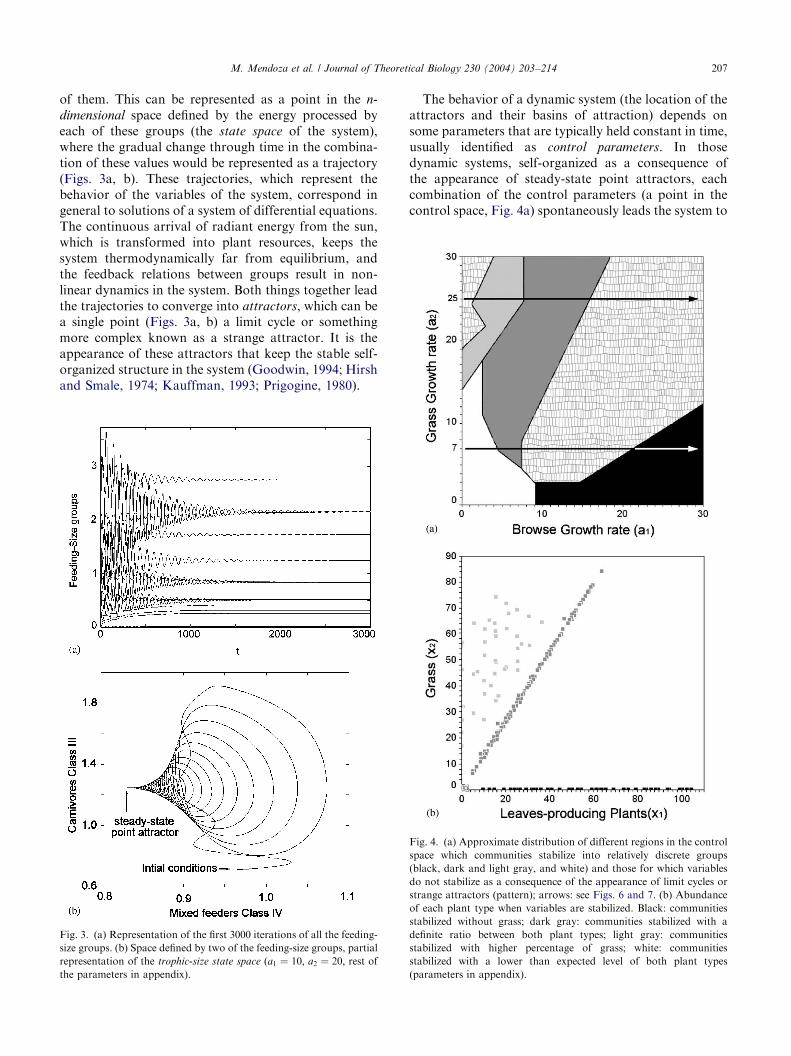
dimensional space defined by the energy processed byeach of these groups (the state space of the system),where the gradual change through time in the combina-tion of these values would be represented as a trajectory(Figs. 3a, b). These trajectories, which represent thebehavior of the variables of the system, correspond ingeneral to solutions of a system of differential equations.The continuous arrival of radiant energy from the sun,which is transformed into plant resources, keeps thesystem thermodynamically far from equilibrium, andthe feedback relations between groups result in non-linear dynamics in the system. Both things together leadthe trajectories to converge into attractors, which can bea single point (Figs. 3a, b) a limit cycle or somethingmore complex known as a strange attractor. It is theappearance of these attractors that keep the stable self-organized structure in the system (Goodwin, 1994; Hirshand Smale, 1974; Kauffman, 1993; Prigogine, 1980).
Fig. 3. (a) Representation of the first 3000 iterations of all the feeding-
size groups. (b) Space defined by two of the feeding-size groups, partial
representation of the trophic-size state space (a1 ¼ 10; a2 ¼ 20; rest of
the parameters in appendix).
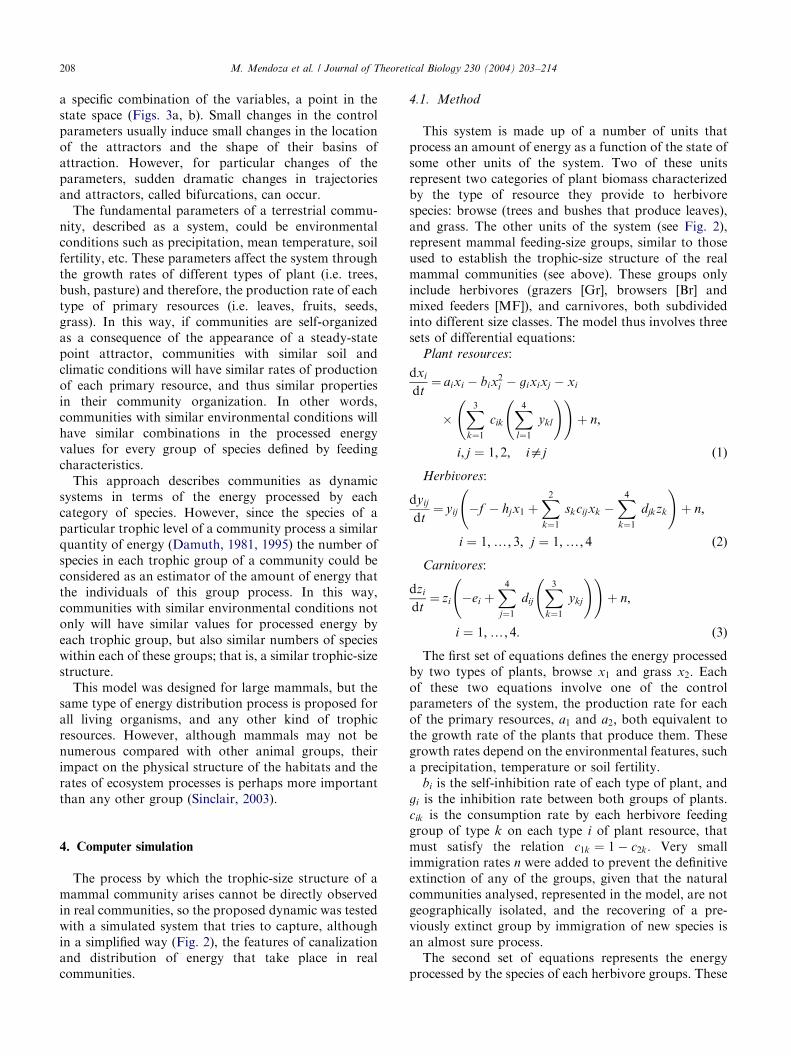
The behavior of a dynamic system (the location of theattractors and their basins of attraction) depends onsome parameters that are typically held constant in time,usually identified as control parameters. In thosedynamic systems, self-organized as a consequence ofthe appearance of steady-state point attractors, eachcombination of the control parameters (a point in thecontrol space, Fig. 4a) spontaneously leads the system to
Fig. 4. (a) Approximate distribution of different regions in the control
space which communities stabilize into relatively discrete groups
(black, dark and light gray, and white) and those for which variables
do not stabilize as a consequence of the appearance of limit cycles or
strange attractors (pattern); arrows: see Figs. 6 and 7. (b) Abundance
of each plant type when variables are stabilized. Black: communities
stabilized without grass; dark gray: communities stabilized with a
definite ratio between both plant types; light gray: communities
stabilized with higher percentage of grass; white: communities
stabilized with a lower than expected level of both plant types
(parameters in appendix).
ARTICLE IN PRESSM. Mendoza et al. / Journal of Theoretical Biology 230 (2004) 203–214208
a specific combination of the variables, a point in thestate space (Figs. 3a, b). Small changes in the controlparameters usually induce small changes in the locationof the attractors and the shape of their basins ofattraction. However, for particular changes of theparameters, sudden dramatic changes in trajectoriesand attractors, called bifurcations, can occur.
The fundamental parameters of a terrestrial commu-nity, described as a system, could be environmentalconditions such as precipitation, mean temperature, soilfertility, etc. These parameters affect the system throughthe growth rates of different types of plant (i.e. trees,bush, pasture) and therefore, the production rate of eachtype of primary resources (i.e. leaves, fruits, seeds,grass). In this way, if communities are self-organizedas a consequence of the appearance of a steady-statepoint attractor, communities with similar soil andclimatic conditions will have similar rates of productionof each primary resource, and thus similar propertiesin their community organization. In other words,communities with similar environmental conditions willhave similar combinations in the processed energyvalues for every group of species defined by feedingcharacteristics.
This approach describes communities as dynamicsystems in terms of the energy processed by eachcategory of species. However, since the species of aparticular trophic level of a community process a similarquantity of energy (Damuth, 1981, 1995) the number ofspecies in each trophic group of a community could beconsidered as an estimator of the amount of energy thatthe individuals of this group process. In this way,communities with similar environmental conditions notonly will have similar values for processed energy byeach trophic group, but also similar numbers of specieswithin each of these groups; that is, a similar trophic-sizestructure.
This model was designed for large mammals, but thesame type of energy distribution process is proposed forall living organisms, and any other kind of trophicresources. However, although mammals may not benumerous compared with other animal groups, theirimpact on the physical structure of the habitats and therates of ecosystem processes is perhaps more importantthan any other group (Sinclair, 2003).
4. Computer simulation
The process by which the trophic-size structure of amammal community arises cannot be directly observedin real communities, so the proposed dynamic was testedwith a simulated system that tries to capture, althoughin a simplified way (Fig. 2), the features of canalizationand distribution of energy that take place in realcommunities.
4.1. Method
This system is made up of a number of units thatprocess an amount of energy as a function of the state ofsome other units of the system. Two of these unitsrepresent two categories of plant biomass characterizedby the type of resource they provide to herbivorespecies: browse (trees and bushes that produce leaves),and grass. The other units of the system (see Fig. 2),represent mammal feeding-size groups, similar to thoseused to establish the trophic-size structure of the realmammal communities (see above). These groups onlyinclude herbivores (grazers [Gr], browsers [Br] andmixed feeders [MF]), and carnivores, both subdividedinto different size classes. The model thus involves threesets of differential equations:
Plant resources:
dxi
dt¼ aixi � bix
2i � gixixj � xi
�X3k¼1
cik
X4l¼1
ykl
! !þ n;
i; j ¼ 1; 2; iaj ð1Þ
Herbivores:
dyij
dt¼ yij �f � hjx1 þ
X2k¼1
skcijxk �X4k¼1
djkzk
!þ n;
i ¼ 1;y; 3; j ¼ 1;y; 4 ð2Þ
Carnivores:
dzi
dt¼ zi �ei þ
X4j¼1
dij
X3k¼1
ykj
! !þ n;
i ¼ 1;y; 4: ð3Þ
The first set of equations defines the energy processedby two types of plants, browse x1 and grass x2: Eachof these two equations involve one of the controlparameters of the system, the production rate for eachof the primary resources, a1 and a2; both equivalent tothe growth rate of the plants that produce them. Thesegrowth rates depend on the environmental features, sucha precipitation, temperature or soil fertility.
bi is the self-inhibition rate of each type of plant, andgi is the inhibition rate between both groups of plants.cik is the consumption rate by each herbivore feedinggroup of type k on each type i of plant resource, thatmust satisfy the relation c1k ¼ 1� c2k: Very smallimmigration rates n were added to prevent the definitiveextinction of any of the groups, given that the naturalcommunities analysed, represented in the model, are notgeographically isolated, and the recovering of a pre-viously extinct group by immigration of new species isan almost sure process.
The second set of equations represents the energyprocessed by the species of each herbivore groups. These
ARTICLE IN PRESSM. Mendoza et al. / Journal of Theoretical Biology 230 (2004) 203–214 209
equations also include the utilization rate of each plantresource by each feeding group c1k; with a positive sign,as well as the utilization rate of each herbivore size classdjk by each carnivore group. Here, sk are the intakeassimilation rates, and f the natural death rate thatalways was taken to be zero in herbivores, apart fromsome tests of simulation without carnivores. Theseequations also include an herbivore mechanical inhibi-tion rate hj that depends on the amount of trees–bush,and increases with the size class of the herbivore groups.It was introduced because large mammals seem to havea disadvantage relative to small ones in densely forestedhabitats.
The third set of equations represents the energyprocessed by the species of each carnivore group. Incontrast to the previous ones, these equations include anon-zero natural death rate ei: This set of equations alsoinvolves the utilization rate of each herbivore size classdij by each carnivore group, but, in this case, with apositive sign.
It is worth to clarify that each equation represents theenergy processed by a whole group of species withsimilar feeding habits, proportional to the number ofspecies included in that group.
We use linear functional responses to describe thetrophic interactions between the groups. Although forinstance, a saturating functional response is morerealistic in case of the interactions between individualspecies (Holling, 1959, 1965), saturation is unlike tooccur within trophic groups, as they consist of manyspecies. Therefore, we used linear responses, whichestablishes that a change in the amount of a resourceentails a proportional change in the energy processed bythose groups that consume the resource.
A region of control space was explored, taking theproduction rates of leaves ða1Þ and grass ða2Þ as controlparameters. A large number of points ð> 600Þ; set byrandom combinations of both parameters in the range(0–30) was selected to obtain the trophic-size structureof a large number of simulated communities. To analysethis structure we used the same types of analyses usedwith the real mammal communities (see above), factorialand discriminant analyses.
In order to test the generality of the model, the sameexhaustive analysis was carried out with differentcombinations of the main non-control parameters(cik and djk). In addition, different ways of organizingthe groups were tested (i.e. making different number oftrophic groups, subdivided into different size classes).To carry out all of these types of analyses is theequivalent of taking different percentages of grass andbody mass values to establish different trophic-sizegroups, which, in the case of the real communities, didnot affect the emergence of the patterns (see above).
In order to asses the implications of annual variationsof the climatic conditions, a number of simulations were
performed using perturbations in the growth rates.These perturbations were random and uniformly dis-tributed variations with different values added in eachline step of the simulation, covering about a 3% of thetotal range analysed.
The role of other parameters that also were includedin order to increase the realism of the model was alsoanalysed. One of them is the mutual inhibition ratebetween the two groups of plants ðgiÞ: Originally, it wasnot considered symmetrical, so the inhibition by grass oftrees and bushes (browse) was taken as zero. Another ofthese parameters is the intake assimilation rate ðskÞ;which also was not originally considered symmetrical.For leaves, this was considered larger than for grass,given that leaves are in general less fibrous and moreeasily fermentable than grasses, and contain moreprotein and soluble carbohydrates. Finally, the effectof the herbivore mechanical inhibition rate hj ; whichdepends on the amount of trees and increases with thesize class of the herbivore groups, was also analysed.The influence of these sources of asymmetry originallyincluded was analysed, taking different values andalso carrying out the same type of analysis afterremoving them.
4.2. Results and discussion
As the model predicts, the variables of the system aredynamically stable for a good number of combinationsof control parameters as a consequence of the appear-ance of steady-state point attractors (Fig. 3). Inaddition, neighboring points in control space result instable states with similar combinations of the variables,independently of the original conditions; in other words,simulated communities with similar combinations ofcontrol parameters are close in the trophic-size state
space.However, somewhat less than half the random
combinations of control parameters that were excludedfrom subsequent analyses gave rise to communities thatremain on limit cycles or strange attractors. They arenot randomly distributed, but most of them fall withinthe same diagonal region of the control space, or in asmall region that combines high rates of grass with lowproduction rates of leaves (Fig. 4a, pattern).
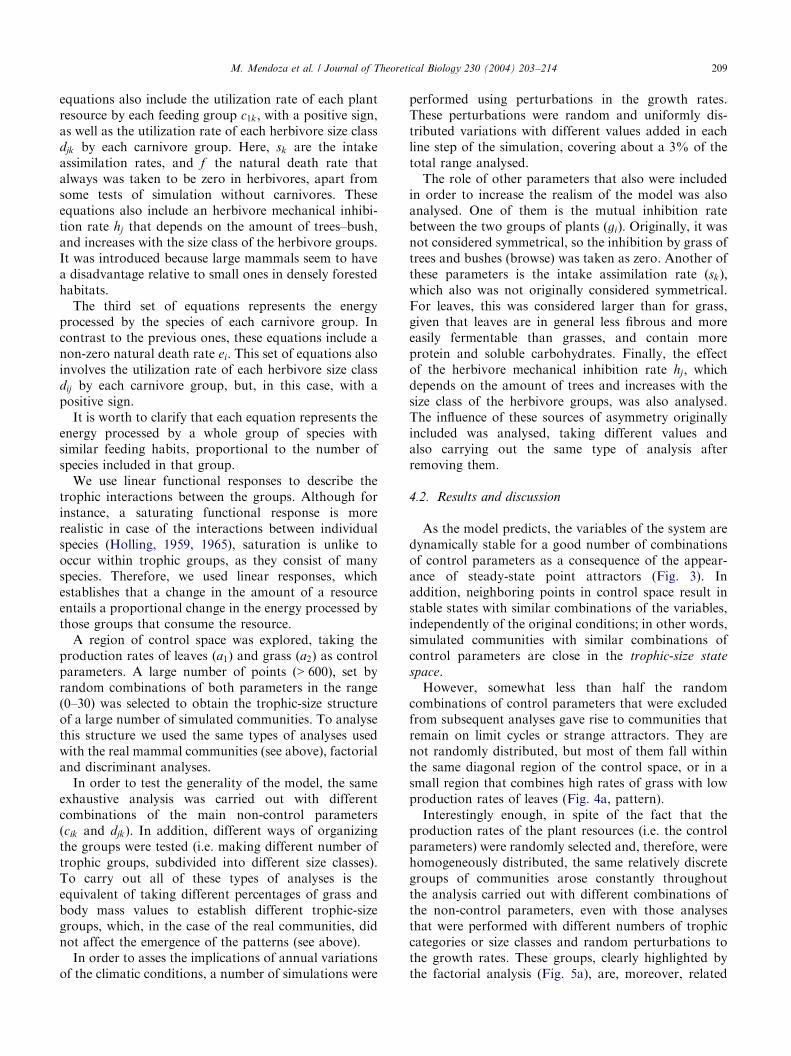
Interestingly enough, in spite of the fact that theproduction rates of the plant resources (i.e. the controlparameters) were randomly selected and, therefore, werehomogeneously distributed, the same relatively discretegroups of communities arose constantly throughoutthe analysis carried out with different combinations ofthe non-control parameters, even with those analysesthat were performed with different numbers of trophiccategories or size classes and random perturbations tothe growth rates. These groups, clearly highlighted bythe factorial analysis (Fig. 5a), are, moreover, related
ARTICLE IN PRESS
Fig. 5. Projection of the simulated communities of large mammals on
the trophic-size space defined by the three first factors (a) and three
first discriminant axis (b). Black: communities stabilized without grass;
dark gray: communities stabilized with a definite ratio between both
plant types; light gray: communities stabilized with higher percentage
of grass; white: communities stabilized with a lower than expected level
of both plant types (parameters in appendix).
M. Mendoza et al. / Journal of Theoretical Biology 230 (2004) 203–214210
with those that appeared with the real mammalcommunities. One of these groups is characterizedbecause, when their variables are stabilized, both typesof plants show an abundance lower than expected (x1
and x2 are less than 0.8), which is not proportional tothe production rates of resources (Figs. 4a, white region;b, empty squares). Another important group of samplesreaches a steady state with a high ratio between bothtypes of plants (trees–bush/grass), which is alwaysaround 0.75 (Figs. 4a and b, dark gray). This groupis separated from a third group by the band of unstable
samples. That third group stabilizes without grass(Figs. 4a and b, black). It was originally assumed thatthe lack of grass was a consequence of the inhibition oftrees and bush over the grass. However, the same resultis obtained when the mutual inhibition rate betweenboth groups of plants ðgiÞ is removed, so it is just theresult of the dynamics of the system as a body. A lastgroup brings together those communities where theamount of trees and bush ðx1Þ do not reach 61% of grassðx2Þ: In most of them, the amount of the plants thatproduce leaves is less than 50% (Figs. 4a and b, lightgray).
It is worth mentioning that in this case, in a similarfashion to the real communities, the only informationprovided to the factorial analysis (Fig. 5a) are the valuesreached by the variables that represent each trophic-sizegroups, which are obtained with random productionrates of the plant resources (i.e. control parameters).
A discriminant analysis among those groups ofsamples highlighted by the factor analysis leads nodoubt about their discrete distribution in the trophic-size
state space (Fig. 5b). These groups are comparable tothose that emerged from the analysis of the trophic-sizestructure of real communities. However, with these realcommunities, the first three factors were not able tohighlight two groups of communities sharing differentlevels of both types of plant. These communities,however, were easily characterized by the discriminantanalysis (Fig. 1b). This could be as a consequence of thelow number of real densely covered wooded commu-nities available for the analysis. In the factorial analysis,like any other type of principal components analysis,when a group of samples is represented by a lownumber, its contribution to the variance is insufficient tobe highlighted.
With a general model like this, however, a detailedreproduction of real communities should not beexpected. What is really important is that, capturing ina general way the trophic relationships of a largemammal community, defined groups of simulatedcommunities emerge, with concrete patterns in thetrophic-size structure and an abundance of differenttypes of plants (browse and grass) clearly related to thatof the real terrestrial mammal-dominated ecosystems.Given that the same relatively discrete groups ofcommunities (related with those highlighted with thereal communities) arose constantly throughout theanalysis carried out with different combinations ofparameters, and those performed with different waysof organizing the groups, the emergence of these groupshas to be the consequence of the canalization anddistribution of energy proposed by the model, which isthe only thing kept constant throughout the analyses.
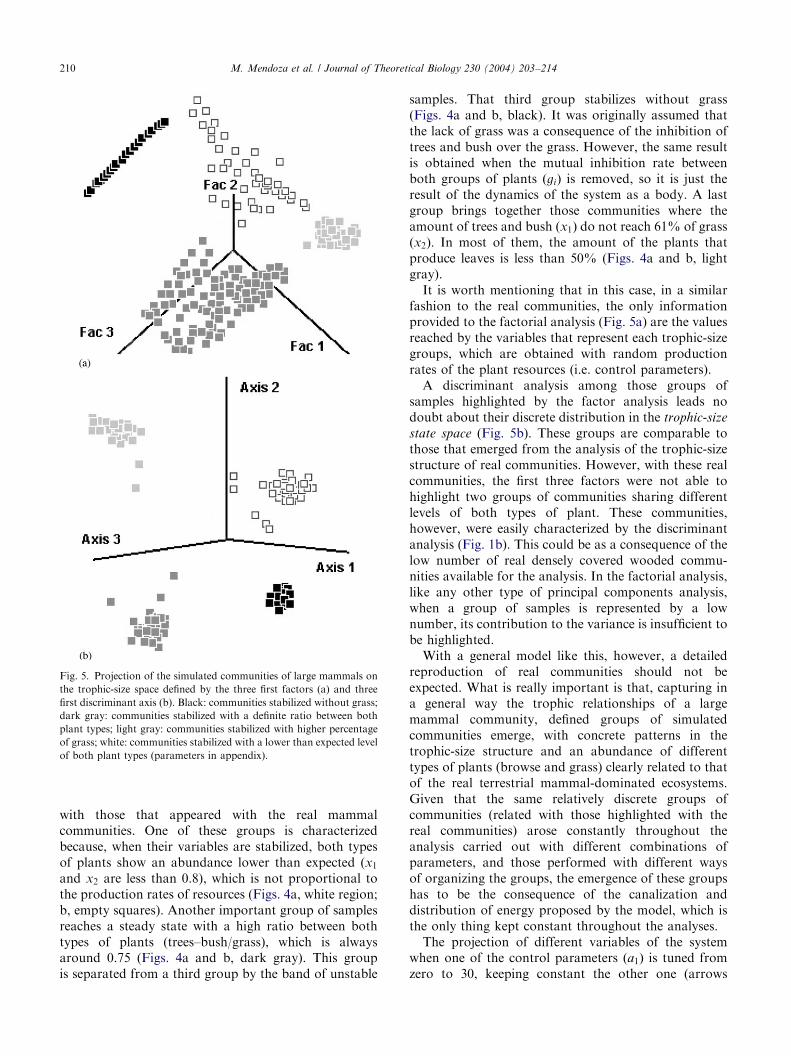
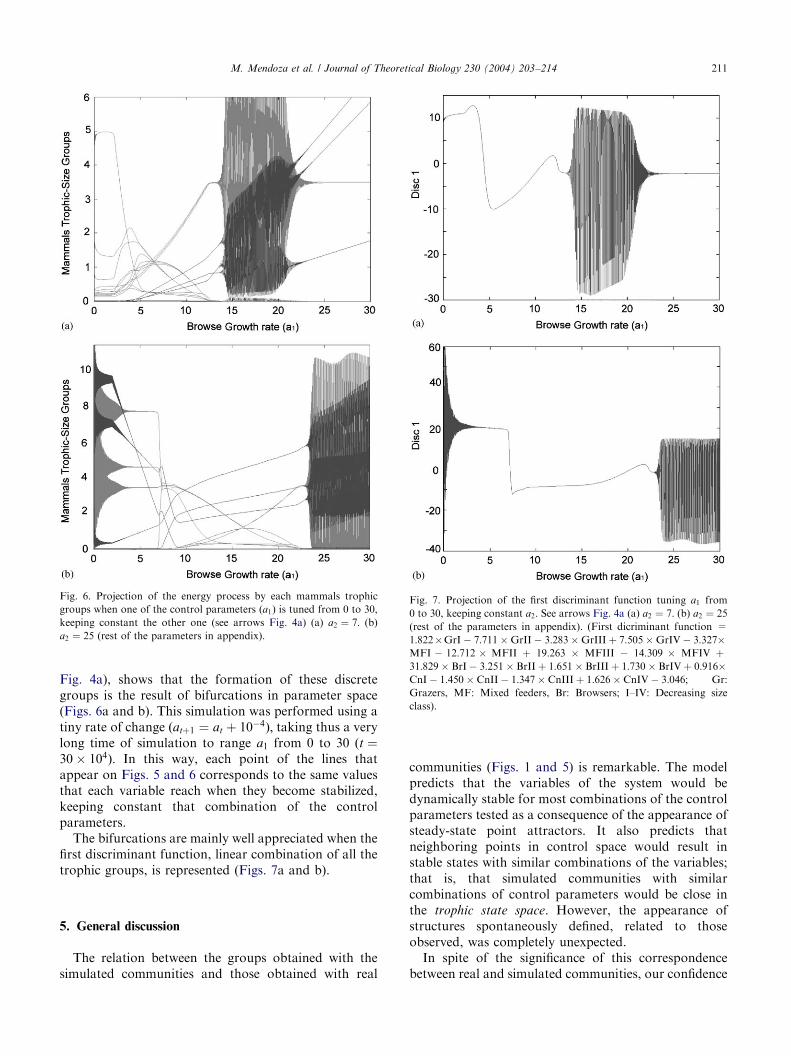
The projection of different variables of the systemwhen one of the control parameters ða1Þ is tuned fromzero to 30, keeping constant the other one (arrows
ARTICLE IN PRESS
Fig. 6. Projection of the energy process by each mammals trophic
groups when one of the control parameters ða1Þ is tuned from 0 to 30,
keeping constant the other one (see arrows Fig. 4a) (a) a2 ¼ 7: (b)
a2 ¼ 25 (rest of the parameters in appendix).
Fig. 7. Projection of the first discriminant function tuning a1 from
0 to 30, keeping constant a2: See arrows Fig. 4a (a) a2 ¼ 7: (b) a2 ¼ 25
(rest of the parameters in appendix). (First dicriminant function =
1:822�GrI� 7:711�GrII� 3:283�GrIIIþ 7:505�GrIV� 3:327�MFI � 12:712 � MFII þ 19:263 � MFIII � 14:309 � MFIV þ31:829� BrI� 3:251� BrIIþ 1:651� BrIIIþ 1:730� BrIVþ 0:916�CnI� 1:450� CnII� 1:347� CnIIIþ 1:626� CnIV� 3:046; Gr:
Grazers, MF: Mixed feeders, Br: Browsers; I–IV: Decreasing size
class).
M. Mendoza et al. / Journal of Theoretical Biology 230 (2004) 203–214 211
Fig. 4a), shows that the formation of these discretegroups is the result of bifurcations in parameter space(Figs. 6a and b). This simulation was performed using atiny rate of change ðatþ1 ¼ at þ 10�4Þ; taking thus a verylong time of simulation to range a1 from 0 to 30 ðt ¼30� 104Þ: In this way, each point of the lines thatappear on Figs. 5 and 6 corresponds to the same valuesthat each variable reach when they become stabilized,keeping constant that combination of the controlparameters.
The bifurcations are mainly well appreciated when thefirst discriminant function, linear combination of all thetrophic groups, is represented (Figs. 7a and b).
5. General discussion
The relation between the groups obtained with thesimulated communities and those obtained with real
communities (Figs. 1 and 5) is remarkable. The modelpredicts that the variables of the system would bedynamically stable for most combinations of the controlparameters tested as a consequence of the appearance ofsteady-state point attractors. It also predicts thatneighboring points in control space would result instable states with similar combinations of the variables;that is, that simulated communities with similarcombinations of control parameters would be close inthe trophic state space. However, the appearance ofstructures spontaneously defined, related to thoseobserved, was completely unexpected.
In spite of the significance of this correspondencebetween real and simulated communities, our confidence
ARTICLE IN PRESSM. Mendoza et al. / Journal of Theoretical Biology 230 (2004) 203–214212
in the model is mainly due to the fact that self-organization is an inevitable consequence in thosesystems that are kept thermodynamically far fromequilibrium, and whose units are interrelated throughpositive feedback relations, such as communities (seeGoodwin, 1994; Hirsh and Smale, 1974; Kauffman,1993; Levin, 1998; Pahl-Wostl, 1997, 2000; Rough-garden, 1998; Schneider and Kay, 1995; Sole et al.,2002).
According to the results of this work, the observedpatterns in the trophic-size structure of the mammalcommunities are the consequence of the type ofecosystem, but, at the same time, the type of ecosystemis led by the presence of the mammal community, whichagrees with Sinclair (2003) description of mammalsas ecological landscaping. In fact, both the trophic-size structure of the large mammal community and thetype of ecosystem seem to be the consequence of thesame process, significantly blurring the cause–effectrelationship between them.
These results support, moreover, the view that theobserved discrete nature of mammal community struc-tures analysed here is the result of bifurcations inparameter space (see, Scheffer et al., 2001). The(dynamic) constraints that emerge from the discretenature of global organization of food webs wouldbe responsible for the observed limited repertoireof qualitative structures present in these complexecosystems.
Here, we have proposed a model defining the under-lying dynamic of communities—or local ecosystems—asintegrated systems. On ecological time-scales, this modelcould explain the origin of the patterns found in thetrophic-size structure of the mammal-dominated eco-systems, and establishes a general mechanism thatallows us to understand how some rules constrain theassembly of the communities (see, Fox, 1999 andreferences therein). Moreover, it constitutes an attemptto explain the significant correlations between variousenvironmental factors and herbivore abundance ordiversity, as shown by a variety of authors (e.g.Belovsky, 1997; Bell, 1982; Coe, 1983; Danell andNiemela, 1996; Du Toit and Owen-Smith, 1989; East,1984; Huston, 1994; McNaughton et al., 1989; Olff et al.,2002; Rosenzweig, 1995; Western and Ssemakula, 1981)taking into account the complex trophic web ofinteractions among the species and their dynamicconsequences.
Additionally, there is active debate within biologicalcircles about the nature of changes in large-scalebiological systems, such as communities or ecosystems.To accept these changes as evolutionary, these systemshave to operate in an integrated way (Eldredge, 1996).The model proposed here makes it possible to seechange of these large-scale biological systems as evolu-tionary. Bambach and Bennington (1996) have analysed
whether change in communities through time is anevolutionary process or is simply the result of therandom change of its constituent species. They examinethe criteria to consider community change as evolu-tionary and conclude that this is not the case, sincecommunities are not independent entities but arbitrarysegments of populations along environmental gradients.Community changes, therefore, cannot be consideredevolutionary.
These conclusions are based on the results of a largenumber of studies, most of them using Q-mode clusteranalysis. In all cases, they find that there are no naturalboundaries between communities in space or time. Inorder to look for these divisions, they analyse the speciesand/or their abundance. However, communities are notnecessarily identified by their constituent species, sincedifferent species can play the same role in differentcommunities. Therefore, it is the processes that takeplace in communities that need to be analysed in orderto characterize them. In those processes it is possible tofind significant differences and even natural boundariesbetween communities.
These authors conclude with additional argumentsin support of the idea that the change producedin communities cannot be considered as evolution.For example, they make clear the inability of commu-nities to reproduce and thus the impossibility ofundergoing a process of heritability and selection. Incontrast, we argue that communities do evolve.Obviously they do not do so like species. As theseauthors point out, communities are not independententities in space and time. Neither do they undergo aprocess of heritable change and selection, although theresults of Swenson et al. (2000) with artificial ecosystemsmight question this. All this, however, does notnecessarily imply that community structure and thechange that communities experience through timeare not a product of their own internal dynamic; i.e.,that does not operate in an integrated way. Wesuggest that communities evolve as integrated dynamicsystems, and that changes in the communities are notthe result of simple random change among theirconstituent species.
Like all integrated dynamic systems, communitieshave a set of parameters that determine their behavior.In the case of terrestrial communities the mostimportant are probably climatic conditions and soilfertility. Through the different plant resource produc-tion rates, these parameters fix the energy that everytrophic-size group can process, constraining the possiblecombinations of species. In general, gradual variationsthrough time of these parameters modify the position ofattractors and their basins, which produce a modifica-tion of the trophic-size structure of the community. Thisis the fundamental way that, according to our model,communities evolve. However, since environmental
ARTICLE IN PRESSM. Mendoza et al. / Journal of Theoretical Biology 230 (2004) 203–214 213
conditions in any given place vary seasonally and eventhrough consecutive years, the attractor that establishesthe trophic structure of the community will slightlychange in position in response to these variations thatcommunities compensate changing the number ofindividuals, and even their weight. Only persistentenvironmental changes would end up affecting thenumber of constituent species.
Moreover, bifurcations would be the cause underl-ying the remarkable observation that communitiesappear to be organized in discrete kinds of eco-systems (i.e. forests, wooded savannas, grasslands,bushlands, etc.), in spite of the gradual change ofmost of environmental conditions (i.e. continuousgradients of rainfall, solar flux, mean temperatures).Parameter variations in the course of time throughbifurcations could be, moreover, the cause of thepattern of change observed in the fossil record thatcombine periods of relative stability in the faunalcomposition of communities with sudden changes(coordinated stasis).
A modification in the trophic-size structure of acommunity implies the extinction from this communityof some species and the appearance of others. This canoccur, in the short to medium term, by immigration ofsome species and the local extinction of some others. Butif immigration is not possible, due to biogeographicalbarriers or other reasons, similar results can by obtainedin the long term by the evolution of some speciestowards other kinds of feeding habits and/or body size.In this way, the evolution of a community as a wholesystem could determine the evolution of their constitu-ent species.
A new work in course incorporates the simulation ofcatastrophic shifts as a consequence of a gradual climatechange (see, Scheffer et al., 2001). Further work willexplicitly incorporate the evolution of network structuretogether with extinction and speciation events (see, e.g.Sole et al., 2002).
In conclusion, we suggest that communities areunitary structures with coherent properties that resultfrom the self-organizing dynamic of the whole system.The initial flux of energy into the system is partitionedamong different classes of primary producers, onwhich herbivores with distinct feeding preferencesdepend, followed by carnivores that again fall intodistinct classes according to prey size. The dynamicproperties of the whole reflect constraints on thetrophic-size organization of the system and result instable points that can be grouped in different types oforganization, despite continuous environmental gradi-ents that determine overall energy flux through thesystem. This type of dynamic structure fits observedecosystem organization, and provides a basis foridentifying communities as self-organizing units thatundergo evolutionary change.
Acknowledgements
We gratefully acknowledge to the World Conserva-tion Monitoring Centre in Cambridge (UK) the freeaccess to its extensive information. We also would liketo thank Dr Manuel Castro for help with computerprogramming and Douglas Brown for proofreading themanuscript. Finally, we would like to thank Drs Johanvan de Koppel, Miguel Angel Medina, Paul Palmqvist,Manuel Mar!ı-Beffa, Raimundo Real, Christine Janis,Stephan Harding, John Damuth, James A. Drake andJose Iriarte, as well as Ricard Sole and anotheranonymous referee, whose advice and criticism washelpful in improving the manuscript.
Appendix
n ¼ 0:001;b1 ¼ b2 ¼ 0:2;g1 ¼ 0; g2 ¼ 0:1;c11 ¼ 0:125; c12 ¼ 0:5; c13 ¼ 0:875; c2k ¼ 1� c1k;h1 ¼ 0:1; h2 ¼ 0:075; h3 ¼ 0:05; h4 ¼ 0;s1 ¼ 0:1; s2 ¼ 0:05; s3 ¼ 0:1;e1 ¼ e2 ¼ e3 ¼ e4 ¼ 0:35;d11 ¼ 0:4; d12 ¼ 0; d13 ¼ 0; d14 ¼ 0;d21 ¼ 0:5; d22 ¼ 0:4; d23 ¼ 0:1; d24 ¼ 0;d31 ¼ 0:1; d32 ¼ 0:5; d33 ¼ 0:4; d34 ¼ 0:1;d41 ¼ 0; d42 ¼ 0:1; d43 ¼ 0:5; d44 ¼ 0:9:
References
Bambach, R.K., Bennington, J.B., 1996. Do communities evolve? A
major question in evolutionary Paleoecology. In: Jablonski, D.,
Douglas, H.E., Lipps, J.H. (Eds.), Evolutionary Paleobiology,
Vol. 6. Chicago University Press, Chicago and London,
pp. 123–160.
Bell, R.H.V., 1982. In: Huntly, B.J., Walker, B.H. (Eds.), Ecology of
Tropical Savannas. Springer, Berlin, pp. 193–216.
Belovsky, G.E., 1997. Optimal foraging and community structure: the
allometry of herbivore food selection and competition. Evol. Ecol.
11, 641–672.
Case, T.J., 2000. An Illustrated Guide to Theoretical Ecology. Oxford
University Press, New York, Oxford.
Coe, M., 1983. In: Lee, J.A., McNeill, J., Rorison, I.H. (Eds.),
Nitrogen as an Ecological Factor. Blackwell, Buscar, Oxford, pp.
345–368.
Damuth, J.D., 1981. Population density and body size in mammals.
Nature 290, 699–700.
Damuth, J.D., 1995. Of size and abundance. Nature 351, 268–269.
Danell, K.L.P., Niemela, P., 1996. Species richness in mammalian
herbivores: patterns in the boreal zone. Ecography 19,
404–409.
Davis, J., 1986. Statistics and Data Analysis in Geology. Wiley,
New York.
Diamond, J.M., 1975. Assembly of species communities. In: Cody,
M.L., Diamond, J.M. (Eds.), Ecology and Evolution of Commu-
nities. Belknap Press of Harvard University Press, Cambridge,
MA, pp. 342–444.
ARTICLE IN PRESSM. Mendoza et al. / Journal of Theoretical Biology 230 (2004) 203–214214
Drake, J.A., 1990. The mechanics of community assembly and
succession. J. Theor. Biol. 147, 213–233.
Drake, J.A., 1991. Community-assembly mechanics and the structure
of an experimental species ensemble. Amer. Nat. 137, 1–26.
Du Toit, J.T., Owen-Smith, N., 1989. Body size, population
metabolism and habitat specialization among large African
herbivores. Amer. Nat. 133, 736–740.
East, R., 1984. Rainfall, nutrient status and biomass of large African
savannah mammals. Afr. J. Ecol. 22, 245–270.
Eldredge, N., 1996. Hierarchies in Macroevolution. In: Jablonski, D.,
Douglas, H.E., Lipps, J.H. (Eds.), Evolutionary Paleobiology. Vol.
3, Chicago University Press, Chicago and London, pp. 43–61.
Fox, B.J., 1999. The genesis and development of guild assembly rules.
In: Weither, E., Keddy, P. (Eds.), Ecological Assembly Rules:
Perspectives, Advances, Retreats. Vol. 1, University Press, Cam-
bridge, pp. 23–57.
Fox, B.J., Brown, J.H., 1993. Assembly rules for functional groups in
North America desert rodent communities. Oikos 67, 358–370.
Fox, B.J., Brown, J.H., 1995. Reaffirming the validity of the assembly
rule for functional groups or guilds. Oikos 73, 125–132.
Fox, B.J., Luo, J., 1996. Estimating competition coefficients in the
field: a validity test of the regression method. Oikos 77, 291–300.
Gilpin, M.E., Carpenter, P., Case, T.J., 1986. The assembly of a
laboratory community: multispecies competition in Drosophila. In:
Diamond, J.M., Case, T.J. (Eds.), Community Ecology. Harper &
Row, New York, pp. 23–40.
Goodwin, B., 1994. How the Leopard Changed its Spots; the
Evolution of Complexity. Weidenfeld and Nicolson, London.
Hirsh, M.W., Smale, S., 1974. Differential Equations, Dynamical
Systems and Linear Algebra. Academic Press, New York.
Holling, C.S., 1959. The components of predation as revealed by a
study of small-mammal predation of the european pine sawfly. The
Canadian Entomologist 91, 293–320.
Holling, C.S., 1965. The functional response of predators to prey
density and its role in mimicry and population regulation. Memoirs
of the Entomological Society of Canada 45, 3–60.
Huston, M.A., 1994. Biological Diversity. The Coexistence of Species
on Changing Landscapes. Cambridge University Press, Cambridge.
Kauffman, S.A., 1993. The Origins of Order. Oxford University Press,
New York.
Levin, S.A., 1998. Ecosystems and the biosphere as complex
adaptative systems. Ecosystems 1, 431–436.
May, R.M., 1973. Stability and Complexity in Model Ecosystems.
Princeton University Press, Princeton, NJ.
May, R.M., 1976. Simple mathematical models with very complicated
dynamics. Nature 261, 439–467.
May, R.M. (Ed.), 1981. Models for single populations. In: Theoretical
Ecology: Principles and Applications. Sinauer, Sunderland, MA.
M’Closkey, R.T., 1978. Niche separation and assembly in four species
of Sonoran Desert rodents. Amer. Nat. 112, 683–694.
M’Closkey, R.T., 1985. Species pools and combinations of heteromyid
rodents. J. Mammal. 66, 132–134.
McNaughton, S.J., Oesterheld, M., Frank, D.A., Williams, K.J., 1989.
Ecosystem-level patterns of primary productivity and herbivory in
terrestrial habitats. Nature 341, 142–144.
Mendoza, M., 2002. Algoritmos para la identificaci !on de patrones
ecomorfol!ogicos en mam!ıferos: contribuciones en Paleoecolog!ıa
Evolutiva. Ph. D. Thesis, Universidad de Malaga.
Mendoza, M., Janis, C.M., Palmqvist, P., 2002. Characterizing
complex craniodental patterns related to feeding behavior in
ungulates: a multivariate approach. J. Zool. 258, 223–246.
Mendoza, M., Janis, C.M., Palmqvist, P. Ecological patterns in
the trophic-size structure of mammal communities: a taxon-
free characterization. Evol. Ecol. Res., submitted for
publication.
Novak, R.M., 1999. Walker’s Mammals of the World. Johns Hopkins
Press, Baltimore, MD.
Olff, H., Ritchie, M.E., Prins, H.H.T., 2002. Global environ-
mental controls of diversity in large herbivores. Nature 415,
901–904.
Pahl-Wostl, C., 1991. Spatiotemporal organization in complex
systems. In: Ebeling, W., Peschel, M., Weidlich, W. (Eds.), Models
of Self-organization in Complex Systems. Akademie-Verlag,
Berlin, pp. 134–141.
Pahl-Wostl, C., 1997. Dynamic structure of a food web model:
comparison with a food chain model. Ecol. Modelling 100,
103–123.
Pahl-Wostl, C., 2000. Ecosystems as dynamical networks. In: Jø
rgensen, S.E, et al. (Ed.), Handbook of Ecosystem Theories and
Management. Lewis Publications, Boca Raton, pp. 317–345.
Pattee, H.H., 1987. Instabilities and information in biological self-
organization. In: Yates, F.E. (Ed.), self-organizing Systems: The
Emergence of Order. Plenum Press, New York.
Prigogine, I., 1980. From Being to Becoming: Time and Complexity in
the Physical Sciences. Freeman and Company, San Francisco.
Rosenzweig, M.L., 1995. Species Diversity in Space and Time.
Cambridge University Press, Cambridge.
Roughgarden, J., 1998. Primer of Ecological Theory. Stanford
University. Prentice-Hall, Upper Saddle River, NJ.
Schaller, G.B., 1972. The Serengeti Lion. A Study of Predator–Prey
Relations. University of Chicago Press, Chicago.
Scheffer, M., Carpenter, S., Foley, J.A., Folke, C., Walker, B., 2001.
Catastrophic shifts in ecosystems. Nature 413, 591–596.
Schneider, E.D., Kay, J.J., 1995. Order from disorder: the thermo-
dynamics of complexity in biology. In: Murphy, M.P., O’Neill,
L.A.J. (Eds.), What is Life? The Next Fifty Years. Cambridge
University Press, Cambridge, UK.
Sinclair, A.R.E., 2003. Mammal population regulation, keystone
processes and ecosystem dynamics. Philos. Trans. Roy. Soc.
London B 358, 1729–1740.
Sole, R.V., Montoya, J.M., Erwin, D.H., 2002. Recovery from
mass extinction: evolutionary assembly in large-scale bio-
sphere dynamics. Philos. Trans. Roy. Soc. London Ser. B. 357,
697–707.
Swenson, W., Wilson, D.S., Elias, R., 2000. Artificial ecosystem
selection. Proc. Natl. Acad. Sci. 97, 9110–9114.
Ulanowicz, R.E., 1997. Ecology, The Ascendent Perspective. Colum-
bia University Press, New York, pp. 224.
Western, D., Ssemakula, J., 1981. The future of savanna ecosystems:
ecological islands or faunal enclaves? Afr. J. Ecol. 19, 7–19.