Embed Size (px)
Citation preview
MEASURING PERFORMANCE OF
IT INVESTMENTS: IMPLEMENTING
THE IT CONTRIBUTION MODEL
Marc J. Epstein and Adriana Rejc Buhovac
ABSTRACT
The pressure to remain competitive in a dynamic, global economy forcesorganizations to consider the results-based approach when deciding oninvestments in information technology (IT). Senior IT managers areconvinced that they do create value and believe that if measured properlyand with adequate support, they would be significant profit centers fortheir organizations. However, without adequate performance evaluationsystems they have difficulties proving the value-adding role of IT and findthemselves continually fighting for and justifying the resources that areneeded. The chapter provides a model and a methodology for evaluatingperformance in IT to help CIOs AU :1better justify and evaluate their initiativesand aid CEOs and CFOs in making better resource allocation decisions.The IT Contribution Model and the subsequent IT Payoff Methodologyis illustrated by and empirically tested in Istrabenz Group, an inter-national group engaged in food, investments, tourism, and energy. Thestudy shows that the methodology’s requirement for active employeeinvolvement in the identification of the critical drivers of success, the
1
3
5
7
9
11
13
15
17
19
21
23
25
27
29
31
33
35
37
39
Advances in Management Accounting, Volume 17, 43–79
Copyright r 2008 by Emerald Group Publishing Limited
All rights of reproduction in any form reserved
ISSN: 1474-7871/doi:10.1016/S1474-7871(08)17002-2
43
expected outputs of the IT initiative, in particular, substantially facilitatesthe IT initiative implementation by increasing the level of understandingand acceptance.
INTRODUCTION
There have been significant discussions in both the managerial and academicliterature concerning the payoffs of information technology (IT) invest-ments. Many senior business managers have questioned IT’s contribution totheir bottom line (Leavitt, 1999; Schwartz, 1999; Carr, 2003, 2004). Indeed,cumulative results from the earlier studies, which examined the relationshipbetween IT investment and firm performance, along with economics-basedstudies investigating IT productivity, were plagued with ambiguities andinconsistencies (Strassman, 1990; Weill, 1992; Loveman, 1994). Recentstudies, however, examining the value of IT investment in two researchstreams, one using production economics and the other focusing on ‘process-oriented’ models, have been more encouraging (Barua & Mukhopadhyay,2000). Research in both streams managed to mitigate the earlier skepticismon the IT payoffs (Barua & Lee, 1997; Mukhopadyay, Kekre, & Kalathur,1995). In production economics, Brynjolfsson and Hitt (1996) reportedpositive returns on IT investment. Aral, Brynjolfsson, and Wu (2006) findevidence that the use of ERP causes performance increases rather thanperformance inspiring ERP purchases. But also, that success with ERPencourages adoption of extended enterprise systems, which in turn improveproductivity and operational performance. Examples of similar positive resultsof process-oriented studies include Davies, Dehning, and Stratopoulous(2003), Love and Irani (2004), and Lee (2001). Lim, Richardson, and Roberts(2004) posit that contextual factors moderate the relationship between ITinvestment and firm performance. Byrd, Lewis, and Bryan (2006) indicatethat there is a synergistic coupling between strategic alignment and ITinvestment with firm performance. Business process redesign and humancapital also influence the impact of IT investment on firm performance(Davern & Kaufman, 2000). Brynjolfsson (2003), similarly, finds that thegreatest IT benefits are realized when an IT investment is coupled with aspecific set of complementary business investments.
Despite empirical evidence on tangible outcomes of investing in IT, so far,there has been little guidance of how to design or implement an appropriateIT performance evaluation system. On the one hand, there was a shortage
1
3
5
7
9
11
13
15
17
19
21
23
25
27
29
31
33
35
37
39
MARC J. EPSTEIN AND ADRIANA REJC BUHOVAC44

of relevant metrics. On the other hand, even approaches such as thebalanced scorecard and shareholder value analysis that do provide overallframeworks for analysis and management, need additional specificityand definition. Increased specificity was necessary to model, measure, andmanage the organizational links that operationalize these approaches.Therefore, even financial managers that have expertise in managementcontrol and performance measurement have not focused on the benefits ofIT and have not developed the appropriate measures. Consequently, thepayoffs of IT are not measured, ROI AU :2is not calculated, and IT investmentsare not evaluated with the same rigor as other corporate investments.Furthermore, CEOs and CFOs lacked information to make well-informeddecisions on the payoffs of these investments and, as a consequence,corporate goals seem to focus on reduction of the costs of IT rather thanmaximizing the IT value creation activities.
As IT managers must show the payoffs of IT investment to convince keyexecutives that they should be strong supporters of IT efforts, a frameworkfor evaluation of IT performance is a significant need. Few things are moreconvincing to top executives than measurable results. We provide a model anda methodology for evaluating performance in IT in both for-profit and non-profit organizations to help CIOs better justify and evaluate their initiativesand aid CEOs and CFOs in making better resource allocation decisions. Morespecifically, we develop a model of key factors for organizational success in ITintegration (IT Contribution Model) that includes four dimensions: the criticalinputs and processes that lead to success in IT outputs and ultimately tooverall organizational success (outcome). The methodology further articulateseach of the key factors (antecedents and consequences of IT success) asobjectives and outlines the specific drivers of IT success based on theseobjectives. It identifies the causal relationships between the drivers anddevelops performance measures for improved management control. Finally,it provides the IT ROI calculation formula following the cause-and-effectrelationships between the drivers of IT success. The metrics can be used forboth IT project’s justification prior to its start (planning) as well as forevaluation after completion (performance measurement).
This comprehensive albeit pragmatic methodology is empirically testedin Istrabenz Group, a four-division holding company. The methodologywas applied in the Tourism division, which was facing the challenge ofjustifying the introduction of a uniform information system for supportingthe operation of all the hotels in the division. The selected case provides asuitable empirical context for testing since in 2005, the company adoptedguidelines on the use of information and communication technology (ICT),
1
3
5
7
9
11
13
15
17
19
21
23
25
27
29
31
33
35
37
39
Measuring Performance of IT Investments 45

from which it follows that this area is one of the key factors of the IstrabenzGroup for achieving its strategic business goals. The company leadersrecognized the strategic role IT integration can play in the strategyimplementation process, but required IT investments to be evaluated withthe same rigor as other corporate investments.
The chapter has both academic and managerial implications. From theacademic perspective, the presented model and the methodology make atwofold contribution. Firstly, the model builds on the process-orientedstudies examining the value of IT investment; it upgrades the existingliterature by offering an integrated model of critical drivers of IT success.Secondly, the methodology represents a more complete analytical tool forevaluating the payoffs of investing in IT based on the proposed model. Themethodology includes the identification of the antecedents and conse-quences of IT investments, develops the cause-and-effect relationshipsbetween the drivers and outcomes, helps identify and measure marginalcosts and benefits of the IT initiative to calculate the IT ROI, and providesperformance measures for managerial control of the IT initiative.
From the practical perspective, with the IT Contribution Model, managerscan implement a performance measurement system to more effectivelyevaluate the effectiveness of IT investments, which can lead to dramaticimprovements in decision-making, corporate resource allocations, andperformance. More specifically, the new methodology will help theaccounting and finance professionals that deal with the challenges ofperformance measurement and control in IT. CIOs, CTOs, and senior ITmanagers will better understand how IT contributes to higher levels ofcorporate performance, more easily evaluate the profitability of ITinvestments, and make better resource allocation decisions. CEOs, CFOs,and other decision makers will be able to identify, document, measure, andcommunicate the short-term results and long-term impacts of IT invest-ments. This includes both cost savings and value creation, and thus providesarguments for additional IT resources when appropriate.
The chapter is organized as follows. The first section provides a review ofthe existing methodologies used to measure performance of IT investments.In the second section, we describe the IT Contribution Model and themethodology to calculate IT payoff. We apply the model to the case ofIstrabenz Group, the Tourism division, in the third section in an empiricaltest of the proposed model. Finally, we discuss the practical implicationsof the proposed model and the empirical testing, address the study’slimitations, and point to some critical performance measurement imple-mentation issues.
1
3
5
7
9
11
13
15
17
19
21
23
25
27
29
31
33
35
37
39
MARC J. EPSTEIN AND ADRIANA REJC BUHOVAC46
AN OVERVIEW OF THE RECENTLY DEVELOPED ITPERFORMANCE MEASUREMENT
METHODOLOGIES
With CEOs and CFOs demanding accountability for the tremendous invest-ment in IT, IT managers are required to ensure accountability, calculate thereturn on investment, develop a value-added approach, and make a bottom-line contribution. Generally, however, there has been little guidance of howto design or implement an appropriate IT performance evaluation system,i.e., how to identify and document the contribution of IT to high-performance organizations.
Total Cost of Ownership (TCO) analysis AU :3(Gartner Group, 1997), some-times referred to as total cost of operation, ideally offers a final statementreflecting not only the cost of purchase of software and hardware but allaspects in the further use and maintenance of the equipment, device, orsystem considered. This includes the costs of training support personnel andthe users of the system, costs associated with failure or outage (planned andunplanned), diminished performance incidents (i.e., if users are keptwaiting), costs of security breaches (in loss of reputation and recoverycosts), costs of disaster preparedness and recovery, floor space, electricity,development expenses, testing infrastructure and expenses, quality assur-ance, boot image control, marginal incremental growth, decommissioning,e-waste handling, and more. When incorporated in any financial benefitanalysis (e.g., ROI, IRR, EVA), TCO provides an excellent cost basisfor determining the economic value of that investment. However, it isinsufficient as it does not address the benefits arising from an IT investment.Also, most of what is measured in the TCO analysis is owned by the ITorganization while real business benefits can only be determined and ownedby the responsible parts of the organization.
Strassman developed a ratio called Information Productivity (IP), which isthe ratio of the Economic Value-Added (EVA) to the total cost ofinformation management (Strassman, 1999). With IT, being one of thefastest growing components of the costs of information management, thismetric is designed to reflect an organization’s success at converting the costsof information management into profit. As such, this approach cannot beused for determining an IT initiative payoff.
Another proposal is to expand conventional financial measurement likereturn on investment and payback period to an eBusiness context, which is awhole-view measurement of business performance across both internal andexternal constituents (Cameron, Meringer, Dawe, & Jastrzembski, 2000).
1
3
5
7
9
11
13
15
17
19
21
23
25
27
29
31
33
35
37
39
Measuring Performance of IT Investments 47

By setting weighted eBusiness objectives relating to end-customer success,hyper-partnering efficiency, and multi-organization financial performanceand applying quantitative and qualitative impact metrics, organizations cantrack a project’s impact on a given eBusiness objective.
In yet another approach, Intel has developed a Business Value Index(BVI) (Intel, 2003; Curley, 2004). BVI is a component index of factors thataffect the value of an IT investment. It evaluates IT investments along threevectors: IT business value, impact on the IT efficiency, and the financialattractiveness of the investment. All three AU :4vectors use a predeterminedset of defining criteria that includes customer need, business and technicalrisks, strategic fit, revenue potential, level of required investment, and theamount of innovation and learning generated. Each criterion is weighted,and project managers or program owners score their projects againstthese criteria to produce total scores for each of the three vectors. Bygraphically depicting the three indices for each project, BVI methodologyprovides some decision support to managers to compare and contrastinvestments, and then determine the investments that align best with theirbusiness priorities.
Enterprise Resource Payback (IFS Resource Payback) (EAC Report,2005) is considered a more complete analysis of an IT investment return thatthe ROI as it looks at the overall payback that enterprise software can offerto a company. It includes not only quantifiable improvements in bottom andtop line functionality, but also more qualitative measures – such as newbusiness opportunities, new customer and partner relations, and improvedtime to market – that contribute significantly to the success of a company’senterprise software implementation and use. Increased quest for account-ability in IT, however, demands measurement rather than assessments andassigning monetary value to IT outputs.
IT Value Mapping (Hajela, 2005) is considered a holistic framework thatquantifies and visually depicts it capabilities of an organization. It createsdiagrams, or value maps, to depict the state of key business and ITcomponents at any given point in time. It also depicts the impact of eachcomponent’s ‘state’ on business value. This approach is used to maximizereturns on IT investments by eliminating IT investments that are not in linewith business imperatives (as seen from the value maps depictingorganizational and IT capabilities) and managing the remaining investmentsto improve returns. It is not used for calculating IT returns per se.
Total Value of Opportunity Approach (Apfel, 2002) is a methodologythat measures business performance of an IT initiative by including theimportant factors of risk, time, and an assessment of the organization’s
1
3
5
7
9
11
13
15
17
19
21
23
25
27
29
31
33
35
37
39
MARC J. EPSTEIN AND ADRIANA REJC BUHOVAC48

ability to convert projected value into actual business benefit. Themethodology is based on the cost/benefit analysis where the costs are doneon the basis of the TCO principles, whereas benefits are modeled against allof the controllable activities of the company. The metrics are monitoredbefore, during, and after implementation to determine how the projectedvalue is being delivered.
The so called emerging IT valuation measures also include appliedinformation economics that uses scientific and mathematical methods toevaluate the IT investment process, EVA, economic value sourced thatquantifies the dollar value of risk and time and adds these in the valua-tion equation, portfolio management that manages IT assets from aninvestment perspective by calculating risks, yields, and benefits, and realoption valuation that tracks ‘assets in place’ and ‘growth options’ to presentthe widest array of future possibilities (Davies et al., 2003). Not only arethey difficult to apply, they also fail to shed light on how the IT value isgenerated.
Other approaches can be found in Tardugno, DiPasquale, and Matthews(2000), Remenyi, Money, and Sherwood-Smith (2000), Murphy (2002),Devaraj and Kohli (2002), Lutchen (2004), Weill and Ross (2004), andSchubert (2004).
Though all of these approaches are helpful, they have critical limitationsas discussed above. Various approaches and methodologies fall short onproviding information on how to make better IT decisions based uponthe analysis. Also, in many organizations, after the business initiative waslaunched, the project was not monitored or benchmarked against theoriginal projected benefits. Performance measures were not specified forsubsequent managerial control. Specific tools for the identification andmeasurement are necessary. In this chapter, we attempt to provide a usefulmodel and a methodology that will help organizations measure an ITinitiative’s payoff in a more comprehensive way and execute efficientmanagement control.
THE IT CONTRIBUTION MODEL AND THE IT
PAYOFF METHODOLOGY
To properly assess the payoffs of investments in IT, organizations mustimplement comprehensive systems to evaluate impacts of IT initiatives onfinancial performance. In Fig. 1, we provide the IT Contribution Model
1
3
5
7
9
11
13
15
17
19
21
23
25
27
29
31
33
35
37
39
Measuring Performance of IT Investments 49
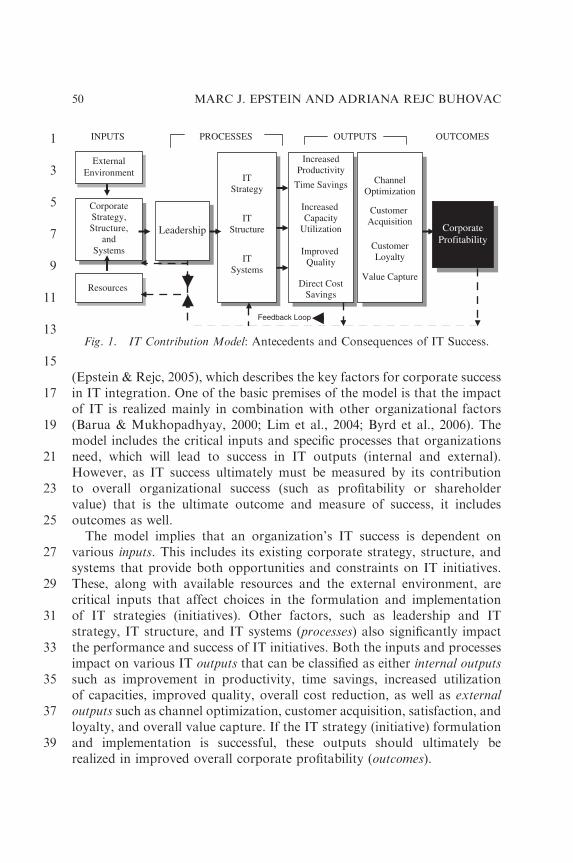
(Epstein & Rejc, 2005), which describes the key factors for corporate successin IT integration. One of the basic premises of the model is that the impactof IT is realized mainly in combination with other organizational factors(Barua & Mukhopadhyay, 2000; Lim et al., 2004; Byrd et al., 2006). Themodel includes the critical inputs and specific processes that organizationsneed, which will lead to success in IT outputs (internal and external).However, as IT success ultimately must be measured by its contributionto overall organizational success (such as profitability or shareholdervalue) that is the ultimate outcome and measure of success, it includesoutcomes as well.
The model implies that an organization’s IT success is dependent onvarious inputs. This includes its existing corporate strategy, structure, andsystems that provide both opportunities and constraints on IT initiatives.These, along with available resources and the external environment, arecritical inputs that affect choices in the formulation and implementationof IT strategies (initiatives). Other factors, such as leadership and ITstrategy, IT structure, and IT systems (processes) also significantly impactthe performance and success of IT initiatives. Both the inputs and processesimpact on various IT outputs that can be classified as either internal outputssuch as improvement in productivity, time savings, increased utilizationof capacities, improved quality, overall cost reduction, as well as externaloutputs such as channel optimization, customer acquisition, satisfaction, andloyalty, and overall value capture. If the IT strategy (initiative) formulationand implementation is successful, these outputs should ultimately berealized in improved overall corporate profitability (outcomes).
1
3
5
7
9
11
13
15
17
19
21
23
25
27
29
31
33
35
37
39
CorporateStrategy,Structure,
andSystems
Resources
Leadership
ChannelOptimization
Customer Acquisition
CustomerLoyalty
Value Capture
CorporateProfitability
Feedback Loop
INPUTS PROCESSES OUTPUTS
ExternalEnvironment
OUTCOMES
ITStrategy
ITStructure
ITSystems
IncreasedProductivity
Time Savings
Increased Capacity
Utilization
Improved Quality
Direct CostSavings
Fig. 1. IT Contribution Model: Antecedents and Consequences of IT Success.
MARC J. EPSTEIN AND ADRIANA REJC BUHOVAC50

The viability of any IT initiative must therefore be estimated throughproper evaluation of external environment and inputs available in anorganization. Managers responsible for planning and developing ITinitiatives must also consider the processes necessary to drive superiorIT performance. Leadership of the organization, for example, must beknowledgeable about IT, committed to the IT initiatives, and aware of theimpacts of existing organizational culture and behavioral patterns that mayact as impediments to effective implementation of new IT initiatives. Topmanagement involvement is an important factor in IT success (Armstrong &Sambamurthy, 1999). Similarly, it is essential that IT systems such asspecialized HR practices for IT departments, IT training, performancemeasurement, and management control are part of the processes pertinentto IT. In many organizations, the gap between the rate of technologyinnovation and employees’ skills and knowledge to use these innovationsproductively is growing preventing IT efforts to realize its full potential.Also critical is the alignment of the IT strategy with the corporate strategyand the establishment of appropriate IT structure.
If the IT initiatives are well designed and executed, the identified inputsand processes should lead to improved performance in outputs, andultimately to increased corporate financial performance. The overall outputsof IT initiatives can be divided into two categories. Internal outputs relateto increased productivity, time savings, increased capacity utilization,improved quality, and direct cost savings. Increased productivity, forexample, is one of the expected immediate benefits of new IT programsand projects. Improvements in IT infrastructure, for example, in terms offully integrated application systems allow for better access to databases,faster exchange of information, reduced operating cycles, and so forth. Inaddition, the standardization of IT work processes, segmentation of thework, and global dispersion for greatest efficiency permit numerousimprovements. These include reuse of applications and technical architec-tures, automation of much of the delivery process, and codification ofmethodologies so that they can be repeated, which all greatly increasesproductivity. IT can reduce the firm’s fixed overhead costs, or reduce thevariable costs of designing, developing, or manufacturing a product(Thatcher & Oliver, 2001). The financial consequences of improvements ininternal outputs are all reflected in cost savings or, potentially, in increasedsales. The external outputs, on the other hand, relate to achievementsrealized in the market and cover a broad array of results with respect tochannel optimization, customer acquisition, loyalty, and retention, andoverall value capture. Customer acquisition, for example, can significantly
1
3
5
7
9
11
13
15
17
19
21
23
25
27
29
31
33
35
37
39
Measuring Performance of IT Investments 51
be increased by creating and using new channels of providing customerswith products and services. Organizations, for example, that move morecommerce to the web can accomplish expanded global coverage andexposure with a relatively minimal investment. For a more detaileddescription of all internal and external outputs, see Epstein and Rejc (2005).
For IT initiatives to be of value, the intermediate outputs must eventuallypayoff in increased organizational success (corporate profits). Viewed simply,increased profitability can only be achieved through reduced costs orimproved revenues. Thus, in order to prove that IT investments in programsand projects were financially sound, the ultimate effect on corporate financialprofitability must be determined and the payoffs clearly documented.
Following the IT Contribution Model, we propose a 6-step methodologythat identifies critical drivers of an IT initiative success and creates causalrelationships among these drivers. The visual presentation of the causalityof drivers helps better understand how the inputs, processes, outputs, andoutcomes of an IT initiative are interrelated. The methodology thus enablesprecise identification and measurement of all present and future marginalcosts and benefits of IT initiatives fundamental for a comprehensive andobjective calculation of IT initiative payoff. Finally, it also developsperformance measures for the drivers that can be used for managerialcontrol after an IT initiative is launched (see Fig. 2).
STEP 1: IT Initiative Overall Purpose and Goals
The IT Payoff Methodology starts by an overall description of an ITinitiative purpose – Why should an IT initiative be implemented? Whatare the overall business outcomes of the project? – and goals – What are theexpected direct results of an IT initiative? The overall purpose and goals canbe stated as narratives but must clearly reflect the alignment of the ITinitiative (solution) with the business. This will ensure project alignmentwith business imperatives and accountability for stated purpose and goals.
STEP 2: The IT Contribution Model: Identify Relevant Inputs, Processes,Outputs, and Outcomes
Step 2 introduces the IT Contribution Model that helps identify all requiredinputs and processes of an IT initiative, as well as expected outputs, andoutcomes. Critical drivers specify more precisely the keys to IT success and
1
3
5
7
9
11
13
15
17
19
21
23
25
27
29
31
33
35
37
39
MARC J. EPSTEIN AND ADRIANA REJC BUHOVAC52

the actions that managers must take to improve the success of the ITactivities that will ultimately impact on overall organizational success. Withthe IT Contribution Model, an IT initiative antecedents and consequencescan be determined more comprehensively which is needed for a visualpresentation of the causality of drivers, the designing of performancemeasures, identification of relevant benefits and cost, and the calculation ofan IT payoff.
STEP 3: Identify Causal Relationships between theDrivers of IT Initiative Success
After having identified specific drivers of IT success, their causal relation-ships must be developed (see Fig. 3).
1
3
5
7
9
11
13
15
17
19
21
23
25
27
29
31
33
35
37
39
Step 5
Step 6
IT initiative overallpurpose and goals
The IT Contribution Model: Identify relevant inputs, processes,
outputs, and outcomes (drivers)
Identify relevant benefits and costs (operating
and capital)
Step 3
Step 4
Step 2
Design performance measures for
tracking
Step 1
Identify causal relationships between the drivers
of IT initiative success
the monetary value of IT initiative benefits
the total costs of IT initiative
Calculate Calculate
Calculate the IT initiative payoff
Fig. 2. The IT Payoff Methodology.
Measuring Performance of IT Investments 53

A clear understanding of the cause-and-effect relationships underlying theprimary drivers of value in an IT initiative is one of the most importantdeterminants of its success. In practice, there are numerous drivers of ITsuccess and the ones outlined in Fig. 3 do not attempt to cover all choices.On the other hand, the illustrated example is comprehensive. In practice,there should be fewer critical IT performance drivers and the illustration ofthe causality of IT performance drivers less complex.
Fig. 3 shows, for example, that if organizations align the corporateand IT strategy, then they will potentially obtain more resources to spendon IT technology. More resources spent on IT technology can enable themto consolidate and standardize IT infrastructure leading to improved ITprocesses, increased productivity and quality, and decreased costs.Similarly, if organizations devote more resources to enhance IT productsand services, they can increase delivery options leading to higher customersatisfaction, sales, and revenues.
1
3
5
7
9
11
13
15
17
19
21
23
25
27
29
31
33
35
37
39
Data handling improvements
Increased revenues Decreased costs
External environment including competitor offerings
New products online
Optimal outsourcing of IT work
Improved IT processes
Increased delivery options
Production/service improvements
Customer satisfaction and loyalty
IT spending (technology, processes, people)
Enhanced IT products and services
Expanded markets
New customer acquisition
Greater sales
Increased productivity
IT literate managers
and employees
Aligned corporate and IT strategy
Improved quality
Increased strategic alliances
Needed IT knowledge and skills
Time savings
Data handling improvements
Consolidated and standardized IT infrastructure
Increased Corporate Profits/ Organizational Success
Inputs
Processes
Outputs: external & internal
Outcomes
Fig. 3. Causality of IT Performance Drivers.
MARC J. EPSTEIN AND ADRIANA REJC BUHOVAC54

Causal relationships between drivers within each of the four dimensionsas well as between drivers in different dimensions are based on hypotheticalassumptions of causes and effects, i.e., leading and lagging elements. Inpractice, the notion of leading versus lagging elements should be thought ofas a continuum, as, for example, improved IT processes leads to timesavings, but at the same time lags the IT spending. These hypothesizedrelationships need to be continuously tested and revised.
STEP 4: Identify Relevant Benefits and Costs (Operating and Capital)
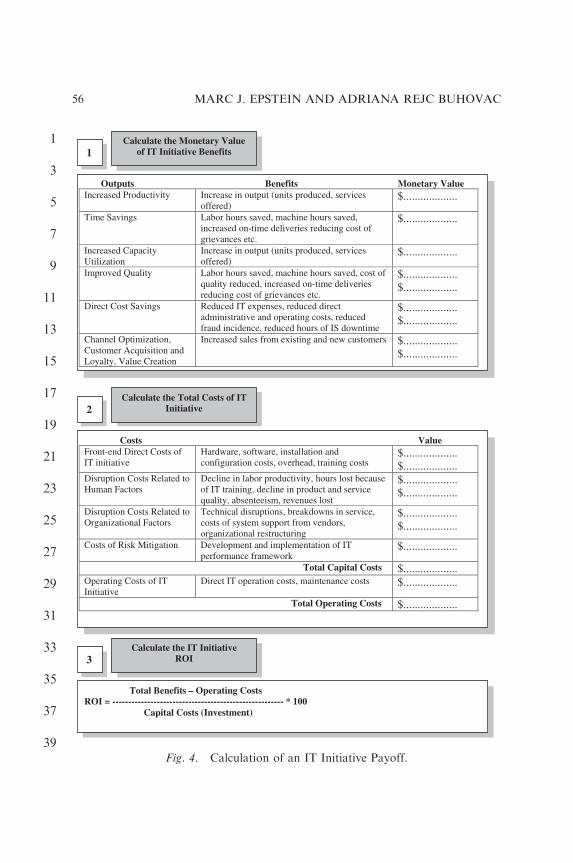
Step 4 requires an exact specification of all benefits arising from the ITinitiative and the capital and operational costs. The identified causalrelationships between the critical drivers of an IT initiative will helpdetermine both the costs and expected benefits of the initiative. Althoughbenefits do not always clearly translate into short-term profits, they shouldultimately lead to either cost savings or increased revenues. Sometimes, thedirect relationship between a specific action or process, such as better andfaster information, and the business value creation is not clear enough toprovide an easy calculation of the benefit’s monetary value. In such cases,additional inquiry in terms of ‘How does this improvement specifically helpyou in your work?’ should be undertaken. It may be that the systemsupports increased throughput per employee (increased productivity), savestime (time savings), helps optimizing the use of existing resources (increasedcapacity utilization), or allows fewer mistakes (improved quality). As shownin Fig. 4, the new methodology specifically recognizes the importanceof measuring both the total costs of an IT initiative – including a range ofdifferent disruption costs – as well as the benefits, and additionally considersthe risks associated with IT investments. It is important to note, that aprecise identification and measurement of the present and future marginalcosts and benefits of IT initiatives is fundamental for a comprehensive andobjective calculation of IT initiative ROI. In particular, disruption costsassociated with the adoption of IT initiatives require a thorough evaluationas they are typically significant.
STEP 5: Calculate the IT Payoff
In Step 5, the benefits are assigned monetary value and the costs arecalculated. Finally, the IT payoff is calculated (see Fig. 4).
1
3
5
7
9
11
13
15
17
19
21
23
25
27
29
31
33
35
37
39
Measuring Performance of IT Investments 55
1
3
5
7
9
11
13
15
17
19
21
23
25
27
29
31
33
35
37
39
Calculate the Monetary Value of IT Initiative Benefits
Outputs Benefits Monetary Value Increased Productivity Increase in output (units produced, services
offered) $...................
Time Savings Labor hours saved, machine hours saved, increased on-time deliveries reducing cost of grievances etc.
$...................
Increased Capacity Utilization
Increase in output (units produced, services offered)
$...................
Improved Quality Labor hours saved, machine hours saved, cost of quality reduced, increased on-time deliveries reducing cost of grievances etc.
$................... $...................
Direct Cost Savings Reduced IT expenses, reduced direct administrative and operating costs, reduced fraud incidence, reduced hours of IS downtime
$................... $...................
Channel Optimization, Customer Acquisition and Loyalty, Value Creation
Increased sales from existing and new customers $................... $...................
Calculate the Total Costs of IT Initiative
Costs Value Front-end Direct Costs of IT initiative
Hardware, software, installation and configuration costs, overhead, training costs
$................... $...................
Disruption Costs Related to Human Factors
Decline in labor productivity, hours lost because of IT training, decline in product and service quality, absenteeism, revenues lost
$................... $...................
Disruption Costs Related to Organizational Factors
Technical disruptions, breakdowns in service, costs of system support from vendors, organizational restructuring
$................... $...................
Costs of Risk Mitigation Development and implementation of IT performance framework
$...................
Total Capital Costs $................... Operating Costs of IT Initiative
Direct IT operation costs, maintenance costs $...................
Total Operating Costs $...................
1
2
3 Calculate the IT Initiative
ROI
Total Benefits – Operating Costs ROI = ------------------------------------------------------ * 100 Capital Costs (Investment)
Fig. 4. Calculation of an IT Initiative Payoff.
MARC J. EPSTEIN AND ADRIANA REJC BUHOVAC56
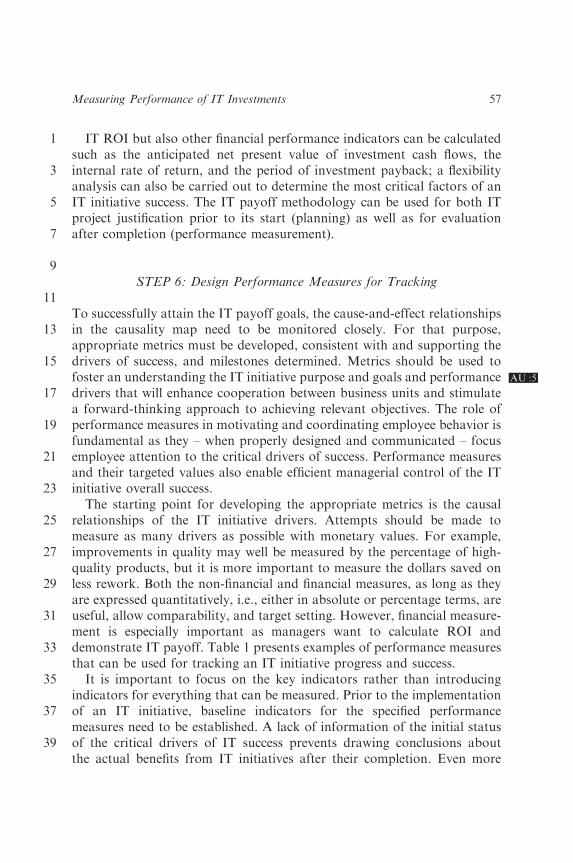
IT ROI but also other financial performance indicators can be calculatedsuch as the anticipated net present value of investment cash flows, theinternal rate of return, and the period of investment payback; a flexibilityanalysis can also be carried out to determine the most critical factors of anIT initiative success. The IT payoff methodology can be used for both ITproject justification prior to its start (planning) as well as for evaluationafter completion (performance measurement).
STEP 6: Design Performance Measures for Tracking
To successfully attain the IT payoff goals, the cause-and-effect relationshipsin the causality map need to be monitored closely. For that purpose,appropriate metrics must be developed, consistent with and supporting thedrivers of success, and milestones determined. Metrics should be used tofoster an understanding the IT initiative purpose AU :5and goals and performancedrivers that will enhance cooperation between business units and stimulatea forward-thinking approach to achieving relevant objectives. The role ofperformance measures in motivating and coordinating employee behavior isfundamental as they – when properly designed and communicated – focusemployee attention to the critical drivers of success. Performance measuresand their targeted values also enable efficient managerial control of the ITinitiative overall success.
The starting point for developing the appropriate metrics is the causalrelationships of the IT initiative drivers. Attempts should be made tomeasure as many drivers as possible with monetary values. For example,improvements in quality may well be measured by the percentage of high-quality products, but it is more important to measure the dollars saved onless rework. Both the non-financial and financial measures, as long as theyare expressed quantitatively, i.e., either in absolute or percentage terms, areuseful, allow comparability, and target setting. However, financial measure-ment is especially important as managers want to calculate ROI anddemonstrate IT payoff. Table 1 presents examples of performance measuresthat can be used for tracking an IT initiative progress and success.
It is important to focus on the key indicators rather than introducingindicators for everything that can be measured. Prior to the implementationof an IT initiative, baseline indicators for the specified performancemeasures need to be established. A lack of information of the initial statusof the critical drivers of IT success prevents drawing conclusions aboutthe actual benefits from IT initiatives after their completion. Even more
1
3
5
7
9
11
13
15
17
19
21
23
25
27
29
31
33
35
37
39
Measuring Performance of IT Investments 57

1
3
5
7
9
11
13
15
17
19
21
23
25
27
29
31
33
35
37
39
Table 1. Examples of Performance Measures for Tracking an ITInitiative.
Inputs Performance Measures
Corporate strategy % of planned change in annual IT budget
Corporate structure Level of empowerment to SBU and functional
managers
Corporate systems % of employees compensated based on individual or
group performance
Resources Growth rate of IT spend per growth rate of direct total
spend
External Assessment of competitor IT investments
Environment Assessment of customer and supplier needs and
capabilities
Processes Performance Measures
Leadership % of CIO’s and IT managers’ bonus linked to IT
profitability
Create and execute appropriate IT
strategies
% of discretionary spending decisions aligned with
corporate and business unit strategy
Planned costs, benefits, and profitability of IT projects
Design and institute proper IT
structure
% of systems developed/maintained outside the
organization
% of standardized hardware, databases,
communications and applications systems
Develop and implement appropriate
IT systems
% of IT employee turnover
% of IT staff with pay for performance compensation
Break/fix maintenance response/resolution time
Internal Outputs Performance Measures
Increased productivity % increase in production output per employee
Dollar increase in sales based on productivity
improvements
Time savings Reduction in on-line response time
Dollars saved based on time savings
Increased capacity utilization % increase in capacity utilization
% of utilization of databases
Improved quality Dollars saved on prevention and appraisal cost of
quality
Direct cost savings % reduction in IT mandatory expenses
Time saved on disaster recovery/business continuity
External Outputs Performance Measures
Channel optimization Dollar value of activities completed through web sites
Hours of web site downtime (in a year)
Customer acquisition % of customers using web sites exclusively
% of visitors to web site who are also buyers (reach)
Customer loyalty Sales from retained customers versus new customers
% of customer attrition
MARC J. EPSTEIN AND ADRIANA REJC BUHOVAC58
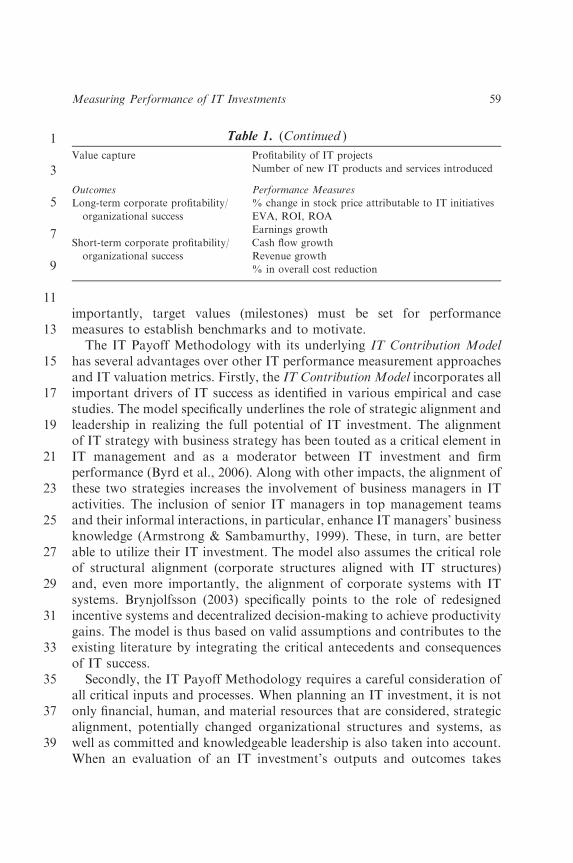
importantly, target values (milestones) must be set for performancemeasures to establish benchmarks and to motivate.
The IT Payoff Methodology with its underlying IT Contribution Modelhas several advantages over other IT performance measurement approachesand IT valuation metrics. Firstly, the IT Contribution Model incorporates allimportant drivers of IT success as identified in various empirical and casestudies. The model specifically underlines the role of strategic alignment andleadership in realizing the full potential of IT investment. The alignmentof IT strategy with business strategy has been touted as a critical element inIT management and as a moderator between IT investment and firmperformance (Byrd et al., 2006). Along with other impacts, the alignment ofthese two strategies increases the involvement of business managers in ITactivities. The inclusion of senior IT managers in top management teamsand their informal interactions, in particular, enhance IT managers’ businessknowledge (Armstrong & Sambamurthy, 1999). These, in turn, are betterable to utilize their IT investment. The model also assumes the critical roleof structural alignment (corporate structures aligned with IT structures)and, even more importantly, the alignment of corporate systems with ITsystems. Brynjolfsson (2003) specifically points to the role of redesignedincentive systems and decentralized decision-making to achieve productivitygains. The model is thus based on valid assumptions and contributes to theexisting literature by integrating the critical antecedents and consequencesof IT success.
Secondly, the IT Payoff Methodology requires a careful consideration ofall critical inputs and processes. When planning an IT investment, it is notonly financial, human, and material resources that are considered, strategicalignment, potentially changed organizational structures and systems, aswell as committed and knowledgeable leadership is also taken into account.When an evaluation of an IT investment’s outputs and outcomes takes
1
3
5
7
9
11
13
15
17
19
21
23
25
27
29
31
33
35
37
39
Table 1. (Continued )
Value capture Profitability of IT projects
Number of new IT products and services introduced
Outcomes Performance Measures
Long-term corporate profitability/
organizational success
% change in stock price attributable to IT initiatives
EVA, ROI, ROA
Earnings growth
Short-term corporate profitability/
organizational success
Cash flow growth
Revenue growth
% in overall cost reduction
Measuring Performance of IT Investments 59

place, they are not analyzed in isolation but judged in the light of themodel’s antecedents’ status. This is an important managerial contributionthat distinguishes this methodology from extant ones.
Also, the visual presentation of performance drivers’ causality helps betterunderstand the cause-and-effect relationships among the various drivers ofsuccess. It points to the many areas that need improvement today in orderto reap benefits in the output and outcome areas later. As such, it providesmanagers with timely information to make better IT decisions.
Further, the methodology requires a specification of performancemeasures and their target values along the time horizon to monitor thedrivers’ progress and to benchmark the final results against the initiallyprojected net benefits. IT managers can thus execute effective managerialcontrol over the milestones and the ultimate outcomes. Performance metricsis particularly important as it focuses attention on the critical drivers andstimulates a forward-thinking approach to achieving relevant objectives.
Finally, the methodology provides practical guidance on how to calculatethe monetary value of IT benefits, which is often one of the major concernsof those responsible for calculating an IT ROI. The formula for IT ROI isprovided along with the specification of all relevant capital and operationalcosts. None of the existing IT performance measurement methodologiesincorporates all these characteristics.
APPLICATION OF THE IT PAYOFF METHODOLOGY
IN ISTRABENZ GROUP
The Istrabenz Group is an international group of affiliated companiesmanaged by the Istrabenz Holding Company. Its activity is organized intofour divisions comprising energy, tourism, investments, and food, as well asIT support as an accompanying activity. In 2005, the company preparedguidelines on the use of ICT, from which it follows that this area is one ofthe key factors of the Istrabenz Group for achieving its strategic businessgoals; this is why the ICT strategy must be in line with business goals.Among other things, the guidelines regulate information system operationand the exploitation of synergies in ICT. This primarily involves the methodof performing IT services and the efficient use of common resources such asthe use of technological solutions that make possible the long-term stableoperation and development of the Istrabenz Group (Istrabenz Group, 2005,Guidelines on the Use of Information and Communication Technology).
1
3
5
7
9
11
13
15
17
19
21
23
25
27
29
31
33
35
37
39
MARC J. EPSTEIN AND ADRIANA REJC BUHOVAC60

In 2005, the Istrabenz Holding Company was considering the introduc-tion of the ROS information system as a uniform information system forsupporting the operation of all the hotels in the Istrabenz Group tourismdivision. For the Morje Hotels, this would replace the FIDELIOinformation system, whereas for the Palace Hotels, the ROS informationsystem had already been introduced in 2001. The company top managementrequired exact calculations of the investment payoff. The IT ContributionModel and the IT Payoff Methodology have been selected as analyticaltools and permission was granted for empirical testing of the model. Asresearchers, we were able to observe the effects of the implementation andthe effectiveness of the model.
The company initiated its own project group for the IT initiativevaluation. It included representatives of the Istrabenz Group tourismdivision and the ROS Company. The group comprised a project council(composed of the representatives of the tourism division and ROS), theproject head, working group coordinators, the module head, key informa-tion system users, and advisers to ROS. The role of the key informationsystem users was especially important as they are the ones that know besthow the existing business operations function and what changes the newsystem is intended to yield. Key information system users were determinedby the IT head at the Istrabenz Hotels; they included the managing directorof the Morje Hotels, the managing director of the Palace Hotels, therepresentatives of the invoice and material accounting departments, thehead of Food Supervision, and the sales manager at the Istrabenz Hotels.
The project group used the IT Payoff Methodology to determine theexpected benefits from the information system unification and to set up thetools for subsequent managerial control if the project is approved. Withthe help of structured interviews, data were gathered on how the informa-tion system would change the operations. Starting points for discussionswere prepared and sent to each interviewee in advance. The purpose was todetermine the business process before and after the introduction of ROSand, on the basis of this, to determine the potential effects with the help ofkey users. In evaluating the effects of the ROS information system,secondary data from the Istrabenz Hotels were also used.
The subject of the research project is the IT initiative to introduce the ROSinformation system as a uniform information system for supporting theoperation of the Morje and Palace Hotels. The study relates to one part of thetourism division of Istrabenz only but the project could be easily expanded toother parts of the company. The practical example of the IT PayoffMethodology application presented below demonstrates how methodology
1
3
5
7
9
11
13
15
17
19
21
23
25
27
29
31
33
35
37
39
Measuring Performance of IT Investments 61

can be used for project justification prior to its start and for subsequentmanagerial control of the project and its applicability to other companies.
STEP 1: IT Initiative Purpose and Goals – The ROS Information System
The ROS information system comprises various modules specified forvarious business areas. It includes ROS HIS, an information system forhotel and convention services; ROS GIS, an information system for cateringservices; ROS ZIS, a health resort information system; ROS Wellness, awellness information system; ROS FRS, a financial and accounting system;and ROS WEB extras, an online hotel reservation system with an integratedpayment system (ROS company internal publication, 2003). During theproject to introduce the ROS information system, the HIS, GIS, ZIS, andWELLNESS modules were implemented.
The main goals of introducing the ROS system as a uniform informationsystem were the restructuring and unification of information solutions andprocesses in the tourism division of the Istrabenz Group with the purposeto ensure timely information for the needs of the companies’ management,and information solutions that enable high-quality support for implement-ing tourism business processes. In reality, the introduction of the ROSinformation system was expected to have dual effects. On the one hand,these involve the effects of the replacement of the FIDELIO informationsystem for the Morje Hotels and, on the other, the effects of the unificationof both systems into a uniform information system.
STEP 2: The IT Contribution Model: Inputs, Processes, Outputs, andOutcomes for the ROS Information System Implementation
In accordance with the methodology, individual elements in the ITContribution Model were defined in terms of their content (inputs, processes,outputs, and outcomes). Each element was carefully described by the projectmembers, particularly by the selected main users of the ROS informationsystem. In terms of the needed inputs, for example, all required resourceswere determined. The cost of the needed capital investment was calculated;there was no need to hire additional employees; the ROS Company offeredIT training for employees that would be using the new information systemwith costs being incorporated in the capital investments numbers. The ITsupport and system maintenance costs were considered as operational
1
3
5
7
9
11
13
15
17
19
21
23
25
27
29
31
33
35
37
39
MARC J. EPSTEIN AND ADRIANA REJC BUHOVAC62

costs. Corporate strategy was found to be supportive of the ICT strategy.Similarly, other inputs and required processes were determined. After theconversation with the managing directors of the Morje and Palace Hotels,the dimensions of the effects (outputs) of the ROS information system weredivided in the following areas for the needs of investment evaluation: sales,reception office, catering and wellness, support staff, material accounting,invoices, and general effects.
Some of the expected results of introducing the ROS informationsystem were not completely definitive. In the evaluation of results, varioushypotheses about cause-and-effect relations between the ROS and opera-tions were used, which were defined on the basis of key users’ experiences.In defining the hypotheses, there was a certain extent of uncertaintyregarding their accuracy. The project group tried to eliminate this with thehelp of sensitivity analysis. Another possibility is the probability theory,where several scenarios are created for a specific fuzzy hypothesis and thenprobability is attributed to them (Anandarajan & Wen, 1999, p. 329).
STEP 3: Identify Causal Relationships Between theDrivers of IT Initiative Success
Causal relationships between inputs, processes, outputs, and outcomesmust be result of a unified understanding of how the project is expectedto evolve towards its goals and purposes. The visual presentation of thecause-and-effect relationships between antecedents and consequences ofthe ROS information system implementation is shown in Fig. 5. The mostinteresting areas in the figure are the processes and outputs area withdescriptions of critical changes in the hotel operations and subsequenteffects on the customers. As can be seen, the final outcomes are manifestedas lower operating expenses or as an increase in sales revenues, which resultsin an increase in the company’s profit.
The project group used the comprehensive causal relationships scheme asthe basis for laying out the processes expected to change and for describingall the expected cost and benefits.
STEP 4: Relevant Costs (Operating and Capital) and Benefits of the ROSInformation System Implementation
The changes caused by the ROS information system and the subsequentcosts and benefits will be presented in more detail in the area of catering and
1
3
5
7
9
11
13
15
17
19
21
23
25
27
29
31
33
35
37
39
Measuring Performance of IT Investments 63
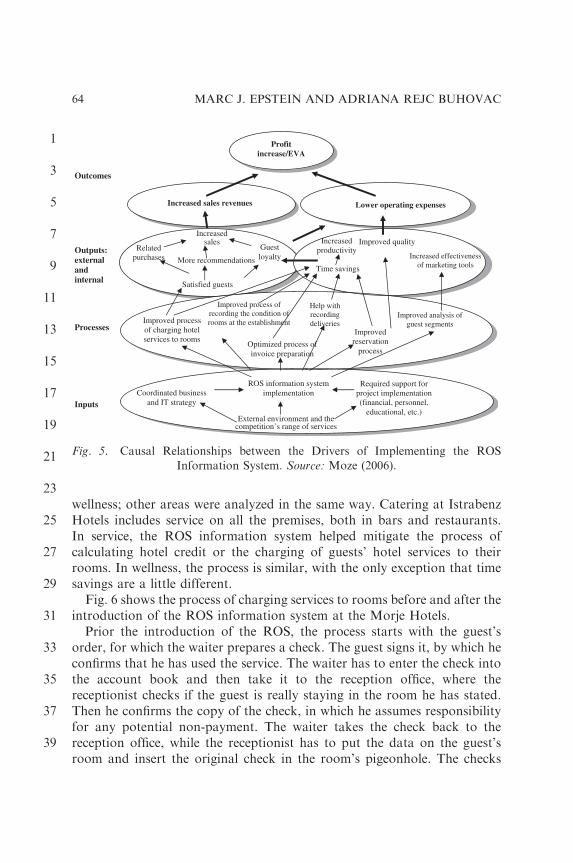
wellness; other areas were analyzed in the same way. Catering at IstrabenzHotels includes service on all the premises, both in bars and restaurants.In service, the ROS information system helped mitigate the process ofcalculating hotel credit or the charging of guests’ hotel services to theirrooms. In wellness, the process is similar, with the only exception that timesavings are a little different.
Fig. 6 shows the process of charging services to rooms before and after theintroduction of the ROS information system at the Morje Hotels.
Prior the introduction of the ROS, the process starts with the guest’sorder, for which the waiter prepares a check. The guest signs it, by which heconfirms that he has used the service. The waiter has to enter the check intothe account book and then take it to the reception office, where thereceptionist checks if the guest is really staying in the room he has stated.Then he confirms the copy of the check, in which he assumes responsibilityfor any potential non-payment. The waiter takes the check back to thereception office, while the receptionist has to put the data on the guest’sroom and insert the original check in the room’s pigeonhole. The checks
1
3
5
7
9
11
13
15
17
19
21
23
25
27
29
31
33
35
37
39
Increased sales revenues Lower operating expenses
External environment and the competition’s range of services
Improved reservation
process
Satisfied guests
Improved process of recording the condition of rooms at the establishment
Increased sales Increased
productivity
Improved analysis of guest segments
Coordinated business and IT strategy
Improved quality
Improved process of charging hotel services to rooms
Required support for project implementation (financial, personnel,
educational, etc.)
Time savings
Help with recording deliveries
Profit increase/EVA
ROS information system implementation
Optimized process of invoice preparation
Increased effectiveness of marketing tools
Related purchases More recommendations
Guest loyalty
Inputs
Processes
Outputs: external and internal
Outcomes
Fig. 5. Causal Relationships between the Drivers of Implementing the ROS
Information System. Source: Moze (2006).
MARC J. EPSTEIN AND ADRIANA REJC BUHOVAC64

prove that the guest has really used the service charged. After theintroduction of the ROS, the process of charging services to rooms willchange. The check will be automatically put on the guest’s room tab as soonas the waiter prepares it and this is also recorded on the receptionist’scomputer. At the end of the day, the waiter only has to take the checks tothe reception office for recordkeeping if guests demand proof that theyreally used the service charged.
The ROS information system was expected to optimize the process ofcharging hotel services to rooms. Through direct transfer of the check fromthe bar, restaurant, or wellness center to the guest’s room, savings in thetime used for the process are created for both the waiter as well as the hotelor wellness center receptionist. After the conversation with the managing
1
3
5
7
9
11
13
15
17
19
21
23
25
27
29
31
33
35
37
39
Waiter prepares the check
Waiter enters the check in the books
Receptionist confirms the copy of the check
Waiter takes the check back to the bar or
restaurant
Receptionist checks on the computer if the guest is actually staying in the
room stated
Waiter takes the check to the reception office
Guest signs the check Guest's order
Receptionist puts the check on the guest’s
room tab
Receptionist inserts the check into the guest’s
pigeonhole After ROS introduction:
Guest's order Waiter prepares the check
Receptionist puts the check directly on the
guest’s room tab
Guest signs the check At the end of the day the waiter takes the checks to the reception office
Receptionist inserts the check into the guest’s
pigeonhole
Fig. 6. The Process of Charging Hotel Bar and Restaurant Services to the Room
before and after the Introduction of the ROS Information System.
Measuring Performance of IT Investments 65
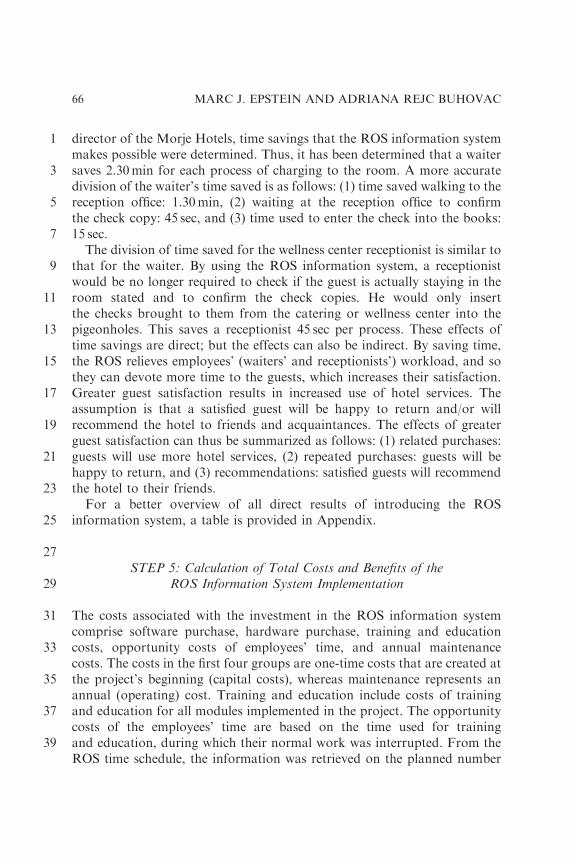
director of the Morje Hotels, time savings that the ROS information systemmakes possible were determined. Thus, it has been determined that a waitersaves 2.30min for each process of charging to the room. A more accuratedivision of the waiter’s time saved is as follows: (1) time saved walking to thereception office: 1.30min, (2) waiting at the reception office to confirmthe check copy: 45 sec, and (3) time used to enter the check into the books:15 sec.
The division of time saved for the wellness center receptionist is similar tothat for the waiter. By using the ROS information system, a receptionistwould be no longer required to check if the guest is actually staying in theroom stated and to confirm the check copies. He would only insertthe checks brought to them from the catering or wellness center into thepigeonholes. This saves a receptionist 45 sec per process. These effects oftime savings are direct; but the effects can also be indirect. By saving time,the ROS relieves employees’ (waiters’ and receptionists’) workload, and sothey can devote more time to the guests, which increases their satisfaction.Greater guest satisfaction results in increased use of hotel services. Theassumption is that a satisfied guest will be happy to return and/or willrecommend the hotel to friends and acquaintances. The effects of greaterguest satisfaction can thus be summarized as follows: (1) related purchases:guests will use more hotel services, (2) repeated purchases: guests will behappy to return, and (3) recommendations: satisfied guests will recommendthe hotel to their friends.
For a better overview of all direct results of introducing the ROSinformation system, a table is provided in Appendix.
STEP 5: Calculation of Total Costs and Benefits of theROS Information System Implementation
The costs associated with the investment in the ROS information systemcomprise software purchase, hardware purchase, training and educationcosts, opportunity costs of employees’ time, and annual maintenancecosts. The costs in the first four groups are one-time costs that are created atthe project’s beginning (capital costs), whereas maintenance represents anannual (operating) cost. Training and education include costs of trainingand education for all modules implemented in the project. The opportunitycosts of the employees’ time are based on the time used for trainingand education, during which their normal work was interrupted. From theROS time schedule, the information was retrieved on the planned number
1
3
5
7
9
11
13
15
17
19
21
23
25
27
29
31
33
35
37
39
MARC J. EPSTEIN AND ADRIANA REJC BUHOVAC66

of hours for training and education by every employee. This time was thenmultiplied by employees’ average hourly payment, which equaled theexpected opportunity costs of the employees’ time (see Table 2).
Table 3 shows the calculation of anticipated financial effects of timesavings in catering and wellness after the introduction of the new informationsystem for a five-year period of time (2006–2010). At the Istrabenz tourismdivision, the payback period for information systems is five years, which canbe considered the period of the system’s duration and thus the period ofinvestment evaluation. The estimations for the first two years of the ROSbeing in place and in use also include the so called implementation factorswhich are used to substitute for suboptimal use of the information systemand the subsequent disruption costs (0.6 and 0.8, respectively).
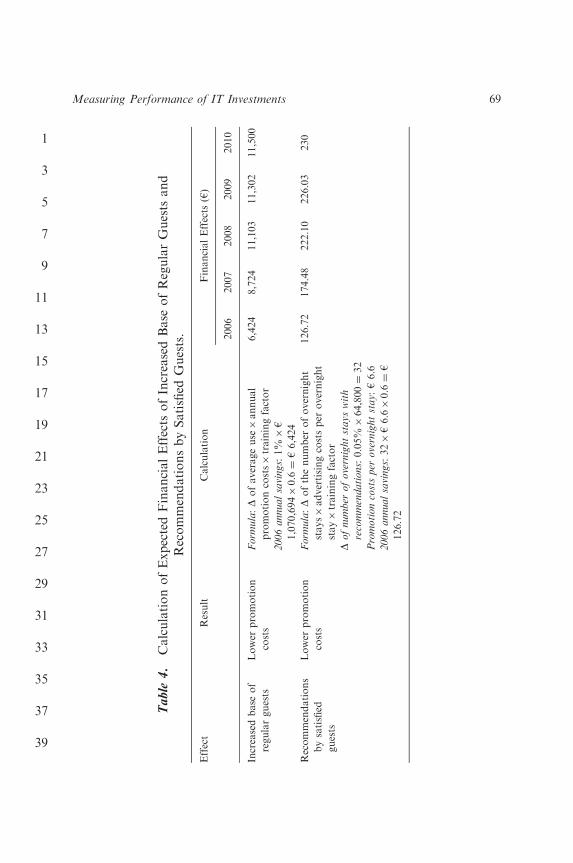
The same procedure was used for other areas (sales, reception office,support staff, material accounting, and invoices). Table 4 shows thecalculation of selected anticipated financial benefits from general effects,such as increased guest satisfaction. An increase in the base of regularguests and recommendations by satisfied guests are included. Other effectsinclude increased efficiency of marketing tools, related purchases, as well asdecreased number of claims, and they were all included in the finalcalculations.
Altogether, total expected benefits for the first year sum up to h 55,073,the total costs are in the amount of h 130,474; in the second year, thebenefits increase to h 73,882 and continue to rise up to the final year, whilethe costs fall to h 2,303 and remain at the maintenance level.
The investment in the ROS information system was evaluated bycalculating the anticipated net present value of investment cash flows, theinternal return rate, and the period of investment payback; at the same time,
1
3
5
7
9
11
13
15
17
19
21
23
25
27
29
31
33
35
37
39
Table 2. Expected Total Costs of Investment in the ROSInformation System.
Cost Calculation Item Value (h)
Software Istrabenz Turizem internal sources 95,438
Hardware Istrabenz Turizem internal sources 19,629
Training and education Istrabenz Turizem internal sources 9,114
Opportunity costs of
employees’ time
Labor hours planned for training and
education� labor cost per hour
3,990
Total capital costs Sum of all items above 128,171
Annual maintenance Istrabenz Turizem internal sources 2,304
Measuring Performance of IT Investments 67

1
3
5
7
9
11
13
15
17
19
21
23
25
27
29
31
33
35
37
39 Table
3.
CalculationofExpectedFinancialEffects
ofTim
eSavingin
CateringandWellnessafter
the
IntroductionofROS.
Area
Result
Calculation
FinancialEffects
(h)
2006
2007
2008
2009
2010
Catering
and
wellness
Saving2.5min
inwaiter’s
work
per
each
process
of
chargingto
room
Tim
esavings:number
ofprocesses
per
year�2.5min¼
7,500�2.5min¼
687.5h
2,063
2,754
3,505
3,567
3,630
Tim
evalue:
h5per
hour
2006annualsavings:687.5h�h5�0.6¼
h2,063
Saving1.75min
ofwellness
receptionist’swork
per
everyprocess
ofcharging
toroom
Tim
esavings:number
ofprocesses
per
year�1.75min¼
8,250�1.75¼
239.3h
603
799
1,016
1,035
1,053
Tim
evalue:
h4.2
per
hour
2006annualsavings:239.3�h4.2�0.6¼
h603
Saving45secof
receptionist’swork
at
MorjeHotelsper
every
process
ofchargingto
room
Tim
esavings:number
ofprocesses
per
year�45sec¼
24,750�45¼
309.375h
1,160
1,549
1,972
2,007
2,042
Tim
evalue:
h6.25per
hour
2006annualsavings:309.375�h6.25�0.6¼
h1,160
Saving30secofthe
receptionist’swork
at
Palace
Hotelsper
day
Tim
esavings:3hper
year
11.25
15.02
18.78
18.77
18.77
Tim
evalue:
h6.25per
hour
2006annualsavings:3�h6.25per
hour�0.6¼
h
11.25
MARC J. EPSTEIN AND ADRIANA REJC BUHOVAC68
1
3
5
7
9
11
13
15
17
19
21
23
25
27
29
31
33
35
37
39
Table
4.
CalculationofExpectedFinancialEffects
ofIncreasedBase
ofRegularGuests
and
RecommendationsbySatisfied
Guests.
Effect
Result
Calculation
FinancialEffects
(h)
2006
2007
2008
2009
2010
Increasedbase
of
regularguests
Lower
promotion
costs
Form
ula:D
ofaverageuse�annual
promotioncosts�trainingfactor
6,424
8,724
11,103
11,302
11,500
2006annualsavings:1%�h
1,070,694�0.6¼
h6,424
Recommendations
bysatisfied
guests
Lower
promotion
costs
Form
ula:D
ofthenumber
ofovernight
stays�advertisingcostsper
overnight
stay�trainingfactor
126.72
174.48
222.10
226.03
230
Dofnumber
ofovernightstayswith
recommendations:0.05%�64,800¼
32
Promotioncostsper
overnightstay:h6.6
2006annualsavings:32�h6.6�0.6¼
h
126.72
Measuring Performance of IT Investments 69

a sensitivity analysis was also carried out. Investment cash flows representthe calculated financial effects of the ROS information system and the costsof investment. The discount rate by which the investment cash flows arediscounted is the required return rate of the investor – in this case, the ownerof the Istrabenz Group – according to the investment risk and returns ofalternative investments with comparable risk. The required return rate ofthe investment in the ROS information system was 8.5%. The calculationsshow the net present value of investment cash flows is h 220,068, the internalrate of return is 139%, and the period of investment payback is 2 years and15 days.
Sensitivity analysis tested the sensitivity of the investment’s evaluation tothe change in the evaluations of savings on marketing costs made by thesales manager at the Istrabenz tourism division. Results show that in thecase of an evaluation of savings on marketing costs decreased by 1%, the netpresent value decreases by 8%, whereas the internal return rate decreases by17 percentage points or by 12%. In the case of an evaluation of savings onmarketing costs increased by 1%, the net present value of the investmentincreases by 9%, whereas the internal return rate increases by 19 percentagepoints or by 14%. With the 71% change in evaluation of savings onmarketing costs, the period of investment payback extends by 29 or shortensby 30 days. The sensitivity analysis presented above offers an example ofgreat investment sensitivity to the evaluation of savings on marketing costs.This was taken into account in the final evaluation of the effectiveness of theinvestment in the ROS information system.
STEP 6: Design Performance Measures for Tracking
In the final step, after the project was approved, performance measureswere developed to foster the anticipated changes as foreseen in the initialcalculations. Performance measures were drawn from the causality ofdrivers’ scheme; for outputs, however, a more detailed look at the changes invarious processes was needed to design appropriate indicators. Table 5provides selected performance measures for tracking the outputs of cateringand wellness.
For many performance measures that have not been tracked before baselineindicators were determined. Specific measurements and evaluations took placeas separate activities in the project to determine these baseline values. Then,target values or milestones were set for performance measures across theexpected period of investment payback. These values were determined by
1
3
5
7
9
11
13
15
17
19
21
23
25
27
29
31
33
35
37
39
MARC J. EPSTEIN AND ADRIANA REJC BUHOVAC70

the project group members but with a consent of those employees who wereresponsible for the processes and activities under evaluation.
DISCUSSION
The chapter addresses an important methodological question that has beenaddressed in both the IT and management control literature, namely thequestion of identifying, measuring, and managing the IT’s contribution tothe bottom line. While empirical research work, recent studies, in particular,provides evidence of the IT value, there is little practical guidance on how todesign and implement an appropriate IT performance measurement system.Various approaches and IT valuation measures fall short on providing acomprehensive overview of all critical drivers of IT success, their inter-relations, the way they can be measured, and how to make better ITdecisions based upon the analysis. In this chapter, we provide an integratedmodel (the IT Contribution Model) and a methodology (the IT PayoffMethodology) that bridge this methodological gap and help organizationsmeasure an IT initiative’s payoff in a more comprehensive way and executeefficient management control.
The academic contribution of the chapter is twofold. On the one hand, wepresent and empirically test, the IT Contribution Model, which upgradesthe existing literature by offering an integrated model of critical drivers of
1
3
5
7
9
11
13
15
17
19
21
23
25
27
29
31
33
35
37
39
Table 5. Selected Performance Measures for Tracking the Outputs ofCatering and Wellness.
Catering and Wellness
Internal Outputs
Performance Measures
Time savings % of time saved in the waiter’s work
% of time saved in the hotel receptionist’s work
% of time saved in the wellness receptionist’s work
Dollars saved based on time savings
Improved quality % decrease in customer complaints related to waiters’/receptionists’
work
Dollars saved based on fewer customer complaints
External Outputs Performance Measures
Customer acquisition % of guests being recommended by friends and acquaintances
Customer loyalty % of guests returning to the hotel
Sales from retained customers versus new customers
Value capture Dollars earned on related purchases
Measuring Performance of IT Investments 71

IT success. The model was designed based on empirically tested assump-tions about the cause-and-effect relationships between the antecedentsand consequences of IT success provided in existing empirical studies.With a model incorporating IT inputs, processes, and outputs that lead tooverall IT payoff and improved corporate profitability, organizations willless likely rely on a reactive approach to their adoption of new technologiesor risk making costly, personality-driven choices.
On the other hand, we also present and implement the IT PayoffMethodology, which represents a more complete analytical tool forevaluating the payoffs of investing in IT based on the proposed model. Themethodology is more straightforward than existing tools as it relies on sixwell-defined steps, applies standard methods and analytical tools, and doesnot require complex calculations. It includes the identification of criticaldrivers of an IT investment’s success, develops the cause-and-effect relation-ships between the drivers and outcomes, helps identify and measure allimportant costs and benefits of the IT initiative to calculate the IT initiativeROI, and provides performance measures for tracking the IT initiative. Allthese steps are necessary to properly value and manage an IT investment.
Apart from the academic dimension, the chapter also has several practicalimplications. The new methodology for valuing IT investments offerspractical insights into how to identify, measure, and manage the criticaldrivers of IT success. More specifically, the IT Payoff Methodology helpeddecision makers at Istrabenz in several ways
� Firstly, it provided exact calculations of the expected investment payoffand enabled well-informed resource allocation decision, which was theinitial purpose of the project. The methodology specifically recognizesthe importance of measuring both the total costs of an IT initiative –including a range of different disruption costs – as well as the benefits, andadditionally considers the risks associated with IT investments. Sincemost organizations have little experience in assigning monetary values toIT outputs and the measurement of IT payoffs, the methodology’s specificinstructions on these questions helped resolve many dilemmas.� Secondly, by having a clear picture of the IT cause-and-effect relation-ships, IT managers can monitor how the IT initiatives are progressing andmore fairly evaluate their intermediate results. The causal linkage map ofdrivers is useful and important as it helps ensure that all actions that arenecessary to achieve success are taken, that unnecessary actions are nottaken, and that all employees understand their critical role in the successof the IT activities.
1
3
5
7
9
11
13
15
17
19
21
23
25
27
29
31
33
35
37
39
MARC J. EPSTEIN AND ADRIANA REJC BUHOVAC72

� Thirdly, the project group members specifically acknowledged theimportance of steps 2–5 for a precise and objective calculation of the ITinitiative payoff. The visual representation of the causality of criticaldrivers of success was considered as particularly helpful for projecting themonetary benefits and costs of the IT initiative. The financial calculationshave further shown how important it is to understand the influence thatthe hypotheses about the cause-and-effect relations and various subjectiveevaluations have on the investment net present value, internal return rate,and payback period. The sensitivity analysis has revealed great investmentsensitivity to the evaluation of savings on marketing costs.� Fourthly, the IT Payoff Methodology requires the active participation ofall important holders of processes under investigation, their managers,and subordinate employees. The active involvement in the identificationof the critical drivers of success, expected internal and external outputs, inparticular, however, substantially facilitates the IT initiative implementa-tion by increasing the level of understanding and acceptance. In Istrabenztourism division, this benefit has been widely acknowledged.� Finally, the Istrabenz project team found the methodological toolto be very pragmatic, simple, and with feasible implementation costs.The methodology can be performed internally without the need to hireexternal consultants.
The project group also listed potential challenges of the methodology.
� Firstly, the methodology can best be applied when extant businessprocesses are already identified and described thus allowing for theestablishment of baseline indicators of performance. In the opposite case,baseline measurements and evaluations need to take place, which takestime but is crucial for subsequent comparisons.� Secondly, the methodology necessarily requires various assumptionsabout expected savings from improved processes. The objectivity of theseassumptions is best attained when they are set by those who perform theseprocesses, the so-called key users of the new IT. Still, sensitivity analysesor probability scenarios are required to mitigate some of the uncertainty.� Thirdly, one of the most vexing problems in estimating performanceimpacts of IT investment is simultaneity bias. If companies undertaketechnology implementations when demand for their products is high orwhen they expect to perform well, estimates of the impact of IT adoptionon performance may be biased upward creating indeterminacy in causalinterpretations (Brynjolfsson & Hitt, 2003).
1
3
5
7
9
11
13
15
17
19
21
23
25
27
29
31
33
35
37
39
Measuring Performance of IT Investments 73

� Fourthly, the case study supports Brynjolfsson’s finding (Brynjolfsson,2003), namely, that companies do not simply plug in computers andtelecommunications equipment and achieve productivity gains. Discus-sions with the project group members revealed that without efforts toimprove employee IT literacy, understanding, and ability to use theseinnovations, further, actually measure improvements based on imple-mented innovations, and, finally, establish proper compensation policiesto stimulate employees to deploy the use of IT, the projected benefits willnot be realized. To realize full potential of IT investment, organizationsmust often go through a process of organizational redesign. Brynjolfssonrefers to a cluster of related innovations, such as automation of numerousroutine tasks, highly skilled labor, more decentralized decision-making,improved information flow vertically and laterally, strong performance-based incentives, and increased emphasis on recruiting and training(Brynjolfsson, 2003, p. 42). Earlier research and case studies have alsoproven that IT investments complement other long-term performance-enhancing investments, including innovations in business methodsand organization, human capital investments, and supply chain manage-ment systems, which are carried out over a period of several years(Brynjolfsson & Hitt, 2003; Bresnahan, Brynjolfsson, & Hitt, 2002;Davenport & Short, 1990; Short & Venkatramen, 1992).� Finally, it has also been agreed in the project group that, to attainbusiness value from an IT initiative, a structured and ongoing carefulexamination of costs, benefits, and risks from the initial feasibilitythrough post-implementation is needed. Even when business value isachieved, there is no guarantee that this value will be maintained unlessthere is an ongoing attention to IT performance measurement.
The implementation of an IT payoff measurement system should by nomeans be seen as a threat to or imposition on staff, rather as a mechanism toenhance performance and corporate learning. A properly developed andimplemented measurement system promotes productivity by focusingattention on the most important issues, tasks, and objectives of the project.
CONCLUSION
The chapter presents the empirical testing of a new model and thesubsequent methodology for identifying and measuring the IT investmentpayoff in the case of Istrabenz Group. While the use of a singular study
1
3
5
7
9
11
13
15
17
19
21
23
25
27
29
31
33
35
37
39
MARC J. EPSTEIN AND ADRIANA REJC BUHOVAC74

limits the generalization of the findings, the research shows that with aproperly implemented IT Contribution Model and the IT Payoff Methodol-ogy IT managers are able to demonstrate the impact on corporateprofitability and value creation from IT.
The new methodology can assist IT managers as they evaluate thetrade-offs and decide which IT project provides the largest net benefit toboth short-term financial performance as well as the overall long-termsuccess of the organization. It can help CIOs, CTOs, CFOs and other seniorcorporate and financial managers as they develop an IT strategy to makeoverall corporate resource allocations to support that strategy. They canrely on convincing evidence based on formal measurement and evaluationwhen making recommendations on these allocations. Also, the IT staff willknow better how well they are performing, correct any deficiencies, and byseeing the results of their work develop an important sense of personalsatisfaction.
The IT Contribution Model and the IT Payoff Methodology can beadapted into any management system that an organization utilizes. It iscompatible with measurement and management frameworks such as thebalanced scorecard and shareholder value analysis that focus on a betterunderstanding of the causal relationships and linkages within organizationsand the actions managers can implement to improve both customer andcorporate profitability and drive increased value.
The proposed methodology could be further improved, althoughmethodological refinements should not jeopardise its pragmatism andcomprehensiveness, which are two of its greatest benefits. It would be ofgreat theoretical and practical importance to be able to test the methodologyalong all six steps, including the role performance measures can play incoordinating employee efforts, both as metrics in the performancemeasurement system as well as reward triggers in the compensation system.The IT Contribution Model should also be further tested and validated toprovide additional empirical evidence of the causal relationships stated inthe model.
ACKNOWLEDGMENTS
We are grateful to the Istrabenz Group, Inc., for providing a suitablecontext for empirical testing of the model and Andrej Moze for conductingthe research and granting access to the data.
1
3
5
7
9
11
13
15
17
19
21
23
25
27
29
31
33
35
37
39
Measuring Performance of IT Investments 75

1
3
5
7
9
11
13
15
17
19
21
23
25
27
29
31
33
35
37
39
REFERENCES
Anandarajan, A., & Wen, J. H. (1999). Evaluation of information technology investment.
Management Decision, MCB University Press, 37(4), 329–337.
Apfel, A. (2002). The total value of opportunity approach. Decision Framework, DF-17-0235.
Aral, S., Brynjolfsson, E., & Wu, D. J. (2006). Which AU :6came first: IT or productivity? The
virtuous cycle of investment and use in enterprise systems. Paper presented at 27th
International Conference on Information Systems, Milwaukee.
Armstrong, C. P., & Sambamurthy, V. (1999). Information technology assimilation in firms:
The influence of senior leadership and IT infrastructures. Information Systems Research,
10(4), 304–327.
Barua, A., & Lee, B. (1997). The IT productivity paradox revisited: A theoretical and empirical
investigation in the manufacturing sector. The International Journal of Flexible
Manufacturing Systems, 9, 145–166.
Barua, A., & Mukhopadhyay, T. (2000). Information technology and business performance:
Past, present, and future. In: R. M. Zmud (Ed.), Framing the domains of IT management:
Projecting the future through the past (pp. 65–84). Cincinnati, OH: Pinnflex Education
Resources.
Bresnahan, T., Brynjolfsson, E., & Hitt, L. (2002). Information technology, workplace
organization and the demand for skilled labor: Firm-level evidence. Quarterly Journal of
Economics, 117(1), 339–376.
Brynjolfsson, E. (2003). The IT productivity gap. Optimize, ABI/Inform GLOBAL, July,
pp. 26–43.
Brynjolfsson, E., & Hitt, L. M. (1996). Paradox lost? Firm-level evidence on the returns to
information systems spending. Management Science, 42(4), 541–558.
Brynjolfsson, E., & Hitt, L. M. (2003). Computing productivity: Firm-level evidence. Review of
Economics and Statistics, 85(4), 793–808.
Byrd, T. A., Lewis, B. R., & Bryan, R. W. (2006). The leveraging influence of strategic alignment
on IT Investment: An empirical examination. Information and Management, 43, 308–321.
Cameron, B., Meringer, J., Dawe, C., & Jastrzembski, E. (2000). Measuring eBusiness success.
The Forrester Report, September.
Carr, N. G. (2003). IT doesn’t matter. Harvard Business AU :7Review (May), 41–49.
Carr, N. G. (2004). Does IT matter? Information technology and the corrosion of competitive
advantage. Boston: Harvard Business School Press.
Curley, M. (2004). Managing information technology for business value: Practical strategies for
IT and business managers. Hillsboro: Intel Press.
Davenport, T., & Short, J. (1990). The new industrial engineering: Information technology and
business process redesign. Sloan Management Review, 31(4), 11–27.
Davern, M. J., & Kaufman, R. J. (2000). Discovering potential and realizing value from informa-
tion technology investments. Journal of Management Information Systems, 16(4), 121–143.
Davies, L., Dehning, B., & Stratopoulous, T. (2003). Does the market recognize IT-enabled
competitive advantage? Information and Management, 40, 705–716.
Devaraj, S., & Kohli, R. (2002). The IT payoff: Measuring the business value of information
technology investments. Upper Saddle River: Prentice-Hall.
EAC Report. (2005). Beyond ROI: Enterprise payback (Enterprise Applications Consulting,
Joshua Greenbaum, Principal).
Epstein, M. J., & Rejc, A. (2005). Evaluating performance in information technology. Manage-
ment accounting guideline. Hamilton: The Society of Management Accountants of Canada.
MARC J. EPSTEIN AND ADRIANA REJC BUHOVAC76

1
3
5
7
9
11
13
15
17
19
21
23
25
27
29
31
33
35
37
39
Gartner Group. (1997). Total cost of ownership analyst: A white paper on GartnerGroup’s next
generation total cost of ownership methodology. Stamford: GartnerConsulting.
Hajela, S. (2005). IT value mapping: A quantitative approach to maximize returns on it
investment. Available at http://wwwstartsmarts.com
Intel Information Technology White Paper. (2003). Managing IT investments: Intel’s IT
business value metrics program, August.
Istrabenz Group. (2005). Guidelines on the use of information and communication technology.
Leavitt, W. (1999). Profit talking. Fleet Owner, 94(1), 57–61.
Lee, C. S. (2001). Modeling the business value of information technology. Information and
Management, 39, 191–210.
Lim, J. H., Richardson, V. J., & Roberts, T. L. (2004). Information AU :8technology investment and
firm performance: A meta-analysis. In: Proceedings of the 37th Hawaii International
Conference on System Sciences, Hawaii.
Love, P. E. D., & Irani, Z. (2004). An exploratory study of information technology evaluation
and benefits: Management practices of SMEs in the construction industry. Information
and Management, 42, 227–242.
Loveman, G. W. (1994). An assessment of the productivity impact of information technologies.
In: T. J. Allen &M. S. Scott-Morton (Eds), Information technology and the corporation of
the 1990s: Research studies. Cambridge, MA: MIT Press.
Lutchen, M. D. (2004). Managing IT as a business: A survival guide for CEOs. Hoboken:
Wiley.
Moze, A. (2006). The application of a new methodology for evaluating IT investments – A case
study. Master’s thesis, University of Ljubljana, Faculty of Economics.
Mukhopadyay, T., Kekre, S., & Kalathur, S. (1995). Business value of information technology:
A study of electronic data interchange. MIS Quarterly, 19(2), 137–156.
Murphy, T. (2002). Achieving business value from technology: A practical guide for today’s
executive. Hoboken: Wiley.
Remenyi, D., Money, A., & Sherwood-Smith, M. (2000). The effective measurement and
management of IT costs and benefits. Oxford: Butterworth-Heinemann.
Schubert, K. D. (2004). CIO survival guide: The roles and responsibilities of the chief information
officer. Hoboken: Wiley.
Schwartz, E. (1999). CEOs diss IT investments. InfoWorld, 21(1), 32.
Short, J. E., & Venkatramen, N. (1992). Beyond business process redesign: Redefining Baxter’s
business network. Sloan Management Review, 34(1), 7–21.
Strassman, P. A. (1990). The business value of computers. New Canaan: Information Economics
Press.
Strassman, P. A. (1999). Information productivity: Assessing the information management costs
of US industrial corporations. New Canaan: Information Economics Press.
Tardugno, A. F., DiPasquale, T. R., & Matthews, R. E. (2000). IT services: Costs, metrics,
benchmarking, and marketing. Upper Saddle River: Prentice Hall.
Thatcher, M. E., & Oliver, J. R. (2001). The impact of technology investments on a firm’s
production efficiency, product quality, and productivity. Journal of Management
Information Systems, 18(2), 17–45.
Weill, P. (1992). The relationship between investment in information technology and firm
performance: A study of the valve manufacturing sector. Information Systems Research,
3(4), 307–333.
Weill, P., & Ross, J. W. (2004). IT governance: How top performers manage IT decision rights for
superior results. Boston: Harvard Business School Press.
Measuring Performance of IT Investments 77

APPENDIX. RESULTS OF INTRODUCING THE ROS
INFORMATION SYSTEM PER INFLUENCE AREA
Area Result Result Specification
Sales Time savings ROS accelerates the response to
the demand and thus creates
savings in the work time of
� Sales personnel: 10% of work
time,� Heads of reservation department:
15% of work time.
More efficient
management tools
ROS enables better analysis of
marketing segments and more
target-oriented marketing. Thus,
the company saves on marketing
expenses.
Fewer complaints ROS decreases the number of
reservation errors and thus the
number of complaints. In this
way, certain costs concerning
claims are saved.
Fewer guests lost Unsatisfied guests may not
complain, but they will never
return.
Catering and
Wellness
Time savings ROS saves time for the
� Waiter: 2.5min per process,� Hotel receptionist: 45 sec per
process,� Wellness receptionist: 1.75min
per process.
More satisfied guests ROS relieves the waiter’s and
receptionist’s workload, which is
why they can devote more time to
guests. Thus, ROS results in
� Related purchases,� Guests returning to the hotel,� Recommendations to guests’
friends and acquaintances.
1
3
5
7
9
11
13
15
17
19
21
23
25
27
29
31
33
35
37
39
MARC J. EPSTEIN AND ADRIANA REJC BUHOVAC78

Support staff Time savings Savings in the work time of
� Cleaning staff: 1min per day,� Receptionist: 30 sec per day.
Material
Accounting
Time savings ROS aids in recording deliveries and
thus saves two bookkeepers 1 h of
work per day.
Invoice
Department
Time savings Time savings will not be visible until
next year; they will amount to 25%
of the work of two invoice clerks.
General Effects Optimization of human
resources
ROS enables detailed analyses that
help organize work.
Economization of
human resources
ROS standardizes working processes
and thus simplifies transfers of
employees from one hotel to
another.
Greater guest
satisfaction and
loyalty
ROS enables the use of a uniform
guest database, creating a basis for
keeping records of regular guests,
and can also help direct the
relationship with the customer.
This increases guest loyalty and
satisfaction, which results in
� Related purchases,� Guests returning to the hotel,� Recommendations to guests’
friends and acquaintances.
1
3
5
7
9
11
13
15
17
19
21
23
25
27
29
31
33
35
37
39
APPENDIX. (Continued )
Area Result Result Specification
Measuring Performance of IT Investments 79

1
3
5
7
9
11
13
15
17
19
21
23
25
27
29
31
33
35
37
39
AUTHOR QUERY FORM
Book: ADVMA-V017
Chapter: 2
Please e-mail or fax your responses
and any corrections to:
E-mail:
Fax:
Dear Author,
During the preparation of your manuscript for typesetting, some questions may have arisen.
These are listed below. Please check your typeset proof carefully and mark any corrections in
the margin of the proof or compile them as a separate list.
Disk use
Sometimes we are unable to process the electronic file of your article and/or artwork. If this is
the case, we have proceeded by:
& Scanning (parts of) your article & Rekeying (parts of) your article
& Scanning the artwork
Bibliography
If discrepancies were noted between the literature list and the text references, the following may
apply:
& The references listed below were noted in the text but appear to be missing from
your literature list. Please complete the list or remove the references from the text.
& UNCITED REFERENCES: This section comprises references that occur in the
reference list but not in the body of the text. Please position each reference in the text or
delete it. Any reference not dealt with will be retained in this section.
Queries and/or remarks
Location in
Article
Query / remark Response
AU:1 Does "CIOs" stands for "chief
information officers"?
AU:2 Please provide the expansion of
following: ROI, IRR, ROS and
SBU.
AU:3 Please check and confirm the
insertion of "TCO" in sentence
"Total Cost of Ownership....".
1
3
5
7
9
11
13
15
17
19
21
23
25
27
29
31
33
35
37
39
AU:4 Please check the change made
from "factors" to "vectors" in
sentence "All three vectors use
a....".
AU:5 Please check the sentence
"Metrics should be used to foster
an understanding the IT
initiative..." for sense clarity.
AU:6 In reference Aral et al. (2006),
please check the change made.
AU:7 In reference Carr (2003), please
provide the volume number.
AU:8 In reference Lim et al. (2004),
please provide the editors name.