Embed Size (px)
Citation preview
WORLD MAGAZINE TRENDS
2014 / 15
SPECIAL REPORTEMEA

FIPP WORLD MAGAZINE TRENDS 2014/2015:EMEA SPECIAL REPORT 1
EMEA
T he region of Africa and the Middle East is so diverse that it is impossible to draw conclusions for the region as a whole. Nigeria for example has
emerged as the largest economy in Africa with a GDP of 502 billion but has one of the lowest ratios on advertising expenditure. With a total adspend in 2013 of US$785 million the ratio is 0.16%, one of the lowest in the region. South Africa with a GDP of US$262 billion and an adspend of US$3,830 million has the highest ratio in the region (1.09%). The worldwide average is 0.69% and for MENA (Middle East and North Africa) this is 0.23%. In MENA Saudi Arabia is the largest economy with a GDP of US$745 billion, but advertising revenue is so low, with ‘only’ US$602 million that it is one of the lowest in the MENA region.
After the Arab Spring began in December 2010, advertising markets in Middle East and North Africa were constrained by the region’s social and political turmoil, which left many advertisers cautious about attracting negative attention. Adspend shrank 14.9% in 2011, and grew a meagre 1.4% in 2012. Confidence and activity began to recover in 2013, when adspend grew 4.7%. Zenith forecasts 7.1% growth in 2014, falling back to a more muted 4% to 5% annual growth in 2015 and 2016.
South Africa’s economy has struggled since the recession in 2009, partly because of global factors, but also because of domestic problems, including regulatory uncertainty, rising employment, electricity costs, infrastructure bottlenecks and labour unrest. However the advertising industry saw only growth. In 2013 the ad revenue increased with 7.5% and will do so in the next few years with an average annual growth of 8.2% to US$4,848 million in 2016. This is almost the same level as the whole of MENA with a total of US$5,138 million.
The media landscape in both MENA and South Africa differs from the global situation and this is due to the very small share of internet advertising.
TV is and will remain the first medium as it is in the rest of the world. Here it takes a bigger part of total adspend. In 2013 the share of TV in MENA is 53%, in South Africa 49% and globally 40%. In the Middle East the share within the countries is once again completely different. In the UAE for example, television accounts for a very small share of only 6% in this market due to the dominance of pan-Arab satellite television channels, which attract viewers at the expense of national and local stations. TV will grow 9% in MENA and 6% in South Africa where most of the growth comes from organic growth in the broadcast TV market. This is fuelled by growing audiences, greater competition among broadcasters and advertisers for their attention, and relatively favourable macroeconomic conditions. The second large medium is newspapers, and together with TV they account for more than 80% of the total adspend market in MENA. In South Africa radio is much bigger than worldwide with a share of 16% compared with only 7% globally.
Although internet advertising will grow, share is still very low with 3.9% in MENA (5.5% in 2016) and only 2.8% in South Africa in 2013 (3% in 2016). Forecasts are positive as internet access increases. Mobile internet advertising in particular will grow rapidly as access to smartphones increases.
Magazines: small but solidPublishers in the consumer magazine sector have experimented with launches and closures over the past few years in order to increase market share and stimulate growth. Unfortunately this didn’t boost either revenue or share very much. In the advertising market the
share of magazines is 3.5% in MENA and 6.6% in South Africa, where this is 8% globally. With total revenue - both circulation and advertising - of US$1,500 million, the market grew by a cautious 1% in 2013. PwC forecasts an annual growth of 5% to a total of US$1,736 million in 2016. South Africa accounts for 62% of the revenue in the whole region with 92% for consumer magazines and 8% for B2B. Most of the revenue comes from circulations (57%) and will even grow in the near future (61% in 2016). Digital revenue, both circulation and advertising is still very small in this region. In 2013 2% comes from digital and 4% in 2016.
> Austria > Belgium > Bulgaria > Czech Republic > Denmark > Finland
> France > Germany> Greece > Hungary > Ireland > Italy > Kazakhstan
> Latvia > Netherlands > Norway> Poland > Portugal > Russia > South Africa
> Spain > Sweden > Switzerland > Turkey > UK> United Arab Emirates
Most of the revenue comes from circulations and will grow to 61% in the near future
>SUMMARY: AFRICA / MIDDLE EAST
> COUNTRIES COVERED
* ZenithOptimedia defines Africa and the Middle East as MENA (Middle East and North Africa), which includes Bahrain, Egypt, Kuwait, Lebanon, Oman, Qatar, Saudi Arabia and UAE. South Africa is placed in ‘the rest of the world’ category. In this summary both categories are combined.
PwC includes Saudi Arabia, UAE, South Africa, Egypt, Nigeria and Kenya in its statistics for the Africa and Middle East region.
With total revenue, the region’s market grew by a cautious 1% in 2013
South Africa’s ad industry saw only growth
2 FIPP WORLD MAGAZINE TRENDS 2014/2015: EMEA SPECIAL REPORT
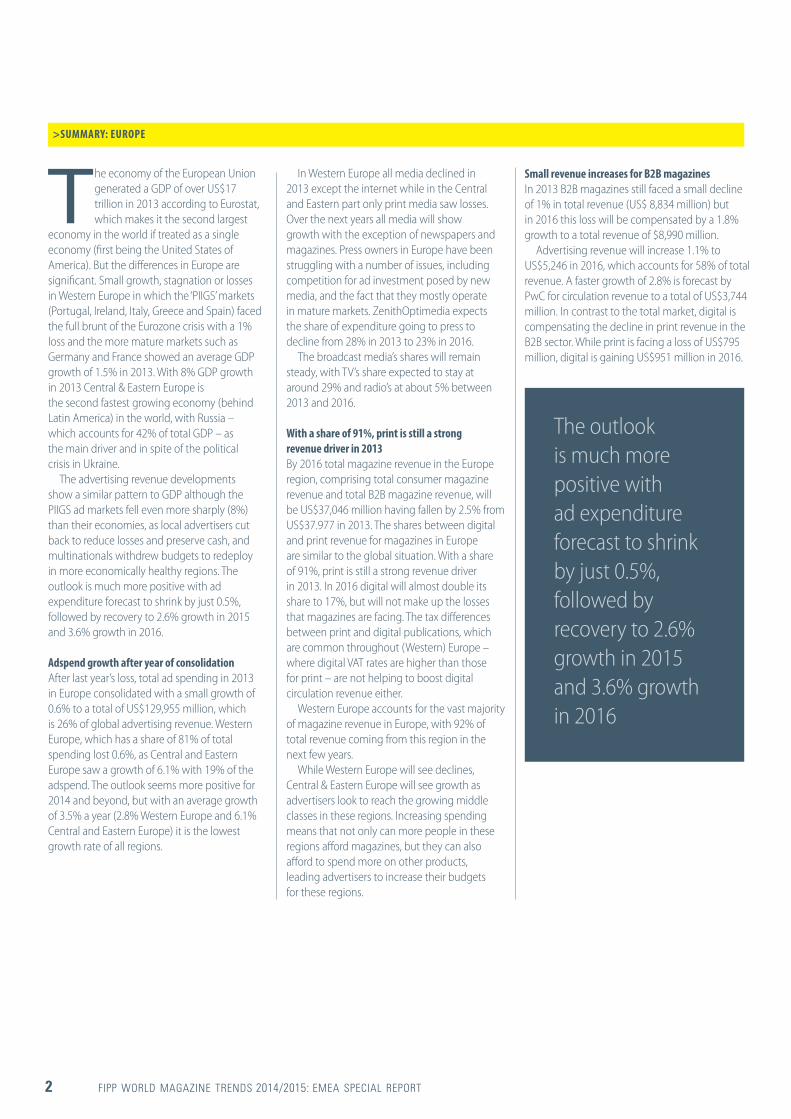
T he economy of the European Union generated a GDP of over US$17 trillion in 2013 according to Eurostat, which makes it the second largest
economy in the world if treated as a single economy (first being the United States of America). But the differences in Europe are significant. Small growth, stagnation or losses in Western Europe in which the ‘PIIGS’ markets (Portugal, Ireland, Italy, Greece and Spain) faced the full brunt of the Eurozone crisis with a 1% loss and the more mature markets such as Germany and France showed an average GDP growth of 1.5% in 2013. With 8% GDP growth in 2013 Central & Eastern Europe is the second fastest growing economy (behind Latin America) in the world, with Russia – which accounts for 42% of total GDP – as the main driver and in spite of the political crisis in Ukraine.
The advertising revenue developments show a similar pattern to GDP although the PIIGS ad markets fell even more sharply (8%) than their economies, as local advertisers cut back to reduce losses and preserve cash, and multinationals withdrew budgets to redeploy in more economically healthy regions. The outlook is much more positive with ad expenditure forecast to shrink by just 0.5%, followed by recovery to 2.6% growth in 2015 and 3.6% growth in 2016.
Adspend growth after year of consolidationAfter last year’s loss, total ad spending in 2013 in Europe consolidated with a small growth of 0.6% to a total of US$129,955 million, which is 26% of global advertising revenue. Western Europe, which has a share of 81% of total spending lost 0.6%, as Central and Eastern Europe saw a growth of 6.1% with 19% of the adspend. The outlook seems more positive for 2014 and beyond, but with an average growth of 3.5% a year (2.8% Western Europe and 6.1% Central and Eastern Europe) it is the lowest growth rate of all regions.
In Western Europe all media declined in 2013 except the internet while in the Central and Eastern part only print media saw losses. Over the next years all media will show growth with the exception of newspapers and magazines. Press owners in Europe have been struggling with a number of issues, including competition for ad investment posed by new media, and the fact that they mostly operate in mature markets. ZenithOptimedia expects the share of expenditure going to press to decline from 28% in 2013 to 23% in 2016.
The broadcast media’s shares will remain steady, with TV’s share expected to stay at around 29% and radio’s at about 5% between 2013 and 2016.
With a share of 91%, print is still a strong revenue driver in 2013By 2016 total magazine revenue in the Europe region, comprising total consumer magazine revenue and total B2B magazine revenue, will be US$37,046 million having fallen by 2.5% from US$37.977 in 2013. The shares between digital and print revenue for magazines in Europe are similar to the global situation. With a share of 91%, print is still a strong revenue driver in 2013. In 2016 digital will almost double its share to 17%, but will not make up the losses that magazines are facing. The tax differences between print and digital publications, which are common throughout (Western) Europe – where digital VAT rates are higher than those for print – are not helping to boost digital circulation revenue either.
Western Europe accounts for the vast majority of magazine revenue in Europe, with 92% of total revenue coming from this region in the next few years.
While Western Europe will see declines, Central & Eastern Europe will see growth as advertisers look to reach the growing middle classes in these regions. Increasing spending means that not only can more people in these regions afford magazines, but they can also afford to spend more on other products, leading advertisers to increase their budgets for these regions.
Small revenue increases for B2B magazinesIn 2013 B2B magazines still faced a small decline of 1% in total revenue (US$ 8,834 million) but in 2016 this loss will be compensated by a 1.8% growth to a total revenue of $8,990 million.
Advertising revenue will increase 1.1% to US$5,246 in 2016, which accounts for 58% of total revenue. A faster growth of 2.8% is forecast by PwC for circulation revenue to a total of US$3,744 million. In contrast to the total market, digital is compensating the decline in print revenue in the B2B sector. While print is facing a loss of US$795 million, digital is gaining US$951 million in 2016.
The outlook is much more positive with ad expenditure forecast to shrink by just 0.5%, followed by recovery to 2.6% growth in 2015 and 3.6% growth in 2016
>SUMMARY: EUROPE
FIPP WORLD MAGAZINE TRENDS 2014/2015:EMEA SPECIAL REPORT 3
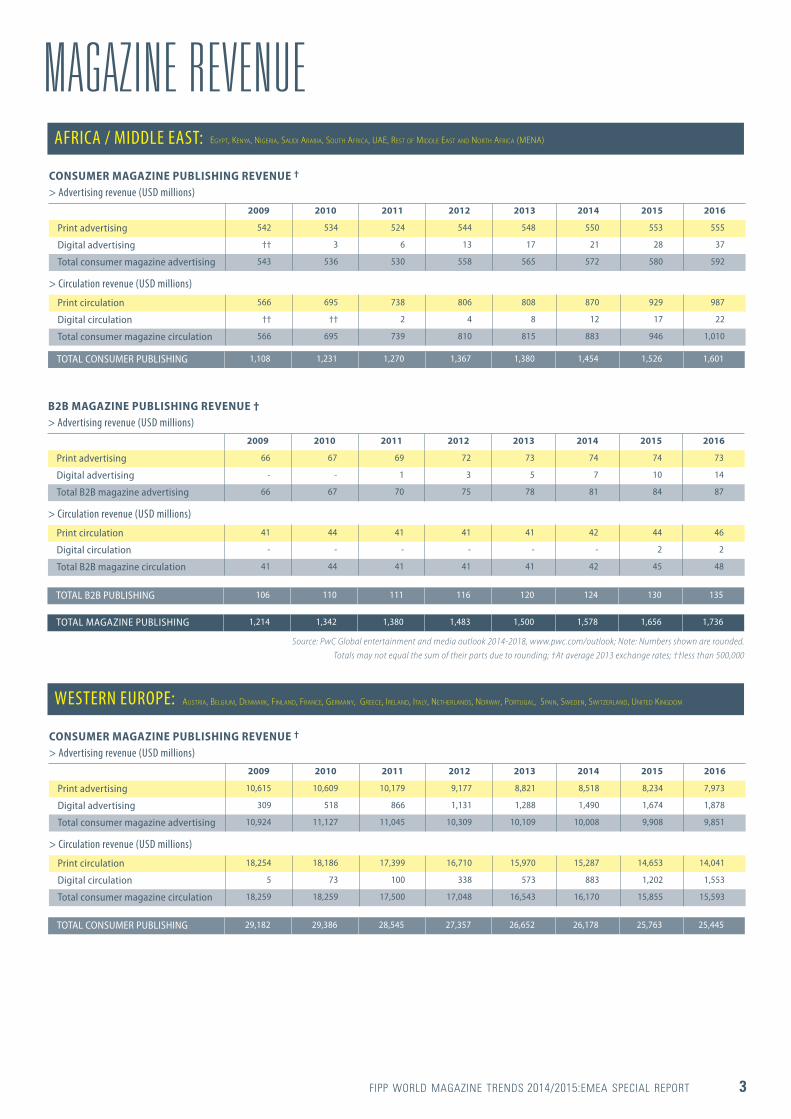
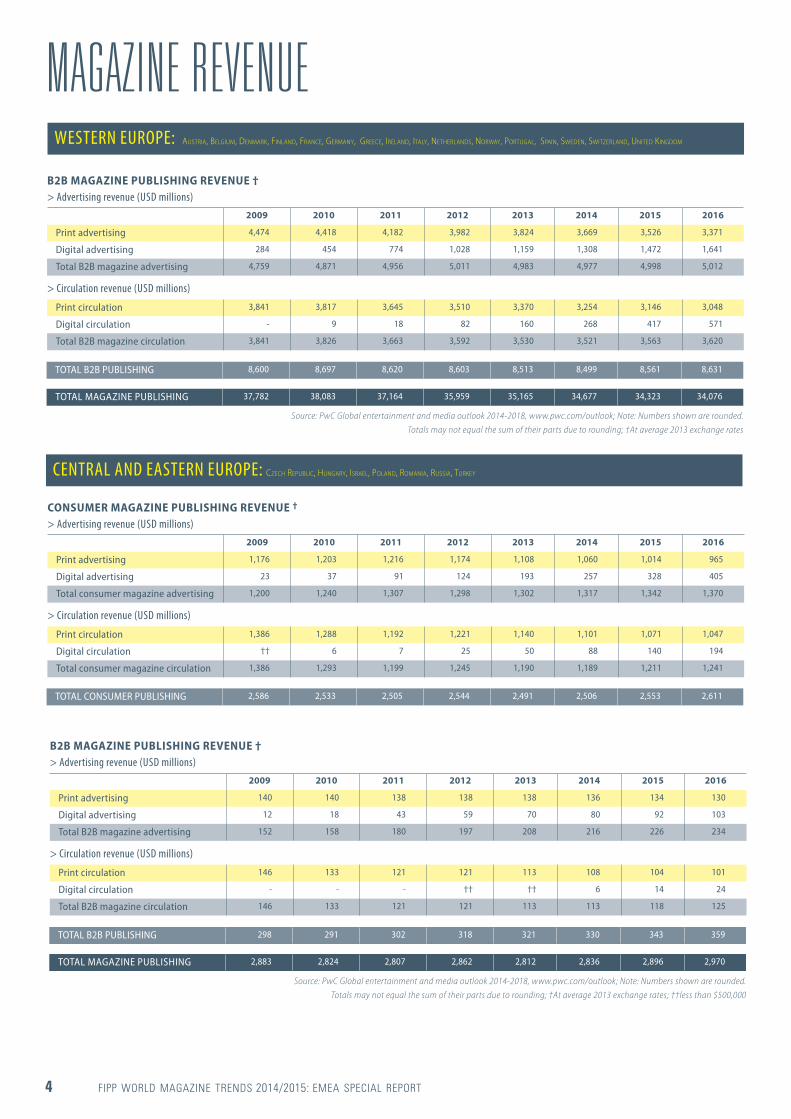
MAGAZINE REVENUECONSUMER MAGAZINE PUBLISHING REVENUE †
AFRICA / MIDDLE EAST:
> Advertising revenue (USD millions)
> Circulation revenue (USD millions)
2009 2010 2011 2012 2013 2014 2015 2016
Print advertising 542 534 524 544 548 550 553 555
Digital advertising †† 3 6 13 17 21 28 37
Total consumer magazine advertising 543 536 530 558 565 572 580 592
Print circulation 566 695 738 806 808 870 929 987
Digital circulation †† †† 2 4 8 12 17 22
Total consumer magazine circulation 566 695 739 810 815 883 946 1,010
TOTAL CONSUMER PUBLISHING 1,108 1,231 1,270 1,367 1,380 1,454 1,526 1,601
EGYPT, KENYA, NIGERIA, SAUDI ARABIA, SOUTH AFRICA, UAE, REST OF MIDDLE EAST AND NORTH AFRICA (MENA)
B2B MAGAZINE PUBLISHING REVENUE †> Advertising revenue (USD millions)
> Circulation revenue (USD millions)
2009 2010 2011 2012 2013 2014 2015 2016
Print advertising 66 67 69 72 73 74 74 73
Digital advertising - - 1 3 5 7 10 14
Total B2B magazine advertising 66 67 70 75 78 81 84 87
Print circulation 41 44 41 41 41 42 44 46
Digital circulation - - - - - - 2 2
Total B2B magazine circulation 41 44 41 41 41 42 45 48
TOTAL B2B PUBLISHING 106 110 111 116 120 124 130 135
TOTAL MAGAZINE PUBLISHING 1,214 1,342 1,380 1,483 1,500 1,578 1,656 1,736
Source: PwC Global entertainment and media outlook 2014-2018, www.pwc.com/outlook; Note: Numbers shown are rounded. Totals may not equal the sum of their parts due to rounding; †At average 2013 exchange rates; ††less than 500,000
CONSUMER MAGAZINE PUBLISHING REVENUE †
WESTERN EUROPE:
> Advertising revenue (USD millions)
> Circulation revenue (USD millions)
2009 2010 2011 2012 2013 2014 2015 2016
Print advertising 10,615 10,609 10,179 9,177 8,821 8,518 8,234 7,973
Digital advertising 309 518 866 1,131 1,288 1,490 1,674 1,878
Total consumer magazine advertising 10,924 11,127 11,045 10,309 10,109 10,008 9,908 9,851
Print circulation 18,254 18,186 17,399 16,710 15,970 15,287 14,653 14,041
Digital circulation 5 73 100 338 573 883 1,202 1,553
Total consumer magazine circulation 18,259 18,259 17,500 17,048 16,543 16,170 15,855 15,593
TOTAL CONSUMER PUBLISHING 29,182 29,386 28,545 27,357 26,652 26,178 25,763 25,445
AUSTRIA, BELGIUM, DENMARK, FINLAND, FRANCE, GERMANY, GREECE, IRELAND, ITALY, NETHERLANDS, NORWAY, PORTUGAL, SPAIN, SWEDEN, SWITZERLAND, UNITED KINGDOM
4 FIPP WORLD MAGAZINE TRENDS 2014/2015: EMEA SPECIAL REPORT
B2B MAGAZINE PUBLISHING REVENUE †> Advertising revenue (USD millions)
> Circulation revenue (USD millions)
2009 2010 2011 2012 2013 2014 2015 2016
Print advertising 140 140 138 138 138 136 134 130
Digital advertising 12 18 43 59 70 80 92 103
Total B2B magazine advertising 152 158 180 197 208 216 226 234
Print circulation 146 133 121 121 113 108 104 101
Digital circulation - - - †† †† 6 14 24
Total B2B magazine circulation 146 133 121 121 113 113 118 125
TOTAL B2B PUBLISHING 298 291 302 318 321 330 343 359
TOTAL MAGAZINE PUBLISHING 2,883 2,824 2,807 2,862 2,812 2,836 2,896 2,970
Source: PwC Global entertainment and media outlook 2014-2018, www.pwc.com/outlook; Note: Numbers shown are rounded. Totals may not equal the sum of their parts due to rounding; †At average 2013 exchange rates; ††less than $500,000
MAGAZINE REVENUEB2B MAGAZINE PUBLISHING REVENUE †> Advertising revenue (USD millions)
> Circulation revenue (USD millions)
2009 2010 2011 2012 2013 2014 2015 2016
Print advertising 4,474 4,418 4,182 3,982 3,824 3,669 3,526 3,371
Digital advertising 284 454 774 1,028 1,159 1,308 1,472 1,641
Total B2B magazine advertising 4,759 4,871 4,956 5,011 4,983 4,977 4,998 5,012
Print circulation 3,841 3,817 3,645 3,510 3,370 3,254 3,146 3,048
Digital circulation - 9 18 82 160 268 417 571
Total B2B magazine circulation 3,841 3,826 3,663 3,592 3,530 3,521 3,563 3,620
TOTAL B2B PUBLISHING 8,600 8,697 8,620 8,603 8,513 8,499 8,561 8,631
TOTAL MAGAZINE PUBLISHING 37,782 38,083 37,164 35,959 35,165 34,677 34,323 34,076
Source: PwC Global entertainment and media outlook 2014-2018, www.pwc.com/outlook; Note: Numbers shown are rounded. Totals may not equal the sum of their parts due to rounding; †At average 2013 exchange rates
CONSUMER MAGAZINE PUBLISHING REVENUE †
CENTRAL AND EASTERN EUROPE:
> Advertising revenue (USD millions)
> Circulation revenue (USD millions)
2009 2010 2011 2012 2013 2014 2015 2016
Print advertising 1,176 1,203 1,216 1,174 1,108 1,060 1,014 965
Digital advertising 23 37 91 124 193 257 328 405
Total consumer magazine advertising 1,200 1,240 1,307 1,298 1,302 1,317 1,342 1,370
Print circulation 1,386 1,288 1,192 1,221 1,140 1,101 1,071 1,047
Digital circulation †† 6 7 25 50 88 140 194
Total consumer magazine circulation 1,386 1,293 1,199 1,245 1,190 1,189 1,211 1,241
TOTAL CONSUMER PUBLISHING 2,586 2,533 2,505 2,544 2,491 2,506 2,553 2,611
CZECH REPUBLIC, HUNGARY, ISRAEL, POLAND, ROMANIA, RUSSIA, TURKEY
WESTERN EUROPE: AUSTRIA, BELGIUM, DENMARK, FINLAND, FRANCE, GERMANY, GREECE, IRELAND, ITALY, NETHERLANDS, NORWAY, PORTUGAL, SPAIN, SWEDEN, SWITZERLAND, UNITED KINGDOM

FIPP WORLD MAGAZINE TRENDS 2014/2015:EMEA SPECIAL REPORT 5
AFRICA/MIDDLE EAST
DIGITAL PENETRATIONINTERNET USERS POPULATION (2014 EST.) INTERNET PENETRATION
(% POPULATION)COUNTRY’S SHARE OF WORLD INTERNET USERS
South Africa 24,909,854 53,139,528 46.88% 0.85%
UAE 8,807,226 9,445,624 93.24% 0.30%
EUROPE
Austria 7,135,168 8,526,429 83.68% 0.24%
Belgium 9,441,116 11,144,420 84.72% 0.32%
Bulgaria 4,083,950 7,167,998 56.97% 0.14%
Czech Republic 8,322,168 10,740,468 77.48% 0.28%
Denmark 5,419,113 5,640,184 96.08% 0.19%
Finland 5,117,660 5,443,497 94.01% 0.18%
France 55,429,382 64,641,279 85.75% 1.90%
Germany 71,727,551 82,652,256 86.78% 2.46%
Greece 6,438,325 11,128,404 57.85% 0.22%
Hungary 7,388,776 9,933,173 74.38% 0.25%
Ireland 3,817,491 4,677,340 81.62% 0.13%
Italy 36,593,969 61,070,224 59.92% 1.25%
Kazakhstan 9,850,123 16,606,878 59.31% 0.34%
Latvia 1,560,452 2,041,111 76.45% 0.05%
Netherlands 16,143,879 16,802,463 96.08% 0.55%
Norway 4,895,885 5,091,924 96.15% 0.17%
Poland 25,666,238 38,220,543 67.15% 0.88%
Portugal 7,015,519 10,610,304 66.12% 0.24%
Russia 84,437,793 142,467,651 59.27% 2.89%
Spain 35,010,273 47,066,402 74.38% 1.20%
Sweden 8,581,261 9,631,261 89.10% 0.29%
Switzerland 7,180,749 8,157,896 88.02% 0.25%
Turkey 35,358,888 75,837,020 46.62% 1.21%
UK 57,075,826 63,489,234 89.90% 1.95%
Source: Internet Live Stats (www.InternetLiveStats.com) 2014 est.; Internet World Stats for Chinese Taipei (www.internetworldstats.com); Internet user = individual, of any age, who can access the Internet at home, via any device type (computer or mobile) and connection;
Population calculation according to each separate source
CZECH REPUBLIC, HUNGARY, ISRAEL, POLAND, ROMANIA, RUSSIA, TURKEY
6 FIPP WORLD MAGAZINE TRENDS 2014/2015: EMEA SPECIAL REPORT
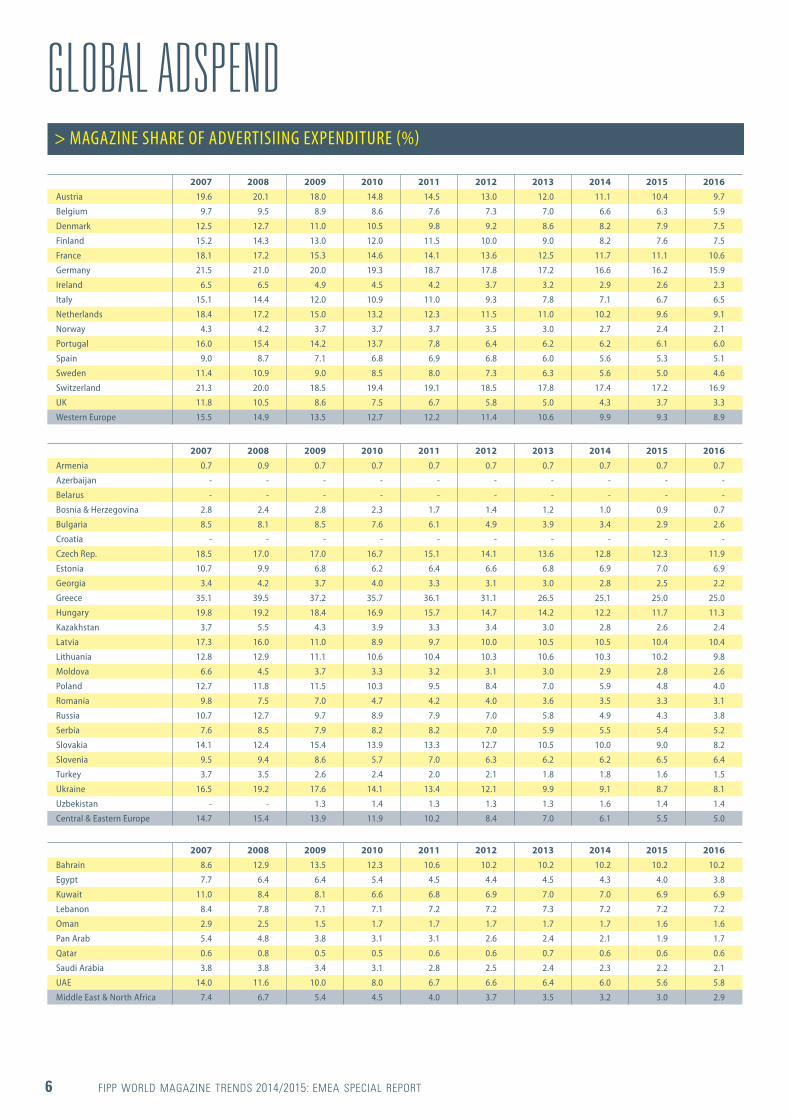
GLOBAL ADSPEND> MAGAZINE SHARE OF ADVERTISIING EXPENDITURE (%)
2007 2008 2009 2010 2011 2012 2013 2014 2015 2016
Austria 19.6 20.1 18.0 14.8 14.5 13.0 12.0 11.1 10.4 9.7
Belgium 9.7 9.5 8.9 8.6 7.6 7.3 7.0 6.6 6.3 5.9
Denmark 12.5 12.7 11.0 10.5 9.8 9.2 8.6 8.2 7.9 7.5
Finland 15.2 14.3 13.0 12.0 11.5 10.0 9.0 8.2 7.6 7.5
France 18.1 17.2 15.3 14.6 14.1 13.6 12.5 11.7 11.1 10.6
Germany 21.5 21.0 20.0 19.3 18.7 17.8 17.2 16.6 16.2 15.9
Ireland 6.5 6.5 4.9 4.5 4.2 3.7 3.2 2.9 2.6 2.3
Italy 15.1 14.4 12.0 10.9 11.0 9.3 7.8 7.1 6.7 6.5
Netherlands 18.4 17.2 15.0 13.2 12.3 11.5 11.0 10.2 9.6 9.1
Norway 4.3 4.2 3.7 3.7 3.7 3.5 3.0 2.7 2.4 2.1
Portugal 16.0 15.4 14.2 13.7 7.8 6.4 6.2 6.2 6.1 6.0
Spain 9.0 8.7 7.1 6.8 6.9 6.8 6.0 5.6 5.3 5.1
Sweden 11.4 10.9 9.0 8.5 8.0 7.3 6.3 5.6 5.0 4.6
Switzerland 21.3 20.0 18.5 19.4 19.1 18.5 17.8 17.4 17.2 16.9
UK 11.8 10.5 8.6 7.5 6.7 5.8 5.0 4.3 3.7 3.3
Western Europe 15.5 14.9 13.5 12.7 12.2 11.4 10.6 9.9 9.3 8.9
2007 2008 2009 2010 2011 2012 2013 2014 2015 2016
Armenia 0.7 0.9 0.7 0.7 0.7 0.7 0.7 0.7 0.7 0.7
Azerbaijan - - - - - - - - - -
Belarus - - - - - - - - - -
Bosnia & Herzegovina 2.8 2.4 2.8 2.3 1.7 1.4 1.2 1.0 0.9 0.7
Bulgaria 8.5 8.1 8.5 7.6 6.1 4.9 3.9 3.4 2.9 2.6
Croatia - - - - - - - - - -
Czech Rep. 18.5 17.0 17.0 16.7 15.1 14.1 13.6 12.8 12.3 11.9
Estonia 10.7 9.9 6.8 6.2 6.4 6.6 6.8 6.9 7.0 6.9
Georgia 3.4 4.2 3.7 4.0 3.3 3.1 3.0 2.8 2.5 2.2
Greece 35.1 39.5 37.2 35.7 36.1 31.1 26.5 25.1 25.0 25.0
Hungary 19.8 19.2 18.4 16.9 15.7 14.7 14.2 12.2 11.7 11.3
Kazakhstan 3.7 5.5 4.3 3.9 3.3 3.4 3.0 2.8 2.6 2.4
Latvia 17.3 16.0 11.0 8.9 9.7 10.0 10.5 10.5 10.4 10.4
Lithuania 12.8 12.9 11.1 10.6 10.4 10.3 10.6 10.3 10.2 9.8
Moldova 6.6 4.5 3.7 3.3 3.2 3.1 3.0 2.9 2.8 2.6
Poland 12.7 11.8 11.5 10.3 9.5 8.4 7.0 5.9 4.8 4.0
Romania 9.8 7.5 7.0 4.7 4.2 4.0 3.6 3.5 3.3 3.1
Russia 10.7 12.7 9.7 8.9 7.9 7.0 5.8 4.9 4.3 3.8
Serbia 7.6 8.5 7.9 8.2 8.2 7.0 5.9 5.5 5.4 5.2
Slovakia 14.1 12.4 15.4 13.9 13.3 12.7 10.5 10.0 9.0 8.2
Slovenia 9.5 9.4 8.6 5.7 7.0 6.3 6.2 6.2 6.5 6.4
Turkey 3.7 3.5 2.6 2.4 2.0 2.1 1.8 1.8 1.6 1.5
Ukraine 16.5 19.2 17.6 14.1 13.4 12.1 9.9 9.1 8.7 8.1
Uzbekistan - - 1.3 1.4 1.3 1.3 1.3 1.6 1.4 1.4
Central & Eastern Europe 14.7 15.4 13.9 11.9 10.2 8.4 7.0 6.1 5.5 5.0
2007 2008 2009 2010 2011 2012 2013 2014 2015 2016
Bahrain 8.6 12.9 13.5 12.3 10.6 10.2 10.2 10.2 10.2 10.2
Egypt 7.7 6.4 6.4 5.4 4.5 4.4 4.5 4.3 4.0 3.8
Kuwait 11.0 8.4 8.1 6.6 6.8 6.9 7.0 7.0 6.9 6.9
Lebanon 8.4 7.8 7.1 7.1 7.2 7.2 7.3 7.2 7.2 7.2
Oman 2.9 2.5 1.5 1.7 1.7 1.7 1.7 1.7 1.6 1.6
Pan Arab 5.4 4.8 3.8 3.1 3.1 2.6 2.4 2.1 1.9 1.7
Qatar 0.6 0.8 0.5 0.5 0.6 0.6 0.7 0.6 0.6 0.6
Saudi Arabia 3.8 3.8 3.4 3.1 2.8 2.5 2.4 2.3 2.2 2.1
UAE 14.0 11.6 10.0 8.0 6.7 6.6 6.4 6.0 5.6 5.8
Middle East & North Africa 7.4 6.7 5.4 4.5 4.0 3.7 3.5 3.2 3.0 2.9

FIPP WORLD MAGAZINE TRENDS 2014/2015:EMEA SPECIAL REPORT 7
GLOBAL ADSPEND> TOTAL MAGAZINE EXPENDITURE: US$ MILLION AT CURRENT PRICES
2007 2008 2009 2010 2011 2012 2013 2014 2015 2016
Austria 623 672 592 607 634 562 522 487 465 443
Belgium 399 398 374 394 364 349 343 338 333 327
Denmark 328 324 238 231 228 207 192 186 186 184
Finland 279 268 209 204 209 181 150 134 124 124
France 2,440 2,344 1,914 1,972 1,951 1,843 1,657 1,548 1,476 1,423
Germany 5,383 5,245 4,575 4,602 4,588 4,296 4,175 4,101 4,062 4,040
Ireland 100 84 53 46 41 34 29 27 25 24
Italy 1,860 1,724 1,230 1,164 1,121 913 695 619 596 585
Netherlands 1,072 1,004 760 692 648 578 549 518 498 483
Norway 110 109 86 93 100 93 83 74 68 62
Portugal 200 190 152 147 74 50 44 45 46 48
Spain 959 820 534 527 506 417 337 324 324 327
Sweden 394 391 280 298 298 271 232 212 195 187
Switzerland 967 967 880 1,038 1,089 1,058 1,035 1,014 1,001 990
UK 2,338 2,106 1,517 1,428 1,307 1,152 1,045 962 906 854
Western Europe 17,450 16,647 13,394 13,443 13,155 12,005 11,087 10,590 10,305 10,101
2007 2008 2009 2010 2011 2012 2013 2014 2015 2016
Armenia 0 0 1 1 1 1 1 1 1 1
Azerbaijan - - - - - - - - - -
Belarus - - - - - - - - - -
Bosnia & Herzegovina 7 8 11 10 8 8 7 6 6 6
Bulgaria 56 67 59 51 43 37 33 31 29 27
Croatia - - - - - - - - - -
Czech Rep. 217 221 182 189 175 163 156 153 149 148
Estonia 16 15 6 6 6 6 7 7 8 8
Georgia 1 2 2 2 2 2 2 2 1 1
Greece 1,255 1,369 1,094 919 721 438 357 325 325 329
Hungary 166 173 141 132 121 114 113 99 97 95
Kazakhstan 31 49 32 33 33 36 37 37 39 39
Latvia 44 42 16 11 13 13 15 15 15 15
Lithuania 25 28 14 14 14 14 14 14 15 14
Moldova 1 1 1 1 1 1 1 1 1 1
Poland 282 290 250 229 215 180 142 121 102 87
Romania 59 59 38 22 18 16 14 14 14 14
Russia 737 935 538 578 623 633 581 529 490 470
Serbia 12 17 14 17 17 16 13 12 12 12
Slovakia 101 110 109 94 89 86 70 68 64 60
Slovenia 57 66 61 47 61 54 47 49 54 57
Turkey 65 60 38 45 50 56 54 58 61 62
Ukraine 164 218 93 94 103 100 88 55 58 60
Uzbekistan - - 1 1 1 1 1 1 1 1
Central & Eastern Europe 3,296 3,730 2,700 2,494 2,315 1,973 1,750 1,599 1,541 1,507
2007 2008 2009 2010 2011 2012 2013 2014 2015 2016
Bahrain 8 14 12 12 4 4 4 4 4 4
Egypt 20 28 31 28 14 15 15 15 15 15
Kuwait 34 37 30 25 24 23 23 23 23 23
Lebanon 10 11 11 13 11 10 9 9 9 9
Oman 2 2 1 1 1 1 1 1 1 1
Pan Arab 100 110 77 69 62 56 56 55 52 49
Qatar 1 1 0 1 1 1 1 0 0 0
Saudi Arabia 28 31 22 19 17 15 14 14 14 14
UAE 123 148 59 50 35 32 32 32 32 36
Middle East & North Africa 325 382 243 218 168 156 154 153 150 151

8 FIPP WORLD MAGAZINE TRENDS 2014/2015: EMEA SPECIAL REPORT
GLOBAL ADSPEND> TOTAL ADVERTISING EXPENDITURE: US$ MILLION AT CURRENT PRICES
2007 2008 2009 2010 2011 2012 2013 2014 2015 2016
Austria 3,182 3,347 3,295 4,114 4,369 4,322 4,354 4,388 4,469 4,581
Belgium 4,135 4,210 4,219 4,605 4,766 4,794 4,914 5,102 5,304 5,515
Denmark 2,611 2,542 2,161 2,211 2,330 2,262 2,229 2,265 2,341 2,444
Finland 1,839 1,870 1,600 1,698 1,812 1,805 1,666 1,635 1,635 1,654
France 13,454 13,615 12,510 13,473 13,878 13,589 13,250 13,193 13,259 13,427
Germany 25,062 24,993 22,869 23,855 24,547 24,189 24,242 24,643 25,000 25,337
Ireland 1,538 1,294 1,096 1,023 978 927 899 923 965 1,029
Italy 12,361 12,004 10,289 10,649 10,230 9,801 8,890 8,701 8,831 9,024
Netherlands 5,836 5,827 5,060 5,226 5,269 5,008 4,989 5,097 5,195 5,294
Norway 2,547 2,631 2,309 2,485 2,670 2,681 2,795 2,792 2,847 2,925
Portugal 1,247 1,233 1,071 1,078 938 778 715 728 754 789
Spain 10,606 9,432 7,479 7,780 7,312 6,157 5,659 5,772 6,067 6,407
Sweden 3,449 3,586 3,118 3,513 3,752 3,739 3,702 3,805 3,902 4,058
Switzerland 4,545 4,826 4,752 5,362 5,698 5,734 5,798 5,814 5,828 5,860
UK 19,886 20,080 17,614 18,986 19,420 19,844 20,850 22,390 24,223 25,650
Western Europe 112,298 111,490 99,440 106,056 107,968 105,631 104,951 107,249 110,621 113,995
2007 2008 2009 2010 2011 2012 2013 2014 2015 2016
Armenia 40 52 69 86 91 100 110 121 127 133
Azerbaijan 38 50 56 66 70 86 108 129 122 145
Belarus 88 115 88 98 70 81 108 123 139 157
Bosnia & Herzegovina 238 326 410 430 491 553 612 642 695 798
Bulgaria 666 819 697 675 705 764 852 917 982 1,041
Croatia 340 395 323 303 289 260 254 258 269 298
Czech Rep. 1,171 1,298 1,073 1,131 1,161 1,161 1,150 1,195 1,218 1,245
Estonia 152 148 94 89 96 96 101 106 110 111
Georgia 36 40 44 48 49 51 53 55 57 59
Greece 3,581 3,466 2,941 2,577 1,999 1,411 1,348 1,295 1,302 1,318
Hungary 835 901 763 782 771 774 795 814 830 839
Kazakhstan 829 889 739 851 988 1,059 1,214 1,335 1,475 1,628
Latvia 252 261 142 123 130 132 139 141 143 143
Lithuania 198 216 129 128 134 135 135 138 142 145
Moldova 19 30 29 30 32 34 37 39 42 46
Poland 2,219 2,452 2,168 2,214 2,259 2,134 2,022 2,059 2,108 2,170
Romania 603 796 538 458 440 395 383 393 412 445
Russia 6,884 7,373 5,561 6,528 7,940 9,018 10,009 10,704 11,471 12,357
Serbia 164 195 178 212 207 231 215 215 220 231
Slovakia 715 888 705 678 669 675 670 676 710 733
Slovenia 600 708 712 824 883 862 757 791 836 886
Turkey 1,737 1,702 1,453 1,897 2,440 2,670 2,993 3,262 3,726 4,137
Ukraine 994 1,138 525 666 764 828 893 603 665 745
Uzbekistan 15 35 37 42 46 47 46 50 56 68
Central & Eastern Europe 22,413 24,292 19,474 20,934 22,721 23,556 25,004 26,063 27,857 29,878
Source: ZenithOptimedia Advertising Expenditure Forecasts June 2014
2007 2008 2009 2010 2011 2012 2013 2014 2015 2016
Bahrain 94 107 92 96 33 36 38 38 38 38
Egypt 259 440 488 520 314 350 328 359 382 405
Kuwait 311 442 370 386 354 333 325 326 330 331
Lebanon 114 144 150 181 151 136 130 129 128 128
Oman 56 74 59 64 58 55 55 55 54 54
Pan Arab 1,856 2,283 2,032 2,259 2,033 2,148 2,365 2,604 2,738 2,842
Qatar 106 121 103 111 88 79 75 74 73 73
Saudi Arabia 740 809 646 635 596 593 602 609 643 655
UAE 879 1,280 592 629 528 482 493 528 567 613
Middle East & North Africa 4,415 5,700 4,533 4,881 4,155 4,211 4,409 4,722 4,953 5,138
FIPP WORLD MAGAZINE TRENDS 2014/2015:EMEA SPECIAL REPORT 9
NATIONAL ASSOCIATION
» Österreichischer Zeitschriften- und Fachmedien-Verband (ÖZV)
> FIPP MEMBERS
> AT-A-GLANCE
PUBLISHERS
» Verlagsgruppe News
SUPPLIERS
» Sappi Austria
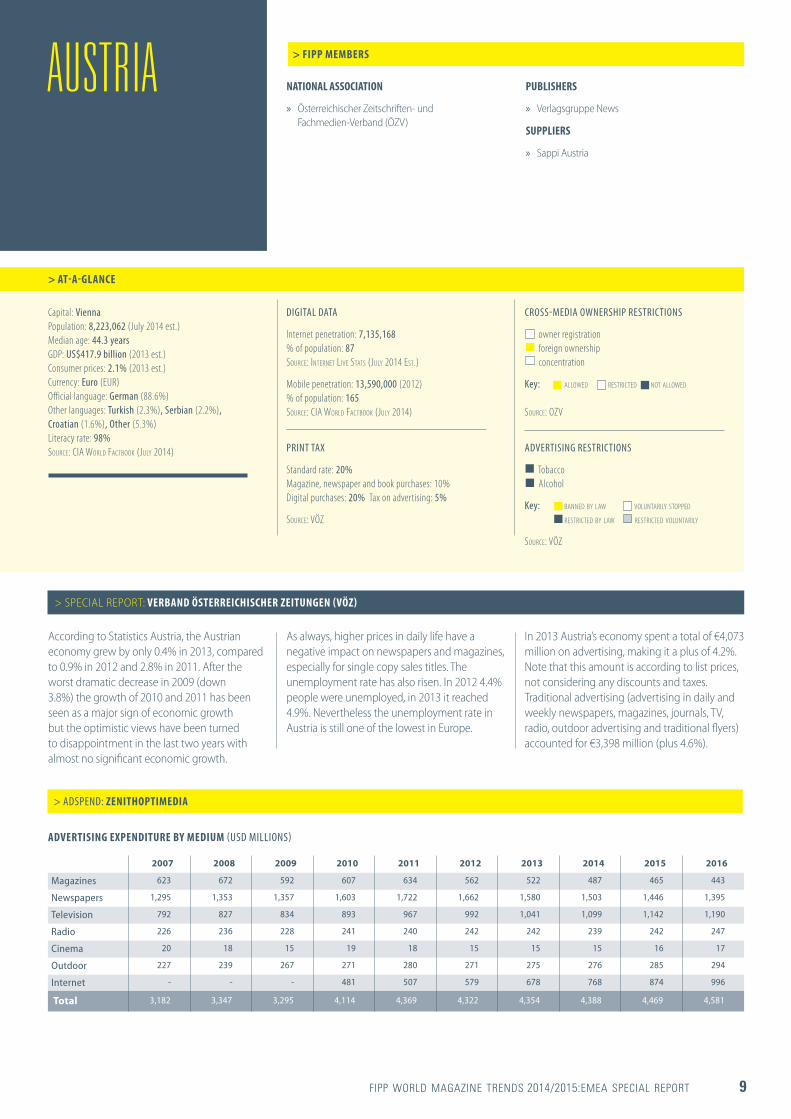
Capital: Vienna Population: 8,223,062 (July 2014 est.) Median age: 44.3 years GDP: US$417.9 billion (2013 est.) Consumer prices: 2.1% (2013 est.) Currency: Euro (EUR) Official language: German (88.6%) Other languages: Turkish (2.3%), Serbian (2.2%), Croatian (1.6%), Other (5.3%) Literacy rate: 98% SOURCE: CIA WORLD FACTBOOK (JULY 2014)
DIGITAL DATA
Internet penetration: 7,135,168 % of population: 87 SOURCE: INTERNET LIVE STATS (JULY 2014 EST.)
Mobile penetration: 13,590,000 (2012) % of population: 165 SOURCE: CIA WORLD FACTBOOK (JULY 2014)
PRINT TAX
Standard rate: 20% Magazine, newspaper and book purchases: 10% Digital purchases: 20% Tax on advertising: 5%
SOURCE: VÖZ
CROSS-MEDIA OWNERSHIP RESTRICTIONS
owner registration foreign ownership concentration
Key: ALLOWED RESTRICTED NOT ALLOWED SOURCE: OZV
ADVERTISING RESTRICTIONS
Tobacco Alcohol
Key: BANNED BY LAW VOLUNTARILY STOPPED RESTRICTED BY LAW RESTRICTED VOLUNTARILY
SOURCE: VÖZ
AUSTRIA
According to Statistics Austria, the Austrian economy grew by only 0.4% in 2013, compared to 0.9% in 2012 and 2.8% in 2011. After the worst dramatic decrease in 2009 (down 3.8%) the growth of 2010 and 2011 has been seen as a major sign of economic growth but the optimistic views have been turned to disappointment in the last two years with almost no significant economic growth.
As always, higher prices in daily life have a negative impact on newspapers and magazines, especially for single copy sales titles. The unemployment rate has also risen. In 2012 4.4% people were unemployed, in 2013 it reached 4.9%. Nevertheless the unemployment rate in Austria is still one of the lowest in Europe.
> SPECIAL REPORT: VERBAND ÖSTERREICHISCHER ZEITUNGEN (VÖZ)
In 2013 Austria’s economy spent a total of €4,073 million on advertising, making it a plus of 4.2%. Note that this amount is according to list prices, not considering any discounts and taxes. Traditional advertising (advertising in daily and weekly newspapers, magazines, journals, TV, radio, outdoor advertising and traditional flyers) accounted for €3,398 million (plus 4.6%).
> ADSPEND: ZENITHOPTIMEDIA
ADVERTISING EXPENDITURE BY MEDIUM (USD MILLIONS)
2007 2008 2009 2010 2011 2012 2013 2014 2015 2016
Magazines 623 672 592 607 634 562 522 487 465 443
Newspapers 1,295 1,353 1,357 1,603 1,722 1,662 1,580 1,503 1,446 1,395
Television 792 827 834 893 967 992 1,041 1,099 1,142 1,190
Radio 226 236 228 241 240 242 242 239 242 247
Cinema 20 18 15 19 18 15 15 15 16 17
Outdoor 227 239 267 271 280 271 275 276 285 294
Internet - - - 481 507 579 678 768 874 996
Total 3,182 3,347 3,295 4,114 4,369 4,322 4,354 4,388 4,469 4,581
10 FIPP WORLD MAGAZINE TRENDS 2014/2015: EMEA SPECIAL REPORT
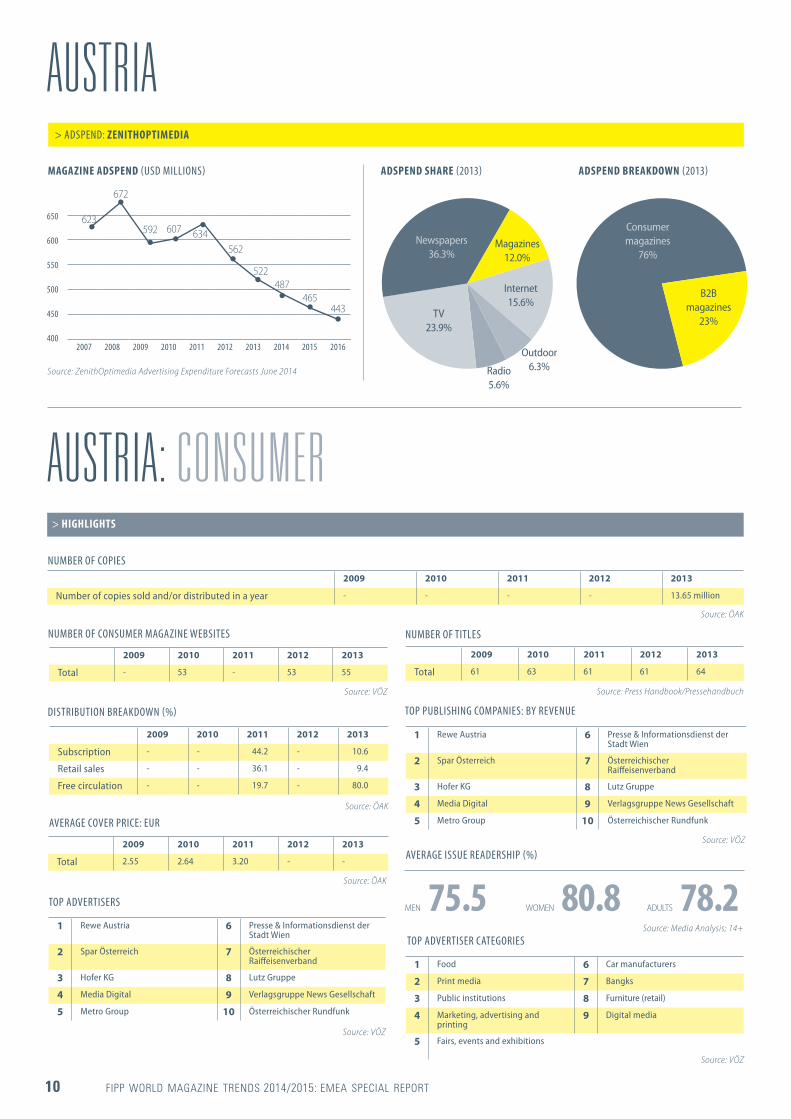
AUSTRIA
AUSTRIA: CONSUMER
MAGAZINE ADSPEND (USD MILLIONS) ADSPEND SHARE (2013) ADSPEND BREAKDOWN (2013)
NUMBER OF COPIES
DISTRIBUTION BREAKDOWN (%)
NUMBER OF TITLES
2009 2010 2011 2012 2013
Number of copies sold and/or distributed in a year - - - - 13.65 million
> HIGHLIGHTS
2009 2010 2011 2012 2013
Total 61 63 61 61 64
2009 2010 2011 2012 2013
Subscription - - 44.2 - 10.6
Retail sales - - 36.1 - 9.4
Free circulation - - 19.7 - 80.0
2007 2008 2009 2010 2011 2012 2013 2014 2015 2016
650
600
550
500
450
400
623
562
672
522
592
487
607
465
634
443
Source: ZenithOptimedia Advertising Expenditure Forecasts June 2014
Source: ÖAK
Source: Press Handbook/Pressehandbuch
AVERAGE COVER PRICE: EUR
2009 2010 2011 2012 2013
Total 2.55 2.64 3.20 - -
Source: ÖAK
Source: ÖAK
Magazines 12.0%
Outdoor 6.3%
Newspapers 36.3%
Radio 5.6%
Internet 15.6%
TV 23.9%
> ADSPEND: ZENITHOPTIMEDIA
NUMBER OF CONSUMER MAGAZINE WEBSITES
2009 2010 2011 2012 2013
Total - 53 - 53 55
Source: VÖZ
TOP PUBLISHING COMPANIES: BY REVENUE
1 Rewe Austria 6 Presse & Informationsdienst der Stadt Wien
2 Spar Österreich 7 Österreichischer Raiffeisenverband
3 Hofer KG 8 Lutz Gruppe
4 Media Digital 9 Verlagsgruppe News Gesellschaft
5 Metro Group 10 Österreichischer Rundfunk
Source: VÖZ
TOP ADVERTISERS
TOP ADVERTISER CATEGORIES1 Rewe Austria 6 Presse & Informationsdienst der
Stadt Wien
2 Spar Österreich 7 Österreichischer Raiffeisenverband
3 Hofer KG 8 Lutz Gruppe
4 Media Digital 9 Verlagsgruppe News Gesellschaft
5 Metro Group 10 Österreichischer Rundfunk
1 Food 6 Car manufacturers
2 Print media 7 Bangks
3 Public institutions 8 Furniture (retail)
4 Marketing, advertising and printing
9 Digital media
5 Fairs, events and exhibitionsSource: VÖZ
Source: VÖZ
Consumer magazines
76%
B2B magazines
23%
AVERAGE ISSUE READERSHIP (%)
MEN 75.5 WOMEN 80.8 ADULTS 78.2Source: Media Analysis; 14+

FIPP WORLD MAGAZINE TRENDS 2014/2015:EMEA SPECIAL REPORT 11
AUSTRIA: B2BNUMBER OF COPIES
NUMBER OF PUBLISHERS
AVERAGE COVER PRICE: EURNUMBER OF B2B MAGAZINE WEBSITES
NUMBER OF TITLES
2009 2010 2011 2012 2013
Number of copies sold and/or distributed in a year 722 million 700 million 690 million - -
2009 2010 2011 2012 2013
Total 410 400 390 380 -
> HIGHLIGHTS
2009 2010 2011 2012 2013
Total 2,790 2,800 2,756 2,700 -
2009 2010 2011 2012 2013
Total 4.80 4.90 4.90 - -2009 2010 2011 2012 2013
Total - 2,600 2,650 - -
Source: PresseHandBuch
Source: PresseHandBuch
Source: estimated ÖZVSource: PresseHandBuch
REVENUE SOURCE (%)
2009 2010 2011 2012 2013
Print ads 64 60 58 - -
Digital revenues 4 6 10 - -
Copy sales 23 24 20 - -
Exhibitions and events
9 10 12 - -
Source: PresseHandBuch
Source: PresseHandBuch

12 FIPP WORLD MAGAZINE TRENDS 2014/2015: EMEA SPECIAL REPORT
NATIONAL ASSOCIATION
» European Magazine Media Association (EMMA))
PUBLISHERS
» The Ppress » Sanoma Media Belgium » Sanoma Regional Belgium NV
> FIPP MEMBERS
> AT-A-GLANCE
SUPPLIERS
» Sappi » Sappi Europe SA » Sappi Lanaken NV
Capital: Brussels Population: 10,449,361(July 2014 est.) Median age: 43.1 years GDP: US$507.4 billion (2013 est.) Consumer prices: 1.3% (2013 est.) Currency: Euro (EUR) Official language: Dutch (60%), French (40%) Literacy rate: 99% SOURCE: CIA WORLD FACTBOOK (JULY 2014)
DIGITAL DATA
Internet penetration: 9,441,116 % of population: 90 SOURCE: INTERNET LIVE STATS (JULY 2014 ESTIMATE)
Mobile penetration: 12,880,000 (2012) % of population: 123 SOURCE: CIA WORLD FACTBOOK (JULY 2014)
ADVERTISING RESTRICTIONS
Tobacco Alcohol Advertising to children Over-the-counter drugs
Key: BANNED BY LAW VOLUNTARILY STOPPED RESTRICTED BY LAW RESTRICTED VOLUNTARILY
SOURCE: THE PPRESS
PRINT TAX
Standard rate: 21% Magazine purchases*: 0% Newspaper purchases: 0% Book purchases: 6% Digital purchases: 21% Tax on advertising: 21%
SOURCE: THE PPRESS; *0% FOR WEEKLIES, 6% FOR OTHER PERIODICALS
CROSS-MEDIA OWNERSHIP RESTRICTIONS
owner registration foreign ownership cross-media ownership concentration
Key: ALLOWED RESTRICTED NOT ALLOWED SOURCE: THE PPRESS
BELGIUM
The situation for magazines has not changed much in 2013 and in the first half of 2014. The publishers continue their transition from print media to multimedia brand platforms with some smaller special interest titles making the shift to digital-only publications. Digital reading via websites, PDFs and apps is evolving slowly as tablet and smartphone possession is still relatively low compared to other Western European countries.
Paid circulation of printed magazines continues to decline at a steady pace, mainly due to the ongoing economic downturn, and digital ad sales still cannot fully compensate for this loss.
Magazine reading is also slowly going down (from 87.5% in 2012 to 85.1% in 2013). Total adspend stabilised in 2013 and the share of (printed) magazines fluctuates between 6 and 7%.
> SPECIAL REPORT: THE PPRESS
Sanoma, one of the major European publishing houses, announced the sale of some or all of their Belgian activities which might result in big changes in the magazine media landscape by the end of 2014.
> ADSPEND: ZENITHOPTIMEDIA
ADVERTISING EXPENDITURE BY MEDIUM (USD MILLIONS)
2007 2008 2009 2010 2011 2012 2013 2014 2015 2016
Magazines 399 398 374 394 364 349 343 338 333 327
Newspapers 1,197 1,178 1,172 1,207 1,198 1,179 1,231 1,244 1,262 1,294
Television 1,542 1,600 1,656 1,878 1,931 1,921 1,939 1,991 2,057 2,129
Radio 499 501 475 530 591 619 644 682 730 767
Cinema 35 36 33 34 41 44 50 53 56 59
Outdoor 317 331 330 337 390 416 417 446 457 471
Internet 146 165 180 224 251 267 291 349 409 470
Total 4,135 4,210 4,219 4,605 4,766 4,794 4,914 5,102 5,304 5,515

FIPP WORLD MAGAZINE TRENDS 2014/2015:EMEA SPECIAL REPORT 13
BELGIUM: CONSUMER
NUMBER OF COPIES
DISTRIBUTION BREAKDOWN (%)
NUMBER OF TITLES
2009 2010 2011 2012 2013
Number of copies sold in a year - - - 196 million 184 million
> HIGHLIGHTS
2009 2010 2011 2012 2013
Total - - 411 - -
2009 2010 2011 2012 2013
Subscription - 69.3 68.3 - -
Retail sales - 24.1 25.1 - -
Free circulation - 6.6 6.6 - -
Source: The Ppress; (copies sold)
Source: The Ppress
AVERAGE COVER PRICE: EUR
2009 2010 2011 2012 2013
Total 3.61 3.51 3.62 - 3.36
Source: The Ppress (Febelmag only)
Source: The Ppress
NUMBER OF WEBSITES
NUMBER OF PUBLISHERS
2009 2010 2011 2012 2013
Total - 60 - - -
2009 2010 2011 2012 2013
Total - - 45 - -
Source: The Ppress
Source: The Ppress
TOP PUBLISHING COMPANIES: BY REVENUE
1 Sanoma Belgium 6 Cine Revue
2 Roularta Media Group 7 De Vrije Pers
3 Persgroep Publishing 8 Belgomedia
4 Le Vif 9 Cascade
5 HumoNV 10 Produpress
Source: The Ppress
TOP ADVERTISERS
TOP ADVERTISER CATEGORIES
1 Procter & Gamble 6 Reckitt & Benckiser
2 Unilever 7 L'Oréal Group
3 D'Ieteren 8 Belgacom Group
4 PSA Peugeot Citroen 9 Colruyt Group
5 Coca-Cola Belgium 10 Lidl & Co
1 Culture, leisure, tourism and sports
6 Beauty and hygiene
2 Distribution 7 Telecom
3 Food 8 House and office equipment
4 Services 9 Clothes and accessories
5 Transport 10 House and office maintenance
Source: ONMEDIA/Nielsen
Source: ONMEDIA/Nielsen
AVERAGE ISSUE READERSHIP (%)
MEN 81.2 WOMEN 88.8 ADULTS 85.1 Source: CIM Study 2013 (2); Reference period: 01-12-2012/30-11-2013; 12+
> ADSPEND: ZENITHOPTIMEDIA
MAGAZINE ADSPEND (USD MILLIONS) ADSPEND SHARE (2013)
2007 2008 2009 2010 2011 2012 2013 2014 2015 2016
400
380
360
340
320
300
399
349
398
343
374
338
394
333327
364
Source: ZenithOptimedia Advertising Expenditure Forecasts June 2014
Magazines 7.0%
Cinema 1.0%
Newspapers 25.1%
Radio 13.1%
Outdoor 8.5%
Internet 5.9% TV 39.5%
14 FIPP WORLD MAGAZINE TRENDS 2014/2015: EMEA SPECIAL REPORT
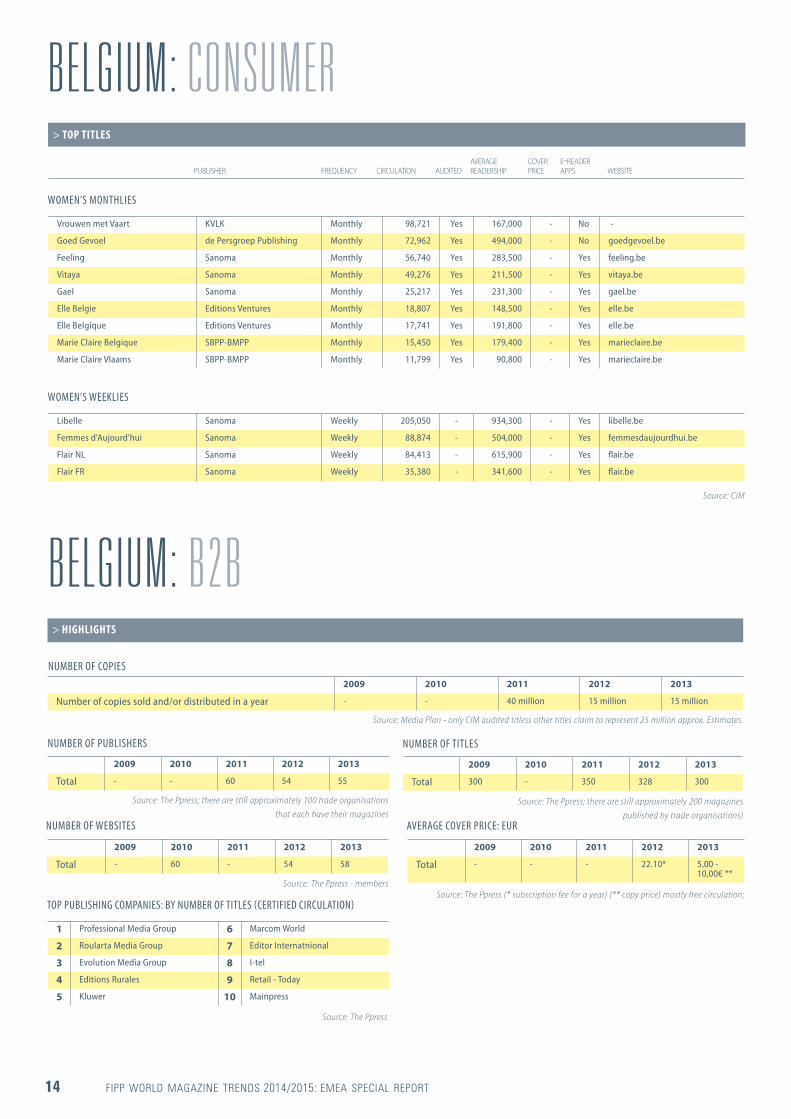
BELGIUM: CONSUMER> TOP TITLES
PUBLISHERAVERAGE READERSHIP
COVER PRICE
E-READER APPSCIRCULATIONFREQUENCY AUDITED WEBSITE
BELGIUM: B2BNUMBER OF COPIES
NUMBER OF PUBLISHERS
AVERAGE COVER PRICE: EURNUMBER OF WEBSITES
NUMBER OF TITLES
2009 2010 2011 2012 2013
Number of copies sold and/or distributed in a year - - 40 million 15 million 15 million
2009 2010 2011 2012 2013
Total - - 60 54 55
> HIGHLIGHTS
2009 2010 2011 2012 2013
Total 300 - 350 328 300
2009 2010 2011 2012 2013
Total - - - 22.10* 5,00 - 10,00€ **
2009 2010 2011 2012 2013
Total - 60 - 54 58
Source: Media Plan - only CIM audited titless other titles claim to represent 25 million approx. Estimates.
Source: The Ppress; there are still approximately 200 magazines published by trade organisations)
Source: The Ppress (* subscription fee for a year) (** copy price) mostly free circulation; Source: The Ppress - members
Source: The Ppress; there are still approximately 100 trade organisations that each have their magazines
WOMEN’S MONTHLIES
WOMEN’S WEEKLIES
Vrouwen met Vaart KVLK Monthly 98,721 Yes 167,000 - No -
Goed Gevoel de Persgroep Publishing Monthly 72,962 Yes 494,000 - No goedgevoel.be
Feeling Sanoma Monthly 56,740 Yes 283,500 - Yes feeling.be
Vitaya Sanoma Monthly 49,276 Yes 211,500 - Yes vitaya.be
Gael Sanoma Monthly 25,217 Yes 231,300 - Yes gael.be
Elle Belgie Editions Ventures Monthly 18,807 Yes 148,500 - Yes elle.be
Elle Belgique Editions Ventures Monthly 17,741 Yes 191,800 - Yes elle.be
Marie Claire Belgique SBPP-BMPP Monthly 15,450 Yes 179,400 - Yes marieclaire.be
Marie Claire Vlaams SBPP-BMPP Monthly 11,799 Yes 90,800 - Yes marieclaire.be
Libelle Sanoma Weekly 205,050 - 934,300 - Yes libelle.be
Femmes d'Aujourd'hui Sanoma Weekly 88,874 - 504,000 - Yes femmesdaujourdhui.be
Flair NL Sanoma Weekly 84,413 - 615,900 - Yes flair.be
Flair FR Sanoma Weekly 35,380 - 341,600 - Yes flair.be
Source: CIM
TOP PUBLISHING COMPANIES: BY NUMBER OF TITLES (CERTIFIED CIRCULATION)
1 Professional Media Group 6 Marcom World
2 Roularta Media Group 7 Editor Internatnional
3 Evolution Media Group 8 I-tel
4 Editions Rurales 9 Retail - Today
5 Kluwer 10 Mainpress
Source: The Ppress
FIPP WORLD MAGAZINE TRENDS 2014/2015:EMEA SPECIAL REPORT 15
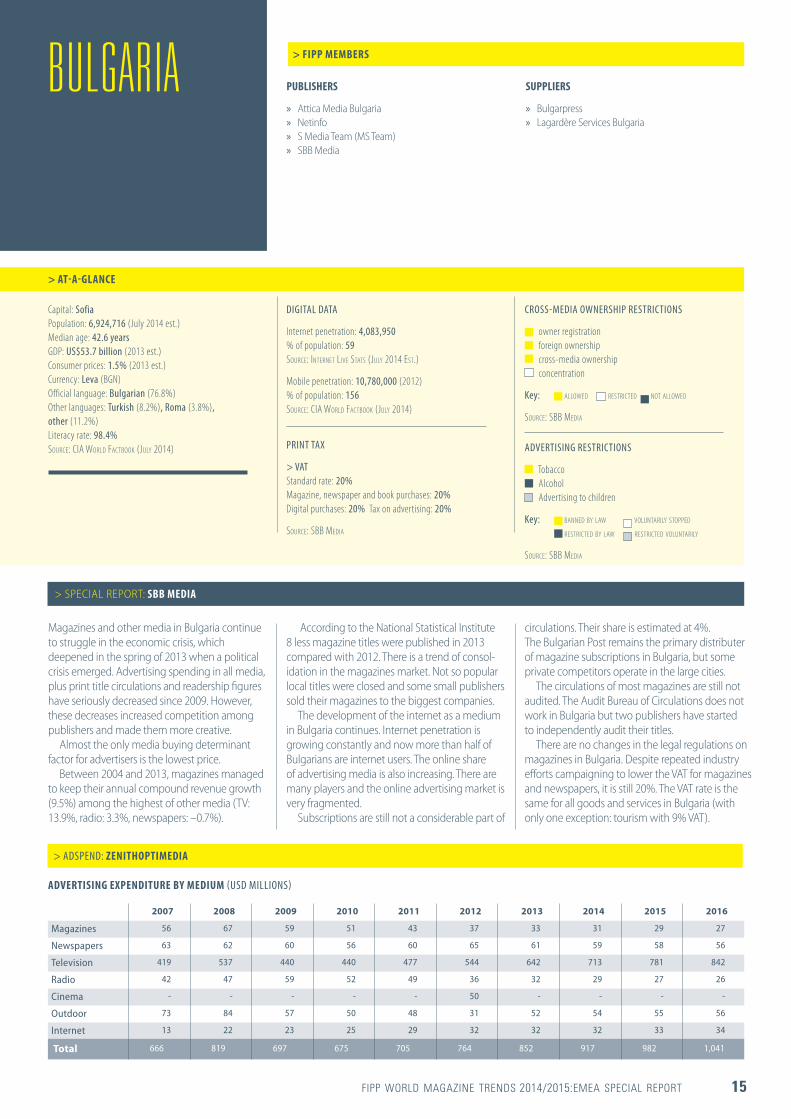
PUBLISHERS
» Attica Media Bulgaria » Netinfo » S Media Team (MS Team) » SBB Media
> FIPP MEMBERS
> AT-A-GLANCE
SUPPLIERS
» Bulgarpress » Lagardère Services Bulgaria
Capital: Sofia Population: 6,924,716 (July 2014 est.) Median age: 42.6 years GDP: US$53.7 billion (2013 est.) Consumer prices: 1.5% (2013 est.) Currency: Leva (BGN) Official language: Bulgarian (76.8%) Other languages: Turkish (8.2%), Roma (3.8%), other (11.2%) Literacy rate: 98.4% SOURCE: CIA WORLD FACTBOOK (JULY 2014)
DIGITAL DATA
Internet penetration: 4,083,950 % of population: 59 SOURCE: INTERNET LIVE STATS (JULY 2014 EST.)
Mobile penetration: 10,780,000 (2012) % of population: 156 SOURCE: CIA WORLD FACTBOOK (JULY 2014)
PRINT TAX
> VAT Standard rate: 20% Magazine, newspaper and book purchases: 20% Digital purchases: 20% Tax on advertising: 20%
SOURCE: SBB MEDIA
CROSS-MEDIA OWNERSHIP RESTRICTIONS
owner registration foreign ownership cross-media ownership concentration
Key: ALLOWED RESTRICTED NOT ALLOWED
SOURCE: SBB MEDIA
ADVERTISING RESTRICTIONS
Tobacco Alcohol Advertising to children
Key: BANNED BY LAW VOLUNTARILY STOPPED RESTRICTED BY LAW RESTRICTED VOLUNTARILY
SOURCE: SBB MEDIA
BULGARIA
Magazines and other media in Bulgaria continue to struggle in the economic crisis, which deepened in the spring of 2013 when a political crisis emerged. Advertising spending in all media, plus print title circulations and readership figures have seriously decreased since 2009. However, these decreases increased competition among publishers and made them more creative.
Almost the only media buying determinant factor for advertisers is the lowest price.
Between 2004 and 2013, magazines managed to keep their annual compound revenue growth (9.5%) among the highest of other media (TV: 13.9%, radio: 3.3%, newspapers: –0.7%).
According to the National Statistical Institute 8 less magazine titles were published in 2013 compared with 2012. There is a trend of consol-idation in the magazines market. Not so popular local titles were closed and some small publishers sold their magazines to the biggest companies.
The development of the internet as a medium in Bulgaria continues. Internet penetration is growing constantly and now more than half of Bulgarians are internet users. The online share of advertising media is also increasing. There are many players and the online advertising market is very fragmented.
Subscriptions are still not a considerable part of
> SPECIAL REPORT: SBB MEDIA
circulations. Their share is estimated at 4%. The Bulgarian Post remains the primary distributer of magazine subscriptions in Bulgaria, but some private competitors operate in the large cities.
The circulations of most magazines are still not audited. The Audit Bureau of Circulations does not work in Bulgaria but two publishers have started to independently audit their titles.
There are no changes in the legal regulations on magazines in Bulgaria. Despite repeated industry efforts campaigning to lower the VAT for magazines and newspapers, it is still 20%. The VAT rate is the same for all goods and services in Bulgaria (with only one exception: tourism with 9% VAT).
> ADSPEND: ZENITHOPTIMEDIA
ADVERTISING EXPENDITURE BY MEDIUM (USD MILLIONS)
2007 2008 2009 2010 2011 2012 2013 2014 2015 2016
Magazines 56 67 59 51 43 37 33 31 29 27
Newspapers 63 62 60 56 60 65 61 59 58 56
Television 419 537 440 440 477 544 642 713 781 842
Radio 42 47 59 52 49 36 32 29 27 26
Cinema - - - - - 50 - - - -
Outdoor 73 84 57 50 48 31 52 54 55 56
Internet 13 22 23 25 29 32 32 32 33 34
Total 666 819 697 675 705 764 852 917 982 1,041

16 FIPP WORLD MAGAZINE TRENDS 2014/2015: EMEA SPECIAL REPORT
2007 2008 2009 2010 2011 2012 2013 2014 2015 2016
BULGARIA
BULGARIA: CONSUMER> HIGHLIGHTS
70
60
50
40
30
20
NUMBER OF TITLES
2009 2010 2011 2012 2013
Total 603 563 559 517 509
Source: National Statistical Institute
AVERAGE COVER PRICE: BGN
2009 2010 2011 2012 2013
Weeklies - 1.50 1.40 1.77 1.70
Monthlies - 5.00 5.00 5.00 5.00
Source: SBB Media Estimate
DISTRIBUTION BREAKDOWN (%)
2009 2010 2011 2012 2013
Subscription 3 3.5 3.5 3.5 4
Retail sales 97 96.5 96.5 96.5 96
Free circulation - - - - -
Source: SBB Media Estimate
Source: Be Media Consultant; total revenue Jan-Dec 2013
RETAIL OUTLETS
2009 2010 2011 2012 2013
Kiosk/newsstand 10,000* 10,000* 10,000* 10,000* 10,000*
Source: SBB Media Estimate; *estimates
> ADSPEND: ZENITHOPTIMEDIA
TOP PUBLISHING COMPANIES: BY REVENUE
1 SBB Media 6 MIT Press
2 S Media Team 7 Balkan Media Group
3 Attica Media Bulgaria 8 Programata Media Group
4 QM 9 Newspaper Group Bulgaria (WAZ)
5 Agency Eva 10 Economedia
TOP ADVERTISERS
1 L'Oréal 6 Giulian
2 Sarantis Bulgaria 7 Notos-Bulgaria
3 Procter & Gamble 8 National Distributors
4 Cosmetic Plus 9 Hennes & Mauritz
5 Cosmo Bulgaria Mobile 10 IND Commerce
Source: Be Media Consultant Jan-Dec 2013, excluding media, charity, advertising and research agencies
TOP ADVERTISER CATEGORIES
1 Cosmetics 6 Pharmacy
2 Fashion 7 Drinks
3 Cars and fuel 8 Tourism
4 Telecommunications 9 Audiovisual industry
5 Retail shops 10 Financial services
Source: Be Media Consultant Jan-Dec 2013, excluding media, charity, advertising and research agencies
MAGAZINE ADSPEND (USD MILLIONS) ADSPEND SHARE (2013) ADSPEND BREAKDOWN (2013)
56
37
67
33
59
31
51
29
43
27
Source: ZenithOptimedia Advertising Expenditure Forecasts June 2014 Magazines 4.0%
Newspapers 7.0%
Outdoor 6.0%
Cinema 0%
Newspapers 7%
Radio 4.0%
Internet 4.0%
TV 75.0%
Consumer magazines
91.7%
B2B magazines
8.3%
AVERAGE ISSUE READERSHIP (%)
Source: Nationally, 15-54 y.o., GARB Audience, Sept-Oct 2013
MEN 26.4 WOMEN 33.0 ADULTS 59.4

FIPP WORLD MAGAZINE TRENDS 2014/2015:EMEA SPECIAL REPORT 17
Magazine trendsOverall trends of the Czech Republic in 2013 and in the first half of 2014, show both positive and negative developments. According to the data sources, in 2013 the number of consumer magazines published in the Czech Republic grew by 8.5%, mainly due to the growth in the number of free and local titles having increased by as much as 21.6%. The number of paid magazine titles, on the other hand, dropped by 7%. The total of sold magazines, which are included in the ABC CR print verification audit also decreased by 8.7%.
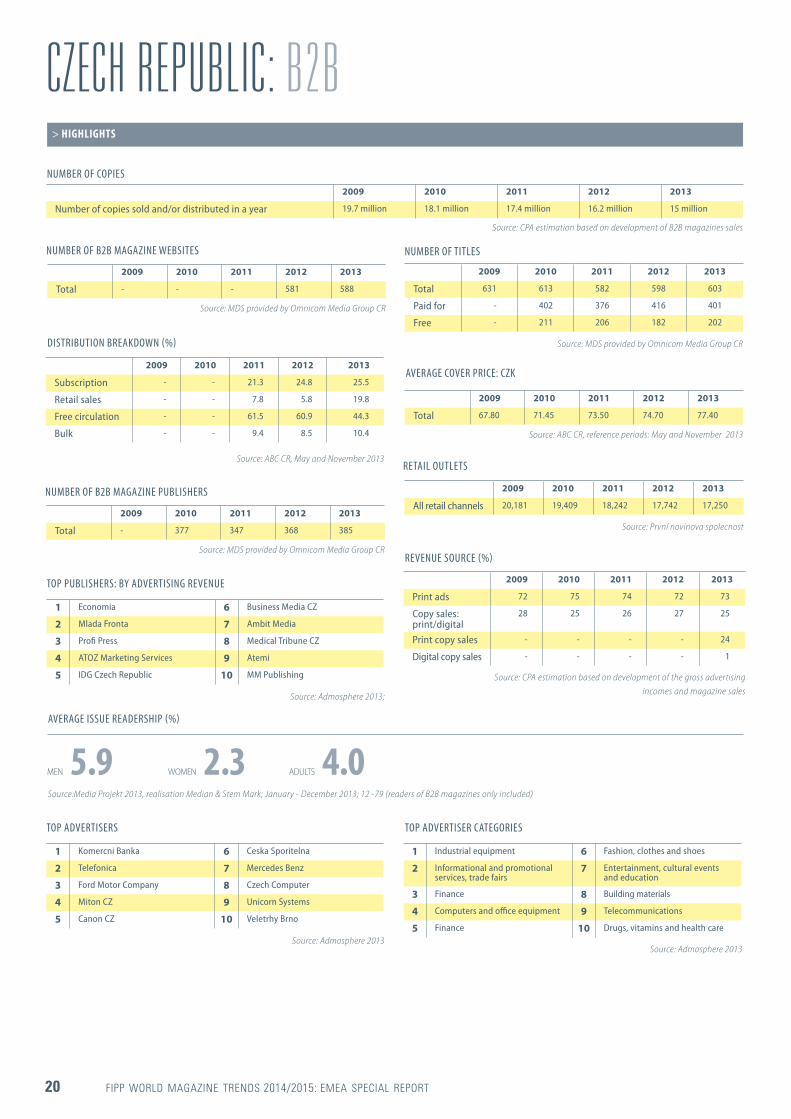
In B2B magazines, the total number of titles rose by only 0.8% and the number of paid titles dropped by 3.6%. Single copy B2B sales dropped by 7.4% according to the audited sample. Which means that the year-on-year comparison for B2B showed better results than consumer magazines for the first time in many years.
An equally important factor for magazines is their readership. And in the Czech media market it is basically the most significant factor of magazine performance, as readership is the basis for media agencies’ adspend planning. In 2013, compared to the previous year, the readership of entertainment and crossword/ quiz titles was up 27.7%, automotive magazines were up 10.8%, magazines for children and teenagers were up 8.5%, cookery magazines were up 4.8%, and living and interior culture titles were up 3.1%.
On the other hand the readership of sports titles, healthcare and health lifestyle magazines, business and finance titles and ITC magazines and women’s magazines dropped. In the first half of 2014, the readership of solely economic magazines and TV guides grew against the average in 2013. As the data of a very limited title sample proves, the decline in readership has probably affected the B2B magazines group, with an overall drop of at least 10%.
Gross advertising incomes for magazines in 2013 were almost on the same level as in 2012 (down 0.9%), and the preliminary results in the first half of 2014 indicate that the same development may be anticipated in the annual comparison of 2014/2013.
Future prospectsExperts expect that the current magazine positioning in the media market will be maintained in the upcoming period, since it is a reflection of the overall global development. It can naturally be expected that readers will continue dividing their attention between print and other media and the trend for increasing consumption of content on digital and mobile devices will continue. On the other hand, publishers managed to take some steps to offer more digital content.
The development of the magazine market definitely goes hand in hand with the overall economic development, which shows better results in 2014 than in the previous year. The VAT situation for print sales is an important issue for publishers’ activities (see below).
Adapting to new digital opportunitiesIn 2013 and 2014, the trend of widening the offer for providing magazine content via mobile reading devices continued, particularly in formats supporting Android and iOS. The offer of providing digital content by domestic providers has spread, usually concerning printed magazines converted to digital format. The current offer represents all main magazine titles and a vast specter of special interest titles.
Publishers also use a range of digital applications, for example food and drink titles offer magazine content with online recipe archives and shopping lists for smartphones.
Launches/closuresIn 2013 the sector of TV magazines increased in number. However the total launches of new titles in the last two years dropped. Publishers have focused new title launches in the broad market segments such as society and entertainment, including Čas pro hvězdy (Time for Stars).
A number of new titles have recently been launched but ceased publishing due to market competition. However several digital projects have appeared, which have more in common with news and celebrity magazines than with mainstream news media. For example, Echo24 and Dotyk (Touch), which won the Czech
NATIONAL ASSOCIATION » Czech Publishers Association (Unie vydavatelu)
PUBLISHERS » Bauer Media v.o.s. » Burda Media 2000 » Burda Praha / Burda Media 2000 » IDG Czech Republic » MM Prumyslove Spektrum » Motor-Presse Bohemia
> FIPP MEMBERS
> AT-A-GLANCE
» Ringier Axel Springer CZ » Sanoma Media Praha
SUPPLIERS » CZ PRESS » HDS Retail Czech Republic
Capital: Prague Population: 10,627,448 (July 2014 est) Median age: 40.9 years GDP: US$194.8 billion (2013 est.) Consumer prices: 1.4% (2013 est.) Currency: Koruna (CZK) Official language: Czech (95.4%), Slovak (1.6%) Literacy rate: 99% SOURCE: CIA WORLD FACTBOOK (JULY 2014)
DIGITAL DATA
Internet penetration: 8,322,168 % of population: 78% SOURCE: INTERNET LIVE STATS (JULY 2014 EST.) Mobile penetration: 12,973,000 (2012) % of population: 122 SOURCE: CIA WORLD FACTBOOK (JULY 2014)
PRINT TAX
Standard rate: 21% Magazine, newspaper and book* purchases: 15% Digital purchases: 21% Tax on advertising: 21%
SOURCE: MINISTRY OF FINANCE; * DECREASE ON 10 % PROPOSED
CROSS-MEDIA OWNERSHIP RESTRICTIONS
owner registration foreign ownership cross-media ownership* concentration**
Key: ALLOWED RESTRICTED NOT ALLOWED
SOURCE: CZECH PRESS ACT, RADIO AND TV BROADCASTING ACT; * NO REGISTRATION OF THE OWNERS; ** UNDER 40 %
ADVERTISING RESTRICTIONS
Tobacco Alcohol Advertising to children Over-the-counter drugs Guns/ammunition
Key: BANNED BY LAW VOLUNTARILY STOPPED RESTRICTED BY LAW RESTRICTED VOLUNTARILY
SOURCE: CZECH ADVERTISING REGULATION ACT 40/1995
CZECH REPUBLIC
> SPECIAL REPORT: CZECH PUBLISHERS ASSOCIATION (UNIE VYDAVATELU)
18 FIPP WORLD MAGAZINE TRENDS 2014/2015: EMEA SPECIAL REPORT
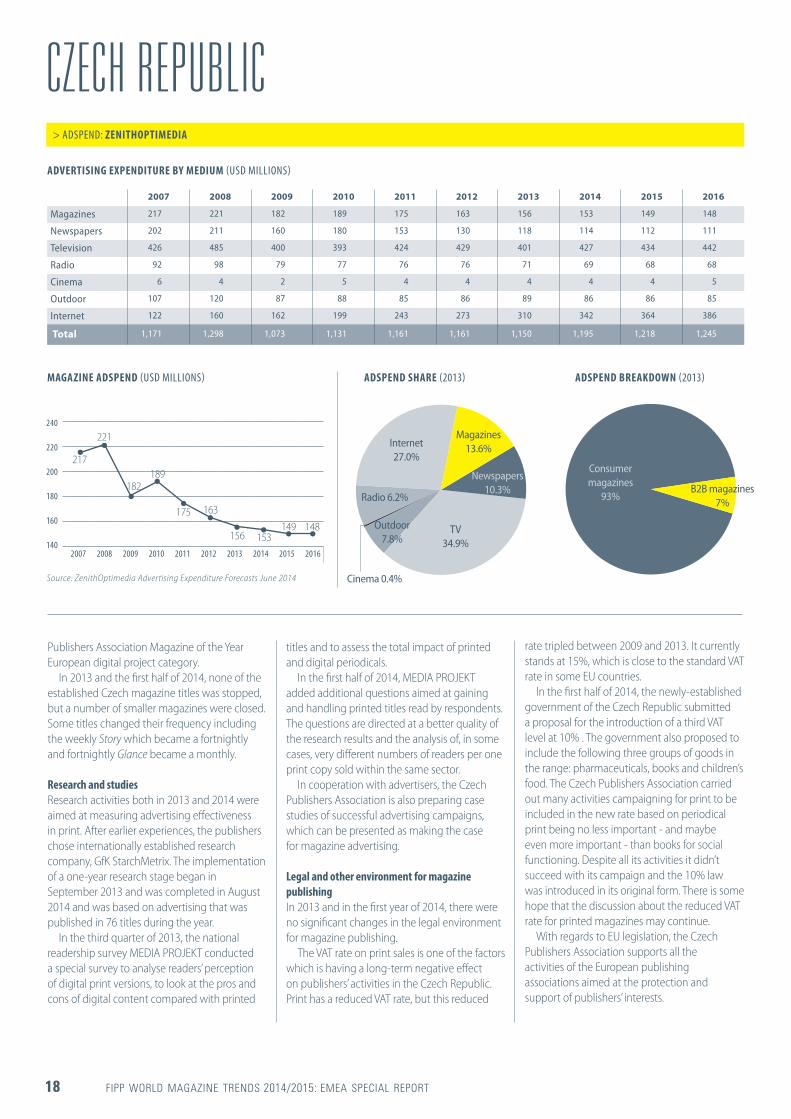
CZECH REPUBLIC> ADSPEND: ZENITHOPTIMEDIA
ADVERTISING EXPENDITURE BY MEDIUM (USD MILLIONS)
MAGAZINE ADSPEND (USD MILLIONS) ADSPEND SHARE (2013) ADSPEND BREAKDOWN (2013)
2007 2008 2009 2010 2011 2012 2013 2014 2015 2016
Magazines 217 221 182 189 175 163 156 153 149 148
Newspapers 202 211 160 180 153 130 118 114 112 111
Television 426 485 400 393 424 429 401 427 434 442
Radio 92 98 79 77 76 76 71 69 68 68
Cinema 6 4 2 5 4 4 4 4 4 5
Outdoor 107 120 87 88 85 86 89 86 86 85
Internet 122 160 162 199 243 273 310 342 364 386
Total 1,171 1,298 1,073 1,131 1,161 1,161 1,150 1,195 1,218 1,245
2007 2008 2009 2010 2011 2012 2013 2014 2015 2016
240
220
200
180
160
140
217
163
221
156
182
153
189
149175
148
Source: ZenithOptimedia Advertising Expenditure Forecasts June 2014
Magazines 13.6%
Cinema 0.4%
Newspapers 10.3%
Radio 6.2%
Outdoor 7.8%
Internet 27.0%
TV 34.9%
Consumer magazines
93%B2B magazines
7%
Publishers Association Magazine of the Year European digital project category.
In 2013 and the first half of 2014, none of the established Czech magazine titles was stopped, but a number of smaller magazines were closed. Some titles changed their frequency including the weekly Story which became a fortnightly and fortnightly Glance became a monthly.
Research and studiesResearch activities both in 2013 and 2014 were aimed at measuring advertising effectiveness in print. After earlier experiences, the publishers chose internationally established research company, GfK StarchMetrix. The implementation of a one-year research stage began in September 2013 and was completed in August 2014 and was based on advertising that was published in 76 titles during the year.
In the third quarter of 2013, the national readership survey MEDIA PROJEKT conducted a special survey to analyse readers’ perception of digital print versions, to look at the pros and cons of digital content compared with printed
titles and to assess the total impact of printed and digital periodicals.
In the first half of 2014, MEDIA PROJEKT added additional questions aimed at gaining and handling printed titles read by respondents. The questions are directed at a better quality of the research results and the analysis of, in some cases, very different numbers of readers per one print copy sold within the same sector.
In cooperation with advertisers, the Czech Publishers Association is also preparing case studies of successful advertising campaigns, which can be presented as making the case for magazine advertising.
Legal and other environment for magazine publishing In 2013 and in the first year of 2014, there were no significant changes in the legal environment for magazine publishing.
The VAT rate on print sales is one of the factors which is having a long-term negative effect on publishers’ activities in the Czech Republic. Print has a reduced VAT rate, but this reduced
rate tripled between 2009 and 2013. It currently stands at 15%, which is close to the standard VAT rate in some EU countries.
In the first half of 2014, the newly-established government of the Czech Republic submitted a proposal for the introduction of a third VAT level at 10% . The government also proposed to include the following three groups of goods in the range: pharmaceuticals, books and children’s food. The Czech Publishers Association carried out many activities campaigning for print to be included in the new rate based on periodical print being no less important - and maybe even more important - than books for social functioning. Despite all its activities it didn’t succeed with its campaign and the 10% law was introduced in its original form. There is some hope that the discussion about the reduced VAT rate for printed magazines may continue.
With regards to EU legislation, the Czech Publishers Association supports all the activities of the European publishing associations aimed at the protection and support of publishers’ interests.
FIPP WORLD MAGAZINE TRENDS 2014/2015:EMEA SPECIAL REPORT 19
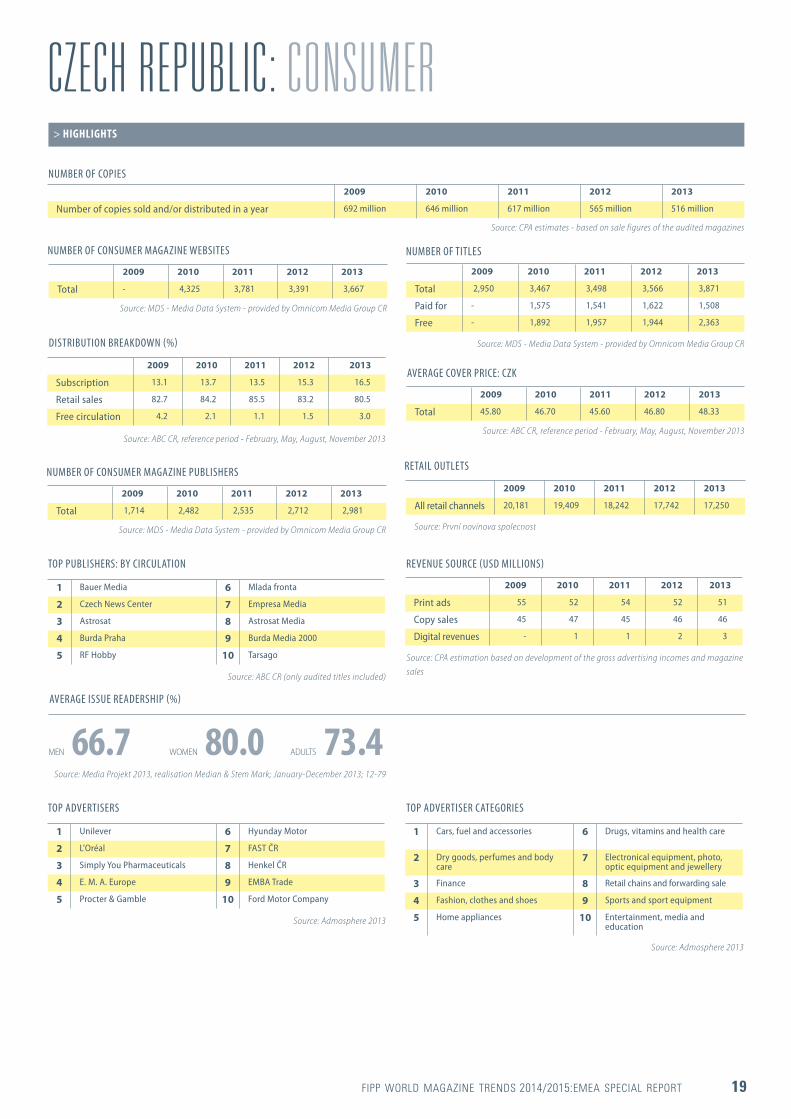
CZECH REPUBLIC: CONSUMER
DISTRIBUTION BREAKDOWN (%)
2009 2010 2011 2012 2013
Subscription 13.1 13.7 13.5 15.3 16.5
Retail sales 82.7 84.2 85.5 83.2 80.5
Free circulation 4.2 2.1 1.1 1.5 3.0
Source: ABC CR, reference period - February, May, August, November 2013
NUMBER OF COPIES
AVERAGE COVER PRICE: CZK
NUMBER OF TITLES
2009 2010 2011 2012 2013
Number of copies sold and/or distributed in a year 692 million 646 million 617 million 565 million 516 million
2009 2010 2011 2012 2013
Total 2,950 3,467 3,498 3,566 3,871
Paid for - 1,575 1,541 1,622 1,508
Free - 1,892 1,957 1,944 2,363
2009 2010 2011 2012 2013
Total 45.80 46.70 45.60 46.80 48.33
Source: CPA estimates - based on sale figures of the audited magazines
Source: MDS - Media Data System - provided by Omnicom Media Group CR
Source: ABC CR, reference period - February, May, August, November 2013
TOP ADVERTISERS
TOP PUBLISHERS: BY CIRCULATION
TOP ADVERTISER CATEGORIES
AVERAGE ISSUE READERSHIP (%)
> HIGHLIGHTS
1 Unilever 6 Hyunday Motor
2 L'Oréal 7 FAST ČR
3 Simply You Pharmaceuticals 8 Henkel ČR
4 E. M. A. Europe 9 EMBA Trade
5 Procter & Gamble 10 Ford Motor Company
1 Bauer Media 6 Mlada fronta
2 Czech News Center 7 Empresa Media
3 Astrosat 8 Astrosat Media
4 Burda Praha 9 Burda Media 2000
5 RF Hobby 10 Tarsago
1 Cars, fuel and accessories 6 Drugs, vitamins and health care
2 Dry goods, perfumes and body care
7 Electronical equipment, photo, optic equipment and jewellery
3 Finance 8 Retail chains and forwarding sale
4 Fashion, clothes and shoes 9 Sports and sport equipment
5 Home appliances 10 Entertainment, media and education
MEN 66.7 WOMEN 80.0 ADULTS 73.4
Source: Media Projekt 2013, realisation Median & Stem Mark; January-December 2013; 12-79
Source: Admosphere 2013
Source: ABC CR (only audited titles included)
Source: Admosphere 2013
NUMBER OF CONSUMER MAGAZINE WEBSITES
2009 2010 2011 2012 2013
Total - 4,325 3,781 3,391 3,667
Source: MDS - Media Data System - provided by Omnicom Media Group CR
RETAIL OUTLETS
2009 2010 2011 2012 2013
All retail channels 20,181 19,409 18,242 17,742 17,250
Source: První novinova spolecnost
REVENUE SOURCE (USD MILLIONS)
2009 2010 2011 2012 2013
Print ads 55 52 54 52 51
Copy sales 45 47 45 46 46
Digital revenues - 1 1 2 3
Source: CPA estimation based on development of the gross advertising incomes and magazine sales
NUMBER OF CONSUMER MAGAZINE PUBLISHERS
2009 2010 2011 2012 2013
Total 1,714 2,482 2,535 2,712 2,981
Source: MDS - Media Data System - provided by Omnicom Media Group CR
20 FIPP WORLD MAGAZINE TRENDS 2014/2015: EMEA SPECIAL REPORT
CZECH REPUBLIC: B2B
DISTRIBUTION BREAKDOWN (%)
2009 2010 2011 2012 2013
Subscription - - 21.3 24.8 25.5
Retail sales - - 7.8 5.8 19.8
Free circulation - - 61.5 60.9 44.3
Bulk - - 9.4 8.5 10.4
Source: ABC CR, May and November 2013
NUMBER OF COPIES
AVERAGE COVER PRICE: CZK
NUMBER OF TITLES
2009 2010 2011 2012 2013
Number of copies sold and/or distributed in a year 19.7 million 18.1 million 17.4 million 16.2 million 15 million
2009 2010 2011 2012 2013
Total 631 613 582 598 603
Paid for - 402 376 416 401
Free - 211 206 182 202
2009 2010 2011 2012 2013
Total 67.80 71.45 73.50 74.70 77.40
Source: CPA estimation based on development of B2B magazines sales
Source: MDS provided by Omnicom Media Group CR
Source: ABC CR, reference periods: May and November 2013
TOP ADVERTISERS
TOP PUBLISHERS: BY ADVERTISING REVENUE
TOP ADVERTISER CATEGORIES
AVERAGE ISSUE READERSHIP (%)
> HIGHLIGHTS
1 Komercni Banka 6 Ceska Sporitelna
2 Telefonica 7 Mercedes Benz
3 Ford Motor Company 8 Czech Computer
4 Miton CZ 9 Unicorn Systems
5 Canon CZ 10 Veletrhy Brno
1 Economia 6 Business Media CZ
2 Mlada Fronta 7 Ambit Media
3 Profi Press 8 Medical Tribune CZ
4 ATOZ Marketing Services 9 Atemi
5 IDG Czech Republic 10 MM Publishing
1 Industrial equipment 6 Fashion, clothes and shoes
2 Informational and promotional services, trade fairs
7 Entertainment, cultural events and education
3 Finance 8 Building materials
4 Computers and office equipment 9 Telecommunications
5 Finance 10 Drugs, vitamins and health care
MEN 5.9 WOMEN 2.3 ADULTS 4.0
Source:Media Projekt 2013, realisation Median & Stem Mark; January - December 2013; 12 -79 (readers of B2B magazines only included)
Source: Admosphere 2013
Source: Admosphere 2013;
Source: Admosphere 2013
NUMBER OF B2B MAGAZINE WEBSITES
2009 2010 2011 2012 2013
Total - - - 581 588
Source: MDS provided by Omnicom Media Group CR
RETAIL OUTLETS
2009 2010 2011 2012 2013
All retail channels 20,181 19,409 18,242 17,742 17,250
Source: První novinova spolecnost
REVENUE SOURCE (%)
2009 2010 2011 2012 2013
Print ads 72 75 74 72 73
Copy sales: print/digital
28 25 26 27 25
Print copy sales - - - - 24
Digital copy sales - - - - 1
Source: CPA estimation based on development of the gross advertising incomes and magazine sales
NUMBER OF B2B MAGAZINE PUBLISHERS
2009 2010 2011 2012 2013
Total - 377 347 368 385
Source: MDS provided by Omnicom Media Group CR
FIPP WORLD MAGAZINE TRENDS 2014/2015:EMEA SPECIAL REPORT 21
NATIONAL ASSOCIATION
» Danske Medier (The Association of Danish Media)
> FIPP MEMBERS
> AT-A-GLANCE
PUBLISHERS
» Aller Media » Benjamin Media » Bonnier Publications » Egmont International Holding,
Kids Media Division » Egmont Magasiner » IDG Denmark » Jacobsen Publications
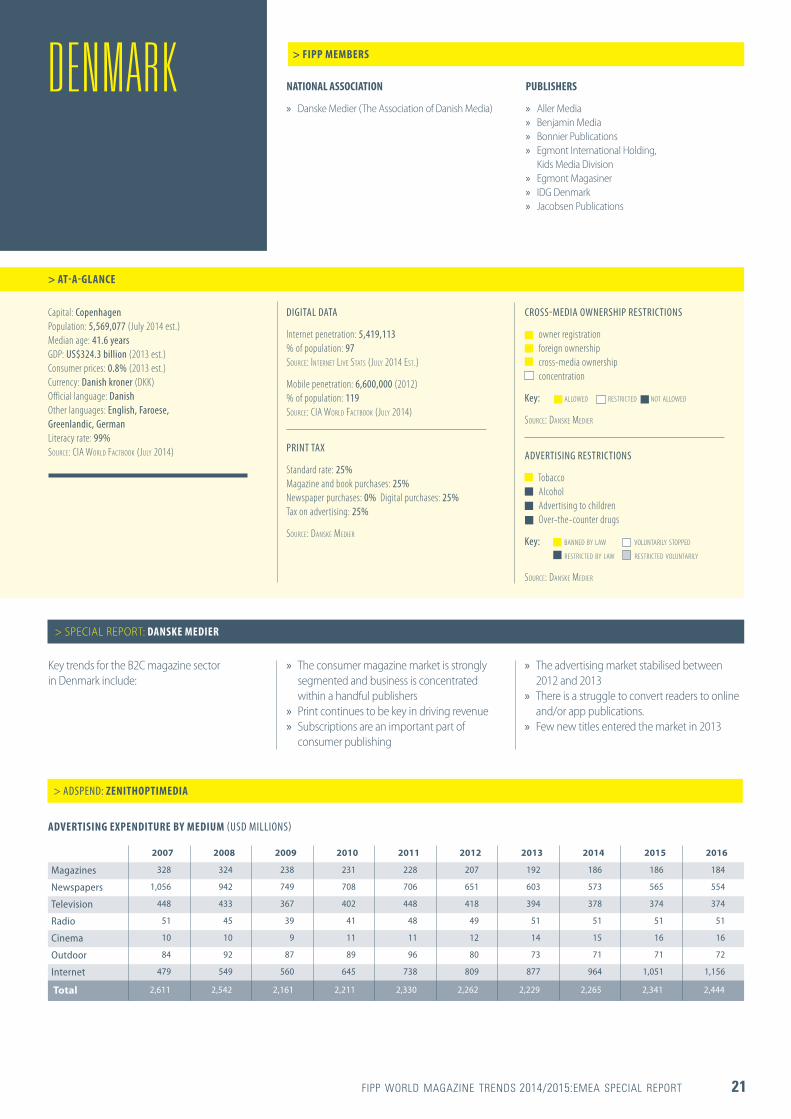
Capital: Copenhagen Population: 5,569,077 (July 2014 est.) Median age: 41.6 years GDP: US$324.3 billion (2013 est.) Consumer prices: 0.8% (2013 est.) Currency: Danish kroner (DKK) Official language: Danish Other languages: English, Faroese, Greenlandic, German Literacy rate: 99% SOURCE: CIA WORLD FACTBOOK (JULY 2014)
DIGITAL DATA
Internet penetration: 5,419,113 % of population: 97 SOURCE: INTERNET LIVE STATS (JULY 2014 EST.)
Mobile penetration: 6,600,000 (2012) % of population: 119 SOURCE: CIA WORLD FACTBOOK (JULY 2014)
PRINT TAX
Standard rate: 25% Magazine and book purchases: 25% Newspaper purchases: 0% Digital purchases: 25% Tax on advertising: 25%
SOURCE: DANSKE MEDIER
CROSS-MEDIA OWNERSHIP RESTRICTIONS
owner registration foreign ownership cross-media ownership concentration
Key: ALLOWED RESTRICTED NOT ALLOWED
SOURCE: DANSKE MEDIER
ADVERTISING RESTRICTIONS
Tobacco Alcohol Advertising to children Over-the-counter drugs
Key: BANNED BY LAW VOLUNTARILY STOPPED RESTRICTED BY LAW RESTRICTED VOLUNTARILY
SOURCE: DANSKE MEDIER
DENMARK
Key trends for the B2C magazine sector in Denmark include:
» The consumer magazine market is strongly segmented and business is concentrated within a handful publishers
» Print continues to be key in driving revenue » Subscriptions are an important part of
consumer publishing
> SPECIAL REPORT: DANSKE MEDIER
» The advertising market stabilised between 2012 and 2013
» There is a struggle to convert readers to online and/or app publications.
» Few new titles entered the market in 2013
> ADSPEND: ZENITHOPTIMEDIA
ADVERTISING EXPENDITURE BY MEDIUM (USD MILLIONS)
2007 2008 2009 2010 2011 2012 2013 2014 2015 2016
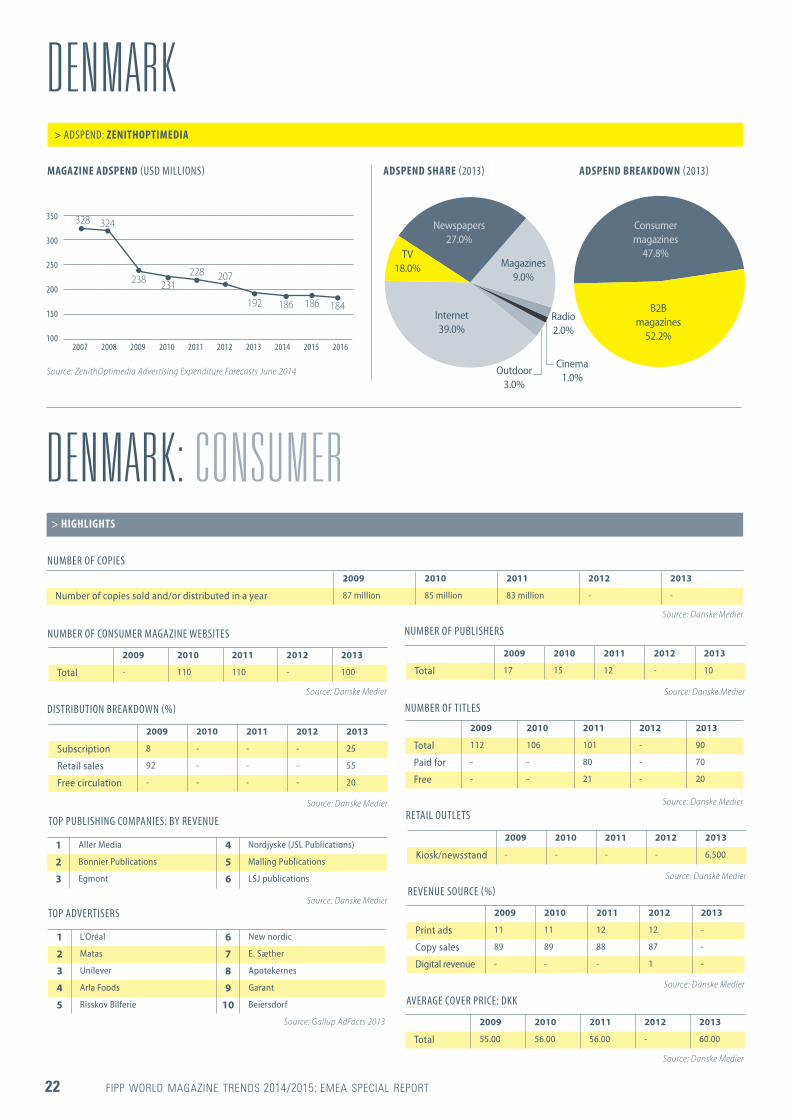
Magazines 328 324 238 231 228 207 192 186 186 184
Newspapers 1,056 942 749 708 706 651 603 573 565 554
Television 448 433 367 402 448 418 394 378 374 374
Radio 51 45 39 41 48 49 51 51 51 51
Cinema 10 10 9 11 11 12 14 15 16 16
Outdoor 84 92 87 89 96 80 73 71 71 72
Internet 479 549 560 645 738 809 877 964 1,051 1,156
Total 2,611 2,542 2,161 2,211 2,330 2,262 2,229 2,265 2,341 2,444
22 FIPP WORLD MAGAZINE TRENDS 2014/2015: EMEA SPECIAL REPORT
DENMARK
DENMARK: CONSUMER
MAGAZINE ADSPEND (USD MILLIONS) ADSPEND SHARE (2013) ADSPEND BREAKDOWN (2013)
NUMBER OF COPIES2009 2010 2011 2012 2013
Number of copies sold and/or distributed in a year 87 million 85 million 83 million - -
> HIGHLIGHTS
2007 2008 2009 2010 2011 2012 2013 2014 2015 2016
350
300
250
200
150
100
328
207
324
192
238
186
231
186
228
184
Source: ZenithOptimedia Advertising Expenditure Forecasts June 2014
Source: Danske Medier
NUMBER OF TITLES
2009 2010 2011 2012 2013
Total 112 106 101 - 90
Paid for - - 80 - 70
Free - - 21 - 20
Source: Danske Medier
AVERAGE COVER PRICE: DKK
2009 2010 2011 2012 2013
Total 55.00 56.00 56.00 - 60.00
Source: Danske Medier
DISTRIBUTION BREAKDOWN (%)
2009 2010 2011 2012 2013
Subscription 8 - - - 25
Retail sales 92 - - - 55
Free circulation - - - - 20
Source: Danske Medier
Magazines 9.0%
Outdoor 3.0%
Cinema 1.0%
Newspapers 27.0%
Radio 2.0%
Internet 39.0%
TV 18.0%
> ADSPEND: ZENITHOPTIMEDIA
NUMBER OF CONSUMER MAGAZINE WEBSITES
2009 2010 2011 2012 2013
Total - 110 110 - 100
Source: Danske Medier
TOP PUBLISHING COMPANIES: BY REVENUE
1 Aller Media 4 Nordjyske (JSL Publications)
2 Bonnier Publications 5 Malling Publications
3 Egmont 6 LSJ publications
Source: Danske MedierTOP ADVERTISERS
1 L'Oréal 6 New nordic
2 Matas 7 E. Sæther
3 Unilever 8 Apotekernes
4 Arla Foods 9 Garant
5 Risskov Bilferie 10 Beiersdorf
Source: Gallup AdFacts 2013
RETAIL OUTLETS
2009 2010 2011 2012 2013
Kiosk/newsstand - - - - 6,500
Source: Danske Medier
NUMBER OF PUBLISHERS
2009 2010 2011 2012 2013
Total 17 15 12 - 10
Source: Danske Medier
REVENUE SOURCE (%)
2009 2010 2011 2012 2013
Print ads 11 11 12 12 -
Copy sales 89 89 88 87 -
Digital revenue - - - 1 -
Source: Danske Medier
B2B magazines
52.2%
Consumer magazines
47.8%
FIPP WORLD MAGAZINE TRENDS 2014/2015:EMEA SPECIAL REPORT 23
DENMARK: B2B
NUMBER OF PUBLISHERS
NUMBER OF B2B MAGAZINE WEBSITES
NUMBER OF TITLES
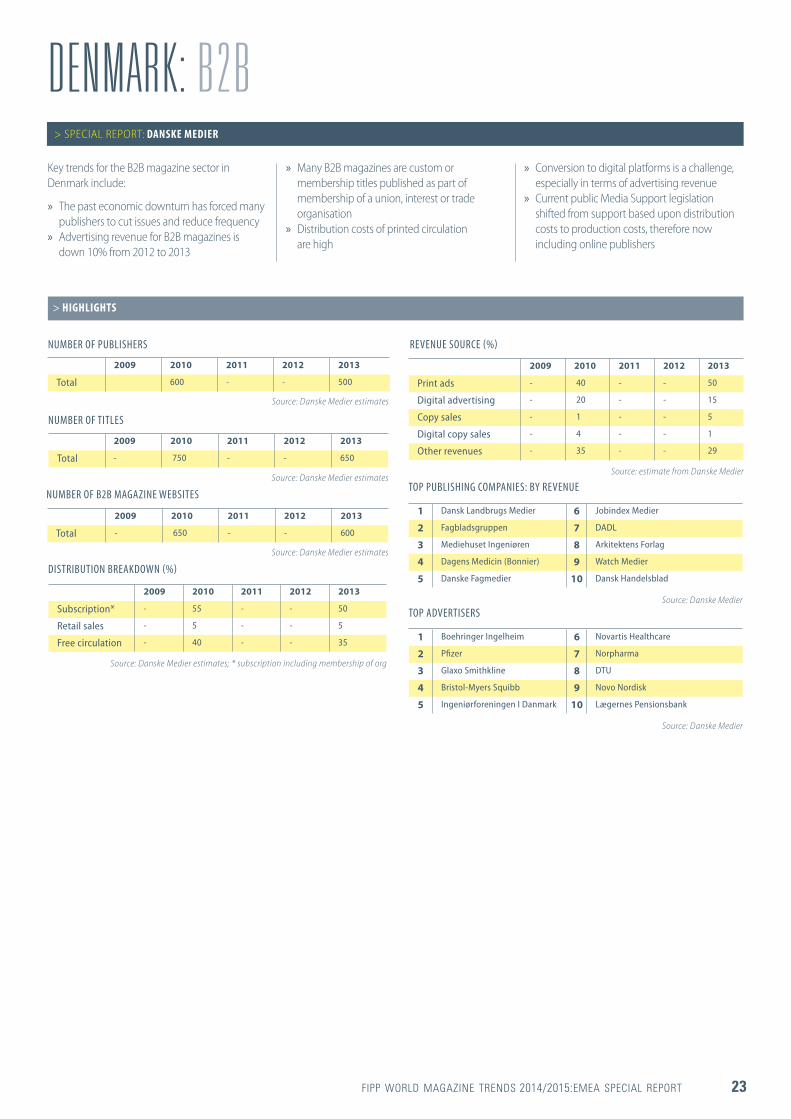
2009 2010 2011 2012 2013
Total 600 - - 500
> HIGHLIGHTS
2009 2010 2011 2012 2013
Total - 750 - - 650
2009 2010 2011 2012 2013
Total - 650 - - 600
Source: Danske Medier estimates
Source: Danske Medier estimates
TOP PUBLISHING COMPANIES: BY REVENUE
TOP ADVERTISERS
1 Dansk Landbrugs Medier 6 Jobindex Medier
2 Fagbladsgruppen 7 DADL
3 Mediehuset Ingeniøren 8 Arkitektens Forlag
4 Dagens Medicin (Bonnier) 9 Watch Medier
5 Danske Fagmedier 10 Dansk Handelsblad
1 Boehringer Ingelheim 6 Novartis Healthcare
2 Pfizer 7 Norpharma
3 Glaxo Smithkline 8 DTU
4 Bristol-Myers Squibb 9 Novo Nordisk
5 Ingeniørforeningen I Danmark 10 Lægernes Pensionsbank
Source: Danske Medier
Source: Danske Medier
REVENUE SOURCE (%)
2009 2010 2011 2012 2013
Print ads - 40 - - 50
Digital advertising - 20 - - 15
Copy sales - 1 - - 5
Digital copy sales - 4 - - 1
Other revenues - 35 - - 29
Source: estimate from Danske Medier
Source: Danske Medier estimates
Key trends for the B2B magazine sector in Denmark include:
» The past economic downturn has forced many publishers to cut issues and reduce frequency
» Advertising revenue for B2B magazines is down 10% from 2012 to 2013
» Many B2B magazines are custom or membership titles published as part of membership of a union, interest or trade organisation
» Distribution costs of printed circulation are high
> SPECIAL REPORT: DANSKE MEDIER
» Conversion to digital platforms is a challenge, especially in terms of advertising revenue
» Current public Media Support legislation shifted from support based upon distribution costs to production costs, therefore now including online publishers
DISTRIBUTION BREAKDOWN (%)
2009 2010 2011 2012 2013
Subscription* - 55 - - 50
Retail sales - 5 - - 5
Free circulation - 40 - - 35
Source: Danske Medier estimates; * subscription including membership of org
24 FIPP WORLD MAGAZINE TRENDS 2014/2015: EMEA SPECIAL REPORT
NATIONAL ASSOCIATION
» Finnish Periodical Publishers’ Association (FPPA)
PUBLISHERS
» A-lehdet » Aller Media » Bonnier Publications » Image Kustannus » Markkinointiviestinta Dialogi » Otavamedia Customer Communications
> FIPP MEMBERS
> AT-A-GLANCE
» Otavamedia » Sanoma Corporation » Sanoma Magazines Finland
SUPPLIERS
» Sappi Finland » UPM
Capital: Helsinki Population: 5,268,799 (July 2014 est.) Median age: 43.2 years GDP: US$259.6 billion (2013 est.) Consumer prices: 2.2% (2013 est.) Currency: Euro (EUR) Official language: Finnish (94.2%), Swedish (5.5%) Other languages: Sami and Russian (0.2%) Literacy rate: 100% SOURCE: CIA WORLD FACTBOOK (JULY 2014)
DIGITAL DATA
Internet penetration: 5,117,660 % of population: 97 SOURCE: INTERNET LIVE STATS (JULY 2014 EST.)
Mobile penetration: 9,320,000 (2012) % of population: 177 SOURCE: CIA WORLD FACTBOOK (JULY 2014)
PRINT TAX
Standard rate: 24% Magazine, newspaper and book purchases: 10% Digital purchases: 24% Tax on advertising: 24% SOURCE: FPPA
CROSS-MEDIA OWNERSHIP RESTRICTIONS
owner registration foreign ownership cross-media ownership concentration
Key: ALLOWED RESTRICTED NOT ALLOWED SOURCE: FPPA
ADVERTISING RESTRICTIONS
Tobacco Alcohol Advertising to children Over-the-counter drugs
Key: BANNED BY LAW VOLUNTARILY STOPPED RESTRICTED BY LAW RESTRICTED VOLUNTARILY SOURCE: FPPA
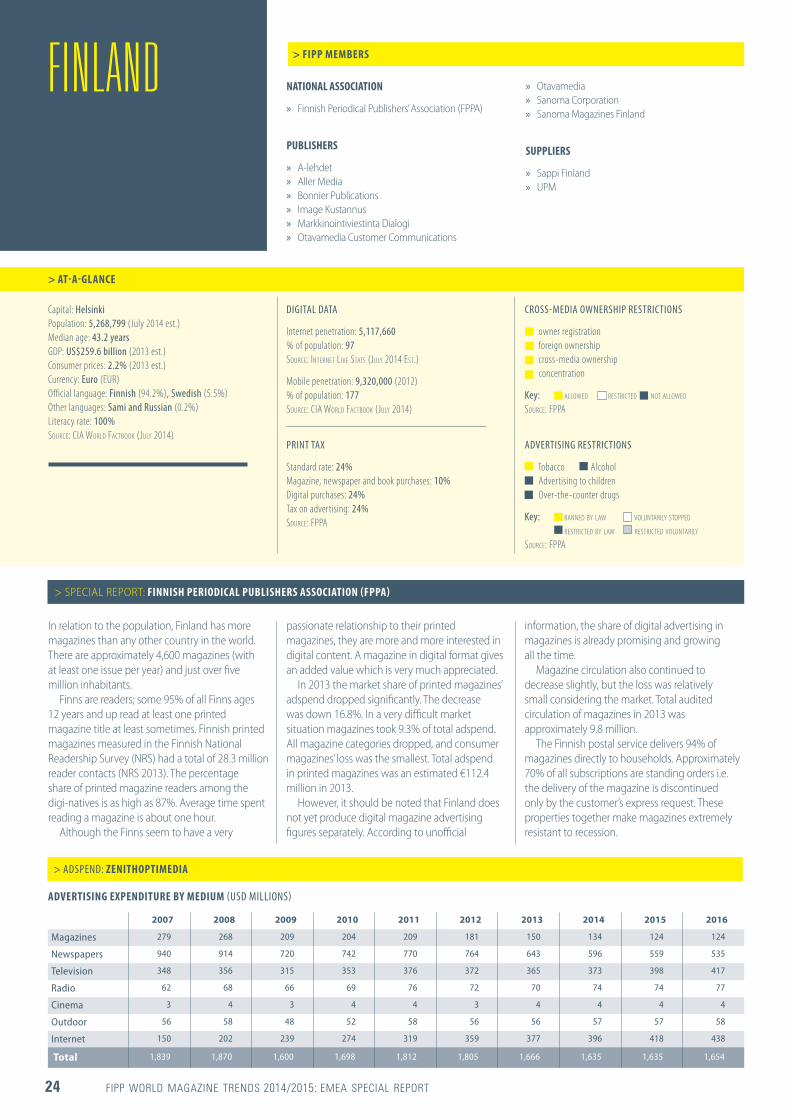
FINLAND
In relation to the population, Finland has more magazines than any other country in the world. There are approximately 4,600 magazines (with at least one issue per year) and just over five million inhabitants.
Finns are readers; some 95% of all Finns ages 12 years and up read at least one printed magazine title at least sometimes. Finnish printed magazines measured in the Finnish National Readership Survey (NRS) had a total of 28.3 million reader contacts (NRS 2013). The percentage share of printed magazine readers among the digi-natives is as high as 87%. Average time spent reading a magazine is about one hour.
Although the Finns seem to have a very
passionate relationship to their printed magazines, they are more and more interested in digital content. A magazine in digital format gives an added value which is very much appreciated.
In 2013 the market share of printed magazines’ adspend dropped significantly. The decrease was down 16.8%. In a very difficult market situation magazines took 9.3% of total adspend. All magazine categories dropped, and consumer magazines’ loss was the smallest. Total adspend in printed magazines was an estimated €112.4 million in 2013.
However, it should be noted that Finland does not yet produce digital magazine advertising figures separately. According to unofficial
> SPECIAL REPORT: FINNISH PERIODICAL PUBLISHERS ASSOCIATION (FPPA)
information, the share of digital advertising in magazines is already promising and growing all the time.
Magazine circulation also continued to decrease slightly, but the loss was relatively small considering the market. Total audited circulation of magazines in 2013 was approximately 9.8 million.
The Finnish postal service delivers 94% of magazines directly to households. Approximately 70% of all subscriptions are standing orders i.e. the delivery of the magazine is discontinued only by the customer’s express request. These properties together make magazines extremely resistant to recession.
> ADSPEND: ZENITHOPTIMEDIA
ADVERTISING EXPENDITURE BY MEDIUM (USD MILLIONS)
2007 2008 2009 2010 2011 2012 2013 2014 2015 2016
Magazines 279 268 209 204 209 181 150 134 124 124
Newspapers 940 914 720 742 770 764 643 596 559 535
Television 348 356 315 353 376 372 365 373 398 417
Radio 62 68 66 69 76 72 70 74 74 77
Cinema 3 4 3 4 4 3 4 4 4 4
Outdoor 56 58 48 52 58 56 56 57 57 58
Internet 150 202 239 274 319 359 377 396 418 438
Total 1,839 1,870 1,600 1,698 1,812 1,805 1,666 1,635 1,635 1,654

FIPP WORLD MAGAZINE TRENDS 2014/2015:EMEA SPECIAL REPORT 25
FINLAND
FINLAND: CONSUMER> HIGHLIGHTS
NUMBER OF TITLES
2009 2010 2011 2012 2013
Total 238 228 223 223 211
Source: FPPA , Members of FPPA only
DISTRIBUTION BREAKDOWN (%)
2009 2010 2011 2012 2013
Subscription 95 95 95 95 94
Retail sales 5 5 5 5 6
Source: FPPA - Figures include B2B magazines
Source: Balance-Team Oy
TOP PUBLISHING COMPANIES: BY REVENUE
1 Sanoma Magazines Finland 6 Oy Valitut Palat - Reader's Digest
2 Otavamedia 7 Egmont Kustannus
3 A-lehdet 8 Markkinointiviestintä Dialogi
4 Aller Media 9 Alma Media Lehdentekijät
5 Talentum Media 10 A-kustannus
TOP ADVERTISERS
1 L'Oréal Finland 6 VV-Auto
2 Unilever Finland 7 Bayer
3 Valio 8 Leader
4 Ikea 9 MTV3
5 Berner 10 Procter & Gamble
Source: TNS Gallup, 2014
TOP ADVERTISER CATEGORIES
1 Groceries 6 Tourism and transportation
2 Cosmetics 7 Clothing
3 Drugs 8 Furniture and decoration
4 Motor vehicles and accessories 9 Media publishers
5 Building 10 Entertainment
Source: TNS Gallup, 2014
TOTAL READERSHIP (%)
Source: MediaAuditFinland, 2014; 2013/2014; Adults = 12+
MEN 92 WOMEN 97 ADULTS 95
MAGAZINE ADSPEND (USD MILLIONS) ADSPEND SHARE (2013)
2007 2008 2009 2010 2011 2012 2013 2014 2015 2016
300
250
200
150
100
50
279
181
268
150
209
134
204
124
209
124
Source: ZenithOptimedia Advertising Expenditure Forecasts June 2014
Magazines 9.0%
Outdoor 3.3%
Cinema 0.2%
Newspapers 38.6%
Radio 4.2%
Internet 22.6%
TV 21.9%
> ADSPEND: ZENITHOPTIMEDIA
NUMBER OF COPIES2009 2010 2011 2012 2013
Number of copies sold and/or distributed in a year 381.7 million 364.4 million 337.9 million 304.4 million 313.6 million
Source: Itella, Lehtipiste and Alma Manu
REVENUE SOURCE (%)
2009 2010 2011 2012 2013
Print ads 24 23 25 24 24
Copy sales 76 77 75 69 69
Other revenues - - - 7 7
Source: Statistics Finland, Yearbook 2012
26 FIPP WORLD MAGAZINE TRENDS 2014/2015: EMEA SPECIAL REPORT
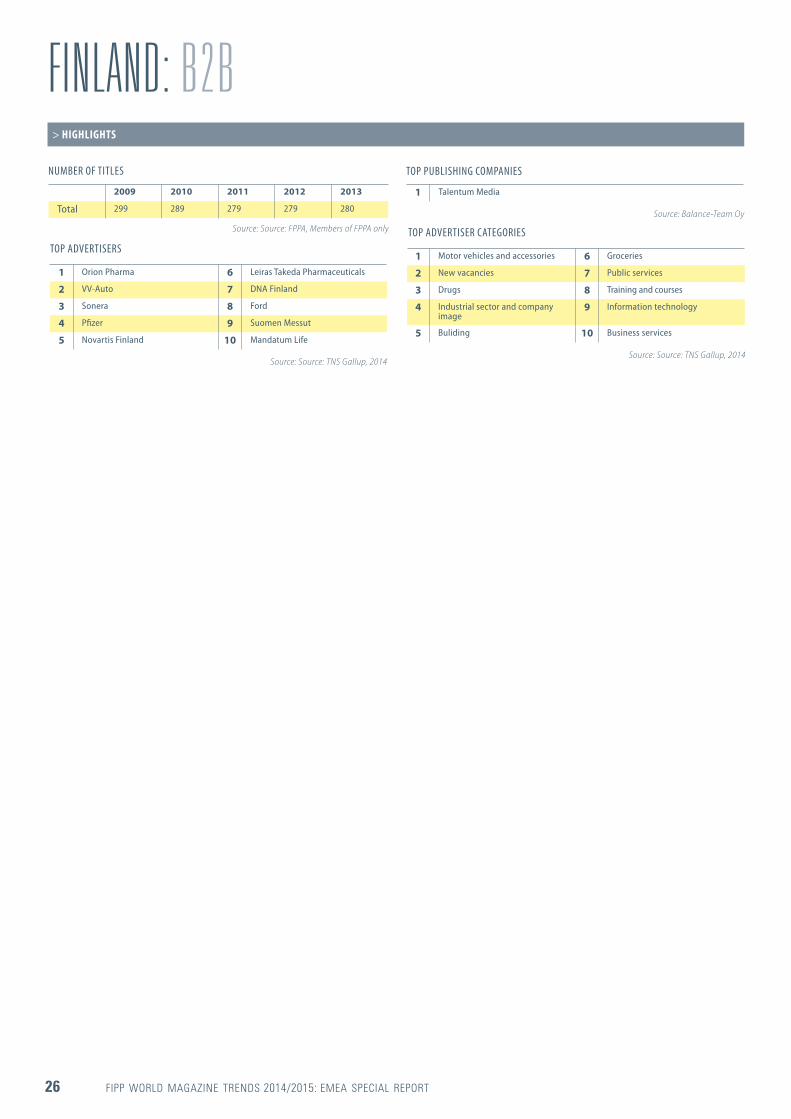
FINLAND: B2BNUMBER OF TITLES
> HIGHLIGHTS
2009 2010 2011 2012 2013
Total 299 289 279 279 280
Source: Source: FPPA, Members of FPPA only
TOP PUBLISHING COMPANIES
1 Talentum Media
Source: Balance-Team Oy
TOP ADVERTISERS
1 Orion Pharma 6 Leiras Takeda Pharmaceuticals
2 VV-Auto 7 DNA Finland
3 Sonera 8 Ford
4 Pfizer 9 Suomen Messut
5 Novartis Finland 10 Mandatum Life
Source: Source: TNS Gallup, 2014
TOP ADVERTISER CATEGORIES
1 Motor vehicles and accessories 6 Groceries
2 New vacancies 7 Public services
3 Drugs 8 Training and courses
4 Industrial sector and company image
9 Information technology
5 Buliding 10 Business services
Source: Source: TNS Gallup, 2014

FIPP WORLD MAGAZINE TRENDS 2014/2015:EMEA SPECIAL REPORT 27
Circulation, sales, ads, audience2013 has been a difficult year for the whole press sector in terms of sales, and B2C magazine media was in line with this, with circulation falling by 5%.
Concerning ad revenues, 2013 was once again a tough year for the magazine industry with revenues down by 10.1%, while national newspapers declined by 8.2% and traditional media (TV, radio, cinema, outdoor and press) was down 5%.
However, magazines still have a decisive role in the overall media plan of many advertisers because of their importance in brand building: the market share of magazine media represents 35% of the press sector and almost 13% of traditional media. This year’s SEPM Marketing-Publicité survey proves the special effectiveness of web + print magazines ad campaigns.
With regards to audience, Audipresse One Global 2013 ranked five magazine brands in the top 10 and 13 in the top 20 of press brands, with Femme Actuelle the leader.
Furthermore, three of the nine global web categories are dominated by magazine websites – tele-loisirs.fr, 01net.com and voici.fr – as regards users’ preference (Harris/NetObserver).
Digital challengesFor the time being, magazine digital circulation figures are still low - under 1% of the total paid circulation – while national newspapers are above 5%.
But readers’ commitment to magazine brands should develop magazine digital circulation and turnover in the coming years.
And some publishers are already reaping the fruits of their digital strategy: for instance, 10% of Prisma Media turnover and one third of its advertising revenues come from digital. And other publishers also have significant revenues from digital, including Lagardère Active, Marie-Claire etc.
Brand extension is a path that French publishers are increasingly following to create revenues and reinforce their brands: doing it to develop their core business with new titles which are brand extensions based on related titles (i.e. Geo Histoire, Geo Voyage, Geo Savoir, Geo Art etc). But also with books (Prisma), conferences (Psychologies, Nouvel Observateur), cruises (L’Express, Psychologies), fashion events (Condé Nast and Fashion Week), e-commerce (Condé Nast’s investment in Vestiaire Collective).
Print challengesOn the print side, an increase in the remuneration of the single-copy sales network is on the verge of being implemented. This will put French newsstands’ remuneration at the level of French EU counterparts and will help stimulate the market.
French magazine publishers are also trying to put in place new commercial relations with the postal operator which would be based on a radically new logistics system. After a six-year period during which their postal prices have jumped by up to 50%, and when subscriptions have been the more stable baseline of publishers’ revenues for years, this is a matter of absolute priority.
ASSOCIATIONS » WAN-IFRA (World Association of Newspapers
and News Publishers)
» Fédération Nationale de la Presse d’Information Spécialisée (FNPS)
» Syndicat des Editeurs de la Presse Magazine (SEPM)
PUBLISHERS
» Groupe Prisma Média
» Groupe Psychologies
> FIPP MEMBERS
> AT-A-GLANCE
» Hachette Filipacchi Associés
» Lagardère Active
» Lagardère Entertainment
» Les Publications Condé Nast
» Marie Claire Album
» Mondadori France
» Motor Presse France
SUPPLIERS
» Adobe Systems
Capital: Paris Population: 62,814,233 (July 2014 est) Median age: 40.9 years GDP: US$2.739 trillion (2013 est.) Consumer prices: 0.9% (2013 est.) Currency: Euro (EUR) Official language: French Literacy rate: 99% SOURCE: CIA WORLD FACTBOOK (JULY 2014)
DIGITAL DATA
Internet penetration: 55,429,382 % of population: 88 SOURCE: INTERNET LIVE STATS (JULY 2014 est.) Mobile penetration: 62,280,000 % of population: 99 SOURCE: CIA WORLD FACTBOOK (JULY 2014)
PRINT TAX
Magazine purchases: 2.1% Digital purchases: 2.1%*
SOURCE: SEPM; * AN EUROPEAN COMMISSION INFRINGEMENT PROCEDURE IS PENDING AGAINST THE VAT RATE ON ELECTRONIC BOOKS.
CROSS-MEDIA OWNERSHIP RESTRICTIONS
foreign ownership* concentration
Key: ALLOWED RESTRICTED NOT ALLOWED
SOURCE: SEPM; * NOT MORE THAN 20%
ADVERTISING RESTRICTIONS
Tobacco Alcohol Advertising to children Over-the-counter drugs Firearms
Key: BANNED BY LAW VOLUNTARILY STOPPED RESTRICTED BY LAW RESTRICTED VOLUNTARILY
SOURCE: SEPM
FRANCE
> SPECIAL REPORT: SYNDICAT DES ÉDITEURS DE LA PRESSE MAGAZINE (SEPM)

28 FIPP WORLD MAGAZINE TRENDS 2014/2015: EMEA SPECIAL REPORT
FRANCE: CONSUMER
DISTRIBUTION BREAKDOWN (%)
2009 2010 2011 2012 2013
Subscription 44.4 45.2 45.4 47.6 49.0
Retail sales 55.6 54.8 52.8 52.4 51.0
Free circulation - - 1.7 - -
Source: OJD
NUMBER OF COPIES
AVERAGE COVER PRICE: EUR
NUMBER OF TITLES
2009 2010 2011 2012 2013
Number of copies sold and/or distributed in a year 1.856 billion 1.820 billion 1.760 billion 1.686 billion 1.609 billion
2009 2010 2011 2012 2013
Total 4,500 4,518 4,550 4,627 4,430
2009 2010 2011 2012 2013
Total 2.26 2.28 2.24 2.39 2.47
Source: OJD
Source: CSMP
Source: CSMP
> HIGHLIGHTS
FRANCE> ADSPEND: ZENITHOPTIMEDIA
ADVERTISING EXPENDITURE BY MEDIUM (USD MILLIONS)
MAGAZINE ADSPEND (USD MILLIONS) ADSPEND SHARE (2013) ADSPEND BREAKDOWN (2013)
2007 2008 2009 2010 2011 2012 2013 2014 2015 2016
Magazines 2,440 2,344 1,914 1,972 1,951 1,843 1,657 1,548 1,476 1,423
Newspapers 1,494 1,519 1,417 1,413 1,409 1,318 1,244 1,182 1,135 1,101
Television 4,753 4,489 4,060 4,538 4,568 4,363 4,210 4,168 4,147 4,147
Radio 1,069 1,035 940 988 994 982 978 978 987 1,002
Cinema 118 99 101 120 139 140 121 127 130 133
Outdoor 1,643 1,680 1,497 1,578 1,599 1,555 1,530 1,530 1,545 1,568
Internet 1,936 2,448 2,581 2,865 3,218 3,388 3,510 3,660 3,838 4,053
Total 13,454 13,615 12,510 13,473 13,878 13,589 13,250 13,193 13,259 13,427
2007 2008 2009 2010 2011 2012 2013 2014 2015 2016
2,400
2,200
2,000
1,800
1,600
1,400
2,440
1,843
2,344
1,6571,914
1,548
1,972
1,476
1,951
1,423
Source: ZenithOptimedia Advertising Expenditure Forecasts June 2014
Magazines 12.5%
Cinema 0.9%
Newspapers 9.4%
Radio 7.4%
Outdoor 11.5%
Internet 26.5%
TV 31.8%
Consumer magazines
79%B2B
magazines 21%
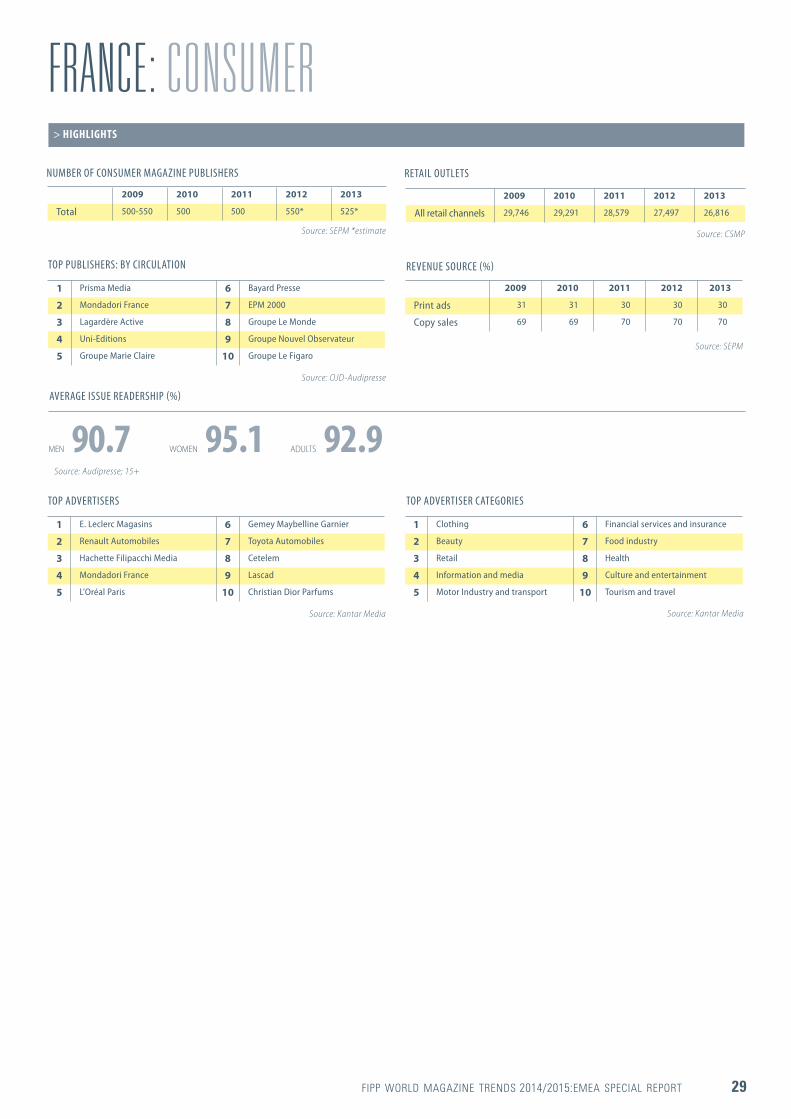
FIPP WORLD MAGAZINE TRENDS 2014/2015:EMEA SPECIAL REPORT 29
FRANCE: CONSUMER> HIGHLIGHTS
TOP ADVERTISERS
TOP PUBLISHERS: BY CIRCULATION
TOP ADVERTISER CATEGORIES
AVERAGE ISSUE READERSHIP (%)
1 E. Leclerc Magasins 6 Gemey Maybelline Garnier
2 Renault Automobiles 7 Toyota Automobiles
3 Hachette Filipacchi Media 8 Cetelem
4 Mondadori France 9 Lascad
5 L'Oréal Paris 10 Christian Dior Parfums
1 Prisma Media 6 Bayard Presse
2 Mondadori France 7 EPM 2000
3 Lagardère Active 8 Groupe Le Monde
4 Uni-Editions 9 Groupe Nouvel Observateur
5 Groupe Marie Claire 10 Groupe Le Figaro
1 Clothing 6 Financial services and insurance
2 Beauty 7 Food industry
3 Retail 8 Health
4 Information and media 9 Culture and entertainment
5 Motor Industry and transport 10 Tourism and travel
MEN 90.7 WOMEN 95.1 ADULTS 92.9Source: Audipresse; 15+
Source: Kantar Media
Source: OJD-Audipresse
Source: Kantar Media
RETAIL OUTLETS
2009 2010 2011 2012 2013
All retail channels 29,746 29,291 28,579 27,497 26,816
Source: CSMP
REVENUE SOURCE (%)
2009 2010 2011 2012 2013
Print ads 31 31 30 30 30
Copy sales 69 69 70 70 70
Source: SEPM
NUMBER OF CONSUMER MAGAZINE PUBLISHERS
2009 2010 2011 2012 2013
Total 500-550 500 500 550* 525*
Source: SEPM *estimate

30 FIPP WORLD MAGAZINE TRENDS 2014/2015: EMEA SPECIAL REPORT
Innovation driveMagazine titles that are less than ten years old turn over more than 40% of the total B2B revenue.
Relevance across all channels Never before have so many people consumed magazine content. The reasons for the high interest in magazines are the trust readers have in the journalistic quality of the existing print brands and in their topicality. In business communications the relevance of magazines has increased as well. 94% of top decision makers refer to B2B magazines as a source of information in a professional context.
Magazines are the clear winners among all media types when it comes to mobile reach.
The number of publications has reached a record high of 1,600 magazine titles.
Magazines are thought leaders in the media market and the best source of information for business industries. The success of magazines also lies in the differentiated range of magazine titles with tailor-made content for increasingly demanding, narrow target groups.
German publishing companies serve the interest of a fragmented society with the rapid development of new businesses and innovations. The entrepreneurial boom continues with established publishing houses as
well as with young, new publishing companies. Across all channels more people than ever
before read magazines. Their total reach has been growing for years. This significantly distinguishes magazines from other media segments. 91.5% of the German population above 14 years of age read print publications. 72% make use of the online services offered by consumer magazines.
According to the current VDZ trend survey, publishers expect to generate on average 34% of their revenue with digital or other business. An increase of 14.8% for online business is expected. 92% of the publishers expect an increase in their mobile business.
An additional promising growth segment for publishing companies is the business of moving images: 59% of publishing companies have expanded their business with video. At the same time they are enhancing their paid content offerings.
The annual domestic and international turnover of all publishing houses across all business sectors is €14.85 billion Euro (Germany: €10.81 billion, international: €4.04 billion). Print products continue to be an essential pillar with a 66% share of the total turnover.
In the advertising business a slight fall in revenue of 1.5% on a gross basis for the whole year 2014 is forecast even though the first
ASSOCIATIONS » WAN-IFRA (World Association
of Newspapers and News Publishers) » VDZ - Verband Deutscher Zeitschriftenverleger » Verein Deutsche Fachpresse
PUBLISHERS » Alfons W. Gentner » Axel Springer » Bauer Media Group » BILD am SONNTAG » BILD digital » Burda Community Network » Burda Digital Systems » Burda Intermedia Publishing » Burda International » Burda People Group » Burda Style Group » Burda Verlag Osteuropa » Burda Verlagskoordination » CHIP Xonio Online » Computec Media AG (Marquard Media International) » Condé Nast » De Agostini Deutschland » Deutscher Fachverlag » DPV Gruner + Jahr » Ebner » Egmont EHAPA » Egmont Holding » G+J Women New Media » Gruner + Jahr
> FIPP MEMBERS
> AT-A-GLANCE
» Gruner + Jahr International » Haymarket Media » Hubert Burda Media » Hubert Burda Media - Milchstrasse » IDG Entertainment Media » Klambt-Verlag » Motor Presse Stuttgart » National Geographic Germany » Playboy Deutschland Publishing » Ringier Publishing » Rodale Motor-Presse » Spotlight Verlag » stern.de » Verlag Aenne Burda » Vogel Business Media
SUPPLIERS » Adobe Systems » Applix » censhare » Dalim Software » eZ Systems » HDS Retail Deutschland » OneVision Software » Sappi Deutschland » UPM Paper Business Group » UPM Sales » Yoochoose Unit » Zinio
Capital: Berlin Population: 80,996,685 (July 2014 est) Median age: 46.1 years GDP: US$3.593 trillion (2013 est.) Consumer prices: 1.6% (2013 est.) Currency: Euro (EUR) Official language: German Literacy rate: 99% SOURCE: CIA WORLD FACTBOOK (JULY 2014)
DIGITAL DATA
Internet penetration: 71,727,551 % of population: 89 SOURCE: INTERNET LIVE STATS (JULY 2014 est.) Mobile penetration: 107,700,000 (2012) % of population: 133 SOURCE: CIA WORLD FACTBOOK (JULY 2014)
PRINT TAX
Standard VAT rate: 19% Magazine, newspaper and book purchases: 7% Digital purchases: 19% Tax on advertising: 19%
SOURCE: VDZ
ADVERTISING RESTRICTIONS
Tobacco Alcohol Advertising to children Over-the-counter drugs
Key: BANNED BY LAW VOLUNTARILY STOPPED RESTRICTED BY LAW RESTRICTED VOLUNTARILY
SOURCE: VDZ
GERMANY
> SPECIAL REPORT: DEUTSCHE FACHPRESSE/VDZ
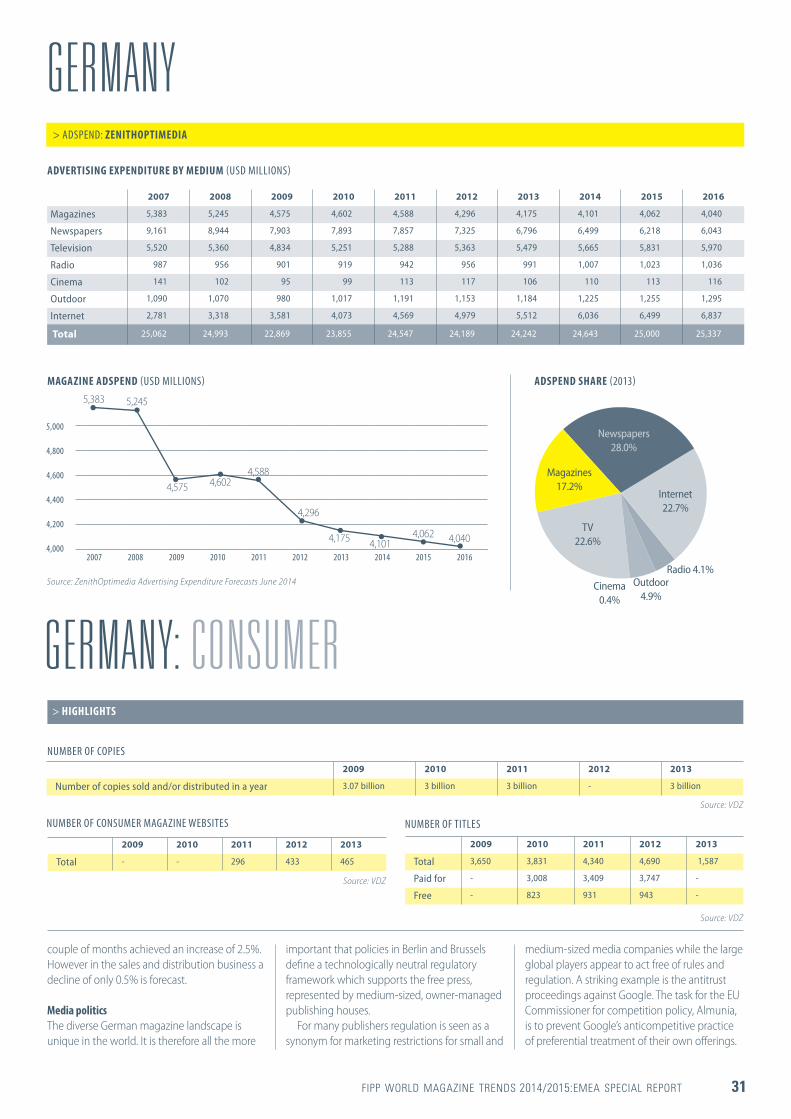
FIPP WORLD MAGAZINE TRENDS 2014/2015:EMEA SPECIAL REPORT 31
GERMANY: CONSUMERNUMBER OF COPIES
NUMBER OF TITLES
2009 2010 2011 2012 2013
Number of copies sold and/or distributed in a year 3.07 billion 3 billion 3 billion - 3 billion
2009 2010 2011 2012 2013
Total 3,650 3,831 4,340 4,690 1,587
Paid for - 3,008 3,409 3,747 -
Free - 823 931 943 -
Source: VDZ
Source: VDZ
> HIGHLIGHTS
NUMBER OF CONSUMER MAGAZINE WEBSITES
2009 2010 2011 2012 2013
Total - - 296 433 465
Source: VDZ
GERMANY> ADSPEND: ZENITHOPTIMEDIA
ADVERTISING EXPENDITURE BY MEDIUM (USD MILLIONS)
2007 2008 2009 2010 2011 2012 2013 2014 2015 2016
Magazines 5,383 5,245 4,575 4,602 4,588 4,296 4,175 4,101 4,062 4,040
Newspapers 9,161 8,944 7,903 7,893 7,857 7,325 6,796 6,499 6,218 6,043
Television 5,520 5,360 4,834 5,251 5,288 5,363 5,479 5,665 5,831 5,970
Radio 987 956 901 919 942 956 991 1,007 1,023 1,036
Cinema 141 102 95 99 113 117 106 110 113 116
Outdoor 1,090 1,070 980 1,017 1,191 1,153 1,184 1,225 1,255 1,295
Internet 2,781 3,318 3,581 4,073 4,569 4,979 5,512 6,036 6,499 6,837
Total 25,062 24,993 22,869 23,855 24,547 24,189 24,242 24,643 25,000 25,337
couple of months achieved an increase of 2.5%. However in the sales and distribution business a decline of only 0.5% is forecast.
Media politicsThe diverse German magazine landscape is unique in the world. It is therefore all the more
important that policies in Berlin and Brussels define a technologically neutral regulatory framework which supports the free press, represented by medium-sized, owner-managed publishing houses.
For many publishers regulation is seen as a synonym for marketing restrictions for small and
medium-sized media companies while the large global players appear to act free of rules and regulation. A striking example is the antitrust proceedings against Google. The task for the EU Commissioner for competition policy, Almunia, is to prevent Google’s anticompetitive practice of preferential treatment of their own offerings.
MAGAZINE ADSPEND (USD MILLIONS) ADSPEND SHARE (2013)
2007 2008 2009 2010 2011 2012 2013 2014 2015 2016
5,000
4,800
4,600
4,400
4,200
4,000
5,383
4,296
5,245
4,175
4,575
4,101
4,602
4,062
4,588
4,040
Source: ZenithOptimedia Advertising Expenditure Forecasts June 2014
Magazines 17.2%
Outdoor 4.9%
Cinema 0.4%
Newspapers 28.0%
Radio 4.1%
Internet 22.7%
TV 22.6%
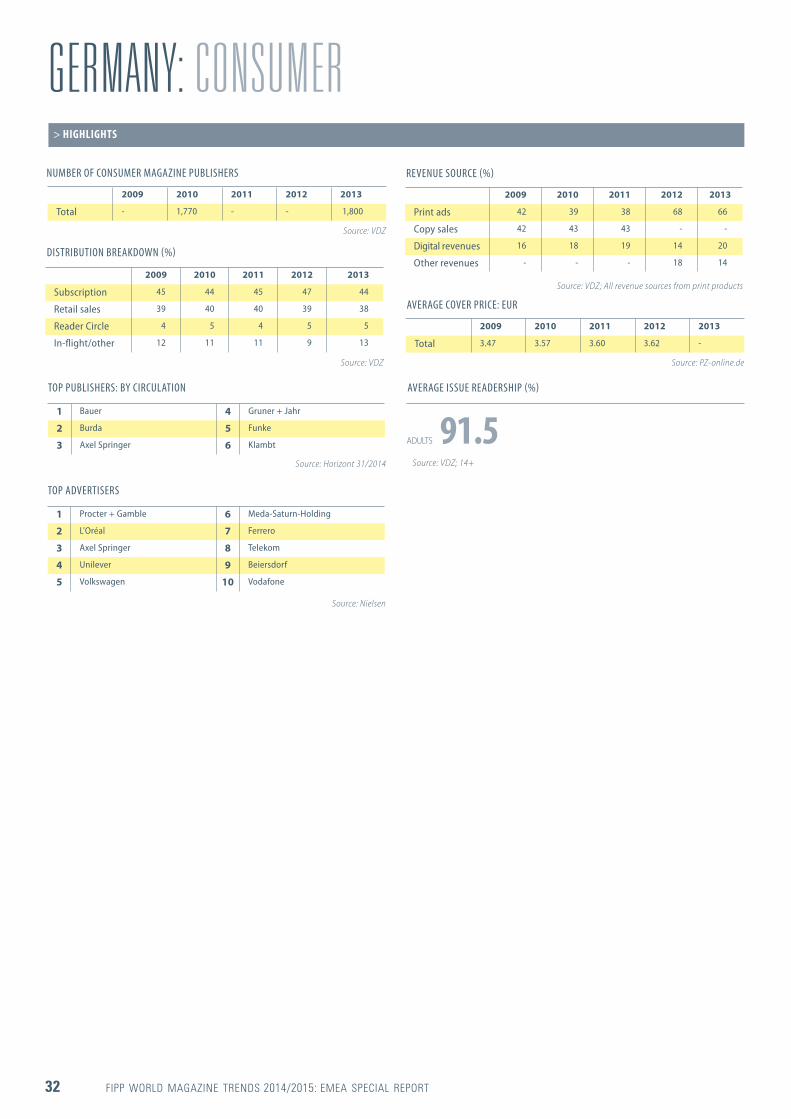
32 FIPP WORLD MAGAZINE TRENDS 2014/2015: EMEA SPECIAL REPORT
GERMANY: CONSUMER
DISTRIBUTION BREAKDOWN (%)
2009 2010 2011 2012 2013
Subscription 45 44 45 47 44
Retail sales 39 40 40 39 38
Reader Circle 4 5 4 5 5
In-flight/other 12 11 11 9 13
Source: VDZ
AVERAGE COVER PRICE: EUR
2009 2010 2011 2012 2013
Total 3.47 3.57 3.60 3.62 -
Source: PZ-online.de
> HIGHLIGHTS
TOP ADVERTISERS
1 Procter + Gamble 6 Meda-Saturn-Holding
2 L'Oréal 7 Ferrero
3 Axel Springer 8 Telekom
4 Unilever 9 Beiersdorf
5 Volkswagen 10 Vodafone
AVERAGE ISSUE READERSHIP (%)
ADULTS 91.5Source: VDZ; 14+
Source: Nielsen
TOP PUBLISHERS: BY CIRCULATION
1 Bauer 4 Gruner + Jahr
2 Burda 5 Funke
3 Axel Springer 6 Klambt
Source: Horizont 31/2014
REVENUE SOURCE (%)
2009 2010 2011 2012 2013
Print ads 42 39 38 68 66
Copy sales 42 43 43 - -
Digital revenues 16 18 19 14 20
Other revenues - - - 18 14
Source: VDZ; All revenue sources from print products
NUMBER OF CONSUMER MAGAZINE PUBLISHERS
2009 2010 2011 2012 2013
Total - 1,770 - - 1,800
Source: VDZ
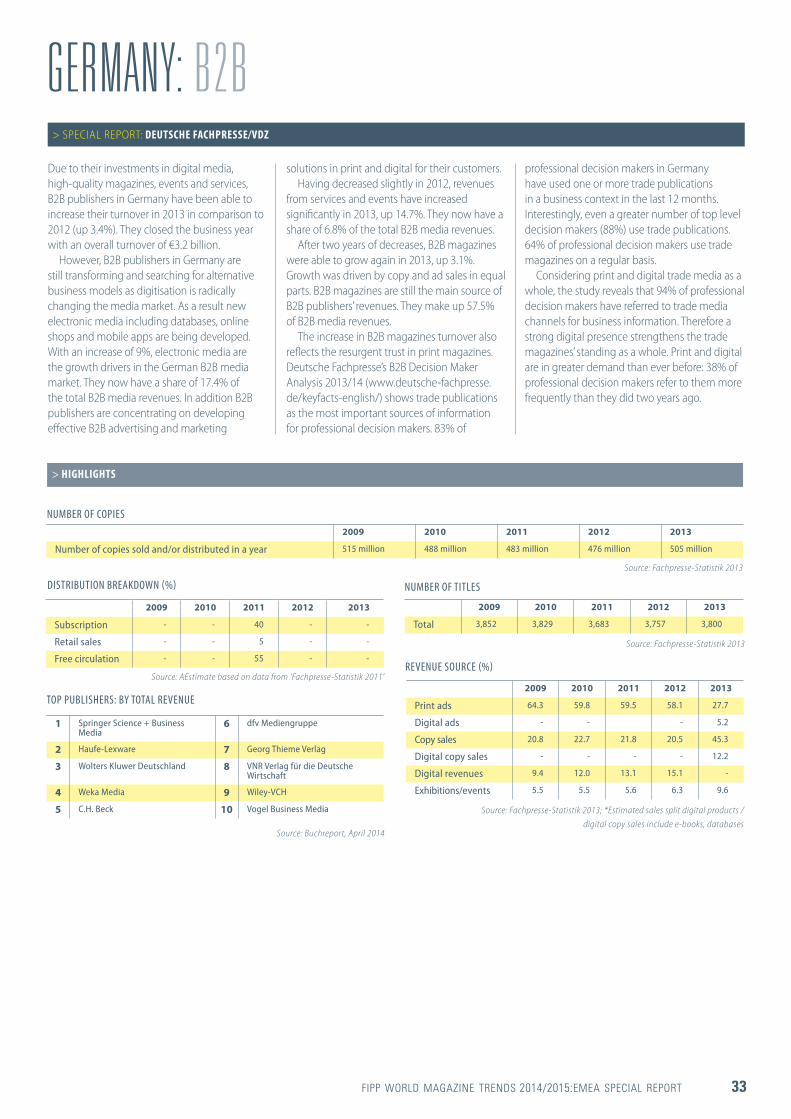
FIPP WORLD MAGAZINE TRENDS 2014/2015:EMEA SPECIAL REPORT 33
GERMANY: B2B
DISTRIBUTION BREAKDOWN (%)
2009 2010 2011 2012 2013
Subscription - - 40 - -
Retail sales - - 5 - -
Free circulation - - 55 - -
Source: AEstimate based on data from ‘Fachpresse-Statistik 2011’
NUMBER OF COPIES
NUMBER OF TITLES
2009 2010 2011 2012 2013
Number of copies sold and/or distributed in a year 515 million 488 million 483 million 476 million 505 million
2009 2010 2011 2012 2013
Total 3,852 3,829 3,683 3,757 3,800
Source: Fachpresse-Statistik 2013
Source: Fachpresse-Statistik 2013
TOP PUBLISHERS: BY TOTAL REVENUE
> HIGHLIGHTS
1 Springer Science + Business Media
6 dfv Mediengruppe
2 Haufe-Lexware 7 Georg Thieme Verlag
3 Wolters Kluwer Deutschland 8 VNR Verlag für die Deutsche Wirtschaft
4 Weka Media 9 Wiley-VCH
5 C.H. Beck 10 Vogel Business Media
Source: Buchreport, April 2014
REVENUE SOURCE (%)
2009 2010 2011 2012 2013
Print ads 64.3 59.8 59.5 58.1 27.7
Digital ads - - - 5.2
Copy sales 20.8 22.7 21.8 20.5 45.3
Digital copy sales - - - - 12.2
Digital revenues 9.4 12.0 13.1 15.1 -
Exhibitions/events 5.5 5.5 5.6 6.3 9.6
Source: Fachpresse-Statistik 2013; *Estimated sales split digital products / digital copy sales include e-books, databases
Due to their investments in digital media, high-quality magazines, events and services, B2B publishers in Germany have been able to increase their turnover in 2013 in comparison to 2012 (up 3.4%). They closed the business year with an overall turnover of €3.2 billion.
However, B2B publishers in Germany are still transforming and searching for alternative business models as digitisation is radically changing the media market. As a result new electronic media including databases, online shops and mobile apps are being developed. With an increase of 9%, electronic media are the growth drivers in the German B2B media market. They now have a share of 17.4% of the total B2B media revenues. In addition B2B publishers are concentrating on developing effective B2B advertising and marketing
solutions in print and digital for their customers.Having decreased slightly in 2012, revenues
from services and events have increased significantly in 2013, up 14.7%. They now have a share of 6.8% of the total B2B media revenues.
After two years of decreases, B2B magazines were able to grow again in 2013, up 3.1%. Growth was driven by copy and ad sales in equal parts. B2B magazines are still the main source of B2B publishers’ revenues. They make up 57.5% of B2B media revenues.
The increase in B2B magazines turnover also reflects the resurgent trust in print magazines. Deutsche Fachpresse’s B2B Decision Maker Analysis 2013/14 (www.deutsche-fachpresse.de/keyfacts-english/) shows trade publications as the most important sources of information for professional decision makers. 83% of
> SPECIAL REPORT: DEUTSCHE FACHPRESSE/VDZ
professional decision makers in Germany have used one or more trade publications in a business context in the last 12 months. Interestingly, even a greater number of top level decision makers (88%) use trade publications. 64% of professional decision makers use trade magazines on a regular basis.
Considering print and digital trade media as a whole, the study reveals that 94% of professional decision makers have referred to trade media channels for business information. Therefore a strong digital presence strengthens the trade magazines’ standing as a whole. Print and digital are in greater demand than ever before: 38% of professional decision makers refer to them more frequently than they did two years ago.

34 FIPP WORLD MAGAZINE TRENDS 2014/2015: EMEA SPECIAL REPORT
Seven years after the onset of the financial crisis in 2008, the Greek economy shows undeniable signs of recovery from the recession.
» In April 2014 Greece returned successfully to the bond markets, for the first time in four years
» Greek exports rose by 5.4% on a twelve month basis
» Greek banks have been able to raise capital in financial markets
» Tourism, which accounts for about one-sixth of the economy is set to reach a second consecutive record with an estimate of 18.5 million tourists visiting the country in 2014 (compared with 17.9 million in 2013), expecting to generate revenues of €13bn
» Foreign investments have been picking up and the nation’s privatisation programme has started to slowly bear fruit
Even consumer spending which has been dramatically hit by the recession, by tax rises and by pension and pay cuts, turned in a positive figure, rising by 0.8% in the first quarter of 2014.
Certainly all problems are far from been solved with unemployment remaining as high as 27% (one of the highest levels in the euro zone along with Spain). However, based on the above undeniable facts, the European Commission, one of Greece’s lenders, estimates that the country will emerge from recession in 2014 at a pace of around 0.6 % and will advance to growth of 2.9 % in 2015.
As expected, the media business is timidly following the general positive trend.
According to Media Services data, advertising revenues – the only revenue source for private media – decreased by 4.4% in 2013 (Jan-Dec) as compared to the same period in 2012.
Television showed the highest value increase of 4.1% with a further increase of its market share from 32% in 2012 to 35% in 2013.
Newspapers and radio have maintained their market share of 22% and 6% respectively with a renveue decrease of 1.3% for newspapers and an incremental revenue increase of 1.8% for radio.
The magazine sector suffered a considerable market share decrease from 31% in 2012 to 27% in 2013 and consequently it was the only media
which faced a substantial value decrease of 18.5% in 2013 versus 2012 (Jan-Dec data). This decrease was even higher for the stand-alone magazines (down 24.7%) as compared to the magazines distributed with newspaper editions (down 1%).
However this negative situation for magazines started showing a recovery trend in the last quarter of 2013, a tendency which was further confirmed in the first five months of 2014.
The Media Services data for the period Jan-May 2014 marks an increase of 8.2% in total advertising revenues versus the same period of 2013.
Television continues to absorb half of the total advertising spent with a market share of 51% but its increase in value (11%) is more in accordance with the other media.
In the same period, newspapers, with a relative market share decrease from 21% to 19%, is the only medium facing an advertising value decrease of 3.3%.
The radio sector achieved the highest value increase of 43.4% while maintaining its market share.
Magazines have finally succeeded in bucking the negative trend. In the first five month period of 2014, with the same market share of 24%, they showed a value increase of 5.6%. Furthermore, for the first time, the picture for independent magazines versus magazines distributed with newspapers is reversed, with the former enjoying an increase of 9.4% while the latter showed a decrease of 1.1%.
As in recent years , due to the recession, a considerable number of monthly magazines skipped or combined their January issues therefore the comparison of February-May data is more accurate and even more favourable for magazines with a 7% increase in 2014 compared with 2013 (11.6% of which for independent magazines ).
Magazines’ circulation is not immediately following this upward trend with a decline of 11% according to the official sales data from ARGOS Distribution Agency during 2013 (Jan-Dec period). However the five major categories (women, fitness, deco, tv guides and lifestyle gossip) show an increase of 7% in the same period.
NATIONAL ASSOCIATION
» Hellenic Union of Editors of Periodical Press (HUEPP) PUBLISHERS
» Attica Publications » De Agostini Hellas » Identity Media » Media2Day Publishing » Motor Press Hellas
> FIPP MEMBERS
> AT-A-GLANCE
SUPPLIERS
» Sappi Hellas
Capital: Athens Population: 10,775,557 (July 2014 est.) Median age: 43.5 years GDP: US$243.3 billion (2013 est.) Consumer prices: -0.8% (2013 est.) Currency: Euro (EUR) Official language: Greek (99%) Literacy rate: 97.3% SOURCE: CIA WORLD FACTBOOK (JULY 2014)
DIGITAL DATA
Internet penetration: 6,438,325 % of population: 60 SOURCE: INTERNET LIVE STATS (JULY 2014 est.)
Mobile penetration: 13,354,000 (2012) % of population: 124 SOURCE: CIA WORLD FACTBOOK (JULY 2014)
PRINT TAX
Standard rate: 6.5% Magazine, newspaper and book purchases: 6.5% Digital purchases: 23% Tax on advertising: 23%
SOURCE: FINANCIAL DEPARTMENT
ADVERTISING RESTRICTIONS
Tobacco Over-the-counter drugs
Key: BANNED BY LAW VOLUNTARILY STOPPED RESTRICTED BY LAW RESTRICTED VOLUNTARILY
SOURCE: MPG
GREECE
> SPECIAL REPORT: MAGAZINE PUBLISHERS OF GREECE
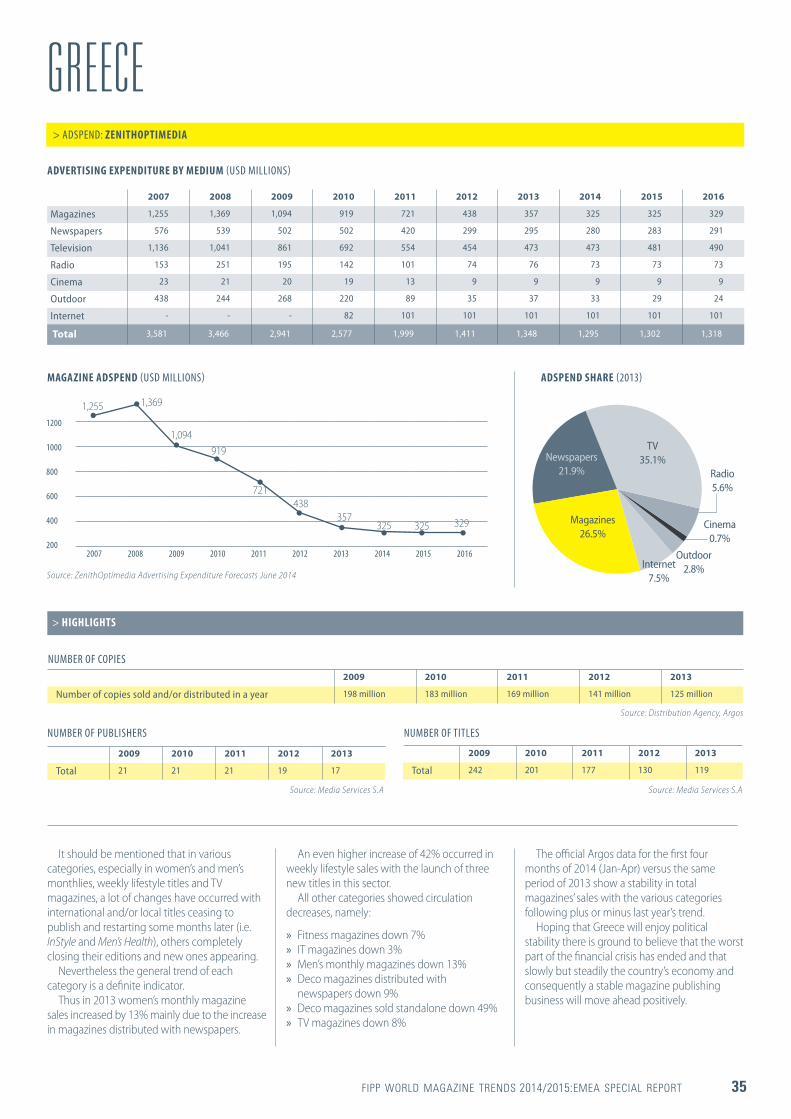
FIPP WORLD MAGAZINE TRENDS 2014/2015:EMEA SPECIAL REPORT 35
It should be mentioned that in various categories, especially in women’s and men’s monthlies, weekly lifestyle titles and TV magazines, a lot of changes have occurred with international and/or local titles ceasing to publish and restarting some months later (i.e. InStyle and Men’s Health), others completely closing their editions and new ones appearing.
Nevertheless the general trend of each category is a definite indicator.
Thus in 2013 women’s monthly magazine sales increased by 13% mainly due to the increase in magazines distributed with newspapers.
An even higher increase of 42% occurred in weekly lifestyle sales with the launch of three new titles in this sector.
All other categories showed circulation decreases, namely:
» Fitness magazines down 7% » IT magazines down 3% » Men’s monthly magazines down 13% » Deco magazines distributed with
newspapers down 9% » Deco magazines sold standalone down 49% » TV magazines down 8%
The official Argos data for the first four months of 2014 (Jan-Apr) versus the same period of 2013 show a stability in total magazines’ sales with the various categories following plus or minus last year’s trend.
Hoping that Greece will enjoy political stability there is ground to believe that the worst part of the financial crisis has ended and that slowly but steadily the country’s economy and consequently a stable magazine publishing business will move ahead positively.
GREECE> ADSPEND: ZENITHOPTIMEDIA
ADVERTISING EXPENDITURE BY MEDIUM (USD MILLIONS)
MAGAZINE ADSPEND (USD MILLIONS) ADSPEND SHARE (2013)
NUMBER OF COPIES
NUMBER OF PUBLISHERS NUMBER OF TITLES
2007 2008 2009 2010 2011 2012 2013 2014 2015 2016
Magazines 1,255 1,369 1,094 919 721 438 357 325 325 329
Newspapers 576 539 502 502 420 299 295 280 283 291
Television 1,136 1,041 861 692 554 454 473 473 481 490
Radio 153 251 195 142 101 74 76 73 73 73
Cinema 23 21 20 19 13 9 9 9 9 9
Outdoor 438 244 268 220 89 35 37 33 29 24
Internet - - - 82 101 101 101 101 101 101
Total 3,581 3,466 2,941 2,577 1,999 1,411 1,348 1,295 1,302 1,318
2009 2010 2011 2012 2013
Number of copies sold and/or distributed in a year 198 million 183 million 169 million 141 million 125 million
2009 2010 2011 2012 2013
Total 21 21 21 19 17
> HIGHLIGHTS
2009 2010 2011 2012 2013
Total 242 201 177 130 119
2007 2008 2009 2010 2011 2012 2013 2014 2015 2016
1200
1000
800
600
400
200
1,255
438
1,369
357
1,094
325
919
325
721
329
Source: ZenithOptimedia Advertising Expenditure Forecasts June 2014
Source: Distribution Agency, Argos
Source: Media Services S.ASource: Media Services S.A
Magazines 26.5%
Cinema 0.7%
Outdoor 2.8%
Newspapers 21.9% Radio
5.6%
Internet 7.5%
TV 35.1%
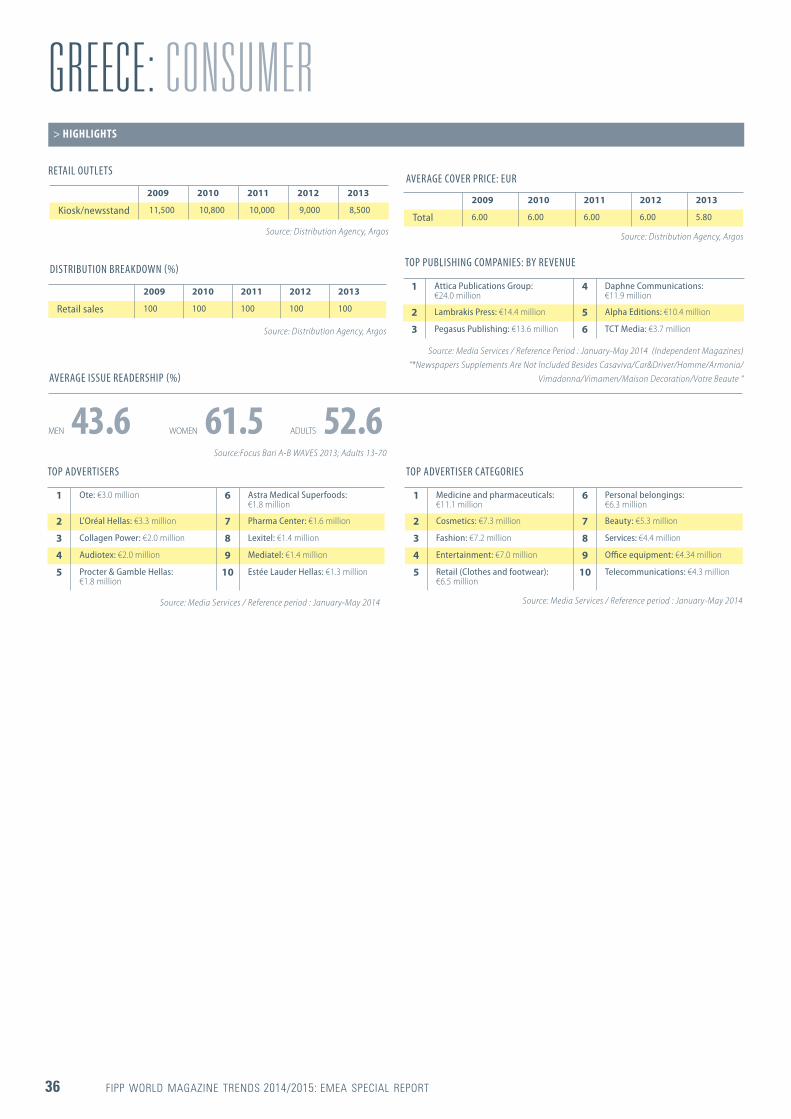
36 FIPP WORLD MAGAZINE TRENDS 2014/2015: EMEA SPECIAL REPORT
GREECE: CONSUMER
DISTRIBUTION BREAKDOWN (%)
TOP ADVERTISERS TOP ADVERTISER CATEGORIES
AVERAGE ISSUE READERSHIP (%)
AVERAGE COVER PRICE: EUR
TOP PUBLISHING COMPANIES: BY REVENUE
> HIGHLIGHTS
2009 2010 2011 2012 2013
Total 6.00 6.00 6.00 6.00 5.80
2009 2010 2011 2012 2013
Retail sales 100 100 100 100 100
1 Attica Publications Group: €24.0 million
4 Daphne Communications: €11.9 million
2 Lambrakis Press: €14.4 million 5 Alpha Editions: €10.4 million
3 Pegasus Publishing: €13.6 million 6 TCT Media: €3.7 million
1 Ote: €3.0 million 6 Astra Medical Superfoods: €1.8 million
2 L'Oréal Hellas: €3.3 million 7 Pharma Center: €1.6 million
3 Collagen Power: €2.0 million 8 Lexitel: €1.4 million
4 Audiotex: €2.0 million 9 Mediatel: €1.4 million
5 Procter & Gamble Hellas: €1.8 million
10 Estée Lauder Hellas: €1.3 million
1 Medicine and pharmaceuticals: €11.1 million
6 Personal belongings: €6.3 million
2 Cosmetics: €7.3 million 7 Beauty: €5.3 million
3 Fashion: €7.2 million 8 Services: €4.4 million
4 Entertainment: €7.0 million 9 Office equipment: €4.34 million
5 Retail (Clothes and footwear): €6.5 million
10 Telecommunications: €4.3 million
MEN 43.6 WOMEN 61.5 ADULTS 52.6
Source: Distribution Agency, Argos
Source: Media Services / Reference Period : January-May 2014 (Independent Magazines) “*Newspapers Supplements Are Not Included Besides Casaviva/Car&Driver/Homme/Armonia/
Vimadonna/Vimamen/Maison Decoration/Votre Beaute “
Source: Distribution Agency, Argos
Source:Focus Bari A-B WAVES 2013; Adults 13-70
Source: Media Services / Reference period : January-May 2014 Source: Media Services / Reference period : January-May 2014
RETAIL OUTLETS
2009 2010 2011 2012 2013
Kiosk/newsstand 11,500 10,800 10,000 9,000 8,500
Source: Distribution Agency, Argos
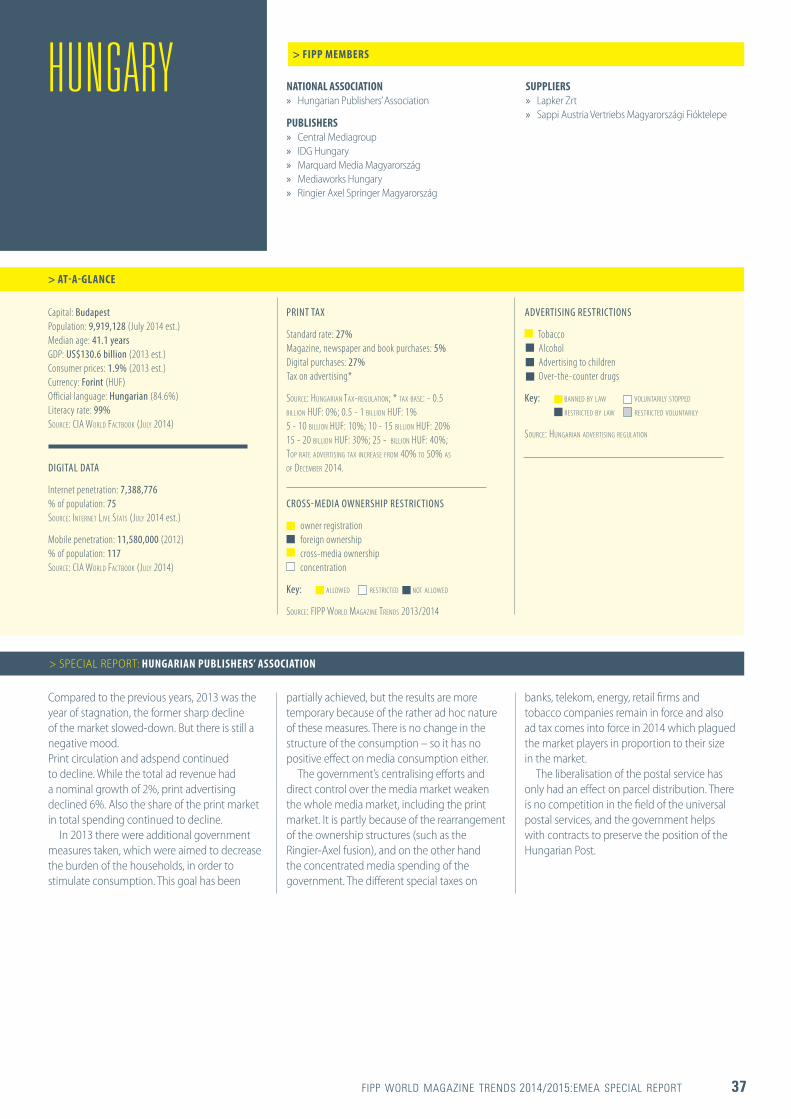
FIPP WORLD MAGAZINE TRENDS 2014/2015:EMEA SPECIAL REPORT 37
NATIONAL ASSOCIATION » Hungarian Publishers’ Association
PUBLISHERS » Central Mediagroup » IDG Hungary » Marquard Media Magyarország » Mediaworks Hungary » Ringier Axel Springer Magyarország
> FIPP MEMBERS
> AT-A-GLANCE
SUPPLIERS » Lapker Zrt » Sappi Austria Vertriebs Magyarországi Fióktelepe
Capital: Budapest Population: 9,919,128 (July 2014 est.) Median age: 41.1 years GDP: US$130.6 billion (2013 est.) Consumer prices: 1.9% (2013 est.) Currency: Forint (HUF) Official language: Hungarian (84.6%) Literacy rate: 99% SOURCE: CIA WORLD FACTBOOK (JULY 2014)
DIGITAL DATA
Internet penetration: 7,388,776 % of population: 75 SOURCE: INTERNET LIVE STATS (JULY 2014 est.)
Mobile penetration: 11,580,000 (2012) % of population: 117 SOURCE: CIA WORLD FACTBOOK (JULY 2014)
PRINT TAX
Standard rate: 27% Magazine, newspaper and book purchases: 5% Digital purchases: 27% Tax on advertising*
SOURCE: HUNGARIAN TAX-REGULATION; * TAX BASE: - 0.5 BILLION HUF: 0%; 0.5 - 1 BILLION HUF: 1% 5 - 10 BILLION HUF: 10%; 10 - 15 BILLION HUF: 20% 15 - 20 BILLION HUF: 30%; 25 - BILLION HUF: 40%; TOP RATE ADVERTISING TAX INCREASE FROM 40% TO 50% AS OF DECEMBER 2014.
CROSS-MEDIA OWNERSHIP RESTRICTIONS
owner registration foreign ownership cross-media ownership concentration
Key: ALLOWED RESTRICTED NOT ALLOWED
SOURCE: FIPP WORLD MAGAZINE TRENDS 2013/2014
ADVERTISING RESTRICTIONS
Tobacco Alcohol Advertising to children Over-the-counter drugs
Key: BANNED BY LAW VOLUNTARILY STOPPED RESTRICTED BY LAW RESTRICTED VOLUNTARILY
SOURCE: HUNGARIAN ADVERTISING REGULATION
HUNGARY
Compared to the previous years, 2013 was the year of stagnation, the former sharp decline of the market slowed-down. But there is still a negative mood.Print circulation and adspend continued to decline. While the total ad revenue had a nominal growth of 2%, print advertising declined 6%. Also the share of the print market in total spending continued to decline.
In 2013 there were additional government measures taken, which were aimed to decrease the burden of the households, in order to stimulate consumption. This goal has been
partially achieved, but the results are more temporary because of the rather ad hoc nature of these measures. There is no change in the structure of the consumption – so it has no positive effect on media consumption either.
The government’s centralising efforts and direct control over the media market weaken the whole media market, including the print market. It is partly because of the rearrangement of the ownership structures (such as the Ringier-Axel fusion), and on the other hand the concentrated media spending of the government. The different special taxes on
> SPECIAL REPORT: HUNGARIAN PUBLISHERS’ ASSOCIATION
banks, telekom, energy, retail firms and tobacco companies remain in force and also ad tax comes into force in 2014 which plagued the market players in proportion to their size in the market.
The liberalisation of the postal service has only had an effect on parcel distribution. There is no competition in the field of the universal postal services, and the government helps with contracts to preserve the position of the Hungarian Post.

38 FIPP WORLD MAGAZINE TRENDS 2014/2015: EMEA SPECIAL REPORT
HUNGARY
HUNGARY: CONSUMER
MAGAZINE ADSPEND (USD MILLIONS) ADSPEND SHARE (2013) ADSPEND BREAKDOWN (2013)
NUMBER OF COPIES
NUMBER OF PUBLISHERS
NUMBER OF CONSUMER MAGAZINE WEBSITES AVERAGE COVER PRICE: HUF
NUMBER OF TITLES
2009 2010 2011 2012 2013
Number of copies distributed in a year 240 million 222 million 211 million 203 million 185 million
Numbers of copies sold in a year 150 million 136 million 125 million 119 million 106 million
2009 2010 2011 2012 2013
Total 566 578 541 503 471
2009 2010 2011 2012 2013
Total - 155-170 150-200 200-220 200-220
> HIGHLIGHTS
2009 2010 2011 2012 2013
Total 1,621 1,641 1,659 1,542 1,495
2009 2010 2011 2012 2013
Total 257 261 270 271 274
2007 2008 2009 2010 2011 2012 2013 2014 2015 2016
1000
800
600
400
200
0
166
114
173
113
141
99
132
97
121
95
Source: ZenithOptimedia Advertising Expenditure Forecasts June 2014
Source: Lapker
Source: Lapker
Source: LapkerSource: Hungarian Publishers’ Association
Source: Hungarian Publishers’ Association
Magazines 14.2%
Outdoor 10.6%
Cinema 0.8%
Newspapers 14.7%
Radio 6.3%
Internet 21.4%
TV 32.0%
> ADSPEND: ZENITHOPTIMEDIA
ADVERTISING EXPENDITURE BY MEDIUM (USD MILLIONS)
2007 2008 2009 2010 2011 2012 2013 2014 2015 2016
Magazines 166 173 141 132 121 114 113 99 97 95
Newspapers 150 159 132 129 121 114 117 126 123 120
Television 319 325 273 273 261 248 255 265 273 272
Radio 36 40 37 39 44 48 50 50 51 51
Cinema 4 4 4 5 5 6 6 6 6 6
Outdoor 91 100 70 81 81 81 84 85 86 85
Internet 70 99 106 124 137 162 170 182 195 209
Total 835 901 763 782 771 774 795 814 830 839
Consumer magazines
84%
B2B magazines
16%
RETAIL OUTLETS
2009 2010 2011 2012 2013
All retail channels - - - - 645
Source: Hungarian Publishers’ Association
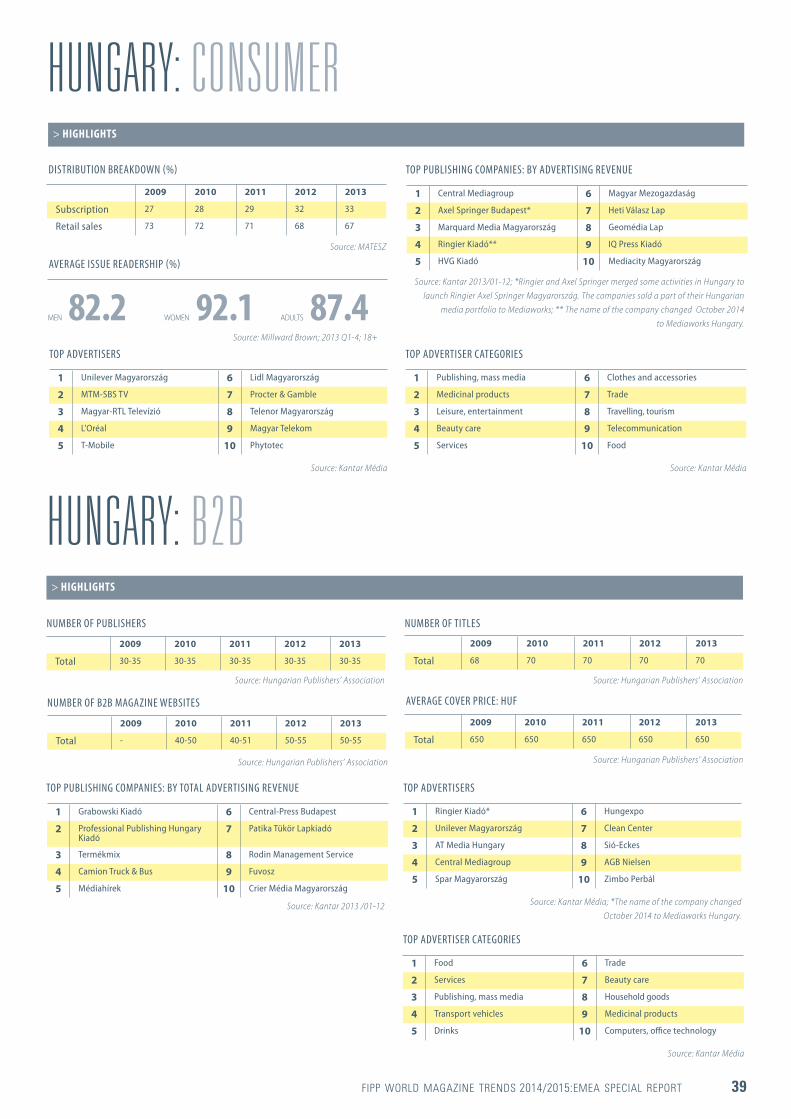
FIPP WORLD MAGAZINE TRENDS 2014/2015:EMEA SPECIAL REPORT 39
HUNGARY: CONSUMERDISTRIBUTION BREAKDOWN (%)
TOP ADVERTISERS TOP ADVERTISER CATEGORIES
AVERAGE ISSUE READERSHIP (%)
TOP PUBLISHING COMPANIES: BY ADVERTISING REVENUE
> HIGHLIGHTS
2009 2010 2011 2012 2013
Subscription 27 28 29 32 33
Retail sales 73 72 71 68 67
1 Central Mediagroup 6 Magyar Mezogazdaság
2 Axel Springer Budapest* 7 Heti Válasz Lap
3 Marquard Media Magyarország 8 Geomédia Lap
4 Ringier Kiadó** 9 IQ Press Kiadó
5 HVG Kiadó 10 Mediacity Magyarország
1 Unilever Magyarország 6 Lidl Magyarország
2 MTM-SBS TV 7 Procter & Gamble
3 Magyar-RTL Televízió 8 Telenor Magyarország
4 L'Oréal 9 Magyar Telekom
5 T-Mobile 10 Phytotec
1 Publishing, mass media 6 Clothes and accessories
2 Medicinal products 7 Trade
3 Leisure, entertainment 8 Travelling, tourism
4 Beauty care 9 Telecommunication
5 Services 10 Food
MEN 82.2 WOMEN 92.1 ADULTS 87.4 Source: Kantar 2013/01-12; *Ringier and Axel Springer merged some activities in Hungary to
launch Ringier Axel Springer Magyarország. The companies sold a part of their Hungarian media portfolio to Mediaworks; ** The name of the company changed October 2014
to Mediaworks Hungary.
Source: MATESZ
Source: Millward Brown; 2013 Q1-4; 18+
Source: Kantar Média Source: Kantar Média
HUNGARY: B2BNUMBER OF PUBLISHERS
NUMBER OF B2B MAGAZINE WEBSITES AVERAGE COVER PRICE: HUF
NUMBER OF TITLES
2009 2010 2011 2012 2013
Total 30-35 30-35 30-35 30-35 30-35
2009 2010 2011 2012 2013
Total - 40-50 40-51 50-55 50-55
> HIGHLIGHTS
2009 2010 2011 2012 2013
Total 68 70 70 70 70
2009 2010 2011 2012 2013
Total 650 650 650 650 650
Source: Hungarian Publishers’ Association
Source: Hungarian Publishers’ AssociationSource: Hungarian Publishers’ Association
Source: Hungarian Publishers’ Association
TOP PUBLISHING COMPANIES: BY TOTAL ADVERTISING REVENUE
1 Grabowski Kiadó 6 Central-Press Budapest
2 Professional Publishing Hungary Kiadó
7 Patika Tükör Lapkiadó
3 Termékmix 8 Rodin Management Service
4 Camion Truck & Bus 9 Fuvosz
5 Médiahírek 10 Crier Média Magyarország
Source: Kantar 2013 /01-12
TOP ADVERTISERS
TOP ADVERTISER CATEGORIES
1 Ringier Kiadó* 6 Hungexpo
2 Unilever Magyarország 7 Clean Center
3 AT Media Hungary 8 Sió-Eckes
4 Central Mediagroup 9 AGB Nielsen
5 Spar Magyarország 10 Zimbo Perbál
1 Food 6 Trade
2 Services 7 Beauty care
3 Publishing, mass media 8 Household goods
4 Transport vehicles 9 Medicinal products
5 Drinks 10 Computers, office technology
Source: Kantar Média; *The name of the company changed October 2014 to Mediaworks Hungary.
Source: Kantar Média

40 FIPP WORLD MAGAZINE TRENDS 2014/2015: EMEA SPECIAL REPORT
With all the economic fundamentals pointing in the right direction, advertising spend in Ireland is likely to rebound by 2.7% in 2014 according to the June 2014 Advertising Expenditure Forecasts, which is published by media agency ZenithOptimedia.
It is the first growth the domestic advertising market has experienced since 2007 and although it is still modest, it is the second highest level of growth in Europe, with only Belgium likely to achieve a growth rate greater than Ireland’s. The agency is also forecasting that the Irish ad market will continue to grow over the coming years with forecasts of 4.5% and 6.6% for 2015 and 2016 respectively.
Not surprisingly, digital advertising, specifically mobile, will drive this growth. Consumers are spending more and more time online and advertisers and marketers are becoming more confident in its role within the media mix.
Internet adspend in Ireland will reach the same levels as TV for the first time ever in 2014 according to ZenithOptimedia. By 2015, however, online adspend in Ireland will overtake TV and by 2016 it will account for a whopping 32% of advertising spend, a significant increase on 2013, when it accounted for 25.5%.
Magazine brands work well online as it means they can now communicate with their target audience on a continuous basis. Online is not only providing magazine publishers with an alternative advertising source but it is also a means of promoting the printed product, resulting in extra copy sales when it hits the shelf.
While magazine publishers need to be active on the online front, major questions about returns from digital investments still remain. Digital revenues are growing, particularly for B2B titles, but still haven’t made up for the drop-off in print revenues at many media companies. For publishers that have been trying to protect their legacy print business while investing cautiously in digital, decisions on when and how to shift more resources toward growth channels are taking on greater urgency. Most publishers now have a diversified portfolio of products and
services that generate either advertiser or reader revenue. One high-growth area of marketing services is native advertising. As brands’ interest in native advertising grows, publishers have an opportunity to offer services not just for hosting these native ads, but for helping brands develop the content that goes into them. Publishers are also continuing to explore new ways to “skin the pig” – maximising their editorial by repurposing content in different formats for different channels.
The prevailing economic climate is still challenging enough for publishers and they have also had to invest major time and resources fending off further threats to the industry. As well as rising costs in paper, print and distribution they have had to deal with increases in postal rates. The national postal service not only increased its rates by 13% and 8% in July 2014 (depending on the weight band) but it also introduced a new requirement for all Publication Services customers to produce a “manifest” that reflects the schedule of their publication distribution. This introduction of zonal pricing was a further attack on magazine businesses adding further increases in costs to the actual postal rates as well as extra costs for additional administration.
However in spite of intense competition on the newsstand from imported titles the Irish magazine market is doing well and the latest ABC figures show Irish titles holding their own. It’s an exciting time for the magazine business and Irish magazines continue to dominate their respective markets.
Innovative new product launches including Taste from RTE Guide and BASH from Image Publications, and exciting developments on digital platforms enable us to deliver the highest quality content to our audiences and advertisers across every dimension. With the market showing signs of positive momentum and 2014 anticipated to be the year when the market will finally move out of recession, we look forward to new launches and more brand extensions from our members.
NATIONAL ASSOCIATION
» Magazines Ireland
> FIPP MEMBERS
> AT-A-GLANCE
Capital: Dublin Population: 4,832,765 (July 2014 est.) Median age: 35.7 years GDP: US$220.9 billion (2013 est.) Consumer prices: 0.6% (2013 est.) Currency: Euro (EUR) Official language: English, Irish (Gaelic) Literacy rate: 99% SOURCE: CIA WORLD FACTBOOK (JULY 2014)
DIGITAL DATA
Internet penetration: 3,817,491 % of population: 79 SOURCE: INTERNET LIVE STATS (JULY 2014 EST.)
Mobile penetration: 4,906,000 (2012) % of population: 102 SOURCE: CIA WORLD FACTBOOK (JULY 2014)
PRINT TAX
> VAT Standard rate: 23% Magazine and newspaper purchases: 9%; Books: 0% Digital purchases: 23% Tax on advertising: 23%
SOURCE: MAGAZINES IRELAND
CROSS-MEDIA OWNERSHIP RESTRICTIONS
owner registration foreign ownership cross-media ownership concentration
Key: ALLOWED RESTRICTED NOT ALLOWED
SOURCE: MAGAZINES IRELAND
ADVERTISING RESTRICTIONS
Tobacco Alcohol Advertising to children Over-the-counter drugs
Key: BANNED BY LAW VOLUNTARILY STOPPED RESTRICTED BY LAW RESTRICTED VOLUNTARILY
SOURCE: MAGAZINES IRELAND
IRELAND
> SPECIAL REPORT: MAGAZINES IRELAND
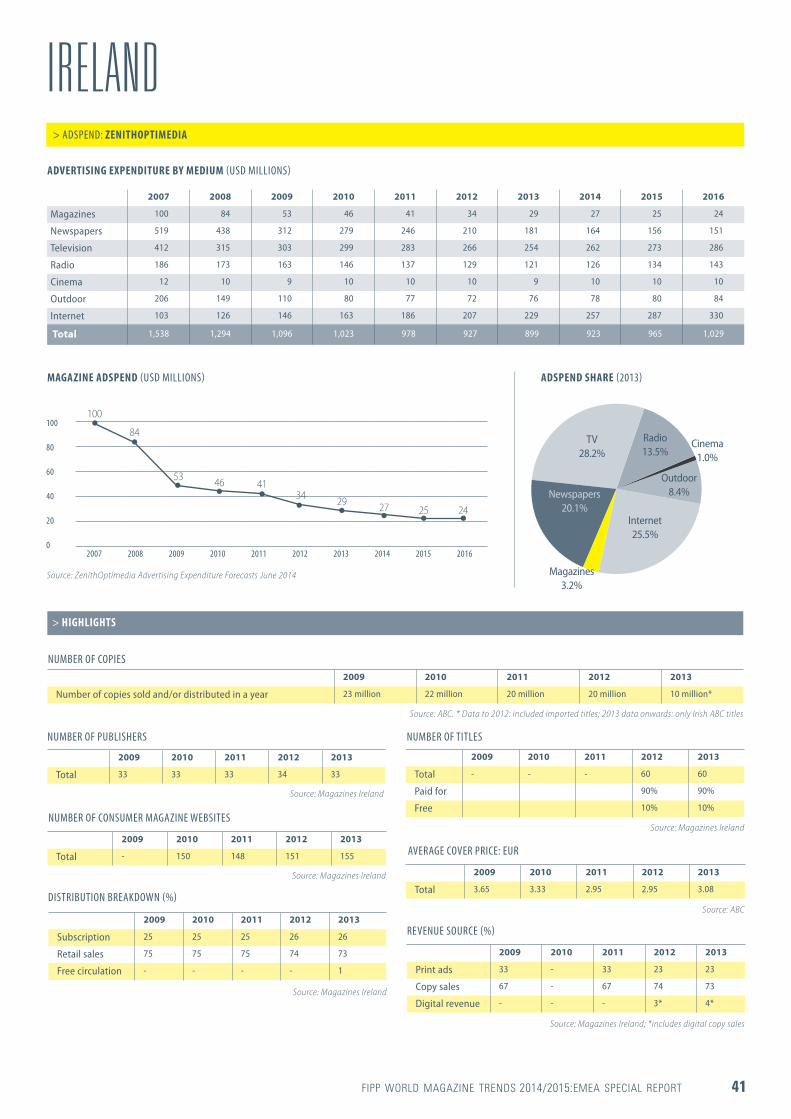
FIPP WORLD MAGAZINE TRENDS 2014/2015:EMEA SPECIAL REPORT 41
IRELAND> ADSPEND: ZENITHOPTIMEDIA
ADVERTISING EXPENDITURE BY MEDIUM (USD MILLIONS)
MAGAZINE ADSPEND (USD MILLIONS) ADSPEND SHARE (2013)
NUMBER OF COPIES
NUMBER OF PUBLISHERS NUMBER OF TITLES
2007 2008 2009 2010 2011 2012 2013 2014 2015 2016
Magazines 100 84 53 46 41 34 29 27 25 24
Newspapers 519 438 312 279 246 210 181 164 156 151
Television 412 315 303 299 283 266 254 262 273 286
Radio 186 173 163 146 137 129 121 126 134 143
Cinema 12 10 9 10 10 10 9 10 10 10
Outdoor 206 149 110 80 77 72 76 78 80 84
Internet 103 126 146 163 186 207 229 257 287 330
Total 1,538 1,294 1,096 1,023 978 927 899 923 965 1,029
2009 2010 2011 2012 2013
Number of copies sold and/or distributed in a year 23 million 22 million 20 million 20 million 10 million*
2009 2010 2011 2012 2013
Total 33 33 33 34 33
> HIGHLIGHTS
2009 2010 2011 2012 2013
Total - - - 60 60
Paid for 90% 90%
Free 10% 10%
2007 2008 2009 2010 2011 2012 2013 2014 2015 2016
100
80
60
40
20
0
100
34
84
29
53
27
46
25
41
24
Source: ZenithOptimedia Advertising Expenditure Forecasts June 2014
Source: ABC. * Data to 2012: included imported titles; 2013 data onwards: only Irish ABC titles
Source: Magazines Ireland
Source: Magazines Ireland
Magazines 3.2%
Cinema 1.0%
Outdoor 8.4%Newspapers
20.1%
Radio 13.5%
Internet 25.5%
TV 28.2%
DISTRIBUTION BREAKDOWN (%)
AVERAGE COVER PRICE: EUR
2009 2010 2011 2012 2013
Total 3.65 3.33 2.95 2.95 3.08
2009 2010 2011 2012 2013
Subscription 25 25 25 26 26
Retail sales 75 75 75 74 73
Free circulation - - - - 1
Source: ABC
Source: Magazines Ireland
NUMBER OF CONSUMER MAGAZINE WEBSITES
2009 2010 2011 2012 2013
Total - 150 148 151 155
Source: Magazines Ireland
REVENUE SOURCE (%)
2009 2010 2011 2012 2013
Print ads 33 - 33 23 23
Copy sales 67 - 67 74 73
Digital revenue - - - 3* 4*
Source: Magazines Ireland; *includes digital copy sales
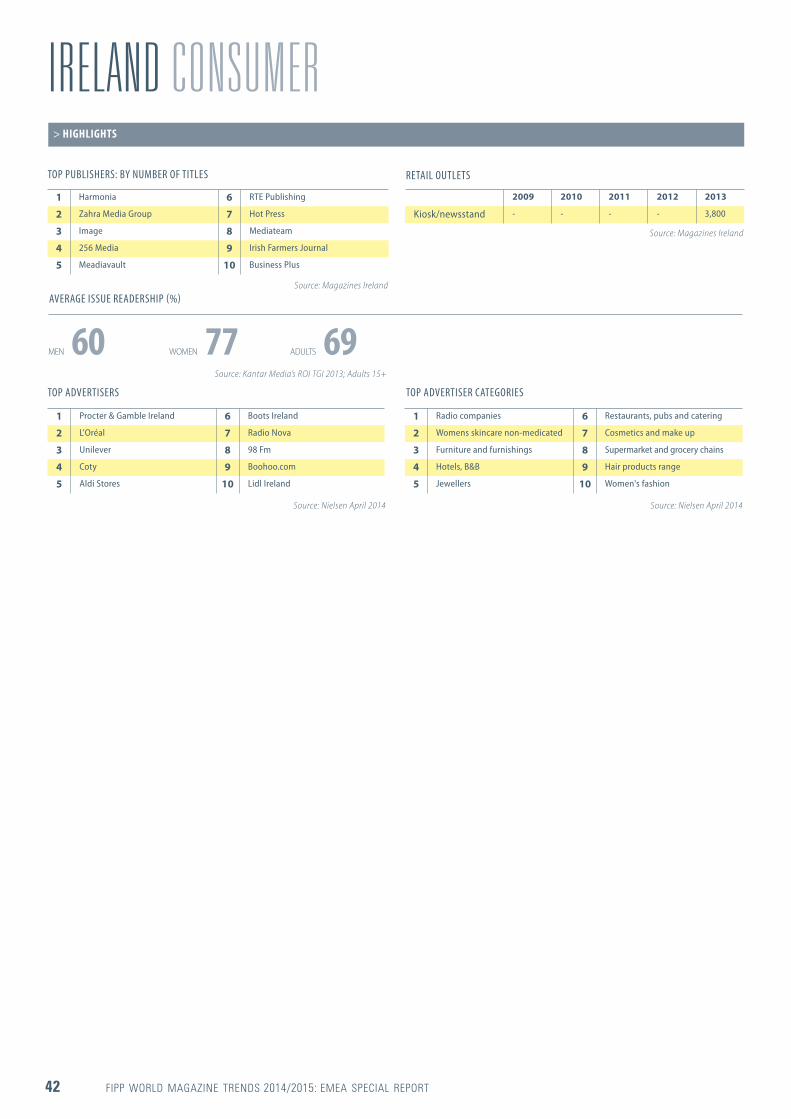
42 FIPP WORLD MAGAZINE TRENDS 2014/2015: EMEA SPECIAL REPORT
IRELAND CONSUMER
TOP ADVERTISERS
TOP PUBLISHERS: BY NUMBER OF TITLES
TOP ADVERTISER CATEGORIES
AVERAGE ISSUE READERSHIP (%)
> HIGHLIGHTS
1 Procter & Gamble Ireland 6 Boots Ireland
2 L'Oréal 7 Radio Nova
3 Unilever 8 98 Fm
4 Coty 9 Boohoo.com
5 Aldi Stores 10 Lidl Ireland
1 Radio companies 6 Restaurants, pubs and catering
2 Womens skincare non-medicated 7 Cosmetics and make up
3 Furniture and furnishings 8 Supermarket and grocery chains
4 Hotels, B&B 9 Hair products range
5 Jewellers 10 Women's fashion
MEN 60 WOMEN 77 ADULTS 69
Source: Kantar Media’s ROI TGI 2013; Adults 15+
Source: Nielsen April 2014 Source: Nielsen April 2014
1 Harmonia 6 RTE Publishing
2 Zahra Media Group 7 Hot Press
3 Image 8 Mediateam
4 256 Media 9 Irish Farmers Journal
5 Meadiavault 10 Business Plus
Source: Magazines Ireland
RETAIL OUTLETS
2009 2010 2011 2012 2013
Kiosk/newsstand - - - - 3,800
Source: Magazines Ireland
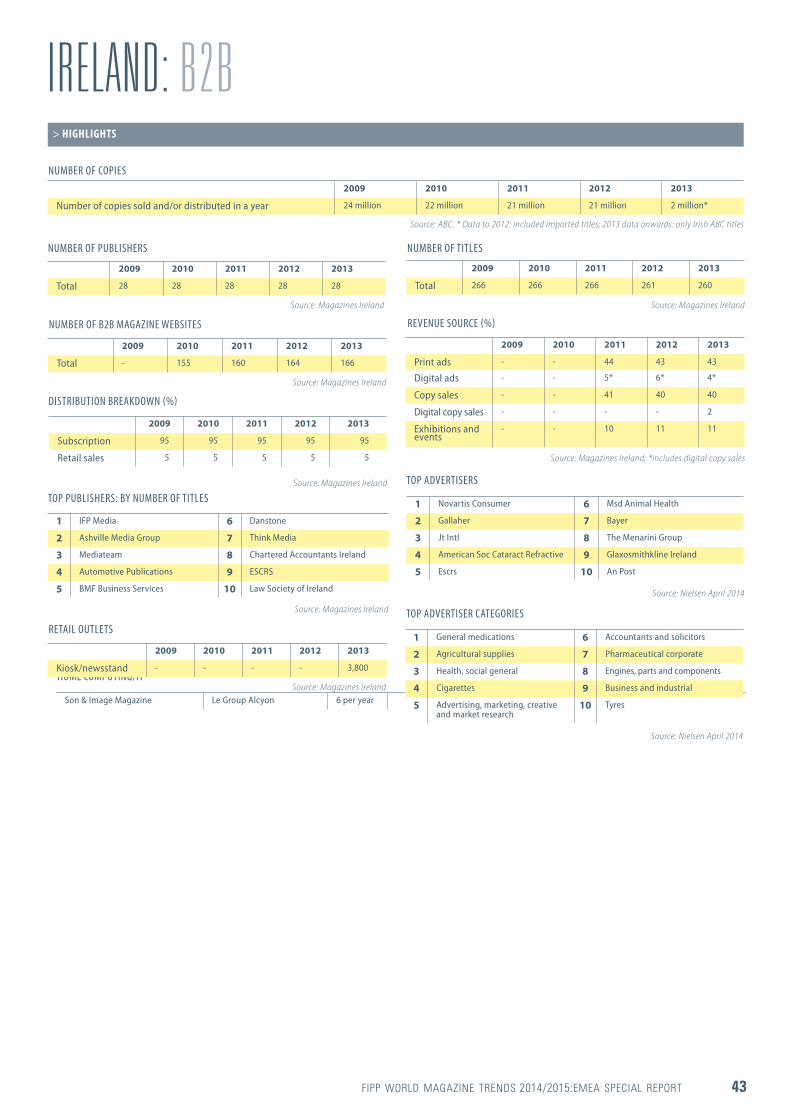
FIPP WORLD MAGAZINE TRENDS 2014/2015:EMEA SPECIAL REPORT 43
HOME COMPUTING/IT
Son & Image Magazine Le Group Alcyon 6 per year 5,000 No - 6.95 Yes son-et-image.com
IRELAND: B2BNUMBER OF COPIES
NUMBER OF PUBLISHERS NUMBER OF TITLES
2009 2010 2011 2012 2013
Number of copies sold and/or distributed in a year 24 million 22 million 21 million 21 million 2 million*
2009 2010 2011 2012 2013
Total 28 28 28 28 28
> HIGHLIGHTS
2009 2010 2011 2012 2013
Total 266 266 266 261 260
Source: ABC. * Data to 2012: included imported titles; 2013 data onwards: only Irish ABC titles
Source: Magazines IrelandSource: Magazines Ireland
DISTRIBUTION BREAKDOWN (%)
2009 2010 2011 2012 2013
Subscription 95 95 95 95 95
Retail sales 5 5 5 5 5
Source: Magazines Ireland
NUMBER OF B2B MAGAZINE WEBSITES
2009 2010 2011 2012 2013
Total - 155 160 164 166
Source: Magazines Ireland
REVENUE SOURCE (%)
2009 2010 2011 2012 2013
Print ads - - 44 43 43
Digital ads - - 5* 6* 4*
Copy sales - - 41 40 40
Digital copy sales - - - - 2
Exhibitions and events
- - 10 11 11
Source: Magazines Ireland; *includes digital copy sales
TOP PUBLISHERS: BY NUMBER OF TITLESTOP ADVERTISERS
1 Novartis Consumer 6 Msd Animal Health
2 Gallaher 7 Bayer
3 Jt Intl 8 The Menarini Group
4 American Soc Cataract Refractive 9 Glaxosmithkline Ireland
5 Escrs 10 An Post
Source: Nielsen April 2014
TOP ADVERTISER CATEGORIES
1 General medications 6 Accountants and solicitors
2 Agricultural supplies 7 Pharmaceutical corporate
3 Health, social general 8 Engines, parts and components
4 Cigarettes 9 Business and industrial
5 Advertising, marketing, creative and market research
10 Tyres
Source: Nielsen April 2014
1 IFP Media 6 Danstone
2 Ashville Media Group 7 Think Media
3 Mediateam 8 Chartered Accountants Ireland
4 Automotive Publications 9 ESCRS
5 BMF Business Services 10 Law Society of Ireland
Source: Magazines Ireland
RETAIL OUTLETS
2009 2010 2011 2012 2013
Kiosk/newsstand - - - - 3,800
Source: Magazines Ireland
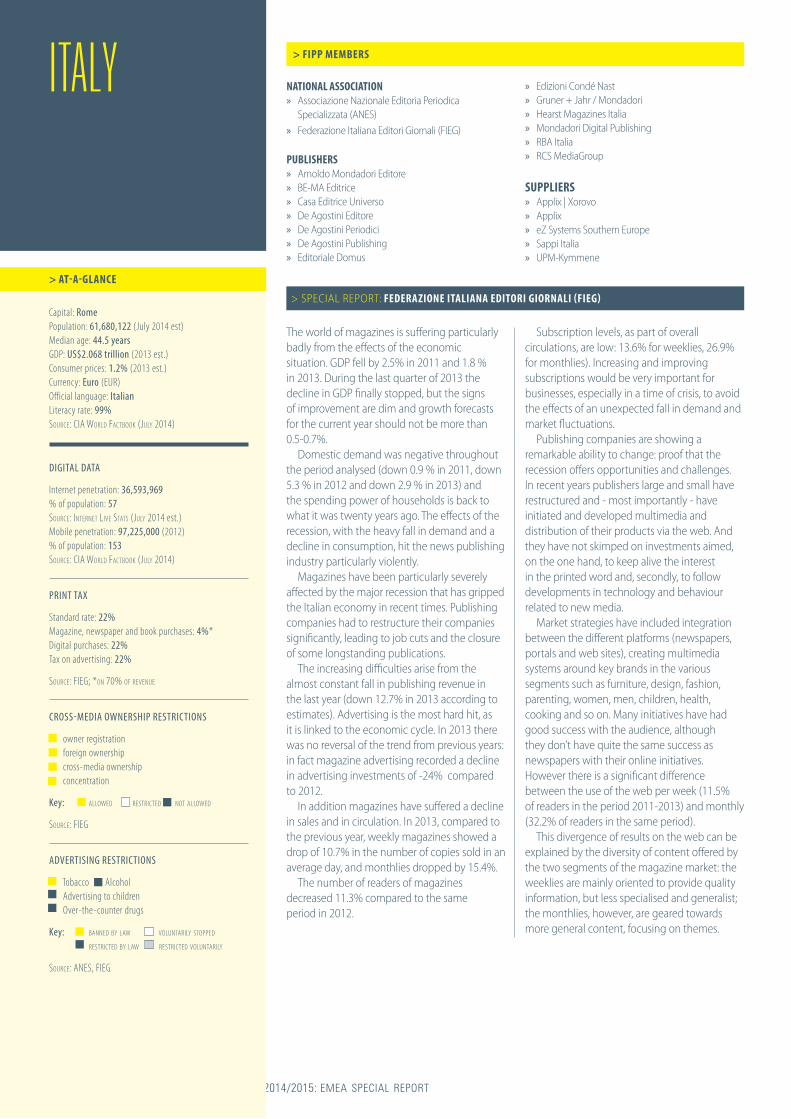
44 FIPP WORLD MAGAZINE TRENDS 2014/2015: EMEA SPECIAL REPORT
The world of magazines is suffering particularly badly from the effects of the economic situation. GDP fell by 2.5% in 2011 and 1.8 % in 2013. During the last quarter of 2013 the decline in GDP finally stopped, but the signs of improvement are dim and growth forecasts for the current year should not be more than 0.5-0.7%.
Domestic demand was negative throughout the period analysed (down 0.9 % in 2011, down 5.3 % in 2012 and down 2.9 % in 2013) and the spending power of households is back to what it was twenty years ago. The effects of the recession, with the heavy fall in demand and a decline in consumption, hit the news publishing industry particularly violently.
Magazines have been particularly severely affected by the major recession that has gripped the Italian economy in recent times. Publishing companies had to restructure their companies significantly, leading to job cuts and the closure of some longstanding publications.
The increasing difficulties arise from the almost constant fall in publishing revenue in the last year (down 12.7% in 2013 according to estimates). Advertising is the most hard hit, as it is linked to the economic cycle. In 2013 there was no reversal of the trend from previous years: in fact magazine advertising recorded a decline in advertising investments of -24% compared to 2012.
In addition magazines have suffered a decline in sales and in circulation. In 2013, compared to the previous year, weekly magazines showed a drop of 10.7% in the number of copies sold in an average day, and monthlies dropped by 15.4%.
The number of readers of magazines decreased 11.3% compared to the same period in 2012.
Subscription levels, as part of overall circulations, are low: 13.6% for weeklies, 26.9% for monthlies). Increasing and improving subscriptions would be very important for businesses, especially in a time of crisis, to avoid the effects of an unexpected fall in demand and market fluctuations.
Publishing companies are showing a remarkable ability to change: proof that the recession offers opportunities and challenges. In recent years publishers large and small have restructured and - most importantly - have initiated and developed multimedia and distribution of their products via the web. And they have not skimped on investments aimed, on the one hand, to keep alive the interest in the printed word and, secondly, to follow developments in technology and behaviour related to new media.
Market strategies have included integration between the different platforms (newspapers, portals and web sites), creating multimedia systems around key brands in the various segments such as furniture, design, fashion, parenting, women, men, children, health, cooking and so on. Many initiatives have had good success with the audience, although they don’t have quite the same success as newspapers with their online initiatives. However there is a significant difference between the use of the web per week (11.5% of readers in the period 2011-2013) and monthly (32.2% of readers in the same period).
This divergence of results on the web can be explained by the diversity of content offered by the two segments of the magazine market: the weeklies are mainly oriented to provide quality information, but less specialised and generalist; the monthlies, however, are geared towards more general content, focusing on themes.
NATIONAL ASSOCIATION » Associazione Nazionale Editoria Periodica
Specializzata (ANES) » Federazione Italiana Editori Giornali (FIEG)
PUBLISHERS » Arnoldo Mondadori Editore » BE-MA Editrice » Casa Editrice Universo » De Agostini Editore » De Agostini Periodici » De Agostini Publishing » Editoriale Domus
> FIPP MEMBERS
> AT-A-GLANCE
» Edizioni Condé Nast » Gruner + Jahr / Mondadori » Hearst Magazines Italia » Mondadori Digital Publishing » RBA Italia » RCS MediaGroup
SUPPLIERS » Applix | Xorovo » Applix » eZ Systems Southern Europe » Sappi Italia » UPM-Kymmene
Capital: Rome Population: 61,680,122 (July 2014 est) Median age: 44.5 years GDP: US$2.068 trillion (2013 est.) Consumer prices: 1.2% (2013 est.) Currency: Euro (EUR) Official language: Italian Literacy rate: 99% SOURCE: CIA WORLD FACTBOOK (JULY 2014)
DIGITAL DATA
Internet penetration: 36,593,969 % of population: 57 SOURCE: INTERNET LIVE STATS (JULY 2014 est.) Mobile penetration: 97,225,000 (2012) % of population: 153 SOURCE: CIA WORLD FACTBOOK (JULY 2014)
PRINT TAX
Standard rate: 22% Magazine, newspaper and book purchases: 4%* Digital purchases: 22% Tax on advertising: 22%
SOURCE: FIEG; *ON 70% OF REVENUE
CROSS-MEDIA OWNERSHIP RESTRICTIONS
owner registration foreign ownership cross-media ownership concentration
Key: ALLOWED RESTRICTED NOT ALLOWED
SOURCE: FIEG
ADVERTISING RESTRICTIONS
Tobacco Alcohol Advertising to children Over-the-counter drugs
Key: BANNED BY LAW VOLUNTARILY STOPPED RESTRICTED BY LAW RESTRICTED VOLUNTARILY
SOURCE: ANES, FIEG
ITALY
> SPECIAL REPORT: FEDERAZIONE ITALIANA EDITORI GIORNALI (FIEG)
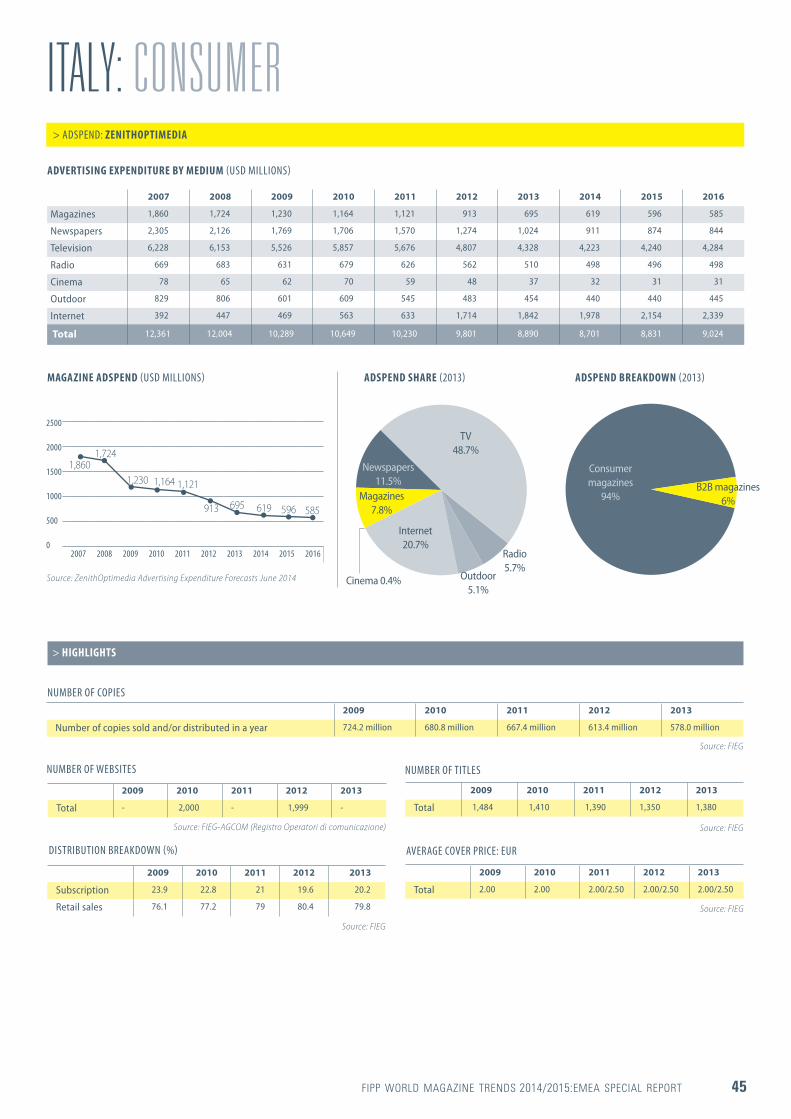
FIPP WORLD MAGAZINE TRENDS 2014/2015:EMEA SPECIAL REPORT 45
ITALY: CONSUMER> ADSPEND: ZENITHOPTIMEDIA
ADVERTISING EXPENDITURE BY MEDIUM (USD MILLIONS)
MAGAZINE ADSPEND (USD MILLIONS) ADSPEND SHARE (2013) ADSPEND BREAKDOWN (2013)
DISTRIBUTION BREAKDOWN (%)
2007 2008 2009 2010 2011 2012 2013 2014 2015 2016
Magazines 1,860 1,724 1,230 1,164 1,121 913 695 619 596 585
Newspapers 2,305 2,126 1,769 1,706 1,570 1,274 1,024 911 874 844
Television 6,228 6,153 5,526 5,857 5,676 4,807 4,328 4,223 4,240 4,284
Radio 669 683 631 679 626 562 510 498 496 498
Cinema 78 65 62 70 59 48 37 32 31 31
Outdoor 829 806 601 609 545 483 454 440 440 445
Internet 392 447 469 563 633 1,714 1,842 1,978 2,154 2,339
Total 12,361 12,004 10,289 10,649 10,230 9,801 8,890 8,701 8,831 9,024
2009 2010 2011 2012 2013
Subscription 23.9 22.8 21 19.6 20.2
Retail sales 76.1 77.2 79 80.4 79.8
2007 2008 2009 2010 2011 2012 2013 2014 2015 2016
2500
2000
1500
1000
500
0
1,860
913
1,724
695
1,230
619
1,164
596
1,121
585
Source: ZenithOptimedia Advertising Expenditure Forecasts June 2014
Source: FIEG
Magazines 7.8%
Cinema 0.4%
Newspapers 11.5%
Radio 5.7%
Outdoor 5.1%
Internet 20.7%
TV 48.7%
NUMBER OF COPIES
AVERAGE COVER PRICE: EUR
NUMBER OF TITLES
2009 2010 2011 2012 2013
Number of copies sold and/or distributed in a year 724.2 million 680.8 million 667.4 million 613.4 million 578.0 million
2009 2010 2011 2012 2013
Total 1,484 1,410 1,390 1,350 1,380
2009 2010 2011 2012 2013
Total 2.00 2.00 2.00/2.50 2.00/2.50 2.00/2.50
Source: FIEG
Source: FIEG
Source: FIEG
> HIGHLIGHTS
Consumer magazines
94%B2B magazines
6%
NUMBER OF WEBSITES
2009 2010 2011 2012 2013
Total - 2,000 - 1,999 -
Source: FIEG-AGCOM (Registro Operatori di comunicazione)
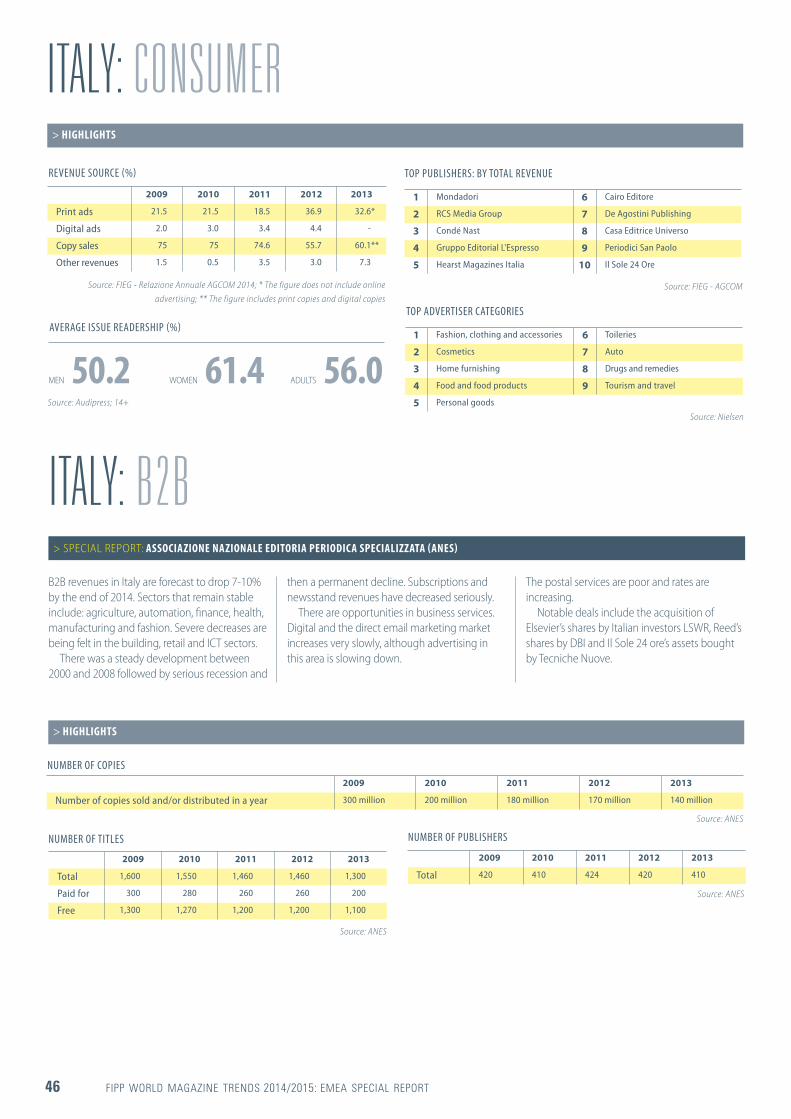
46 FIPP WORLD MAGAZINE TRENDS 2014/2015: EMEA SPECIAL REPORT
ITALY: CONSUMERTOP PUBLISHERS: BY TOTAL REVENUE
TOP ADVERTISER CATEGORIESAVERAGE ISSUE READERSHIP (%)
> HIGHLIGHTS
1 Mondadori 6 Cairo Editore
2 RCS Media Group 7 De Agostini Publishing
3 Condé Nast 8 Casa Editrice Universo
4 Gruppo Editorial L'Espresso 9 Periodici San Paolo
5 Hearst Magazines Italia 10 Il Sole 24 Ore
1 Fashion, clothing and accessories 6 Toileries
2 Cosmetics 7 Auto
3 Home furnishing 8 Drugs and remedies
4 Food and food products 9 Tourism and travel
5 Personal goods
MEN 50.2 WOMEN 61.4 ADULTS 56.0 Source: Audipress; 14+
Source: FIEG - AGCOM
Source: Nielsen
REVENUE SOURCE (%)
2009 2010 2011 2012 2013
Print ads 21.5 21.5 18.5 36.9 32.6*
Digital ads 2.0 3.0 3.4 4.4 -
Copy sales 75 75 74.6 55.7 60.1**
Other revenues 1.5 0.5 3.5 3.0 7.3
Source: FIEG - Relazione Annuale AGCOM 2014; * The figure does not include online advertising; ** The figure includes print copies and digital copies
ITALY: B2BB2B revenues in Italy are forecast to drop 7-10% by the end of 2014. Sectors that remain stable include: agriculture, automation, finance, health, manufacturing and fashion. Severe decreases are being felt in the building, retail and ICT sectors.
There was a steady development between 2000 and 2008 followed by serious recession and
then a permanent decline. Subscriptions and newsstand revenues have decreased seriously.
There are opportunities in business services. Digital and the direct email marketing market increases very slowly, although advertising in this area is slowing down.
The postal services are poor and rates are increasing.
Notable deals include the acquisition of Elsevier’s shares by Italian investors LSWR, Reed’s shares by DBI and Il Sole 24 ore’s assets bought by Tecniche Nuove.
> SPECIAL REPORT: ASSOCIAZIONE NAZIONALE EDITORIA PERIODICA SPECIALIZZATA (ANES)
NUMBER OF COPIES2009 2010 2011 2012 2013
Number of copies sold and/or distributed in a year 300 million 200 million 180 million 170 million 140 million
Source: ANES
NUMBER OF TITLES
2009 2010 2011 2012 2013
Total 1,600 1,550 1,460 1,460 1,300
Paid for 300 280 260 260 200
Free 1,300 1,270 1,200 1,200 1,100
Source: ANES
> HIGHLIGHTS
NUMBER OF PUBLISHERS
2009 2010 2011 2012 2013
Total 420 410 424 420 410
Source: ANES

FIPP WORLD MAGAZINE TRENDS 2014/2015:EMEA SPECIAL REPORT 47
ITALY: B2B
REVENUE SOURCES (%)
2009 2010 2011 2012 2013
Print ads 45 44 39 37 36
Copy sales 26 25 34 34 34
Digital revenues 7 9 10 10 11
Exhibitions/events 22 22 16 16 16
Other revenues - - 1 3 3
Source: ANES
AVERAGE COVER PRICE: EUR
2009 2010 2011 2012 2013
Total 5.00 5.00 5.00 5.00 5.00
Source: ANES
TOP PUBLISHERS: BY ADVERTISING REVENUE
1 Tecniche Nuove 6 DBInformation
2 Edizioni Master 7 Edisport Editoriale
3 RCS Media Group 8 Foto Edizioni
4 Edra Lswr 9 Sprea Edizioni
5 Fiera Milano Media 10 Edizioni Riza
Source: ANESTOP ADVERTISER CATEGORIES
1 Medical 6 Sport
2 Industry 7 Automotive
3 Food 8 Tourism & travel
4 Finance 9 Building
5 Agriculture 10 Chemical
Source: ANES
NUMBER OF WEBSITES
2009 2010 2011 2012 2013
Total - 1,889 1,900 1,950 2,100
Source: ANES
DISTRIBUTION BREAKDOWN (%)
2009 2010 2011 2012 2013
Subscription - - 10 10 13
Retail sales - - 25 25 24
Free circulation - - 65 65 63
Source: ANES
> HIGHLIGHTS

48 FIPP WORLD MAGAZINE TRENDS 2014/2015: EMEA SPECIAL REPORT
PUBLISHERS
» Burda-Alatau-Press » Media Link » Season Magazine
> FIPP MEMBERS
> AT-A-GLANCE
Capital: Astana Population: 17,948,816 (July 2014 est.) Median age: 29.7 years GDP: US$224.9 billion (2013 est.) Consumer prices: 5.8% (2013 est.) Currency: Tenge (KZT) Official language: Kazakh (64.4%), Russian (95%) Literacy rate: 99.7% SOURCE: CIA WORLD FACTBOOK (JULY 2014)
DIGITAL DATA
Internet penetration: 9,850,123 % of population: 55 SOURCE: INTERNET LIVE STATS (JULY 2014 est.)
Mobile penetration: 28,731,000 (2012) % of population: 160 SOURCE: CIA WORLD FACTBOOK (JULY 2014)
PRINT TAX
Standard rate: 12% Magazine purchases: 12% Digital purchases: 12%
SOURCE: PARTNERS MEDIA GROUP
CROSS-MEDIA OWNERSHIP RESTRICTIONS
owner registration foreign ownership cross-media ownership
Key: ALLOWED RESTRICTED NOT ALLOWED
SOURCE: FIEG
ADVERTISING RESTRICTIONS
Tobacco Alcohol
Key: BANNED BY LAW VOLUNTARILY STOPPED RESTRICTED BY LAW RESTRICTED VOLUNTARILY
SOURCE: PARTNERS MEDIA GROUP
KAZAKHSTAN
According to TNS Central Asia adspend in mass media January-June 2014 is almost the same as the same period in 2013 (with a small decline of 0.3%). But the devaluation of the local currency which took place in February 2014 (21%) saw a decline in the print sector. Advertising revenues
declined by 24.7%, driven largely by Kazakhstan-based advertisers.
Glossy magazines were affected less compared with newspapers. Harper’s Bazaar holds the leading position in the whole print segment.
> SPECIAL REPORT: PARTNERS MEDIA GROUP
The main news in the publishing business was: Partners Media Group acquired Men’s Health in May (licence with Rodale); Media Link closed Cosmopolitan Shopping and Timeout; and ToRa media group launched SNC magazine in September 2014.
> ADSPEND: ZENITHOPTIMEDIA
ADVERTISING EXPENDITURE BY MEDIUM (USD MILLIONS)
2007 2008 2009 2010 2011 2012 2013 2014 2015 2016
Magazines 31 49 32 33 33 36 37 37 39 39
Newspapers 75 73 55 64 74 71 62 58 55 50
Television 644 675 585 667 776 840 995 1,110 1,243 1,392
Radio 32 37 25 31 39 45 48 50 53 55
Cinema - - - - - - - - - -
Outdoor 46 55 42 56 65 67 73 79 86 92
Total 829 889 739 851 988 1,059 1,214 1,335 1,475 1,628

FIPP WORLD MAGAZINE TRENDS 2014/2015:EMEA SPECIAL REPORT 49
KAZAKHSTAN: CONSUMERMAGAZINE ADSPEND (USD MILLIONS) ADSPEND SHARE (2013)
AUTOMOTIVE/MOTOR RACING/MOTORCYCLE
BUSINESS/FINANCIAL/NEWS
> HIGHLIGHTS
> TOP TITLES
Za Rulem K-Press Monthly 15,000 No - - No zarulem.kz
Persanal Money Drakar Monthly 12,000 No - - No vsedengi.kz
Forbes United Media Group Monthly 10,000 - - 4.00 No forbes.kz
Business Life Toler Company Monthly 8,000 No - - No bizlife.kz
Expert Kazakhstan - Weekly 5,000 - - - No expert.ru/kazakhstan
Capital - - - No - - No kapital.kz
2007 2008 2009 2010 2011 2012 2013 2014 2015 2016
50
45
40
35
30
25
31
36
49
37
32
37
33
39
33
39
PUBLISHERAVERAGE READERSHIP
COVER PRICE
E-READER APPSCIRCULATIONFREQUENCY AUDITED WEBSITE
Source: ZenithOptimedia Advertising Expenditure Forecasts June 2014Magazines
3.0%
Outdoor 6.0%
Newspapers 5.1%
Newspapers 27.0%
Radio 3.9%
TV 81.9%
> ADSPEND: ZENITHOPTIMEDIA
TOP PUBLISHING COMPANIES: BY TOTAL REVENUE
1 Partners Media Group 5 Season
2 Burda Alatau Press 6 First Media Group
3 Media Link 7 Vintage
4 United Media GroupSource: Partners Media Group
TOP ADVERTISERS
TOP ADVERTISER CATEGORIES
1 Mars 6 Coca-Cola Amaty Bottlers
2 Procter & Gamble 7 L'Oréal/Garnier
3 Unilever 8 Kraft Foods
4 Nestlé 9 Benckiser S.A.
5 Henkel/Schwarzkopf 10 Foodmaster
1 Food 6 Cultural events and concerts
2 Services 7 Household chemicals
3 Perfumes and cosmetics 8 Mass-media
4 Medicine and pharmacy 9 Polygraphy
5 Non-alcoholic beverages 10 Appliances
Source: TNS Central Asia, January-June 2014
Source: TNS Central Asia, January-June 2014
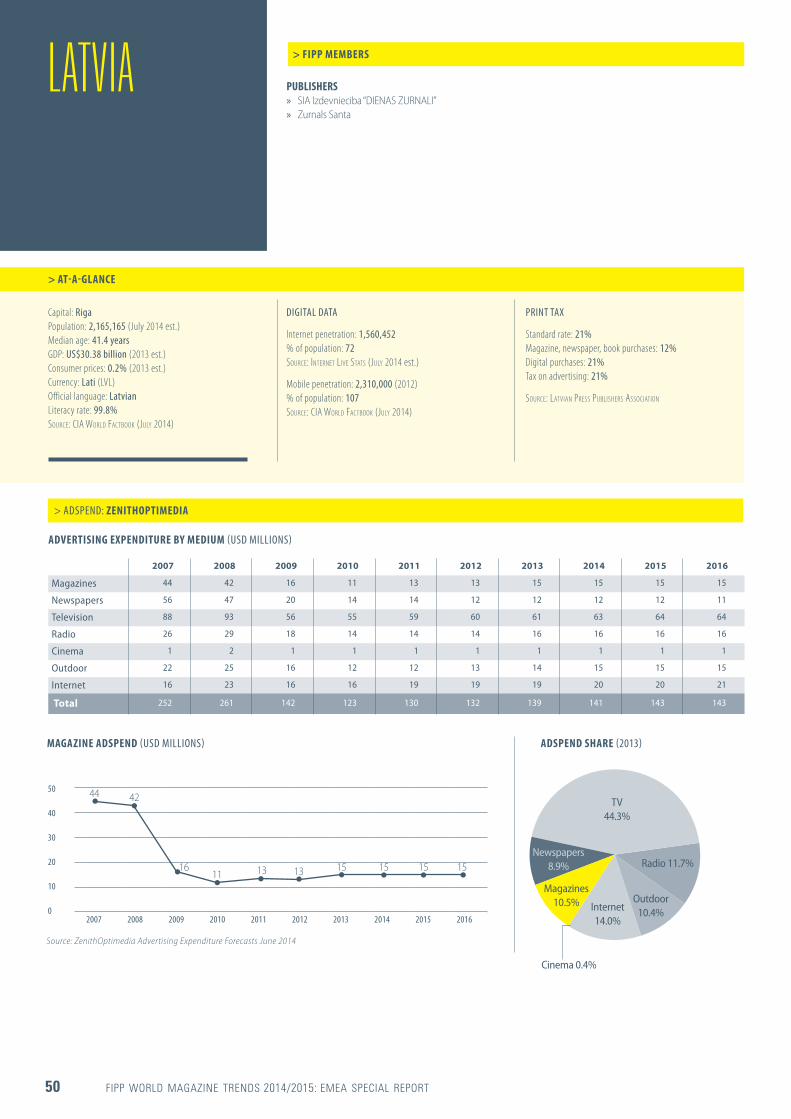
50 FIPP WORLD MAGAZINE TRENDS 2014/2015: EMEA SPECIAL REPORT
PUBLISHERS » SIA Izdevnieciba “DIENAS ZURNALI” » Zurnals Santa
> FIPP MEMBERS
> AT-A-GLANCE
Capital: Riga Population: 2,165,165 (July 2014 est.) Median age: 41.4 years GDP: US$30.38 billion (2013 est.) Consumer prices: 0.2% (2013 est.) Currency: Lati (LVL) Official language: Latvian Literacy rate: 99.8% SOURCE: CIA WORLD FACTBOOK (JULY 2014)
DIGITAL DATA
Internet penetration: 1,560,452 % of population: 72 SOURCE: INTERNET LIVE STATS (JULY 2014 est.)
Mobile penetration: 2,310,000 (2012) % of population: 107 SOURCE: CIA WORLD FACTBOOK (JULY 2014)
PRINT TAX
Standard rate: 21% Magazine, newspaper, book purchases: 12% Digital purchases: 21% Tax on advertising: 21%
SOURCE: LATVIAN PRESS PUBLISHERS ASSOCIATION
LATVIA
> ADSPEND: ZENITHOPTIMEDIA
ADVERTISING EXPENDITURE BY MEDIUM (USD MILLIONS)
2007 2008 2009 2010 2011 2012 2013 2014 2015 2016
Magazines 44 42 16 11 13 13 15 15 15 15
Newspapers 56 47 20 14 14 12 12 12 12 11
Television 88 93 56 55 59 60 61 63 64 64
Radio 26 29 18 14 14 14 16 16 16 16
Cinema 1 2 1 1 1 1 1 1 1 1
Outdoor 22 25 16 12 12 13 14 15 15 15
Internet 16 23 16 16 19 19 19 20 20 21
Total 252 261 142 123 130 132 139 141 143 143
MAGAZINE ADSPEND (USD MILLIONS) ADSPEND SHARE (2013)
2007 2008 2009 2010 2011 2012 2013 2014 2015 2016
50
40
30
20
10
0
44
13
42
1516 1511
1513 15
Source: ZenithOptimedia Advertising Expenditure Forecasts June 2014
Magazines 10.5% Outdoor
10.4%
Newspapers 8.9% Radio 11.7%
Cinema 0.4%
Internet 14.0%
TV 44.3%

FIPP WORLD MAGAZINE TRENDS 2014/2015:EMEA SPECIAL REPORT 51
> HIGHLIGHTS
TOP ADVERTISERS
1 L'Oréal 6 Unilever
2 Fragrances International 7 Tallink
3 Procter & Gamble 8 Kruzas NCD
4 Apranga 9 Royal Canin
5 Elkor 10 Patollo
Source: TNS
TOP PUBLISHING COMPANIES: BY NUMBER OF TITLES
1 Žurnāls Santa 6 Mediju Nams
2 Izdevniecība Dienas Žurnāli 7 Cits Medijs
3 Aģentūra Lilita 8 Izdevniecība IKK
4 Izdevniecība Rīgas Viļņi 9 Izdevniecības Nams Vesti
5 Lauku Avīze 10 Latvijas Vēstnesis
TOP ADVERTISER CATEGORIES
1 Remedies 6 Alcoholic beverages
2 Facial and skin care 7 Financial institutions and services
3 Retail 8 Prestige fragrances
4 Clothing 9 Hair care
5 Cars 10 Medical service and institutions
Source: TNS
Source: Latvian Press Publishers Association
LATVIA: CONSUMERNUMBER OF TITLES
2009 2010 2011 2012 2013
Total 370 368 339 329 308
Source: Central Statistical Bureau of Latvia
AVERAGE ISSUE READERSHIP (%)
Source: TNS, National Readership Survey: Year 2013 (29 Oct 2012 - 27 Oct 2013); 15-74
MEN 45.5 WOMEN 61.2 ADULTS 53.8

52 FIPP WORLD MAGAZINE TRENDS 2014/2015: EMEA SPECIAL REPORT
NATIONAL ASSOCIATION » Dutch Publishers Association (NUV) » Dutch Publishers Association (NUV)
(Consumer Magazine Group) » Dutch Publishers Association (NUV) (Group of
Publishers for Science and Profession) » Magazines.nl
PUBLISHERS » Elektor International Media » G+J Uitgevers » Happinez
> FIPP MEMBERS
> AT-A-GLANCE
» Hearst Magazines Netherlands » IDG Netherlands » Mood for Magazines » Sanoma » Weekbladpers Tijdschriften » WPG Publishers » Zhomer Media Business
SUPPLIERS » Layar » Van Gennep - M.A.C. » WoodWing Europe » WoodWing Software
Capital: Amsterdam Population: 16,877,351 (July 2014 est.) Median age: 42.1 years GDP: US$722.3 billion (2013 est.) Consumer prices: 2.5% (2013 est.) Currency: Euro (EUR) Official language: Dutch Official language: Frisian Literacy rate: 99% SOURCE: CIA WORLD FACTBOOK (JULY 2014)
DIGITAL DATA
Internet penetration: 16,143,879 % of population: 96 SOURCE: INTERNET LIVE STATS (JULY 2014 EST.)
Mobile penetration: 19,643,000 (2012) % of population: 116 SOURCE: CIA WORLD FACTBOOK (JULY 2014)
PRINT TAX
Standard rate: 21% Magazine, newspaper and book purchases: 6% Digital purchases: 21% Tax on advertising: 21%
SOURCE: NUV
CROSS-MEDIA OWNERSHIP RESTRICTIONS
owner registration foreign ownership cross-media ownership* concentration**
Key: ALLOWED RESTRICTED NOT ALLOWED
SOURCE: NUV; *PUBLIC - PRIVATE; **DUTCH COMPETITION LAW (MEDEDINGINGSWET)
ADVERTISING RESTRICTIONS
Tobacco Alcohol Advertising to children Over-the-counter drugs
Key: BANNED BY LAW VOLUNTARILY STOPPED RESTRICTED BY LAW RESTRICTED VOLUNTARILY
SOURCE: NUV
NETHERLANDS
The Dutch media landscape – and therefore, magazines – are still facing many challenges. The media market has changed significantly (and continues to change), but the enormous growth of internet penetration and the penetration of smartphones and tablets is stabilising.
In 2014, internet penetration in The Netherlands is approximately 96%. In 2014 there are 7.4 million tablet users (56% of the Dutch population 13 years or older) and 9 million smartphone users (70% of the Dutch population 13 years or older) in The Netherlands.
Consumer magazine circulation is still under pressure. The data for 2013 shows a decline of 14.9% in comparison with 2012. Total average readership shows a small decline.
In the Netherlands 12.2 million people read magazines. This is 87% of the Dutch population (13 years or older). 83% of men read magazines and 90% of the women.
Since 2009 media spending in The Netherlands is under pressure. Spending on print media declines the most. The ZenithOptimedia figures for 2013 show a decrease of 3.9% for gross media advertising. Adspend for the whole market shows a small decrease of 0.4%. A comparison between the development of magazine spending and magazine reach shows expenditure on magazines is declining much harder than the medium reach. So, magazine reach is far more stable than magazine media spending.
In the Netherlands approximately 1,200 consumer magazine titles (published at least
> SPECIAL REPORT: DUTCH PUBLISHERS ASSOCIATION (NUV)
four times a year) are published for a population of almost 17 million people. 349 million copies were sold in 2013 by newsstand and subscriptions (only based on approximately 270 audited magazines).
Magazines are in a dynamic phase. There are many opportunities for the future. The future of consumer magazines lies in their ability to build strong platforms and create communities around common interests. The arrival of tablets meant that publishers began to explore digital platforms. The number of apps for tablets and smartphones is increasing. The penetration of magazines read on tablets is increasing: in 2014 13% read magazines on a tablet (website, app, pdf ) and also 9% read magazines on smartphones (website, app, pdf ). Three years ago this was 2% and 7% respectively.
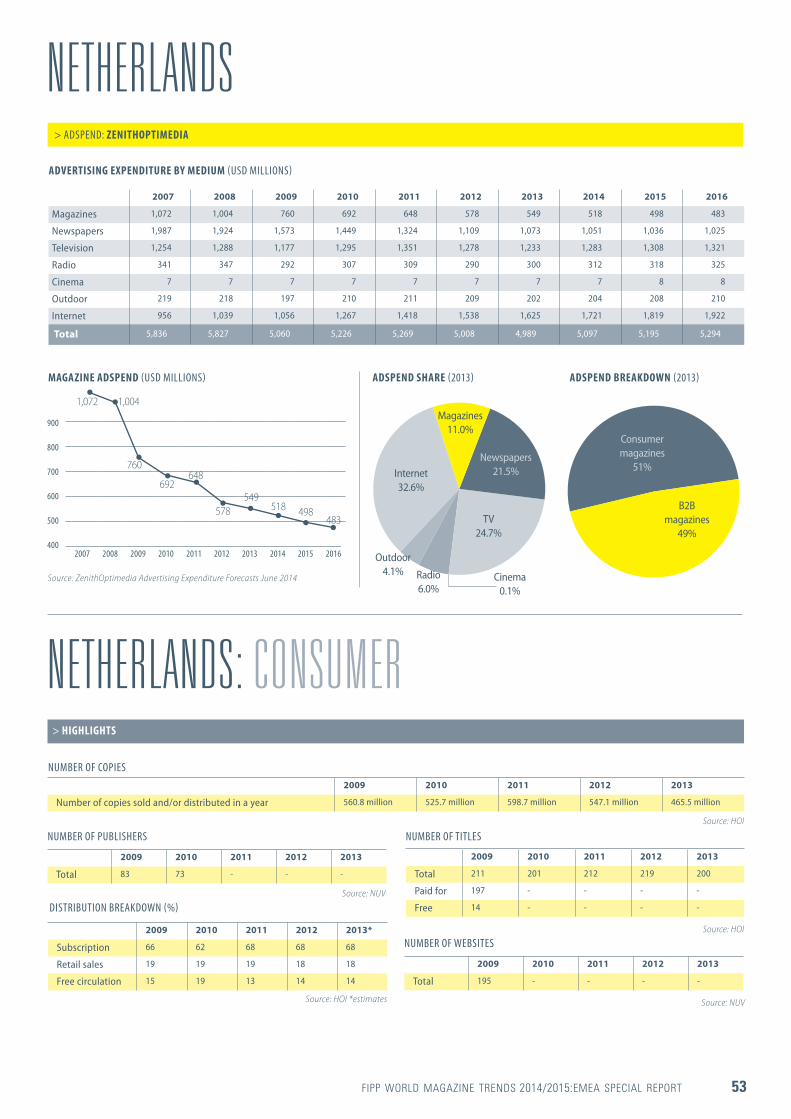
FIPP WORLD MAGAZINE TRENDS 2014/2015:EMEA SPECIAL REPORT 53
NETHERLANDS
NETHERLANDS: CONSUMER
MAGAZINE ADSPEND (USD MILLIONS) ADSPEND SHARE (2013) ADSPEND BREAKDOWN (2013)
NUMBER OF COPIES
NUMBER OF PUBLISHERS
NUMBER OF WEBSITES
NUMBER OF TITLES
2009 2010 2011 2012 2013
Number of copies sold and/or distributed in a year 560.8 million 525.7 million 598.7 million 547.1 million 465.5 million
2009 2010 2011 2012 2013
Total 83 73 - - -
2009 2010 2011 2012 2013
Total 195 - - - -
> HIGHLIGHTS
2009 2010 2011 2012 2013
Total 211 201 212 219 200
Paid for 197 - - - -
Free 14 - - - -
2007 2008 2009 2010 2011 2012 2013 2014 2015 2016
900
800
700
600
500
400
1,072
578
1,004
549
760
518
692
498
648
483
Source: ZenithOptimedia Advertising Expenditure Forecasts June 2014
Source: HOI
Source: HOI
Source: NUV
Source: NUV
Magazines 11.0%
Outdoor 4.1% Cinema
0.1%
Newspapers 21.5%
Radio 6.0%
Internet 32.6%
TV 24.7%
> ADSPEND: ZENITHOPTIMEDIA
ADVERTISING EXPENDITURE BY MEDIUM (USD MILLIONS)
2007 2008 2009 2010 2011 2012 2013 2014 2015 2016
Magazines 1,072 1,004 760 692 648 578 549 518 498 483
Newspapers 1,987 1,924 1,573 1,449 1,324 1,109 1,073 1,051 1,036 1,025
Television 1,254 1,288 1,177 1,295 1,351 1,278 1,233 1,283 1,308 1,321
Radio 341 347 292 307 309 290 300 312 318 325
Cinema 7 7 7 7 7 7 7 7 8 8
Outdoor 219 218 197 210 211 209 202 204 208 210
Internet 956 1,039 1,056 1,267 1,418 1,538 1,625 1,721 1,819 1,922
Total 5,836 5,827 5,060 5,226 5,269 5,008 4,989 5,097 5,195 5,294
Consumer magazines
51%
B2B magazines
49%
DISTRIBUTION BREAKDOWN (%)
2009 2010 2011 2012 2013*
Subscription 66 62 68 68 68
Retail sales 19 19 19 18 18
Free circulation 15 19 13 14 14
Source: HOI *estimates
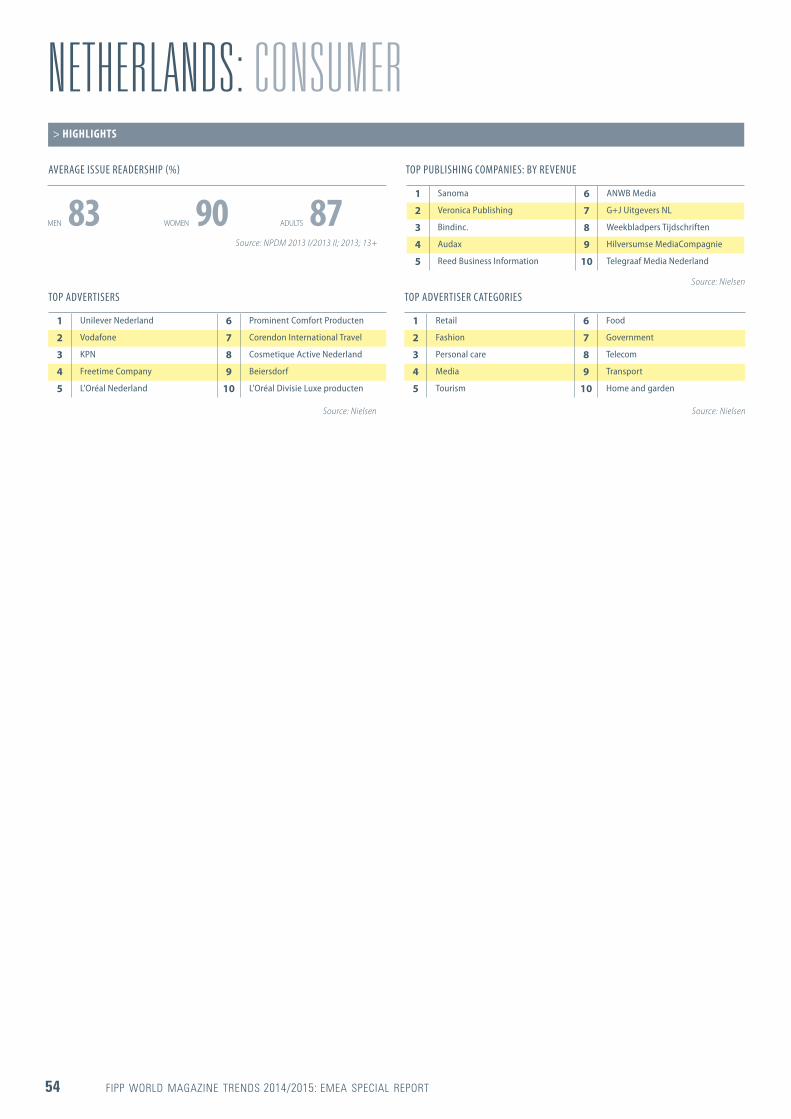
54 FIPP WORLD MAGAZINE TRENDS 2014/2015: EMEA SPECIAL REPORT
NETHERLANDS: CONSUMER
TOP ADVERTISERS TOP ADVERTISER CATEGORIES
TOP PUBLISHING COMPANIES: BY REVENUE
> HIGHLIGHTS
1 Sanoma 6 ANWB Media
2 Veronica Publishing 7 G+J Uitgevers NL
3 Bindinc. 8 Weekbladpers Tijdschriften
4 Audax 9 Hilversumse MediaCompagnie
5 Reed Business Information 10 Telegraaf Media Nederland
1 Unilever Nederland 6 Prominent Comfort Producten
2 Vodafone 7 Corendon International Travel
3 KPN 8 Cosmetique Active Nederland
4 Freetime Company 9 Beiersdorf
5 L'Oréal Nederland 10 L'Oréal Divisie Luxe producten
1 Retail 6 Food
2 Fashion 7 Government
3 Personal care 8 Telecom
4 Media 9 Transport
5 Tourism 10 Home and garden
Source: Nielsen
Source: Nielsen Source: Nielsen
AVERAGE ISSUE READERSHIP (%)
MEN 83 WOMEN 90 ADULTS 87Source: NPDM 2013 I/2013 II; 2013; 13+

FIPP WORLD MAGAZINE TRENDS 2014/2015:EMEA SPECIAL REPORT 55
NATIONAL ASSOCIATION
» Fagpressens Informasjonskontor (The Norwegian Specialised Press Association)
» Norwegian Media Businesses Association
PUBLISHERS
» Aller Media » Benjamin Publications » Bonnier Publications International » Bonnier Responsmedier » Egmont Hjemmet Mortensen
> FIPP MEMBERS
> AT-A-GLANCE
» Elle » IDG Magazines Norge » TU Media
SUPPLIERS
» eZ Systems » eZ Systems Nordics » PRM Media Advisors International
Capital: Oslo Population: 5,147,792(July 2014 est.) Median age: 39.1 years GDP: US$515.8 billion (2013 est.) Consumer prices: 1.9% (2013 est.) Currency: Norwegian kroner (NOK) Official language: Bokmal and Nynorsk Norwegian Literacy rate: 100% SOURCE: CIA WORLD FACTBOOK (JULY 2014)
DIGITAL DATA
Internet penetration: 4,895,885 % of population: 95 SOURCE: INTERNET LIVE STATS (JULY 2014 est.)
Mobile penetration: 5,732,000 (2012) % of population: 111 SOURCE: CIA WORLD FACTBOOK (JULY 2014)
ADVERTISING RESTRICTIONS
Tobacco* Alcohol Advertising to children** Over-the-counter drugs Pornography
Key: BANNED BY LAW VOLUNTARILY STOPPED RESTRICTED BY LAW RESTRICTED VOLUNTARILY
SOURCE: FAGPRESSEN; * SPECIALISED MAGAZINES ARE ALLOWED TO HAVE ADS FOR TOBACCO AND ALCOHOL; ** UP TO AGE 15
PRINT TAX
Standard rate: 25% Magazine purchases*: 25% Newspaper and book purchases**: 0% Digital purchases: 25%
SOURCE: FAGPRESSEN; *0% VAT WHEN SUBSCRIPTION % OVER 80%; ** ON PAPER
CROSS-MEDIA OWNERSHIP RESTRICTIONS
owner registration foreign ownership cross-media ownership concentration
Key: ALLOWED RESTRICTED NOT ALLOWED SOURCE: FAGPRESSEN; * ONLY RESTRICTIONS IN OWNERSHIP OF MASS MEDIA PRODUCTS SUCH AS NEWSPAPERS, TV AND RADIO
NORWAY
In 2012 the Norwegian magazine industry introduced a new national readership survey with a new currency called GEP. Much effort and work was done in 2013 to implement GEP as the new currency for magazines. Even though it takes time to change a currency, the market is increasingly accepting it.
However, as in other countries, the magazine industry is suffering from the general trends affecting the rest of the world. The move from paper-based to digital platforms continued on a stronger level in 2013.
Circulation figures for magazines declined by 7.1% from 2012 to 2013 across the same titles in the marketplace. Four new titles were launched in 2013 but 10 were closed.
The total market for advertising increased by 4.2% in 2013. In this growing market all the paper-based media channels lost revenue and market share. The revenue for magazines dropped 11.2%, and the market share is now down to 3%. On the other hand: advertising on the internet grew by 23.1% and part of this is also magazines. Internet became the biggest
> SPECIAL REPORT: NORWEGIAN MEDIA BUSINESSES’ ASSOCIATION (MEDIEBEDRIFTENES LANDSFORENING)
advertising medium in 2013.Looking at growth, mobile advertising is
growing very rapidly – up 324.1% in 2013. The challenge for the magazine industry is the
same as for the newspaper industry: The change from paper-based to digital platforms. This also influences the method for measuring readership. The Norwegian Media Businesses’ Association is still working on good solutions for calibrating readership figures between the interview-based survey and the electronic measurements.
> ADSPEND: ZENITHOPTIMEDIA
ADVERTISING EXPENDITURE BY MEDIUM (USD MILLIONS)
2007 2008 2009 2010 2011 2012 2013 2014 2015 2016
Magazines 110 109 86 93 100 93 83 74 68 62
Newspapers 1,224 1,171 961 995 1,037 959 874 751 676 622
Television 519 540 475 521 575 617 646 656 669 682
Radio 93 100 86 96 95 102 101 101 102 103
Cinema 22 24 20 24 25 27 25 25 26 26
Outdoor 84 91 82 86 97 99 101 99 101 104
Internet 495 596 599 671 741 784 965 1,086 1,205 1,326
Total 2,547 2,631 2,309 2,485 2,670 2,681 2,795 2,792 2,847 2,925
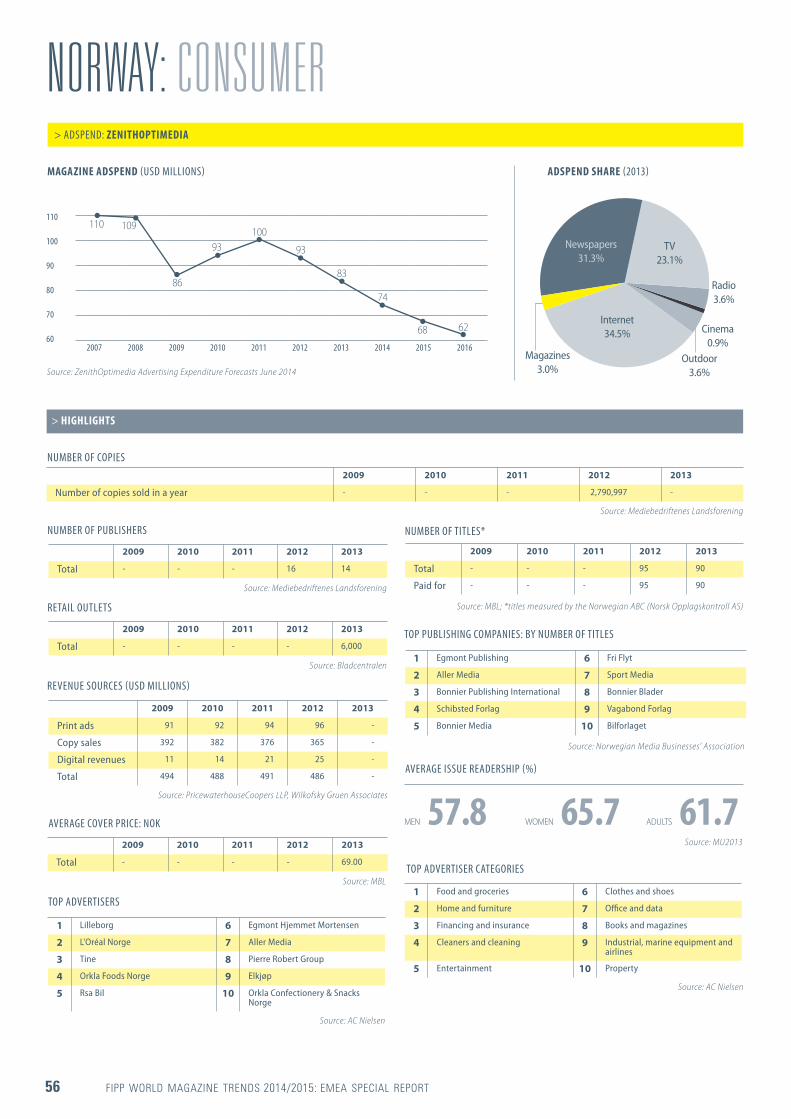
56 FIPP WORLD MAGAZINE TRENDS 2014/2015: EMEA SPECIAL REPORT
NORWAY: CONSUMER
NUMBER OF COPIES
REVENUE SOURCES (USD MILLIONS)
NUMBER OF TITLES*
2009 2010 2011 2012 2013
Number of copies sold in a year - - - 2,790,997 -
> HIGHLIGHTS
2009 2010 2011 2012 2013
Total - - - 95 90
Paid for - - - 95 90
2009 2010 2011 2012 2013
Print ads 91 92 94 96 -
Copy sales 392 382 376 365 -
Digital revenues 11 14 21 25 -
Total 494 488 491 486 -
Source: Mediebedriftenes Landsforening
Source: MBL; *titles measured by the Norwegian ABC (Norsk Opplagskontroll AS)
AVERAGE COVER PRICE: NOK
2009 2010 2011 2012 2013
Total - - - - 69.00
Source: MBL
Source: PricewaterhouseCoopers LLP, Wilkofsky Gruen Associates
RETAIL OUTLETS
NUMBER OF PUBLISHERS
2009 2010 2011 2012 2013
Total - - - - 6,000
2009 2010 2011 2012 2013
Total - - - 16 14
Source: Bladcentralen
Source: Mediebedriftenes Landsforening
TOP PUBLISHING COMPANIES: BY NUMBER OF TITLES
1 Egmont Publishing 6 Fri Flyt
2 Aller Media 7 Sport Media
3 Bonnier Publishing International 8 Bonnier Blader
4 Schibsted Forlag 9 Vagabond Forlag
5 Bonnier Media 10 Bilforlaget
Source: Norwegian Media Businesses’ Association
TOP ADVERTISERS
TOP ADVERTISER CATEGORIES
1 Lilleborg 6 Egmont Hjemmet Mortensen
2 L'Oréal Norge 7 Aller Media
3 Tine 8 Pierre Robert Group
4 Orkla Foods Norge 9 Elkjøp
5 Rsa Bil 10 Orkla Confectionery & Snacks Norge
1 Food and groceries 6 Clothes and shoes
2 Home and furniture 7 Office and data
3 Financing and insurance 8 Books and magazines
4 Cleaners and cleaning 9 Industrial, marine equipment and airlines
5 Entertainment 10 Property
Source: AC Nielsen
Source: AC Nielsen
AVERAGE ISSUE READERSHIP (%)
MEN 57.8 WOMEN 65.7 ADULTS 61.7 Source: MU2013
> ADSPEND: ZENITHOPTIMEDIA
MAGAZINE ADSPEND (USD MILLIONS) ADSPEND SHARE (2013)
2007 2008 2009 2010 2011 2012 2013 2014 2015 2016
110
100
90
80
70
60
110
93
109
8386
74
93
68 62
100
Source: ZenithOptimedia Advertising Expenditure Forecasts June 2014
Magazines 3.0%
Cinema 0.9%
Newspapers 31.3%
Radio 3.6%
Outdoor 3.6%
Internet 34.5%
TV 23.1%

FIPP WORLD MAGAZINE TRENDS 2014/2015:EMEA SPECIAL REPORT 57
NORWAY: B2B
NUMBER OF COPIES
NUMBER OF PUBLISHERS
AVERAGE COVER PRICE: NOKNUMBER OF WEBSITES
NUMBER OF TITLES
2009 2010 2011 2012 2013
Number of copies sold and/or distributed in a year - - - 33,3 million 34,5 million*
2009 2010 2011 2012 2013
Total - - - 191 191
> HIGHLIGHTS
2009 2010 2011 2012 2013
Total - - - 222 222
2009 2010 2011 2012 2013
Total - - - 85* -
2009 2010 2011 2012 2013
Total - - - 210 210
Source: Fagpressen. Only audited members of the association / * circulation x frequency
Source: Fagpressen
Source: The Norwegian Specialized Press Association; *Mainly subscription Source: Fagpressen
Source: Fagpressen
TOP PUBLISHING COMPANIES: BY NUMBER OF TITLES
1 LO Media 6 Tun Media
2 Ask Media 7 Norsk Maritimt Forlag
3 Utdanningsforbundet 8 Oslo University
4 Universitets Forlag 9 Norsk Bokforlag
5 Teknisk Ukeblad Media 10 Norges Jeger og Fisker Forbund
Source: Fagpressen, only magazines that are members of Fagpressen
DISTRIBUTION BREAKDOWN (%) REVENUE SOURCES (USD MILLIONS)
2009 2010 2011 2012 2013
Subscription 88.1 86.5 87.5 88.9 91.1
Retail sales 0.8 0.6 0.5 0.4 0.3
Free circulation 11.1 12.9 12 10.6 8.6
2009 2010 2011 2012 2013
Print ads 96 98 100 103 -
Copy sales 118 114 112 112 -
Digital revenues 8 10 14 18 -
Source: Fagpressen Source: Fagpressen
TOP ADVERTISERS
TOP ADVERTISER CATEGORIES
1 Kiwi 6 Spar
2 Tine 7 Orkla Foods Norge
3 Telenor 8 Møller Harald A.
4 Rema1000 9 One Call
5 Lilleborg 10 Elkjøp
1 Groceries 6 Sport
2 Home 7 Electro
3 Car 8 Cosmetics
4 Telecom 9 Health
5 Travel 10 Banking/insurance
Source: Nielsen; Nytt om reklametatetsikk 2014 -07
Source: Nielsen; Nytt om reklametatetsikk 2014 -07
The Norwegian B2B and specialised press business has had a stable but positive year in 2013, with both a growth in circulation, just under 1% (source: FMK) and an increase in total advertising of about 0.5%. In the same period print advertising alone fell by 4.1% (source: IRM).
A recent study done by IRM (Institutet för Reklam-och Mediestatistik) states that the Norwegian B2B and specialised press’ decline in paper based advertising has been altogether substituted by digital advertising. The study shows that the loss in advertising on paper is fully compensated by magazines’ digital advertising. This is a trend the business has experienced since 2011. In 2011 digital
advertising was 9.6% of the businesses’ total advertising, but in 2013 the percentage had increased to 15.8%. The first two quarters of 2014 have also had similar growth and now digital advertising makes up 17.6% of the total advertising in the B2B and specialised press business.
The Norwegian B2B and specialised press readership project between the national association, Fagpressen, and TNS Gallup is about to start publishing their readership numbers. This project started in 2013, and should go live by the end of 2014.
Norwegian legislators are planning a change in VAT taxes for both paper and digital editorial
> SPECIAL REPORT: FAGPRESSEN
products. All the Norwegian press associations agree that further taxation will harm the ”free press” and they recommend to continue and expand the existing zero percent VAT rates to also include digital editorial products.
Fagpressen has started a campaign for journalism together with the other national press associations. The campaign focuses on young media users, and their ability to separate edited content from other information online, and also on press ethics and best conduct. The campaign corresponds with Norway’s 200 years’ anniversary of its constitution and independence.

58 FIPP WORLD MAGAZINE TRENDS 2014/2015: EMEA SPECIAL REPORT
Trends in the general interest magazines sector are provided by the publishers – covering approximately 900 titles – although a fragmented group of publishers. The scale of fragmentation may be illustrated, for instance, by the fact that in 2013 the Bauer Group, the biggest magazine publisher in this sector audited by ZKDP (the Union of Press Distribution Control), had a share of 46.4% of the circulation while in the previous year, it was 45.7% (and 57% of paid-for distribution). Significant fragmentation is also demonstrated by the fact that the share of top ten consumer publishers in this sector was 79.9% (compared with 78.9% the previous year).
These figures show that the magazine market is constantly consolidating. Publishers continue to acquire existing titles (in 2013, Burda acquired the G+J titles) and to consolidate existing titles (including exchanging titles with other publishers, e.g. Dobre Rady exchanged with Poradnik Domowy). And also to publish titles into all the gaps in the niches in all publishing formats: in recent years, these have mostly been parent, shopping, cookery, garden and interior design and true stories magazines and celebrity titles.
The future development of the consumer magazine market depends on publishers’ strategies and primarily on providing them with a variety of offers. The growing consolidation and similarities in the press offers may result in decreased interest in magazines and – more broadly – in the meaning of the “printed word” in social communication.
Conclusions from the study “The Diagnosis of the Social Readers’ Behaviours” carried out in October 2013 by the Chamber of Press Publishers are not pessimistic. They indicate that in spite of a decline in the printed press readership due to the growing interest in digital press, the magazine sector seems to be stable. The women’s press in particular is stable: at present, 57% of respondents said they read magazines, and 61% according to a five year perspective (the smallest increase is expected in the readership of digital versions – from 1.2% to 18%). About 56% read popular magazines today,
or 64% according to a five year perspective (the share of digital press increases by 1.9% to 25.3%). The pattern is particularly strong for opinion weeklies: the rise in readership oscillates between 30% nowadays and 46.4% in a five year period, and in digital editions between 1.2% at present up to 27.7% in a five year perspective.
Statements and signals coming from the country’s magazine publishers indicate that they follow the US market news closely (and recently also the German market) about the growing revenues generated by e-editions. Not all, however, depends on the publishers themselves; it seems that key factors are technological solutions developed on a national level and the pace with which they are made accessible for the readers, and in particular the development of a sufficiently attractive offer and customer-friendly tools encouraging potential consumers to choose the publishers’ content.
Notable launches include: Woman’s Health (Motor Presse Polska); Cała Ty (Phoenix Press); Weranda Weekend (Te-Jot); Historia Do Rzeczy (Orle Pióro), C’est La Vie (Consiliare Partners) and 7 Dni Puls Tygodnia (Press Media Enterprise). However 7 Dni Puls Tygodnia has already ceased. The major closures include: Maxim Polska and Stuff (Gizna Media Group), Film (PMPG), Mobile Internet (Westa Druk), Exklusiv (Valkea Media), as well as Sekrety Nauki and Śledczy (Burda). Among numerous changes in frequency, a good example is Forum (Polityka) weekly becoming a bi-weekly.
There were no significant legal changes in 2013 which might impact publishers. There are some positive solutions for publishers pending i.e. review of the copyright laws and better copyright protection of content.
The share of subscriptions in magazine distribution has unfortunately decreased for the second year in a row. And the situation is unlikely to change.
There are no changes in VAT rates. Efforts to level the playing field for VAT rates between digital press (23%) and printed editions (5 and 8% for magazines) are ongoing, however, decisions in this case are in the EU competences.
NATIONAL ASSOCIATION
» Polish Chamber of Press Publishers (IWP)
PUBLISHERS
» Bonnier Business (Polska) » Burda Media Polska » De Agostini Polska » Edipresse Polska » Egmont Polska » Gruner + Jahr Polska
> FIPP MEMBERS
> AT-A-GLANCE
» IDG Poland » Marquard Media Polska » Motor-Presse Polska » Ringier Axel Springer Polska » Sanoma Media Russia & CEE » Wydawnictwo Bauer
SUPPLIERS
» HDS Polska » Sappi Europe (Polska)
Capital: Warsaw Population: 38,346,279 (July 2014 est.) Median age: 39.5 years GDP: US$513.9 billion (2013 est.) Consumer prices: 1% (2013 est.) Currency: Zlotych (PLN) Official language: Polish (96.2%) Literacy rate: 99.7% SOURCE: CIA WORLD FACTBOOK (JULY 2014)
DIGITAL DATA
Internet penetration: 25,666,238 % of population: 67 SOURCE: INTERNET LIVE STATS (JULY 2014 EST.)
Mobile penetration: 50,840,000 (2012) % of population: 133 SOURCE: CIA WORLD FACTBOOK (JULY 2014)
PRINT TAX
> VAT Standard rate: 23% Magazine and newspaper purchases: 8%* Specialised magazines: 5%** Digital purchases: 23%
SOURCE: DISTRIPRESS; *23% FOR TITLES WITH AD SPACE; **CIRCULATION LESS THAN 15,000
ADVERTISING RESTRICTIONS
Tobacco Alcohol Advertising to children Over-the-counter drugs
Key: BANNED BY LAW VOLUNTARILY STOPPED RESTRICTED BY LAW RESTRICTED VOLUNTARILY
SOURCE:THE CHAMBER OF PRESS PUBLISHERS, POLAND
POLAND
> SPECIAL REPORT: POLISH CHAMBER OF PRESS PUBLISHERS (IWP)

FIPP WORLD MAGAZINE TRENDS 2014/2015:EMEA SPECIAL REPORT 59
POLAND> ADSPEND: ZENITHOPTIMEDIA
ADVERTISING EXPENDITURE BY MEDIUM (USD MILLIONS)
MAGAZINE ADSPEND (USD MILLIONS) ADSPEND SHARE (2013)
NUMBER OF COPIES
NUMBER OF PUBLISHERS NUMBER OF TITLES
2007 2008 2009 2010 2011 2012 2013 2014 2015 2016
Magazines 282 290 250 229 215 180 142 121 102 87
Newspapers 240 238 180 164 151 121 90 76 63 52
Television 1,116 1,270 1,126 1,163 1,181 1,107 1,058 1,080 1,095 1,109
Radio 158 167 143 144 152 150 144 145 146 146
Cinema 23 30 30 33 34 35 36 37 37 38
Outdoor 212 224 186 176 170 158 141 139 139 139
Internet 188 233 253 305 355 383 411 461 525 599
Total 2,219 2,452 2,168 2,214 2,259 2,134 2,022 2,059 2,108 2,170
2009 2010 2011 2012 2013
Number of copies sold and/or distributed in a year 775 million 720 million 692 million 645 million 608 million
2009 2010 2011 2012 2013
Total 954 943 918 907 910
> HIGHLIGHTS
2009 2010 2011 2012 2013
Total 1,914 1,983 1,974 2,007 2,045
Paid for 1,830 1,891 1,882 1,903 1,933
Free 84 92 92 104 112
2007 2008 2009 2010 2011 2012 2013 2014 2015 2016
Związek Kontroli Dystrybucji Prasy and Polskie Badania Czytelnictwa continued “The Press Works” campaign in 2013. Its primary aim was to stop advertisers leaving print – and ultimately to attract them – using rational arguments based on the press as the best advertising medium. The campaign, however, proved to
be relatively ineffective.2013 marked the beginning of a thorough,
far-reaching reform of the system of readership assessment and communication with the advertising market. Implementation of the changes is planned for 2015.
What is still a worrying phenomenon is the
decreasing number of publishers submitting their titles to auditing by ZKDP (ABC Poland). In 2011, there were 325 consumer magazines, compared with 259 in 2013. The reason is probably the noticeable incompliance of the ZKDP activities with contemporary market demands.
300
250
200
150
100
50
282
180
290
142
250
121
229
102
215
87
Source: ZenithOptimedia Advertising Expenditure Forecasts June 2014
Source: Press-Service Monitoring Mediów; In B2C magazines audited by ZKDP number of copies distributed is 570.5 mln
Source: Press-Service Monitoring Mediów
Source: Press-Service Monitoring Mediów
Magazines 7.0%
Cinema 1.8%Outdoor
7.0%
Newspapers 4.5%
Radio 7.1%
Internet 20.3%
TV 52.3%
NUMBER OF CONSUMER MAGAZINE WEBSITES
2009 2010 2011 2012 2013
Total - 1,863 1,870 1,892 1,895
Source: Press-Service Monitoring Mediów

60 FIPP WORLD MAGAZINE TRENDS 2014/2015: EMEA SPECIAL REPORT
POLAND: CONSUMER
TOP ADVERTISERS TOP ADVERTISER CATEGORIES
AVERAGE COVER PRICE: PLN
> HIGHLIGHTS
2009 2010 2011 2012 2013
Total 4.61 4.73 4.69 4.92 6.54
1 L'Oréal Polska 6 Aflofarm Farmacja Polska
2 Unilever Polska 7 Apart
3 Nivea Polska 8 CT Creative Team
4 Procter & Gamble Polska 9 Lidl Polska Sklepy Spożywcze
5 Volkswagen Group Polska 10 Jeronimo Martins Polska
1 Hygiene and healthcare 6 Media, Books, CD and DVD
2 Others 7 Telecommunications
3 Pharmaceuticals, drugs 8 Automotives
4 Fashion and accesories 9 Food products
5 Trade 10 Finances
Source: Press-Service Monitoring Mediów (based on pricelists of RUCH and Kolporter)
TOP PUBLISHING COMPANIES: BY CIRCULATION
1 Wydawnictwo Bauer, Spółka Komandytowa
6 Wydawnictwo Westa-Druk, Mirosław Kuliś
2 Edipresse Polska 7 Burda Media Polska
3 Grupa Polskapresse 8 Ringier Axel Springer Polska
4 Teleprogram 9 Grupa G+J
5 Phoenix Press, Spółka Komandytowa
10 Oficyna Wydawnicza, Press - Media
Source: ZKDP, Styczeń-grudzień 2013; Zestawienie Press-Service Monitoring Mediów
DISTRIBUTION BREAKDOWN (%)
2009 2010 2011 2012 2013
Subscription 1.98 1.88 1.99 2.00 1.96
Retail sales 78.14 76.12 79.19 81.39 81.83
Free circulation 19.88 22 18.82 16.61 16.21
Source: ZKDP (Jan-Dec 2013) - Global distribution of paid-for and free consumer magazines
AVERAGE ISSUE READERSHIP (%)
MEN 61.1 WOMEN 80.7 ADULTS 71.1
Source: The Chamber of Press Publishers; Jan-Dec 2013; 18+
Source: Kantar Media, www.kantarmedia.pl Source: Kantar Media, www.kantarmedia.pl
RETAIL OUTLETS
2009 2010 2011 2012 2013
Kiosk/newsstand - - - 60,900 57,555
Source: Yearly report /analysis of IWP, published in mid 2013
REVENUE SOURCE (%)
2009 2010 2011 2012 2013
Print ads 55-65 55-65 57 60 -
Copy sales 30-35 30-35 32 30 -
Digital revenues 2-3 1-2 3 3 -
Other revenues 5-7 6-8 8 7 -
Source: Press-Service Monitoring Mediów, estimates
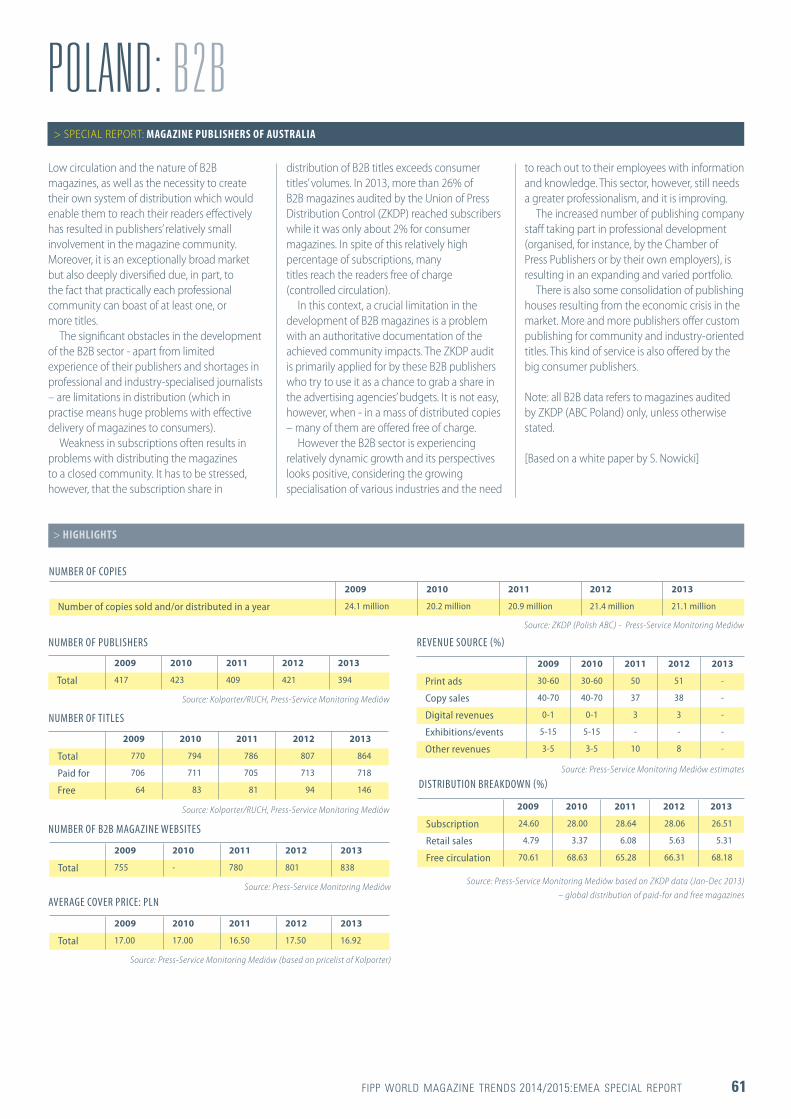
FIPP WORLD MAGAZINE TRENDS 2014/2015:EMEA SPECIAL REPORT 61
POLAND: B2BLow circulation and the nature of B2B magazines, as well as the necessity to create their own system of distribution which would enable them to reach their readers effectively has resulted in publishers’ relatively small involvement in the magazine community. Moreover, it is an exceptionally broad market but also deeply diversified due, in part, to the fact that practically each professional community can boast of at least one, or more titles.
The significant obstacles in the development of the B2B sector - apart from limited experience of their publishers and shortages in professional and industry-specialised journalists – are limitations in distribution (which in practise means huge problems with effective delivery of magazines to consumers).
Weakness in subscriptions often results in problems with distributing the magazines to a closed community. It has to be stressed, however, that the subscription share in
distribution of B2B titles exceeds consumer titles’ volumes. In 2013, more than 26% of B2B magazines audited by the Union of Press Distribution Control (ZKDP) reached subscribers while it was only about 2% for consumer magazines. In spite of this relatively high percentage of subscriptions, many titles reach the readers free of charge (controlled circulation).
In this context, a crucial limitation in the development of B2B magazines is a problem with an authoritative documentation of the achieved community impacts. The ZKDP audit is primarily applied for by these B2B publishers who try to use it as a chance to grab a share in the advertising agencies’ budgets. It is not easy, however, when - in a mass of distributed copies – many of them are offered free of charge.
However the B2B sector is experiencing relatively dynamic growth and its perspectives looks positive, considering the growing specialisation of various industries and the need
> SPECIAL REPORT: MAGAZINE PUBLISHERS OF AUSTRALIA
to reach out to their employees with information and knowledge. This sector, however, still needs a greater professionalism, and it is improving.
The increased number of publishing company staff taking part in professional development (organised, for instance, by the Chamber of Press Publishers or by their own employers), is resulting in an expanding and varied portfolio.
There is also some consolidation of publishing houses resulting from the economic crisis in the market. More and more publishers offer custom publishing for community and industry-oriented titles. This kind of service is also offered by the big consumer publishers.
Note: all B2B data refers to magazines audited by ZKDP (ABC Poland) only, unless otherwise stated.
[Based on a white paper by S. Nowicki]
NUMBER OF COPIES
NUMBER OF PUBLISHERS
AVERAGE COVER PRICE: PLN
NUMBER OF B2B MAGAZINE WEBSITES
NUMBER OF TITLES
2009 2010 2011 2012 2013
Number of copies sold and/or distributed in a year 24.1 million 20.2 million 20.9 million 21.4 million 21.1 million
2009 2010 2011 2012 2013
Total 417 423 409 421 394
> HIGHLIGHTS
2009 2010 2011 2012 2013
Total 770 794 786 807 864
Paid for 706 711 705 713 718
Free 64 83 81 94 146
2009 2010 2011 2012 2013
Total 17.00 17.00 16.50 17.50 16.92
2009 2010 2011 2012 2013
Total 755 - 780 801 838
Source: ZKDP (Polish ABC) - Press-Service Monitoring Mediów
Source: Kolporter/RUCH, Press-Service Monitoring Mediów
Source: Press-Service Monitoring Mediów (based on pricelist of Kolporter)
Source: Press-Service Monitoring Mediów
REVENUE SOURCE (%)
2009 2010 2011 2012 2013
Print ads 30-60 30-60 50 51 -
Copy sales 40-70 40-70 37 38 -
Digital revenues 0-1 0-1 3 3 -
Exhibitions/events 5-15 5-15 - - -
Other revenues 3-5 3-5 10 8 -
Source: Press-Service Monitoring Mediów estimates
Source: Kolporter/RUCH, Press-Service Monitoring Mediów
DISTRIBUTION BREAKDOWN (%)
2009 2010 2011 2012 2013
Subscription 24.60 28.00 28.64 28.06 26.51
Retail sales 4.79 3.37 6.08 5.63 5.31
Free circulation 70.61 68.63 65.28 66.31 68.18
Source: Press-Service Monitoring Mediów based on ZKDP data (Jan-Dec 2013) – global distribution of paid-for and free magazines
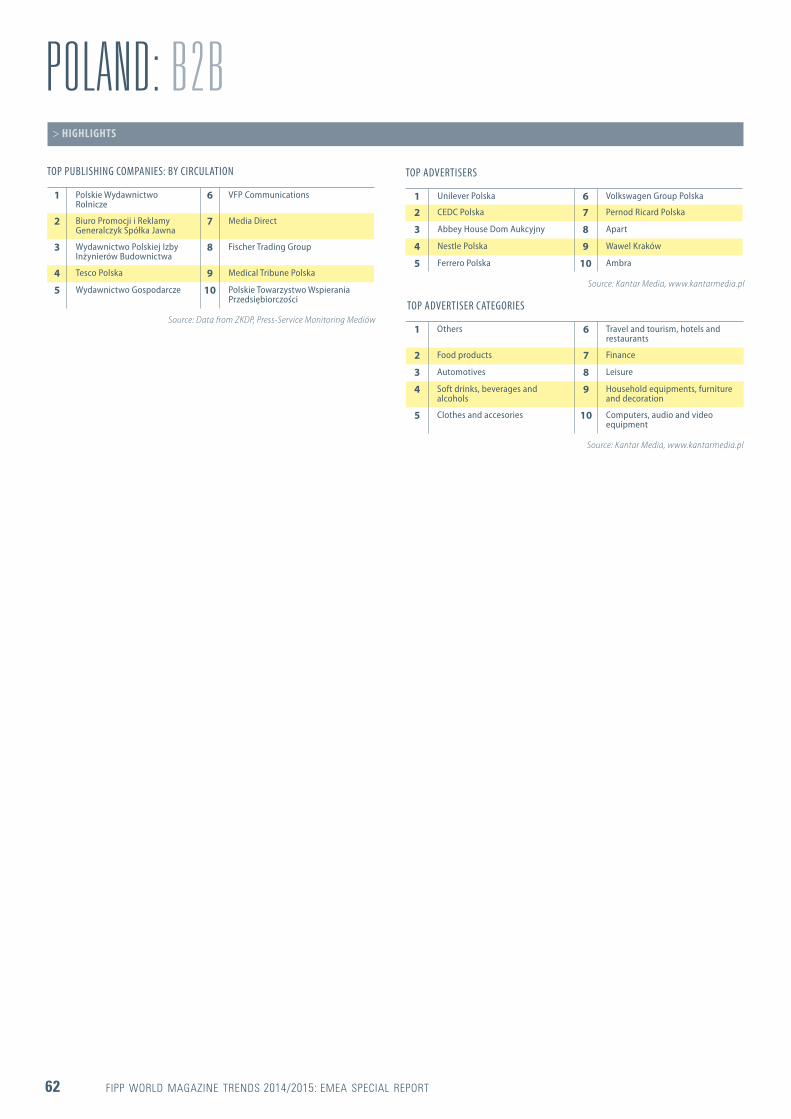
62 FIPP WORLD MAGAZINE TRENDS 2014/2015: EMEA SPECIAL REPORT
POLAND: B2B> HIGHLIGHTS
TOP PUBLISHING COMPANIES: BY CIRCULATION
1 Polskie Wydawnictwo Rolnicze
6 VFP Communications
2 Biuro Promocji i Reklamy Generalczyk Spółka Jawna
7 Media Direct
3 Wydawnictwo Polskiej Izby Inżynierów Budownictwa
8 Fischer Trading Group
4 Tesco Polska 9 Medical Tribune Polska
5 Wydawnictwo Gospodarcze 10 Polskie Towarzystwo Wspierania Przedsiębiorczości
Source: Data from ZKDP, Press-Service Monitoring Mediów
TOP ADVERTISERS
TOP ADVERTISER CATEGORIES
1 Unilever Polska 6 Volkswagen Group Polska
2 CEDC Polska 7 Pernod Ricard Polska
3 Abbey House Dom Aukcyjny 8 Apart
4 Nestle Polska 9 Wawel Kraków
5 Ferrero Polska 10 Ambra
1 Others 6 Travel and tourism, hotels and restaurants
2 Food products 7 Finance
3 Automotives 8 Leisure
4 Soft drinks, beverages and alcohols
9 Household equipments, furniture and decoration
5 Clothes and accesories 10 Computers, audio and video equipment
Source: Kantar Media, www.kantarmedia.pl
Source: Kantar Media, www.kantarmedia.pl

FIPP WORLD MAGAZINE TRENDS 2014/2015:EMEA SPECIAL REPORT 63
Digital technologies are increasing their presence in all segments of the press with the consumer driving these changes. Due to the economic situation, this was delayed but has now been embraced even faster than initially anticipated.
APImprensa has high hopes for the next European Agenda Programme (2014-2020) with media expected to play an important role. The most important areas include the EU Innovation Plan, EU Digital Agenda, a new jobs agenda and industrial policy for the globalisation era.
Internet usage is now one of the greatest trends unifying consumers all over the world. In Portugal broadband is now installed in 62% of all households.
The interest in accessing internet content continues to drive consumption in all segments.
The Portuguese magazine market has experienced balanced development. During 2013 some important publications changed publisher such as Cosmopolitan.
B2B magazines continue to grow in part because their content is more and more segmented and targeted at specialist audiences. Jewellery, optical and gardens magazines have also grown this year.
In Portugal, the magazine publishing industry contributes considerably to the national economy, as the high quality of contents contributes to a better understanding of society’s trends.
As for subscriptions, and compared with newspapers, magazines remain the strongest medium for loyal readers, although in 2013 some of the leading subscription magazines suffered losses of around 8% in circulation due to the general economic crisis.
Despite the global crisis, advertisers continue to invest in magazines. A trend among advertisers is the increased demand for measurement as well as the concern to target audiences.
General information and newsmagazines have gained higher levels of credibility, which translates into a significant increase in sales including digital editions and other platforms for magazines such as Sábado and Visão. A remarkable example is the juniors version of magazine Visão with more than 20,000 subscriptions, some thousands in Portuguese speaking communities around the world.
Postal rates increased 2.33% in June 2013. The National Postal Service also maintains a support system for the renewal of subscriptions and new subscribers. In July 2013 the government privatised the postal company.
PUBLISHERS
» Motor Press Lisboa » O Sol é essencial » RBA Revistas » TailorMade media
> FIPP MEMBERS
> AT-A-GLANCE
Capital: Lisbon Population: 10,813,834 (July 2014 est.) Median age: 41.1 years GDP: US$219.3 billion (2013 est.) Consumer prices: 0.4% (2013 est.) Currency: Euro (EUR) Official language: Portuguese, Mirandese (locally used) Literacy rate: 95.4% SOURCE: CIA WORLD FACTBOOK (JULY 2014)
DIGITAL DATA
Internet penetration: 7,015,519 % of population: 65 SOURCE: INTERNET LIVE STATS (JULY 2014 est.)
Mobile penetration: 12,312,000 (2012) % of population: 114 SOURCE: CIA WORLD FACTBOOK (JULY 2014)
PRINT TAX
Standard rate: 23% Magazine, newspaper and book purchases: 6% Digital purchases: 23% Tax on advertising: 23%
SOURCE: APIMPRESA
ADVERTISING RESTRICTIONS
Tobacco Alcohol Over-the-counter drugs
Key: BANNED BY LAW VOLUNTARILY STOPPED RESTRICTED BY LAW RESTRICTED VOLUNTARILY
SOURCE: APIMPRESA
PORTUGAL
> SPECIAL REPORT: ASSOCIAÇÃO PORTUGUESA DE IMPRENSA (APIMPRENSA)
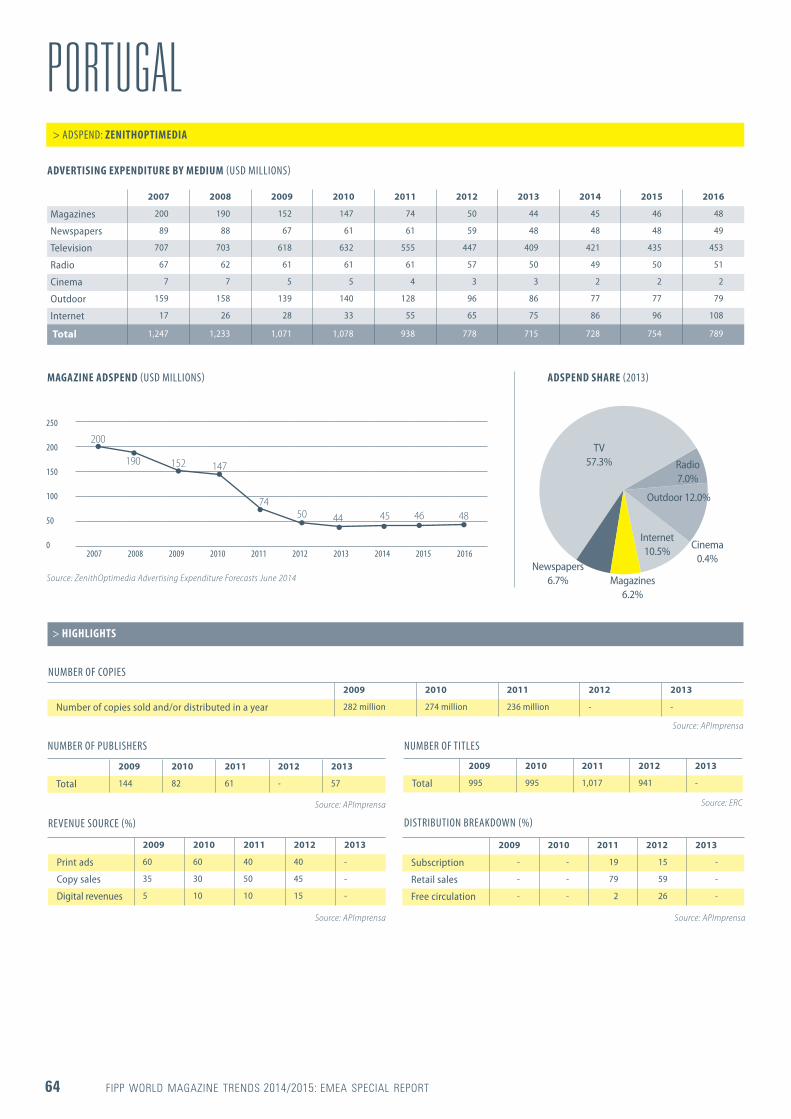
64 FIPP WORLD MAGAZINE TRENDS 2014/2015: EMEA SPECIAL REPORT
PORTUGAL> ADSPEND: ZENITHOPTIMEDIA
ADVERTISING EXPENDITURE BY MEDIUM (USD MILLIONS)
MAGAZINE ADSPEND (USD MILLIONS) ADSPEND SHARE (2013)
NUMBER OF COPIES
NUMBER OF PUBLISHERS
REVENUE SOURCE (%)
NUMBER OF TITLES
2007 2008 2009 2010 2011 2012 2013 2014 2015 2016
Magazines 200 190 152 147 74 50 44 45 46 48
Newspapers 89 88 67 61 61 59 48 48 48 49
Television 707 703 618 632 555 447 409 421 435 453
Radio 67 62 61 61 61 57 50 49 50 51
Cinema 7 7 5 5 4 3 3 2 2 2
Outdoor 159 158 139 140 128 96 86 77 77 79
Internet 17 26 28 33 55 65 75 86 96 108
Total 1,247 1,233 1,071 1,078 938 778 715 728 754 789
2009 2010 2011 2012 2013
Number of copies sold and/or distributed in a year 282 million 274 million 236 million - -
2009 2010 2011 2012 2013
Total 144 82 61 - 57
> HIGHLIGHTS
2009 2010 2011 2012 2013
Total 995 995 1,017 941 -
2009 2010 2011 2012 2013
Print ads 60 60 40 40 -
Copy sales 35 30 50 45 -
Digital revenues 5 10 10 15 -
2007 2008 2009 2010 2011 2012 2013 2014 2015 2016
250
200
150
100
50
0
200
50
190
44
152
45
147
4674
48
Source: ZenithOptimedia Advertising Expenditure Forecasts June 2014
Source: APImprensa
Source: ERC
Source: APImprensa
DISTRIBUTION BREAKDOWN (%)
2009 2010 2011 2012 2013
Subscription - - 19 15 -
Retail sales - - 79 59 -
Free circulation - - 2 26 -
Source: APImprensa
Source: APImprensa
Magazines 6.2%
Cinema 0.4%
Outdoor 12.0%
Newspapers 6.7%
Radio 7.0%
Internet 10.5%
TV 57.3%
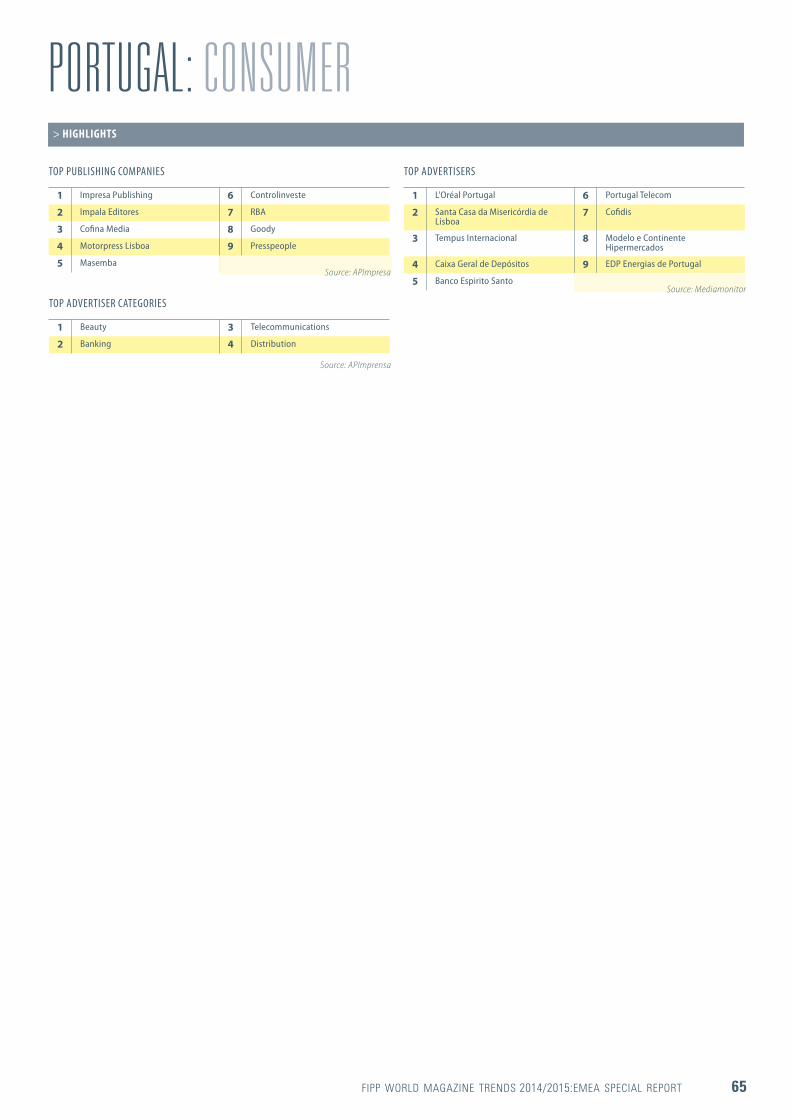
FIPP WORLD MAGAZINE TRENDS 2014/2015:EMEA SPECIAL REPORT 65
PORTUGAL: CONSUMER> HIGHLIGHTS
TOP PUBLISHING COMPANIES TOP ADVERTISERS
1 Impresa Publishing 6 Controlinveste
2 Impala Editores 7 RBA
3 Cofina Media 8 Goody
4 Motorpress Lisboa 9 Presspeople
5 Masemba
1 L'Oréal Portugal 6 Portugal Telecom
2 Santa Casa da Misericórdia de Lisboa
7 Cofidis
3 Tempus Internacional 8 Modelo e Continente Hipermercados
4 Caixa Geral de Depósitos 9 EDP Energias de Portugal
5 Banco Espirito Santo -
TOP ADVERTISER CATEGORIES
1 Beauty 3 Telecommunications
2 Banking 4 Distribution
Source: APImprensa
Source: APImpresa
Source: Mediamonitor

66 FIPP WORLD MAGAZINE TRENDS 2014/2015: EMEA SPECIAL REPORT
NATIONAL ASSOCIATION » Guild of Press Publishers (GIPP)
PUBLISHERS » Axel Springer Russia » Bauer Media » Condé Nast » De Agostini Russia » Edipresse-Konliga » Hearst Shkulev Media/InterMediaGroup » Publishing House Burda » Sanoma Independent Media
> FIPP MEMBERS
> AT-A-GLANCE
SUPPLIERS » Sappi Europe (Representative Office) » UPM-Kymmene, Russia
Capital: Moscow Population: 142,470,272 (July 2014 est.) Median age: 38.9 years GDP: US$2.113 trillion (2013 est.) Consumer prices: 6.8% (2013 est.) Currency: Russian rubles (RUB) Official language: Russian (96.3%) Literacy rate: 99.7% SOURCE: CIA WORLD FACTBOOK (JULY 2014)
DIGITAL DATA
Internet penetration: 84,437,793 % of population: 59 SOURCE: INTERNET LIVE STATS (JULY 2014 est.)
Mobile penetration: 261,900,000 (2012) % of population: 184 SOURCE: CIA WORLD FACTBOOK (JULY 2014)
ADVERTISING RESTRICTIONS
Tobacco Alcohol Over-the-counter drugs
Key: BANNED BY LAW VOLUNTARILY STOPPED RESTRICTED BY LAW RESTRICTED VOLUNTARILY
SOURCE: GIPP
RUSSIA
> ADSPEND: ZENITHOPTIMEDIA
ADVERTISING EXPENDITURE BY MEDIUM (USD MILLIONS)
2007 2008 2009 2010 2011 2012 2013 2014 2015 2016
Magazines 737 935 538 578 623 633 581 529 490 470
Newspapers 365 350 230 260 277 299 274 250 231 222
Television 3,565 3,706 3,036 3,489 4,141 4,511 4,919 5,076 5,279 5,517
Radio 469 413 291 324 373 460 520 564 599 629
Cinema 76 85 69 98 129 152 176 183 190 198
Outdoor 1,272 1,332 794 935 1,080 1,187 1,282 1,358 1,419 1,483
Internet 400 552 602 844 1,316 1,776 2,258 2,743 3,263 3,838
Total 6,884 7,373 5,561 6,528 7,940 9,018 10,009 10,704 11,471 12,357
MAGAZINE ADSPEND (USD MILLIONS) ADSPEND SHARE (2013)
2007 2008 2009 2010 2011 2012 2013 2014 2015 2016
900
800
700
600
500
400
737
633
935
581538 529
578
490
623
470
Source: ZenithOptimedia Advertising Expenditure Forecasts June 2014
Magazines 5.8%
Outdoor 12.8% Newspapers
2.7%
Radio 5.2%
Cinema 1.8%
Internet 22.6%
TV 49.1%
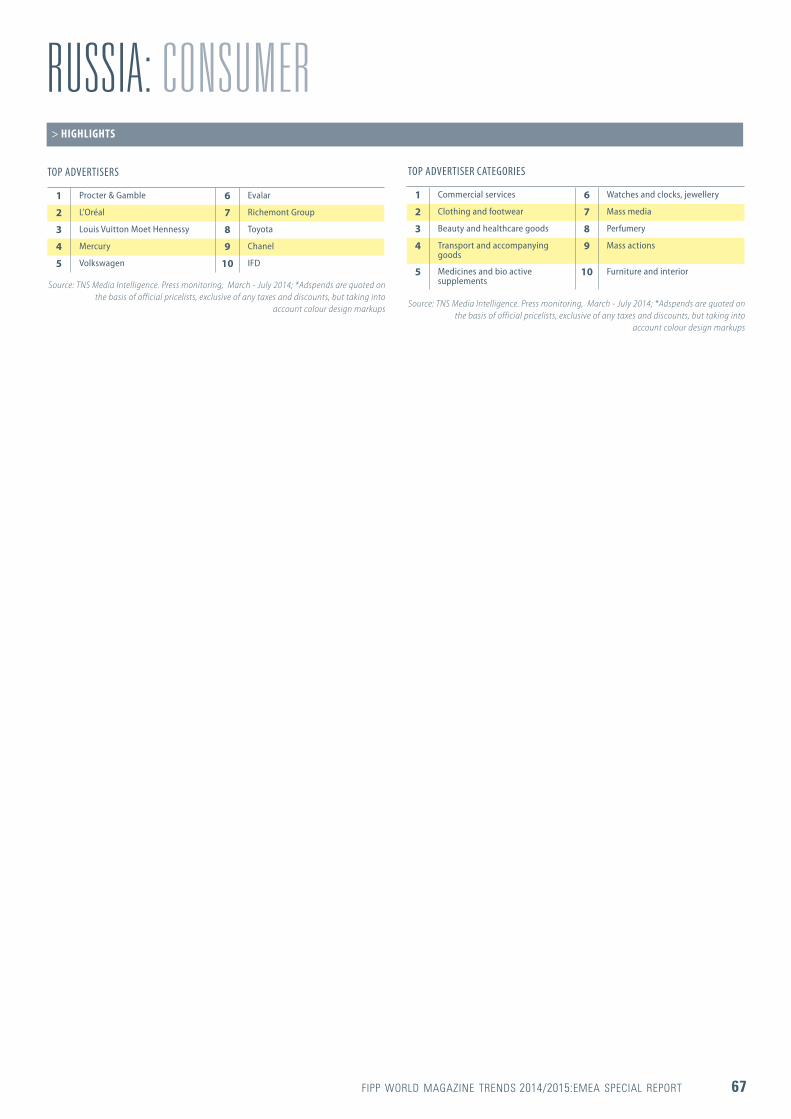
FIPP WORLD MAGAZINE TRENDS 2014/2015:EMEA SPECIAL REPORT 67
> HIGHLIGHTS
TOP ADVERTISERS
1 Procter & Gamble 6 Evalar
2 L'Oréal 7 Richemont Group
3 Louis Vuitton Moet Hennessy 8 Toyota
4 Mercury 9 Chanel
5 Volkswagen 10 IFD
Source: TNS Media Intelligence. Press monitoring, March - July 2014; *Adspends are quoted on the basis of official pricelists, exclusive of any taxes and discounts, but taking into
account colour design markups
TOP ADVERTISER CATEGORIES
1 Commercial services 6 Watches and clocks, jewellery
2 Clothing and footwear 7 Mass media
3 Beauty and healthcare goods 8 Perfumery
4 Transport and accompanying goods
9 Mass actions
5 Medicines and bio active supplements
10 Furniture and interior
Source: TNS Media Intelligence. Press monitoring, March - July 2014; *Adspends are quoted on the basis of official pricelists, exclusive of any taxes and discounts, but taking into
account colour design markups
RUSSIA: CONSUMER

68 FIPP WORLD MAGAZINE TRENDS 2014/2015: EMEA SPECIAL REPORT
After years of relative stability in its composition, operational scope and playing field, the South African magazine media industry has seen the onset of some major changes in 2013.
The biggest of these has been Caxton Media acquiring the remaining stake in family-run Ramsay Media. From two notable players leading a pack of four similarly sized publishers, it will now only be Associated Media (five titles) and Condé Nast Independent (three titles) sailing in the wake of Media24 Magazines and Caxton.
The rest of the media environment is becoming increasingly fragmented and specialised as custom and digital publishers (or content agencies) continue to expand and grow their share of the audiences and revenues migrating to new media platforms.
However, given the diversity of the audience and growth in the emerging market segments, we expect there to be a strong market for printed magazines for a few years to come yet.
The past year was marked also by three major industry developments:
» The withdrawal of the National Association of Broadcasters (NAB) from the SA Advertising Research Foundation (SAARF), effective December 2014, spelled potential disaster for the future of independent audience measurement. However, considerable progress has been made around the negotiation table, leading to a change in leadership at SAARF. Agreement was reached to retain the ES (basis for AMPS, RAMS and TAMS), with some adjustments based on international best practice.
» After struggling for years, the Magazine Publishers’ Association (MPASA) finally disbanded at the end of 2013, with Print and Digital Media SA (PDMSA) absorbing the regulatory and lobbying functions.
» AMPS adjusted the Establishment Survey with the latest population figures from Sensus2011, taking into consideration the migrations between provinces and subsequent population diversification in mostly urban areas. This has had a material effect on sample sizes and representation of the respective population groups. As a result,
the 2013AB AMPS now serve as the new base benchmark for future surveys.
CirculationWhereas the industry at large has remained fairly stable in size (524 ABC registered magazines by March 2014; 218 of which consumer, 184 B2B, 102 customer and 20 free magazines), the same cannot be said of circulations overall.
According to the latest available ABCs (January-March 2014), total circulations decreased by 4% year-on-year, with single copy sales down 4.3% year-on-year and subscriptions – long considered the barometer of economic health – by 18%. Although in decline for a few years now, it is the second consecutive quarter that subscriptions declined by double digit percentage points.
The only highlight is the continued growth in digital editions, up 70% year-on-year, to now stand at average monthly sales of 89,144 copies; representing 1.9% of total circulation.
AdvertisingAlthough the world appears to be moving out of the recession, uncertainty regarding the local economy still looms and this is causing advertisers to be more vigilant than ever in controlling their spend. The growth in adspend has been pedestrian over the past year and given the gloomy outlook for GDP growth for 2014, we expect it to remain muted.
Content consumption on other platforms (many of them free) has also contributed to circulation declines and the rise of media inflation for magazines, impacting its inclusion in the media mix.
Consumer magazines currently have the lowest growth rate amongst all media in the South African market. Measured against the other major mediums, magazines held a market share of 6.6% in 2013, down 4.1% against 2008. Television still receives the lion’s share of adspend, followed by newspapers and radio – typical for developing markets.
Irrespective of the exponential growth in mobile internet access in South Africa, we do not expect mobile advertising to grow at the same rate as it does globally.
NATIONAL ASSOCIATION
» Print and Digital Media South Africa (PDMSA) PUBLISHERS
» Condé Nast Independent Magazines » Media24 Magazines » Media24 Magazines: Business » Media24 Markets » Media24: Lifestyle Magazines
> FIPP MEMBERS
> AT-A-GLANCE
» New Media Publishing » Panorama Publications » Strika Entertainment
SUPPLIERS
» Sappi Limited » Sappi Trading Africa
Capital: Pretoria Population: 48,375,645 (July 2014 est) Median age: 25.7 years GDP: US$353.9 billion (2013 est.) Consumer prices: 5.8% (2013 est.) Currency: Rand (ZAR) Official language: IsiZulu (22.7%), IsiXhosa (16%), Afrikaans (13.5%), Sepedi (9.1%), Setswana (8%), English (9.6%), Sesotho (7.6%), Xitsonga (4.5%), SiSwati (2.5%), Tshivenda (2.4%), IsiNdebele (1.6%) Literacy rate: 93% SOURCE: CIA WORLD FACTBOOK (JULY 2014)
DIGITAL DATA
Internet penetration: 24,909,854 % of population: 51% SOURCE: INTERNET LIVE STATS (JULY 2014 EST.) Mobile penetration: 68,400,000 (2012) % of population: 141 SOURCE: CIA WORLD FACTBOOK (JULY 2014)
PRINT TAX
Standard rate: 14% Magazine, newspaper, book and digital purchases: 14% Tax on advertising: 14%
SOURCE: MEDIA24
CROSS-MEDIA OWNERSHIP RESTRICTIONS
owner registration foreign ownership cross-media ownership concentration
Key: ALLOWED RESTRICTED NOT ALLOWED
SOURCE: PDMSA
ADVERTISING RESTRICTIONS
Tobacco Alcohol Advertising to children Over-the-counter drugs Infant food
Key: BANNED BY LAW VOLUNTARILY STOPPED RESTRICTED BY LAW RESTRICTED VOLUNTARILY
SOURCE: MEDIA24 MAGAZINES
SOUTH AFRICA
> SPECIAL REPORT: PMDSA MAGAZINES
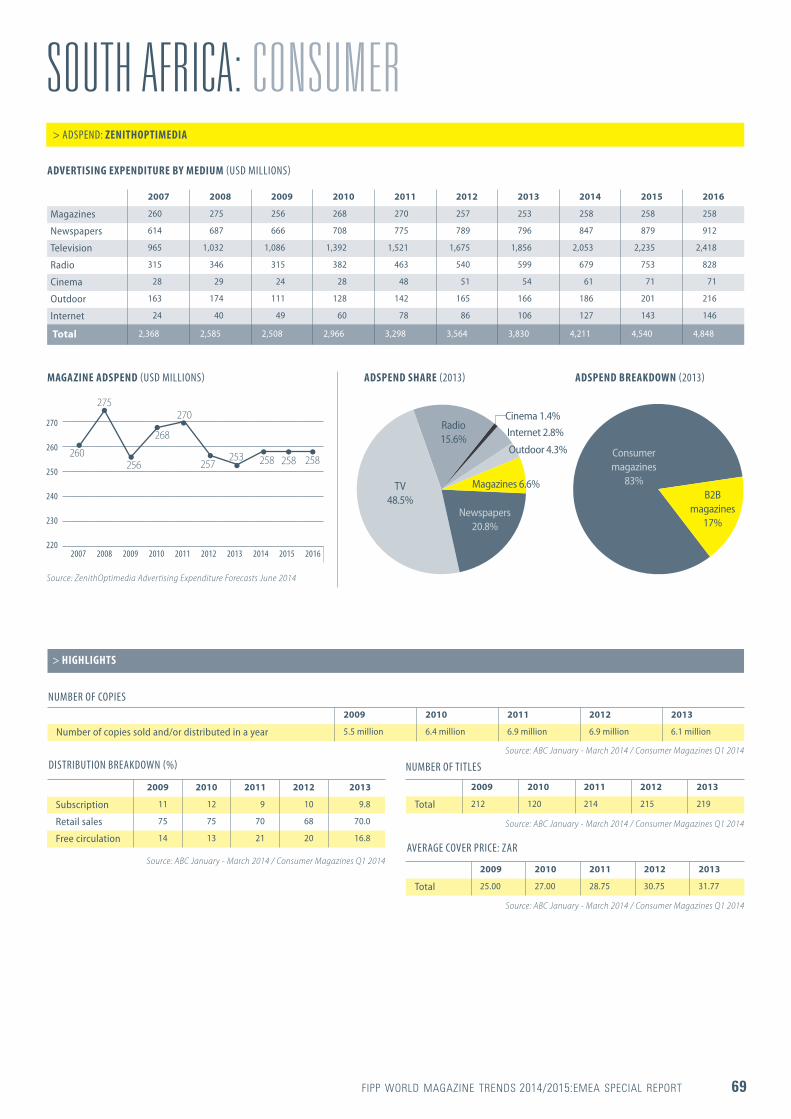
FIPP WORLD MAGAZINE TRENDS 2014/2015:EMEA SPECIAL REPORT 69
SOUTH AFRICA: CONSUMER> ADSPEND: ZENITHOPTIMEDIA
ADVERTISING EXPENDITURE BY MEDIUM (USD MILLIONS)
MAGAZINE ADSPEND (USD MILLIONS) ADSPEND SHARE (2013) ADSPEND BREAKDOWN (2013)
DISTRIBUTION BREAKDOWN (%)
2007 2008 2009 2010 2011 2012 2013 2014 2015 2016
Magazines 260 275 256 268 270 257 253 258 258 258
Newspapers 614 687 666 708 775 789 796 847 879 912
Television 965 1,032 1,086 1,392 1,521 1,675 1,856 2,053 2,235 2,418
Radio 315 346 315 382 463 540 599 679 753 828
Cinema 28 29 24 28 48 51 54 61 71 71
Outdoor 163 174 111 128 142 165 166 186 201 216
Internet 24 40 49 60 78 86 106 127 143 146
Total 2,368 2,585 2,508 2,966 3,298 3,564 3,830 4,211 4,540 4,848
2009 2010 2011 2012 2013
Subscription 11 12 9 10 9.8
Retail sales 75 75 70 68 70.0
Free circulation 14 13 21 20 16.8
2007 2008 2009 2010 2011 2012 2013 2014 2015 2016
270
260
250
240
230
220
260257
275
253256 258
268
258
270
258
Source: ZenithOptimedia Advertising Expenditure Forecasts June 2014
Source: ABC January - March 2014 / Consumer Magazines Q1 2014
Magazines 6.6%
Cinema 1.4%
Newspapers 20.8%
Radio 15.6%
Outdoor 4.3%
Internet 2.8%
TV 48.5%
NUMBER OF COPIES
AVERAGE COVER PRICE: ZAR
NUMBER OF TITLES
2009 2010 2011 2012 2013
Number of copies sold and/or distributed in a year 5.5 million 6.4 million 6.9 million 6.9 million 6.1 million
> HIGHLIGHTS
2009 2010 2011 2012 2013
Total 212 120 214 215 219
2009 2010 2011 2012 2013
Total 25.00 27.00 28.75 30.75 31.77
Source: ABC January - March 2014 / Consumer Magazines Q1 2014
Source: ABC January - March 2014 / Consumer Magazines Q1 2014
Source: ABC January - March 2014 / Consumer Magazines Q1 2014
Consumer magazines
83%B2B
magazines 17%
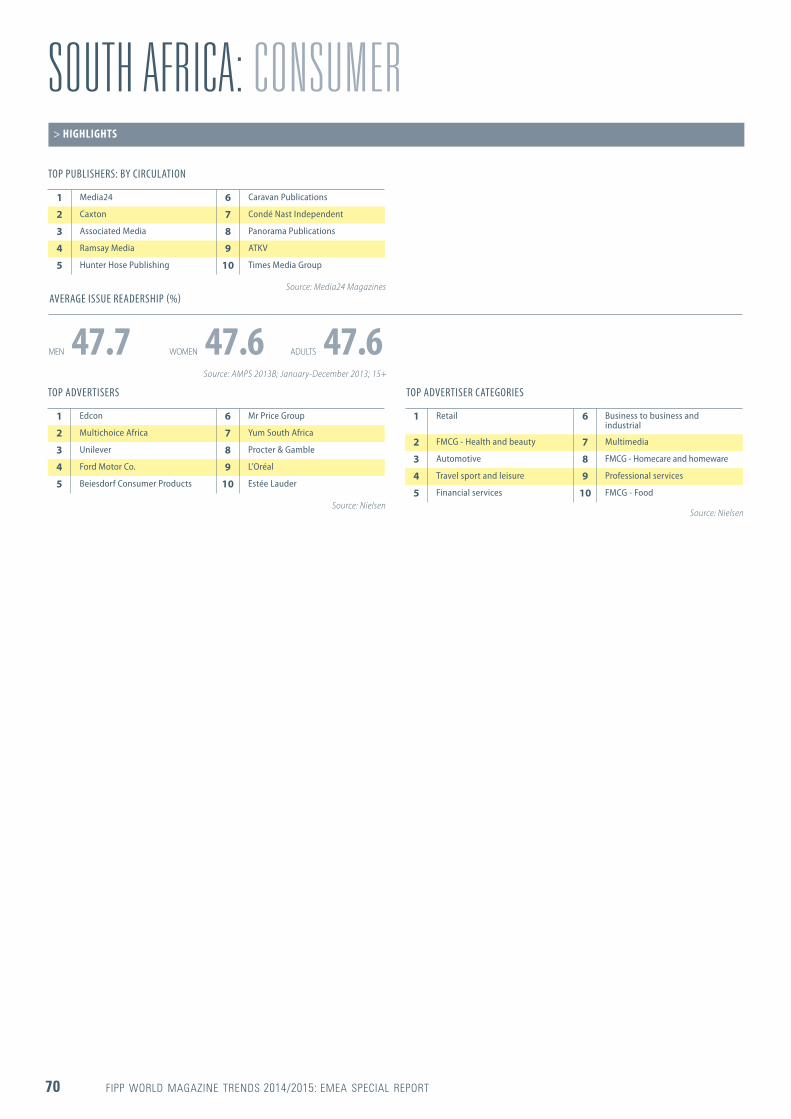
70 FIPP WORLD MAGAZINE TRENDS 2014/2015: EMEA SPECIAL REPORT
SOUTH AFRICA: CONSUMER
TOP ADVERTISERS
TOP PUBLISHERS: BY CIRCULATION
TOP ADVERTISER CATEGORIES
AVERAGE ISSUE READERSHIP (%)
> HIGHLIGHTS
1 Edcon 6 Mr Price Group
2 Multichoice Africa 7 Yum South Africa
3 Unilever 8 Procter & Gamble
4 Ford Motor Co. 9 L'Oréal
5 Beiesdorf Consumer Products 10 Estée Lauder
1 Media24 6 Caravan Publications
2 Caxton 7 Condé Nast Independent
3 Associated Media 8 Panorama Publications
4 Ramsay Media 9 ATKV
5 Hunter Hose Publishing 10 Times Media Group
1 Retail 6 Business to business and industrial
2 FMCG - Health and beauty 7 Multimedia
3 Automotive 8 FMCG - Homecare and homeware
4 Travel sport and leisure 9 Professional services
5 Financial services 10 FMCG - Food
MEN 47.7 WOMEN 47.6 ADULTS 47.6
Source: AMPS 2013B; January-December 2013; 15+
Source: Nielsen
Source: Media24 Magazines
Source: Nielsen
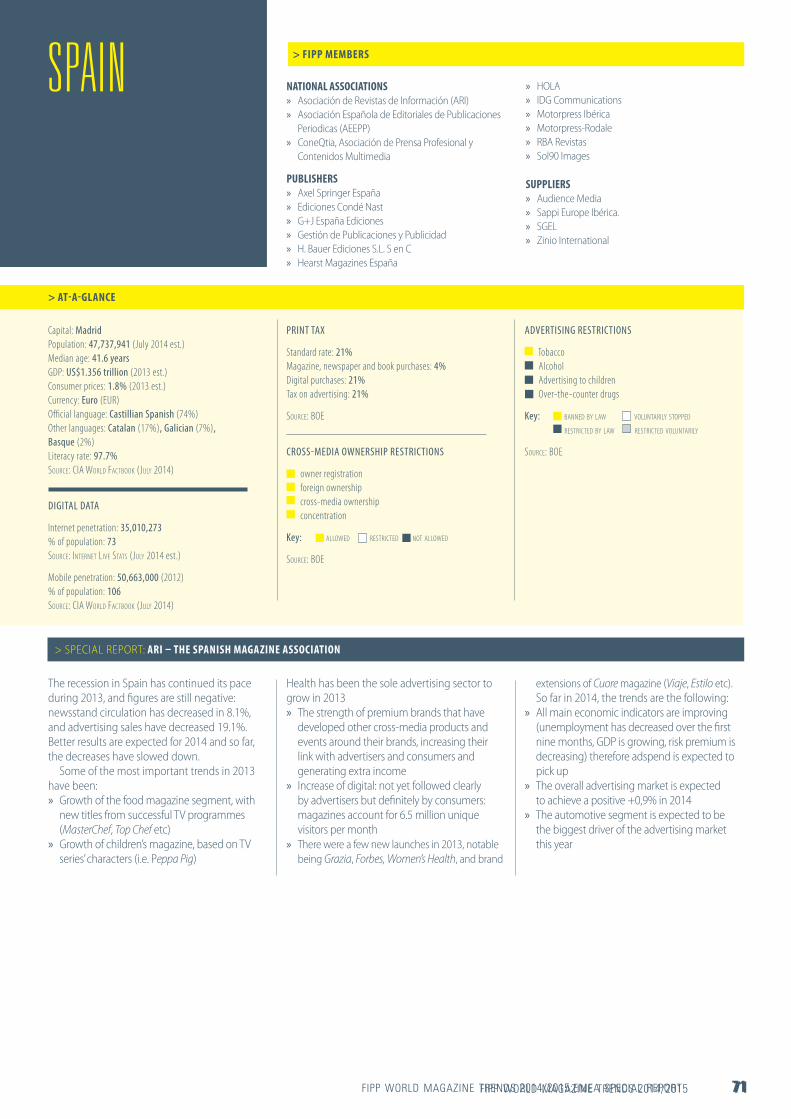
FIPP WORLD MAGAZINE TRENDS 2014/2015:EMEA SPECIAL REPORT 71FIPP WORLD MAGAZINE TRENDS 2014/2015 71
NATIONAL ASSOCIATIONS » Asociación de Revistas de Información (ARI) » Asociación Española de Editoriales de Publicaciones
Periodicas (AEEPP) » ConeQtia, Asociación de Prensa Profesional y
Contenidos Multimedia
PUBLISHERS » Axel Springer España » Ediciones Condé Nast » G+J España Ediciones » Gestión de Publicaciones y Publicidad » H. Bauer Ediciones S.L. S en C » Hearst Magazines España
> FIPP MEMBERS
> AT-A-GLANCE
» HOLA » IDG Communications » Motorpress Ibérica » Motorpress-Rodale » RBA Revistas » Sol90 Images
SUPPLIERS » Audience Media » Sappi Europe Ibérica. » SGEL » Zinio International
Capital: Madrid Population: 47,737,941 (July 2014 est.) Median age: 41.6 years GDP: US$1.356 trillion (2013 est.) Consumer prices: 1.8% (2013 est.) Currency: Euro (EUR) Official language: Castillian Spanish (74%)Other languages: Catalan (17%), Galician (7%), Basque (2%) Literacy rate: 97.7% SOURCE: CIA WORLD FACTBOOK (JULY 2014)
DIGITAL DATA
Internet penetration: 35,010,273 % of population: 73 SOURCE: INTERNET LIVE STATS (JULY 2014 est.)
Mobile penetration: 50,663,000 (2012) % of population: 106 SOURCE: CIA WORLD FACTBOOK (JULY 2014)
PRINT TAX
Standard rate: 21% Magazine, newspaper and book purchases: 4% Digital purchases: 21% Tax on advertising: 21%
SOURCE: BOE
CROSS-MEDIA OWNERSHIP RESTRICTIONS
owner registration foreign ownership cross-media ownership concentration
Key: ALLOWED RESTRICTED NOT ALLOWED
SOURCE: BOE
ADVERTISING RESTRICTIONS
Tobacco Alcohol Advertising to children Over-the-counter drugs
Key: BANNED BY LAW VOLUNTARILY STOPPED RESTRICTED BY LAW RESTRICTED VOLUNTARILY
SOURCE: BOE
SPAIN
The recession in Spain has continued its pace during 2013, and figures are still negative: newsstand circulation has decreased in 8.1%, and advertising sales have decreased 19.1%. Better results are expected for 2014 and so far, the decreases have slowed down.
Some of the most important trends in 2013 have been:
» Growth of the food magazine segment, with new titles from successful TV programmes (MasterChef, Top Chef etc)
» Growth of children’s magazine, based on TV series’ characters (i.e. Peppa Pig)
Health has been the sole advertising sector to grow in 2013
» The strength of premium brands that have developed other cross-media products and events around their brands, increasing their link with advertisers and consumers and generating extra income
» Increase of digital: not yet followed clearly by advertisers but definitely by consumers: magazines account for 6.5 million unique visitors per month
» There were a few new launches in 2013, notable being Grazia, Forbes, Women’s Health, and brand
> SPECIAL REPORT: ARI – THE SPANISH MAGAZINE ASSOCIATION
extensions of Cuore magazine (Viaje, Estilo etc).So far in 2014, the trends are the following:
» All main economic indicators are improving (unemployment has decreased over the first nine months, GDP is growing, risk premium is decreasing) therefore adspend is expected to pick up
» The overall advertising market is expected to achieve a positive +0,9% in 2014
» The automotive segment is expected to be the biggest driver of the advertising market this year
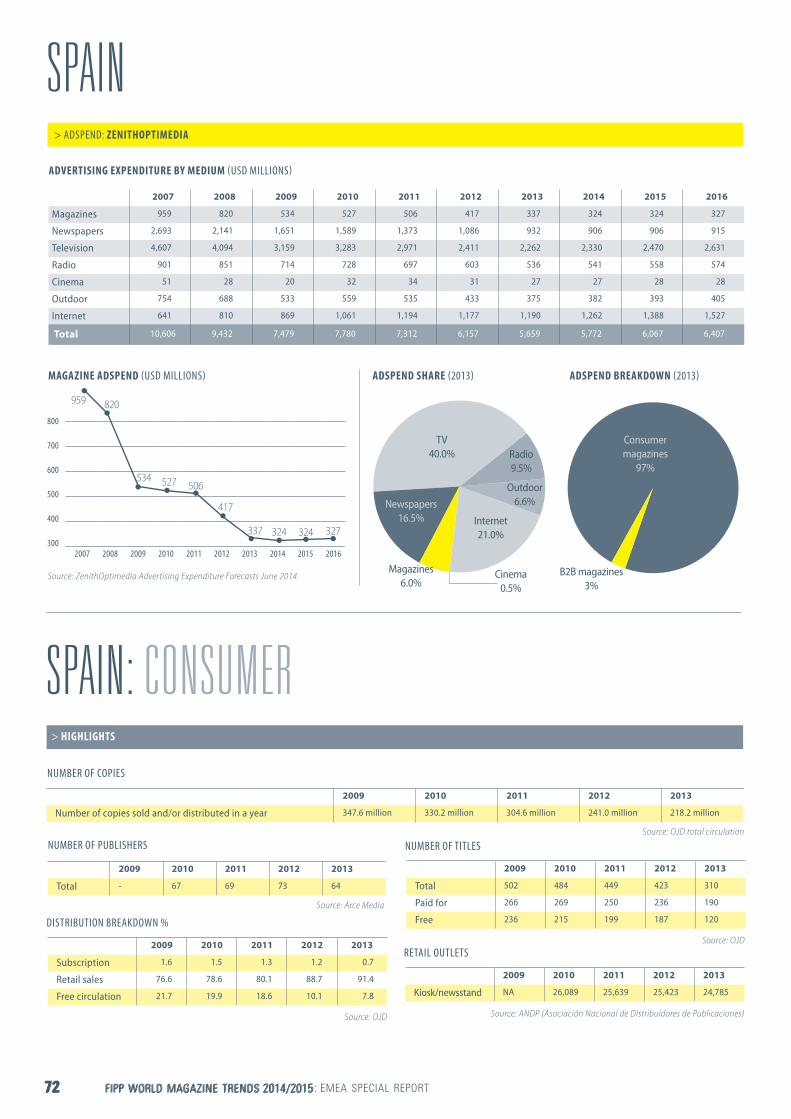
72 FIPP WORLD MAGAZINE TRENDS 2014/2015: EMEA SPECIAL REPORT 72 FIPP WORLD MAGAZINE TRENDS 2014/2015 72 FIPP WORLD MAGAZINE TRENDS 2014/2015
SPAIN
SPAIN: CONSUMERNUMBER OF COPIES
NUMBER OF TITLES
DISTRIBUTION BREAKDOWN %
2009 2010 2011 2012 2013
Number of copies sold and/or distributed in a year 347.6 million 330.2 million 304.6 million 241.0 million 218.2 million
> HIGHLIGHTS
2009 2010 2011 2012 2013
Total 502 484 449 423 310
Paid for 266 269 250 236 190
Free 236 215 199 187 120
2009 2010 2011 2012 2013
Subscription 1.6 1.5 1.3 1.2 0.7
Retail sales 76.6 78.6 80.1 88.7 91.4
Free circulation 21.7 19.9 18.6 10.1 7.8
Source: OJD total circulation
Source: OJD
Source: OJD
> ADSPEND: ZENITHOPTIMEDIA
RETAIL OUTLETS
2009 2010 2011 2012 2013
Kiosk/newsstand NA 26,089 25,639 25,423 24,785
Source: ANDP (Asociación Nacional de Distribuidores de Publicaciones)
NUMBER OF PUBLISHERS
2009 2010 2011 2012 2013
Total - 67 69 73 64
Source: Arce Media
MAGAZINE ADSPEND (USD MILLIONS) ADSPEND SHARE (2013) ADSPEND BREAKDOWN (2013)
800
700
600
500
400
300
959
417
820
337
534
324
527
324
506
327
Source: ZenithOptimedia Advertising Expenditure Forecasts June 2014Magazines
6.0%
Outdoor 6.6%
Cinema 0.5%
Newspapers 16.5%
Radio 9.5%
Internet 21.0%
TV 40.0%
Consumer magazines
97%
B2B magazines 3%
ADVERTISING EXPENDITURE BY MEDIUM (USD MILLIONS)
2007 2008 2009 2010 2011 2012 2013 2014 2015 2016
Magazines 959 820 534 527 506 417 337 324 324 327
Newspapers 2,693 2,141 1,651 1,589 1,373 1,086 932 906 906 915
Television 4,607 4,094 3,159 3,283 2,971 2,411 2,262 2,330 2,470 2,631
Radio 901 851 714 728 697 603 536 541 558 574
Cinema 51 28 20 32 34 31 27 27 28 28
Outdoor 754 688 533 559 535 433 375 382 393 405
Internet 641 810 869 1,061 1,194 1,177 1,190 1,262 1,388 1,527
Total 10,606 9,432 7,479 7,780 7,312 6,157 5,659 5,772 6,067 6,407
2007 2008 2009 2010 2011 2012 2013 2014 2015 2016
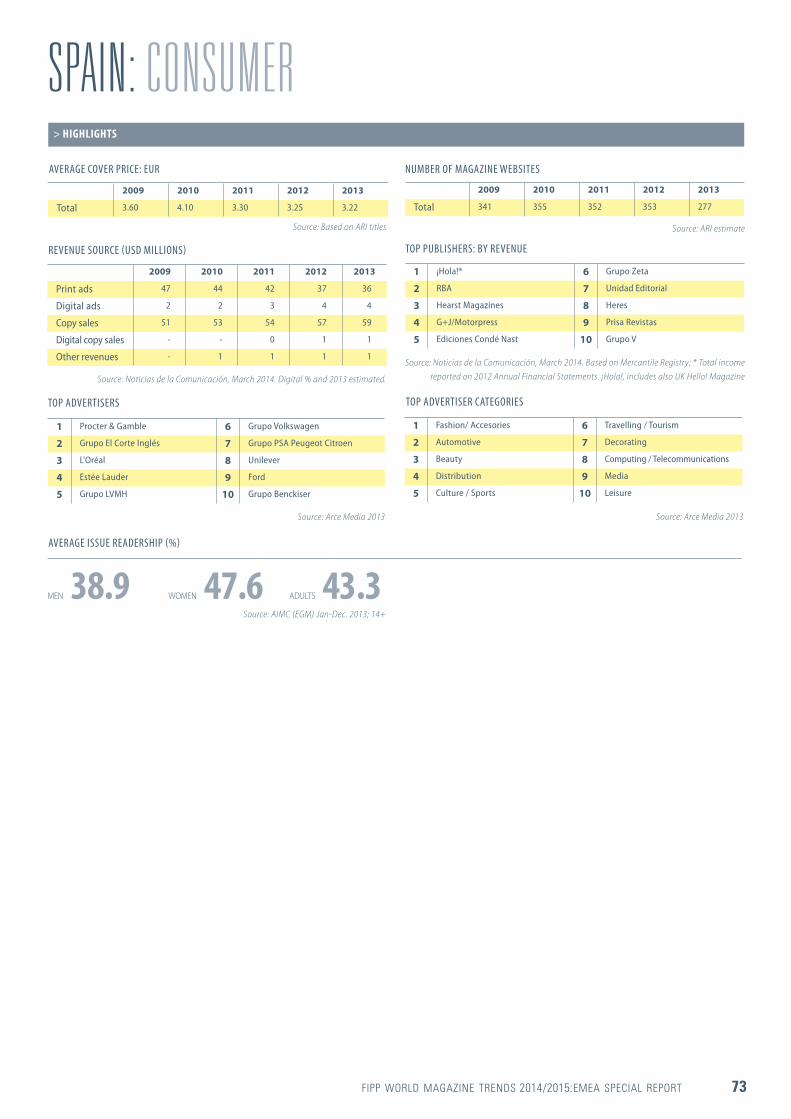
FIPP WORLD MAGAZINE TRENDS 2014/2015:EMEA SPECIAL REPORT 73
SPAIN: CONSUMER> HIGHLIGHTS
AVERAGE COVER PRICE: EUR
2009 2010 2011 2012 2013
Total 3.60 4.10 3.30 3.25 3.22
Source: Based on ARI titles
TOP ADVERTISERS
1 Procter & Gamble 6 Grupo Volkswagen
2 Grupo El Corte Inglés 7 Grupo PSA Peugeot Citroen
3 L'Oréal 8 Unilever
4 Estée Lauder 9 Ford
5 Grupo LVMH 10 Grupo Benckiser
Source: Arce Media 2013
REVENUE SOURCE (USD MILLIONS)
2009 2010 2011 2012 2013
Print ads 47 44 42 37 36
Digital ads 2 2 3 4 4
Copy sales 51 53 54 57 59
Digital copy sales - - 0 1 1
Other revenues - 1 1 1 1
Source: Noticias de la Comunicación, March 2014. Digital % and 2013 estimated.
TOP PUBLISHERS: BY REVENUE
1 ¡Hola!* 6 Grupo Zeta
2 RBA 7 Unidad Editorial
3 Hearst Magazines 8 Heres
4 G+J/Motorpress 9 Prisa Revistas
5 Ediciones Condé Nast 10 Grupo V
Source: Noticias de la Comunicación, March 2014. Based on Mercantile Registry; * Total income reported on 2012 Annual Financial Statements. ¡Hola!, includes also UK Hello! Magazine
AVERAGE ISSUE READERSHIP (%)
MEN 38.9 WOMEN 47.6 ADULTS 43.3 Source: AIMC (EGM) Jan-Dec. 2013; 14+
TOP ADVERTISER CATEGORIES
1 Fashion/ Accesories 6 Travelling / Tourism
2 Automotive 7 Decorating
3 Beauty 8 Computing / Telecommunications
4 Distribution 9 Media
5 Culture / Sports 10 Leisure
Source: Arce Media 2013
NUMBER OF MAGAZINE WEBSITES
2009 2010 2011 2012 2013
Total 341 355 352 353 277
Source: ARI estimate

74 FIPP WORLD MAGAZINE TRENDS 2014/2015: EMEA SPECIAL REPORT
NATIONAL ASSOCIATION
» Sveriges Tidskrifter (Swedish Magazine Publishers Association)
PUBLISHERS
» Aller International » Aller Magazine » Aller Media » Bonnier » Bonnier International Magazines » Bonnier Tidskrifter
> FIPP MEMBERS
> AT-A-GLANCE
» Egmont Kärnan » Egmont Tidskrifter » LRF Media » Plaza Publishing Group
SUPPLIERS
» Adobe Systems » Holmen Paper » Mag+
Capital: Stockholm Population: 9,723,809 (July 2014 est.) Median age: 41.2 years GDP: US$552 billion (2013 est.) Consumer prices: 0% (2013 est.) Currency: Swedish kronor (SEK) Official language: Swedish Other languages: Small Sami and Finish speaking minorities Literacy rate: 99% SOURCE: CIA WORLD FACTBOOK (JULY 2014)
DIGITAL DATA
Internet penetration: 8,581,261 % of population: 88 SOURCE: INTERNET LIVE STATS (JULY 2014 EST.)
Mobile penetration: 11,643,000 (2012) % of population: 120 SOURCE: CIA WORLD FACTBOOK (JULY 2014)
PRINT TAX
Standard rate: 25% Magazine, newspaper and book purchases: 6% Digital purchases: 25% Tax on advertising: 3%
SOURCE: THE SWEDISH TAX AGENCY; ACCORDING TO THE ADVERTISING LAW THE TAXATION AUTHORITY IS DUE TO PAY BACK PAID ADVERTISING TAX WHICH IS EQUIVALENT TO A TAXABLE TURNOVER AMOUNTING TO 50 MILLION SEK FOR THE FULL YEAR (REIMBURSEMENT MAXIMUM OF 1,500,000 SEK / YEAR)
ADVERTISING RESTRICTIONS
Tobacco Alcohol Advertising to children Over-the-counter drugs
Key: BANNED BY LAW VOLUNTARILY STOPPED RESTRICTED BY LAW RESTRICTED VOLUNTARILY
SOURCE: SVERIGES TIDSKRIFTER
SWEDEN
During 2013 the 362 audited magazines in Sweden produced 20.4 million copies per issue, with a total of 289 million copies over the year. Ten years earlier, the industry sold 22.8 million copies per issue, and 419 titles were then audited. Consequently the average audited circulation per title has actually increased during this period.
According to Nordicom/Gothenburg University, 58% of the Swedish population (ages 9-79 years) read at least one magazine in an average week in 2013. Nordicom also reports
that the average Swede spends 36 minutes a day reading consumer magazines, and 28 minutes on trade journals and B2B magazines. The trend is stable, with a slight tendency to increase. The same trend is shown in TNS Sifo’s studies. The time spent on magazines has increased to 42 minutes; up 2 minutes since 2006.
The Swedish magazine market (B2C and B2B) has an estimated annual turnover of about SEK5.8 billion, with almost 70% of the earnings derived from sold copies and roughly 30% derived from
> SPECIAL REPORT: SVERIGES TIDSKRIFTER
advertising investments, according to the IRM Institute for Advertising & Media Statistics.
During 2012 a total of SEK65.6 billion was spent on marketing activities in Sweden, and of that, SEK31.4 billion was invested in media (direct mail and in-store media included). The magazine market’s share of the media investments was about 6% according to the IRM Institute for Advertising & Media and ZenithOptimedia.
The Swedish Magazine Publishers Association represents more than 350 Swedish magazines.
> ADSPEND: ZENITHOPTIMEDIA
ADVERTISING EXPENDITURE BY MEDIUM (USD MILLIONS)
2007 2008 2009 2010 2011 2012 2013 2014 2015 2016
Magazines 394 391 280 298 298 271 232 212 195 187
Newspapers 1,399 1,345 1,092 1,197 1,204 1,058 918 826 744 669
Television 721 763 675 798 875 911 911 925 928 946
Radio 108 112 96 106 116 103 93 96 96 93
Cinema 14 16 16 18 19 17 18 18 18 18
Outdoor 160 163 147 166 168 165 151 153 153 154
Internet 654 796 813 929 1,070 1,213 1,379 1,575 1,769 1,991
Total 3,449 3,586 3,118 3,513 3,752 3,739 3,702 3,805 3,902 4,058

FIPP WORLD MAGAZINE TRENDS 2014/2015:EMEA SPECIAL REPORT 75
SWEDEN
SWEDEN: CONSUMER
MAGAZINE ADSPEND (USD MILLIONS) ADSPEND SHARE (2013) ADSPEND BREAKDOWN (2013)
NUMBER OF COPIES
DISTRIBUTION BREAKDOWN (%)
NUMBER OF TITLES
2009 2010 2011 2012 2013
Number of copies sold and/or distributed in a year 330 million 318 million 308 million 302 million 289 million
> HIGHLIGHTS
2009 2010 2011 2012 2013
Total 191 198 178 178 154
2009 2010 2011 2012 2013
Subscription 91 90.9 91.5 91.6 92.2
Retail sales 9 9.1 8.5 8.4 7.8
2007 2008 2009 2010 2011 2012 2013 2014 2015 2016
400
350
300
250
200
150
394
271
391
232
280
212
298
195
298
187
Source: ZenithOptimedia Advertising Expenditure Forecasts June 2014
Source: TS Mediefakta audited b2c and b2b magazines only
Source: Nordicom and TS Mediefakta based on audited magazines only
AVERAGE COVER PRICE: SEK
2009 2010 2011 2012 2013
Total - 38.29 39.97 - -
Source: Sveriges Tidskrifter
Source: TS Mediefakta audited B2B and B2C magazines only
Magazines 6.3%
Outdoor 4.1%Cinema
0.5%
Newspapers 24.8%
Radio 2.5%
Internet 37.3%
TV 24.6%
> ADSPEND: ZENITHOPTIMEDIA
NUMBER OF CONSUMER MAGAZINE WEBSITES
2009 2010 2011 2012 2013
Total 172 178 160 175 150
Source: Sveriges Tidskrifter (estimate)
NUMBER OF PUBLISHERS
2009 2010 2011 2012 2013
Total - - - - 243
Source: Anette Johansson, Ways Forward (2014); Includes B2B and B2C
RETAIL OUTLETS
2009 2010 2011 2012 2013
Kiosk/newsstand - - - - 7,200
Source: Tidsam
REVENUE SOURCE (%)
2009 2010 2011 2012 2013
Print ads - - 23 30 30
Digital ads - - 2 2 3
Copy sales - - 73 65 62
Digital copy sales
- - 1 1 4
Other - - 1 2 1
Source: Sveriges Tidskrifter
B2B magazines
51%
Consumer magazines
49%
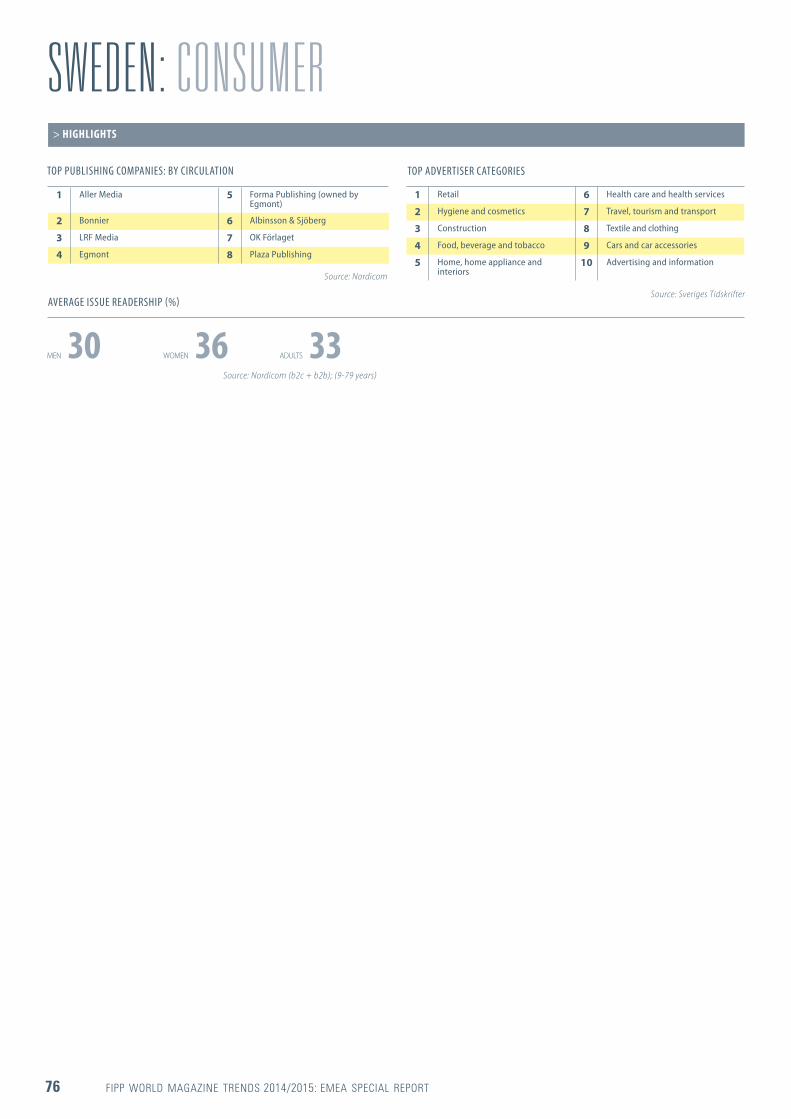
76 FIPP WORLD MAGAZINE TRENDS 2014/2015: EMEA SPECIAL REPORT
SWEDEN: CONSUMER> HIGHLIGHTS
TOP PUBLISHING COMPANIES: BY CIRCULATION
1 Aller Media 5 Forma Publishing (owned by Egmont)
2 Bonnier 6 Albinsson & Sjöberg
3 LRF Media 7 OK Förlaget
4 Egmont 8 Plaza Publishing
Source: Nordicom
Source: Sveriges Tidskrifter
TOP ADVERTISER CATEGORIES
1 Retail 6 Health care and health services
2 Hygiene and cosmetics 7 Travel, tourism and transport
3 Construction 8 Textile and clothing
4 Food, beverage and tobacco 9 Cars and car accessories
5 Home, home appliance and interiors
10 Advertising and information
AVERAGE ISSUE READERSHIP (%)
MEN 30 WOMEN 36 ADULTS 33Source: Nordicom (b2c + b2b); (9-79 years)
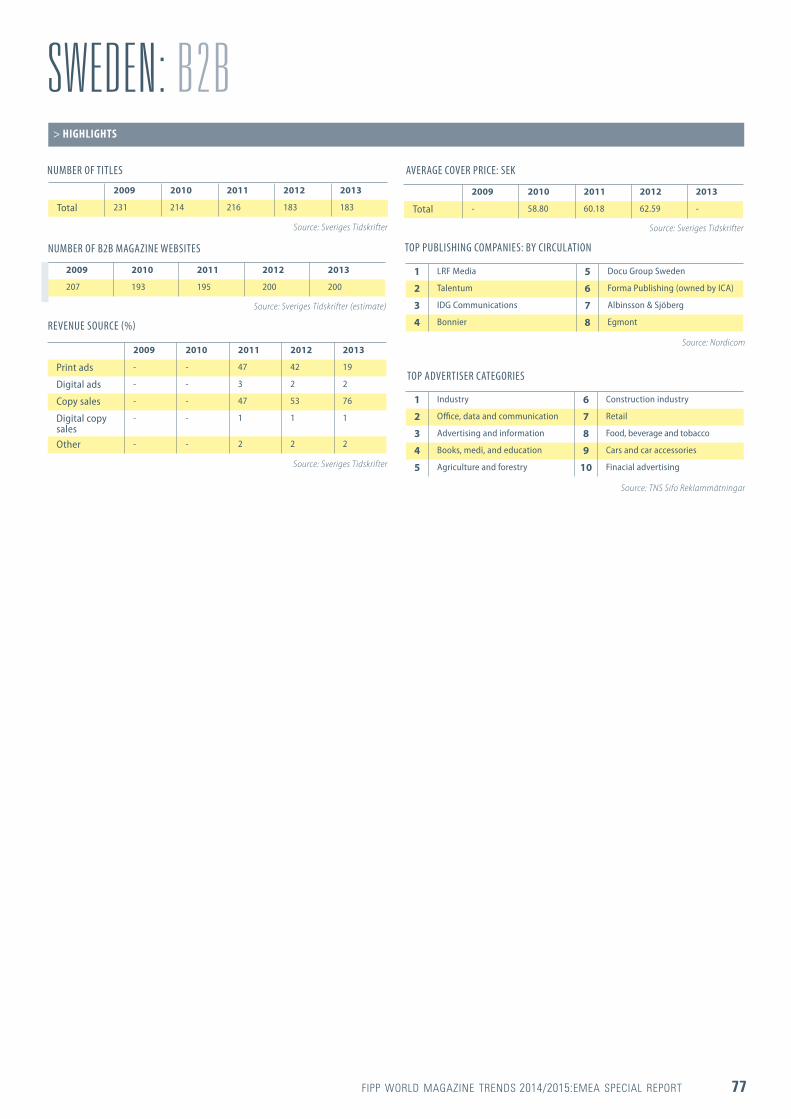
FIPP WORLD MAGAZINE TRENDS 2014/2015:EMEA SPECIAL REPORT 77
SWEDEN: B2B
NUMBER OF B2B MAGAZINE WEBSITES
AVERAGE COVER PRICE: SEK
> HIGHLIGHTS
2009 2010 2011 2012 2013
207 193 195 200 200
2009 2010 2011 2012 2013
Total - 58.80 60.18 62.59 -
NUMBER OF TITLES
2009 2010 2011 2012 2013
Total 231 214 216 183 183
Source: Sveriges Tidskrifter Source: Sveriges Tidskrifter
Source: Sveriges Tidskrifter (estimate)
REVENUE SOURCE (%)
2009 2010 2011 2012 2013
Print ads - - 47 42 19
Digital ads - - 3 2 2
Copy sales - - 47 53 76
Digital copy sales
- - 1 1 1
Other - - 2 2 2
Source: Sveriges Tidskrifter
TOP PUBLISHING COMPANIES: BY CIRCULATION
1 LRF Media 5 Docu Group Sweden
2 Talentum 6 Forma Publishing (owned by ICA)
3 IDG Communications 7 Albinsson & Sjöberg
4 Bonnier 8 Egmont
Source: Nordicom
Source: TNS Sifo Reklammätningar
TOP ADVERTISER CATEGORIES
1 Industry 6 Construction industry
2 Office, data and communication 7 Retail
3 Advertising and information 8 Food, beverage and tobacco
4 Books, medi, and education 9 Cars and car accessories
5 Agriculture and forestry 10 Finacial advertising
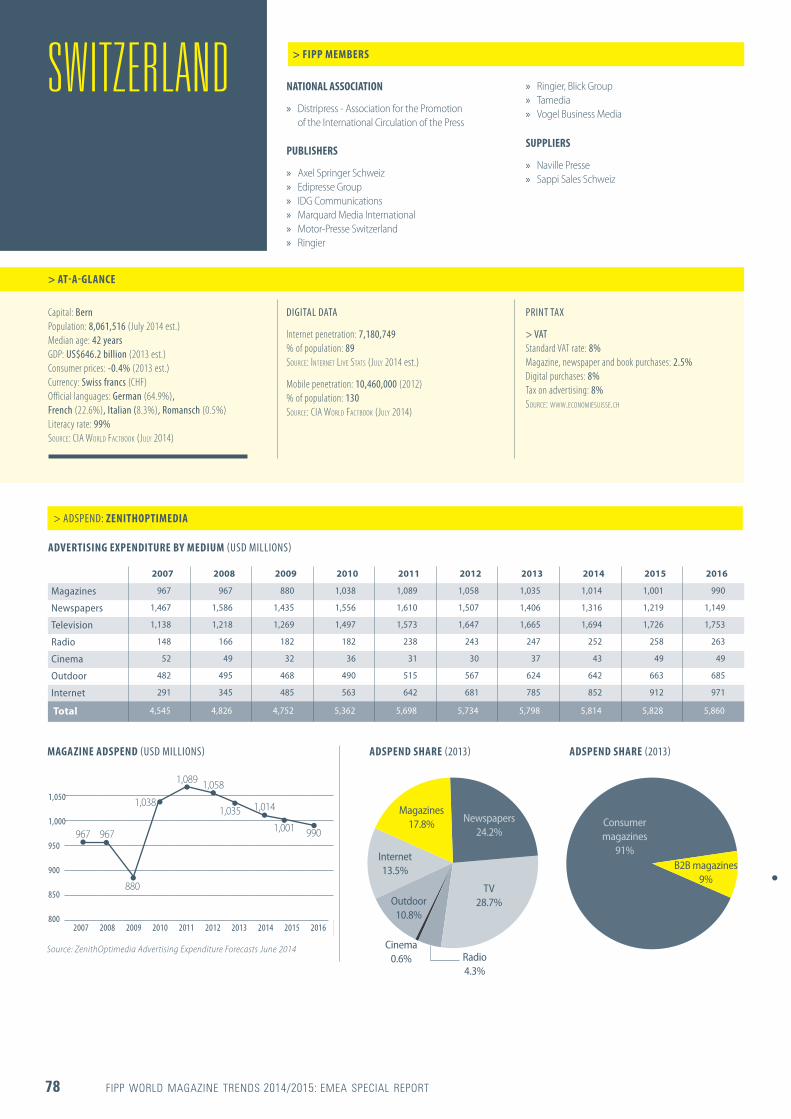
78 FIPP WORLD MAGAZINE TRENDS 2014/2015: EMEA SPECIAL REPORT
NATIONAL ASSOCIATION
» Distripress - Association for the Promotion of the International Circulation of the Press
PUBLISHERS
» Axel Springer Schweiz » Edipresse Group » IDG Communications » Marquard Media International » Motor-Presse Switzerland » Ringier
> FIPP MEMBERS
> AT-A-GLANCE
» Ringier, Blick Group » Tamedia » Vogel Business Media
SUPPLIERS
» Naville Presse » Sappi Sales Schweiz
Capital: Bern Population: 8,061,516 (July 2014 est.) Median age: 42 years GDP: US$646.2 billion (2013 est.) Consumer prices: -0.4% (2013 est.) Currency: Swiss francs (CHF) Official languages: German (64.9%), French (22.6%), Italian (8.3%), Romansch (0.5%) Literacy rate: 99% SOURCE: CIA WORLD FACTBOOK (JULY 2014)
DIGITAL DATA
Internet penetration: 7,180,749 % of population: 89 SOURCE: INTERNET LIVE STATS (JULY 2014 est.)
Mobile penetration: 10,460,000 (2012) % of population: 130 SOURCE: CIA WORLD FACTBOOK (JULY 2014)
PRINT TAX
> VAT Standard VAT rate: 8% Magazine, newspaper and book purchases: 2.5% Digital purchases: 8% Tax on advertising: 8% SOURCE: WWW.ECONOMIESUISSE.CH
SWITZERLAND
> ADSPEND: ZENITHOPTIMEDIA
ADVERTISING EXPENDITURE BY MEDIUM (USD MILLIONS)
2007 2008 2009 2010 2011 2012 2013 2014 2015 2016
Magazines 967 967 880 1,038 1,089 1,058 1,035 1,014 1,001 990
Newspapers 1,467 1,586 1,435 1,556 1,610 1,507 1,406 1,316 1,219 1,149
Television 1,138 1,218 1,269 1,497 1,573 1,647 1,665 1,694 1,726 1,753
Radio 148 166 182 182 238 243 247 252 258 263
Cinema 52 49 32 36 31 30 37 43 49 49
Outdoor 482 495 468 490 515 567 624 642 663 685
Internet 291 345 485 563 642 681 785 852 912 971
Total 4,545 4,826 4,752 5,362 5,698 5,734 5,798 5,814 5,828 5,860
MAGAZINE ADSPEND (USD MILLIONS) ADSPEND SHARE (2013) ADSPEND SHARE (2013)
2007 2008 2009 2010 2011 2012 2013 2014 2015 2016
1,050
1,000
950
900
850
800
967
1,058
967
1,035
880
1,0141,038
1,001
1,089
990
Source: ZenithOptimedia Advertising Expenditure Forecasts June 2014
Magazines 17.8%
Cinema 0.6%
Outdoor 10.8%
Newspapers 24.2%
Radio 4.3%
Internet 13.5%
TV 28.7%
Consumer magazines
91%B2B magazines
9%
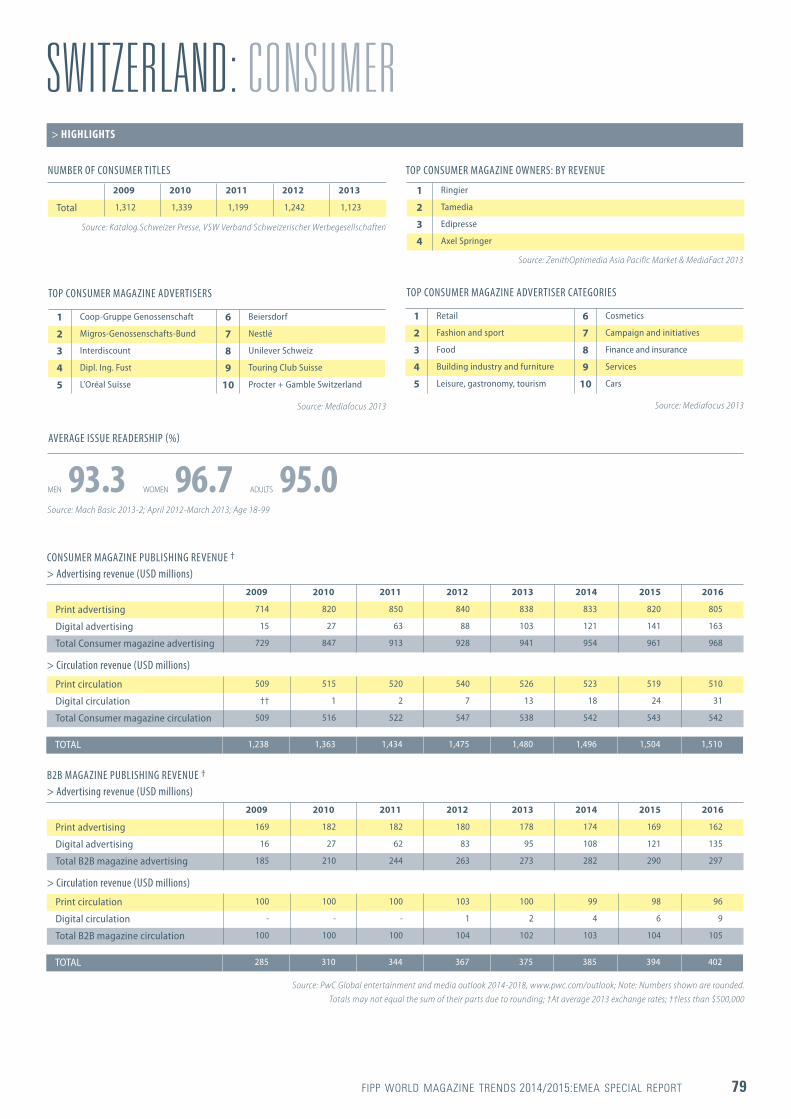
FIPP WORLD MAGAZINE TRENDS 2014/2015:EMEA SPECIAL REPORT 79
SWITZERLAND: CONSUMER> HIGHLIGHTS
TOP CONSUMER MAGAZINE ADVERTISERS
1 Coop-Gruppe Genossenschaft 6 Beiersdorf
2 Migros-Genossenschafts-Bund 7 Nestlé
3 Interdiscount 8 Unilever Schweiz
4 Dipl. Ing. Fust 9 Touring Club Suisse
5 L'Oréal Suisse 10 Procter + Gamble Switzerland
Source: Mediafocus 2013
TOP CONSUMER MAGAZINE OWNERS: BY REVENUE
1 Ringier
2 Tamedia
3 Edipresse
4 Axel Springer
Source: ZenithOptimedia Asia Pacific Market & MediaFact 2013
TOP CONSUMER MAGAZINE ADVERTISER CATEGORIES
1 Retail 6 Cosmetics
2 Fashion and sport 7 Campaign and initiatives
3 Food 8 Finance and insurance
4 Building industry and furniture 9 Services
5 Leisure, gastronomy, tourism 10 Cars
Source: Mediafocus 2013
NUMBER OF CONSUMER TITLES
2009 2010 2011 2012 2013
Total 1,312 1,339 1,199 1,242 1,123
Source: Katalog Schweizer Presse, VSW Verband Schweizerischer Werbegesellschaften
AVERAGE ISSUE READERSHIP (%)
Source: Mach Basic 2013-2; April 2012-March 2013; Age 18-99
MEN 93.3 WOMEN 96.7 ADULTS 95.0
CONSUMER MAGAZINE PUBLISHING REVENUE †
B2B MAGAZINE PUBLISHING REVENUE †
> Advertising revenue (USD millions)
> Advertising revenue (USD millions)
> Circulation revenue (USD millions)
> Circulation revenue (USD millions)
2009 2010 2011 2012 2013 2014 2015 2016
Print advertising 714 820 850 840 838 833 820 805
Digital advertising 15 27 63 88 103 121 141 163
Total Consumer magazine advertising 729 847 913 928 941 954 961 968
2009 2010 2011 2012 2013 2014 2015 2016
Print advertising 169 182 182 180 178 174 169 162
Digital advertising 16 27 62 83 95 108 121 135
Total B2B magazine advertising 185 210 244 263 273 282 290 297
Print circulation 509 515 520 540 526 523 519 510
Digital circulation †† 1 2 7 13 18 24 31
Total Consumer magazine circulation 509 516 522 547 538 542 543 542
Print circulation 100 100 100 103 100 99 98 96
Digital circulation - - - 1 2 4 6 9
Total B2B magazine circulation 100 100 100 104 102 103 104 105
TOTAL 1,238 1,363 1,434 1,475 1,480 1,496 1,504 1,510
TOTAL 285 310 344 367 375 385 394 402
Source: PwC Global entertainment and media outlook 2014-2018, www.pwc.com/outlook; Note: Numbers shown are rounded. Totals may not equal the sum of their parts due to rounding; †At average 2013 exchange rates; ††less than $500,000
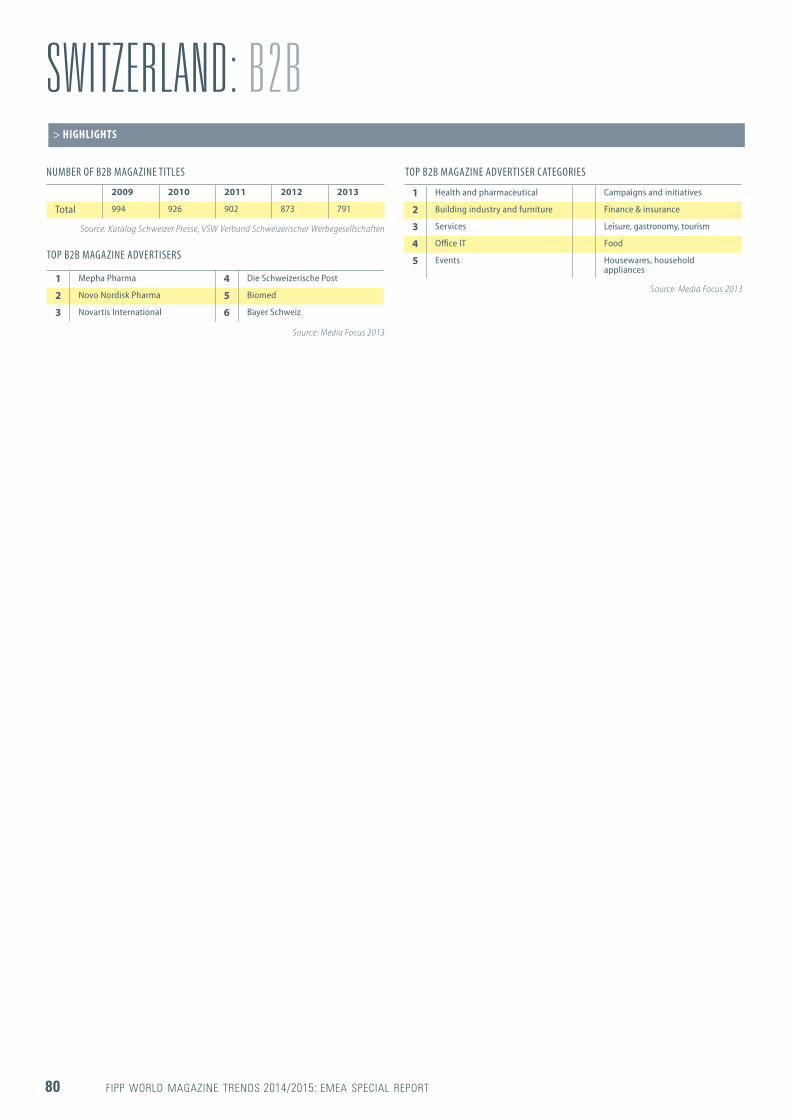
80 FIPP WORLD MAGAZINE TRENDS 2014/2015: EMEA SPECIAL REPORT
SWITZERLAND: B2B> HIGHLIGHTS
TOP B2B MAGAZINE ADVERTISERS
1 Mepha Pharma 4 Die Schweizerische Post
2 Novo Nordisk Pharma 5 Biomed
3 Novartis International 6 Bayer Schweiz
Source: Media Focus 2013
TOP B2B MAGAZINE ADVERTISER CATEGORIES
1 Health and pharmaceutical Campaigns and initiatives
2 Building industry and furniture Finance & insurance
3 Services Leisure, gastronomy, tourism
4 Office IT Food
5 Events Housewares, household appliances
Source: Media Focus 2013
NUMBER OF B2B MAGAZINE TITLES
2009 2010 2011 2012 2013
Total 994 926 902 873 791
Source: Katalog Schweizer Presse, VSW Verband Schweizerischer Werbegesellschaften

FIPP WORLD MAGAZINE TRENDS 2014/2015:EMEA SPECIAL REPORT 81
The Turkish economy has shown remarkable performance with steady growth over the last eight years. A sound macroeconomic strategy in combination with prudent fiscal policies and major structural reforms in effect since 2002 has integrated the Turkish economy into the globalised world, while transforming the country into one of the major recipients of foreign direct investment in the region.
The structural reforms, hastened by Turkey’s EU accession process, have paved the way for comprehensive changes in a number of areas. The main objectives of these efforts were: to increase the role of the private sector in the Turkish economy; to enhance the efficiency and resilience of the financial sector; and to place the social security system on a more solid foundation. As these reforms have strengthened the macroeconomic fundamentals of the country, the economy grew with an average annual growth rate of 5% between 2003 and 2013.
There are six major groups in the magazine market publishing 195 titles in 2013. Of these, 110 are weeklies and monthlies and the remaining titles are published as spin-offs. 40% of titles published in Turkey are licensed.
Magazine circulation decreased in recent years. Competition in women’s and fashion and general interest content is very intense. Especially in the second half of 2013, due to some social and political developments negatively affecting consumer behaviour, magazines’ sales have
decreased rapidly. However, interest in digital editions of magazines is increasing every day. The growth in mobile app magazine downloads confirms this. Magazine publishers increased their investment in online business in order to provide access to both online and hardcopy versions to their readers.
Turkey is a country dominated by the younger generation. Because of young people’s strong interest in digital apps this is considered an area of great potential. Dogan Burda and other major publishers are adapting well to new digital opportunities by providing magazine content for iOS and Android apps. All digital content is free, which is resulting in a decrease in single copy sales.
Dogan Burda has launched some tailor-made titles recently, including Spa & Wellness and Revolution: a publication for watch lovers, which was launched in Turkey in 2013.
Restrictions on gadgets (covermounts) other than cultural ones, is the most important legal restriction imposed on consumer magazines. There are also advertising restrictions applied to several sectors such as alcohol, over the counter drugs (OTC) and health with 0.1% VAT charged on cover prices. However, VAT on advertising income is 18%.
Magazines are delivered to subscribers by private consolidator/courier companies, due to the ineffective and expensive state of the national postal services.
PUBLISHERS
» Ajans Medya Publishing » Doğan Burda Dergi Yayıncılık ve Pazarlama » Doğan Burda Magazine » Dogan Egmont Publishing » Turkuvaz Gazete Dergi Basim » Turkuvaz Media
SUPPLIERS
> FIPP MEMBERS
> AT-A-GLANCE
» Sappi Istanbul Kagit Ve Tic
Capital: Ankara Population: 81,619,392 (July 2014 est.) Median age: 29.6 years GDP: US$821.8 billion (2013 est.) Consumer prices: 7.6% (2013 est.) Currency: Turkish liras (TRY) Official language: Turkish Other languages: Kurdish, other minority languages Literacy rate: 94.1% SOURCE: CIA WORLD FACTBOOK (JULY 2014)
DIGITAL DATA
Internet penetration: 35,358,888 % of population: 43 SOURCE: INTERNET LIVE STATS (JULY 2014 est.)
Mobile penetration: 67,680,000 (2012) % of population: 83 SOURCE: CIA WORLD FACTBOOK (JULY 2014)
PRINT TAX
>VAT Standard rate: 18% Magazine and newspaper purchases: 1% Book purchases: 8% Digital purchases: 18% Tax on advertisiing: 18%
SOURCE: WWW.GIB.GOV.TR (REVENUE ADMINISTRATION)
CROSS-MEDIA OWNERSHIP RESTRICTIONS
owner registration foreign ownership cross-media ownership concentration
Key: ALLOWED RESTRICTED NOT ALLOWED
SOURCE: DOGAN BURDA
ADVERTISING RESTRICTIONS
Tobacco Alcohol Over-the-counter drugs
Key: BANNED BY LAW VOLUNTARILY STOPPED RESTRICTED BY LAW RESTRICTED VOLUNTARILY
SOURCE: DOGAN BURDA
TURKEY
> SPECIAL REPORT: DOGAN BURDA MAGAZINE PUBLISHING

82 FIPP WORLD MAGAZINE TRENDS 2014/2015: EMEA SPECIAL REPORT
TURKEY> ADSPEND: ZENITHOPTIMEDIA
ADVERTISING EXPENDITURE BY MEDIUM (USD MILLIONS)
MAGAZINE ADSPEND (USD MILLIONS) ADSPEND SHARE (2013)
NUMBER OF COPIES
NUMBER OF PUBLISHERS NUMBER OF TITLES
2007 2008 2009 2010 2011 2012 2013 2014 2015 2016
Magazines 65 60 38 45 50 56 54 58 61 62
Newspapers 520 500 392 449 501 529 545 551 579 591
Television 924 886 757 1,060 1,286 1,368 1,527 1,672 1,913 2,123
Radio 58 58 46 54 64 68 70 68 70 72
Cinema 19 21 20 24 28 28 30 30 31 32
Outdoor 123 127 104 132 161 172 183 206 236 259
Internet 28 50 96 132 351 448 585 677 835 998
Total 1,737 1,702 1,453 1,897 2,440 2,670 2,993 3,262 3,726 4,137
2009 2010 2011 2012 2013
Number of copies sold and/or distributed in a year 20.5 million 20.4 million 21.6 million 20.4 million 18.5 million
2009 2010 2011 2012 2013
Total 29 24 33 32 36
> HIGHLIGHTS
2009 2010 2011 2012 2013
Total 184 172 173 166 195
2007 2008 2009 2010 2011 2012 2013 2014 2015 2016
60
55
50
45
40
35
65
56
60
54
38
58
45
61
50
62
Source: ZenithOptimedia Advertising Expenditure Forecasts June 2014
Source: Dogan Burda
Source: Dogan Burda
AVERAGE COVER PRICE: TRY
2009 2010 2011 2012 2013
Total 5.65 5.94 6.10 6.11 6.33
Source: Dogan Burda
TOP PUBLISHING COMPANIES: BY CIRCULATION
1 Dogan Burda 6 Dogan Egmont
2 Turkuvaz 7 Om Medya
3 Feza 8 Maya İletisim
4 Dogus 9 Mutlu
5 Tubitak 10 Turk Medya
Source: Yaysat ( Doğan Dağıtım)
DISTRIBUTION BREAKDOWN (%)
2009 2010 2011 2012 2013
Subscription 5.3 5.9 6.1 7.4 7.6
Retail sales 94.7 94.1 93.9 92.6 92.4
Source: Dogan Burda
Source: Dogan Burda
Magazines 1.8%
Cinema 1.0%Outdoor
6.1%
Newspapers 18.2%
Radio 2.3%
Internet 19.5%
TV 51.0%
RETAIL OUTLETS
2009 2010 2011 2012 2013
Kiosk/newsstand 5,235 5,308 5,197 4,972 4,894
Source: Dogan Burda
REVENUE SOURCE (%)
2009 2010 2011 2012 2013
Print ads 53 59 60 61 60
Digital ads 1 1 2 2 3
Copy sales 42 38 36 35 35
Digital copy sales
0 0 0 0 0
Other 4 2 2 2 2
Source: Dogan Burda
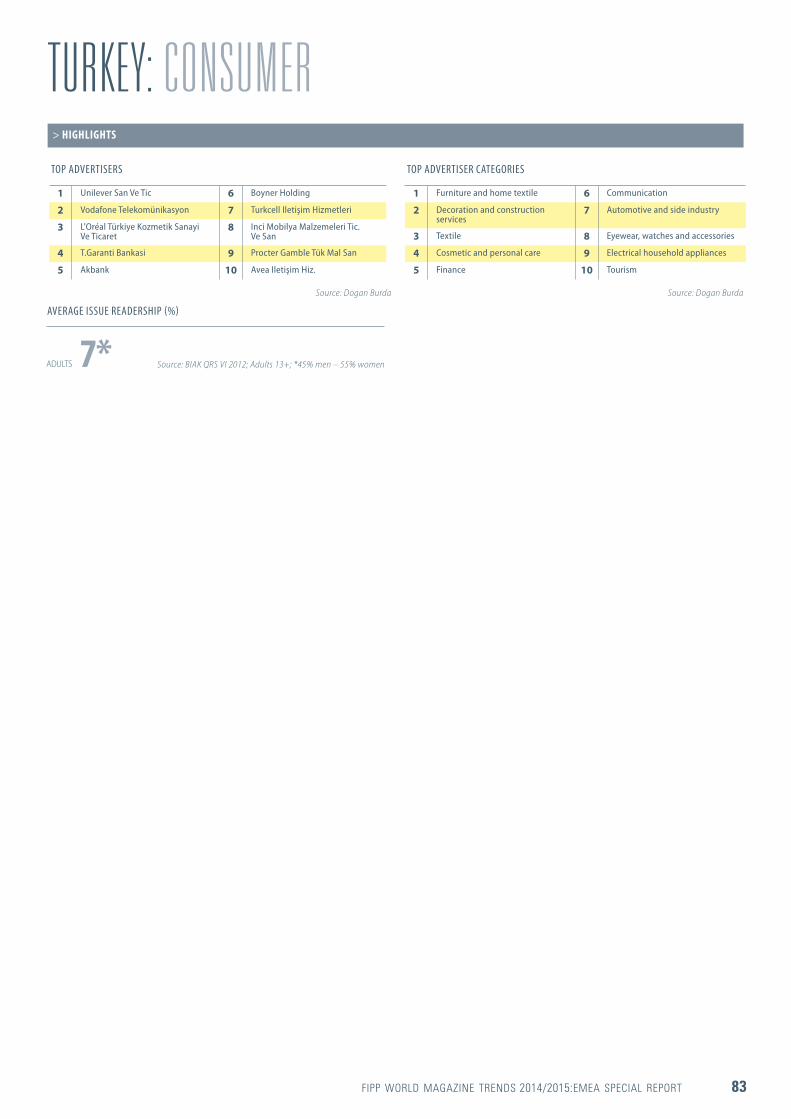
FIPP WORLD MAGAZINE TRENDS 2014/2015:EMEA SPECIAL REPORT 83
TURKEY: CONSUMER> HIGHLIGHTS
AVERAGE ISSUE READERSHIP (%)
ADULTS 7* Source: BIAK QRS VI 2012; Adults 13+; *45% men – 55% women
TOP ADVERTISERS TOP ADVERTISER CATEGORIES
1 Unilever San Ve Tic 6 Boyner Holding
2 Vodafone Telekomünikasyon 7 Turkcell Iletişim Hizmetleri
3 L'Oréal Türkiye Kozmetik Sanayi Ve Ticaret
8 Inci Mobilya Malzemeleri Tic.Ve San
4 T.Garanti Bankasi 9 Procter Gamble Tük Mal San
5 Akbank 10 Avea Iletişim Hiz.
1 Furniture and home textile 6 Communication
2 Decoration and construction services
7 Automotive and side industry
3 Textile 8 Eyewear, watches and accessories
4 Cosmetic and personal care 9 Electrical household appliances
5 Finance 10 Tourism
Source: Dogan Burda Source: Dogan Burda
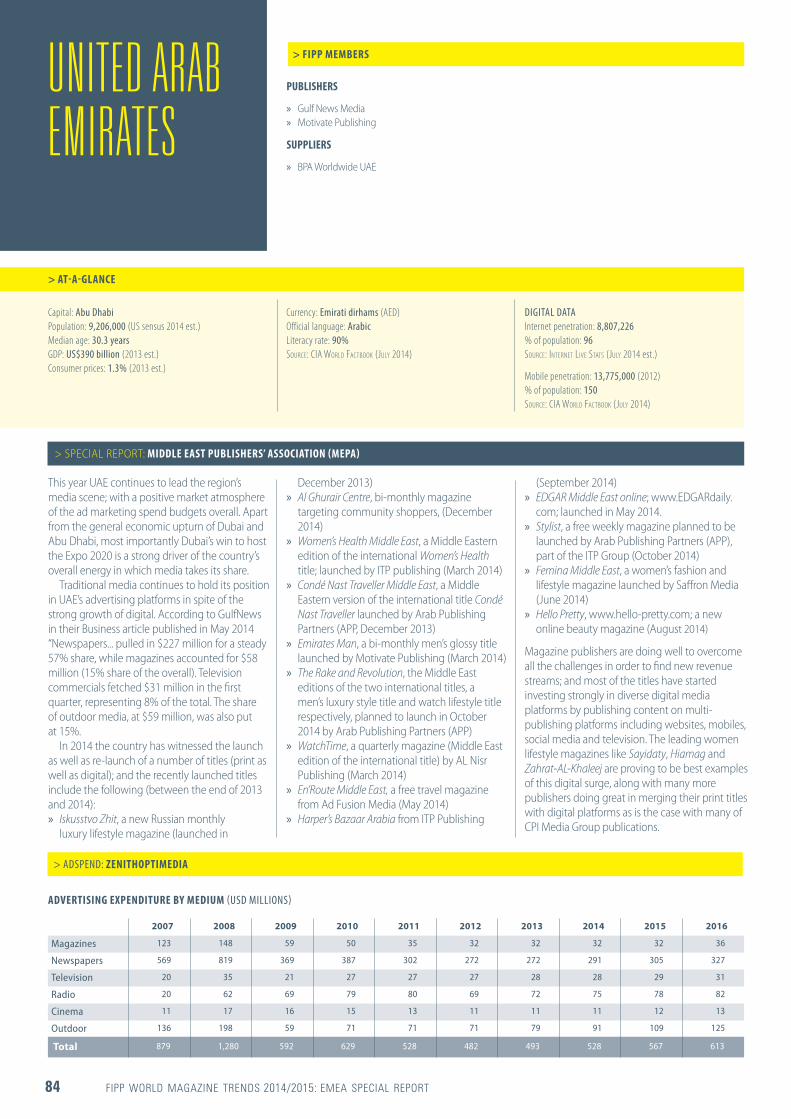
84 FIPP WORLD MAGAZINE TRENDS 2014/2015: EMEA SPECIAL REPORT
PUBLISHERS
» Gulf News Media » Motivate Publishing
SUPPLIERS
» BPA Worldwide UAE
> FIPP MEMBERS
> AT-A-GLANCE
Capital: Abu Dhabi Population: 9,206,000 (US sensus 2014 est.) Median age: 30.3 years GDP: US$390 billion (2013 est.) Consumer prices: 1.3% (2013 est.)
Currency: Emirati dirhams (AED) Official language: Arabic Literacy rate: 90% SOURCE: CIA WORLD FACTBOOK (JULY 2014)
DIGITAL DATA Internet penetration: 8,807,226 % of population: 96 SOURCE: INTERNET LIVE STATS (JULY 2014 est.)
Mobile penetration: 13,775,000 (2012) % of population: 150 SOURCE: CIA WORLD FACTBOOK (JULY 2014)
UNITED ARAB EMIRATES
This year UAE continues to lead the region’s media scene; with a positive market atmosphere of the ad marketing spend budgets overall. Apart from the general economic upturn of Dubai and Abu Dhabi, most importantly Dubai’s win to host the Expo 2020 is a strong driver of the country’s overall energy in which media takes its share.
Traditional media continues to hold its position in UAE’s advertising platforms in spite of the strong growth of digital. According to GulfNews in their Business article published in May 2014 “Newspapers... pulled in $227 million for a steady 57% share, while magazines accounted for $58 million (15% share of the overall). Television commercials fetched $31 million in the first quarter, representing 8% of the total. The share of outdoor media, at $59 million, was also put at 15%.
In 2014 the country has witnessed the launch as well as re-launch of a number of titles (print as well as digital); and the recently launched titles include the following (between the end of 2013 and 2014):
» Iskusstvo Zhit, a new Russian monthly luxury lifestyle magazine (launched in
December 2013) » Al Ghurair Centre, bi-monthly magazine
targeting community shoppers, (December 2014)
» Women’s Health Middle East, a Middle Eastern edition of the international Women’s Health title; launched by ITP publishing (March 2014)
» Condé Nast Traveller Middle East, a Middle Eastern version of the international title Condé Nast Traveller launched by Arab Publishing Partners (APP, December 2013)
» Emirates Man, a bi-monthly men’s glossy title launched by Motivate Publishing (March 2014)
» The Rake and Revolution, the Middle East editions of the two international titles, a men’s luxury style title and watch lifestyle title respectively, planned to launch in October 2014 by Arab Publishing Partners (APP)
» WatchTime, a quarterly magazine (Middle East edition of the international title) by AL Nisr Publishing (March 2014)
» En’Route Middle East, a free travel magazine from Ad Fusion Media (May 2014)
» Harper’s Bazaar Arabia from ITP Publishing
> SPECIAL REPORT: MIDDLE EAST PUBLISHERS’ ASSOCIATION (MEPA)
(September 2014) » EDGAR Middle East online; www.EDGARdaily.
com; launched in May 2014. » Stylist, a free weekly magazine planned to be
launched by Arab Publishing Partners (APP), part of the ITP Group (October 2014)
» Femina Middle East, a women’s fashion and lifestyle magazine launched by Saffron Media (June 2014)
» Hello Pretty, www.hello-pretty.com; a new online beauty magazine (August 2014)
Magazine publishers are doing well to overcome all the challenges in order to find new revenue streams; and most of the titles have started investing strongly in diverse digital media platforms by publishing content on multi-publishing platforms including websites, mobiles, social media and television. The leading women lifestyle magazines like Sayidaty, Hiamag and Zahrat-AL-Khaleej are proving to be best examples of this digital surge, along with many more publishers doing great in merging their print titles with digital platforms as is the case with many of CPI Media Group publications.
> ADSPEND: ZENITHOPTIMEDIA
ADVERTISING EXPENDITURE BY MEDIUM (USD MILLIONS)
2007 2008 2009 2010 2011 2012 2013 2014 2015 2016
Magazines 123 148 59 50 35 32 32 32 32 36
Newspapers 569 819 369 387 302 272 272 291 305 327
Television 20 35 21 27 27 27 28 28 29 31
Radio 20 62 69 79 80 69 72 75 78 82
Cinema 11 17 16 15 13 11 11 11 12 13
Outdoor 136 198 59 71 71 71 79 91 109 125
Total 879 1,280 592 629 528 482 493 528 567 613
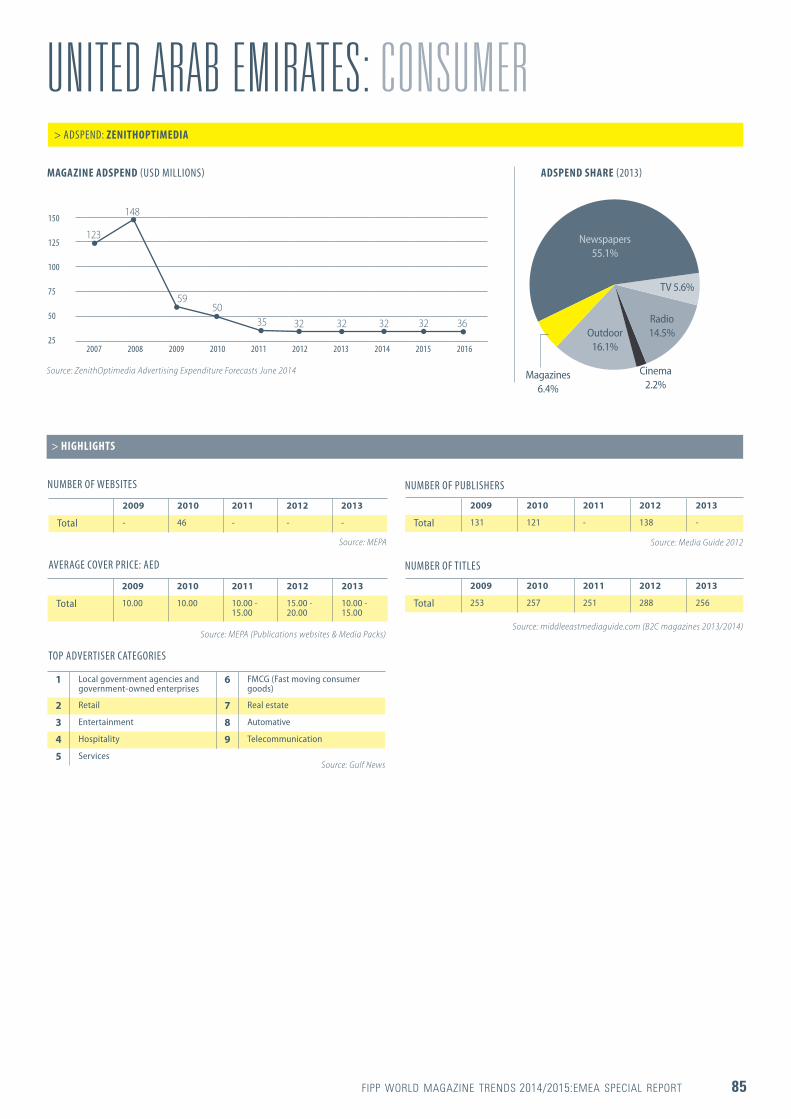
FIPP WORLD MAGAZINE TRENDS 2014/2015:EMEA SPECIAL REPORT 85
UNITED ARAB EMIRATES: CONSUMER
NUMBER OF PUBLISHERS
NUMBER OF TITLES
> HIGHLIGHTS
2009 2010 2011 2012 2013
Total 131 121 - 138 -
2009 2010 2011 2012 2013
Total 253 257 251 288 256
Source: Media Guide 2012
Source: middleeastmediaguide.com (B2C magazines 2013/2014)
AVERAGE COVER PRICE: AED
2009 2010 2011 2012 2013
Total 10.00 10.00 10.00 - 15.00
15.00 - 20.00
10.00 - 15.00
Source: MEPA (Publications websites & Media Packs)
NUMBER OF WEBSITES
2009 2010 2011 2012 2013
Total - 46 - - -
Source: MEPA
TOP ADVERTISER CATEGORIES
1 Local government agencies and government-owned enterprises
6 FMCG (Fast moving consumer goods)
2 Retail 7 Real estate
3 Entertainment 8 Automative
4 Hospitality 9 Telecommunication
5 Services Source: Gulf News
MAGAZINE ADSPEND (USD MILLIONS) ADSPEND SHARE (2013)
2007 2008 2009 2010 2011 2012 2013 2014 2015 2016
150
125
100
75
50
25
123
32
148
32
59
3250
3235 36
Source: ZenithOptimedia Advertising Expenditure Forecasts June 2014 Magazines 6.4%
Outdoor 16.1%
Newspapers 55.1%
Radio 14.5%
Cinema 2.2%
TV 5.6%
> ADSPEND: ZENITHOPTIMEDIA

86 FIPP WORLD MAGAZINE TRENDS 2014/2015: EMEA SPECIAL REPORT
UNITED ARAB EMIRATES: B2B
WEBSITE
NUMBER OF PUBLISHERS
NUMBER OF WEBSITES
NUMBER OF TITLES
2009 2010 2011 2012 2013
Total - - - - 40
> HIGHLIGHTS
2009 2010 2011 2012 2013
Total - - - - 171
2009 2010 2011 2012 2013
Total - - - - 72
Source: Middle East Media Guide
Source: MEPA
Source: Middle East Media Guide
TOP PUBLISHING COMPANIES: BY NUMBER OF TITLES
1 ITP Business Publishing 5 Al Hilal Publishing
2 CPI Media Group 6 Informa Group
3 TPG Publishing 7 JNS Media International
4 TMG Middle East
Source: Middle East Media Guide; Publishers’ websites
In business-to-business (B2B) publishing; the continuous infrastructure improvement along with the increasing growth of business development of the Gulf Cooperation Council in general and UAE more specifically; added to the country’s high appeal and attractiveness to investors, and continues to boost B2B media and publishing growth in the country.
Trade publications and websites are developing to keep pace with the UAE’s strong prospects for exhibition events and trade shows. B2B publishers in UAE have a great opportunity to seize by joining efforts with trade shows and events for different sectors; to realise their full potential and expand and therefore foster a long-term B2B customer relationship necessary for their development in the future.
> SPECIAL REPORT: MIDDLE EAST PUBLISHERS’ ASSOCIATION (MEPA)
To conclude, the noticeable sharp increase in adspend led by campaigns for Expo 2020 accompanied by an upbeat in the retail and real estate sectors, easily positions UAE to be the region’s top advertising - and eventually publishing - market; which would drive ad numbers up and set the magazine industry in both B2C and B2B sectors (digital and print) to grow in the coming years.

FIPP WORLD MAGAZINE TRENDS 2014/2015:EMEA SPECIAL REPORT 87
> AT-A-GLANCE
Capital: London Population: 63,742,977 (July 2014 est.) Median age: 40.4 years GDP: $2.49 trillion (2013 est.) Consumer prices: 2.0% (2013 est.) Currency: British pounds (GBP) Official language: English Literacy rate: 99% SOURCE: CIA WORLD FACTBOOK (JULY 2014)
DIGITAL DATA
Internet penetration: 57,075,826 % of population: 90 SOURCE: INTERNET LIVE STATS (JULY 2014 est.)
Mobile penetration: 82,109,000 (2012) % of population: 129 SOURCE: CIA WORLD FACTBOOK (JULY 2014)
PRINT TAX
Standard rate: 20% Magazine, newspaper and book purchases: 0% Digital purchases: 20% Tax on advertising: 20%
SOURCE: DISTRIPRESS; PRESS PRODUCTS WITH VAT ABLE ADD-ON HAVE THE VAT RATE APPLIED SOLELY TO THE ADD ON VALUE OF THE PRODUCT.
CROSS-MEDIA OWNERSHIP RESTRICTIONS
owner registration foreign ownership cross-media ownership concentration
Key: ALLOWED RESTRICTED NOT ALLOWED
SOURCE: PPA; * MEDIA COMPANIES ARE RESTRICTED FROM OWNING NEWSPAPER, THE LOCAL ITV TV LICENCE AND A REGIONAL STATION IN A SINGLE REGION.
ADVERTISING RESTRICTIONS
Tobacco Alcohol Advertising to children Over-the-counter drugs
Key: BANNED BY LAW VOLUNTARILY STOPPED RESTRICTED BY LAW RESTRICTED VOLUNTARILY
SOURCE: PPA
UNITED KINGDOM
INTERNATIONAL ASSOCIATION » FIPP – the worldwide
magazine media association
» Two Sides
NATIONAL ASSOCIATION » PPA Scotland » Professional Publishers
Association (PPA)
PUBLISHERS » Advanstar
Communications » Bauer Media » Bauer Performance » Bauer Specialist » BBC Worldwide » Condé Nast » Condé Nast
International » Crain
Communications » De Agostini UK » Egmont Publishing
Group
» Egmont UK » Future Publishing » H. Bauer Publishing » Hachette Partworks » Haymarket Business
Interactive » Haymarket Business
Media » Haymarket Consumer
Media » Haymarket Media
Group » Haymarket Network » Hearst Magazines UK » Hearst Rodale » Hello! » Hotelier International » Hubert Burda Media » IDG » IDG Communications » IDG Global Solutions » Imagine Publishing » Immediate Media » IPC Media » Jamie Magazine » Magzter » Media Week
> FIPP MEMBERS
» National Geographic Society
» Nikkei Business Publications Europe
» Northern & Shell » The River Group » Time Magazines
Europe » Time Out Group
SUPPLIERS » ABC UK » Adestra » Air Business » Axel Springer » Blippar » BPA Worldwide » Bruce Sawford
Licensing » Cardiff University » censhare (UK) » Dawson Media Direct » Demographix » eZ Systems UK » Kaldor (Pugpig) » MagazineCloner.com » MediaFund
» OneVision Software Sappi Sales Office
» Stonewash » University of Cardiff
Library » UPM » Videobuilder » Yudu » Yudu Media » Zinio International
MAGAZINE ADSPEND (USD MILLIONS)
2007 2008 2009 2010 2011 2012 2013 2014 2015 2016
2500
2000
1500
1000
500
0
2,338
1,152
2,106
1,045
1,517
9621,4289061,307
854
Source: ZenithOptimedia Advertising Expenditure Forecasts June 2014
> ADSPEND: ZENITHOPTIMEDIA
ADSPEND SHARE (2013) ADSPEND BREAKDOWN (2013)
Magazines 5.0%
Outdoor 6.2%
Cinema 1.2%
Newspapers 15.5%
Radio 3.4%
Internet 43.0%
TV 25.7%
Consumer magazines
64%
B2B magazines
36%

88 FIPP WORLD MAGAZINE TRENDS 2014/2015: EMEA SPECIAL REPORT
UNITED KINGDOM: CONSUMER> ADSPEND: ZENITHOPTIMEDIA
ADVERTISING EXPENDITURE BY MEDIUM (USD MILLIONS)
NUMBER OF COPIES
DISTRIBUTION BREAKDOWN (%)
TOP ADVERTISERS
TOP ADVERTISER CATEGORIES
ISSUE READERSHIP (%)
AVERAGE COVER PRICE: GBP
TOP PUBLISHING COMPANIES: BY REVENUE
NUMBER OF TITLES
2007 2008 2009 2010 2011 2012 2013 2014 2015 2016
Magazines 2,338 2,106 1,517 1,428 1,307 1,152 1,045 962 906 854
Newspapers 6,223 5,491 4,314 4,297 3,931 3,528 3,241 3,057 2,932 2,811
Television 5,288 5,024 4,471 5,097 5,148 5,096 5,351 5,672 5,786 5,901
Radio 796 745 672 696 708 735 710 723 726 735
Cinema 225 227 239 246 228 250 244 252 264 253
Outdoor 1,297 1,248 1,040 1,170 1,178 1,289 1,295 1,327 1,341 1,353
Internet 3,719 5,239 5,360 6,053 6,920 7,794 8,963 10,397 12,269 13,741
Total 19,886 20,080 17,614 18,986 19,420 19,844 20,850 22,390 24,223 25,650
2009 2010 2011 2012 2013
Number of copies sold and/or distributed in a year 1.39 billion 1.49 billion 1.22 billion 1.12 billion 1.06 billion
> HIGHLIGHTS
2009 2010 2011 2012 2013
Total 3,170 2,905 2,823 2,689 2,570
2009 2010 2011 2012 2013
Total - - - 3.39 3.50
2009 2010 2011 2012 2013
Subscription - 12.9 16.3 21.9 -
Retail sales - 54.5 54.0 50.0 -
Free circulation - 32.6 29.7 28.1 -
1 Time Inc. UK 6 Shortlist Media
2 Hearst Magazines UK 7 Haymarket
3 Condé Nast Publications 8 H Bauer Publishing
4 Bauer Media Magazines 9 Dennis Publishing
5 Immediate Media 10 Future Publishing UK
1 Procter & Gamble 6 Coty Prestige UK
2 Unilever UK 7 Beiersdorf UK
3 L'Oréal Paris 8 L'Oréal Luxury
4 Chanel 9 JD Williams & Co
5 Shop Direct Home Shopping 10 Boots The Chemists
1 Cosmetics and personal care 6 Household equipment and DIY
2 Clothing and accessories 7 Entertainment and leisure
3 Finance 8 Leisure equipment
4 Motors 9 Retail
5 Food 10 Mail order
MEN 69.3 WOMEN 84.1 ADULTS 76.9
Source: ABC Jan - Dec 2013 (based on 486 titles)
Source: BRAD Insight, 2014
Source: ABC Jan - Dec 2013 (based on 410 titles)
Source: Nielsen. Period Oct 13 to Sept 14
Source: ABC Jul - Dec 2013
Source: NRS PADD (Print and Digital Data) Jul 2013 - Jun 2014 (based on 152 titles, ever read in a year); 15+
Source: Nielsen (Jan - Dec 2013)
Source: Nielsen (Jan - Dec 2013)
REVENUE SOURCE (%)
2009 2010 2011 2012 2013
Print ads 32.5 30.7 30.2 29.7 28.7
Copy sales 66.0 66.5 65.5 63.0 61.4
Digital ads 1.5 2.3 3.6 5.1 5.8
Digital circulation
0.0 0.5 0.7 2.2 4.1
Source: PwC Global entertainment and media outlook 2014-2018

FIPP WORLD MAGAZINE TRENDS 2014/2015:EMEA SPECIAL REPORT 89
UNITED KINGDOM: B2BNUMBER OF TITLES
DISTRIBUTION BREAKDOWN %
> HIGHLIGHTS
2009 2010 2011 2012 2013
Total 4,790 4,655 4,572 4,292 4,216
2009 2010 2011 2012 2013
Subscription - 37.4 - -
Retail sales - 4.2 - -
Free circulation - 58.4 - -
Source: BRAD Insight, 2014
Source: PPA
REVENUE SOURCE (%)
2009 2010 2011 2012 2013
Print ads 67.8 64.1 60.9 57.7 55.6
Copy sales 27.4 28.2 27.4 25.9 25.3
Digital ads 4.8 7.5 11.5 15.7 17.6
Digital copy sales - 0.1 0.2 0.7 1.5
Source: PwC Global entertainment and media outlook 2014-2018


![Welcome [fipp.s3.amazonaws.com]fipp.s3.amazonaws.com/media/documents/DIS2017... · Create quotes in the system. Manage the pipeline. 18 Account Management Opportunity Creation Contact](https://img.pdfslide.us/doc/110x75/5f7acaa11cafa071863b7833/welcome-fipps3-fipps3-create-quotes-in-the-system-manage-the-pipeline-18.jpg)