Embed Size (px)
Citation preview
Macro Commodities Forex Rates Equity Credit Derivatives
24 September 201024 September 201024 September 201024 September 2010
Fixed Income & Forex Important Notice: The circumstances in which this publication has been produced are such that it is not appropriate to characterise it as independent investment research as referred to in European MIF directive and that it should be treated as a marketing material even if it contains a research recommendation
Emerging Markets Weekly
www.sgresearch.com
EMEA: varying monetary cycles remain intact
n Editorial
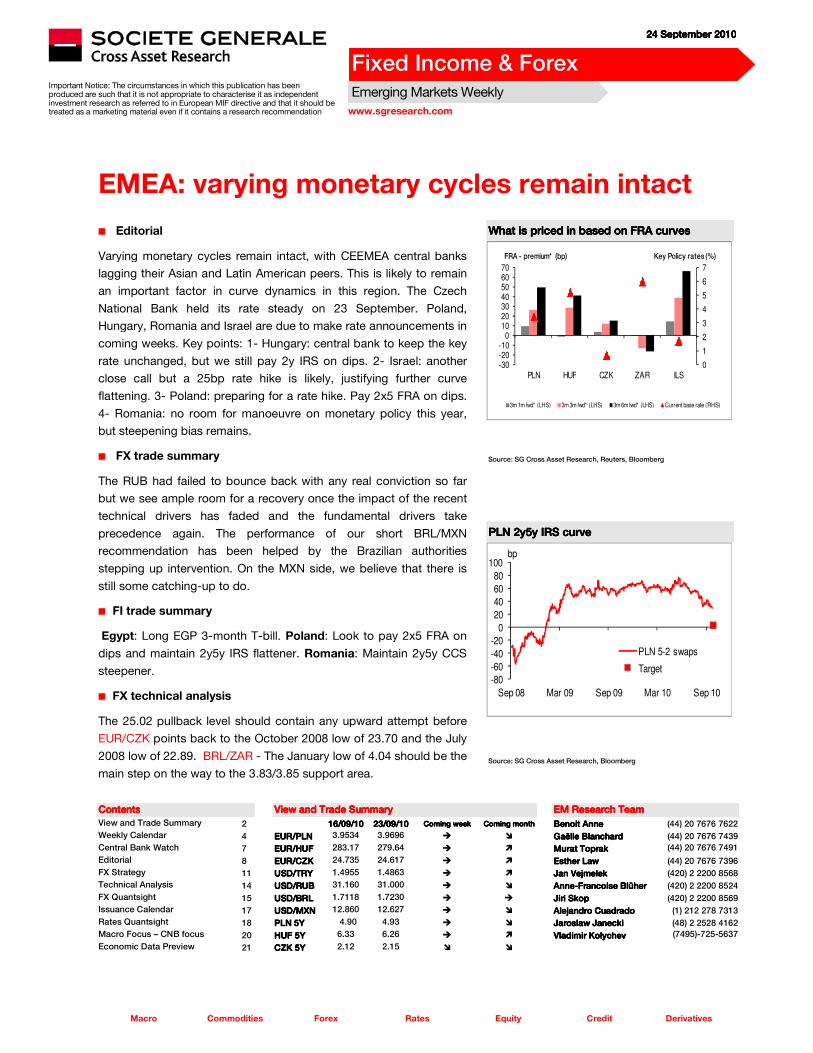
Varying monetary cycles remain intact, with CEEMEA central banks
lagging their Asian and Latin American peers. This is likely to remain
an important factor in curve dynamics in this region. The Czech
National Bank held its rate steady on 23 September. Poland,
Hungary, Romania and Israel are due to make rate announcements in
coming weeks. Key points: 1- Hungary: central bank to keep the key
rate unchanged, but we still pay 2y IRS on dips. 2- Israel: another
close call but a 25bp rate hike is likely, justifying further curve
flattening. 3- Poland: preparing for a rate hike. Pay 2x5 FRA on dips.
4- Romania: no room for manoeuvre on monetary policy this year,
but steepening bias remains.
n FX trade summary
The RUB had failed to bounce back with any real conviction so far
but we see ample room for a recovery once the impact of the recent
technical drivers has faded and the fundamental drivers take
precedence again. The performance of our short BRL/MXN
recommendation has been helped by the Brazilian authorities
stepping up intervention. On the MXN side, we believe that there is
still some catching-up to do.
n FI trade summary
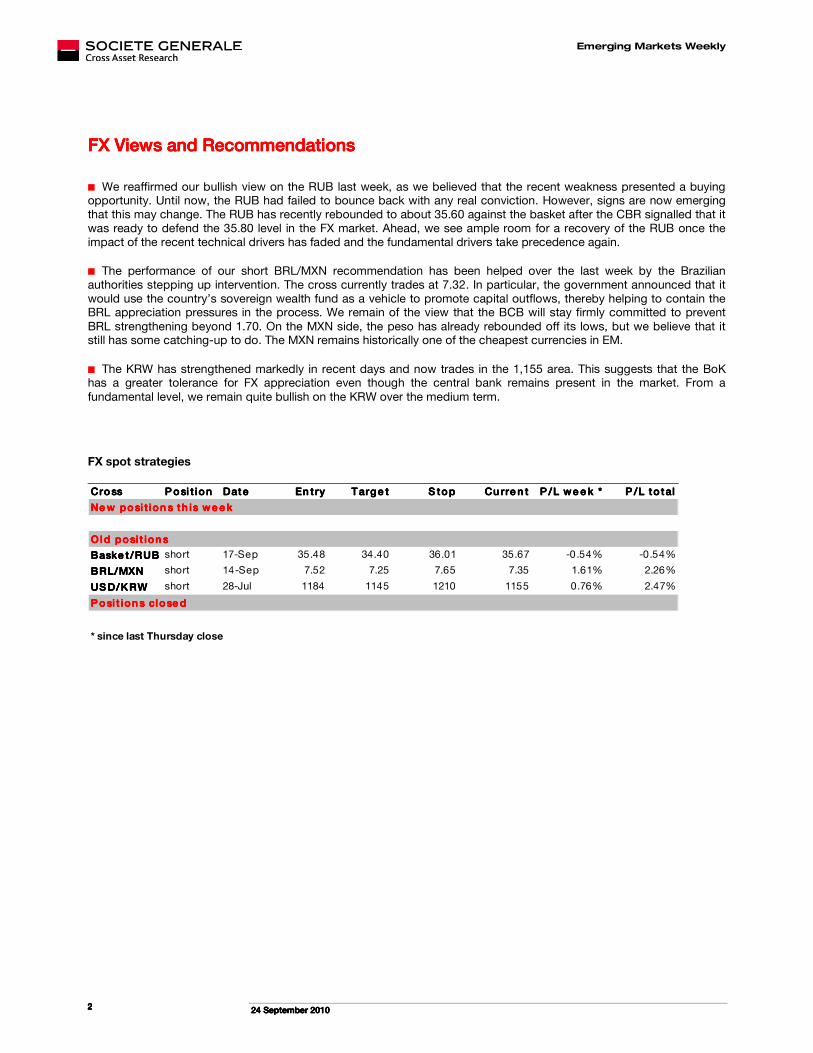
!Egypt: Long EGP 3-month T-bill. Poland: Look to pay 2x5 FRA on
dips and maintain 2y5y IRS flattener. Romania: Maintain 2y5y CCS
steepener.
n FX technical analysis
The 25.02 pullback level should contain any upward attempt before
EUR/CZK points back to the October 2008 low of 23.70 and the July
2008 low of 22.89. BRL/ZAR - The January low of 4.04 should be the
main step on the way to the 3.83/3.85 support area.
What is priced in based on FRA curvesWhat is priced in based on FRA curvesWhat is priced in based on FRA curvesWhat is priced in based on FRA curves
0
1
2
3
4
5
6
7
-30-20-10
010203040506070
PLN HUF CZK ZAR ILS
3m 1m fwd* (LHS) 3m 3m fwd* (LHS) 3m 6m fwd* (LHS) Current base rate (RHS)
FRA - premium* (bp) Key Policy rates (%)
Source: SG Cross Asset Research, Reuters, Bloomberg
PLN 2y5y IRS curvePLN 2y5y IRS curvePLN 2y5y IRS curvePLN 2y5y IRS curve
-80
-60
-40
-20
0
20
40
60
80
100
Sep 08 Mar 09 Sep 09 Mar 10 Sep 10
bp
PLN 5-2 swaps
Target
Source: SG Cross Asset Research, Bloomberg
ContentsContentsContentsContents View and Trade SummaryView and Trade SummaryView and Trade SummaryView and Trade Summary EM Research TeamEM Research TeamEM Research TeamEM Research Team
View and Trade Summary 2 16161616/0/0/0/09999/10/10/10/10 23232323/0/0/0/09999/10/10/10/10 Coming weekComing weekComing weekComing week Coming monthComing monthComing monthComing month Benoit AnneBenoit AnneBenoit AnneBenoit Anne (44) 20 7676 7622
Weekly Calendar 4 EUR/PLNEUR/PLNEUR/PLNEUR/PLN 3.9534 3.9696 � � Gaëlle BlanchardGaëlle BlanchardGaëlle BlanchardGaëlle Blanchard (44) 20 7676 7439
Central Bank Watch 7 EUR/HUFEUR/HUFEUR/HUFEUR/HUF 283.17 279.64 � � Murat ToprakMurat ToprakMurat ToprakMurat Toprak (44) 20 7676 7491
Editorial 8 EUR/CZKEUR/CZKEUR/CZKEUR/CZK 24.735 24.617 � � Esther LawEsther LawEsther LawEsther Law (44) 20 7676 7396
FX Strategy 11 USD/TRYUSD/TRYUSD/TRYUSD/TRY 1.4955 1.4863 � � Jan VejmelekJan VejmelekJan VejmelekJan Vejmelek (420) 2 2200 8568
Technical Analysis 14 USD/RUBUSD/RUBUSD/RUBUSD/RUB 31.160 31.000 � � AnneAnneAnneAnne----Francoise BlüherFrancoise BlüherFrancoise BlüherFrancoise Blüher (420) 2 2200 8524
FX Quantsight 15 USD/BRLUSD/BRLUSD/BRLUSD/BRL 1.7118 1.7230 � � Jiri SkopJiri SkopJiri SkopJiri Skop (420) 2 2200 8569
Issuance Calendar 17 USD/MXNUSD/MXNUSD/MXNUSD/MXN 12.860 12.627 � � Alejandro CuadradoAlejandro CuadradoAlejandro CuadradoAlejandro Cuadrado (1) 212 278 7313
Rates Quantsight 18 PLN 5YPLN 5YPLN 5YPLN 5Y 4.90 4.93 � � Jaroslaw JaneckiJaroslaw JaneckiJaroslaw JaneckiJaroslaw Janecki (48) 2 2528 4162
Macro Focus – CNB focus 20 HUF 5YHUF 5YHUF 5YHUF 5Y 6.33 6.26 � � VladimirVladimirVladimirVladimir KolychevKolychevKolychevKolychev (7495)-725-5637 Economic Data Preview 21 CZK 5YCZK 5YCZK 5YCZK 5Y 2.12 2.15 � �
Emerging Markets Weekly
22224444 SSSSeeeepppptttteeeemmmmbbbbeeeerrrr 2222000011110000 2222
FX Views and RecommendationsFX Views and RecommendationsFX Views and RecommendationsFX Views and Recommendations
n We reaffirmed our bullish view on the RUB last week, as we believed that the recent weakness presented a buying opportunity. Until now, the RUB had failed to bounce back with any real conviction. However, signs are now emerging that this may change. The RUB has recently rebounded to about 35.60 against the basket after the CBR signalled that it was ready to defend the 35.80 level in the FX market. Ahead, we see ample room for a recovery of the RUB once the impact of the recent technical drivers has faded and the fundamental drivers take precedence again.
n The performance of our short BRL/MXN recommendation has been helped over the last week by the Brazilian authorities stepping up intervention. The cross currently trades at 7.32. In particular, the government announced that it would use the country�s sovereign wealth fund as a vehicle to promote capital outflows, thereby helping to contain the BRL appreciation pressures in the process. We remain of the view that the BCB will stay firmly committed to prevent
BRL strengthening beyond 1.70. On the MXN side, the peso has already rebounded off its lows, but we believe that it still has some catching-up to do. The MXN remains historically one of the cheapest currencies in EM.
n The KRW has strengthened markedly in recent days and now trades in the 1,155 area. This suggests that the BoK has a greater tolerance for FX appreciation even though the central bank remains present in the market. From a
fundamental level, we remain quite bullish on the KRW over the medium term.
FX spot strategies
CrossCrossCrossCross P osi t ionP osi t ionP osi t ionP osi t ion DateDateDateDate En tryEn tryEn tryEn try Targe tTarge tTarge tTarge t S topS topS topS top Cu rre n tCu rre n tCu rre n tCu rre n t P /L we e k *P /L we e k *P /L we e k *P /L we e k * P /L to talP /L to talP /L to talP /L to tal
Ne w posi t ion s th is we e kNe w posi t ion s th is we e kNe w posi t ion s th is we e kNe w posi t ion s th is we e k
O ld posi t ion sO ld posi t ion sO ld posi t ion sO ld posi t ion s
Baske t/RUBBaske t/RUBBaske t/RUBBaske t/RUB short 17-Sep 35.48 34.40 36.01 35.67 -0.54% -0.54%
BRL/MXNBRL/MXNBRL/MXNBRL/MXN short 14-Sep 7.52 7.25 7.65 7.35 1.61% 2.26%
US D/KRWUS D/KRWUS D/KRWUS D/KRW short 28-Jul 1184 1145 1210 1155 0.76% 2.47%
P osi t ion s close d P osi t ion s close d P osi t ion s close d P osi t ion s close d
* since last Thursday close
Emerging Markets Weekly
22224444 SSSSeeeepppptttteeeemmmmbbbbeeeerrrr 2222000011110000 3333
FFFFIIII Views and RecommendationsViews and RecommendationsViews and RecommendationsViews and Recommendations
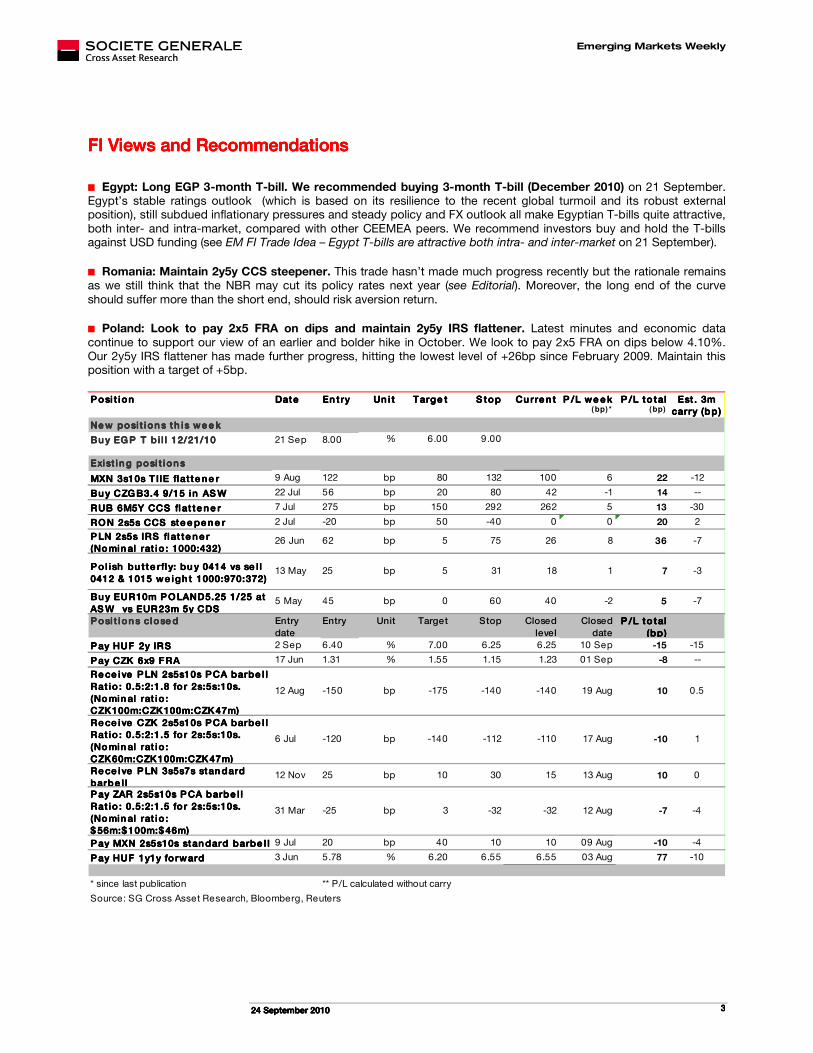
n Egypt: Long EGP 3-month T-bill. We recommended buying 3-month T-bill (December 2010) on 21 September. Egypt�s stable ratings outlook (which is based on its resilience to the recent global turmoil and its robust external position), still subdued inflationary pressures and steady policy and FX outlook all make Egyptian T-bills quite attractive,
both inter- and intra-market, compared with other CEEMEA peers. We recommend investors buy and hold the T-bills against USD funding (see EM FI Trade Idea – Egypt T-bills are attractive both intra- and inter-market on 21 September).
n Romania: Maintain 2y5y CCS steepener. This trade hasn�t made much progress recently but the rationale remains as we still think that the NBR may cut its policy rates next year (see Editorial). Moreover, the long end of the curve
should suffer more than the short end, should risk aversion return.
n Poland: Look to pay 2x5 FRA on dips and maintain 2y5y IRS flattener. Latest minutes and economic data
continue to support our view of an earlier and bolder hike in October. We look to pay 2x5 FRA on dips below 4.10%. Our 2y5y IRS flattener has made further progress, hitting the lowest level of +26bp since February 2009. Maintain this position with a target of +5bp.
P osi t ionP osi t ionP osi t ionP osi t ion DateDateDateDate En tryEn t ryEn t ryEn t ry Un i tUn i tUn i tUn i t Targe tTarge tTarge tTarge t S topS topS topS top Cu rre n tCu rre n tCu rre n tCu rre n t P /L we e k P /L we e k P /L we e k P /L we e k (bp)*
P /L to tal P /L to tal P /L to tal P /L to tal (bp)
Est . 3m Est . 3m Est . 3m Est . 3m carry (bp)carry (bp)carry (bp)carry (bp)
Ne w posi t ion s th is we e kNe w posi t ion s th is we e kNe w posi t ion s th is we e kNe w posi t ion s th is we e k
Bu y EG P T b i l l 12/21/10Bu y EG P T b i l l 12/21/10Bu y EG P T b i l l 12/21/10Bu y EG P T b i l l 12/21/10 21 Sep 8.00 % 6.00 9.00
Exist in g posi t ion sExist in g posi t ion sExist in g posi t ion sExist in g posi t ion s
MXN 3s10s T IIE flat te n e rMXN 3s10s T IIE flat te n e rMXN 3s10s T IIE flat te n e rMXN 3s10s T IIE flat te n e r 9 Aug 122 bp 80 132 100 6 22 -12
Bu y CZG B3.4 9/15 in AS WBu y CZG B3.4 9/15 in AS WBu y CZG B3.4 9/15 in AS WBu y CZG B3.4 9/15 in AS W 22 Jul 56 bp 20 80 42 -1 14 --
RUB 6M5Y CCS flat te n e rRUB 6M5Y CCS flat te n e rRUB 6M5Y CCS flat te n e rRUB 6M5Y CCS flat te n e r 7 Jul 275 bp 150 292 262 5 13 -30
RO N 2s5s CCS ste e pe n e rRO N 2s5s CCS ste e pe n e rRO N 2s5s CCS ste e pe n e rRO N 2s5s CCS ste e pe n e r 2 Jul -20 bp 50 -40 0 0 20 2
P LN 2s5s IRS flat te n e r P LN 2s5s IRS flat te n e r P LN 2s5s IRS flat te n e r P LN 2s5s IRS flat te n e r (No min al rat io : 1000:432)(No min al rat io : 1000:432)(No min al rat io : 1000:432)(No min al rat io : 1000:432)
26 Jun 62 bp 5 75 26 8 36 -7
P ol ish bu t te rfl y: bu y 0414 vs se l l P o l ish bu t te rfl y: bu y 0414 vs se l l P o l ish bu t te rfl y: bu y 0414 vs se l l P o l ish bu t te rfl y: bu y 0414 vs se l l
0412 & 1015 we igh t 1000:970:372)0412 & 1015 we igh t 1000:970:372)0412 & 1015 we igh t 1000:970:372)0412 & 1015 we igh t 1000:970:372)13 May 25 bp 5 31 18 1 7 -3
Bu y EUR10m P O LAND5.25 1/25 at Bu y EUR10m P O LAND5.25 1/25 at Bu y EUR10m P O LAND5.25 1/25 at Bu y EUR10m P O LAND5.25 1/25 at
AS W vs EUR23m 5y CDSAS W vs EUR23m 5y CDSAS W vs EUR23m 5y CDSAS W vs EUR23m 5y CDS5 May 45 bp 0 60 40 -2 5 -7
P osi t ion s close d P osi t ion s close d P osi t ion s close d P osi t ion s close d Entry
date
Entry Unit Target Stop Closed
level
Closed
date
P /L to tal P /L to tal P /L to tal P /L to tal
(bp)(bp)(bp)(bp)
P ay HUF 2y IRS P ay HUF 2y IRS P ay HUF 2y IRS P ay HUF 2y IRS 2 Sep 6.40 % 7.00 6.25 6.25 10 Sep -15 -15
P ay CZK 6x9 FRAP ay CZK 6x9 FRAP ay CZK 6x9 FRAP ay CZK 6x9 FRA 17 Jun 1.31 % 1.55 1.15 1.23 01 Sep -8 --
Re ce ive P LN 2s5s10s P CA barbe l l Re ce ive P LN 2s5s10s P CA barbe l l Re ce ive P LN 2s5s10s P CA barbe l l Re ce ive P LN 2s5s10s P CA barbe l l
Rat io : 0.5:2:1.8 fo r 2s:5s:10s. Rat io : 0.5:2:1.8 fo r 2s:5s:10s. Rat io : 0.5:2:1.8 fo r 2s:5s:10s. Rat io : 0.5:2:1.8 fo r 2s:5s:10s.
(No min al rat io : (No min al rat io : (No min al rat io : (No min al rat io : CZK100m:CZK100m:CZK47m) CZK100m:CZK100m:CZK47m) CZK100m:CZK100m:CZK47m) CZK100m:CZK100m:CZK47m)
12 Aug -150 bp -175 -140 -140 19 Aug 10 0.5
Re ce ive CZK 2s5s10s P CA barbe l l Re ce ive CZK 2s5s10s P CA barbe l l Re ce ive CZK 2s5s10s P CA barbe l l Re ce ive CZK 2s5s10s P CA barbe l l Rat io : 0.5:2:1.5 fo r 2s:5s:10s. Rat io : 0.5:2:1.5 fo r 2s:5s:10s. Rat io : 0.5:2:1.5 fo r 2s:5s:10s. Rat io : 0.5:2:1.5 fo r 2s:5s:10s.
(No min al rat io : (No min al rat io : (No min al rat io : (No min al rat io :
CZK60m:CZK100m:CZK47m)CZK60m:CZK100m:CZK47m)CZK60m:CZK100m:CZK47m)CZK60m:CZK100m:CZK47m)
6 Jul -120 bp -140 -112 -110 17 Aug -10 1
Re ce ive P LN 3s5s7s stan dard Re ce ive P LN 3s5s7s stan dard Re ce ive P LN 3s5s7s stan dard Re ce ive P LN 3s5s7s stan dard
barbe l l barbe l l barbe l l barbe l l 12 Nov 25 bp 10 30 15 13 Aug 10 0
P ay ZAR 2s5s10s P CA barbe l l P ay ZAR 2s5s10s P CA barbe l l P ay ZAR 2s5s10s P CA barbe l l P ay ZAR 2s5s10s P CA barbe l l
Rat io : 0.5:2:1.5 fo r 2s:5s:10s. Rat io : 0.5:2:1.5 fo r 2s:5s:10s. Rat io : 0.5:2:1.5 fo r 2s:5s:10s. Rat io : 0.5:2:1.5 fo r 2s:5s:10s.
(No min al rat io : (No min al rat io : (No min al rat io : (No min al rat io : $ 56m:$ 100m:$ 46m)$ 56m:$ 100m:$ 46m)$ 56m:$ 100m:$ 46m)$ 56m:$ 100m:$ 46m)
31 Mar -25 bp 3 -32 -32 12 Aug -7 -4
P ay MXN 2s5s10s stan dard barbe l l P ay MXN 2s5s10s stan dard barbe l l P ay MXN 2s5s10s stan dard barbe l l P ay MXN 2s5s10s stan dard barbe l l 9 Jul 20 bp 40 10 10 09 Aug -10 -4
P ay HUF 1y1y fo rwardP ay HUF 1y1y fo rwardP ay HUF 1y1y fo rwardP ay HUF 1y1y fo rward 3 Jun 5.78 % 6.20 6.55 6.55 03 Aug 77 -10
* since last publication ** P/L calculated without carry
Source: SG Cross Asset Research, Bloomberg, Reuters
Emerging Markets Weekly
22224444 SSSSeeeepppptttteeeemmmmbbbbeeeerrrr 2222000011110000 4444
Events and dataEvents and dataEvents and dataEvents and data
EMEAEMEAEMEAEMEA
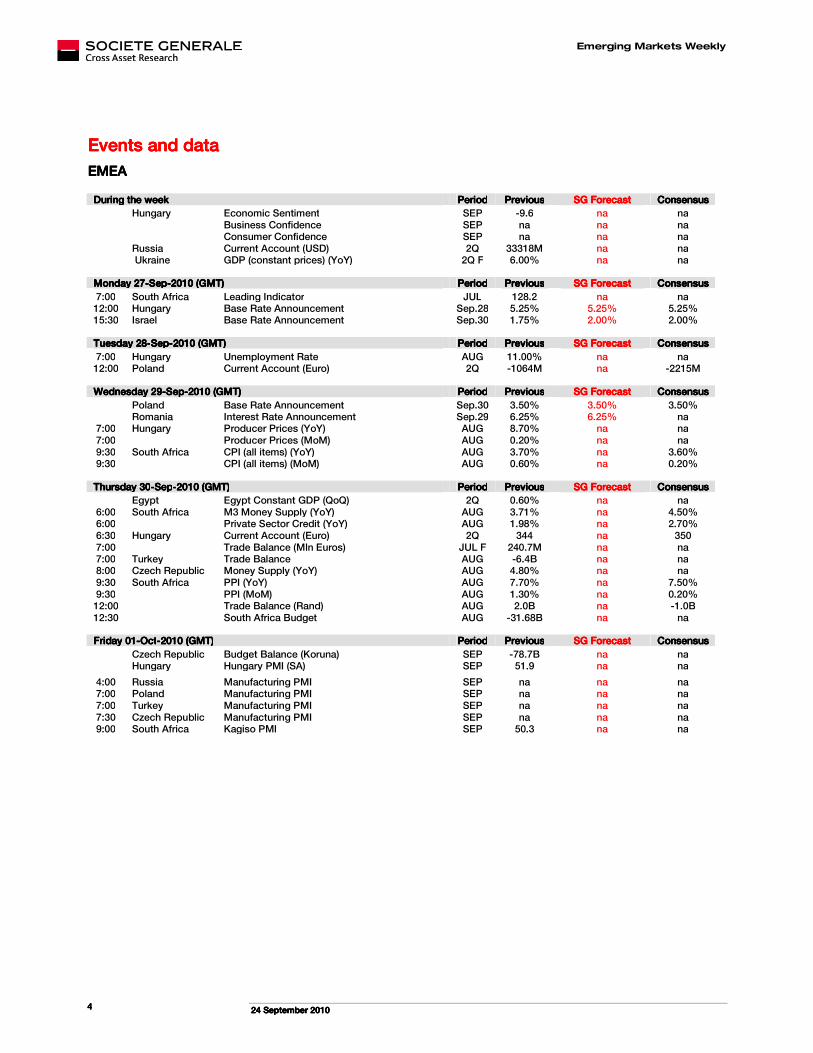
During the weekDuring the weekDuring the weekDuring the week PeriodPeriodPeriodPeriod PreviousPreviousPreviousPrevious SG ForecastSG ForecastSG ForecastSG Forecast ConsensusConsensusConsensusConsensus
Hungary Economic Sentiment SEP -9.6 na na
Business Confidence SEP na na na
Consumer Confidence SEP na na na
Russia Current Account (USD) 2Q 33318M na na
Ukraine GDP (constant prices) (YoY) 2Q F 6.00% na na
Monday 27Monday 27Monday 27Monday 27----SepSepSepSep----2010 (GMT)2010 (GMT)2010 (GMT)2010 (GMT) PeriodPeriodPeriodPeriod PreviousPreviousPreviousPrevious SG ForecastSG ForecastSG ForecastSG Forecast ConsensusConsensusConsensusConsensus
7:00 South Africa Leading Indicator JUL 128.2 na na 12:00 Hungary Base Rate Announcement Sep.28 5.25% 5.25% 5.25% 15:30 Israel Base Rate Announcement Sep.30 1.75% 2.00% 2.00%
Tuesday 28Tuesday 28Tuesday 28Tuesday 28----SepSepSepSep----2010 (GMT)2010 (GMT)2010 (GMT)2010 (GMT) PeriodPeriodPeriodPeriod PreviousPreviousPreviousPrevious SG ForecastSG ForecastSG ForecastSG Forecast ConsensusConsensusConsensusConsensus
7:00 Hungary Unemployment Rate AUG 11.00% na na 12:00 Poland Current Account (Euro) 2Q -1064M na -2215M
Wednesday 2Wednesday 2Wednesday 2Wednesday 29999----SepSepSepSep----2010 (GMT)2010 (GMT)2010 (GMT)2010 (GMT) PeriodPeriodPeriodPeriod PreviousPreviousPreviousPrevious SG ForecastSG ForecastSG ForecastSG Forecast ConsensusConsensusConsensusConsensus
Poland Base Rate Announcement Sep.30 3.50% 3.50% 3.50%
Romania Interest Rate Announcement Sep.29 6.25% 6.25% na
7:00 Hungary Producer Prices (YoY) AUG 8.70% na na 7:00 Producer Prices (MoM) AUG 0.20% na na 9:30 South Africa CPI (all items) (YoY) AUG 3.70% na 3.60% 9:30 CPI (all items) (MoM) AUG 0.60% na 0.20%
Thursday 30Thursday 30Thursday 30Thursday 30----SepSepSepSep----2010 (GMT)2010 (GMT)2010 (GMT)2010 (GMT) PeriodPeriodPeriodPeriod PreviousPreviousPreviousPrevious SG ForecastSG ForecastSG ForecastSG Forecast ConsensusConsensusConsensusConsensus
Egypt Egypt Constant GDP (QoQ) 2Q 0.60% na na 6:00 South Africa M3 Money Supply (YoY) AUG 3.71% na 4.50% 6:00
Private Sector Credit (YoY) AUG 1.98% na 2.70%
6:30 Hungary Current Account (Euro) 2Q 344 na 350 7:00
Trade Balance (Mln Euros) JUL F 240.7M na na
7:00 Turkey Trade Balance AUG -6.4B na na 8:00 Czech Republic Money Supply (YoY) AUG 4.80% na na 9:30 South Africa PPI (YoY) AUG 7.70% na 7.50% 9:30
PPI (MoM) AUG 1.30% na 0.20%
12:00 Trade Balance (Rand) AUG 2.0B na -1.0B 12:30 South Africa Budget AUG -31.68B na na
FridayFridayFridayFriday 01010101----OctOctOctOct----2010 (GMT)2010 (GMT)2010 (GMT)2010 (GMT) PeriodPeriodPeriodPeriod PreviousPreviousPreviousPrevious SG ForecastSG ForecastSG ForecastSG Forecast ConsensusConsensusConsensusConsensus
Czech Republic Budget Balance (Koruna) SEP -78.7B na na Hungary Hungary PMI (SA) SEP 51.9 na na
4:00 Russia Manufacturing PMI SEP na na na 7:00 Poland Manufacturing PMI SEP na na na 7:00 Turkey Manufacturing PMI SEP na na na 7:30 Czech Republic Manufacturing PMI SEP na na na 9:00 South Africa Kagiso PMI SEP 50.3 na na
Emerging Markets Weekly
22224444 SSSSeeeepppptttteeeemmmmbbbbeeeerrrr 2222000011110000 5555
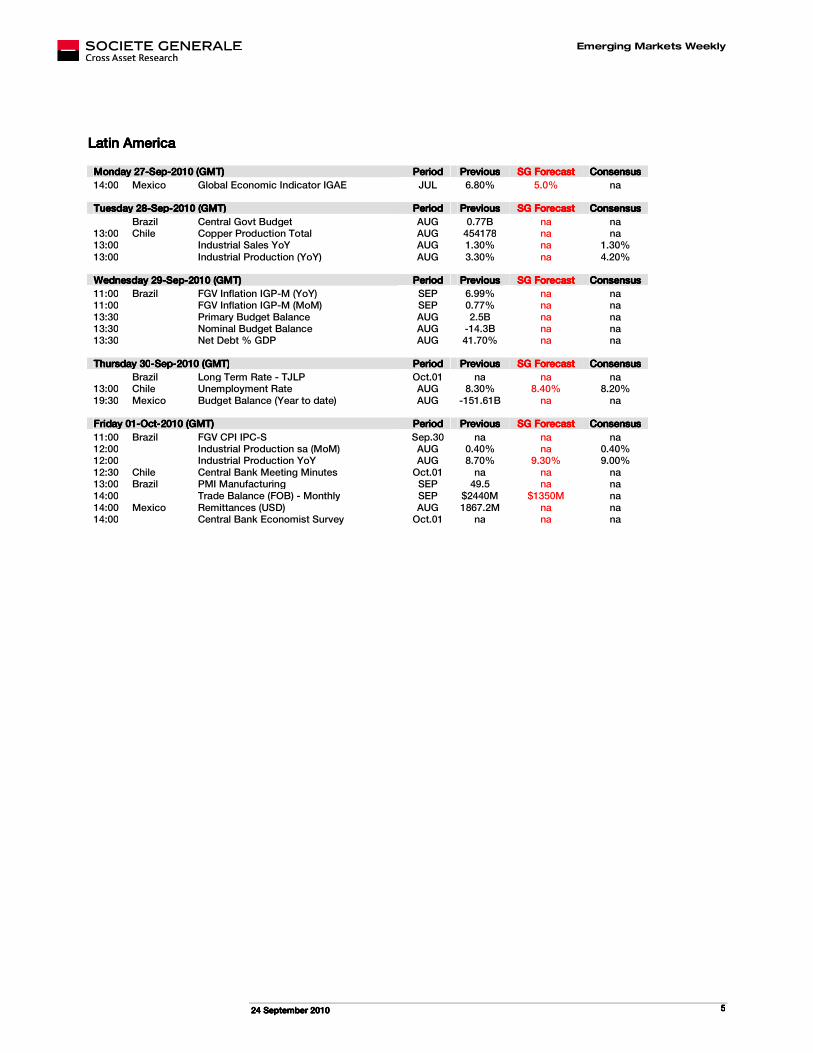
Latin AmericaLatin AmericaLatin AmericaLatin America
Monday 27Monday 27Monday 27Monday 27----SepSepSepSep----2010 (GMT)2010 (GMT)2010 (GMT)2010 (GMT) PeriodPeriodPeriodPeriod PreviousPreviousPreviousPrevious SG ForecastSG ForecastSG ForecastSG Forecast ConsensusConsensusConsensusConsensus
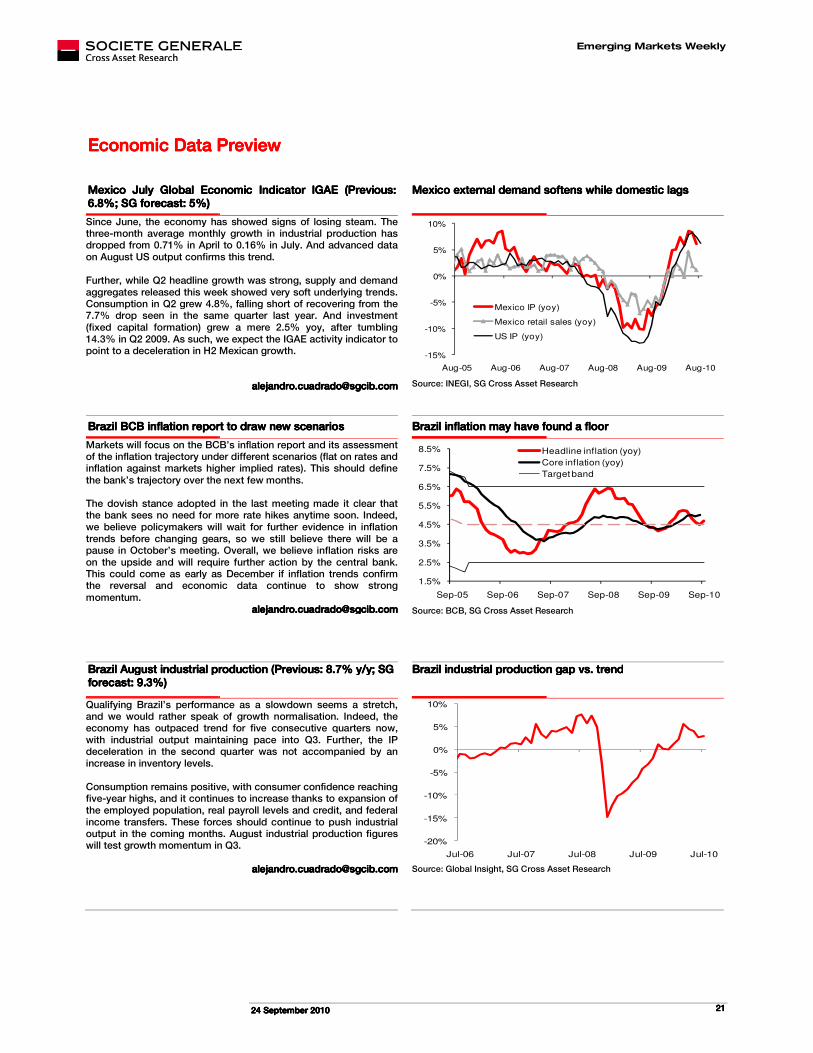
14:00 Mexico Global Economic Indicator IGAE JUL 6.80% 5.0% na
Tuesday 28Tuesday 28Tuesday 28Tuesday 28----SepSepSepSep----2010 (GMT)2010 (GMT)2010 (GMT)2010 (GMT) PeriodPeriodPeriodPeriod PreviousPreviousPreviousPrevious SG ForecastSG ForecastSG ForecastSG Forecast ConsensusConsensusConsensusConsensus
Brazil Central Govt Budget AUG 0.77B na na 13:00 Chile Copper Production Total AUG 454178 na na 13:00 Industrial Sales YoY AUG 1.30% na 1.30% 13:00 Industrial Production (YoY) AUG 3.30% na 4.20%
Wednesday 29Wednesday 29Wednesday 29Wednesday 29----SepSepSepSep----2010 (GMT)2010 (GMT)2010 (GMT)2010 (GMT) PeriodPeriodPeriodPeriod PreviousPreviousPreviousPrevious SG ForecastSG ForecastSG ForecastSG Forecast ConsensusConsensusConsensusConsensus
11:00 Brazil FGV Inflation IGP-M (YoY) SEP 6.99% na na 11:00 FGV Inflation IGP-M (MoM) SEP 0.77% na na 13:30
Primary Budget Balance AUG 2.5B na na
13:30
Nominal Budget Balance AUG -14.3B na na 13:30 Net Debt % GDP AUG 41.70% na na
Thursday 30Thursday 30Thursday 30Thursday 30----SepSepSepSep----2010 (GMT)2010 (GMT)2010 (GMT)2010 (GMT) PeriodPeriodPeriodPeriod PreviousPreviousPreviousPrevious SG ForecastSG ForecastSG ForecastSG Forecast ConsensusConsensusConsensusConsensus
Brazil Long Term Rate - TJLP Oct.01 na na na
13:00 Chile Unemployment Rate AUG 8.30% 8.40% 8.20% 19:30 Mexico Budget Balance (Year to date) AUG -151.61B na na
Friday 01Friday 01Friday 01Friday 01----OctOctOctOct----2010 (GMT)2010 (GMT)2010 (GMT)2010 (GMT) PeriodPeriodPeriodPeriod PreviousPreviousPreviousPrevious SG ForecastSG ForecastSG ForecastSG Forecast ConsensusConsensusConsensusConsensus
11:00 Brazil FGV CPI IPC-S Sep.30 na na na 12:00
Industrial Production sa (MoM) AUG 0.40% na 0.40%
12:00 Industrial Production YoY AUG 8.70% 9.30% 9.00% 12:30 Chile Central Bank Meeting Minutes Oct.01 na na na 13:00 Brazil PMI Manufacturing SEP 49.5 na na 14:00 Trade Balance (FOB) - Monthly SEP $2440M $1350M na 14:00 Mexico Remittances (USD) AUG 1867.2M na na 14:00 Central Bank Economist Survey Oct.01 na na na
Emerging Markets Weekly
22224444 SSSSeeeepppptttteeeemmmmbbbbeeeerrrr 2222000011110000 6666
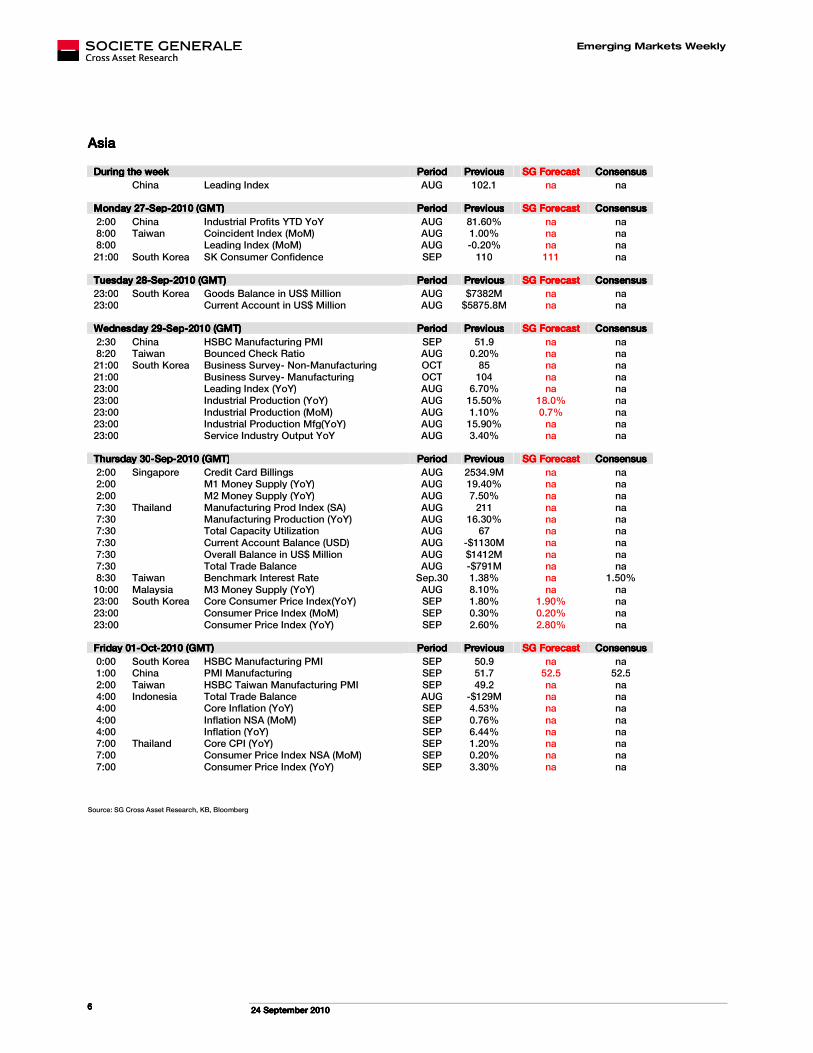
AsiaAsiaAsiaAsia
During the weekDuring the weekDuring the weekDuring the week PeriodPeriodPeriodPeriod PreviousPreviousPreviousPrevious SG ForecastSG ForecastSG ForecastSG Forecast ConsensusConsensusConsensusConsensus
China Leading Index AUG 102.1 na na
Monday 27Monday 27Monday 27Monday 27----SepSepSepSep----2010 (G2010 (G2010 (G2010 (GMT)MT)MT)MT) PeriodPeriodPeriodPeriod PreviousPreviousPreviousPrevious SG ForecastSG ForecastSG ForecastSG Forecast ConsensusConsensusConsensusConsensus
2:00 China Industrial Profits YTD YoY AUG 81.60% na na 8:00 Taiwan Coincident Index (MoM) AUG 1.00% na na 8:00 Leading Index (MoM) AUG -0.20% na na 21:00 South Korea SK Consumer Confidence SEP 110 111 na
Tuesday 28Tuesday 28Tuesday 28Tuesday 28----SepSepSepSep----2010 (GMT)2010 (GMT)2010 (GMT)2010 (GMT) PeriodPeriodPeriodPeriod PreviousPreviousPreviousPrevious SG ForecastSG ForecastSG ForecastSG Forecast ConsensusConsensusConsensusConsensus
23:00 South Korea Goods Balance in US$ Million AUG $7382M na na 23:00 Current Account in US$ Million AUG $5875.8M na na
Wednesday 29Wednesday 29Wednesday 29Wednesday 29----SepSepSepSep----2010 (GMT)2010 (GMT)2010 (GMT)2010 (GMT) PeriodPeriodPeriodPeriod PrevPrevPrevPreviousiousiousious SG ForecastSG ForecastSG ForecastSG Forecast ConsensusConsensusConsensusConsensus
2:30 China HSBC Manufacturing PMI SEP 51.9 na na 8:20 Taiwan Bounced Check Ratio AUG 0.20% na na 21:00 South Korea Business Survey- Non-Manufacturing OCT 85 na na 21:00
Business Survey- Manufacturing OCT 104 na na
23:00
Leading Index (YoY) AUG 6.70% na na 23:00 Industrial Production (YoY) AUG 15.50% 18.0% na 23:00
Industrial Production (MoM) AUG 1.10% 0.7% na
23:00
Industrial Production Mfg(YoY) AUG 15.90% na na 23:00 Service Industry Output YoY AUG 3.40% na na
Thursday 30Thursday 30Thursday 30Thursday 30----SepSepSepSep----2010 (GMT)2010 (GMT)2010 (GMT)2010 (GMT) PeriodPeriodPeriodPeriod PreviousPreviousPreviousPrevious SG ForecastSG ForecastSG ForecastSG Forecast ConsensusConsensusConsensusConsensus
2:00 Singapore Credit Card Billings AUG 2534.9M na na 2:00
M1 Money Supply (YoY) AUG 19.40% na na
2:00 M2 Money Supply (YoY) AUG 7.50% na na 7:30 Thailand Manufacturing Prod Index (SA) AUG 211 na na 7:30
Manufacturing Production (YoY) AUG 16.30% na na
7:30 Total Capacity Utilization AUG 67 na na 7:30
Current Account Balance (USD) AUG -$1130M na na
7:30
Overall Balance in US$ Million AUG $1412M na na 7:30
Total Trade Balance AUG -$791M na na
8:30 Taiwan Benchmark Interest Rate Sep.30 1.38% na 1.50% 10:00 Malaysia M3 Money Supply (YoY) AUG 8.10% na na 23:00 South Korea Core Consumer Price Index(YoY) SEP 1.80% 1.90% na 23:00 Consumer Price Index (MoM) SEP 0.30% 0.20% na 23:00 Consumer Price Index (YoY) SEP 2.60% 2.80% na
Friday 01Friday 01Friday 01Friday 01----OctOctOctOct----2010 (GMT)2010 (GMT)2010 (GMT)2010 (GMT) PeriodPeriodPeriodPeriod PreviousPreviousPreviousPrevious SG ForecastSG ForecastSG ForecastSG Forecast ConsensusConsensusConsensusConsensus
0:00 South Korea HSBC Manufacturing PMI SEP 50.9 na na 1:00 China PMI Manufacturing SEP 51.7 52.5 52.5 2:00 Taiwan HSBC Taiwan Manufacturing PMI SEP 49.2 na na 4:00 Indonesia Total Trade Balance AUG -$129M na na 4:00 Core Inflation (YoY) SEP 4.53% na na 4:00
Inflation NSA (MoM) SEP 0.76% na na
4:00
Inflation (YoY) SEP 6.44% na na 7:00 Thailand Core CPI (YoY) SEP 1.20% na na 7:00
Consumer Price Index NSA (MoM) SEP 0.20% na na
7:00
Consumer Price Index (YoY) SEP 3.30% na na
Source: SG Cross Asset Research, KB, Bloomberg
Emerging Markets Weekly
22224444 SSSSeeeepppptttteeeemmmmbbbbeeeerrrr 2222000011110000 7777
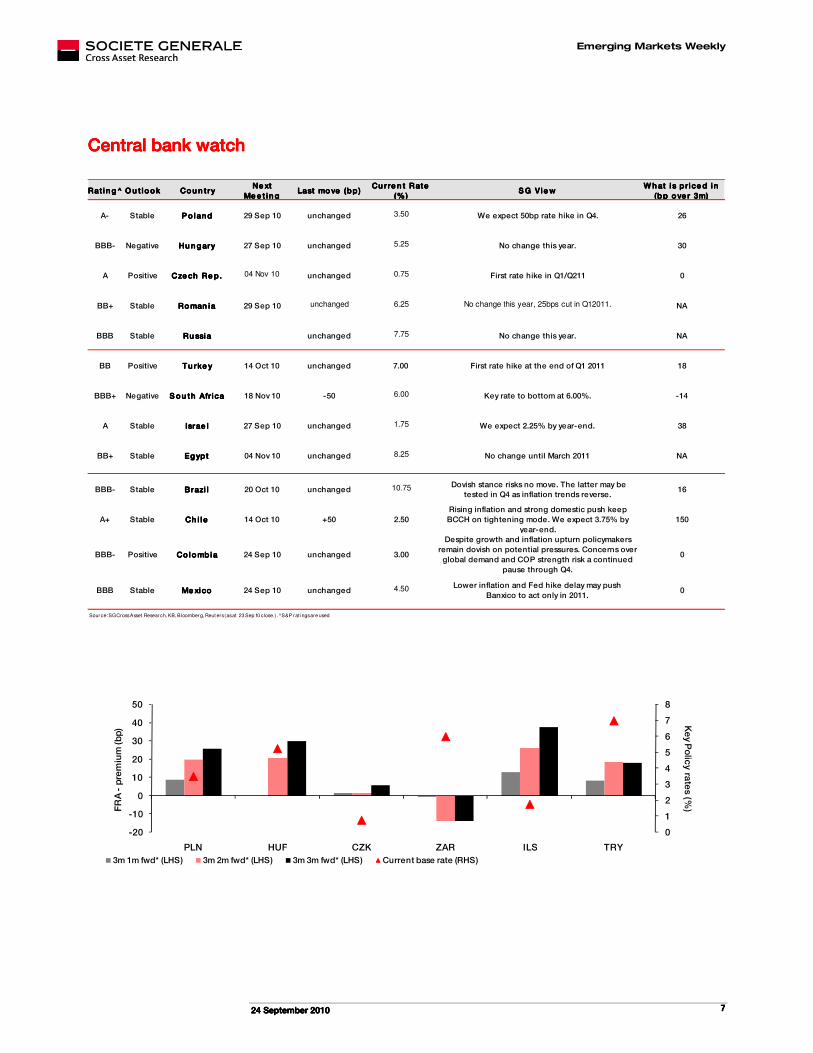
Central bank watchCentral bank watchCentral bank watchCentral bank watch
Rat in g^Rat in g^Rat in g^Rat in g^ O u t lookO u t lookO u t lookO u t look Cou n tryCou n tryCou n tryCou n tryNe xt Ne xt Ne xt Ne xt
Me e t in gMe e t in gMe e t in gMe e t in gLast move (bp)Last move (bp)Last move (bp)Last move (bp)
Cu rre n t Rate Cu rre n t Rate Cu rre n t Rate Cu rre n t Rate
(%)(%)(%)(%)S G V ie wS G Vie wS G Vie wS G Vie w
W h at is price d in W h at i s price d in W h at i s price d in W h at i s price d in
(bp ove r 3m)(bp ove r 3m)(bp ove r 3m)(bp ove r 3m)
A- Stable P o landP o landP o landP o land 29 Sep 10 unchanged 3.50 We expect 50bp rate hike in Q4. 26
BBB- Negative Hu n garyHu n garyHu n garyHu n gary 27 Sep 10 unchanged 5.25 No change this year. 30
A Positive Cze ch Re p.Cze ch Re p.Cze ch Re p.Cze ch Re p. 04 Nov 10 unchanged 0.75 First rate hike in Q1/Q211 0
BB+ Stable Roman iaRoman iaRoman iaRoman ia 29 Sep 10 unchanged 6.25 No change this year, 25bps cut in Q12011. NA
BBB Stable Ru ssiaRu ssiaRu ssiaRu ssia unchanged 7.75 No change this year. NA
BB Positive Tu rke yTu rke yTu rke yTu rke y 14 Oct 10 unchanged 7.00 First rate hike at the end of Q1 2011 18
BBB+ Negative S ou th Afr icaS ou th Afr icaS ou th Afr icaS ou th Afr ica 18 Nov 10 -50 6.00 Key rate to bottom at 6.00%. -14
A Stable Israe lIsrae lIsrae lIsrae l 27 Sep 10 unchanged 1.75 We expect 2.25% by year-end. 38
BB+ Stable EgyptEgyptEgyptEgypt 04 Nov 10 unchanged 8.25 No change until March 2011 NA
BBB- Stable Brazi lBrazi lBrazi lBrazi l 20 Oct 10 unchanged 10.75 Dovish stance risks no move. The latter may be tested in Q4 as inflation trends reverse.
16
A+ Stable Ch i leCh i leCh i leCh i le 14 Oct 10 +50 2.50
Rising inflation and strong domestic push keep
BCCH on tightening mode. We expect 3.75% by
year-end.
150
BBB- Positive Co lombiaCo lombiaCo lombiaCo lombia 24 Sep 10 unchanged 3.00
Despite growth and inflation upturn policymakers
remain dovish on potential pressures. Concerns over
global demand and COP strength risk a continued
pause through Q4.
0
BBB Stable Me xicoMe xicoMe xicoMe xico 24 Sep 10 unchanged 4.50 Lower inflation and Fed hike delay may push
Banxico to act only in 2011.0
Source: SG Cross Asset Research, KB, Bloomberg, Reut ers (as at 23 Sep 10 close.). ̂ S&P rat ings are used
0
1
2
3
4
5
6
7
8
-20
-10
0
10
20
30
40
50
PLN HUF CZK ZAR ILS TRY
Ke
y Po
licy ra
tes
(%)F
RA
-p
rem
ium
(bp
)
3m 1m fwd* (LHS) 3m 2m fwd* (LHS) 3m 3m fwd* (LHS) Current base rate (RHS)
Emerging Markets Weekly
22224444 SSSSeeeepppptttteeeemmmmbbbbeeeerrrr 2222000011110000 8888
EMEA: vEMEA: vEMEA: vEMEA: varying monetary cycles arying monetary cycles arying monetary cycles arying monetary cycles remainremainremainremain intactintactintactintact
Varying monetary cycles remain intact, especially with CEEMEA central banks lagging their Asian and Latin American peers. This has been an important factor in curve dynamics in this region and is likely to remain the driver. The Czech National Bank held its rate steady on 23 September. Poland, Hungary, Romania and Israel are due to make rate announcements in coming weeks. Key points:
* Hungary: central bank to keep the key rate unchanged, * Hungary: central bank to keep the key rate unchanged, * Hungary: central bank to keep the key rate unchanged, * Hungary: central bank to keep the key rate unchanged, but we still pay 2y IRS but we still pay 2y IRS but we still pay 2y IRS but we still pay 2y IRS on dipson dipson dipson dips
* Israel: another close call but a 25bp rate hike is likely, * Israel: another close call but a 25bp rate hike is likely, * Israel: another close call but a 25bp rate hike is likely, * Israel: another close call but a 25bp rate hike is likely, justifying further curve flatteningjustifying further curve flatteningjustifying further curve flatteningjustifying further curve flattening
* Poland: preparing for a rate hike. Pay * Poland: preparing for a rate hike. Pay * Poland: preparing for a rate hike. Pay * Poland: preparing for a rate hike. Pay 2222xxxx5555 FRA FRA FRA FRA on dips on dips on dips on dips
* Romania: no room for manoeuvre on monetary policy this * Romania: no room for manoeuvre on monetary policy this * Romania: no room for manoeuvre on monetary policy this * Romania: no room for manoeuvre on monetary policy this year, but steepening bias remains year, but steepening bias remains year, but steepening bias remains year, but steepening bias remains
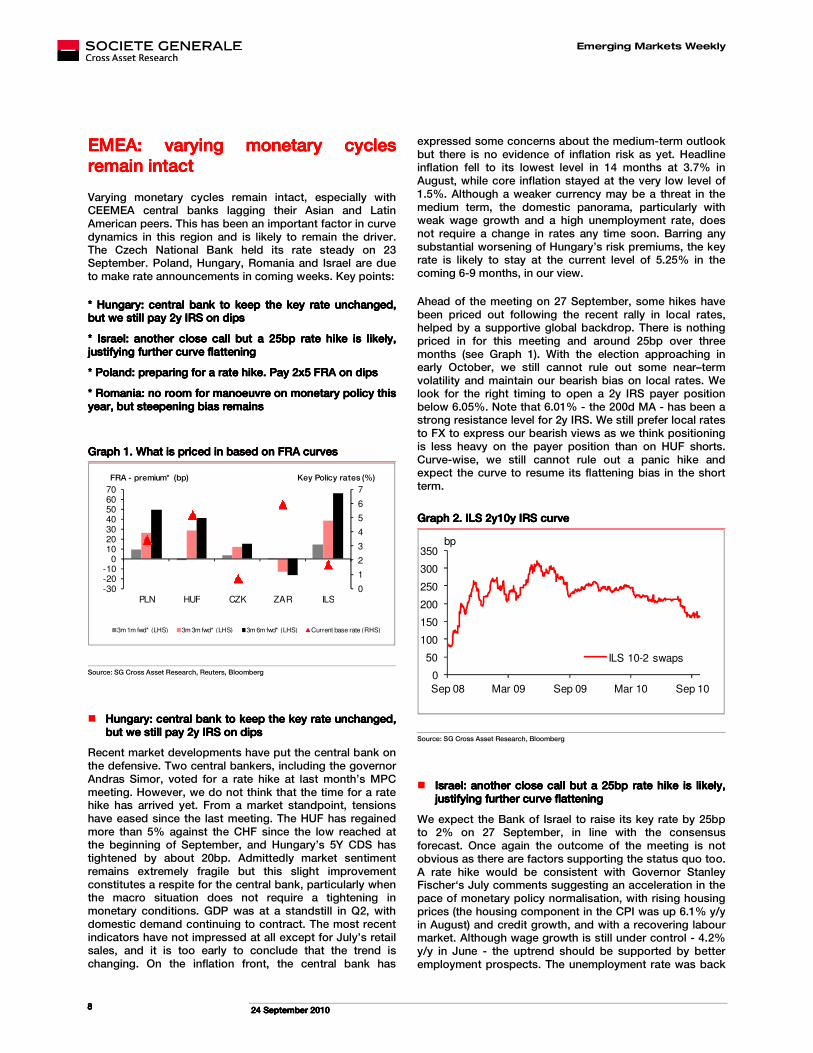
GraphGraphGraphGraph 1.1.1.1. What is priced in based on FRA curvesWhat is priced in based on FRA curvesWhat is priced in based on FRA curvesWhat is priced in based on FRA curves
0
1
2
3
4
5
6
7
-30-20-10
010203040506070
PLN HUF CZK ZAR ILS
3m 1m fwd* (LHS) 3m 3m fwd* (LHS) 3m 6m fwd* (LHS) Current base rate (RHS)
FRA - premium* (bp) Key Policy rates (%)
Source: SG Cross Asset Research, Reuters, Bloomberg
� Hungary: central bankHungary: central bankHungary: central bankHungary: central bank to keep the key rate unchanged, to keep the key rate unchanged, to keep the key rate unchanged, to keep the key rate unchanged, but we still pay 2y IRS on dipsbut we still pay 2y IRS on dipsbut we still pay 2y IRS on dipsbut we still pay 2y IRS on dips
Recent market developments have put the central bank on the defensive. Two central bankers, including the governor Andras Simor, voted for a rate hike at last month’s MPC meeting. However, we do not think that the time for a rate hike has arrived yet. From a market standpoint, tensions have eased since the last meeting. The HUF has regained more than 5% against the CHF since the low reached at the beginning of September, and Hungary’s 5Y CDS has tightened by about 20bp. Admittedly market sentiment remains extremely fragile but this slight improvement constitutes a respite for the central bank, particularly when the macro situation does not require a tightening in monetary conditions. GDP was at a standstill in Q2, with domestic demand continuing to contract. The most recent indicators have not impressed at all except for July’s retail sales, and it is too early to conclude that the trend is changing. On the inflation front, the central bank has
expressed some concerns about the medium-term outlook but there is no evidence of inflation risk as yet. Headline inflation fell to its lowest level in 14 months at 3.7% in August, while core inflation stayed at the very low level of 1.5%. Although a weaker currency may be a threat in the medium term, the domestic panorama, particularly with weak wage growth and a high unemployment rate, does not require a change in rates any time soon. Barring any substantial worsening of Hungary’s risk premiums, the key rate is likely to stay at the current level of 5.25% in the coming 6-9 months, in our view.
Ahead of the meeting on 27 September, some hikes have been priced out following the recent rally in local rates, helped by a supportive global backdrop. There is nothing priced in for this meeting and around 25bp over three months (see Graph 1). With the election approaching in early October, we still cannot rule out some near–term volatility and maintain our bearish bias on local rates. We look for the right timing to open a 2y IRS payer position below 6.05%. Note that 6.01% - the 200d MA - has been a strong resistance level for 2y IRS. We still prefer local rates to FX to express our bearish views as we think positioning is less heavy on the payer position than on HUF shorts. Curve-wise, we still cannot rule out a panic hike and expect the curve to resume its flattening bias in the short term.
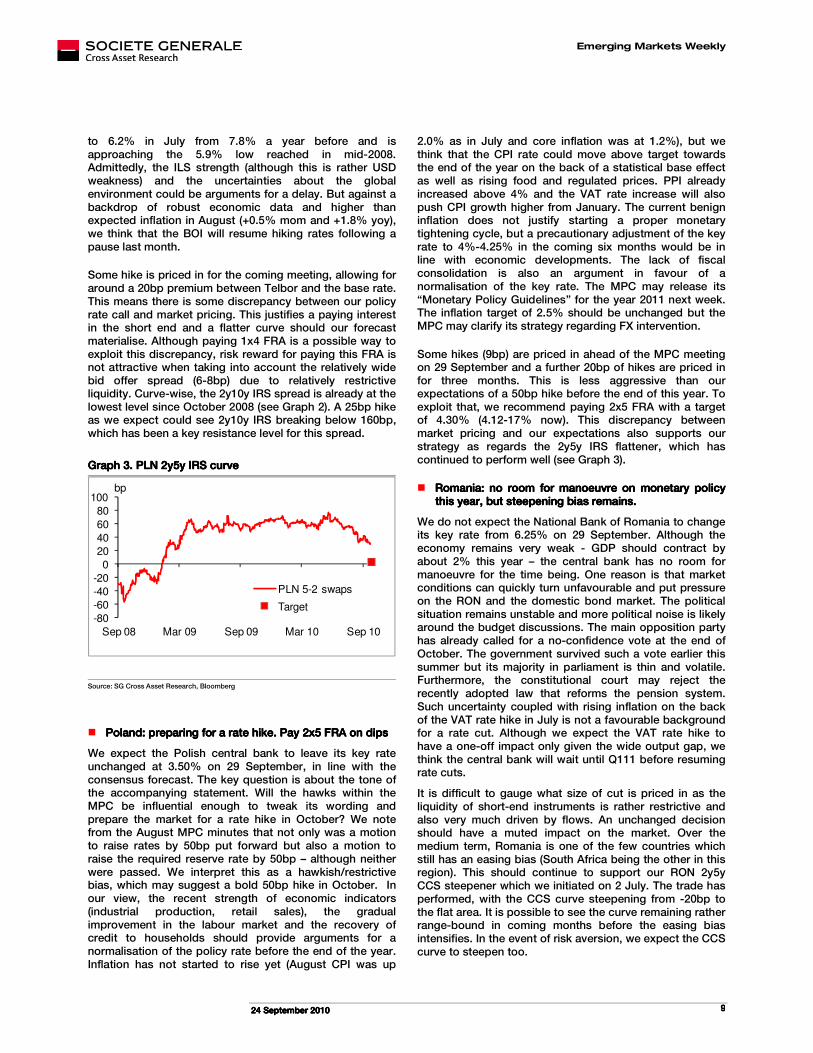
GraphGraphGraphGraph 2.2.2.2. ILS 2y10y IRS curve ILS 2y10y IRS curve ILS 2y10y IRS curve ILS 2y10y IRS curve
0
50
100
150
200
250
300
350
Sep 08 Mar 09 Sep 09 Mar 10 Sep 10
bp
ILS 10-2 swaps
Source: SG Cross Asset Research, Bloomberg
� Israel: another close call Israel: another close call Israel: another close call Israel: another close call but a 25bp rate hike is likely, but a 25bp rate hike is likely, but a 25bp rate hike is likely, but a 25bp rate hike is likely, justifying further curve flatteningjustifying further curve flatteningjustifying further curve flatteningjustifying further curve flattening
We expect the Bank of Israel to raise its key rate by 25bp to 2% on 27 September, in line with the consensus forecast. Once again the outcome of the meeting is not obvious as there are factors supporting the status quo too. A rate hike would be consistent with Governor Stanley Fischer‘s July comments suggesting an acceleration in the pace of monetary policy normalisation, with rising housing prices (the housing component in the CPI was up 6.1% y/y in August) and credit growth, and with a recovering labour market. Although wage growth is still under control - 4.2% y/y in June - the uptrend should be supported by better employment prospects. The unemployment rate was back
Emerging Markets Weekly
22224444 SSSSeeeepppptttteeeemmmmbbbbeeeerrrr 2222000011110000 9999
to 6.2% in July from 7.8% a year before and is approaching the 5.9% low reached in mid-2008. Admittedly, the ILS strength (although this is rather USD weakness) and the uncertainties about the global environment could be arguments for a delay. But against a backdrop of robust economic data and higher than expected inflation in August (+0.5% mom and +1.8% yoy), we think that the BOI will resume hiking rates following a pause last month.
Some hike is priced in for the coming meeting, allowing for around a 20bp premium between Telbor and the base rate. This means there is some discrepancy between our policy rate call and market pricing. This justifies a paying interest in the short end and a flatter curve should our forecast materialise. Although paying 1x4 FRA is a possible way to exploit this discrepancy, risk reward for paying this FRA is not attractive when taking into account the relatively wide bid offer spread (6-8bp) due to relatively restrictive liquidity. Curve-wise, the 2y10y IRS spread is already at the lowest level since October 2008 (see Graph 2). A 25bp hike as we expect could see 2y10y IRS breaking below 160bp, which has been a key resistance level for this spread.
GraphGraphGraphGraph 3333.... PLN 2y5y IRS curve PLN 2y5y IRS curve PLN 2y5y IRS curve PLN 2y5y IRS curve
-80
-60
-40
-20
0
20
40
60
80
100
Sep 08 Mar 09 Sep 09 Mar 10 Sep 10
bp
PLN 5-2 swaps
Target
Source: SG Cross Asset Research, Bloomberg
� Poland:Poland:Poland:Poland: preparing for a rate hikepreparing for a rate hikepreparing for a rate hikepreparing for a rate hike. Pay . Pay . Pay . Pay 2x5 FRA on dips2x5 FRA on dips2x5 FRA on dips2x5 FRA on dips
We expect the Polish central bank to leave its key rate unchanged at 3.50% on 29 September, in line with the consensus forecast. The key question is about the tone of the accompanying statement. Will the hawks within the MPC be influential enough to tweak its wording and prepare the market for a rate hike in October? We note from the August MPC minutes that not only was a motion to raise rates by 50bp put forward but also a motion to raise the required reserve rate by 50bp – although neither were passed. We interpret this as a hawkish/restrictive bias, which may suggest a bold 50bp hike in October. In our view, the recent strength of economic indicators (industrial production, retail sales), the gradual improvement in the labour market and the recovery of credit to households should provide arguments for a normalisation of the policy rate before the end of the year. Inflation has not started to rise yet (August CPI was up
2.0% as in July and core inflation was at 1.2%), but we think that the CPI rate could move above target towards the end of the year on the back of a statistical base effect as well as rising food and regulated prices. PPI already increased above 4% and the VAT rate increase will also push CPI growth higher from January. The current benign inflation does not justify starting a proper monetary tightening cycle, but a precautionary adjustment of the key rate to 4%-4.25% in the coming six months would be in line with economic developments. The lack of fiscal consolidation is also an argument in favour of a normalisation of the key rate. The MPC may release its “Monetary Policy Guidelines” for the year 2011 next week. The inflation target of 2.5% should be unchanged but the MPC may clarify its strategy regarding FX intervention.
Some hikes (9bp) are priced in ahead of the MPC meeting on 29 September and a further 20bp of hikes are priced in for three months. This is less aggressive than our expectations of a 50bp hike before the end of this year. To exploit that, we recommend paying 2x5 FRA with a target of 4.30% (4.12-17% now). This discrepancy between market pricing and our expectations also supports our strategy as regards the 2y5y IRS flattener, which has continued to perform well (see Graph 3).
� Romania: no Romania: no Romania: no Romania: no room for manoeuvre on monetary policyroom for manoeuvre on monetary policyroom for manoeuvre on monetary policyroom for manoeuvre on monetary policy this year, but steepening bias remains. this year, but steepening bias remains. this year, but steepening bias remains. this year, but steepening bias remains.
We do not expect the National Bank of Romania to change its key rate from 6.25% on 29 September. Although the economy remains very weak - GDP should contract by about 2% this year – the central bank has no room for manoeuvre for the time being. One reason is that market conditions can quickly turn unfavourable and put pressure on the RON and the domestic bond market. The political situation remains unstable and more political noise is likely around the budget discussions. The main opposition party has already called for a no-confidence vote at the end of October. The government survived such a vote earlier this summer but its majority in parliament is thin and volatile. Furthermore, the constitutional court may reject the recently adopted law that reforms the pension system. Such uncertainty coupled with rising inflation on the back of the VAT rate hike in July is not a favourable background for a rate cut. Although we expect the VAT rate hike to have a one-off impact only given the wide output gap, we think the central bank will wait until Q111 before resuming rate cuts.
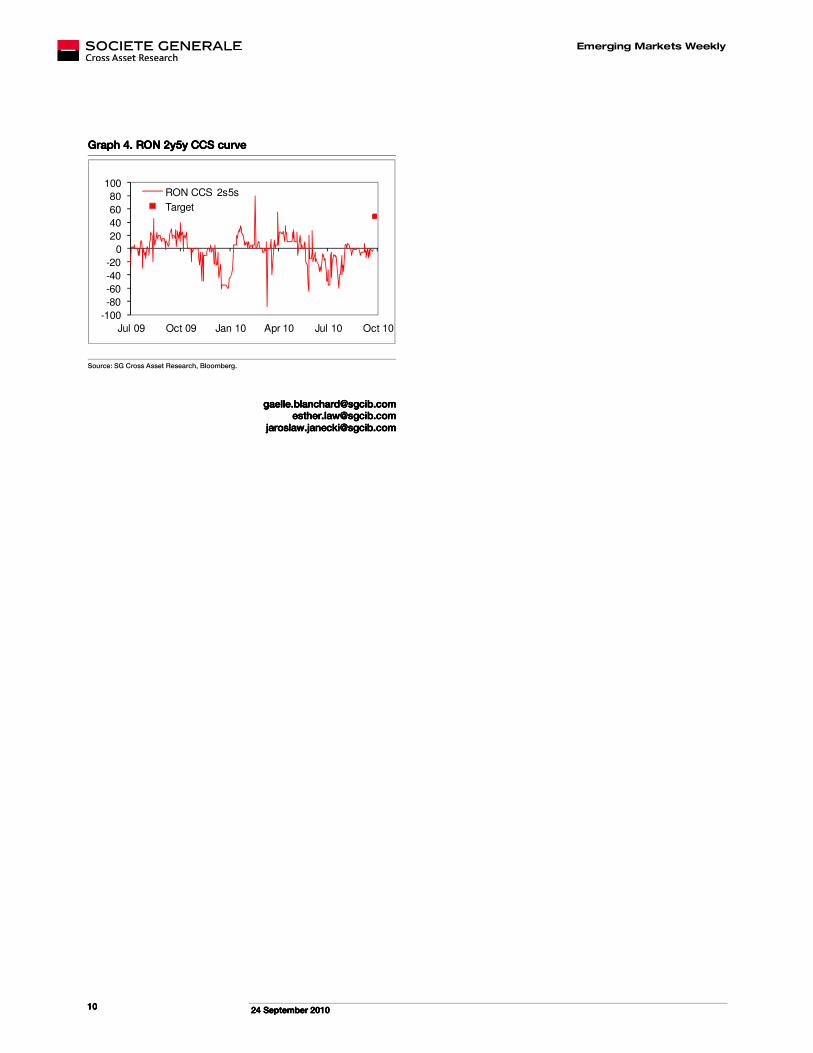
It is difficult to gauge what size of cut is priced in as the liquidity of short-end instruments is rather restrictive and also very much driven by flows. An unchanged decision should have a muted impact on the market. Over the medium term, Romania is one of the few countries which still has an easing bias (South Africa being the other in this region). This should continue to support our RON 2y5y CCS steepener which we initiated on 2 July. The trade has performed, with the CCS curve steepening from -20bp to the flat area. It is possible to see the curve remaining rather range-bound in coming months before the easing bias intensifies. In the event of risk aversion, we expect the CCS curve to steepen too.
Emerging Markets Weekly
22224444 SSSSeeeepppptttteeeemmmmbbbbeeeerrrr 2222000011110000 10101010
GraphGraphGraphGraph 4444.... RON 2y5y RON 2y5y RON 2y5y RON 2y5y CCSCCSCCSCCS curve curve curve curve
-100
-80
-60
-40
-20
0
20
40
60
80
100
Jul 09 Oct 09 Jan 10 Apr 10 Jul 10 Oct 10
RON CCS 2s5s
Target
b
Source: SG Cross Asset Research, Bloomberg.
[email protected]@[email protected]@sgcib.com [email protected]@[email protected]@sgcib.com
[email protected]@[email protected]@sgcib.com
Emerging Markets Weekly
22224444 SSSSeeeepppptttteeeemmmmbbbbeeeerrrr 2222000011110000 11111111
FX FX FX FX StrategyStrategyStrategyStrategy
EUR/PLNEUR/PLNEUR/PLNEUR/PLN 1 week view1 week view1 week view1 week view ���� 1 month view1 month view1 month view1 month view ����
Heavy positioning Heavy positioning Heavy positioning Heavy positioning prevents PLN prevents PLN prevents PLN prevents PLN
appreciation in the short appreciation in the short appreciation in the short appreciation in the short termtermtermterm
No change on the key No change on the key No change on the key No change on the key rate this month but a rate rate this month but a rate rate this month but a rate rate this month but a rate
hike in October is likelyhike in October is likelyhike in October is likelyhike in October is likely
The PLN has remained very stable over the past two weeks, trading in a narrow 3.92-3.96 range. Not only was the Polish currency unable to benefit from the boost in risk appetite provided by the dovish FOMC statement, but it even weakened above 3.96 towards the end of the week. Although we have a medium term bullish view on the PLN, positioning is currently unfavourable. We would seek better levels (around 4.00) to go long PLN, as the upside appears fairly limited in the current conditions (heavy positioning, risks of intervention in case of fast PLN strengthening and potential risk aversion on global markets).
The only event next week is the MPC meeting on 29 September. In line with consensus, we expect the Polish central bank to leave its key rate unchanged at 3.50%. The key question is over the tone of the statement. Will the hawks within the MPC be influential enough to trigger a tweak in the wording of the statement and prepare the market for a rate hike in October? It is interesting to note that in the August MPC minutes, not only was the motion to raise rates put forward, but also a motion to raise the required reserve rate by 50bp, even though neither motion was passed. We interpret this as a hawkish/restrictive bias, which may suggest a bold 50bp hike in October.
In our view, the recent strength of economic indicators (industrial production, retail sales), the gradual improvement in the labour market and the recovery of household credit should provide arguments for a normalisation of the policy rate before the end of the year. Inflation has not started to rise yet (August CPI was up 2.0% as in July and core inflation at 1.2%), but we think that the CPI rate could move above target towards the end of the year, on the back of a statistical base effect as well as rising food and regulated prices. PPI already increased above 4%, the VAT rate increase will also push CPI growth higher from January.
The current benign inflation does not justify starting a proper monetary tightening cycle, but a precautionary adjustment of the key rate to 4%-4.25% in the coming six months would be in line with economic developments. The lack of fiscal consolidation is also an argument in favour of a normalisation of the key rate...
EUR/CZKEUR/CZKEUR/CZKEUR/CZK 1 week view1 week view1 week view1 week view ���� 1 month view1 month view1 month view1 month view ����
Czech crown has not Czech crown has not Czech crown has not Czech crown has not significantly shifted from significantly shifted from significantly shifted from significantly shifted from
last Friday’s clast Friday’s clast Friday’s clast Friday’s closeloseloselose
CNB did not surprise on CNB did not surprise on CNB did not surprise on CNB did not surprise on ratesratesratesrates
No domestic indicators were released this week and the EUR/CZK exchange rate dropped only slightly from last week’s closing level. It tested the support level at 24.50, but then bounced up. Trading was very calm and business activity was low. The crown was again less volatile than other currencies in the CEEMEA region. Few macroeconomic indicators are due next week and this Tuesday is a holiday in the Czech Republic. The exchange rate will be driven by developments in global markets but we do not expect any change in trend next week. Although current levels are slightly overvalued, they are not harming the economy. The anticipated rise in risk aversion should push the exchange rate up in Q410. We see the rate at 24.80 by the end of this year.
The Czech national bank left its key rate unchanged, in line with market and our expectations. The bank board voted 6-1 - it was the first time anybody on the board had voted for a rate hike since Mojmir Hampl voted alone for a hike in June 2008. The CNB sees risks as balanced, a shift from “slightly dis-inflationary” at the last meeting in August (for more information see our CNB Focus published on 23 September).
EUR/HUFEUR/HUFEUR/HUFEUR/HUF 1 week view1 week view1 week view1 week view ���� 1 month view1 month view1 month view1 month view ����
The central bank willThe central bank willThe central bank willThe central bank will keep its key rate keep its key rate keep its key rate keep its key rate
unchangedunchangedunchangedunchanged
EUR/HUF fell all the way from 290 at close on 8 September to 277.70 on 22 September, before settling around 280 at the end of the week. The move was triggered by the government’s new commitment to fiscal targets, better global risk sentiment and good news on the foreign direct investment front. Audi and General Motors have announced plans to invest EUR900mn and EUR500mn respectively to extend factories in Hungary. Besides the positive impact on FDI flows, which have been shrinking with the crisis, it will also have a positive effect on employment and economic growth.
The main event next week is the MPC meeting on 27 September. Recent market developments have put the central bank on the defensive. Two central bankers, including the governor Andras Simor, voted for a rate hike at last month’s MPC meeting. However, we do not think that the time for a rate hike has arrived yet. From a market standpoint, tensions have
Emerging Markets Weekly
22224444 SSSSeeeepppptttteeeemmmmbbbbeeeerrrr 2222000011110000 12121212
The HUF recovery should The HUF recovery should The HUF recovery should The HUF recovery should be very limited from be very limited from be very limited from be very limited from
current levelscurrent levelscurrent levelscurrent levels
WWWWe keep a cautious view e keep a cautious view e keep a cautious view e keep a cautious view on the HUF, as the on the HUF, as the on the HUF, as the on the HUF, as the
currency remains currency remains currency remains currency remains vvvvulnerable to an external ulnerable to an external ulnerable to an external ulnerable to an external
shockshockshockshock
eased since the last meeting. The HUF has regained more than 5% against the CHF since the low reached at the beginning of September, and Hungary’s 5Y CDS has tightened by about 20bp. Admittedly market sentiment remains extremely fragile but this slight improvement constitutes a respite for the central bank, particularly when the macro situation does not require a tightening in monetary conditions. GDP was at a standstill in Q2, with domestic demand continuing to contract. The most recent indicators have not impressed at all except for July’s retail sales, and it is too early to conclude that the trend is changing.
On the inflation front, the central bank has expressed some concerns about the medium-term outlook but there is no evidence of inflation risk as yet. Headline inflation fell to its lowest level in 14 months at 3.7% in August, while core inflation stayed at the very low level of 1.5%. Although a weaker currency may be a threat in the medium term, the domestic panorama, particularly with weak wage growth and a high unemployment rate, does not require a change in rates any time soon. Barring any substantial worsening of Hungary’s risk premiums, the key rate is likely to stay at the current level of 5.25% in the coming 6-9 months, in our view.
FX-wise, we keep a cautious view on the HUF and do not expect gains beyond 278 vs EUR despite the recent positive momentum, as the currency remains very vulnerable to an external shock, notably regarding sovereign debt concerns. We expect EUR/HUF to move back into the 290 area in the coming months.
EUR/RONEUR/RONEUR/RONEUR/RON 1 week view1 week view1 week view1 week view ���� 1 month view1 month view1 month view1 month view ����
The NBR will leave the The NBR will leave the The NBR will leave the The NBR will leave the
key rate unchanged this key rate unchanged this key rate unchanged this key rate unchanged this weekweekweekweek
Political noise willPolitical noise willPolitical noise willPolitical noise will weigh weigh weigh weigh on the RON in coming on the RON in coming on the RON in coming on the RON in coming
weeksweeksweeksweeks
EUR/RON has been trending higher over the past ten days, on the back of renewed political uncertainties and this is likely to be a recurrent issue in the month ahead. The only event next week is the central bank’s monetary policy meeting and it is unlikely to have any market impact. We do not expect any change in the key rate by the NBR on 29 September (key rate at 6.25%). Although the economy remains very weak - GDP should contract by about 2% this year – the central bank has no room to manoeuvre for the time being. One reason is that market conditions can quickly turn unfavourable, putting pressure on the RON and domestic bond market. The political situation remains unstable and more political noise is likely around the budget discussions. The main opposition party has already called for a no-confidence vote at the end of October. The government survived such a vote earlier this summer but its majority in parliament is thin and volatile. Furthermore, the constitutional court may reject the recently adopted law that reforms the pension system. Such uncertainty, coupled with rising inflation on the back of the VAT rate hike in July, does not provide the favourable background for a rate cut. Although we expect the VAT rate hike to have only a one-off impact (given the wide output gap), we think the central bank will wait until Q1 to resume rate cuts.
We could see further RON weakness in the coming weeks but the central bank would intervene at some point so the upside for EUR/RON is limited to the area of 4.35.
Basket/RUBBasket/RUBBasket/RUBBasket/RUB 1 week view1 week view1 week view1 week view ���� 1 month view1 month view1 month view1 month view ����
We keep our positive We keep our positive We keep our positive We keep our positive view on the RUB but the view on the RUB but the view on the RUB but the view on the RUB but the
currency may remain currency may remain currency may remain currency may remain stuck above 35.00 vs the stuck above 35.00 vs the stuck above 35.00 vs the stuck above 35.00 vs the
basket for a while until basket for a while until basket for a while until basket for a while until position cleaning is overposition cleaning is overposition cleaning is overposition cleaning is over
The RUB remained under pressure vs the basket this week, underperforming most other EM currencies. The RUB lost 1.8% vs EUR during the week but remained stable vs USD, even when the dollar was broadly weakening after the FOMC statement. The central bank said it had sold USD0.6bn on the FX market so far in September, and reiterated that the CBR’s aim was to reduce volatility. The upper band of the current narrow fluctuation range is 36.30, but the CBR is likely to be more active in the market before this limit, as it has been during the past few days. Concerns have emerged about the outlook for the current account surplus as the recovery in domestic demand is fuelling rapid import growth. If oil prices do not rise further, this will lead to a reduction of external balances. For the time being, the trade and current account balances remain large enough to provide support to the RUB. Going forward, the evolution of oil prices will remain key.
We keep our positive view on the RUB as our oil forecasts are still supportive, but the currency may remain stuck above 35.00 vs the basket for a while until position cleaning is over.
USD/ZARUSD/ZARUSD/ZARUSD/ZAR 1 week view1 week view1 week view1 week view ���� 1 month view1 month view1 month view1 month view ����
USD/ZAR fell below 7.00 for the first time since February 2008 on Wednesday. The acceleration of the downward trend was triggered by the boost in risk appetite following the FOMC meeting and by better-than-expected domestic data. Retail sales were up 7.9% in July after 7.6% in June (consensus was 7.1%), and the reduction of the current account deficit in
Emerging Markets Weekly
22224444 SSSSeeeepppptttteeeemmmmbbbbeeeerrrr 2222000011110000 13131313
The trend in portfolio The trend in portfolio The trend in portfolio The trend in portfolio
flows will be a key factor flows will be a key factor flows will be a key factor flows will be a key factor to watch, as it could be to watch, as it could be to watch, as it could be to watch, as it could be
the trigger for a reversal the trigger for a reversal the trigger for a reversal the trigger for a reversal in USD/ZAR. in USD/ZAR. in USD/ZAR. in USD/ZAR.
Q2 was quite impressive (from 4.6% of GDP in Q1 to 2.5%, while consensus was 3.2%). It was triggered by a switch of the trade balance to surplus from deficit and by the positive impact on the services balance of tourism linked to the World Cup. The current account data are likely to be less good in coming quarters as the World Cup’s one-off effect will disappear and the recovery in domestic demand – even if only gradual – should weigh on the trade balance. On the financing side, most of the inflows are portfolio investment while FDI remain very low.
The reliance on portfolio inflows (which are more volatile) in financing the current account deficit is a potential vulnerability. It is difficult to go against the strong downward momentum in USD/ZAR for the moment, especially as the authorities appear unable to find a proper way to stem the rand’s strength. The trend in portfolio flows will be a key factor to watch going forward, as it could be the trigger for a reversal in USD/ZAR. Given the heavy positioning in the rand, the correction could be quite large.
USD/ILSUSD/ILSUSD/ILSUSD/ILS 1 week view1 week view1 week view1 week view ���� 1 month view1 month view1 month view1 month view ����
Current ILS strength is Current ILS strength is Current ILS strength is Current ILS strength is
triggered by broadtriggered by broadtriggered by broadtriggered by broad----based based based based USD weaknessUSD weaknessUSD weaknessUSD weakness
Bank ofBank ofBank ofBank of Israel to raise its Israel to raise its Israel to raise its Israel to raise its key rate by 25bpkey rate by 25bpkey rate by 25bpkey rate by 25bp, , , ,
providing further support providing further support providing further support providing further support for ILSfor ILSfor ILSfor ILS
BOI to continue BOI to continue BOI to continue BOI to continue intervention policy intervention policy intervention policy intervention policy
The “risk-on” environment and broad-based USD weakness have pushed ILS higher vs USD since the beginning of the month. The FOMC’s dovish tone this week coupled with prospects of a 25bp rate hike by the BOI on 27 September further accelerated this movement. USD/ILS has fallen by almost 4% since end-August, but EUR/ILS has gained 4% since mid-September.
We expect the Bank of Israel to raise its key rate by 25bp to 2% on Monday, in line with the consensus forecast. Once again the outcome of the meeting is not obvious as there are factors supporting the status quo too. A rate hike would be consistent with Governor Stanley Fischer‘s July comments suggesting an acceleration in the pace of monetary policy normalisation, with rising housing prices (the housing component in the CPI was up 6.1% y/y in August) and credit growth, and with a recovering labour market. Although wage growth is still under control - 4.2% y/y in June - the uptrend should be supported by better employment prospects. The unemployment rate was back to 6.2% in July from 7.8% a year before. The unemployment rate is approaching the 5.9% low reached in mid-2008. Admittedly, the ILS strength (although this is rather USD weakness) and the uncertainties about the global environment could be arguments for a delay. But against a backdrop of robust economic data and higher than expected inflation in August (+0.5% mom and +1.8% yoy), we think that the BOI will resume hiking rates following a pause last month.
As the rate hike is not entirely priced in by the market, further ILS gains are possible following the BOI’s decision. USD/ILS could move towards April’s low of 3.67, especially if EUR/USD continues to move higher. However, the central bank will continue its intervention policy to stem the ILS appreciation.
[email protected]@[email protected]@sgcib.com
[email protected][email protected][email protected][email protected]
Emerging Markets Weekly
22224444 SSSSeeeepppptttteeeemmmmbbbbeeeerrrr 2222000011110000 14141414
Technical analysis
EUR/CZK: ST pause before extension of MT downtrendEUR/CZK: ST pause before extension of MT downtrendEUR/CZK: ST pause before extension of MT downtrendEUR/CZK: ST pause before extension of MT downtrend
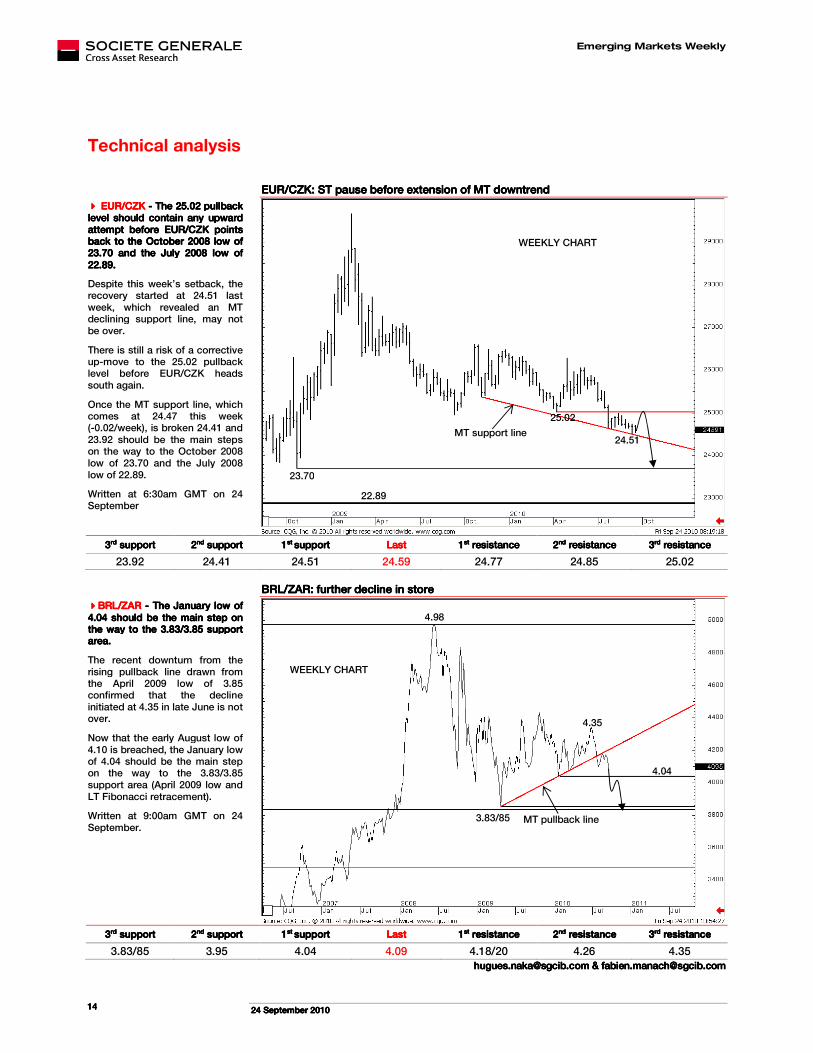
���� EUR/CZKEUR/CZKEUR/CZKEUR/CZK ---- The 25.02 pullback The 25.02 pullback The 25.02 pullback The 25.02 pullback level should contain any upward level should contain any upward level should contain any upward level should contain any upward attempt before EUR/CZK points attempt before EUR/CZK points attempt before EUR/CZK points attempt before EUR/CZK points back to the October 2008 low of back to the October 2008 low of back to the October 2008 low of back to the October 2008 low of 23.70 and the July 2008 low of 23.70 and the July 2008 low of 23.70 and the July 2008 low of 23.70 and the July 2008 low of 22.89.22.89.22.89.22.89.
Despite this week’s setback, the recovery started at 24.51 last week, which revealed an MT declining support line, may not be over.
There is still a risk of a corrective up-move to the 25.02 pullback level before EUR/CZK heads south again.
Once the MT support line, which comes at 24.47 this week (-0.02/week), is broken 24.41 and 23.92 should be the main steps on the way to the October 2008 low of 23.70 and the July 2008 low of 22.89.
Written at 6:30am GMT on 24 September
3333rdrdrdrd supportsupportsupportsupport 2222ndndndnd supportsupportsupportsupport 1111st st st st supsupsupsupportportportport LastLastLastLast 1111stststst resistanceresistanceresistanceresistance 2222ndndndnd resistanceresistanceresistanceresistance 3333rdrdrdrd resistanceresistanceresistanceresistance
23.92 24.41 24.51 24.59 24.77 24.85 25.02
BRLBRLBRLBRL/ZAR/ZAR/ZAR/ZAR: : : : further decline in storefurther decline in storefurther decline in storefurther decline in store
����BRLBRLBRLBRL/ZAR/ZAR/ZAR/ZAR ---- TTTThe January low of he January low of he January low of he January low of 4.04 should be the main step on 4.04 should be the main step on 4.04 should be the main step on 4.04 should be the main step on the way to the 3.83/3.85 support the way to the 3.83/3.85 support the way to the 3.83/3.85 support the way to the 3.83/3.85 support areaareaareaarea....
The recent downturn from the rising pullback line drawn from the April 2009 low of 3.85 confirmed that the decline initiated at 4.35 in late June is not over.
Now that the early August low of 4.10 is breached, the January low of 4.04 should be the main step on the way to the 3.83/3.85 support area (April 2009 low and LT Fibonacci retracement).
Written at 9:00am GMT on 24 September.
3333rdrdrdrd supportsupportsupportsupport 2222ndndndnd supportsupportsupportsupport 1111st st st st supportsupportsupportsupport LastLastLastLast 1111stststst resistanceresistanceresistanceresistance 2222ndndndnd resistanceresistanceresistanceresistance 3333rdrdrdrd resistanceresistanceresistanceresistance
3.83/85 3.95 4.04 4.09 4.18/20 4.26 4.35 [email protected]@[email protected]@sgcib.com & [email protected]& [email protected]& [email protected]& [email protected]
WEEKLY CHART
MT pullback line 3.83/85
4.04
4.35
4.98
WEEKLY CHART
25.02
22.89
23.70
24.51 MT support line
Emerging Markets Weekly
22224444 SSSSeeeepppptttteeeemmmmbbbbeeeerrrr 2222000011110000 15151515
FX QuantsightFX QuantsightFX QuantsightFX Quantsight
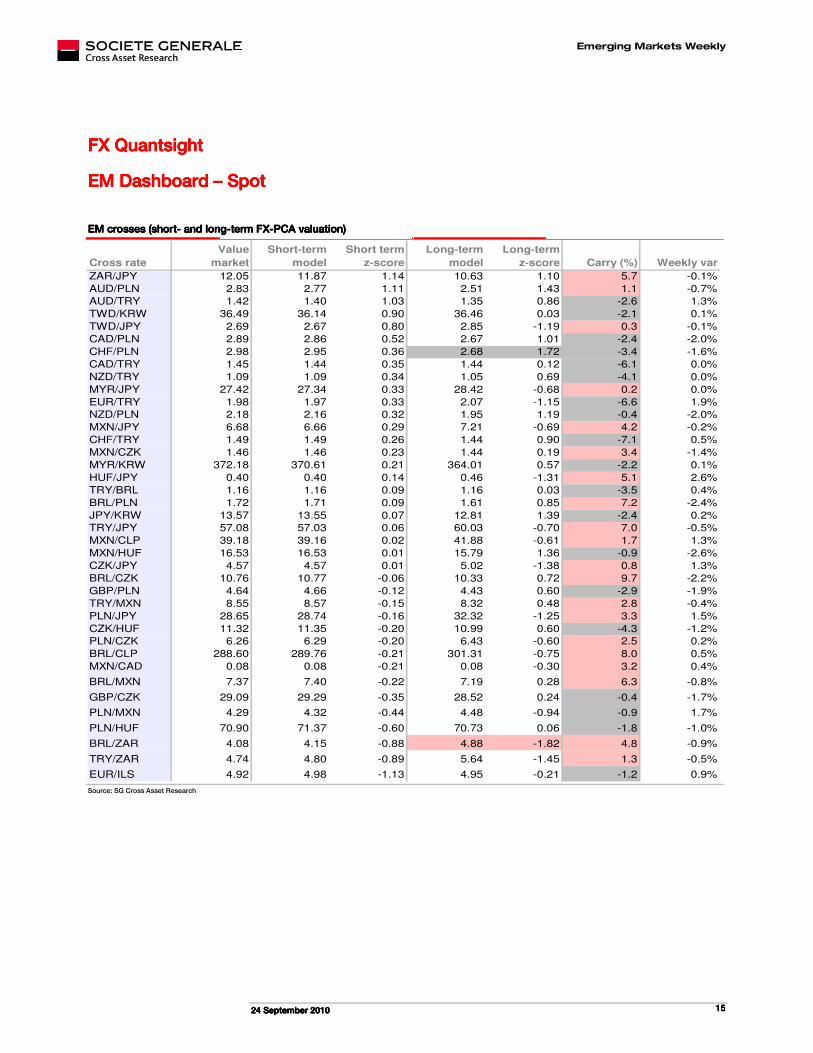
EM Dashboard EM Dashboard EM Dashboard EM Dashboard –––– SpotSpotSpotSpot
EM crosses (EM crosses (EM crosses (EM crosses (sssshorthorthorthort---- and and and and llllongongongong----term FXterm FXterm FXterm FX----PCA valuation)PCA valuation)PCA valuation)PCA valuation)
Cross rate
Value
market
Short-term
model
Short term
z-score
Long-term
model
Long-term
z-score Carry (%) Weekly var
ZAR/JPY 12.05 11.87 1.14 10.63 1.10 5.7 -0.1%
AUD/PLN 2.83 2.77 1.11 2.51 1.43 1.1 -0.7%
AUD/TRY 1.42 1.40 1.03 1.35 0.86 -2.6 1.3%
TWD/KRW 36.49 36.14 0.90 36.46 0.03 -2.1 0.1%
TWD/JPY 2.69 2.67 0.80 2.85 -1.19 0.3 -0.1%
CAD/PLN 2.89 2.86 0.52 2.67 1.01 -2.4 -2.0%
CHF/PLN 2.98 2.95 0.36 2.68 1.72 -3.4 -1.6%
CAD/TRY 1.45 1.44 0.35 1.44 0.12 -6.1 0.0%
NZD/TRY 1.09 1.09 0.34 1.05 0.69 -4.1 0.0%
MYR/JPY 27.42 27.34 0.33 28.42 -0.68 0.2 0.0%
EUR/TRY 1.98 1.97 0.33 2.07 -1.15 -6.6 1.9%
NZD/PLN 2.18 2.16 0.32 1.95 1.19 -0.4 -2.0%
MXN/JPY 6.68 6.66 0.29 7.21 -0.69 4.2 -0.2%
CHF/TRY 1.49 1.49 0.26 1.44 0.90 -7.1 0.5%
MXN/CZK 1.46 1.46 0.23 1.44 0.19 3.4 -1.4%
MYR/KRW 372.18 370.61 0.21 364.01 0.57 -2.2 0.1%
HUF/JPY 0.40 0.40 0.14 0.46 -1.31 5.1 2.6%
TRY/BRL 1.16 1.16 0.09 1.16 0.03 -3.5 0.4%
BRL/PLN 1.72 1.71 0.09 1.61 0.85 7.2 -2.4%
JPY/KRW 13.57 13.55 0.07 12.81 1.39 -2.4 0.2%
TRY/JPY 57.08 57.03 0.06 60.03 -0.70 7.0 -0.5%
MXN/CLP 39.18 39.16 0.02 41.88 -0.61 1.7 1.3%
MXN/HUF 16.53 16.53 0.01 15.79 1.36 -0.9 -2.6%
CZK/JPY 4.57 4.57 0.01 5.02 -1.38 0.8 1.3%
BRL/CZK 10.76 10.77 -0.06 10.33 0.72 9.7 -2.2%
GBP/PLN 4.64 4.66 -0.12 4.43 0.60 -2.9 -1.9%
TRY/MXN 8.55 8.57 -0.15 8.32 0.48 2.8 -0.4%
PLN/JPY 28.65 28.74 -0.16 32.32 -1.25 3.3 1.5%
CZK/HUF 11.32 11.35 -0.20 10.99 0.60 -4.3 -1.2%
PLN/CZK 6.26 6.29 -0.20 6.43 -0.60 2.5 0.2%
BRL/CLP 288.60 289.76 -0.21 301.31 -0.75 8.0 0.5%
MXN/CAD 0.08 0.08 -0.21 0.08 -0.30 3.2 0.4%
BRL/MXN 7.37 7.40 -0.22 7.19 0.28 6.3 -0.8%
GBP/CZK 29.09 29.29 -0.35 28.52 0.24 -0.4 -1.7%
PLN/MXN 4.29 4.32 -0.44 4.48 -0.94 -0.9 1.7%
PLN/HUF 70.90 71.37 -0.60 70.73 0.06 -1.8 -1.0%
BRL/ZAR 4.08 4.15 -0.88 4.88 -1.82 4.8 -0.9%
TRY/ZAR 4.74 4.80 -0.89 5.64 -1.45 1.3 -0.5%
EUR/ILS 4.92 4.98 -1.13 4.95 -0.21 -1.2 0.9% Source: SG Cross Asset Research
Emerging Markets Weekly
22224444 SSSSeeeepppptttteeeemmmmbbbbeeeerrrr 2222000011110000 16161616
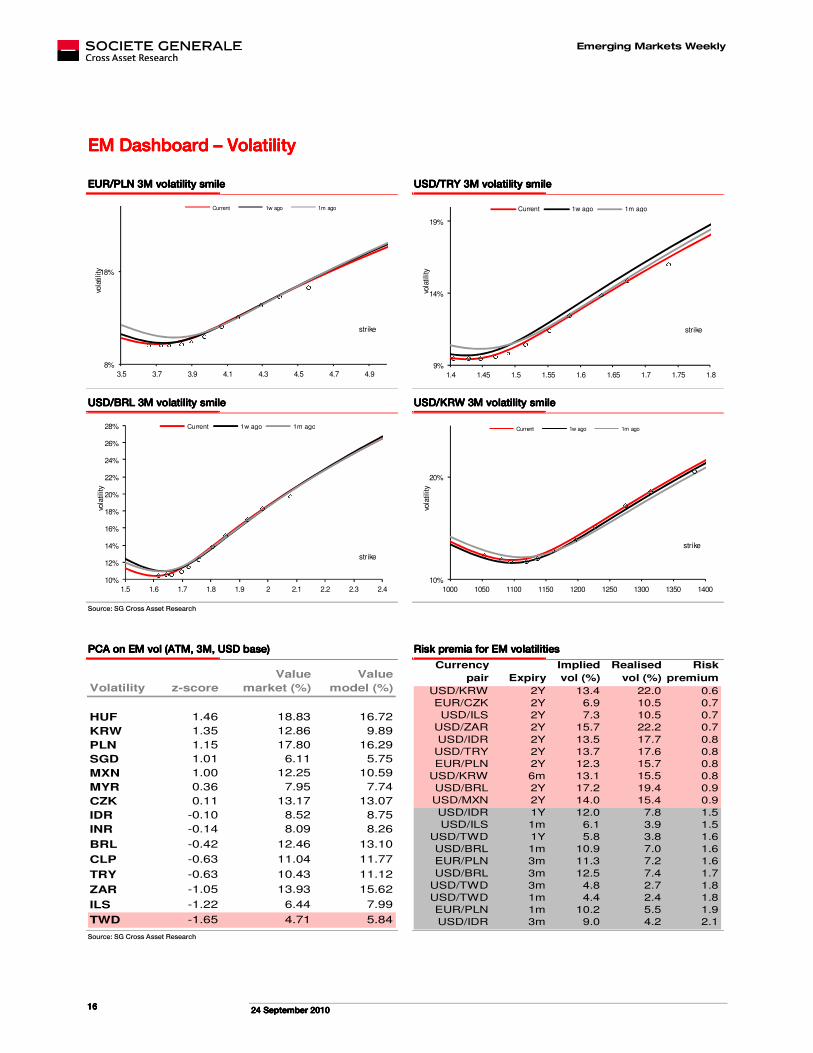
EM Dashboard EM Dashboard EM Dashboard EM Dashboard –––– VolVolVolVolatilityatilityatilityatility
EUR/PLN 3M volatility smileEUR/PLN 3M volatility smileEUR/PLN 3M volatility smileEUR/PLN 3M volatility smile USD/TRY 3M volatility smileUSD/TRY 3M volatility smileUSD/TRY 3M volatility smileUSD/TRY 3M volatility smile
8%
18%
3.5 3.7 3.9 4.1 4.3 4.5 4.7 4.9
vola
tility
strike
Current 1w ago 1m ago
9%
14%
19%
1.4 1.45 1.5 1.55 1.6 1.65 1.7 1.75 1.8
vola
tility
strike
Current 1w ago 1m ago
USD/BRL 3M volatility sUSD/BRL 3M volatility sUSD/BRL 3M volatility sUSD/BRL 3M volatility smilemilemilemile USD/KRW 3M volatility smileUSD/KRW 3M volatility smileUSD/KRW 3M volatility smileUSD/KRW 3M volatility smile
10%
12%
14%
16%
18%
20%
22%
24%
26%
28%
1.5 1.6 1.7 1.8 1.9 2 2.1 2.2 2.3 2.4
vola
tility
strike
Current 1w ago 1m ago
10%
20%
1000 1050 1100 1150 1200 1250 1300 1350 1400
vola
tility
strike
Current 1w ago 1m ago
Source: SG Cross Asset Research
PCA on EM vol (ATM, 3M, USD base)PCA on EM vol (ATM, 3M, USD base)PCA on EM vol (ATM, 3M, USD base)PCA on EM vol (ATM, 3M, USD base) Risk premia for EM volatilities Risk premia for EM volatilities Risk premia for EM volatilities Risk premia for EM volatilities
Volatility z-score
Value
market (%)
Value
model (%)
HUF 1.46 18.83 16.72
KRW 1.35 12.86 9.89
PLN 1.15 17.80 16.29
SGD 1.01 6.11 5.75
MXN 1.00 12.25 10.59
MYR 0.36 7.95 7.74
CZK 0.11 13.17 13.07
IDR -0.10 8.52 8.75
INR -0.14 8.09 8.26
BRL -0.42 12.46 13.10
CLP -0.63 11.04 11.77
TRY -0.63 10.43 11.12
ZAR -1.05 13.93 15.62
ILS -1.22 6.44 7.99
TWD -1.65 4.71 5.84
Currency
pair Expiry
Implied
vol (%)
Realised
vol (%)
Risk
premium
USD/KRW 2Y 13.4 22.0 0.6
EUR/CZK 2Y 6.9 10.5 0.7
USD/ILS 2Y 7.3 10.5 0.7
USD/ZAR 2Y 15.7 22.2 0.7
USD/IDR 2Y 13.5 17.7 0.8
USD/TRY 2Y 13.7 17.6 0.8
EUR/PLN 2Y 12.3 15.7 0.8
USD/KRW 6m 13.1 15.5 0.8
USD/BRL 2Y 17.2 19.4 0.9
USD/MXN 2Y 14.0 15.4 0.9
USD/IDR 1Y 12.0 7.8 1.5
USD/ILS 1m 6.1 3.9 1.5
USD/TWD 1Y 5.8 3.8 1.6
USD/BRL 1m 10.9 7.0 1.6
EUR/PLN 3m 11.3 7.2 1.6
USD/BRL 3m 12.5 7.4 1.7
USD/TWD 3m 4.8 2.7 1.8
USD/TWD 1m 4.4 2.4 1.8
EUR/PLN 1m 10.2 5.5 1.9
USD/IDR 3m 9.0 4.2 2.1
Source: SG Cross Asset Research
Emerging Markets Weekly
22224444 SSSSeeeepppptttteeeemmmmbbbbeeeerrrr 2222000011110000 17171717
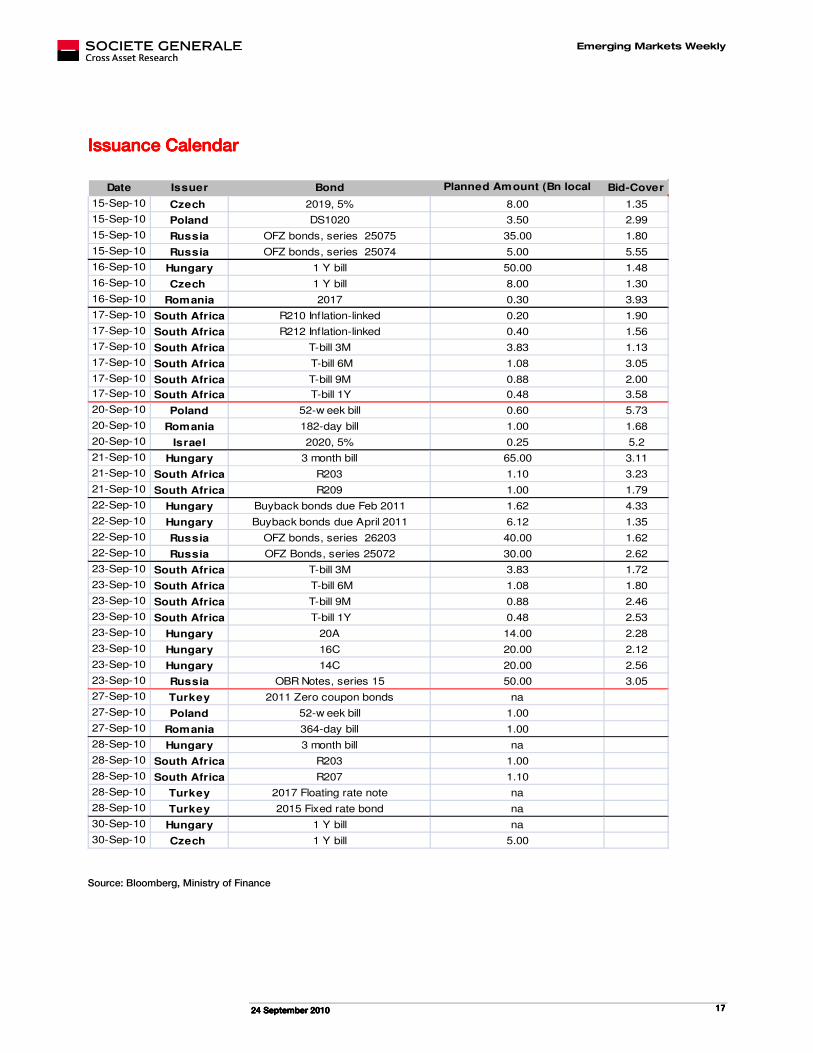
Issuance CalendarIssuance CalendarIssuance CalendarIssuance Calendar
Date Issuer Bond Planned Amount (Bn local
ccy)
Bid-Cover
15-Sep-10 Czech 2019, 5% 8.00 1.35
15-Sep-10 Poland DS1020 3.50 2.99
15-Sep-10 Russia OFZ bonds, series 25075 35.00 1.80
15-Sep-10 Russia OFZ bonds, series 25074 5.00 5.55
16-Sep-10 Hungary 1 Y bill 50.00 1.48
16-Sep-10 Czech 1 Y bill 8.00 1.30
16-Sep-10 Romania 2017 0.30 3.93
17-Sep-10 South Africa R210 Inflation-linked 0.20 1.90
17-Sep-10 South Africa R212 Inflation-linked 0.40 1.56
17-Sep-10 South Africa T-bill 3M 3.83 1.13
17-Sep-10 South Africa T-bill 6M 1.08 3.05
17-Sep-10 South Africa T-bill 9M 0.88 2.00
17-Sep-10 South Africa T-bill 1Y 0.48 3.58
20-Sep-10 Poland 52-w eek bill 0.60 5.73
20-Sep-10 Romania 182-day bill 1.00 1.68
20-Sep-10 Israel 2020, 5% 0.25 5.2
21-Sep-10 Hungary 3 month bill 65.00 3.11
21-Sep-10 South Africa R203 1.10 3.23
21-Sep-10 South Africa R209 1.00 1.79
22-Sep-10 Hungary Buyback bonds due Feb 2011 1.62 4.33
22-Sep-10 Hungary Buyback bonds due April 2011 6.12 1.35
22-Sep-10 Russia OFZ bonds, series 26203 40.00 1.62
22-Sep-10 Russia OFZ Bonds, series 25072 30.00 2.62
23-Sep-10 South Africa T-bill 3M 3.83 1.72
23-Sep-10 South Africa T-bill 6M 1.08 1.80
23-Sep-10 South Africa T-bill 9M 0.88 2.46
23-Sep-10 South Africa T-bill 1Y 0.48 2.53
23-Sep-10 Hungary 20A 14.00 2.28
23-Sep-10 Hungary 16C 20.00 2.12
23-Sep-10 Hungary 14C 20.00 2.56
23-Sep-10 Russia OBR Notes, series 15 50.00 3.05
27-Sep-10 Turkey 2011 Zero coupon bonds na
27-Sep-10 Poland 52-w eek bill 1.00
27-Sep-10 Romania 364-day bill 1.00
28-Sep-10 Hungary 3 month bill na
28-Sep-10 South Africa R203 1.00
28-Sep-10 South Africa R207 1.10
28-Sep-10 Turkey 2017 Floating rate note na
28-Sep-10 Turkey 2015 Fixed rate bond na
30-Sep-10 Hungary 1 Y bill na
30-Sep-10 Czech 1 Y bill 5.00
Source: Bloomberg, Ministry of Finance
Emerging Markets Weekly
22224444 SSSSeeeepppptttteeeemmmmbbbbeeeerrrr 2222000011110000 18181818
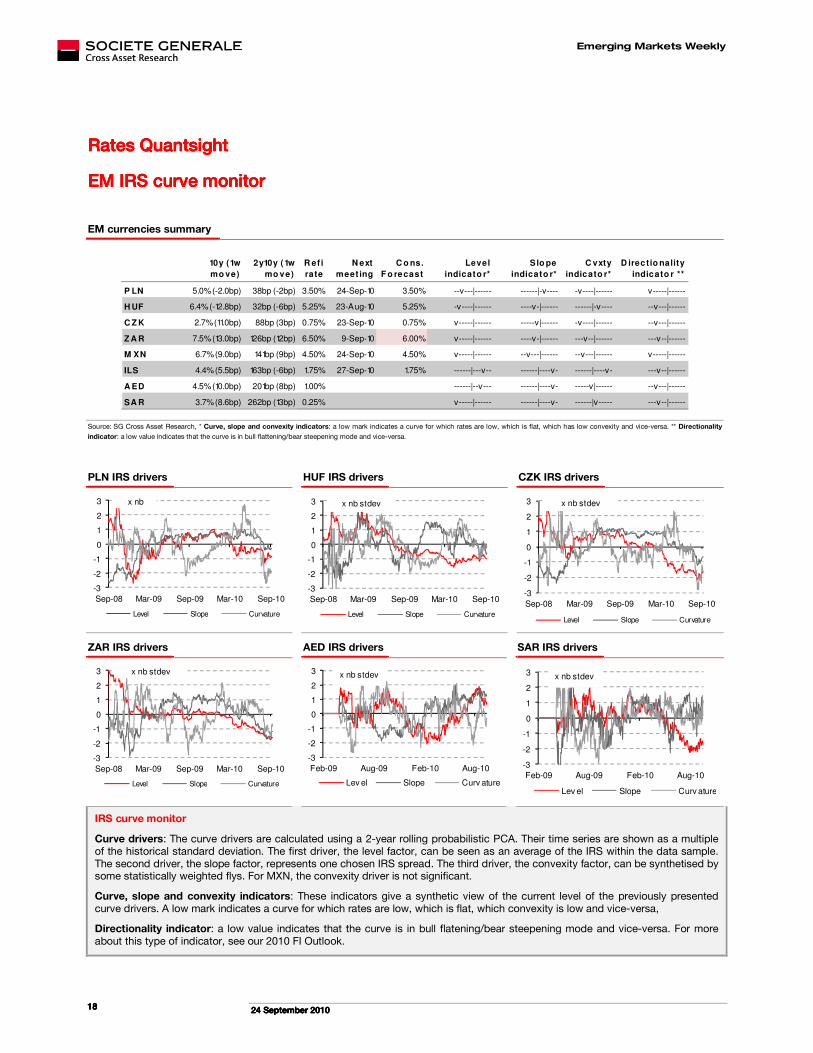
Rates Rates Rates Rates QuantsightQuantsightQuantsightQuantsight
EM IRS curve monitorEM IRS curve monitorEM IRS curve monitorEM IRS curve monitor
EM currencies summary
10y (1w
mo ve)
2y10y (1w
mo ve)
R ef i
rate
N ext
meet ing
C o ns.
F o recast
Level
indicato r*
S lo pe
indicato r*
C vxty
indicato r*
D irectio nality
indicato r **
P LN 5.0% (-2.0bp) 38bp (-2bp) 3.50% 24-Sep-10 3.50% --v---|------ ------|-v---- -v----|------ v-----|------
H UF 6.4% (-12.8bp) 32bp (-6bp) 5.25% 23-Aug-10 5.25% -v----|------ ----v-|------ ------|-v---- --v---|------
C Z K 2.7% (11.0bp) 88bp (3bp) 0.75% 23-Sep-10 0.75% v-----|------ -----v|------ -v----|------ --v---|------
Z A R 7.5% (13.0bp) 126bp (12bp) 6.50% 9-Sep-10 6.00% v-----|------ ----v-|------ ---v--|------ ---v--|------
M XN 6.7% (9.0bp) 141bp (9bp) 4.50% 24-Sep-10 4.50% v-----|------ --v---|------ --v---|------ v-----|------
ILS 4.4% (5.5bp) 163bp (-6bp) 1.75% 27-Sep-10 1.75% ------|---v-- ------|----v- ------|----v- ---v--|------
A ED 4.5% (10.0bp) 201bp (8bp) 1.00% ------|--v--- ------|----v- -----v|------ --v---|------
SA R 3.7% (8.6bp) 262bp (13bp) 0.25% v-----|------ ------|----v- ------|v----- ---v--|------
Source: SG Cross Asset Research, * Curve, slope and convexity indicators: a low mark indicates a curve for which rates are low, which is flat, which has low convexity and vice-versa. ** Directionality
indicator: a low value indicates that the curve is in bull flattening/bear steepening mode and vice-versa.
PLN IRS drivers HUF IRS drivers CZK IRS drivers
-3
-2
-1
0
1
2
3
Sep-08 Mar-09 Sep-09 Mar-10 Sep-10
Level Slope Curvature
x nb
-3
-2
-1
0
1
2
3
Sep-08 Mar-09 Sep-09 Mar-10 Sep-10
Level Slope Curvature
x nb stdev
-3
-2
-1
0
1
2
3
Sep-08 Mar-09 Sep-09 Mar-10 Sep-10
Level Slope Curvature
x nb stdev
ZAR IRS drivers AED IRS drivers SAR IRS drivers
-3
-2
-1
0
1
2
3
Sep-08 Mar-09 Sep-09 Mar-10 Sep-10
Level Slope Curvature
x nb stdev
-3
-2
-1
0
1
2
3
Feb-09 Aug-09 Feb-10 Aug-10
Lev el Slope Curv ature
x nb stdev
-3
-2
-1
0
1
2
3
Feb-09 Aug-09 Feb-10 Aug-10
Lev el Slope Curv ature
x nb stdev
IRS curve monitor
Curve drivers: The curve drivers are calculated using a 2-year rolling probabilistic PCA. Their time series are shown as a multiple of the historical standard deviation. The first driver, the level factor, can be seen as an average of the IRS within the data sample. The second driver, the slope factor, represents one chosen IRS spread. The third driver, the convexity factor, can be synthetised by some statistically weighted flys. For MXN, the convexity driver is not significant.
Curve, slope and convexity indicators: These indicators give a synthetic view of the current level of the previously presented curve drivers. A low mark indicates a curve for which rates are low, which is flat, which convexity is low and vice-versa,
Directionality indicator: a low value indicates that the curve is in bull flatening/bear steepening mode and vice-versa. For more about this type of indicator, see our 2010 FI Outlook.
Emerging Markets Weekly
22224444 SSSSeeeepppptttteeeemmmmbbbbeeeerrrr 2222000011110000 19191919
EM IRS trade monitorEM IRS trade monitorEM IRS trade monitorEM IRS trade monitor
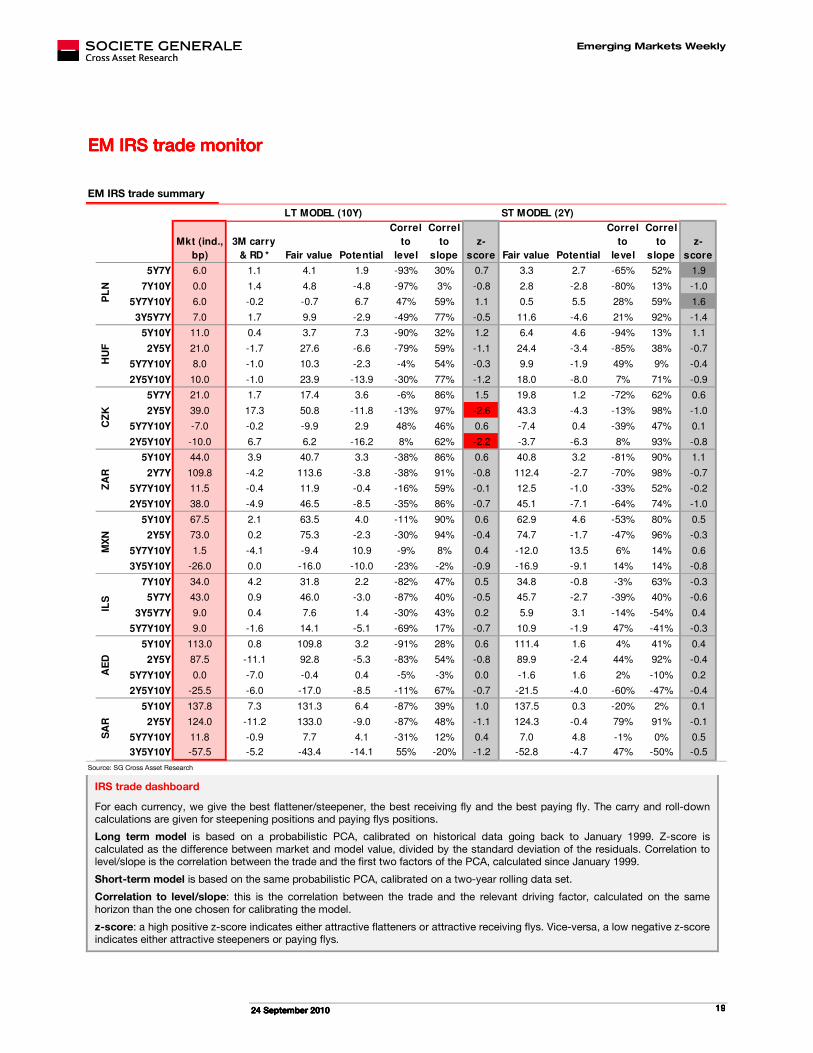
EM IRS trade summary
Mkt (ind.,
bp)
3M carry
& RD * Fair value Potential
Correl
to
level
Correl
to
slope
z-
score Fair value Potential
Correl
to
level
Correl
to
slope
z-
score
5Y7Y 6.0 1.1 4.1 1.9 -93% 30% 0.7 3.3 2.7 -65% 52% 1.9
7Y10Y 0.0 1.4 4.8 -4.8 -97% 3% -0.8 2.8 -2.8 -80% 13% -1.0
5Y7Y10Y 6.0 -0.2 -0.7 6.7 47% 59% 1.1 0.5 5.5 28% 59% 1.6
3Y5Y7Y 7.0 1.7 9.9 -2.9 -49% 77% -0.5 11.6 -4.6 21% 92% -1.4
5Y10Y 11.0 0.4 3.7 7.3 -90% 32% 1.2 6.4 4.6 -94% 13% 1.1
2Y5Y 21.0 -1.7 27.6 -6.6 -79% 59% -1.1 24.4 -3.4 -85% 38% -0.7
5Y7Y10Y 8.0 -1.0 10.3 -2.3 -4% 54% -0.3 9.9 -1.9 49% 9% -0.4
2Y5Y10Y 10.0 -1.0 23.9 -13.9 -30% 77% -1.2 18.0 -8.0 7% 71% -0.9
5Y7Y 21.0 1.7 17.4 3.6 -6% 86% 1.5 19.8 1.2 -72% 62% 0.6
2Y5Y 39.0 17.3 50.8 -11.8 -13% 97% -2.6 43.3 -4.3 -13% 98% -1.0
5Y7Y10Y -7.0 -0.2 -9.9 2.9 48% 46% 0.6 -7.4 0.4 -39% 47% 0.1
2Y5Y10Y -10.0 6.7 6.2 -16.2 8% 62% -2.2 -3.7 -6.3 8% 93% -0.8
5Y10Y 44.0 3.9 40.7 3.3 -38% 86% 0.6 40.8 3.2 -81% 90% 1.1
2Y7Y 109.8 -4.2 113.6 -3.8 -38% 91% -0.8 112.4 -2.7 -70% 98% -0.7
5Y7Y10Y 11.5 -0.4 11.9 -0.4 -16% 59% -0.1 12.5 -1.0 -33% 52% -0.2
2Y5Y10Y 38.0 -4.9 46.5 -8.5 -35% 86% -0.7 45.1 -7.1 -64% 74% -1.0
5Y10Y 67.5 2.1 63.5 4.0 -11% 90% 0.6 62.9 4.6 -53% 80% 0.5
2Y5Y 73.0 0.2 75.3 -2.3 -30% 94% -0.4 74.7 -1.7 -47% 96% -0.3
5Y7Y10Y 1.5 -4.1 -9.4 10.9 -9% 8% 0.4 -12.0 13.5 6% 14% 0.6
3Y5Y10Y -26.0 0.0 -16.0 -10.0 -23% -2% -0.9 -16.9 -9.1 14% 14% -0.8
7Y10Y 34.0 4.2 31.8 2.2 -82% 47% 0.5 34.8 -0.8 -3% 63% -0.3
5Y7Y 43.0 0.9 46.0 -3.0 -87% 40% -0.5 45.7 -2.7 -39% 40% -0.6
3Y5Y7Y 9.0 0.4 7.6 1.4 -30% 43% 0.2 5.9 3.1 -14% -54% 0.4
5Y7Y10Y 9.0 -1.6 14.1 -5.1 -69% 17% -0.7 10.9 -1.9 47% -41% -0.3
5Y10Y 113.0 0.8 109.8 3.2 -91% 28% 0.6 111.4 1.6 4% 41% 0.4
2Y5Y 87.5 -11.1 92.8 -5.3 -83% 54% -0.8 89.9 -2.4 44% 92% -0.4
5Y7Y10Y 0.0 -7.0 -0.4 0.4 -5% -3% 0.0 -1.6 1.6 2% -10% 0.2
2Y5Y10Y -25.5 -6.0 -17.0 -8.5 -11% 67% -0.7 -21.5 -4.0 -60% -47% -0.4
5Y10Y 137.8 7.3 131.3 6.4 -87% 39% 1.0 137.5 0.3 -20% 2% 0.1
2Y5Y 124.0 -11.2 133.0 -9.0 -87% 48% -1.1 124.3 -0.4 79% 91% -0.1
5Y7Y10Y 11.8 -0.9 7.7 4.1 -31% 12% 0.4 7.0 4.8 -1% 0% 0.5
3Y5Y10Y -57.5 -5.2 -43.4 -14.1 55% -20% -1.2 -52.8 -4.7 47% -50% -0.5
AE
DS
AR
MX
NIL
S
LT MODEL (10Y) ST MODEL (2Y)
PL
NH
UF
CZ
KZ
AR
Source: SG Cross Asset Research
IRS trade dashboard
For each currency, we give the best flattener/steepener, the best receiving fly and the best paying fly. The carry and roll-down calculations are given for steepening positions and paying flys positions.
Long term model is based on a probabilistic PCA, calibrated on historical data going back to January 1999. Z-score is
calculated as the difference between market and model value, divided by the standard deviation of the residuals. Correlation to level/slope is the correlation between the trade and the first two factors of the PCA, calculated since January 1999.
Short-term model is based on the same probabilistic PCA, calibrated on a two-year rolling data set.
Correlation to level/slope: this is the correlation between the trade and the relevant driving factor, calculated on the same
horizon than the one chosen for calibrating the model.
z-score: a high positive z-score indicates either attractive flatteners or attractive receiving flys. Vice-versa, a low negative z-score indicates either attractive steepeners or paying flys.
Emerging Markets Weekly
22224444 SSSSeeeepppptttteeeemmmmbbbbeeeerrrr 2222000011110000 20202020
CNBCNBCNBCNB focusfocusfocusfocus
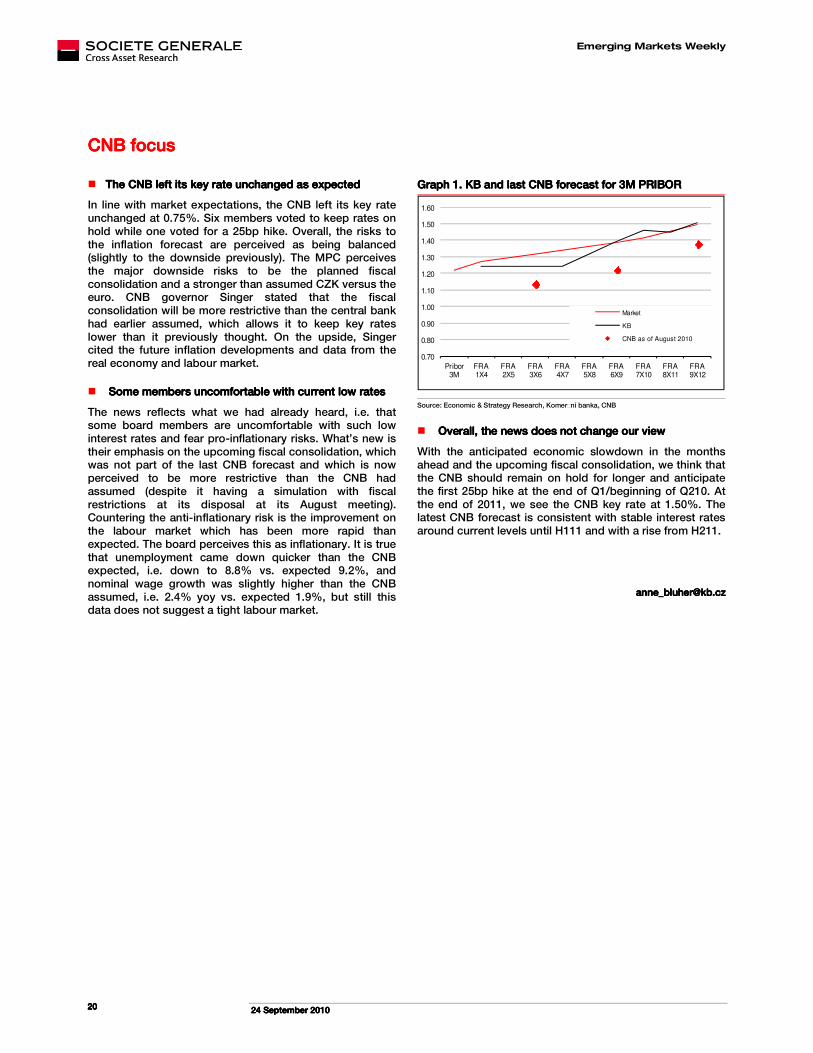
� The CNB left its key rate unchanged as expectedThe CNB left its key rate unchanged as expectedThe CNB left its key rate unchanged as expectedThe CNB left its key rate unchanged as expected
In line with market expectations, the CNB left its key rate unchanged at 0.75%. Six members voted to keep rates on hold while one voted for a 25bp hike. Overall, the risks to the inflation forecast are perceived as being balanced (slightly to the downside previously). The MPC perceives the major downside risks to be the planned fiscal consolidation and a stronger than assumed CZK versus the euro. CNB governor Singer stated that the fiscal consolidation will be more restrictive than the central bank had earlier assumed, which allows it to keep key rates lower than it previously thought. On the upside, Singer cited the future inflation developments and data from the real economy and labour market.
� SomSomSomSome members uncomfortable with current low ratese members uncomfortable with current low ratese members uncomfortable with current low ratese members uncomfortable with current low rates
The news reflects what we had already heard, i.e. that some board members are uncomfortable with such low interest rates and fear pro-inflationary risks. What’s new is their emphasis on the upcoming fiscal consolidation, which was not part of the last CNB forecast and which is now perceived to be more restrictive than the CNB had assumed (despite it having a simulation with fiscal restrictions at its disposal at its August meeting). Countering the anti-inflationary risk is the improvement on the labour market which has been more rapid than expected. The board perceives this as inflationary. It is true that unemployment came down quicker than the CNB expected, i.e. down to 8.8% vs. expected 9.2%, and nominal wage growth was slightly higher than the CNB assumed, i.e. 2.4% yoy vs. expected 1.9%, but still this data does not suggest a tight labour market.
GraphGraphGraphGraph 1.1.1.1. KB and last CNB forecast for 3M PRIBORKB and last CNB forecast for 3M PRIBORKB and last CNB forecast for 3M PRIBORKB and last CNB forecast for 3M PRIBOR
0.70
0.80
0.90
1.00
1.10
1.20
1.30
1.40
1.50
1.60
Pribor 3M
FRA 1X4
FRA 2X5
FRA 3X6
FRA 4X7
FRA 5X8
FRA 6X9
FRA 7X10
FRA 8X11
FRA 9X12
Market
KB
CNB as of August 2010
Source: Economic & Strategy Research, KomerWní banka, CNB
� Overall, the news does not change our view Overall, the news does not change our view Overall, the news does not change our view Overall, the news does not change our view
With the anticipated economic slowdown in the months ahead and the upcoming fiscal consolidation, we think that the CNB should remain on hold for longer and anticipate the first 25bp hike at the end of Q1/beginning of Q210. At the end of 2011, we see the CNB key rate at 1.50%. The latest CNB forecast is consistent with stable interest rates around current levels until H111 and with a rise from H211.
[email protected][email protected][email protected][email protected]
Emerging Markets Weekly
22224444 SSSSeeeepppptttteeeemmmmbbbbeeeerrrr 2222000011110000 21212121
Economic Data PreviewEconomic Data PreviewEconomic Data PreviewEconomic Data Preview
Mexico Mexico Mexico Mexico July Global Economic Indicator IGAE (Previous: July Global Economic Indicator IGAE (Previous: July Global Economic Indicator IGAE (Previous: July Global Economic Indicator IGAE (Previous: 6.8%; SG forecast: 5%)6.8%; SG forecast: 5%)6.8%; SG forecast: 5%)6.8%; SG forecast: 5%)
Mexico external demand softens while domestic lagsMexico external demand softens while domestic lagsMexico external demand softens while domestic lagsMexico external demand softens while domestic lags
Since June, the economy has showed signs of losing steam. The three-month average monthly growth in industrial production has dropped from 0.71% in April to 0.16% in July. And advanced data on August US output confirms this trend. Further, while Q2 headline growth was strong, supply and demand aggregates released this week showed very soft underlying trends. Consumption in Q2 grew 4.8%, falling short of recovering from the 7.7% drop seen in the same quarter last year. And investment (fixed capital formation) grew a mere 2.5% yoy, after tumbling 14.3% in Q2 2009. As such, we expect the IGAE activity indicator to point to a deceleration in H2 Mexican growth.
[email protected]@[email protected]@sgcib.com
-15%
-10%
-5%
0%
5%
10%
Aug-05 Aug-06 Aug-07 Aug-08 Aug-09 Aug-10
Mexico IP (yoy)
Mexico retail sales (yoy)
US IP (yoy)
Source: INEGI, SG Cross Asset Research
Brazil BCB inflation report to draw new scenariosBrazil BCB inflation report to draw new scenariosBrazil BCB inflation report to draw new scenariosBrazil BCB inflation report to draw new scenarios Brazil inflation may have found a floorBrazil inflation may have found a floorBrazil inflation may have found a floorBrazil inflation may have found a floor
Markets will focus on the BCB’s inflation report and its assessment of the inflation trajectory under different scenarios (flat on rates and inflation against markets higher implied rates). This should define the bank’s trajectory over the next few months. The dovish stance adopted in the last meeting made it clear that the bank sees no need for more rate hikes anytime soon. Indeed, we believe policymakers will wait for further evidence in inflation trends before changing gears, so we still believe there will be a pause in October’s meeting. Overall, we believe inflation risks are on the upside and will require further action by the central bank. This could come as early as December if inflation trends confirm the reversal and economic data continue to show strong momentum.
[email protected]@[email protected]@sgcib.com
1.5%
2.5%
3.5%
4.5%
5.5%
6.5%
7.5%
8.5%
Sep-05 Sep-06 Sep-07 Sep-08 Sep-09 Sep-10
Headline inflation (yoy)
Core inflation (yoy)
Target band
Source: BCB, SG Cross Asset Research
Brazil Brazil Brazil Brazil August industrial production (Previous: 8.7% y/y; SG August industrial production (Previous: 8.7% y/y; SG August industrial production (Previous: 8.7% y/y; SG August industrial production (Previous: 8.7% y/y; SG forecast: 9.3%)forecast: 9.3%)forecast: 9.3%)forecast: 9.3%)
Brazil industrial production gap vs. trendBrazil industrial production gap vs. trendBrazil industrial production gap vs. trendBrazil industrial production gap vs. trend
Qualifying Brazil’s performance as a slowdown seems a stretch, and we would rather speak of growth normalisation. Indeed, the economy has outpaced trend for five consecutive quarters now, with industrial output maintaining pace into Q3. Further, the IP deceleration in the second quarter was not accompanied by an increase in inventory levels. Consumption remains positive, with consumer confidence reaching five-year highs, and it continues to increase thanks to expansion of the employed population, real payroll levels and credit, and federal income transfers. These forces should continue to push industrial output in the coming months. August industrial production figures will test growth momentum in Q3.
[email protected]@[email protected]@sgcib.com
-20%
-15%
-10%
-5%
0%
5%
10%
Jul-06 Jul-07 Jul-08 Jul-09 Jul-10
Source: Global Insight, SG Cross Asset Research
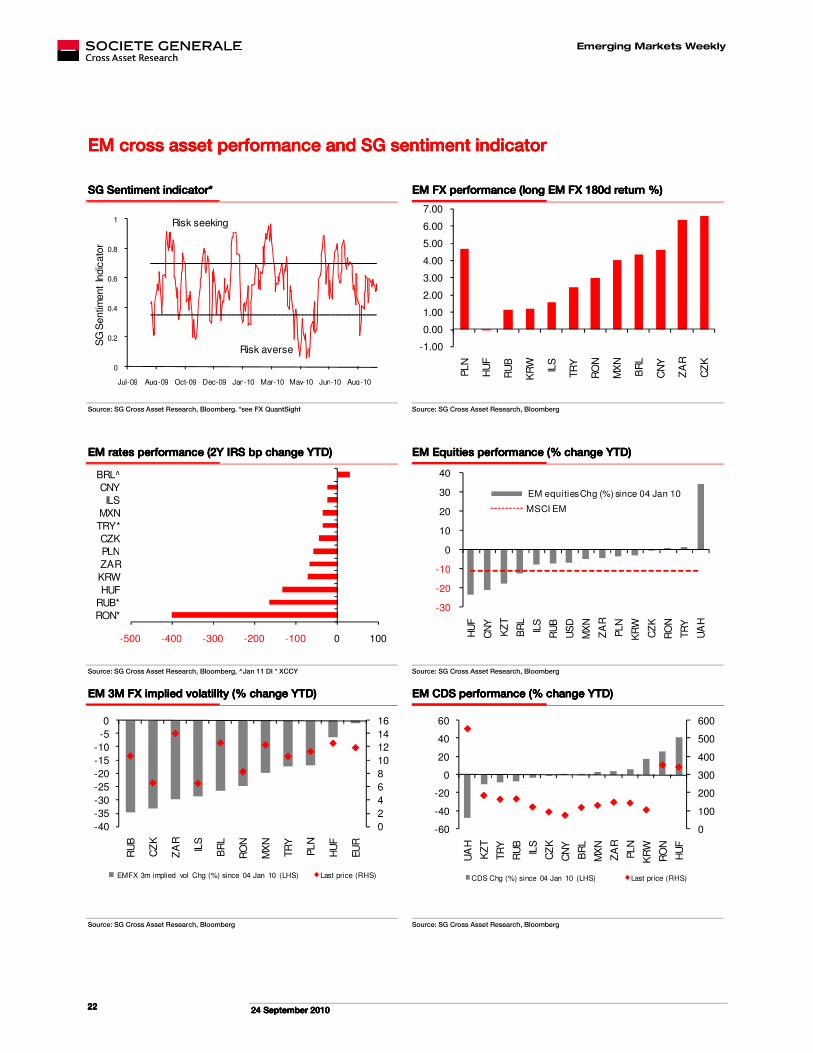
Emerging Markets Weekly
22224444 SSSSeeeepppptttteeeemmmmbbbbeeeerrrr 2222000011110000 22222222
EEEEM cross asset performance and SG sentiment indicatorM cross asset performance and SG sentiment indicatorM cross asset performance and SG sentiment indicatorM cross asset performance and SG sentiment indicator
SG Sentiment indicator*SG Sentiment indicator*SG Sentiment indicator*SG Sentiment indicator* EM FX performance (long EM FX 180d return %)EM FX performance (long EM FX 180d return %)EM FX performance (long EM FX 180d return %)EM FX performance (long EM FX 180d return %)
0
0.2
0.4
0.6
0.8
1
Jul-09 Aug-09 Oct-09 Dec-09 Jan-10 Mar-10 May-10 Jun-10 Aug-10
SG
Sentim
ent
Indic
ato
r
Risk seeking
Risk averse
-1.00
0.00
1.00
2.00
3.00
4.00
5.00
6.00
7.00
PLN
HU
F
RU
B
KR
W
ILS
TR
Y
RO
N
MX
N
BR
L
CN
Y
ZA
R
CZ
K
Source: SG Cross Asset Research, Bloomberg. *see FX QuantSight Source: SG Cross Asset Research, Bloomberg
EM ratesEM ratesEM ratesEM rates performance (2Y IRS bp change YTD)performance (2Y IRS bp change YTD)performance (2Y IRS bp change YTD)performance (2Y IRS bp change YTD) EM Equities performance (% change YTD)EM Equities performance (% change YTD)EM Equities performance (% change YTD)EM Equities performance (% change YTD)
-500 -400 -300 -200 -100 0 100
RON*
RUB*
HUF
KRW
ZAR
PLN
CZK
TRY*
MXN
ILS
CNY
BRL^
-30
-20
-10
0
10
20
30
40 H
UF
CN
Y
KZ
T
BR
L
ILS
RU
B
US
D
MX
N
ZA
R
PLN
KR
W
CZ
K
RO
N
TR
Y
UA
H
EM equities Chg (%) since 04 Jan 10
MSCI EM
Source: SG Cross Asset Research, Bloomberg, ^Jan 11 DI * XCCY Source: SG Cross Asset Research, Bloomberg
EM 3M FX implied volatility (% change YTD)EM 3M FX implied volatility (% change YTD)EM 3M FX implied volatility (% change YTD)EM 3M FX implied volatility (% change YTD) EM CDS performaEM CDS performaEM CDS performaEM CDS performance (% change YTD)nce (% change YTD)nce (% change YTD)nce (% change YTD)
0
2
4
6
8
10
12
14
16
-40
-35
-30
-25
-20
-15
-10
-5
0
RU
B
CZ
K
ZA
R
ILS
BR
L
RO
N
MX
N
TR
Y
PLN
HU
F
EU
R
EMFX 3m implied vol Chg (%) since 04 Jan 10 (LHS) Last price (RHS)
0
100
200
300
400
500
600
-60
-40
-20
0
20
40
60
UA
H
KZ
T
TR
Y
RU
B
ILS
CZ
K
CN
Y
BR
L
MX
N
ZA
R
PLN
KR
W
RO
N
HU
F
CDS Chg (%) since 04 Jan 10 (LHS) Last price (RHS)
Source: SG Cross Asset Research, Bloomberg Source: SG Cross Asset Research, Bloomberg
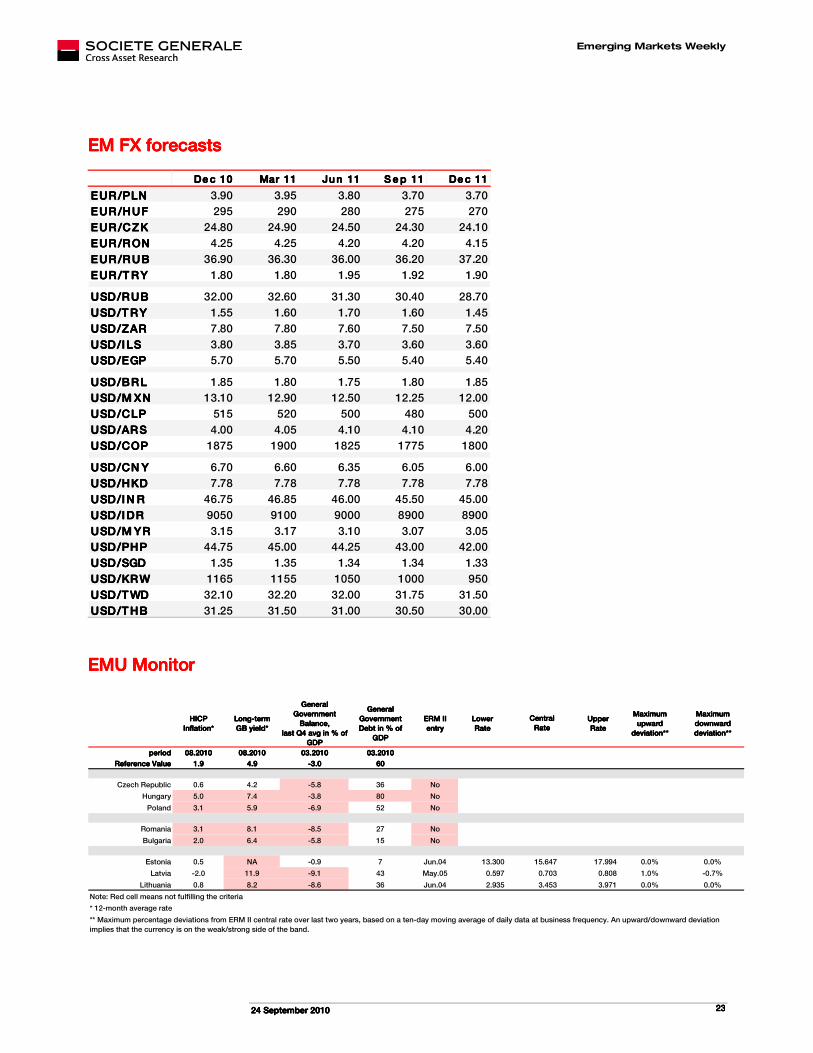
Emerging Markets Weekly
22224444 SSSSeeeepppptttteeeemmmmbbbbeeeerrrr 2222000011110000 23232323
EM FX forecastsEM FX forecastsEM FX forecastsEM FX forecasts
De c 10De c 10De c 10De c 10 Mar 11Mar 11Mar 11Mar 11 Ju n 11Ju n 11Ju n 11Ju n 11 S e p 11S e p 11S e p 11S e p 11 De c 11De c 11De c 11De c 11
EUR/PLNEUR/PLNEUR/PLNEUR/PLN 3.90 3.95 3.80 3.70 3.70
EUR/HUFEUR/HUFEUR/HUFEUR/HUF 295 290 280 275 270
EUR/CZKEUR/CZKEUR/CZKEUR/CZK 24.80 24.90 24.50 24.30 24.10
EUR/RONEUR/RONEUR/RONEUR/RON 4.25 4.25 4.20 4.20 4.15
EUR/RUBEUR/RUBEUR/RUBEUR/RUB 36.90 36.30 36.00 36.20 37.20
EUR/T RYEUR/T RYEUR/T RYEUR/T RY 1.80 1.80 1.95 1.92 1.90
USD/RUBUSD/RUBUSD/RUBUSD/RUB 32.00 32.60 31.30 30.40 28.70
USD/T RYUSD/T RYUSD/T RYUSD/T RY 1.55 1.60 1.70 1.60 1.45
USD/ZARUSD/ZARUSD/ZARUSD/ZAR 7.80 7.80 7.60 7.50 7.50
USD/ILSUSD/ILSUSD/ILSUSD/ILS 3.80 3.85 3.70 3.60 3.60
USD/EGPUSD/EGPUSD/EGPUSD/EGP 5.70 5.70 5.50 5.40 5.40
USD/BRLUSD/BRLUSD/BRLUSD/BRL 1.85 1.80 1.75 1.80 1.85
USD/M XNUSD/M XNUSD/M XNUSD/M XN 13.10 12.90 12.50 12.25 12.00
USD/CLPUSD/CLPUSD/CLPUSD/CLP 515 520 500 480 500
USD/ARSUSD/ARSUSD/ARSUSD/ARS 4.00 4.05 4.10 4.10 4.20
USD/COPUSD/COPUSD/COPUSD/COP 1875 1900 1825 1775 1800
USD/CN YUSD/CN YUSD/CN YUSD/CN Y 6.70 6.60 6.35 6.05 6.00
USD/HKDUSD/HKDUSD/HKDUSD/HKD 7.78 7.78 7.78 7.78 7.78
USD/IN RUSD/IN RUSD/IN RUSD/IN R 46.75 46.85 46.00 45.50 45.00
USD/IDRUSD/IDRUSD/IDRUSD/IDR 9050 9100 9000 8900 8900
USD/M YRUSD/M YRUSD/M YRUSD/M YR 3.15 3.17 3.10 3.07 3.05
USD/PHPUSD/PHPUSD/PHPUSD/PHP 44.75 45.00 44.25 43.00 42.00
USD/SGDUSD/SGDUSD/SGDUSD/SGD 1.35 1.35 1.34 1.34 1.33
USD/KRWUSD/KRWUSD/KRWUSD/KRW 1165 1155 1050 1000 950
USD/T WDUSD/T WDUSD/T WDUSD/T WD 32.10 32.20 32.00 31.75 31.50
USD/T HBUSD/T HBUSD/T HBUSD/T HB 31.25 31.50 31.00 30.50 30.00
EMU MonitorEMU MonitorEMU MonitorEMU Monitor
HICPHICPHICPHICP
Inflation*Inflation*Inflation*Inflation*
Long-term Long-term Long-term Long-term
GB yield*GB yield*GB yield*GB yield*
General General General General
Government Government Government Government
Balance,Balance,Balance,Balance,
last Q4 avg in % of last Q4 avg in % of last Q4 avg in % of last Q4 avg in % of
GDPGDPGDPGDP
General General General General
Government Government Government Government
Debt in % of Debt in % of Debt in % of Debt in % of
GDPGDPGDPGDP
ERM II ERM II ERM II ERM II
entryentryentryentry
LowerLowerLowerLower
RateRateRateRate
UpperUpperUpperUpper
RateRateRateRate
Maximum Maximum Maximum Maximum
upward upward upward upward
deviation**deviation**deviation**deviation**
Maximum Maximum Maximum Maximum
downward downward downward downward
deviation**deviation**deviation**deviation**
periodperiodperiodperiod 08.201008.201008.201008.2010 08.201008.201008.201008.2010 03.201003.201003.201003.2010 03.201003.201003.201003.2010
Reference ValueReference ValueReference ValueReference Value 1.91.91.91.9 4.94.94.94.9 -3.0-3.0-3.0-3.0 60606060
Czech Republic 0.6 4.2 -5.8 36 No
Hungary 5.0 7.4 -3.8 80 No
Poland 3.1 5.9 -6.9 52 No
Romania 3.1 8.1 -8.5 27 No
Bulgaria 2.0 6.4 -5.8 15 No
Estonia 0.5 NA -0.9 7 Jun.04 13.300 15.647 17.994 0.0% 0.0%
Latvia -2.0 11.9 -9.1 43 May.05 0.597 0.703 0.808 1.0% -0.7%
Lithuania 0.8 8.2 -8.6 36 Jun.04 2.935 3.453 3.971 0.0% 0.0%
* 12-month average rate
CentralCentralCentralCentral
RateRateRateRate
Note: Red cell means not fulfilling the criteria
** Maximum percentage deviations from ERM II central rate over last two years, based on a ten-day moving average of daily data at business frequency. An upward/downward deviation
implies that the currency is on the weak/strong side of the band.
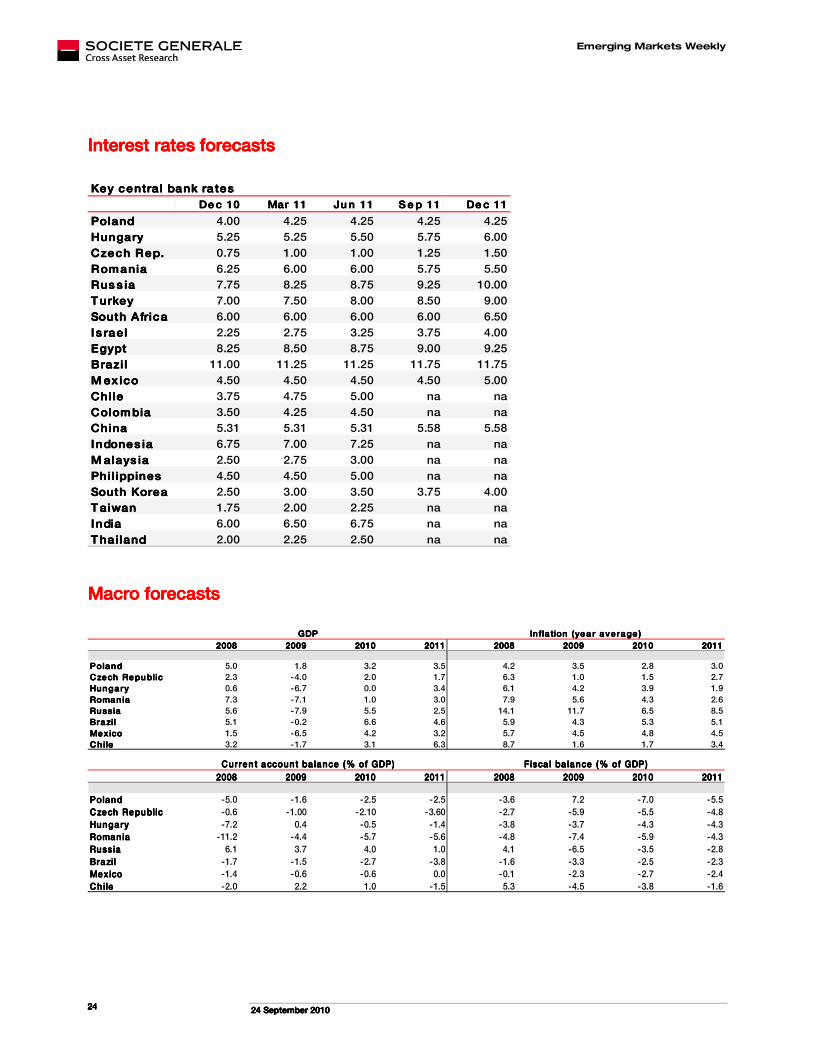
Emerging Markets Weekly
22224444 SSSSeeeepppptttteeeemmmmbbbbeeeerrrr 2222000011110000 24242424
Interest rates forecastsInterest rates forecastsInterest rates forecastsInterest rates forecasts
Key centra l bank ra tesKey centra l bank ra tesKey centra l bank ra tesKey centra l bank ra tes
De c 10De c 10De c 10De c 10 Mar 11Mar 11Mar 11Mar 11 Ju n 11Ju n 11Ju n 11Ju n 11 S e p 11S e p 11S e p 11S e p 11 De c 11De c 11De c 11De c 11
PolandPolandPolandPoland 4.00 4.25 4.25 4.25 4.25
HungaryHungaryHungaryHungary 5.25 5.25 5.50 5.75 6.00
Czech Rep.Czech Rep.Czech Rep.Czech Rep. 0.75 1.00 1.00 1.25 1.50
RomaniaRomaniaRomaniaRomania 6.25 6.00 6.00 5.75 5.50
Rus s iaRus s iaRus s iaRus s ia 7.75 8.25 8.75 9.25 10.00
T urkeyT urkeyT urkeyT urkey 7.00 7.50 8.00 8.50 9.00
South AfricaSouth AfricaSouth AfricaSouth Africa 6.00 6.00 6.00 6.00 6.50
Is raelI s raelI s raelI s rael 2.25 2.75 3.25 3.75 4.00
EgyptEgyptEgyptEgypt 8.25 8.50 8.75 9.00 9.25
Brazi lBrazi lBrazi lBrazi l 11.00 11.25 11.25 11.75 11.75
M ex icoM ex icoM ex icoM ex ico 4.50 4.50 4.50 4.50 5.00
ChileChileChileChile 3.75 4.75 5.00 na na
ColombiaColombiaColombiaColombia 3.50 4.25 4.50 na na
ChinaChinaChinaChina 5.31 5.31 5.31 5.58 5.58
Indones iaIndones iaIndones iaIndones ia 6.75 7.00 7.25 na na
M alays iaM alays iaM alays iaM alays ia 2.50 2.75 3.00 na na
Phil ippinesPhil ippinesPhil ippinesPhil ippines 4.50 4.50 5.00 na na
South KoreaSouth KoreaSouth KoreaSouth Korea 2.50 3.00 3.50 3.75 4.00
T aiwanT aiwanT aiwanT aiwan 1.75 2.00 2.25 na na
IndiaIndiaIndiaIndia 6.00 6.50 6.75 na na
T hailandT hailandT hailandT hailand 2.00 2.25 2.50 na na
Macro forecastsMacro forecastsMacro forecastsMacro forecasts
2008200820082008 2009200920092009 2010201020102010 2011201120112011 2008200820082008 2009200920092009 2010201020102010 2011201120112011
PolandPolandPolandPoland 5.0 1.8 3.2 3.5 4.2 3.5 2.8 3.0
Czech RepublicCzech RepublicCzech RepublicCzech Republic 2.3 -4.0 2.0 1.7 6.3 1.0 1.5 2.7
HungaryHungaryHungaryHungary 0.6 -6.7 0.0 3.4 6.1 4.2 3.9 1.9
RomaniaRomaniaRomaniaRomania 7.3 -7.1 1.0 3.0 7.9 5.6 4.3 2.6
RussiaRussiaRussiaRussia 5.6 -7.9 5.5 2.5 14.1 11.7 6.5 8.5
BrazilBrazilBrazilBrazil 5.1 -0.2 6.6 4.6 5.9 4.3 5.3 5.1
MexicoMexicoMexicoMexico 1.5 -6.5 4.2 3.2 5.7 4.5 4.8 4.5
ChileChileChileChile 3.2 -1.7 3.1 6.3 8.7 1.6 1.7 3.4
GDPGDPGDPGDP Infla tion (yea r ave rage )Infla tion (yea r ave rage )Infla tion (yea r ave rage )Infla tion (yea r ave rage )
2008200820082008 2009200920092009 2010201020102010 2011201120112011 2008200820082008 2009200920092009 2010201020102010 2011201120112011
PolandPolandPolandPoland -5.0 -1.6 -2.5 -2.5 -3.6 7.2 -7.0 -5.5
Czech RepublicCzech RepublicCzech RepublicCzech Republic -0.6 -1.00 -2.10 -3.60 -2.7 -5.9 -5.5 -4.8
HungaryHungaryHungaryHungary -7.2 0.4 -0.5 -1.4 -3.8 -3.7 -4.3 -4.3
RomaniaRomaniaRomaniaRomania -11.2 -4.4 -5.7 -5.6 -4.8 -7.4 -5.9 -4.3
RussiaRussiaRussiaRussia 6.1 3.7 4.0 1.0 4.1 -6.5 -3.5 -2.8
BrazilBrazilBrazilBrazil -1.7 -1.5 -2.7 -3.8 -1.6 -3.3 -2.5 -2.3
MexicoMexicoMexicoMexico -1.4 -0.6 -0.6 0.0 -0.1 -2.3 -2.7 -2.4
ChileChileChileChile -2.0 2.2 1.0 -1.5 5.3 -4.5 -3.8 -1.6
Fisca l ba lance (% of GDP)Fisca l ba lance (% of GDP)Fisca l ba lance (% of GDP)Fisca l ba lance (% of GDP)Curren t account ba lance (% of GDP)Curren t account ba lance (% of GDP)Curren t account ba lance (% of GDP)Curren t account ba lance (% of GDP)

Emerging Markets Weekly
CROSS ASSET RESECROSS ASSET RESECROSS ASSET RESECROSS ASSET RESEAAAARCH RCH RCH RCH –––– FIXED INCOME FIXED INCOME FIXED INCOME FIXED INCOME &&&& FOREX FOREX FOREX FOREX GROUPSGROUPSGROUPSGROUPS Global Head of ResearchGlobal Head of ResearchGlobal Head of ResearchGlobal Head of Research
Patrick LeglandPatrick LeglandPatrick LeglandPatrick Legland (33) 1 42 13 97 79 [email protected]
Head of Fixed IncomeHead of Fixed IncomeHead of Fixed IncomeHead of Fixed Income StrategyStrategyStrategyStrategy
Vincent ChaigneauVincent ChaigneauVincent ChaigneauVincent Chaigneau (44) 20 7676 7707 [email protected]
Ciaran O'HaganCiaran O'HaganCiaran O'HaganCiaran O'Hagan
Adam KurpielAdam KurpielAdam KurpielAdam Kurpiel
Aro RazafindrakolaAro RazafindrakolaAro RazafindrakolaAro Razafindrakola
Jose SarafanaJose SarafanaJose SarafanaJose Sarafana (33) 1 42 13 58 60 (33) 1 42 13 63 42 (33) 1 42 13 64 93 (33) 1 42 13 56 59 [email protected] [email protected] [email protected] [email protected]
Mark CapletonMark CapletonMark CapletonMark Capleton
Patrick GouraudPatrick GouraudPatrick GouraudPatrick Gouraud
David MendezDavid MendezDavid MendezDavid Mendez----VivesVivesVivesVives
Christian CaChristian CaChristian CaChristian Carrrrrillo (Asiarillo (Asiarillo (Asiarillo (Asia----Pacific)Pacific)Pacific)Pacific) (44) 20 7676 7956 (44) 20 7676 7850 (33) 1 42 13 31 03 (81) 3 5549 5626 [email protected] [email protected] [email protected] [email protected]
Fidelio Tata (New Fidelio Tata (New Fidelio Tata (New Fidelio Tata (New York)York)York)York)
WeeWeeWeeWee----Khoon Chong (Khoon Chong (Khoon Chong (Khoon Chong (Hong KongHong KongHong KongHong Kong)))) (1) 212 278 6213 (852) 2166 5462 [email protected] [email protected]
Head of Foreign ExchangeHead of Foreign ExchangeHead of Foreign ExchangeHead of Foreign Exchange
Kit JuckesKit JuckesKit JuckesKit Juckes (44) 20 7676 7972 [email protected]
David DeddoucheDavid DeddoucheDavid DeddoucheDavid Deddouche
Phyllis PapadavidPhyllis PapadavidPhyllis PapadavidPhyllis Papadavid
Peter FrankPeter FrankPeter FrankPeter Frank
Olivier KorberOlivier KorberOlivier KorberOlivier Korber (Derivatives)(Derivatives)(Derivatives)(Derivatives) (33) 1 42 13 56 22 (44) 20 7676 7999 (44) 20 7676 7458 (33) 1 42 13 32 88 [email protected] [email protected] [email protected] [email protected]
Head of Emerging Markets StrategyHead of Emerging Markets StrategyHead of Emerging Markets StrategyHead of Emerging Markets Strategy
Benoît AnneBenoît AnneBenoît AnneBenoît Anne (44) 20 7676 7622 [email protected]
Murat ToprakMurat ToprakMurat ToprakMurat Toprak
Gaëlle BlanchardGaëlle BlanchardGaëlle BlanchardGaëlle Blanchard
Esther LawEsther LawEsther LawEsther Law (44) 20 7676 7491 (44) 20 7676 7439 (44) 20 7676 7396 [email protected] [email protected] [email protected]
Technical analysisTechnical analysisTechnical analysisTechnical analysis
HugHugHugHuguesuesuesues NakaNakaNakaNaka
FabFabFabFabien Manac’hien Manac’hien Manac’hien Manac’h (33) 1 42 13 51 10 (33) 1 42 13 88 35 [email protected] [email protected]
The information herein is not intended to be an offer to buy or sell, or a solicitation of an offer to buy or sell, any securities and including any expression of opinion, has been obtained from or is based upon sources believed to be reliable but is not guaranteed as to accuracy or completeness although Société Générale (“SG”) believe it to be fair and not misleading or deceptive. SG, and their affiliated companies in the SG Group, may from time to time deal in, profit from the trading of, hold or act as market-makers or act as advisers, brokers or bankers in relation to the securities, or derivatives thereof, of persons, firms or entities mentioned in this document or be represented on the board of such persons, firms or entities. Employees of SG, and their affiliated companies in the SG Group, or individuals connected to them may from time to time have a position in or be holding any of the investments or related investments mentioned in this document. SG and their affiliated companies in the SG Group are under no obligation to disclose or take account of this document when advising or dealing with or for their customers. The views of SG reflected in this document may change without notice. To the maximum extent possible at law, SG does not accept any liability whatsoever arising from the use of the material or information contained herein. Dealing in warrants and/or derivative products such as futures, options, and contracts for differences has specific risks andDealing in warrants and/or derivative products such as futures, options, and contracts for differences has specific risks andDealing in warrants and/or derivative products such as futures, options, and contracts for differences has specific risks andDealing in warrants and/or derivative products such as futures, options, and contracts for differences has specific risks and other other other other significant aspects. You should nosignificant aspects. You should nosignificant aspects. You should nosignificant aspects. You should not deal in these products unless you understand their nature and the extent of your exposure to risk. t deal in these products unless you understand their nature and the extent of your exposure to risk. t deal in these products unless you understand their nature and the extent of your exposure to risk. t deal in these products unless you understand their nature and the extent of your exposure to risk. This research document is not intended for use by or targeted at retail customers. Should a retail customer obtain a copy of this report they should not base their investment decisions solely on the basis of this document but must seek independent financial advice. Important NoticeImportant NoticeImportant NoticeImportant Notice: The circumstances in which this publication has been produced are such (for example because of reporting or remuneration structures or the physical location of the author of the material), that it is not appropriate to characterise it as independent investment research as referred to in European MIF directive and that it should be treated as a marketing material even if it contains a research recommendation (« recommandation d’investissement à caractère promotionnel »). This publication is also not subject to any prohibition on dealing ahead of the dissemination of investment research. However, it must be made clear that all publications issued by SG will be clear, fair, and not misleading. Analyst Certification:Analyst Certification:Analyst Certification:Analyst Certification: Each author of this research report hereby certifies that the views expressed in the research report accurately reflect his or her personal views about any and all of the subject securities or issuers. Notice to French Investors:Notice to French Investors:Notice to French Investors:Notice to French Investors: This publication is issued in France by or through Société Générale ("SG") which is authorised by the CECEI and regulated by the AMF (Autorité des Marchés Financiers). Notice to UK InvestorsNotice to UK InvestorsNotice to UK InvestorsNotice to UK Investors: This publication is issued in the United Kingdom by or through Société Générale ("SG") London Branch which is regulated by the Financial Services Authority ("FSA") for the conduct of its UK business. Notice to US Investors:Notice to US Investors:Notice to US Investors:Notice to US Investors: This report is issued solely to major US institutional investors pursuant to SEC Rule 15a-6. Any US person wishing to discuss this report or effect transactions in any security discussed herein should do so with or through SG Americas Securities, LLC to conform with the requirements of US securities law. SG Americas Securities, LLC, 1221 Avenue of the Americas, New York, NY, 10020. (212) 278-6000. Some of the securities mentioned herein may not be qualified for sale under the securities laws of certain states, except for unsolicited orders. Customer purchase orders made on the basis of this report cannot be considered to be unsolicited by SG Americas Securities, LLC and therefore may not be accepted by SG Americas Securities, LLC investment executives unless the security is qualified for sale in the state. Notice to Japanese Investors:Notice to Japanese Investors:Notice to Japanese Investors:Notice to Japanese Investors: This report is distributed in Japan by Société Générale Securities (North Pacific) Ltd., Tokyo Branch, which is regulated by the Financial Services Agency of Japan. The products mentioned in this report may not be eligible for sale in Japan and they may not be suitable for all types of investors. Notice to AuNotice to AuNotice to AuNotice to Australian Investors: stralian Investors: stralian Investors: stralian Investors: Société Générale Australia Branch (ABN 71 092 516 286) (SG) takes responsibility for publishing this document. SG holds an AFSL no. 236651 issued under the Corporations Act 2001 (Cth) ("Act"). The information contained in this newsletter is only directed to recipients who are aware they are wholesale clients as defined under the Act. http://www.sgcib.com. Copyright: The Société Générale Group 2010. All rights reserved.