Embed Size (px)
Citation preview
EMEA PERSPECTIVES
1
ContentsUK ECONOMIC MOMENTUM
1/
2/7
3/7
4/7
5/7
6/7
7/7
Page 2
Introduction
Page 6
Fast-growing economy
Page 12
Challenges remain ahead
Page 18
Political landscape
Page 24
Market outlook
Page 30
Investment implications
Page 32
Biographies
For an interactive version of this publication, please visit www.jpmorgan.com/pb/emeaperspectivesspring2015
3
IntroductionUK ECONOMIC MOMENTUM
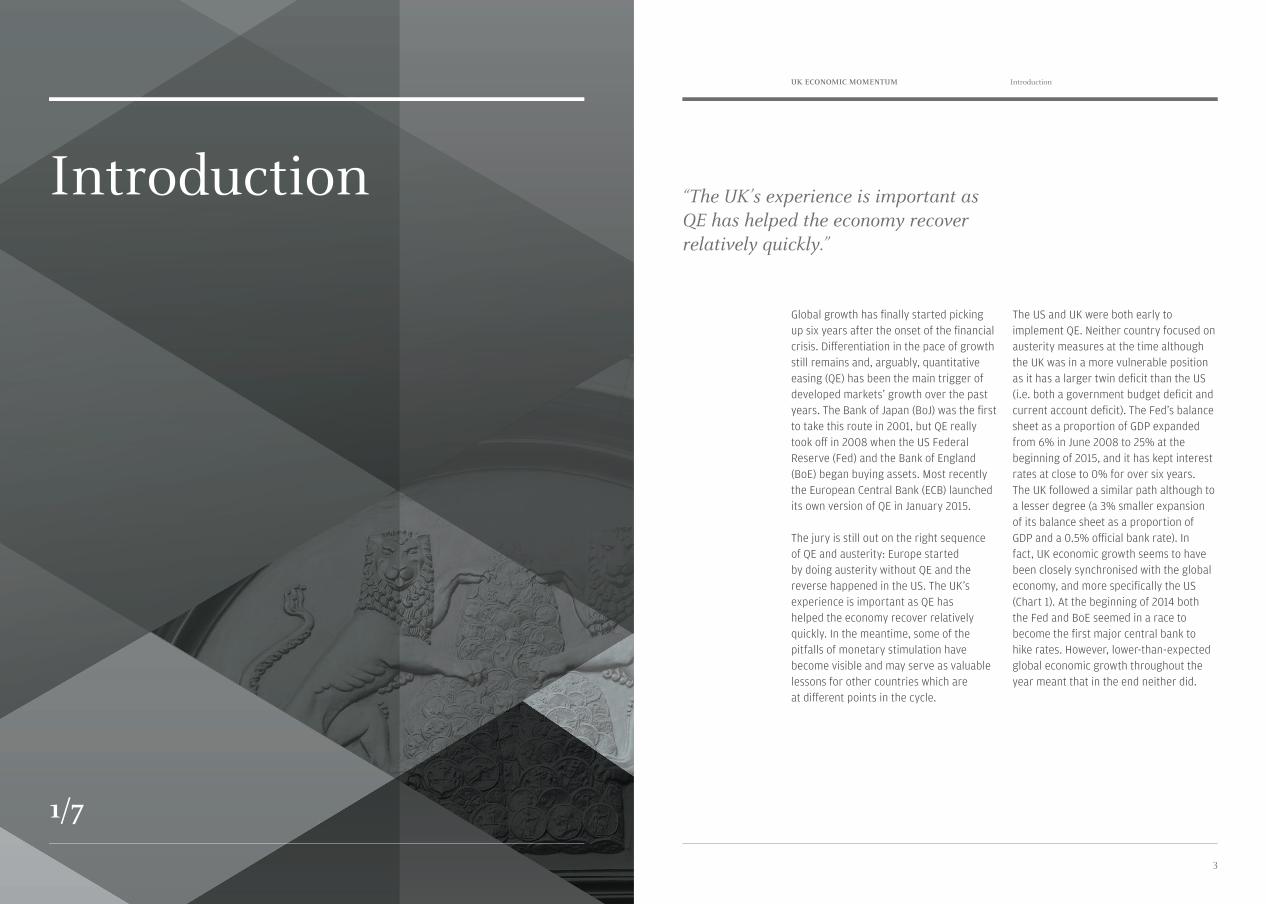
Global growth has finally started picking up six years after the onset of the financial crisis. Differentiation in the pace of growth still remains and, arguably, quantitative easing (QE) has been the main trigger of developed markets’ growth over the past years. The Bank of Japan (BoJ) was the first to take this route in 2001, but QE really took off in 2008 when the US Federal Reserve (Fed) and the Bank of England (BoE) began buying assets. Most recently the European Central Bank (ECB) launched its own version of QE in January 2015.
The jury is still out on the right sequence of QE and austerity: Europe started by doing austerity without QE and the reverse happened in the US. The UK’s experience is important as QE has helped the economy recover relatively quickly. In the meantime, some of the pitfalls of monetary stimulation have become visible and may serve as valuable lessons for other countries which are at different points in the cycle.
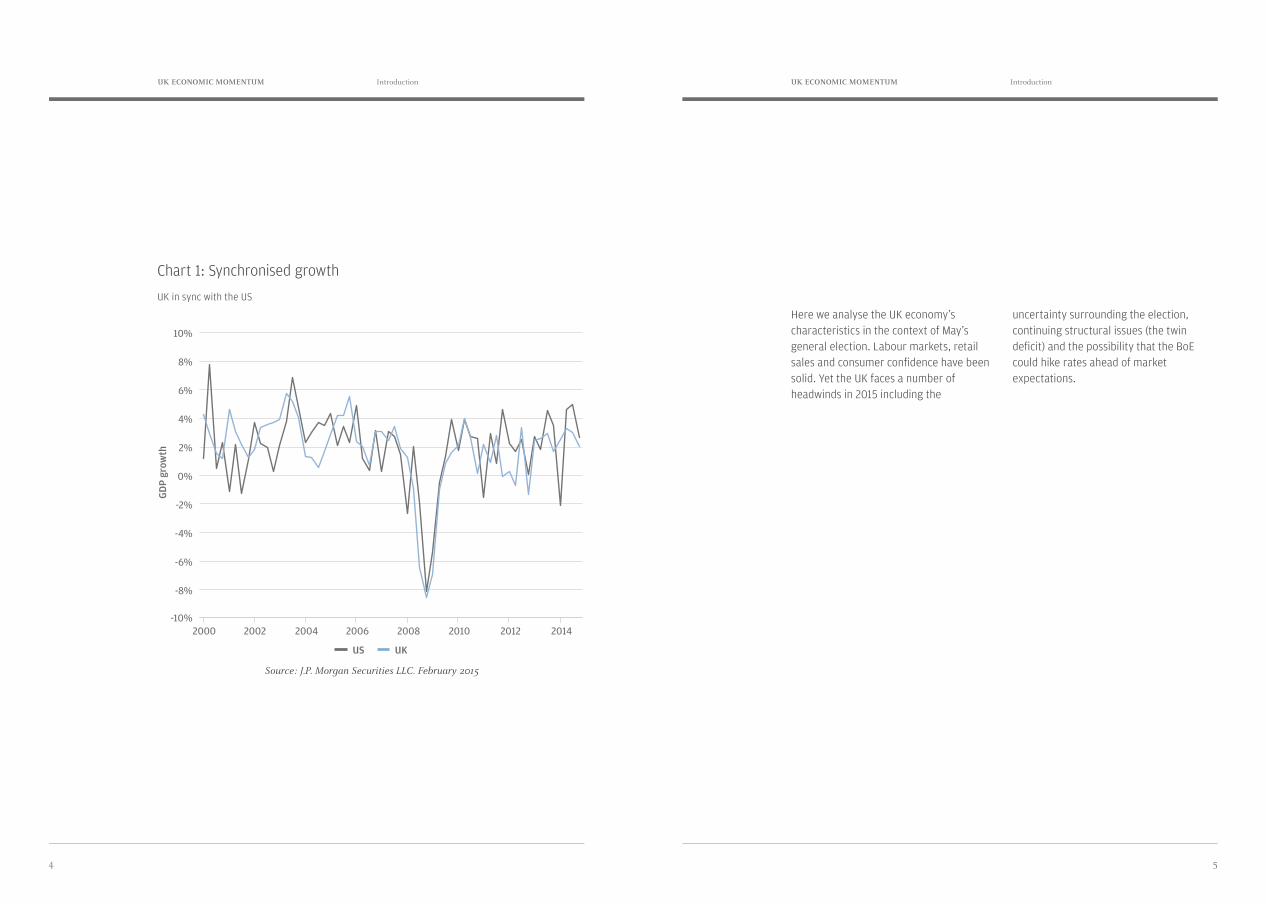
The US and UK were both early to implement QE. Neither country focused on austerity measures at the time although the UK was in a more vulnerable position as it has a larger twin deficit than the US (i.e. both a government budget deficit and current account deficit). The Fed’s balance sheet as a proportion of GDP expanded from 6% in June 2008 to 25% at the beginning of 2015, and it has kept interest rates at close to 0% for over six years. The UK followed a similar path although to a lesser degree (a 3% smaller expansion of its balance sheet as a proportion of GDP and a 0.5% official bank rate). In fact, UK economic growth seems to have been closely synchronised with the global economy, and more specifically the US (Chart 1). At the beginning of 2014 both the Fed and BoE seemed in a race to become the first major central bank to hike rates. However, lower-than-expected global economic growth throughout the year meant that in the end neither did.
“The UK’s experience is important as QE has helped the economy recover relatively quickly.”
Introduction
1/7
54
UK ECONOMIC MOMENTUM IntroductionIntroduction UK ECONOMIC MOMENTUM
Chart 1: Synchronised growth
UK in sync with the US
Source: J.P. Morgan Securities LLC. February 2015
Here we analyse the UK economy’s characteristics in the context of May’s general election. Labour markets, retail sales and consumer confidence have been solid. Yet the UK faces a number of headwinds in 2015 including the
uncertainty surrounding the election, continuing structural issues (the twin deficit) and the possibility that the BoE could hike rates ahead of market expectations.
4/17/2015 J.P.Morgan
http://ldnjpemea.callisto.analogfolk.com/#/ 4/29
Source: J.P.Morgan Securities LLC. February 2015
Here we analyse the UK economy’s characteristics in the context of May’s general
election. Labour markets, retail sales and consumer confidence have been solid. Yet
the UK faces a number of headwinds in 2015 including the uncertainty surrounding
the election, continuing structural issues (the twin deficit) and the possibility that the
BoE could hike rates ahead of market expectations.
US UK
GD
P gr
owth
2000 2002 2004 2006 2008 2010 2012 2014-10%
-8%
-6%
-4%
-2%
0%
2%
4%
6%
8%
10%
2000
10%
GDP
grow
th
US UK
8%
6%
4%
2%
0%
-2%
-4%
-6%
-8%
-10%2006 20122002 2008 20142004 2010
7
Fast-growing economyUK ECONOMIC MOMENTUM
2/7
Fast-growing economy
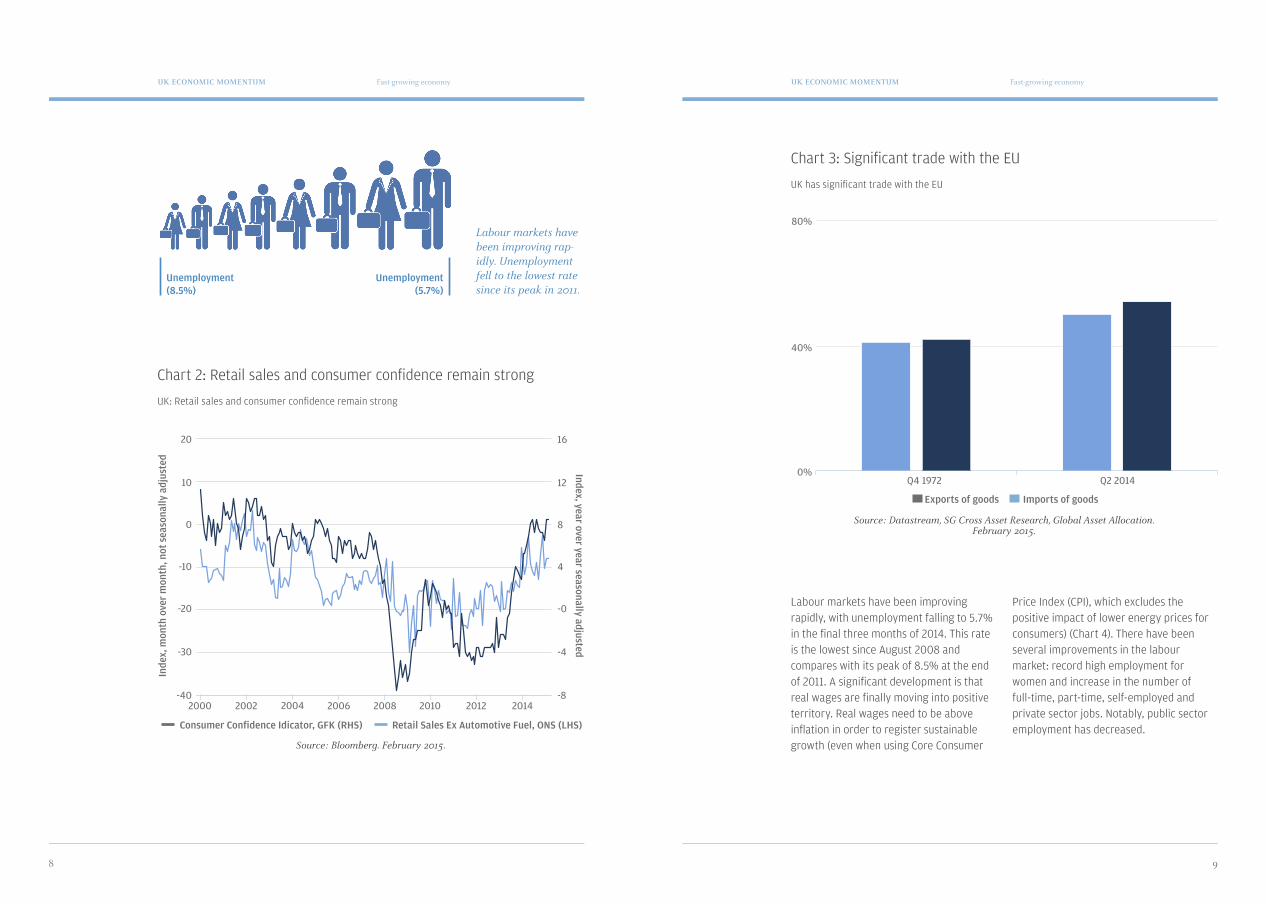
The UK economy appears to be heading in the right direction, which is reflected in strong retail sales and consumer confidence (Chart 2). GDP expanded at an annual pace of 2.7% in 2014, which is notably higher than the 1.7% average growth rate across developed markets. Private consumption expenditure is the main component of the UK’s economy, representing 65% of GDP compared with 58% in 1980. Private consumption held up remarkably well after the financial crisis and only took a year to reach pre-crisis levels, owing to QE, which increased asset values (total net financial assets and real estate for households) and depressed yields, making credit cheaper. In March 2009 the BoE first cut its main policy rate to 0.5% and then started to purchase
assets under the Asset Purchase Facility (APF), reaching a total of £375 billion at its peak. According to the BoE, QE translates into a 1% to 1.5% increase in consumption, assuming a 4% increase in total wealth. We note that consumption represents two-thirds of the UK’s GDP. Even though private consumption has been strong, the UK economy is at a stage when its reliance on consumption needs to be balanced by an increase in investment. A factor which keeps consumption from heating up is that net exports are at risk of falling as a result of slowing global trade and a somewhat slower recovery in neighbouring Eurozone countries, which represent 50% of the UK’s exports (Chart 3).
98
Fast-growing economyFast-growing economyUK ECONOMIC MOMENTUM UK ECONOMIC MOMENTUM
Chart 2: Retail sales and consumer confidence remain strong
UK: Retail sales and consumer confidence remain strong
Chart 3: Significant trade with the EU
UK has significant trade with the EU
Source: Bloomberg. February 2015.
Source: Datastream, SG Cross Asset Research, Global Asset Allocation. February 2015.
Labour markets have been improving rapidly, with unemployment falling to 5.7% in the final three months of 2014. This rate is the lowest since August 2008 and compares with its peak of 8.5% at the end of 2011. A significant development is that real wages are finally moving into positive territory. Real wages need to be above inflation in order to register sustainable growth (even when using Core Consumer
Price Index (CPI), which excludes the positive impact of lower energy prices for consumers) (Chart 4). There have been several improvements in the labour market: record high employment for women and increase in the number of full-time, part-time, self-employed and private sector jobs. Notably, public sector employment has decreased.
Labour markets have been improving rap-idly. Unemployment fell to the lowest rate since its peak in 2011.
Unemployment (8.5%)
Unemployment (5.7%)
4/17/2015 J.P.Morgan
http://ldnjpemea.callisto.analogfolk.com/#/political-landscape 7/29
Source: Bloomberg. February 2015.
Chart 3: Significant trade with the EU
UK has significant trade with the EU
Consumer Confidence Indicator, GFK (RHS) Retail Sales Ex Automotive Fuel, ONS (LHS)
Inde
x, M
oM, n
sa Index, YoY, sa2000 2002 2004 2006 2008 2010 2012 2014
-40
-30
-20
-10
0
10
20
-8
-4
0
4
8
12
16
4/17/2015 J.P.Morgan
http://ldnjpemea.callisto.analogfolk.com/#/political-landscape 8/29
Source: Datastream, SG Cross Asset Research, Global Asset Allocation. February 2015.
Labour markets have been improving rapidly, with unemployment falling to 5.7% in the
final three months of 2014. This rate is the lowest since August 2008 and compares
with its peak of 8.5% at the end of 2011. A significant development is that real wages
are finally moving into positive territory. Real wages need to be above inflation in order
to register sustainable growth (even when using Core Consumer Price Index (CPI),
which excludes the positive impact of lower energy prices for consumers) (Chart 4).
There have been several improvements in the labour market: record high employment
for women and increase in the number of full-time, part-time, self-employed and private
sector jobs. Notably, public sector employment has decreased.
Exports of goods Imports of goods
Q4 1972 Q2 20140%
40%
80%
2000
Inde
x, m
onth
ove
r m
onth
, not
sea
sona
lly a
djus
ted
Index, year over year seasonally adjusted
Consumer Confidence Idicator, GFK (RHS) Retail Sales Ex Automotive Fuel, ONS (LHS)
10
20
80%
40%
0%
0
-10
-20
-30
-402006 20122002 2008 2014
Q4 1972 Q2 2014
2004 2010
12
16
8
4
-0
-4
-8
Exports of goods Imports of goods
1110
Fast-growing economyFast-growing economyUK ECONOMIC MOMENTUM UK ECONOMIC MOMENTUM
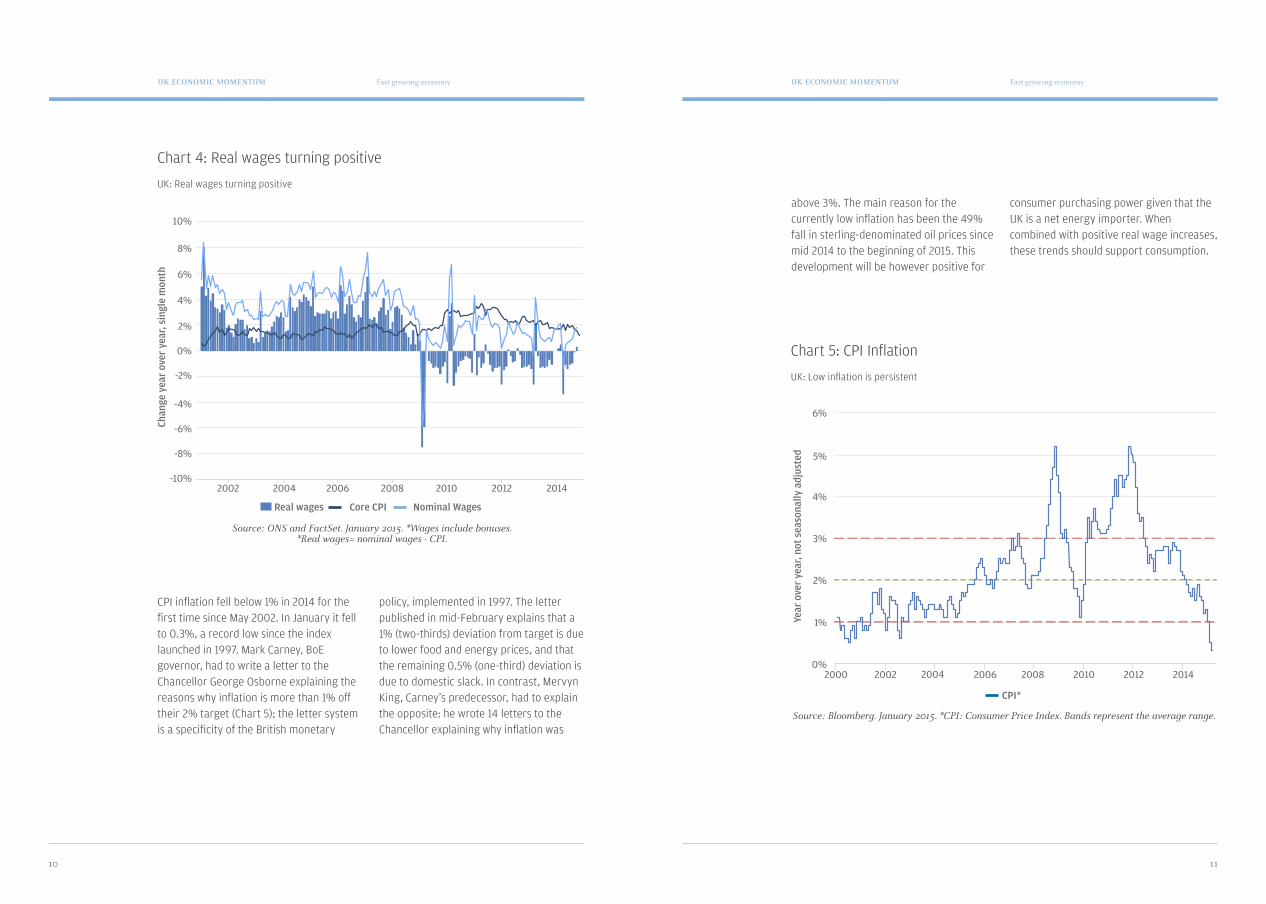
Chart 4: Real wages turning positive
UK: Real wages turning positive
Chart 5: CPI Inflation
UK: Low inflation is persistent
Source: ONS and FactSet. January 2015. *Wages include bonuses. *Real wages= nominal wages - CPI.
Source: Bloomberg. January 2015. *CPI: Consumer Price Index. Bands represent the average range.
CPI inflation fell below 1% in 2014 for the first time since May 2002. In January it fell to 0.3%, a record low since the index launched in 1997. Mark Carney, BoE governor, had to write a letter to the Chancellor George Osborne explaining the reasons why inflation is more than 1% off their 2% target (Chart 5); the letter system is a specificity of the British monetary
policy, implemented in 1997. The letter published in mid-February explains that a 1% (two-thirds) deviation from target is due to lower food and energy prices, and that the remaining 0.5% (one-third) deviation is due to domestic slack. In contrast, Mervyn King, Carney’s predecessor, had to explain the opposite: he wrote 14 letters to the Chancellor explaining why inflation was
above 3%. The main reason for the currently low inflation has been the 49% fall in sterling-denominated oil prices since mid 2014 to the beginning of 2015. This development will be however positive for
consumer purchasing power given that the UK is a net energy importer. When combined with positive real wage increases, these trends should support consumption.
4/17/2015 J.P.Morgan
http://ldnjpemea.callisto.analogfolk.com/#/political-landscape 9/29
Chart 4: Real wages turning positive
UK: Real wages turning positive
Source: ONS and FactSet. January 2015. *Wages include bonuses. *Real wages= nominal wages - CPI.
CPI inflation fell below 1% in 2014 for the first time since May 2002. In January it fell to
0.3%, a record low since the index launched in 1997. Mark Carney, BoE governor, had
to write a letter to the Chancellor George Osborne explaining the reasons why inflation
is more than 1% off their 2% target (Chart 5); the letter system is a specificity of the
British monetary policy, implemented in 1997. The letter published in mid-February
explains that 1% (two-thirds) deviation from target is due to lower food and energy
prices, and that the remaining 0.5% (one-third) deviation is due to domestic slack. In
Real Wages Core CPI Nominal Wages
Chan
ge y
ear
over
yea
r, s
ingl
e m
onth
2002 2004 2006 2008 2010 2012 2014-10%
-8%
-6%
-4%
-2%
0%
2%
4%
6%
8%
10%
4/17/2015 J.P.Morgan
http://ldnjpemea.callisto.analogfolk.com/#/political-landscape 10/29
contrast, Mervyn King, Carney’s predecessor, had to explain the opposite: he wrote 14
letters to the Chancellor explaining why inflation was above 3%. The main reason for
the currently low inflation is the 49% fall in sterling denominated oil prices since mid
2014 to the beginning of 2015. This development will be however positive for consumer
purchasing power given that the UK is a net energy importer. When combined with
positive real wage increases, these trends should support consumption.
Chart 5: CPI Inflation
UK: Low inflation is persistent
Source: Bloomberg. January 2015. *CPI: Consumer Price Index. Bands represent the average range.
CPI*
YoY,
NSA
2000 2002 2004 2006 2008 2010 2012 20140%
1%
2%
3%
4%
5%
6%
10%
Chan
ge y
ear
over
yea
r, si
ngle
mon
th
Year
ove
r ye
ar, n
ot s
easo
nally
adj
uste
d
Core CPIReal wages Nominal Wages
8%
6%
4%
2%
6%
0%
5%
-2%
4%
-4%
3%
-6%
2%
-8%
1%
-10%
0%
2006 20122002 2008 20142004 2010
2000 2006 20122002 2008 20142004 2010
CPI*

13
Challenges remain aheadUK ECONOMIC MOMENTUM
Challenges remain ahead
3/7
A 1% rate hike would result in an overall 0.5% cut in spending: the savers who would increase spending would not fully compensate for the borrowers expected to reduce it.
Following May’s general election, an increase in interest rates or a change in fiscal policy could impact the UK’s economic growth rate.
The BoE is caught between a solid labour market and low inflation, and became more dovish at its January Monetary Policy Committee (MPC) meeting with all members agreeing not to hike rates. Despite identical votes in the February MPC meeting, one member signalled that their next policy decision may be “roughly as likely to be loosening as tightening”. Markets expect the BoE to raise rates by mid 2016. Although we believe Europe is also exerting downward pressure on US
rates, the effect appears to be magnified in the UK. When combined with moderating inflation and the uncertainty surrounding the general election, the outlook for rates increases in the UK has clearly moderated. Our base case is for a rate move towards the second half of 2015, at the earliest.
The UK appears to be in one of the weakest fiscal positions because it has a high current account deficit and negative budget balance. This situation adds pressure to an already vulnerable political context.
10% of savers 60% of borrowers
1514
Challenges remain aheadChallenges remain aheadUK ECONOMIC MOMENTUM UK ECONOMIC MOMENTUM
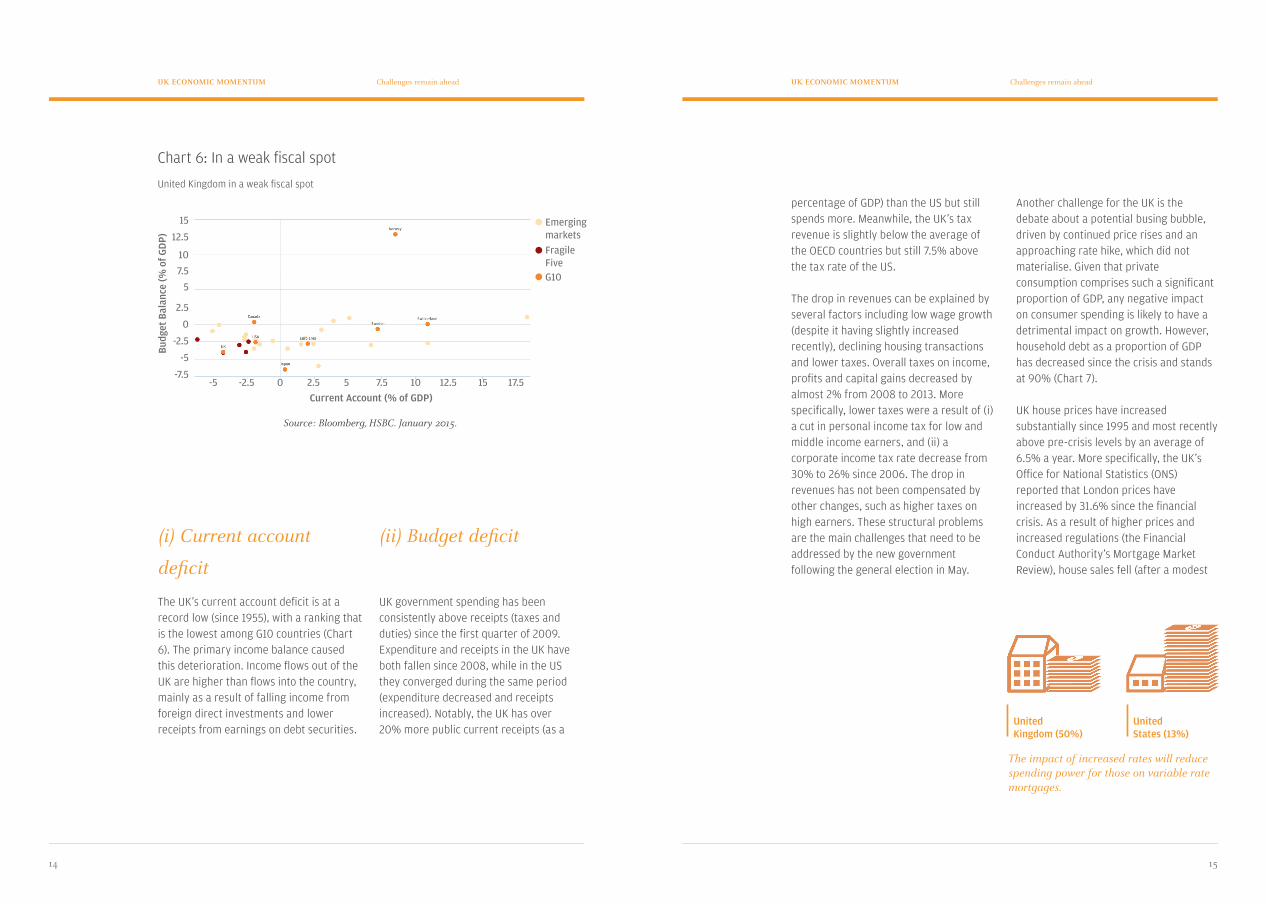
Source: Bloomberg, HSBC. January 2015.
Chart 6: In a weak fiscal spot
United Kingdom in a weak fiscal spot
(i) Current account
deficit
The UK’s current account deficit is at a record low (since 1955), with a ranking that is the lowest among G10 countries (Chart 6). The primary income balance caused this deterioration. Income flows out of the UK are higher than flows into the country, mainly as a result of falling income from foreign direct investments and lower receipts from earnings on debt securities.
(ii) Budget deficit
UK government spending has been consistently above receipts (taxes and duties) since the first quarter of 2009. Expenditure and receipts in the UK have both fallen since 2008, while in the US they converged during the same period (expenditure decreased and receipts increased). Notably, the UK has over 20% more public current receipts (as a
percentage of GDP) than the US but still spends more. Meanwhile, the UK’s tax revenue is slightly below the average of the OECD countries but still 7.5% above the tax rate of the US.
The drop in revenues can be explained by several factors including low wage growth (despite it having slightly increased recently), declining housing transactions and lower taxes. Overall taxes on income, profits and capital gains decreased by almost 2% from 2008 to 2013. More specifically, lower taxes were a result of (i) a cut in personal income tax for low and middle income earners, and (ii) a corporate income tax rate decrease from 30% to 26% since 2006. The drop in revenues has not been compensated by other changes, such as higher taxes on high earners. These structural problems are the main challenges that need to be addressed by the new government following the general election in May.
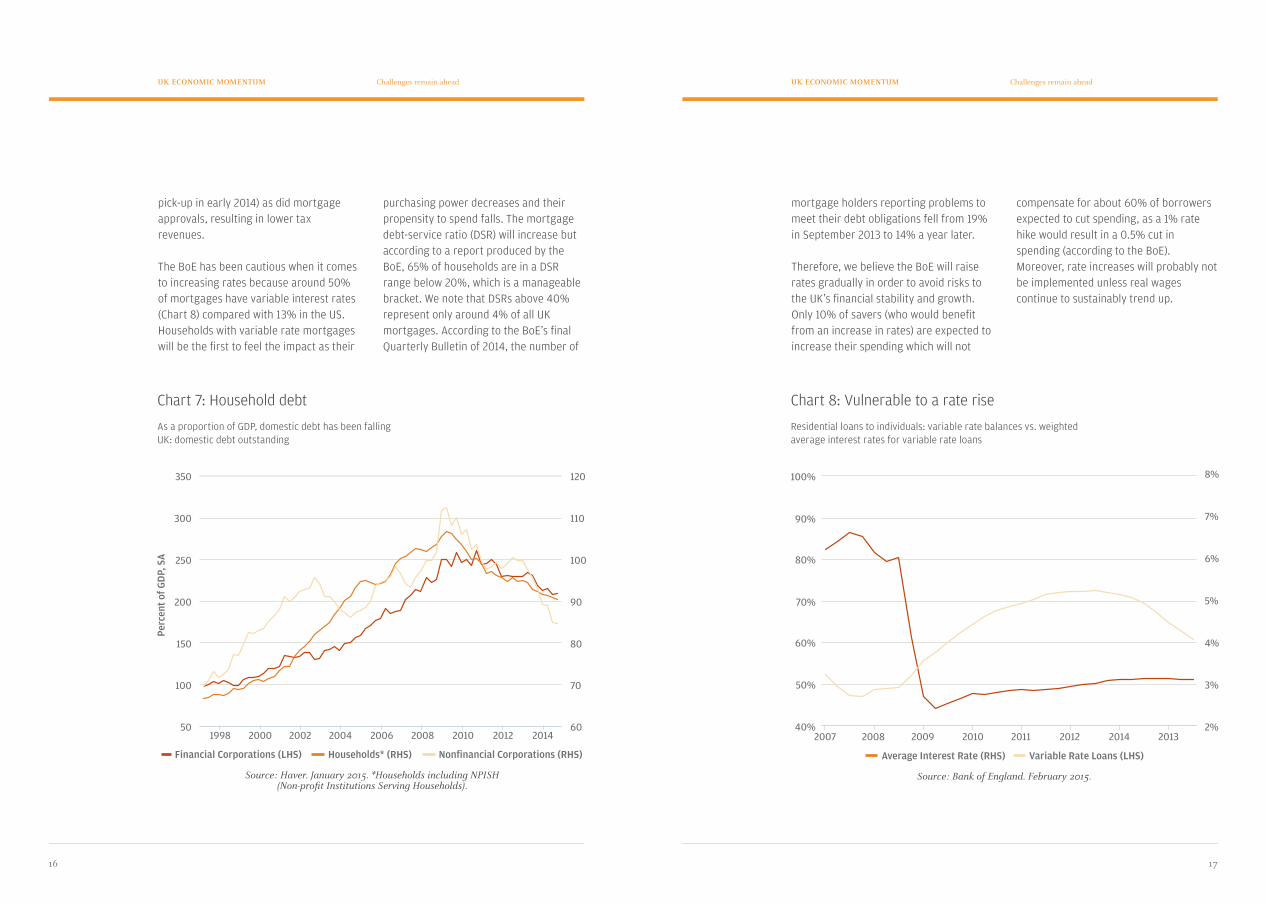
Another challenge for the UK is the debate about a potential busing bubble, driven by continued price rises and an approaching rate hike, which did not materialise. Given that private consumption comprises such a significant proportion of GDP, any negative impact on consumer spending is likely to have a detrimental impact on growth. However, household debt as a proportion of GDP has decreased since the crisis and stands at 90% (Chart 7).
UK house prices have increased substantially since 1995 and most recently above pre-crisis levels by an average of 6.5% a year. More specifically, the UK’s Office for National Statistics (ONS) reported that London prices have increased by 31.6% since the financial crisis. As a result of higher prices and increased regulations (the Financial Conduct Authority’s Mortgage Market Review), house sales fell (after a modest
The impact of increased rates will reduce spending power for those on variable rate mortgages.
United Kingdom (50%)
United States (13%)
15
Budg
et B
alan
ce (%
of G
DP)
Current Account (% of GDP)
12.5
10
7.5
5
2.5
0
-2.5
-5
-7.50 7.5-5 2.5 10
Emerging marketsFragile FiveG10
12.5 15 17.5-2.5 5
1716
Challenges remain aheadChallenges remain aheadUK ECONOMIC MOMENTUM UK ECONOMIC MOMENTUM
Chart 7: Household debt
As a proportion of GDP, domestic debt has been falling UK: domestic debt outstanding
Chart 8: Vulnerable to a rate rise
Residential loans to individuals: variable rate balances vs. weighted average interest rates for variable rate loans
Source: Haver. January 2015. *Households including NPISH(Non-profit Institutions Serving Households).
Source: Bank of England. February 2015.
4/17/2015 J.P.Morgan
http://ldnjpemea.callisto.analogfolk.com/#/political-landscape 17/29
Source: Haver. January 2015. *Households including NPISH (Non-profit Instituions Serving Households).
Chart 8: Vulnerable to a rate rise
Residential loans to individuals: variable rate balances vs. weighted average interest rates for variable rate loans
Financial Corporations (LHS) Households* (RHS) Nonfinancial Corporations (RHS)
Perc
ent
of G
DP,
SA
1998 2000 2002 2004 2006 2008 2010 2012 201450
100
150
200
250
300
350
60
70
80
90
100
110
120
4/17/2015 J.P.Morgan
http://ldnjpemea.callisto.analogfolk.com/#/political-landscape 18/29
Source: Bank of England. February 2015.
Average interest rate (RHS) Variable rate loans (LHS)
2007 2008 2009 2010 2011 2012 2013 201440%
50%
60%
70%
80%
90%
100%
2%
3%
4%
5%
6%
7%
8%
4/6
pick-up in early 2014) as did mortgage approvals, resulting in lower tax revenues.
The BoE has been cautious when it comes to increasing rates because around 50% of mortgages have variable interest rates (Chart 8) compared with 13% in the US. Households with variable rate mortgages will be the first to feel the impact as their
purchasing power decreases and their propensity to spend falls. The mortgage debt-service ratio (DSR) will increase but according to a report produced by the BoE, 65% of households are in a DSR range below 20%, which is a manageable bracket. We note that DSRs above 40% represent only around 4% of all UK mortgages. According to the BoE’s final Quarterly Bulletin of 2014, the number of
mortgage holders reporting problems to meet their debt obligations fell from 19% in September 2013 to 14% a year later.
Therefore, we believe the BoE will raise rates gradually in order to avoid risks to the UK’s financial stability and growth. Only 10% of savers (who would benefit from an increase in rates) are expected to increase their spending which will not
compensate for about 60% of borrowers expected to cut spending, as a 1% rate hike would result in a 0.5% cut in spending (according to the BoE). Moreover, rate increases will probably not be implemented unless real wages continue to sustainably trend up.
Perc
ent o
f GD
P, S
A
Households* (RHS) Average Interest Rate (RHS)Financial Corporations (LHS) Nonfinancial Corporations (RHS) Variable Rate Loans (LHS)
300 90%
100%
110 7%
350 120 8%
250 80%100 6%
200 70%90 5%
150 60%80 4%
100 50%70 3%
50 40%60 2%2002 20092008 20121998 20072004 20102010 20132012 201420142000 20082006 2011
19
Political landscapeUK ECONOMIC MOMENTUM
Political landscape
4/7
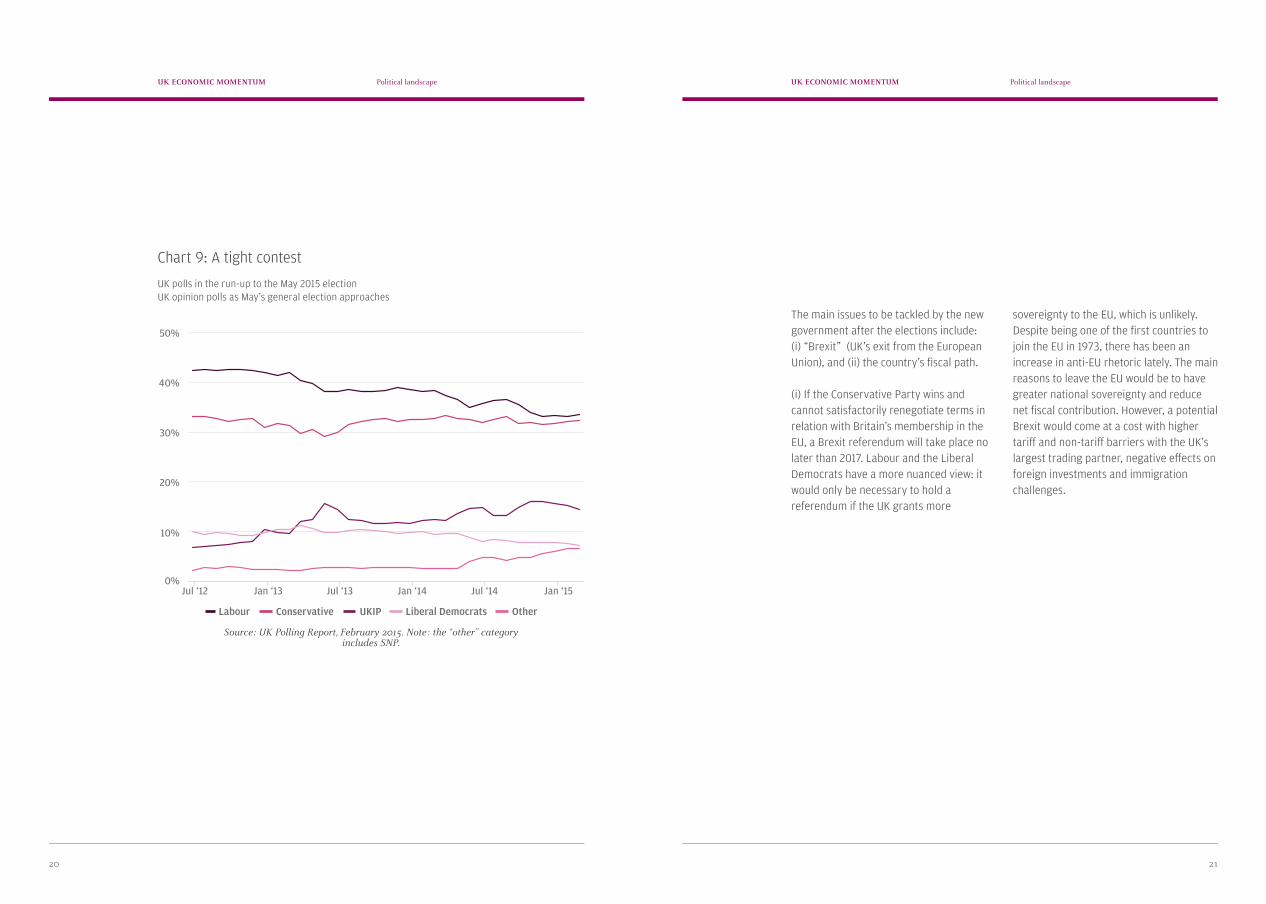
The May general elections will have the most uncertain outcome in a generation. Polls point to a hung parliament, requiring a coalition to be formed, similar to what occurred in 2010. The difference with past elections is that multi-party politics is on the rise, with the Scottish National Party (SNP), UK Independence Party (UKIP), Liberal Democrats and Green Party getting stronger representation in the polls. Since the last elections, support has continued to migrate away from the two main parties. Although the 2014 referendum ultimately saw Scotland remain part of the UK, it appears to have boosted support for the SNP as a choice for representation in the UK parliament, largely at the expense of Labour.
The opinion polls show the two main parties with a fairly equal share of the vote, making it hard to predict which of them will gain the most support. But the rise in support for the fringe parties makes the precise outcome of
the general election even harder to call and the numerous likely permutations make it difficult to forecast a clear winner. Furthermore, we cannot exclude that the next government may involve three or more parties. However, there are several coalitions based on potential alliances which look likely. These include: Labour-SNP, Liberal Democrats-Labour, Conservative-UKIP or Liberal Democrats-Conservatives. Predicting how votes will translate into slots is probably the biggest uncertainty, as regional polling data suggests the rise in support for fringe parties. In conclusion, the party that gains the most number of seats will not necessarily form the next government and the structure of that government could involve multiple parties in either a formal coalition or looser agreement.
“The number of people willing to leave the EU has decreased over the past two years with the majority wanting to stay.”
2120
Political landscapePolitical landscapeUK ECONOMIC MOMENTUM UK ECONOMIC MOMENTUM
Chart 9: A tight contest
UK polls in the run-up to the May 2015 election UK opinion polls as May’s general election approaches
Source: UK Polling Report, February 2015. Note: the “other” category includes SNP.
The main issues to be tackled by the new government after the elections include: (i) “Brexit” (UK’s exit from the European Union), and (ii) the country’s fiscal path.
(i) If the Conservative Party wins and cannot satisfactorily renegotiate terms in relation with Britain’s membership in the EU, a Brexit referendum will take place no later than 2017. Labour and the Liberal Democrats have a more nuanced view: it would only be necessary to hold a referendum if the UK grants more
sovereignty to the EU, which is unlikely. Despite being one of the first countries to join the EU in 1973, there has been an increase in anti-EU rhetoric lately. The main reasons to leave the EU would be to have greater national sovereignty and reduce net fiscal contribution. However, a potential Brexit would come at a cost with higher tariff and non-tariff barriers with the UK’s largest trading partner, negative effects on foreign investments and immigration challenges.
4/17/2015 J.P.Morgan
http://ldnjpemea.callisto.analogfolk.com/#/political-landscape 20/29
for fringe parties. In conclusion, the party that gains the most number of seats will not
necessarily form the next government and the structure of that government could
involve multiple parties in either a formal coalition or looser agreement.
Chart 9: A tight contest
UK polls in the run-up to the May 2015 electionUK opinion polls as May’s general election approaches
Source: UK Polling Report, February 2015. Note: the "other" category includes SNP.
The main issues to be tackled by the new government after the elections include: (i)
“Brexit” (UK’s exit from the European Union), and (ii) the country’s fiscal path.
Labour Conservative UKIP Liberal Democrats Other
Jul '12 Jan '13 Jul '13 Jan '14 Jul '14 Jan '150%
10%
20%
30%
40%
50%
UKIP OtherConservativeLabour Liberal Democrats
50%
40%
30%
20%
10%
0%Jul ‘12 Jan ‘13 Jan ‘15Jan ‘14 Jul ‘14Jul ‘13
2322
Political landscapePolitical landscapeUK ECONOMIC MOMENTUM UK ECONOMIC MOMENTUM
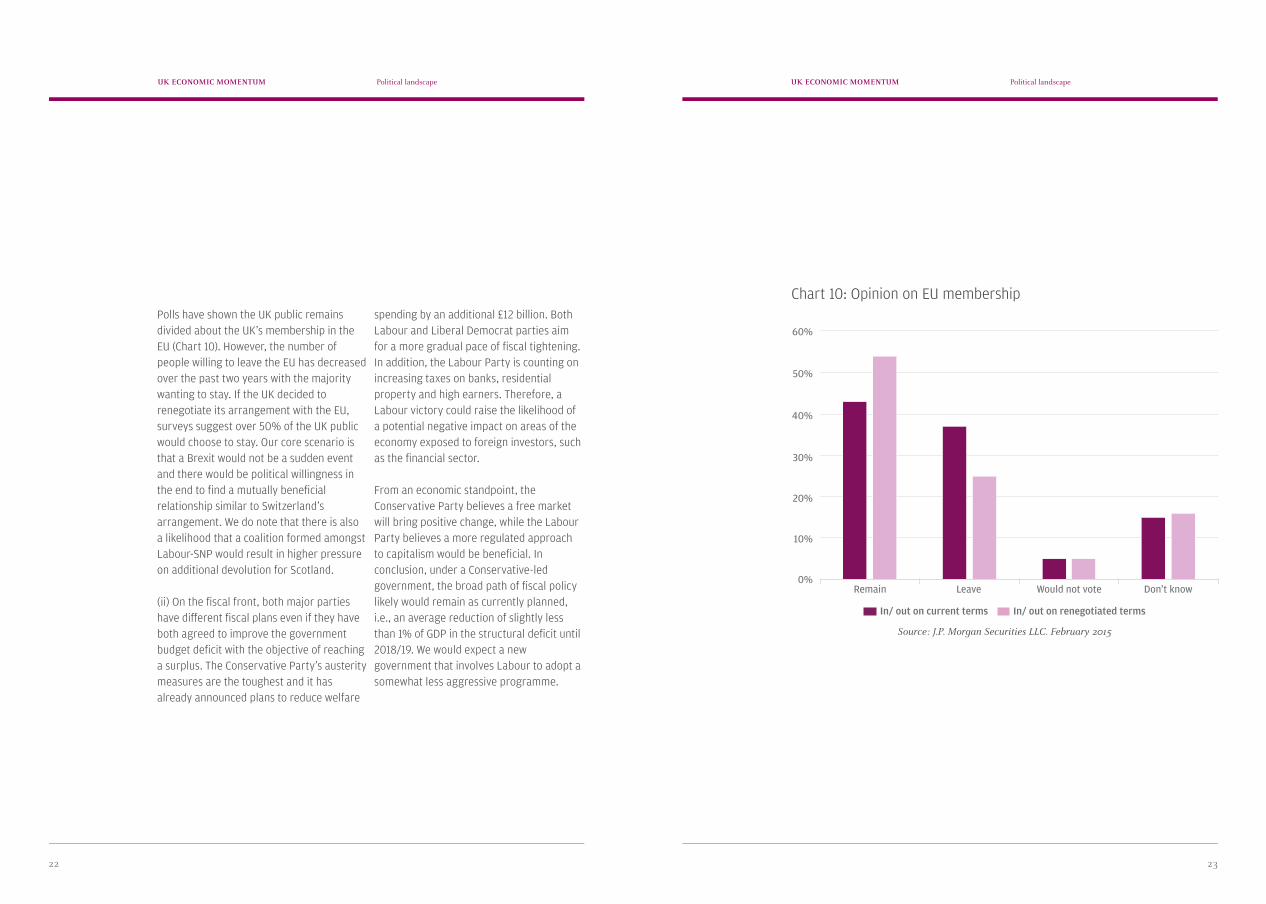
Chart 10: Opinion on EU membership
Source: J.P. Morgan Securities LLC. February 2015
Polls have shown the UK public remains divided about the UK’s membership in the EU (Chart 10). However, the number of people willing to leave the EU has decreased over the past two years with the majority wanting to stay. If the UK decided to renegotiate its arrangement with the EU, surveys suggest over 50% of the UK public would choose to stay. Our core scenario is that a Brexit would not be a sudden event and there would be political willingness in the end to find a mutually beneficial relationship similar to Switzerland’s arrangement. We do note that there is also a likelihood that a coalition formed amongst Labour-SNP would result in higher pressure on additional devolution for Scotland.
(ii) On the fiscal front, both major parties have different fiscal plans even if they have both agreed to improve the government budget deficit with the objective of reaching a surplus. The Conservative Party’s austerity measures are the toughest and it has already announced plans to reduce welfare
spending by an additional £12 billion. Both Labour and Liberal Democrat parties aim for a more gradual pace of fiscal tightening. In addition, the Labour Party is counting on increasing taxes on banks, residential property and high earners. Therefore, a Labour victory could raise the likelihood of a potential negative impact on areas of the economy exposed to foreign investors, such as the financial sector.
From an economic standpoint, the Conservative Party believes a free market will bring positive change, while the Labour Party believes a more regulated approach to capitalism would be beneficial. In conclusion, under a Conservative-led government, the broad path of fiscal policy likely would remain as currently planned, i.e., an average reduction of slightly less than 1% of GDP in the structural deficit until 2018/19. We would expect a new government that involves Labour to adopt a somewhat less aggressive programme.
4/17/2015 J.P.Morgan
http://ldnjpemea.callisto.analogfolk.com/#/political-landscape 22/29
From an economic standpoint, the Conservative Party believes a free market will bring
positive change, while the Labour Party believes a more regulated approach to
capitalism would be beneficial. In conclusion, under a Conservative-led government,
the broad path of fiscal policy likely would remain as currently planned, i.e., an average
reduction of slightly less than 1% of GDP in the structural deficit until 2018/19. We
would expect a new government that involves Labour to adopt a somewhat less
aggressive programme.
Chart 10: Opinion on EU membership
Source: YouGov. January 2015.
In/out on current terms In/out on renegotiated terms
Remain Leave Would not vote Don't know0%
10%
20%
30%
40%
50%
60%
In/ out on current terms In/ out on renegotiated terms
50%
60%
40%
30%
20%
10%
0%Remain Leave Would not vote Don’t know
25
Market outlookUK ECONOMIC MOMENTUM
Market outlook
5/7
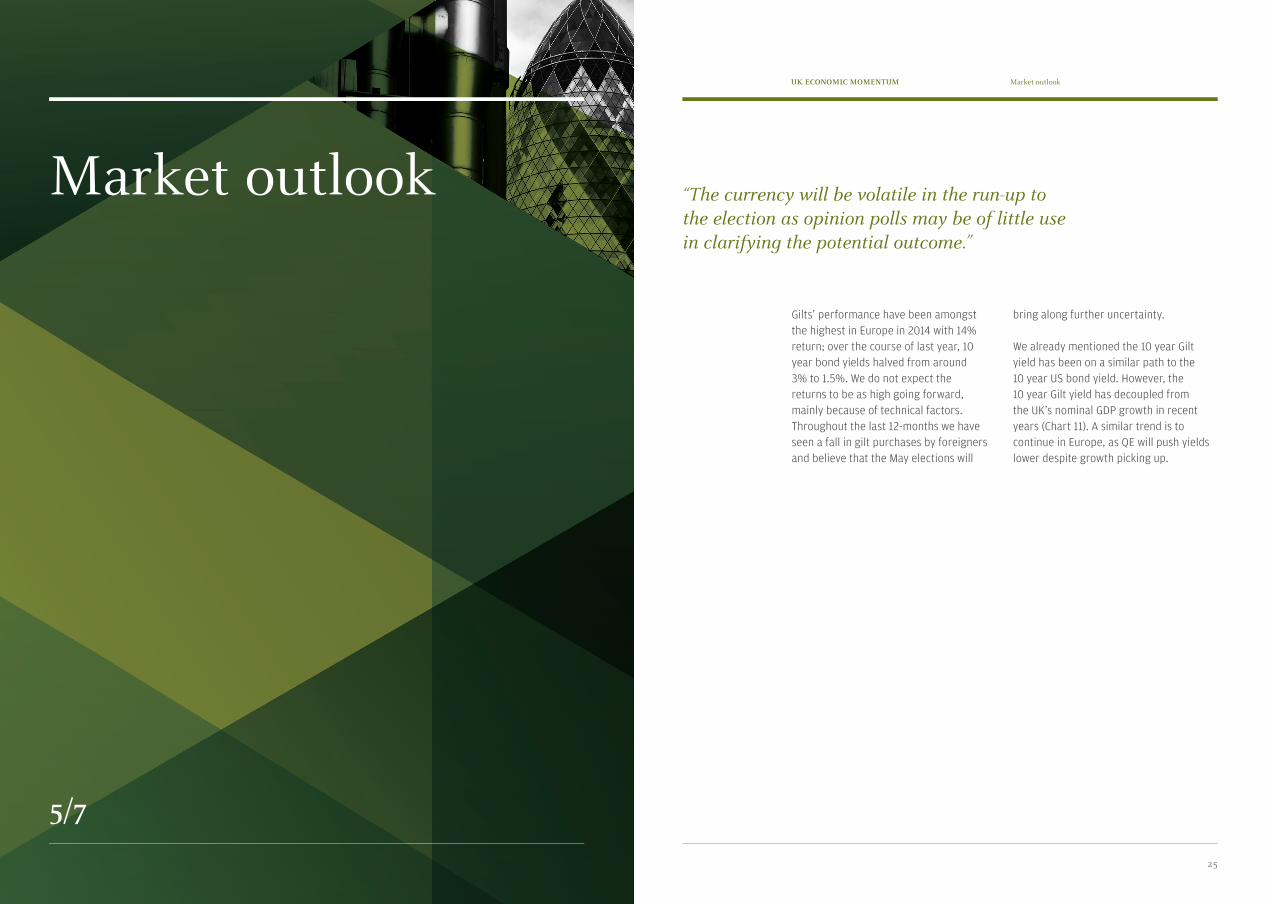
“The currency will be volatile in the run-up to the election as opinion polls may be of little use in clarifying the potential outcome.”
Gilts’ performance have been amongst the highest in Europe in 2014 with 14% return; over the course of last year, 10 year bond yields halved from around 3% to 1.5%. We do not expect the returns to be as high going forward, mainly because of technical factors. Throughout the last 12-months we have seen a fall in gilt purchases by foreigners and believe that the May elections will
bring along further uncertainty.
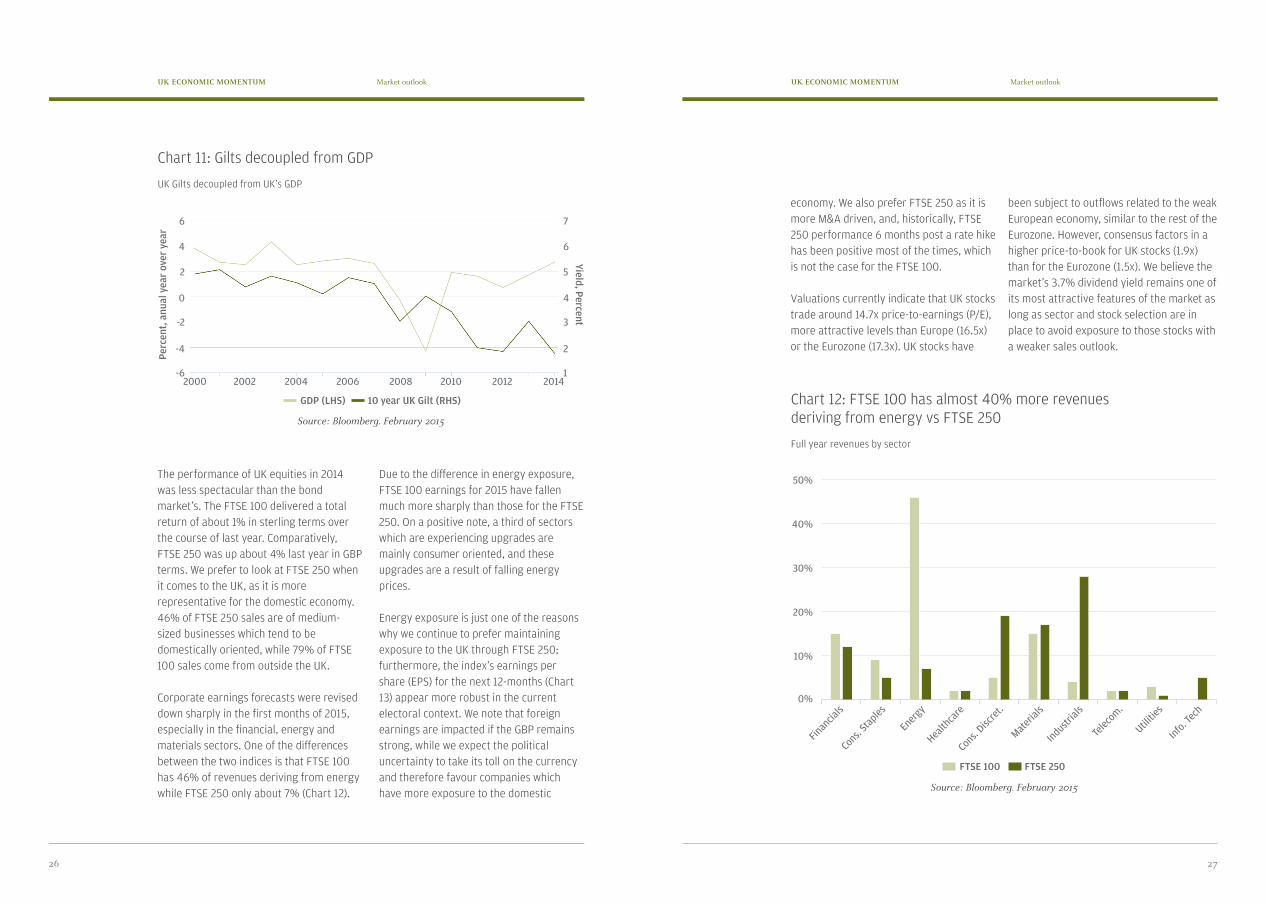
We already mentioned the 10 year Gilt yield has been on a similar path to the 10 year US bond yield. However, the 10 year Gilt yield has decoupled from the UK’s nominal GDP growth in recent years (Chart 11). A similar trend is to continue in Europe, as QE will push yields lower despite growth picking up.
2726
Market outlookMarket outlookUK ECONOMIC MOMENTUM UK ECONOMIC MOMENTUM
The performance of UK equities in 2014 was less spectacular than the bond market’s. The FTSE 100 delivered a total return of about 1% in sterling terms over the course of last year. Comparatively, FTSE 250 was up about 4% last year in GBP terms. We prefer to look at FTSE 250 when it comes to the UK, as it is more representative for the domestic economy. 46% of FTSE 250 sales are of medium-sized businesses which tend to be domestically oriented, while 79% of FTSE 100 sales come from outside the UK.
Corporate earnings forecasts were revised down sharply in the first months of 2015, especially in the financial, energy and materials sectors. One of the differences between the two indices is that FTSE 100 has 46% of revenues deriving from energy while FTSE 250 only about 7% (Chart 12).
Due to the difference in energy exposure, FTSE 100 earnings for 2015 have fallen much more sharply than those for the FTSE 250. On a positive note, a third of sectors which are experiencing upgrades are mainly consumer oriented, and these upgrades are a result of falling energy prices.
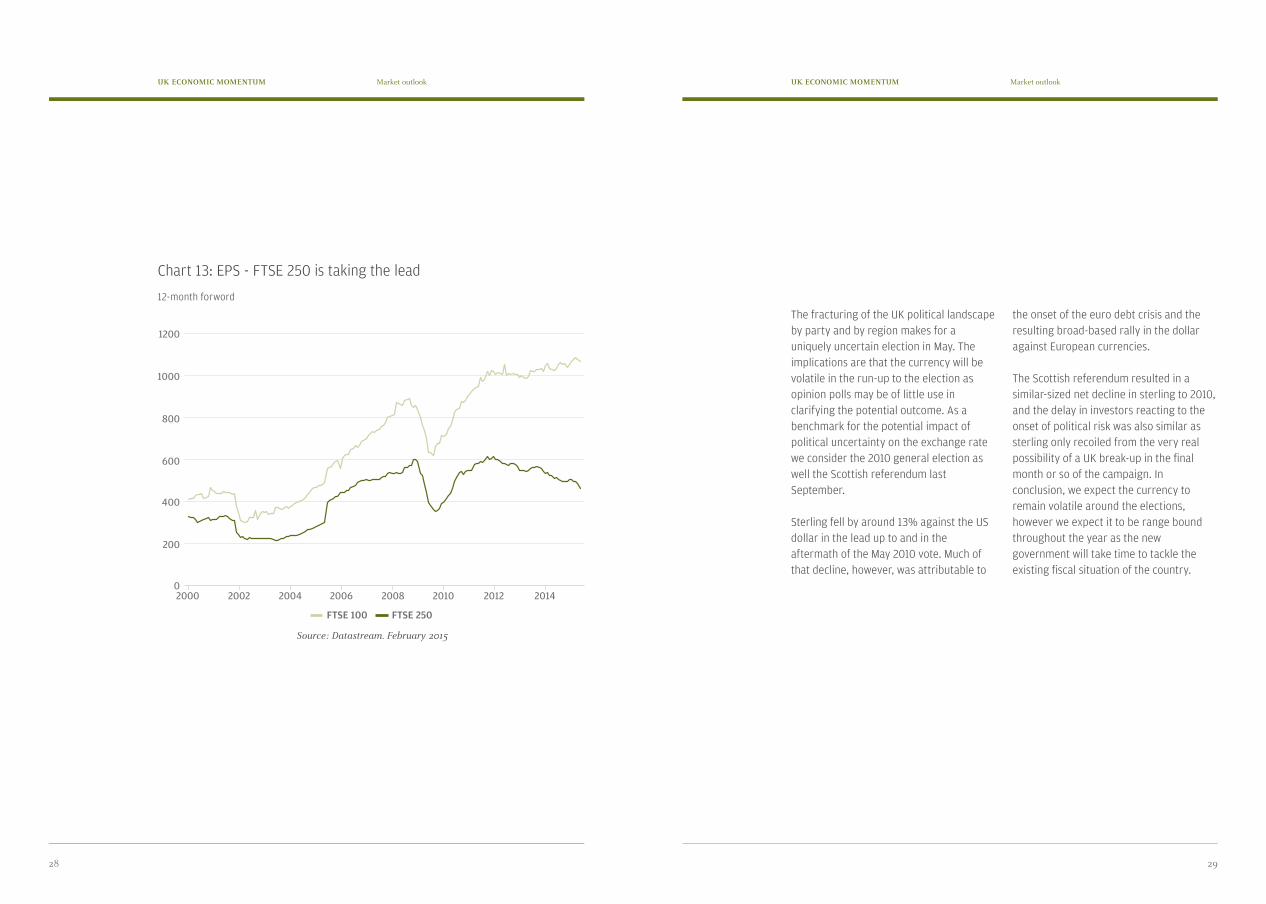
Energy exposure is just one of the reasons why we continue to prefer maintaining exposure to the UK through FTSE 250; furthermore, the index’s earnings per share (EPS) for the next 12-months (Chart 13) appear more robust in the current electoral context. We note that foreign earnings are impacted if the GBP remains strong, while we expect the political uncertainty to take its toll on the currency and therefore favour companies which have more exposure to the domestic
Chart 12: FTSE 100 has almost 40% more revenues deriving from energy vs FTSE 250
Full year revenues by sector
Source: Bloomberg. February 2015
Chart 11: Gilts decoupled from GDP
UK Gilts decoupled from UK’s GDP
Source: Bloomberg. February 2015
economy. We also prefer FTSE 250 as it is more M&A driven, and, historically, FTSE 250 performance 6 months post a rate hike has been positive most of the times, which is not the case for the FTSE 100.
Valuations currently indicate that UK stocks trade around 14.7x price-to-earnings (P/E), more attractive levels than Europe (16.5x) or the Eurozone (17.3x). UK stocks have
been subject to outflows related to the weak European economy, similar to the rest of the Eurozone. However, consensus factors in a higher price-to-book for UK stocks (1.9x) than for the Eurozone (1.5x). We believe the market’s 3.7% dividend yield remains one of its most attractive features of the market as long as sector and stock selection are in place to avoid exposure to those stocks with a weaker sales outlook.
4/17/2015 J.P.Morgan
http://ldnjpemea.callisto.analogfolk.com/#/political-landscape 26/29
Chart 12: FTSE 100 has almost 40% more revenues deriving from energy vs FTSE250
Full year revenues by sector
Source: Bloomberg. February 2015.
Chart 13: EPS - FTSE 250 is taking the lead
12-month forword
FTSE100 FTSE250
Financials
Cons. Sta
ples
Energy
Healthca
re
Cons. Disc
ret.
Materia
ls
Industr
ials
Telecom.
Utiliti
es
Info
. Tech
0%
10%
20%
30%
40%
50%
Perc
ent,
anu
al y
ear
over
yea
r
Yield, Percent
GDP (LHS)
FTSE 100
10 year UK Gilt (RHS)
FTSE 250
4
40%
6
6
50%
7
2
30%
5
0
20%
4
-2
10%
3
-4
0%
2
-6 120022000
Financia
ls
Cons. Staples
Energy
Health
care
Cons. Disc
ret.
Materials
Industrials
Telec
om.
Utilitie
s
Info. Tec
h
2006 2008 2010 2012 20142004
2928
Market outlookMarket outlookUK ECONOMIC MOMENTUM UK ECONOMIC MOMENTUM
The fracturing of the UK political landscape by party and by region makes for a uniquely uncertain election in May. The implications are that the currency will be volatile in the run-up to the election as opinion polls may be of little use in clarifying the potential outcome. As a benchmark for the potential impact of political uncertainty on the exchange rate we consider the 2010 general election as well the Scottish referendum last September.
Sterling fell by around 13% against the US dollar in the lead up to and in the aftermath of the May 2010 vote. Much of that decline, however, was attributable to
the onset of the euro debt crisis and the resulting broad-based rally in the dollar against European currencies.
The Scottish referendum resulted in a similar-sized net decline in sterling to 2010, and the delay in investors reacting to the onset of political risk was also similar as sterling only recoiled from the very real possibility of a UK break-up in the final month or so of the campaign. In conclusion, we expect the currency to remain volatile around the elections, however we expect it to be range bound throughout the year as the new government will take time to tackle the existing fiscal situation of the country.
Chart 13: EPS - FTSE 250 is taking the lead
12-month forword
Source: Datastream. February 2015
4/17/2015 J.P.Morgan
http://ldnjpemea.callisto.analogfolk.com/#/political-landscape 27/29
Source: Datastream. February 2015.
The fracturing of the UK political landscape by party and by region makes for a
uniquely uncertain election in May. The implications are that the currency will be volatile
in the run-up to the election as opinion polls may be of little use in clarifying the
potential outcome. As a benchmark for the potential impact of political uncertainty on
the exchange rate we consider the 2010 general election as well the Scottish
referendum last September.
Sterling fell by around 13% against the US dollar in the lead up to and in the aftermath
of the May 2010 vote. Much of that decline, however, was attributable to the onset of
the euro debt crisis and the resulting broad-based rally in the dollar against European
currencies.
FTSE 250 FTSE 100
2000 2002 2004 2006 2008 2010 2012 20140
200
400
600
800
1000
12001200
1000
800
600
400
200
02004 20102000 2006 2012 20142002 2008
FTSE 100 FTSE 250
Investment implicationsUK ECONOMIC MOMENTUM
31
Investment implications
6/7
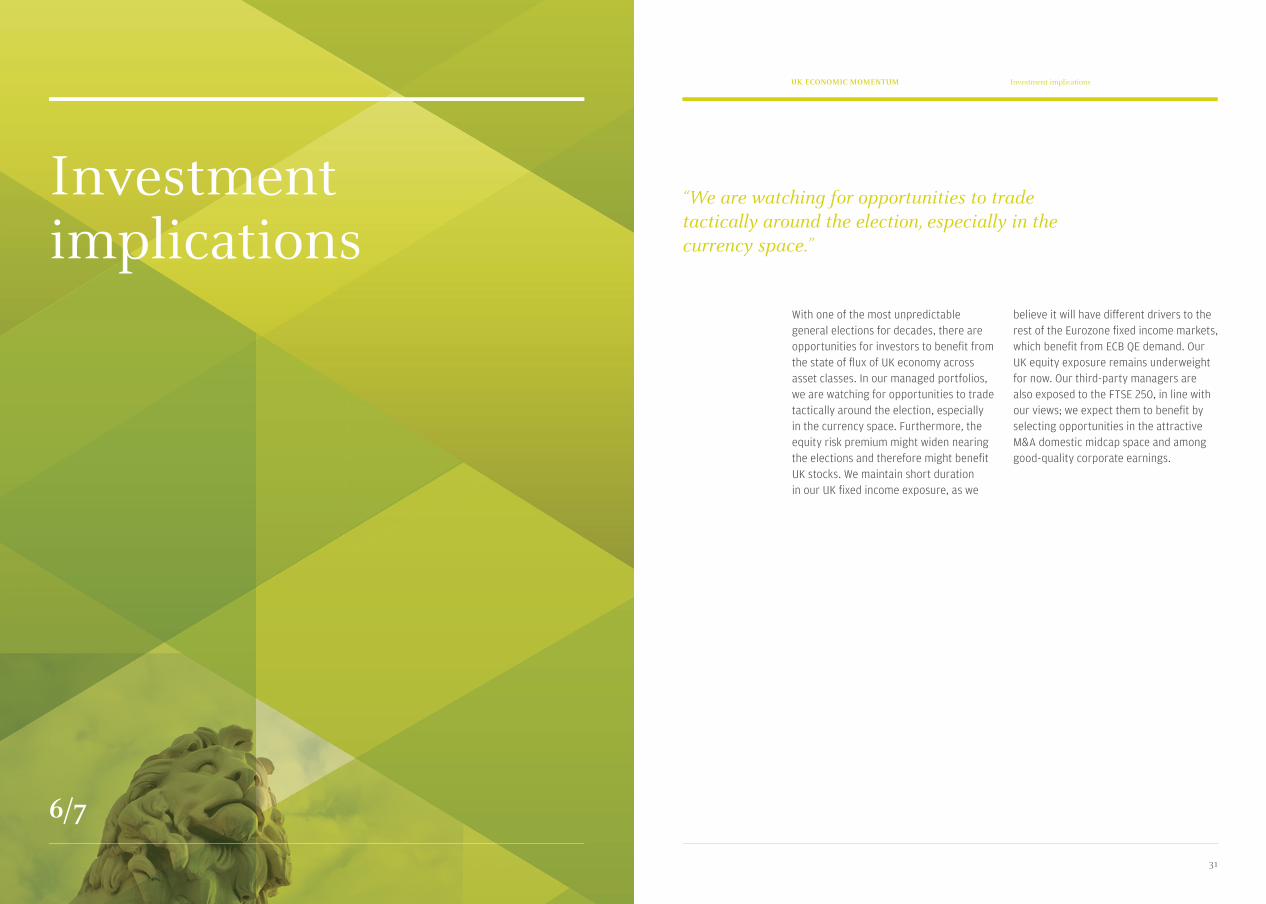
“We are watching for opportunities to trade tactically around the election, especially in the currency space.”
With one of the most unpredictable general elections for decades, there are opportunities for investors to benefit from the state of flux of UK economy across asset classes. In our managed portfolios, we are watching for opportunities to trade tactically around the election, especially in the currency space. Furthermore, the equity risk premium might widen nearing the elections and therefore might benefit UK stocks. We maintain short duration in our UK fixed income exposure, as we
believe it will have different drivers to the rest of the Eurozone fixed income markets, which benefit from ECB QE demand. Our UK equity exposure remains underweight for now. Our third-party managers are also exposed to the FTSE 250, in line with our views; we expect them to benefit by selecting opportunities in the attractive M&A domestic midcap space and among good-quality corporate earnings.
Biographies
7/7
33
BiographiesUK ECONOMIC MOMENTUM
César Pérez is the Global Head of Investment Strategy and a member of the Global Private Bank Investment Team.
Mr. Pérez has worked in investment management across all asset classes and regions for both institutional and private clients for the past 20 years, including two years at Credit Suisse Asset Management as head of equities, f ive years at M&G
Investments in London and nine years at J.P. Morgan Investment Management in Madrid, London and New York.
He appears regularly in the press, and has been featured in the Financial Times, Les Echos, Il Sole, La Stampa and Reuters, among others. Mr. Pérez studied management and industrial organization at Instituto Catolico de Artes e Industrias.
César PérezGLOBAL HEAD OF INVESTMENT STRATEGY, J.P. Morgan Private Bank
3534
BiographiesBiographiesUK ECONOMIC MOMENTUM UK ECONOMIC MOMENTUM
34
Frances Rhodius is an Associate on the J.P. Morgan Private Bank Investment Strategy team based in London; covering Europe, the Middle East, and Africa. Frances focuses on economic and financial market analysis as well as asset allocation and portfolio strategy.
Prior to joining the Investment Strategy team, Frances was an analyst for the Latin American team in Geneva and worked at BNP
Paribas Arbitrage in the Global Equities and Commodity Derivatives department in Paris.
Frances holds a double degree in BSc International Management and Modern Languages from the University of Bath, and completed her exchange at l’ESCP Europe in Paris.
Frances RhodiusINVESTMENT STRATEGIST, J.P. Morgan Private Bank
35
Livia Constantinescu is an Investment Strategist in the J.P. Morgan Private Bank CIO Team, focusing on economic and financial market analysis as well as asset allocation and portfolio strategy for Europe, the Middle East and Africa.
She is based in London. Prior to joining J.P. Morgan in 2010, she worked as a merger
arbitrage and special situations equity analyst.
Ms. Constantinescu holds an MSc in Finance from London Business School, with a concentration in Investment Management.
Livia ConstantinescuINVESTMENT STRATEGIST, J.P. Morgan Private Bank
3736
Important InformationImportant InformationUK ECONOMIC MOMENTUM UK ECONOMIC MOMENTUM
Important Information
JPMorgan Chase & Co. and its affiliates do not provide tax advice. Accordingly, any discussion of U.S. tax matters contained herein (including any attachments) is not intended or written to be used, and cannot be used, in connection with the promotion, marketing or recommendation by anyone unaffiliated with JPMorgan Chase & Co. of any of the matters addressed herein or for the purpose of avoiding U.S. tax-related penalties.
Each recipient of this presentation, and each agent thereof, may disclose to any person, without limitation, the U.S. income and franchise tax treatment and tax structure of the transactions described herein and may disclose all materials of any kind (including opinions or other tax analyses) provided to each recipient insofar as the materials relate to a U.S. income or franchise tax strategy provided to such recipient by JPMorgan Chase & Co. and its subsidiaries.
This material is intended for your personal use and should not be circulated to any other person without J.P. Morgan’s permission. Any use, distribution or duplication by anyone other than the recipient without J.P. Morgan’s permission is prohibited. We believe the information contained in this material to be reliable but do not warrant its accuracy or completeness. Any investment, products, services or strategies may not be suitable for all clients. Opinions, estimates, investment strategies and views expressed in this document constitute our judgment based on current market conditions and are subject to change without notice. This material should not be regarded as research or a J.P. Morgan research report or as including sufficient information to support an investment decision and is not intended as an offer or solicitation for the purchase or sale of any financial instrument. The investment strategies and views expressed herein may differ from the opinions expressed by other areas of J.P. Morgan including research.
The information provided herein is for general informational purposes only and is intended to inform you of the investment products and services offered by J.P. Morgan’s private banking business of JPMorgan Chase & Co. The information is not intended as a recommendation of or an offer or solicitation to purchase or sell any investment product or service or as a recommendation of an investment manager. The investment products and services described herein may not be suitable for all clients. Furthermore, please be advised that
past performance and forecasts are not reliable indicators of future results. Results may increase or decrease as a result of currency fluctuations. This material is distributed with the understanding that J.P. Morgan is not rendering accounting, legal or tax advice. You should consult with your independent advisors concerning such matters.
“J.P. Morgan Private Bank” is a marketing name for private banking business conducted by JPMorgan Chase & Co. and its subsidiaries worldwide. Bank products and services are offered by JPMorgan Chase Bank, N.A. and its affiliates. Securities are offered by J.P. Morgan Securities LLC, member NYSE, FINRA and SIPC, and other affiliates globally as local legislation permits. Securities products purchased or sold through J.P. Morgan Securities LLC are not insured by the Federal Deposit Insurance Corporation; are not deposits or other obligations of its bank or thrift affiliates and are not guaranteed by its bank or thrift affiliates; and are subject to investment risks, including possible loss of the principal invested.
In the United Kingdom, this material is approved by J.P. Morgan International Bank Limited (JPMIB) with the registered office located at 25 Bank Street, Canary Wharf, London E14 5JP, registered in England No. 03838766 and is authorized by the Prudential Regulation Authority and regulated by the Financial Conduct Authority and Prudential Regulation Authority. In addition, this material may be distributed by: JPMorgan Chase Bank, N.A. (JPMCB) Paris branch, which is regulated by the French banking authorities Autorité de Contrôle Prudentiel et de Résolution and Autorité des Marchés Financiers; J.P. Morgan (Suisse) SA, regulated by the Swiss Financial Market Supervisory Authority; JPMCB Dubai branch, regulated by the Dubai Financial Services Authority; JPMCB Bahrain branch, licensed as a conventional wholesale bank by the Central Bank of Bahrain (for professional clients only). With respect to countries in Latin America, the distribution of this material may be restricted in certain jurisdictions. Receipt of this material does not constitute an offer or solicitation to any person in any jurisdiction in which such offer or solicitation is not authorized or to any person to whom it would be unlawful to make such offer or solicitation.
In Hong Kong, this material is distributed by JPMCB, Hong Kong branch except to recipients having an account at JPMCB, Singapore branch and where this material relates to a collective investment scheme (other than private funds such as private equity and hedge funds) in which case it is distributed by J.P. Morgan Securities (Asia Pacific) Limited (“JPMSAPL”). Both JPMCB, Hong Kong branch and JPMSAPL are regulated by the Hong Kong Monetary Authority and the Securities and Futures Commission of Hong Kong. In Singapore, this material is
39
AcronymsUK ECONOMIC MOMENTUM
38
Important InformationUK ECONOMIC MOMENTUM
distributed by JPMCB, Singapore branch except to recipients having an account at JPMCB, Singapore branch and where this material relates to a collective investment scheme (other than private funds such as private equity and hedge funds) in which case it is distributed by J.P. Morgan (S.E.A.) Limited (“JPMSEAL”). Both JPMCB, Singapore branch and JPMSEAL are regulated by the Monetary Authority of Singapore. Dealing and advisory services and discretionary investment management services are provided to you by JPMCB, Hong Kong/Singapore branch (as notified to you). Banking and custody services are provided to you by JPMIB. The contents of this document have not been reviewed by any regulatory authority in Hong Kong, Singapore or any other jurisdictions. You are advised to exercise caution in relation to this document. If you are in any doubt about any of the contents of this document, you should obtain independent professional advice.
Conflicts of interest may arise whenever JPMorgan Chase Bank, N.A. or any of its affiliates (together, “J.P. Morgan”) has an actual or perceived economic or other incentive in its management of our clients’ portfolios to act in a way that benefits J.P. Morgan. Conflicts may result, for example (to the extent the following activities are permitted in your account): (1) when J.P. Morgan invests in an investment product, such as a mutual fund, structured product, separately managed account or hedge fund issued or managed by JPMorgan Chase Bank, N.A. or an affiliate, such as J.P. Morgan Investment Management Inc.; (2) when a J.P. Morgan entity obtains services, including trade execution and trade clearing, from an affiliate such as J.P. Morgan Securities LLC or J.P. Morgan Clearing Corp; (3) when J.P. Morgan receives payment as a result of purchasing an investment product for a client’s account; or (4) when J.P. Morgan receives payment for providing services (including shareholder servicing, recordkeeping or custody) with respect to investment products purchased for a client’s portfolio. Other conflicts may result because of relationships that J.P. Morgan has with other clients or when J.P. Morgan acts for its own account.
Should you have any questions regarding the information contained in this material or about J.P. Morgan products and services, please contact your J.P. Morgan private banking representative. Additional information is available upon request. If you no longer wish to receive these communications, please contact your usual J.P. Morgan representative.
© 2015 JPMorgan Chase & Co. All rights reserved.
Acronyms
Euro area / Eurozone: The economic and monetary union of 19 European Union member states that have adopted the euro as their common currency
CPI: Consumer Price Index
EU: European Union, an economic and political union of 28 member states
GDP: gross domestic product
G10 countries (actually 11): Belgium, Canada, France, Germany, Italy, Japan, the Netherlands, Sweden, Switzerland, the UK and the US.
OECD: Organisation for Economic Co-operation and Development